Cytonn Annual Markets Review - 2021
By Research Team, Jan 2, 2022
Executive Summary
Global Market Review
According to the October 2021 World Economic Outlook Report by the International Monetary Fund (IMF), the global economy is projected to expand by 5.9% in 2021, following a contraction of 4.4% in 2020. The growth is projected to be widespread across both the developed and the emerging markets. IMF projects that the new COVID-19 variants coupled with the slow vaccine distribution will continue to pose a risk on the recovery;
Sub-Saharan Africa Region Review
The World Bank and the International Monetary Fund, (IMF) project the Sub-Saharan region (SSA)’s economy to expand by 3.1% and 3.0%, respectively, in 2021, up from the 3.3% contraction recorded in 2020. The rebound projections come on the back of the increased rollout of vaccines in the region which has resulted to most countries re-opening their economies. The region has also seen recoveries in key sectors such as global trade, tourism and commodity driven sectors;
The select currencies recorded mixed performance against the US Dollar, with the Zambian Kwacha being the largest gainer in 2021, gaining by 21.0%, while the Mauritius Rupee was the largest decliner, depreciating by 9.3%. In 2021, Africa’s appetite for foreign-denominated debt continued to increase, with the region having raised a total of USD 11.8 bn in foreign-denominated debt issues;
Kenya Macro Economic Review
In 2021, the Kenyan economy rebounded, with the GDP for the first half of the year coming at an average of 5.4% , due to the 10.1% growth recorded in Q2’2021 and the 0.7% growth recorded in Q1’2021. The recovery was largely driven by growth in the transport and the accommodation and food sector which recorded growths of 16.9% and 9.1%, respectively, in Q2’2021, compared to the contraction of 16.8% and 56.6%, in Q2’2020. Business conditions in the Kenyan private sector recorded solid improvement during the year, with the average Stanbic Bank Monthly Purchasing Managers’ Index (PMI) for the first eleven months averaging 50.6, higher than the 48.0 recorded during a similar period in 2020. In 2021, inflation rate remained within the government’s set range of 2.5% - 7.5% but higher than the mid-range of 5.0% with the average inflation rate coming in at 6.1%;
Fixed Income
The yields on the government bonds remained relatively stable with the FTSE bond index registering a 2.2% decline. The yields on the, 91-day and 182-day T-bills increased to 7.0% and 7.6%, respectively while the yield on the 364-day T-bill declined to 8.5%, in 2021. There was a general increased interest on longer dated government securities with treasury receiving a 130.9% subscription translating to Kshs 834.2 bn raised compared to Kshs 728.0 bn on offer. The short-term papers were affected by the occasional liquidity strains with T-bills auction recording an undersubscription, with the average subscription rate coming in at 94.1%, down from the 130.9% oversubscription recorded in 2020;
Equities
The Kenyan equities market was on an upward trend with all indices gaining: NASI, NSE 25 and NSE 20 were up by 9.5%, 9.8% and 1.6%, respectively. The equities market performance was driven by gains recorded by large cap stocks such as Equity Group, ABSA Bank Kenya, BAT Kenya, KCB Group and Safaricom of 45.5%, 24.5%, 22.3%, 18.4%, and 10.8%, respectively. The banking sector has seen recovery with the core earnings per share (EPS) of the listed banks growing by 102.0%, compared to a weighted decline of (32.4%) in Q3’2020. This year, 4 companies issued profit warnings, as compared to 15 companies in 2020, and 10 companies in 2019. These companies are Centum Investment Company PLC, Umeme Limited, Williamson Tea Kenya PLC and WPP ScanGroup PLC. Additionally, the Nairobi Securities Exchange (NSE) de-listed National Bank of Kenya (NBK) after the successful takeover of all the bank’s shares by KCB Group in September 2019;
During the week, the Central Bank of Kenya (CBK) released the Quarterly Economic Review for the period ending 30th June 2021, highlighting that the sector’s total assets increased by 7.8% to Kshs 5.7 tn, from Kshs 5.3 tn in June 2020 and Profit before Tax (PBT) increased by 132.7% to Kshs 50.5 bn, from Kshs 21.7 bn in Q2’2020. During the week, Equity Group disclosed that Britam Holdings PLC had agreed to sell its 6.7% stake in Equity Group to the International Finance Corporation (IFC) and IFC Financial Institutions Growth Fund (IFC FIG Fund);
Real Estate
In 2021, the Kenyan Real Estate sector witnessed increased development activities with a general improvement in Real Estate transactions, attributed to the improved business environment. The reopening of the economy has also facilitated numerous expansion and construction activities by investors, in addition to various businesses also resuming full operations. In terms of performance; the residential, commercial office, retail, mixed-use developments and serviced apartments sectors realized average rental yields of 4.8%, 7.1%, 7.8%, 7.2%, and 5.5%, respectively. This resulted to an average rental yield for the Real Estate market at 6.5%, 0.4% points higher than the 6.1% recorded in 2020.
Investment Updates:
- Weekly Rates:
- Cytonn Money Market Fund closed the week at a yield of 10.51%. To invest, dial *809#;
- Cytonn High Yield Fund closed the week at a yield of 13.97% p.a. To invest, email us at sales@cytonn.com and to withdraw the interest, dial *809#;
- We shall resume our Wealth Management Training from Monday through Saturday, from 9:00 am to 11:00 am, through our Cytonn Foundation as from the New Year. The training aims to grow financial literacy among the general public. To register for any of our Wealth Management Trainings, click here;
- If interested in our Private Wealth Management Training for your employees or investment group, please get in touch with us through wmt@cytonn.com;
- Any CHYS and CPN investors still looking to convert is welcome to consider one of the five projects currently available for conversion, click here for the latest conversion term sheet;
- Cytonn Insurance Agency acts as an intermediary for those looking to secure their assets and loved ones’ future through insurance namely; Motor, Medical, Life, Property, WIBA, Credit and Fire and Burglary insurance covers. For assistance, get in touch with us through insuranceagency@cytonn.com;
- Cytonnaire Savings and Credit Co-operative Society Limited (SACCO) provides a savings and investments avenue to help you in your financial planning journey. To enjoy competitive investment returns, kindly get in touch with us through clientservices@cytonn.com;
Real Estate Updates:
- For an exclusive tour of Cytonn’s Real Estate developments, visit: Sharp Investor's Tour, and for more information, email us at sales@cytonn.com;
- Phase 3 of The Alma is now ready for occupation. To rent, please email properties@cytonn.com;
- We have 8 investment-ready projects, offering attractive development and buyer targeted returns. See further details here: Summary of Investment-ready Projects;
- For recent news about the group, see our news section here;
Hospitality Updates:
- We currently have promotions for Staycations. Visit cysuites.com/offers for details or email us at sales@cysuites.com;
- Share a meal with a friend during the Sunday Brunch at The Hive Restaurant at Cysuites Hotel and Apartment. Every Sunday from 11.00 AM to 4.00 PM at a price of Kshs 2,500 for Adults and Kshs 1,500 for children under 12 years;
Global Economic Growth
According to the October 2021 World Economic Outlook Report by the International Monetary Fund (IMF), the global economy is projected to expand by 5.9% in 2021, from a contraction of 4.4% in 2020. IMF projects that the new COVID-19 variants coupled with the slow vaccine distribution as the big risk to the global economic recovery. Advanced Economies are projected to expand by 5.2%, while Developing and Emerging Markets are projected to expand by 6.4% in 2021. The recovery of the Advanced Economies has been revised down to 5.2% from 5.6%, partly attributable to the supply-chain disruptions brought about by the pandemic while that of the Developing and Emerging Markets has been revised up from 6.3% to 6.4% due to increased commodity prices that have boosted some of the commodity-exporting economies. Close to 60.0% of the population in advanced economies has been vaccinated, compared to approximately 4.0% of the low-income economies’ population. The global recovery shall largely be determined by how quickly and effectively governments vaccinate their populations.
Global Equities Markets Performance
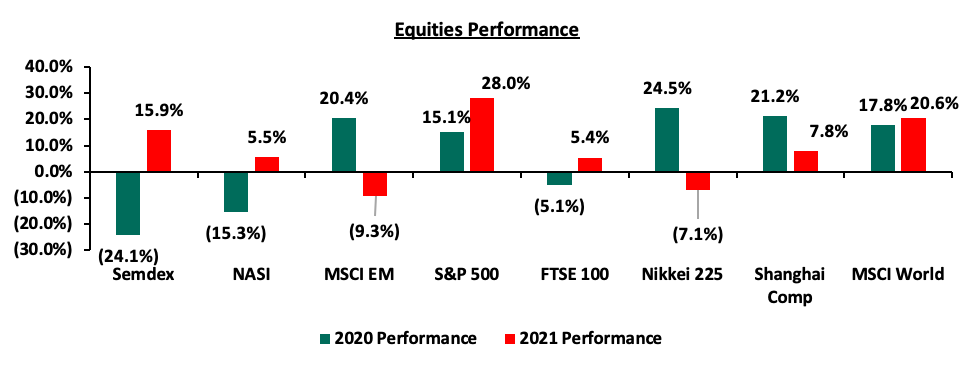
Global equity markets registered mixed performance during the year, with MSCI Emerging Markets and Nikkei 225 being the only losers among the major world indices. The losses recorded by MSCI EM and Nikkei 225 can be attributed to increased sell off of tech stocks following new strict regulations introduced in China which aimed to intensify the government’s influence over tech companies. The tech stocks had rallied during the third and fourth quarters of 2020, leading to the indices gaining at a period when most world indices were recording losses brought about by adverse effects of the pandemic. Growth in the global equities markets has been mainly driven by the economic recovery from the COVID-19 pandemic, accommodative monetary policies and increased rollout of vaccines which has improved the control of the pandemic. Below is a chart highlighting the performance of select stock indices;
Source: S&P Capital IQ
Global Commodities Market Performance
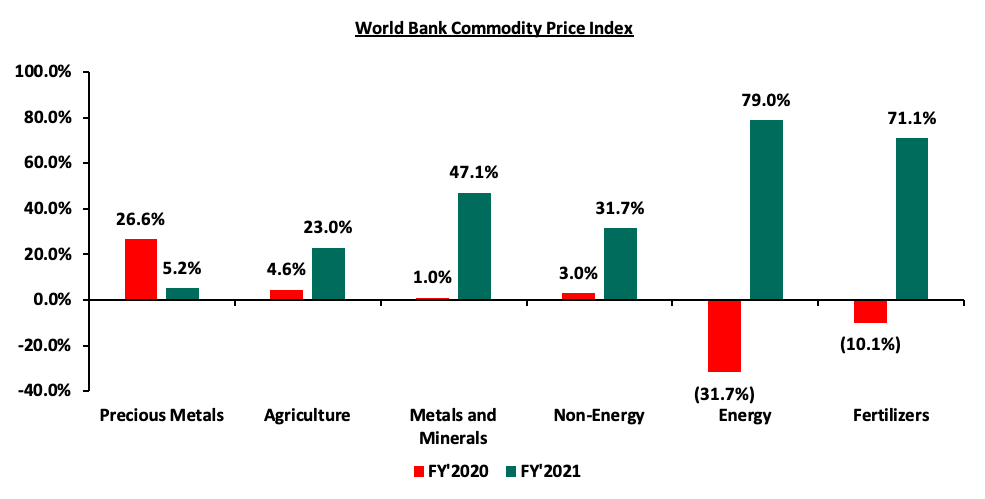
Global commodity prices registered positive performance in 2021, with energy prices showing the greatest increase of 79.0%, compared to the 31.7% decline experienced in 2020. The significant increase can be attributed to the recovery in global demand following the re-opening of major economies. Fertilizers, metals & minerals, non-energy commodities and agriculture, similarly registered gains of 71.1%, 47.1%, 31.7% and 23.0%, respectively, while precious metals registered a slower growth of 5.2% which was significantly lower than the 26.6% gain recorded in 2020. The slow gains by precious metals can be attributed to improved economic conditions from the pandemic, which have reduced investor demand for them as a primary store of value. Below is a summary performance of various commodities;
Economic Growth
The Sub-Saharan Africa economy is projected to expand by 3.1% in 2021 according to World Bank’s African Pulse issue and 3.0% according to the IMF, and is expected to grow further in 2022 by 3.5% and 3.8%, according to projections from the World Bank and IMF respectively. The growth will be driven by elevated commodity prices, relaxation of COVID-19 containments measures, increased vaccination and recovery in global trade. The SSA remains prone to threats such as emergence of new waves of the pandemic, coupled with slow vaccine roll out in some economies and concerns over debt sustainability. The region’s public debt to Gross domestic product is estimated at 71.0%, which is 30.0% points more than in 2013.
Currency Performance
In 2021, SSA Currency markets recorded mixed performance, with most currencies depreciating against the dollar. This is attributable to increased dollar demand in the region following the reopening of major economies in 2021, coupled with a faster increase in imports as compared to exports. Below is a table showing the performance of select African currencies;
|
Select Sub Saharan Africa Currency Performance vs USD |
|||||
|
Currency |
Dec-19 |
Dec-20 |
Dec-21 |
2020 y/y change (%) |
2021 y/y change (%) |
|
Zambian Kwacha |
14.1 |
21.1 |
16.7 |
(50.4%) |
21.0% |
|
Ugandan Shilling |
3,660.0 |
3,647.0 |
3,544.3 |
0.4% |
2.8% |
|
Tanzania Shilling |
2,293.0 |
2,314.0 |
2,297.8 |
(0.9%) |
0.7% |
|
Ghanaian Cedi |
5.7 |
5.8 |
6.0 |
(3.2%) |
(3.4%) |
|
Kenyan Shilling |
101.3 |
109.2 |
113.1 |
(7.7%) |
(3.6%) |
|
Malawian Kwacha |
729.1 |
763.2 |
817.3 |
(4.7%) |
(7.1%) |
|
Nigerian Naira |
306.0 |
380.7 |
410.9 |
(24.4%) |
(8.0%) |
|
South African Rand |
14.0 |
14.7 |
15.9 |
(5.0%) |
(8.1%) |
|
Botswana Pula |
10.6 |
10.8 |
11.7 |
(2.3%) |
(8.7%) |
|
Mauritius Rupee |
36.2 |
39.6 |
43.3 |
(9.3%) |
(9.3%) |
Key take outs from the table above are;
- The Mauritian Rupee was the worst performer, depreciating by 9.3% against the dollar, attributable to lower dollar inflows from export and tourism sectors as a result of strict lockdown measures to curb spread of the Delta variant of COVID-19.
- The Zambian kwacha registered significant recovery, appreciating by 0% compared to the 50.4% depreciation recorded in 2020. The strong performance of the Kwacha is mainly attributable to the strong recovery in global copper prices which led to improved foreign exchange flows from the mining sector.
- The Kenya Shilling depreciated by 3.6% in 2021 to close at Kshs 113.1 against the US Dollar, compared to Kshs 109.2 recorded at the end of 2020, driven by the increased global crude oil prices that led to increased dollar demand from oil and energy importers who had to increase the amounts they pay for oil imports and hence depleting dollar supply in the market.
African Eurobonds
Africa’s appetite for foreign-denominated debt has continued to increase, with USD 11.8 bn worth of Eurobonds issued by African sovereigns in 2021. The latest issuer in 2021 was Nigeria, who raised a total of USD 4.0 bn in September 2021, after receiving bids worth USD 12.2 bn, translating to a subscription rate of 3.1x. The oversubscription is mainly driven by the yield hungry investors and also the positive outlook of Nigeria’s economic recovery. Other countries that issued Eurobonds include Kenya which raised USD 1.0 bn in June 2021, in an issue that was 5.0x oversubscribed. Similarly, Ghana raised USD 3.0 bn from a zero-coupon Eurobond issue that was 2.0x oversubscribed.
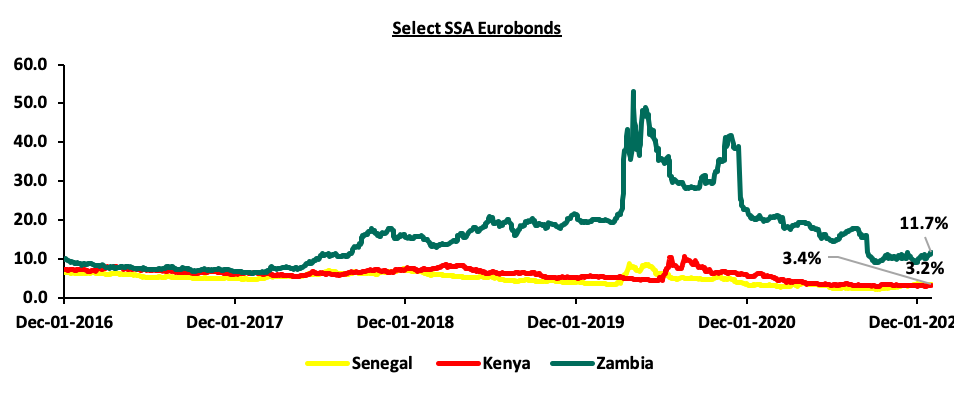
Below is a 5-year graph showing the Eurobond secondary market performance of select 10-year Eurobonds issued by the respective countries:
Source: S&P Capital IQ
There was a general decline in the yields of the various Eurobonds from different countries due to general improvement in investor sentiment as the economies recovered and demand for commodities increased. However, yields have slightly edged up in the tail end of Q4’2021, as investors attach a higher risk premium on the region, following the emergence of the new Omicron variant that continues to pose a risk to the region’s economic recovery.
Equities Market Performance
Sub-Saharan Africa (SSA) stock markets recorded mixed performance in 2021, with most of the markets recording positive returns, attributable to the improved investor sentiments in the region. The Zambia Stock market (LASILZ) was the best performing with a 96.2% index gain, attributable to the recovery of copper prices. On the other hand, Rwanda’s RSEASI was the worst-performing index, recording losses of 5.5%, mainly attributable to a deterioration in the business environment following the sustained lockdowns put in place to curb the spread of COVID-19, hence lowering investor sentiments. Below is a summary of the performance of key indices:
|
Equities Market Performance (Dollarized*) |
||||||
|
Country |
Index |
Dec-19 |
Dec-20 |
Dec-21 |
2020 y/y change (%) |
2021 y/y change (%) |
|
Zambia |
LASILZ |
303.3 |
185.2 |
363.4 |
(39.0%) |
96.2% |
|
Ghana |
GGSECI |
405.5 |
332.5 |
464.4 |
(18.0%) |
39.7% |
|
South Africa |
JALSH |
4,079.3 |
4,069.0 |
4638.8 |
(0.3%) |
14.0% |
|
Kenya |
NASI |
1.6 |
1.4 |
1.5 |
(15.2%) |
4.4% |
|
Tanzania |
DARSDEI |
1.5 |
1.5 |
1.6 |
0.7% |
3.4% |
|
Uganda |
USEASI |
0.5 |
0.4 |
0.4 |
(26.8%) |
0.2% |
|
Nigeria |
NGEASI |
87.7 |
105.8 |
103.9 |
20.6% |
(1.8%) |
|
Rwanda |
RSEASI |
0.1 |
0.2 |
0.1 |
3.4% |
(5.5%) |
|
*The index values are dollarized for ease of comparison |
||||||
Source: S&P Capital IQ
Robust GDP growth in Sub-Saharan Africa region is expected to continue in 2022 in line with the rest of the global economy. The region still faces key challenges among them emergence of new COVID-19 waves coupled with slow pace of vaccine rollout. The region continues to suffer from high debt levels that will make them less attractive to foreign capital and high costs of debt service following expiry of Debt Service Suspension Initiative and weakening of local currencies.
Economic Growth:
During the first half of the year, the economy recorded an average growth of 5.4% growth, 10.1% growth recorded in Q2’2021 and the 0.7% growth recorded in Q1’2021, an increase from the 0.2% contraction recorded in H1’2020. The expansion was largely driven by growth in the transport and the accommodation and food sectors which recorded growth of 16.9% and 9.1%, respectively, in Q2’2021, compared to the contraction of 16.8% and 56.6%, recorded in Q2’2020. The growth in these sectors follow the ease of COVID-19 travel restrictions and lift of the dawn to dusk curfew that was put in place since March 2020. Notably, the agricultural sector recorded a decline of 0.9% in Q2’2021, compared to a 4.9% growth in Q2’2020 and a 0.1% contraction in Q1’2021. The contraction during the quarters is mainly attributable to unfavorable weather conditions witnessed during the period. For more information, see our Q2’2021 GDP Note.
In 2021, the Kenyan economy is projected to grow at an average of 5.8% supported by continued recovery in the accommodation and food sector. The key challenge remains the Covid 19 pandemic and the fact that Kenya is having an election in2022. The table below shows the projections by various organizations:
|
No. |
Organization |
2021 Projections |
|
1 |
International Monetary Fund |
7.6% |
|
2 |
National Treasury |
6.4% |
|
3 |
Cytonn Investments Management PLC |
5.7% |
|
4 |
World Bank |
5.0% |
|
5 |
S&P Global |
4.4% |
|
Average |
5.8% |
|
|
Median of Growth Estimates |
5.7% |
|
Source: Cytonn Research, 2021
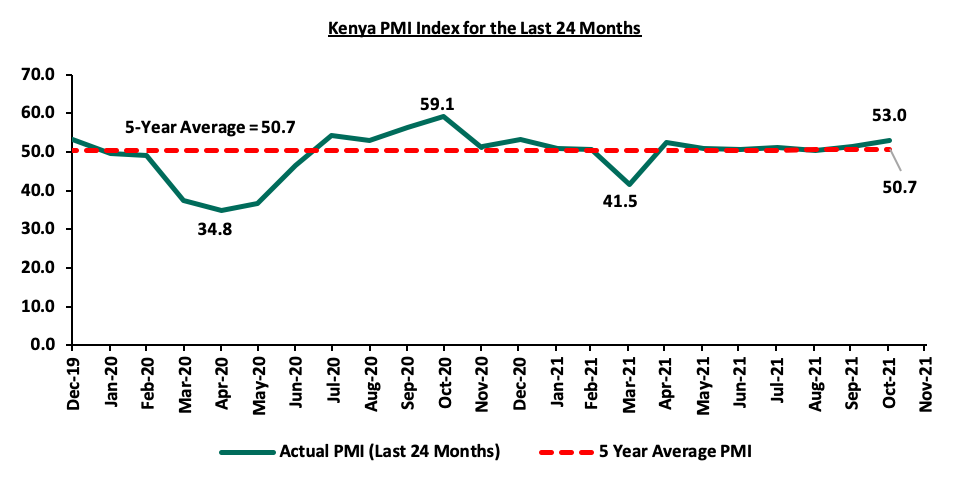
Business conditions in the Kenyan private sector recorded solid improvement during the year, with the average Stanbic Bank Monthly Purchasing Managers’ Index (PMI) for the first eleven months averaging 50.6, higher than the 48.0 recorded during a similar period in 2020. For the month of November 2021, the index increased to 53.0 from 51.4 recorded in October 2021.
The Kenya Shilling:
The Kenya Shilling depreciated by 3.6% against the US Dollar to close at Kshs 113.1 in 2021, compared to Kshs 109.2 at the end of 2020.
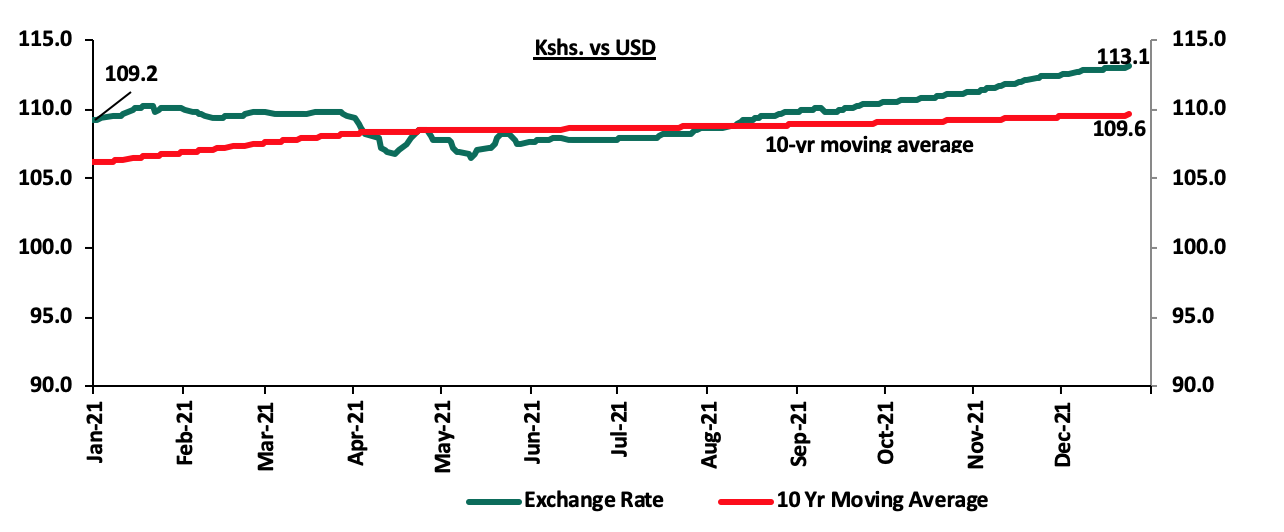
The performance of the Kenyan shilling in 2021 was driven by;
On the negative side we had
- Increased global crude oil prices that led to increased dollar demand from oil and energy importers who had to increase the amounts they pay for oil imports and hence depleting dollar supply in the market,
- Increased dollar demand as economies reopened leading to shortage of USD in the Kenyan market,
- Expansion of the current account deficit attributed to a robust increase in merchandise imports by 38.9% to Kshs 451.0 bn in Q2’2021, from Kshs 324.6 bn in Q1’2020 as compared to a 29.0% increase in merchandise exports to Kshs 179.7 bn, from Kshs 139.1 bn in Q2’2020, and,
- The aggressively growing government debt, with Kenya’s public debt having increased at a 10-year CAGR of 17.7% to Kshs 7.8 tn in July 2021, from Kshs 1.5 tn in July 2011 thus putting pressure on forex reserves to repay some of the public debt.
The shilling received some support driven by
- The forex reserve remains sufficient well above the statutory requirement of maintaining at least 4.0-months of import cover, and the EAC region’s convergence criteria of 4.5-months of import cover. The following is a graph showing Kenya months of import cover and forex reserves since 2012;
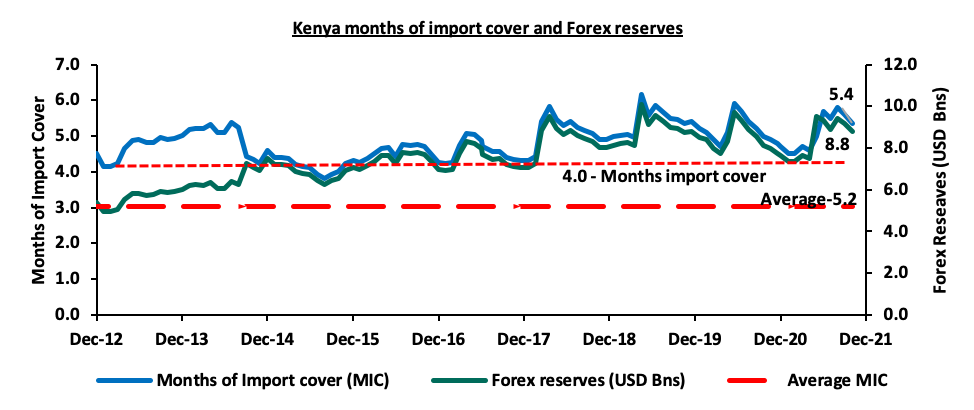
- The government received USD 314.0 mn disbursement from the International Monetary Fund (IMF) earlier in April 2021 and the USD 407.0 mn approved by the IMF under the Extended Fund Facility and Extended Credit Facility in June 2021 which supported the reserves as they increased by 26.4% to Kshs 9.5 bn in June 2021 from Kshs 7.5 bn in May 2021. Additionally, in December 2021, the International Monetary Fund (IMF) completed the second review of the 38-month Extended Fund Facility (EFF) and Extended Credit Facility (ECF) allowing Kenya to access approximately USD 258.1 mn (Kshs 29.2 bn), bringing the total support from IMF to Kenya to USD 972.6 mn (Kshs 109.9 bn) in 2021. This debt relief is expected to support forex reserves,
- Diaspora remittances that has grown to USD 320.1 mn as at November 2021, compared to USD 257.7 mn recorded in the same period in 2020,
- CBK’s supportive activities in the money market, such as repurchase agreements and selling of dollars, and,
- Monetary policy support from CBK by maintaining the policy rate at the current 7.0%. Any additional rate cuts would lead to a further depreciation of the shilling.
In line with our expectations, the Kenyan shilling closed the year at Kshs 113.1. We expect the shilling to continue weakening in the medium term, within a range of Kshs 109.1 and Kshs 116.6 against the USD based on the Purchasing Power Parity (PPP) and Interest Rate Parity (IRP) approach. Read on our Review of Performance of Kenya Currency.
Inflation:
The inflation rate remained within the government’s set range of 2.5% - 7.5% but higher than the mid-range of 5.0% in 2021 with the average monthly inflation rate coming in at 6.1%. The relatively high inflation can be attributed to the high fuel prices experienced through most of the year, coupled with the erratic weather conditions experienced in the second half of the year which led to food commodity prices spiking. The December numbers were 5.7%, a decline from 5.8% recorded in November in line with our expectations of 5.7% - 6.1%, but higher than the December 2020 rate of 5.6%. On a m/m basis, the inflation rates increased by 0.9%, driven by a 1.7% increase in food & non-alcoholic beverages.
Going forward, we expect the inflation rate to remain within the government’s set range of 2.5% - 7.5% with the key risks being drought in the first quarter of the year, further depreciation of the currency and unsustainability of the fuel subsidy program by the National Treasury should the average landed costs of fuel keep rising, which could eventually lead to increase in fuel prices.
Monetary Policy:
During the year the Monetary Policy Committee(MPC) met 6 times and maintained the Central Bank Rate (CBR) at 7.00% and the Cash Reserve Ratio of 4.25% in all meetings, citing that the measures implemented since March 2020 were having the intended effect on the economy and as such, remained appropriate and effective. We expect the MPC to continue holding the rates at the same level as they try to balance between supporting the fragile economic recovery and maintain a stable price environment and at the same time protect the currency.
2021 Key Highlights:
- FY’2021/2022 Budget and Draft 2022 Budget Policy Statement;
- On 10thJune 2021, the National Treasury presented Kenya’s FY’2021/2022 National Budget to the National Assembly highlighting that the total budget estimate for the 2021/2022 fiscal year was Kshs 3.0 tn, a 4.8% increase from the Kshs 2.9 tn final FY’2020/21 budget. The government projects that total revenue will increase by 10.3% to Kshs 2.0 tn, from the Kshs 1.8 tn in FY’2020/2021, the increase largely being projected to come from ordinary revenue, which is to grow by 11.4% to Kshs 1.8 tn in FY’2021/22 from Kshs 1.6 tn in the FY’2020/21 budget. The projected revenues are mainly pegged on Kenya’s economic recovery, broadening the tax base and tax reforms. The expenditure is expected to increase by 4.8% to Kshs 3.0 tn, from Kshs 2.9 tn in the FY’2020/21 budget. For more information, see our Kenya’s FY’2021/2022 Budget Review, and,
- In the month of November, the National Treasury released the Draft 2022 Budget Policy Statement, projecting a 7.7% increase in the target Excise Duty for FY’2021/2022 to Kshs 259.6 bn, from Kshs 241.0 bn as highlighted in the original budget estimates. The increase in the Excise duty revenue collection target follows the publishing of the Legal Notice 217 of 2021, which allowed the Kenya Revenue Authority, (KRA) to adjust the specific rates of excise duty upwards by 5.0% in line with average annual inflation rate for the FY’2020/2021. For more information, see our Cytonn Weekly #46/2021.
- Credit Facilities extended to Kenya;
- In 2021, Kenya received a total of USD 130.0 mn (Kshs 14.0 bn) from the World Bank and USD 984.0 mn (Kshs 109.8 bn) from the IMF to help the country respond to the unprecedented shock of the COVID-19 pandemic as well as reduce Kenya’s debt levels. The funding from the World Bank would also enable Kenya to procure more vaccines through the African Vaccine Acquisition Task Team (Avatt) and the COVID-19 Vaccines Global Access (Covax) facilities in addition to supporting the deployment of the vaccines by boosting the country’s cold-storage capacity. For more information, see our Cytonn Weekly #26/2021, and,
- On 22nd December 2021, the Kenyan authorities and the IMF reached a staff level agreement on the second review of the 38-month Extended Fund Facility (EFF) and Extended Credit Facility (ECF) - funded program. IMF noted that subject to the completion of the review by the IMF Board, Kenya would access approximately USD 264.0 mn (Kshs 29.5 bn). For more information, see our Cytonn Weekly #07/2021, Cytonn Weekly #44/2021, and Cytonn Weekly #50/2021.
- Balance of Payments
The Kenya National Bureau of Statistics released the Q1’2021 Balance of Payments Report highlighting that Kenya’s balance of payments deteriorated in Q1’2021, coming in at a deficit of Kshs 59.4 bn, from a deficit of Kshs 47.4 bn in Q1’2020. The deterioration was due to the 16.6% increase in the Current Account deficit to Kshs 142.0 bn, from Kshs 121.7 bn in Q1’2020 due to merchandised trade deficit and lower inflows from the services sector. The current account deficit (value of goods and services imported exceeds the value of those exported) expanded by 16.6% to Kshs 142.0 bn, from Kshs 121.7 bn in Q1’2020, mainly attributable to widening of the Merchandise Trade Deficit by 26.9% to Kshs 287.3 bn from Kshs 226.4 bn recorded in Q1’2020. For more information, see our Q1’2021 BOP Note.
- Credit Ratings;
The country saw its ratings revised downwards by Standard & Poor’s, a US based ratings agency, to 'B' from 'B+’, while Fitch Rating affirmed Kenya's Long-Term Foreign-Currency Issuer Default Rating (IDR) at 'B+' with a Negative Outlook. Fitch Rating pointed out that the rating reflected a track record of strong growth, relative macroeconomic stability and a favorable government debt structure which was balanced by negatives such as rising public debt levels and high net external indebtedness. On the other hand, the Negative Outlook on the ratings reflected the underlying weaknesses of the public finances and the uncertain pace of planned fiscal consolidation. For more information, see our Cytonn Q1’2021 Market Review. Below is a summary of the credit rating on Kenya so far:
|
Rating Agency |
Previous Rating |
Current Rating |
Current Outlook |
Date Released |
|
S&P Global |
B+ |
B |
Stable |
5th March 2021 |
|
Moody’s |
B1 |
B2 |
Negative |
19th June 2020 |
|
Fitch Ratings |
B+ |
B+ |
Negative |
26th March 2021 |
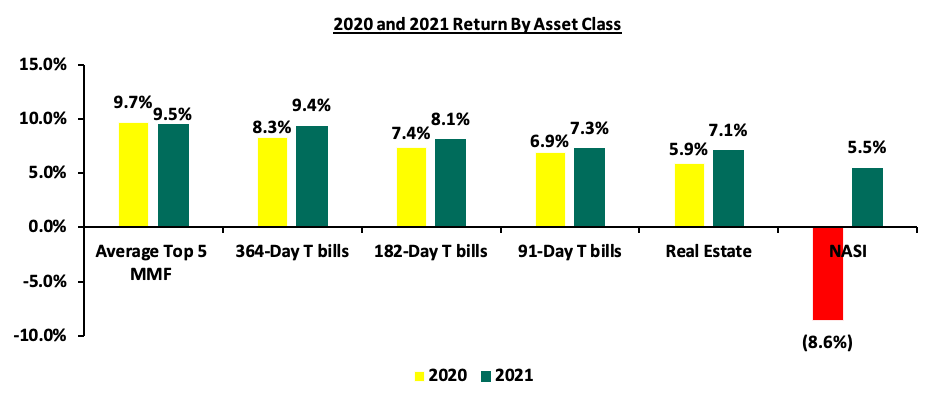
2021 returns by various Asset Classes
The returns by the various asset classes improved in 2021, with the 364-day, 182-day and 91-day Government papers recording yields of 9.4%, 8.1% and 7.3%, respectively, while Real estate yield and NASI recorded returns of 7.1% and 5.5% respectively. However, average returns of top five money market funds recorded a 0.2% points decline to 9.5% in December 2021, from 9.7% recorded in December 2020. The graph below shows the summary of returns by various asset classes (Average top 5 MMF, Fixed Income, Real Estate and Equities).
The table below shows the macro-economic indicators that we track, indicating our expectations for each variable at the beginning of 2021 versus the experience;
|
Macroeconomic Indicators 2021 Review |
||||
|
Macro-Economic Indicators |
2021 Expectations at Beginning of Year |
Outlook - Beginning of Year |
2021 Experience |
Effect |
|
Government Borrowing |
|
Negative |
|
Negative |
|
Exchange Rate |
|
Neutral |
|
Negative |
|
Interest Rates |
|
Neutral |
|
Neutral |
|
Inflation |
|
Positive |
|
Neutral |
|
GDP |
|
Neutral |
|
Neutral |
|
Investor Sentiment |
|
Positive |
|
Positive |
|
Security |
|
Neutral |
|
Neutral |
Since the beginning of the year, the notable changes we have seen out of the seven metrics that we track, fall under Exchange rates and Inflation. Exchange rates changed from neutral to negative while Inflation rate changed from positive to neutral. In conclusion, macroeconomic fundamentals showed mixed performances during the year but we expect a continued recovery in 2022 supported by the improving business conditions in the country. This will, however, be highly dependent on how well the government can handle the emerging COVID-19 Omicron variant and the upcoming national elections
T-Bills & T-Bonds Primary Auction:
During the year, T-bills auction recorded an undersubscription, with the average subscription rate coming in at 94.1% compared to an average of 130.9% in 2020, as investors shifted their interest to the bond market in search of higher yields. The yields on the 91-day and 182-day papers increased by 10 bps and 7.1 bps to 7.0% and 7.6%, respectively while the yield on the 364-day paper declined by 1.8 bps to 8.5% in 2021. Yields on government securities remained relatively stable, mainly due to the Central Bank of Kenya’s (CBK’s) efforts to keep rates low by rejecting expensive bids in the auction market.
Primary T-bond auctions in 2021 were oversubscribed, with the subscription rate averaging 147.6%, which was higher than the 130.6% average subscription rate recorded in 2020, partly attributable to the ample liquidity in the money market. The market preferred the medium-term bonds, owing to concerns that risks on the longer end of the yield curve may not be sufficiently priced. The average acceptance rate came in at 79.9% in 2021, an 11.4% points increase from the 68.5% recorded in 2020 as the market adjusted to the efforts of the CBK to maintain the rates at low levels.
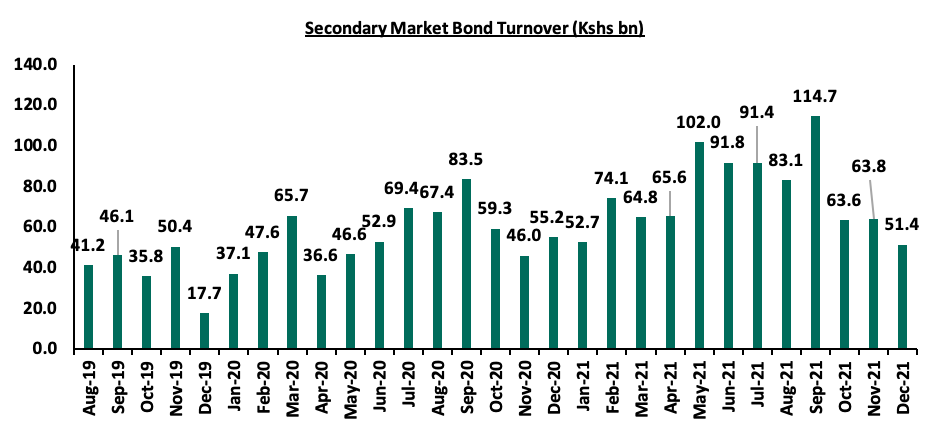
Secondary Bond Market Activity:
The secondary bond market recorded increased activity with the turnover having increased by 50.2% to Kshs 919.1 bn, from Kshs 667.3 bn in 2020. This is attributable to local institutional investors increasing their allocation to treasury bonds as they sort for higher returns offered by the asset class.
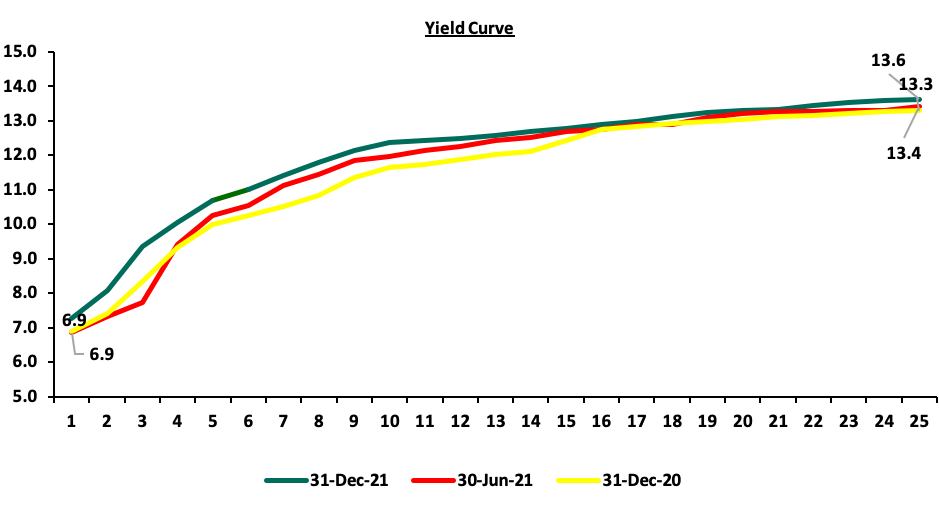
In 2021, the yield curve experienced upward pressure, partly attributable to the increased government borrowing and partly due to the increasing inflation seen in 2021 given that the higher the current rate of inflation and the higher the expected future rates of inflation, the higher the yields will rise across the yield curve, as investors will demand higher yield to compensate for inflation risk. The FTSE NSE bond index declined by 2.2% to close the year at 96.1, from 98.3 at the end of 2020. The chart below is the yield curve movement during the period;
Liquidity:
During the year, liquidity levels tightened as evidenced by the increase in the average interbank rate to 4.7% in 2021, from 3.7% in 2020. The tightened liquidity is partly due to government remittances which offset payments. The average volumes traded in the interbank market declined marginally by 0.3% to Kshs 10.65 bn in 2021 from Kshs 10.68 bn recorded in 2020.
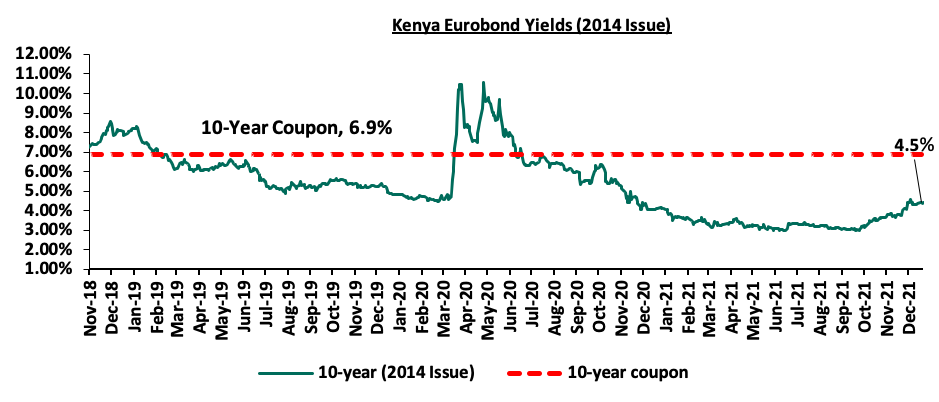
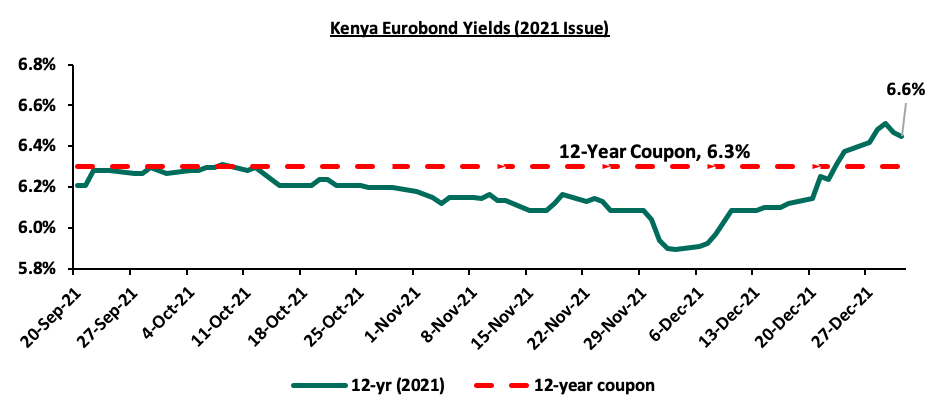
Kenya Eurobonds:
Yields on all Kenyan Eurobonds generally increased in 2021, pointing towards concerns by the investors on the economic status of the country. According to the CBK, the yields on the 10-Year Eurobond issued in 2014 increased by 0.6% points to 4.5%, from 3.9% recorded at the end of 2021.
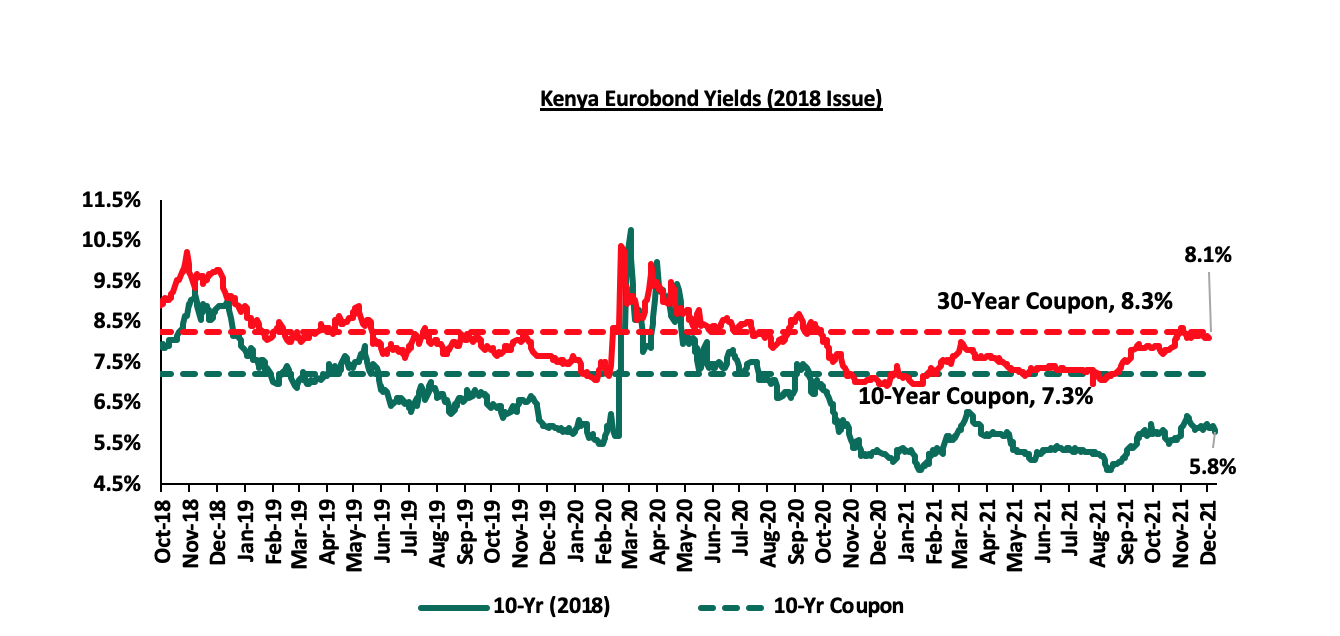
For the 2018 Eurobond issue, the yields on the 10-year Eurobond and the 30-year Eurobond both increased by 0.6% points and 1.1% points to close the year at 5.8% and 8.1%, from yields of 5.0% and 7.0% at the close of 2020 respectively.
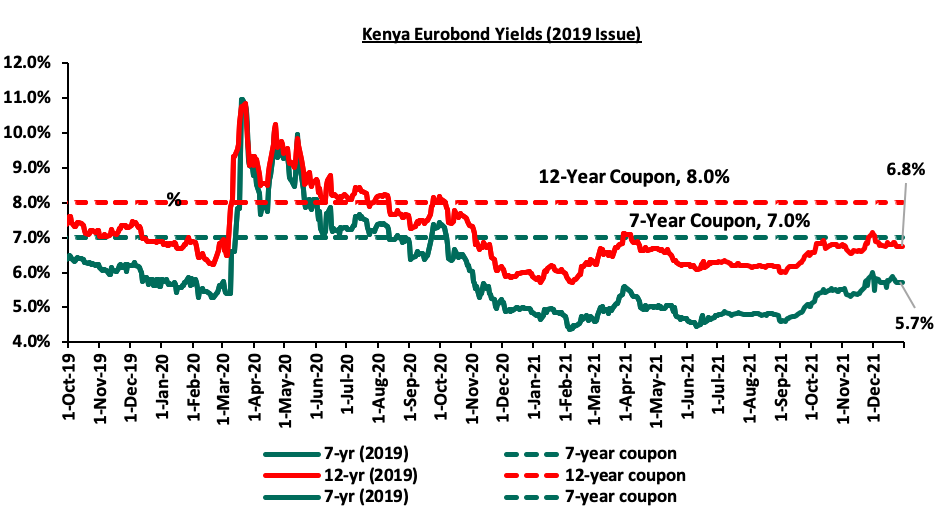
For the 2019 Dual-tranche Eurobond issue, the yields on the 7-year Eurobond and the 12-year Eurobond increased by 0.8% points and 0.9% points to close the year at 5.7% and 6.8%, from 4.9% and 5.9% at the close of 2020, respectively.
For the 13-Year Eurobond issued in 2021 closed the year at a yield of 6.6%.
Rates in the fixed income market have remained relatively stable with an upward bias due to the tightened but sufficient levels of liquidity in the money markets and the high appetite for debt by the government. The government is 5.9% ahead of its prorated borrowing target of Kshs 341.9 bn having borrowed Kshs 362.1 bn of the Kshs 658.5 bn borrowing target for the FY’2021/2022. We expect a gradual economic recovery going into FY’2021/2022 as evidenced by KRAs collection of Kshs 740.0 bn in revenues during the first five months of the current fiscal year, which is equivalent to 100.0% of the prorated revenue collection target. However, despite the projected high budget deficit of 7.5% and the lower credit rating from S&P Global to 'B' from 'B+', we believe that the support from the IMF and World Bank will mean that the interest rate environment will remain stable since the government is not desperate for cash.
Market Performance
During the year, the Kenyan equities market was on an upward trajectory, with NASI, NSE 25 and NSE 20 increasing by 9.5%, 9.8% and 1.6%, respectively. Below is a summary of the 2021 performance of the some of the large cap stocks in the Kenyan stock market:
|
Kenyan Equities Performance – Large Cap Gainers and Losers 2021 |
||
|
No |
Company Name |
Share Price Performance 2021 |
|
1 |
Equity Group |
45.5% |
|
2 |
ABSA Bank Kenya |
24.5% |
|
3 |
BAT Kenya |
22.3% |
|
4 |
KCB Group |
18.4% |
|
5 |
Safaricom |
10.8% |
|
6 |
East African Breweries Limited (EABL) |
7.1% |
|
7 |
Co-operative Bank Kenya |
3.2% |
|
8 |
Bamburi Cement |
(4.9%) |
|
9 |
NCBA Bank Kenya |
(5.3%) |
|
10 |
Standard Chartered Bank Kenya |
(11.2%) |
|
11 |
Diamond Trust Bank Kenya (DTB-K) |
(22.5%) |
Equity turnover during the year declined by 11.2% to USD 1.3 bn, from USD 1.4 bn in FY’2020. Foreign investors remained net sellers, with a net outflow of USD 91.9 mn, compared to net outflows of USD 280.9 mn recorded in FY’2020. The foreign-investor outflows during the year can be attributed mainly to profit taking activities as most large cap stocks recorded significant gains during the year, compared to 2020.
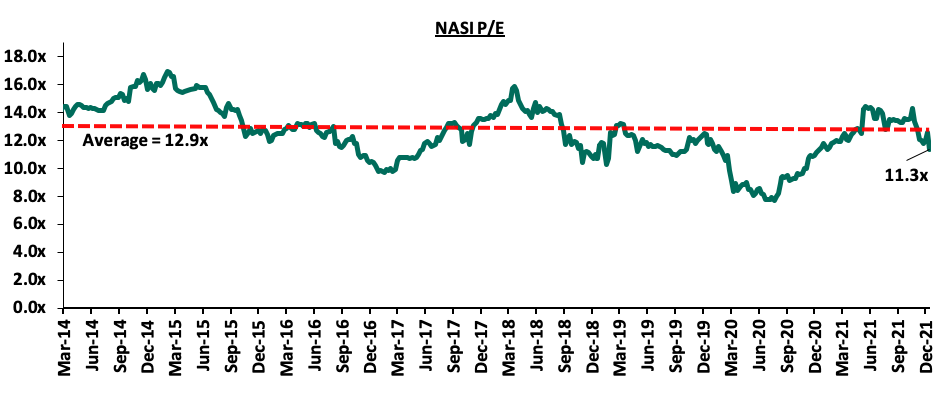
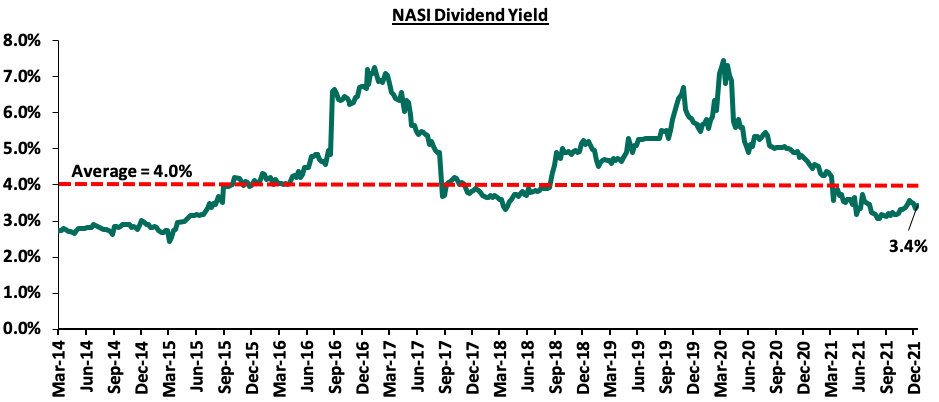
The market is currently trading at a price to earnings ratio (P/E) of 11.3x, similar to what was recorded at the end of 2020, and is 12.4% below the 12-year historical average of 12.9x. NASI’s P/E ratio has remained high for most of the year, mainly attributable to price rallies on most stocks such as Safaricom whose price increased by 10.8% during the year, while its EPS decline by 6.8%. Safaricom continues to be a key part of Kenyan equities portfolios, accounting for 59.5% of Nairobi Stock Exchange (NSE’s) market capitalization, and has dominated both the market turnover and determining the direction of the market given its weight and liquidity in the Nairobi Securities Exchange. On the other hand, the average dividend yield is currently at 3.4%, 0.6% points below the historical average of 4.0%.
Key to note, NASI’s PEG ratio currently stands at 1.3x, an indication that the market is trading at a premium to its future earnings growth. The current P/E valuation of 11.3x is 47.1% above the most recent trough valuation of 7.7x experienced in the first week of August 2020. The charts below indicate the market’s historical P/E and dividend yield:
Weekly Highlights:
- Q2’2021 Quarterly Economic Review
During the week, the Central Bank of Kenya (CBK) released the Quarterly Economic Review for the period ending 30th June 2021, highlighting that the banking sector remained stable and resilient during the period. According to the report, the sector’s total assets increased by 2.7% to Kshs 5.7 tn in June 2021, from Kshs 5.5 tn in March 2021. The increase was mainly attributable to a 2.7% increase in loans and advances during the quarter. On a yearly basis, total assets increased by 7.8% to Kshs 5.7 tn, from Kshs 5.3 tn in June 2020. Notably, loans and advances accounted for 49.3% of total assets in Q2’2021, which was a 0.5% points decrease from 49.8% of total assets in Q1’2021 and a 1.6% points decrease from 50.9% of the total assets in Q2’2020.
Other key take-outs from the report include:
- The banking sector recorded a 10.1% increase in Profit before Tax (PBT) to Kshs 50.5 bn in Q2’2021, from Kshs 45.9 bn in Q1’2021, with the increase in profitability mainly attributable to a higher 6.3% increase in income to Kshs 154.0 bn, from Kshs 144.9 bn in Q1’2021, compared to the 4.5% increase in expenses to Kshs 103.5 bn, from Kshs 99.1 bn in Q1’2021. On a yearly basis, PBT increased by 132.7%, to Kshs 50.5 bn, from Kshs 21.7 bn recorded in Q2’2020. Consequently, the sector’s Return on Assets (ROA) recorded a 0.1% point increase to come in at 2.7% in Q2’2021, from 2.6% recorded in Q1’2021, and, a 2.2% points increase from 0.5% recorded in Q2’2020. Additionally, Return On Equity (ROE) recorded an 0.7% points increase to 22.7% in June 2021, from 22.0% in March 2021, and, an 11.4% points increase from 11.3% recorded in June 2020,
- Lending increased by 2.3% to Kshs 3.1 tn in Q2’2021, from Kshs 3.0 tn in Q1’2021, attributable to an increase in loans and advances to Manufacturing, and Personal and Household, and Financial Services sectors. On a yearly basis, lending was up by 6.9% to Kshs 3.1 tn, from Kshs 2.9 tn in Q2’2020,
- Deposits recorded a 2.8% increase to Kshs 4.2 tn in June 2021, from Kshs 4.1 tn in March 2021, attributable to a 3.4% increase in local currency deposits which increased to Kshs 3.2 tn in June 2021, from Kshs 3.1 tn in March 2021. Compared to last year, deposits increased by 8.9% to Kshs 4.2 tn in Q2’2021, from Kshs 3.9 tn in Q2’2020. Key to note, customer deposits remain the main source of funding for banks, accounting for 74.8% of the sector’s total liabilities and shareholders’ funds as at Q2’2021, same as recorded in Q1’2021 but slightly lower than the 75.0% recorded in Q2’2020,
- Credit risk remained elevated in the sector, despite the gross Non-Performing Loans (NPLs) ratio reducing to 14.0% in Q2’2021, from 14.6% in Q1’2021. The Transport and Communication sector registered the highest increase in NPLs by 15.3% in Q2’2021 as a result of the disruptions caused by the COVID-19 pandemic. The asset quality, however, deteriorated compared with last year as the NPL ratio increased by 0.9% points to 14.0% in Q2’2021, from 13.1% in Q2’2020. The sector’s NPL coverage ratio decreased slightly to 53.0% in Q2’2021, from 53.1% in Q1’2021, an indication that the banks maintained the current relatively high provisioning levels to manage risks given the tough economic conditions. The NPL coverage as of Q2’2020 stood at 44.4%,
- The banking sector remained adequately capitalized, with the aggregate Core Capital to Total Risk-Weighted Assets ratio coming in at 16.5% in Q2’2021, similar to what was recorded in Q1’2021 and 0.1% higher than the 16.4% recorded in Q2’2020. The Core Capital to Total Risk-Weighted Assets ratio was 6.0% points above the CBK’s minimum statutory ratio of 10.5%. On the other hand, Total Capital to Total Risk-Weighted Assets ratio, increased slightly by 0.1% points to 18.9% in Q2’2021, from 18.8% in Q1’2021, and, up 0.4% points from 18.5% recorded in Q2’2020. The Q2’2021 Total Capital to Total Risk-Weighted Assets ratio was 4.4% points above the CBK’s minimum statutory ratio of 14.5%, and,
- The sector remained liquid during the period under review, with the liquidity ratio rising to 56.8% in Q2’2021, from 56.3% in Q1’2021 and 52.8% record in Q2’2020. This was 36.8% points above the minimum statutory level of 20.0%. The increase in the banking sector’s liquidity is attributable to a 3.3% increase in total liquid assets, which outpaced the 2.4% increase in short term liabilities during the quarter.
The increasing profitability in Q2’2021 indicates that the banking sector remains on the path to recovery in 2021. The sector remains sufficiently capitalized and with adequate liquidity levels, evidenced by the capital adequacy and liquidity ratios remaining above the minimum statutory ratios. Overall, we expect the banking sector to remain resilient boosted by the CBK’s efforts to improve their liquidity positions by maintaining the Cash Reserve Ratio at 4.25%, proactive monitoring of the loan book by commercial banks and improved capital adequacy across the sector.
- Britam Shares Sale in Equity Group
During the week, Equity Group disclosed that Britam Holdings PLC and Britam Life Assurance Company (Kenya) Limited had entered into a share purchase and sale agreement of Equity Group Shares with International Finance Corporation (IFC) and IFC Financial Institutions Growth Fund (IFC FIG Fund). The agreement will see IFC acquire 164,521,735 shares, 4.4% of the total Equity Group shares, and IFC FIG Fund would acquire 88,588,626 shares, 2.3% of the total Equity Group shares, from Britam in total. Britam Life is a subsidiary of Britam Holdings PLC. IFC and IFC FIG Fund are expected to acquire the shares at Kshs 55.0 per share, which represents a 4.3% premium on Equity Group’s current market price of Kshs 52.8 per share as of 31st December 2021. Britam will receive a total of Kshs 13.9 bn from the transaction. The split between Britam Holdings and Britam Life, and, the use of proceeds, have not been specified. However, we estimate that Kshs 3.3 bn will go towards paying the holding company’s bank loan that was secured with quoted ordinary shares, and, Kshs 5.2 bn will go towards supporting the Britam Wealth Management Fund. Britam Holdings had made a provision for investment losses of Kshs 5.2 bn in their FY’2020 financials, to provide financial support to the Wealth Management Fund, a fund managed by Britam Asset Managers.
The move to sell the shares will help reduce the effect that the volatile equity investment has had on Britam’s profit levels in the past. According to their FY’2020 annual report, its shareholding in Equity Group alone led to a fair value loss of Kshs 4.2 bn, representing 46.9% of the total Kshs 9.1 bn loss recorded during the year, due to a 33.5% share price decline in Equity Group’s share price in 2020. We expect that this portfolio optimization will help Britam stabilize its performance going forward and enable it to focus on its core and profitable offerings.
2021 Key highlights;
- Banking Sector Earnings
As per the Q3’2021 results, the listed banks recorded a weighted average increase in their core earnings per share of 102.0%, compared to a weighted decline of (32.4%) in Q3’2020. The table below highlights the performance of the banking sector, showing the performance using several metrics, and the key take-outs of the performance.
|
Bank |
Core EPS Growth |
Interest Income Growth |
Interest Expense Growth |
Net Interest Income Growth |
Net Interest Margin |
Non-Funded Income Growth |
NFI to Total Operating Income |
Growth in Total Fees & Commissions |
Deposit Growth |
Growth in Government Securities |
Loan to Deposit Ratio |
Loan Growth |
Return on Average Equity |
|
ABSA |
328.3% |
1.3% |
(19.1%) |
8.6% |
7.0% |
5.2% |
32.0% |
11.9% |
9.0% |
(5.6%) |
85.2% |
9.5% |
21.1% |
|
NCBA |
159.0% |
16.2% |
10.8% |
17.9% |
8.4% |
10.3% |
29.4% |
1.2% |
11.2% |
6.9% |
75.9% |
12.9% |
22.7% |
|
KCB |
131.4% |
28.7% |
45.0% |
23.3% |
7.0% |
28.8% |
39.7% |
34.2% |
26.6% |
25.8% |
63.9% |
23.2% |
22.2% |
|
Equity |
78.6% |
9.8% |
(1.3%) |
19.1% |
6.2% |
(0.2%) |
44.3% |
(4.3%) |
11.2% |
(14.1%) |
53.2% |
(4.6%) |
11.8% |
|
Stanbic |
43.2% |
(2.5%) |
(23.3%) |
2.8% |
6.7% |
19.1% |
33.9% |
17.9% |
6.4% |
(6.8%) |
51.0% |
0.1% |
14.5% |
|
SCBK |
33.7% |
0.5% |
(7.3%) |
12.2% |
6.2% |
4.2% |
42.6% |
(8.5%) |
(5.8%) |
(17.4%) |
83.0% |
11.2% |
14.0% |
|
I&M |
25.1% |
15.7% |
(5.2%) |
34.5% |
6.0% |
(3.5%) |
30.7% |
12.8% |
14.2% |
28.6% |
71.9% |
11.8% |
14.3% |
|
DTBK |
20.1% |
6.0% |
6.2% |
5.9% |
5.4% |
(4.9%) |
24.5% |
0.3% |
12.3% |
(2.7%) |
63.5% |
0.0% |
6.8% |
|
Co-op |
18.0% |
21.6% |
22.4% |
21.3% |
8.5% |
15.6% |
35.4% |
9.4% |
12.0% |
35.9% |
72.9% |
7.8% |
14.2% |
|
HF Group |
(22.0%) |
(18.4%) |
(21.2%) |
(14.8%) |
3.9% |
12.2% |
24.7% |
27.5% |
(1.3%) |
(9.5%) |
92.2% |
(7.9%) |
(19.0%) |
|
Q3'21 Mkt Weighted Average* |
102.0% |
15.9% |
14.9% |
16.9% |
7.3% |
14.3% |
35.2% |
13.8% |
14.3% |
11.7% |
69.7% |
12.4% |
18.7% |
|
Q3'20 Mkt Weighted Average** |
(32.4%) |
10.8% |
8.2% |
11.7% |
7.0% |
2.1% |
35.9% |
(7.9%) |
23.1% |
47.4% |
65.6% |
15.0% |
13.0% |
|
*Market cap weighted as at 10/12/2021 **Market cap weighted as at 01/12/2020 |
|||||||||||||
Key takeaways from the table above include:
- For the third quarter of 2021, core Earnings per Share (EPS) recorded a weighted average growth of 102.0%, compared to a weighted average decline of 32.4% in Q3’2020 for the listed banking sector. The performance is however largely skewed by the strong performance from ABSA, NCBA and KCB Group of 3%, 159.0% and 131.4%, respectively,
- The Banks have recorded a weighted average deposit growth of 14.3%, a decline from the 23.1% recorded in Q3’2020,
- Interest expense grew at a faster pace, by 14.9%, compared to the 8.2% growth in Q3’2020 while cost of funds declined, coming in at a weighted average of 2.7% in Q3’2021, from 2.9% in Q3’2020, owing to the faster growth in average interest-bearing liabilities, an indication that the listed banks were able to mobilize cheaper deposits,
- Average loan growth came in at 12.4%, lower than the 15.0% growth recorded in Q3’2020. Notably, the loan growth outpaced the 11.7% growth in government securities, an indication that the banks’ have increased their lending to private sectors due to decrease in credit risk on the back of economic recovery,
- Interest income grew by 15.9%, compared to a growth of 10.8% recorded in Q3’2020. Notably, the weighted average Yield on Interest Earning Assets (YIEA) for the listed banks increased to 9.8%, from the 9.5% recorded in Q3’2020, an indication of the increased allocation to higher-yielding government securities by the sector during the period. Consequently, the Net Interest Margin (NIM) now stands at 7.3%, a 0.3% points increase from the 7.0% recorded in Q3’2020 for the listed banking sector, and,
- Non-Funded Income grew by 14.3%, compared to the 2.1% increase recorded in Q3’2020. This can be attributable to the faster growth in the fees and commission which grew by 13.8% compared to a decline of 7.9% in Q3’2020, and points to the diversification of income in the banking sector.
For more information, see our Kenya Listed Banks Q3’2021 Report.
- Insurance Sector Earnings:
During the year, Kenyan listed insurers released their H1’2021 results, recording a weighted average increase in core earnings per share of 127.6%, an improvement, compared to an average decline of (280.5%) in H1’2020. The table below highlights the performance of the listed insurance sector, showing the performance using several metrics, and the key take-outs of the performance:
|
Listed Insurance Companies H1'2021 Earnings and Growth Metrics |
||||||||
|
Insurance |
Core EPS Growth |
Net Premium growth |
Claims growth |
Loss Ratio |
Expense Ratio |
Combined Ratio |
ROaE |
ROaA |
|
CIC Group |
177.3% |
0.5% |
7.0% |
81.3% |
50.8% |
132.1% |
3.4% |
0.6% |
|
Jubilee Holdings |
146.2% |
10.0% |
42.1% |
109.6% |
30.4% |
140.0% |
12.5% |
3.1% |
|
Britam Holdings |
123.0% |
2.4% |
15.8% |
78.5% |
79.4% |
157.8% |
1.7% |
0.3% |
|
Sanlam Kenya |
68.8% |
45.9% |
64.9% |
92.8% |
47.1% |
140.0% |
(19.3%) |
(0.9%) |
|
Liberty Holdings |
(20.4%) |
(5.7%) |
32.5% |
75.0% |
84.3% |
159.3% |
3.1% |
0.7% |
|
*H1'2021 Weighted Average |
127.6% |
6.3% |
29.1% |
92.8% |
53.8% |
146.6% |
6.2% |
1.6% |
|
**H1'2020 Weighted Average |
(280.5%) |
5.1% |
6.5% |
75.0% |
48.8% |
123.8% |
2.0% |
0.6% |
|
*Market cap weighted as at 11/11/2021 **Market cap weighted as at 30/09/2020 |
||||||||
The key take-outs from the above table include;
- Core EPS growth recorded a weighted growth of 127.6%, compared to a weighted decline of 280.5% in H1’2020. The increase in earnings was attributable to increased premiums during the period following robust recovery by the sector from the COVID-19 pandemic, coupled with gains recorded in the equities markets and higher yields from government papers,
- The premiums grew at a faster pace of 6.3% in H1’2021, compared to a growth of 5.1% in H1’2020, while claims grew at an aggressive faster rate of 29.1% in H1’2021, from the 6.5% recorded in H1’2020 on a weighted average basis,
- The loss ratio across the sector increased to 92.8% in H1’2021, from 75.0% in H1’2020, owing to increased claims in insurance sub sectors such as motor and medical and perennial challenges facing the industry such as fictitious claims and increased benefit payments from the life business owing to job layoffs,
- The expense ratio increased to 53.8% in H1’2021, from 48.8% in H1’2020, owing to an increase in operating expenses,
- The insurance core business still remains unprofitable, with a combined ratio of 146.6% as at H1’2021, compared to 123.8% in H1’2020, and,
- On average, the insurance sector delivered a Return on Average Equity (ROaE) of 6.2%, an increase from a weighted Return on Average Equity of 2.0% in H1’2020.
For more information, see our Kenya H1’2021 Listed Insurance Report.
Other Key Results
Safaricom Limited released the H1’2022 results, recording core earnings per share increase of 12.1% to Kshs 0.9, from Kshs 0.8 in H1’2021. The increase in the earnings growth was attributable to the 45.8% increase in M-PESA revenue to Kshs 52.3 bn, from Kshs 35.9 bn in H1’2021, following the lifting of the waiver by the Central Bank of Kenya on all charges for transactions below Kshs 1,000.
This year, 4 companies issued profit warnings to investors compared to 15 companies in 2020, and 10 companies in 2019, as a results of the improved business environment following the lifting of COVID-related restrictions. Companies are required to issue profit warnings if they project a more than 25.0% decline in profits year-on-year. Below is the summary of the said companies:
|
Companies that issued profit warnings |
|||
|
No |
2021 |
2020 |
2019 |
|
1 |
Centum Investment Company PLC |
ABSA Kenya |
Nairobi Stock Exchange |
|
2 |
Umeme Limited |
Diamond Trust Bank |
BOC Kenya Plc |
|
3 |
Williamson Tea Kenya PLC |
Standard Chartered |
UAP Holdings Limited |
|
4 |
WPP ScanGroup PLC |
I&M Holdings |
Kenya Power and Lightning Company |
|
5 |
|
NCBA Group |
Eaagads |
|
6 |
|
Britam Holdings |
Williamson Tea Kenya |
|
7 |
|
East African Breweries Limited |
Standard Group Plc |
|
8 |
|
Nation Media Group |
CIC Insurance |
|
9 |
|
Longhorn Publishers |
Kenya Airways |
|
10 |
|
Kenya Power |
Kapchorua Tea Company |
|
11 |
|
Unga Group |
|
|
12 |
|
East Africa Cables |
|
|
13 |
|
Kenya Orchards |
|
|
14 |
|
TPS East African |
|
|
15 |
|
Nairobi Business Ventures |
|
The key take-outs from the table above include:
- Centum Investment Company Limited attributed the shortfall in profits to the impact of COVID-19 on their Private Equity portfolio businesses and the lack of gains on disposal of investments in the financial year ending 31st March 2021. Centum had registered significant gains on disposal of investments totalling Kshs 12.5 bn in the previous financial year ending 31st March 2020. Additionally, Centum pointed to the revenue recognition of sales in the Real Estate business as another reason for the depressed profit level, as sales revenues are only recognized once ownership of the real estate residential units are transferred to the new owners,
- Umeme Limited issued a profit warning statement attributing dismal performance to the attributed to (i) the effects of the Covid-19 pandemic as restrictions put in place which led to a 9.0% decline in Commercial, medium-industrial and large industrial electricity demand, (ii) regulatory lag, and, (iii) suspension of the Government’s free connections policy,
- Williamson Tea Kenya PLC also issued a profit warning citing that the pandemic adversely affected the property market leading to a loss on revaluation of the firm’s investment properties. Williamson Tea also cited rising production costs and lower global market prices as contributing factors to their depressed bottom-line in the financial year ending 31st March 2021, and,
- WPP ScanGroup cited that the impact of discontinued operations in 2020, when the company disposed of its interest in Millward Brown East Africa Limited, Millward Brown West Africa Limited, Millward Brown Nigeria and Research and Marketing Group Limited, on 30th June 2020, as the reason for the firm’s lower earnings.
Below is a summary of the number of companies that issued profit warnings over the last 7 years:
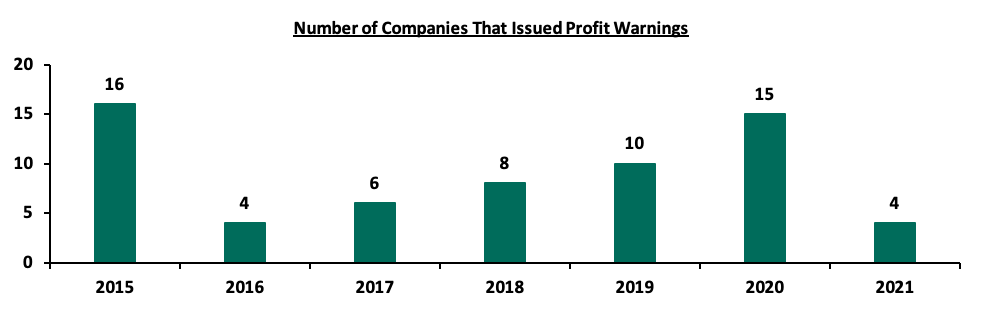
Source: Cytonn Research, NSE
- Listings and Suspensions
During the year, the Nairobi Securities Exchange (NSE) delisted National Bank of Kenya (NBK), effective 25th November 2021. This came after the successful takeover by KCB of 100.0% of all the ordinary shares of National Bank of Kenya (NBK) through a share swap of 1 ordinary share of KCB for every 10 NBK shares, after the Capital Markets Authority (CMA) approved the acquisition in September 2019. The de-listing was approved by both the CMA and the shareholders of NBK. NBK became the 13th firm since 2001 to be de-listed in the NSE with Kenol/Kobil being the most recent exit in August 2019. The table below shows the delisted companies and the year they were delisted in:
|
No. |
Company Name |
Year of De-listing |
|
1. |
East African Packaging Industries |
2001 |
|
2. |
Africa Online Holding Ltd |
2003 |
|
3. |
Unilever Tea Kenya |
2008 |
|
4. |
Access Kenya |
2013 |
|
5. |
City Trust Ltd |
2013 |
|
6. |
Rea Vipingo Plantations Limited |
2015 |
|
7. |
CMC Holdings |
2015 |
|
8. |
Atlas Development and Support Services |
2017 |
|
9. |
Marshall East Africa Limited |
2017 |
|
10. |
Hutchings Biemer |
2018 |
|
11. |
A. Baumann & Co. Limited |
2018 |
|
12. |
Kenol/Kobil |
2019 |
|
13. |
National Bank of Kenya |
2021 |
The chart below shows the number of listed companies in the Nairobi Securities Exchange (NSE) for the period 2010 - 2021:
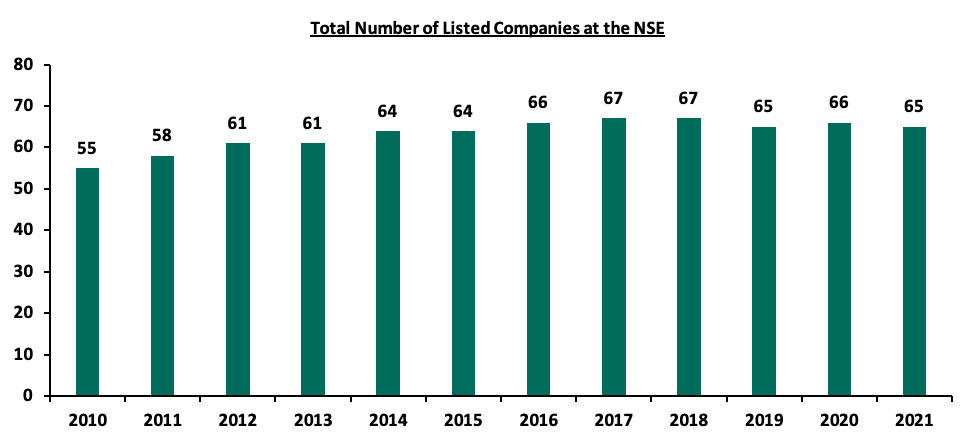
Source: CMA Quarterly Statistical Bulletins
- Liquidations
During the year, the Central Bank of Kenya (CBK) approved the liquidation of three banks; namely, Chase Bank Limited (In Receivership), Imperial Bank Limited (In Receivership) and Charterhouse Bank Limited. Charterhouse Bank had been under statutory management since 23rd June, 2006 over severe violations of the Banking Act relating to lending, accuracy of returns submitted to CBK, and failure to obtain account opening documentation for a number of customers. The bank’s liquidation was announced on 7th May 2021, with the Kenya Deposit Insurance Corporation (KDIC) being appointed as the liquidator in order to protect the interest of the bank’s depositors, its creditors, and other stakeholders. Charterhouse Bank had assets totalling Kshs 4.0 bn and deposits totalling Kshs 2.9 bn, as of 2006.
For both Chase Bank and Imperial Bank, KDIC acted as the receiver and liquidation approvals came after recommendation by KDIC that liquidation was the only feasible option going forward. Chase Bank Limited (In Receivership) (CBLIR)’s liquidation announcement was made in 16th April 2021, and came five years after CBK appointed KDIC as the receiver for Chase Bank Limited on April 7, 2016. Please see our Note on the Liquidation of Chase Bank Limited, In Receivership (CBLIR) for a detailed analysis. We expect total recoveries of Kshs 59.6 bn out of the total Kshs 76.1 bn in deposits held by Chase Bank Limited In Receivership; resulting in a potential loss of Kshs 16.5 bn. This represents a 78.3% recovery rate. Out of the Kshs 59.6 bn recoveries, Kshs 57.1 bn is the deposits amount transferred to SBM Bank (K) and expected to be fully recovered while Kshs 2.5 bn is the maximum amount to be paid by KDIC after liquidation.
Additionally, CBK announced on 9th December 2021, that it had approved the liquidation of Imperial Bank Limited In Receivership (IBLIR), in order to pave way for the sale of IBLIR’s remaining assets to settle any existing debts to depositors and creditors. Imperial Bank Limited was put under receivership by CBK on 13th October 2015 due to irregularities and malpractices in the bank which exposed depositors, creditors and the banking sector to financial risk. At the time of receivership, IBLIR had 32 branches, Kshs 70.3 bn (as of 30th June 2015) worth of assets, and Kshs 58.1 bn worth of deposits, owed to 50,000 depositors. According to CBK, 37.3% of the total deposits will be recovered, totalling Kshs 21.7 bn. Out of the 50,000 depositors, 45,700 will be paid fully representing 91.4% of the total depositors. For more information on the liquidation of Imperial Bank Limited In Receivership (IBLIR), please see our Cytonn Weekly #49/2021.
- Legislations and other Developments
The year 2021 saw a number of legislative changes and other developments that affected the equities market and investor sentiment, namely:
- Guidance on Loan Restructuring: The Central Bank of Kenya announced that the emergency measures on restructuring of loans for bank borrowers put in place in March 2020, expired on 2nd March 2021. The circular, intended to cushion the borrowers from the adverse effects of the pandemic, provided commercial banks and mortgage finance companies with guidelines on loan reclassification, and provisioning of extended and restructured loans as per the Banking Circular No 3 of 2020. According to the Central Bank, the measures were highly effective, giving borrowers restructuring options which included moratorium on principle or interest and waivers on interest fees. The measures gave borrowers room to readjust their businesses and operations to the ‘new normal’ in addition to helping mitigate job losses. The banking sector also benefitted from the measures, presenting banks with the opportunity to re-evaluate their loan books, build additional capital and liquidity buffers and minimizing the effect of the pandemic on their Non-Performing Loan book,
- Draft CMA Investments Regulations: In August 2021, the Cabinet Secretary for the National Treasury and Planning, through the Capital Markets Authority (CMA), published two draft regulations; the Capital Markets (Collective Investment Schemes) Regulations 2021 and the Capital Markets (Collective Investment Schemes) (Alternative Investment Funds) Regulations 2021. The proposed CIS regulations seek to update the current Collective Investment Scheme regulations given the changes in the market dynamics since the last published Regulations in 2001, as well as address emerging issues. Additionally, the draft Alternative Investment Funds’ (AIFs) regulations seek to create a regulatory environment for privately pooled funds whose investors seek higher returns by investing in specified alternative asset classes including Debt funds, Equity and equity linked investments, Hedge funds, or infrastructure. For a detailed analysis of the draft regulations, please see our Cytonn Weekly#37/2021. However, we still await the release of the Regulatory Impact Assessment by the regulator and a revised draft taking into account market commentaries,
- Integration of Climate-Related Risk Management: In October 2021, the Central Bank of Kenya (CBK) released Guidance on Climate-Related Risk Management, highlighting that all banks and mortgage finance companies ought to integrate the risks and opportunities arising from climate change in their risk management, strategy and governance structure. Opportunities expected to arise from climate change include financing activities such as the transition to renewable energy, appropriate housing, resilient infrastructure and innovative agricultural practices. On the other hand, banks are expected to build their capacity going forward to identify and mitigate the risks arising from climate change,
- Guidelines on Buybacks for Listed Companies - In November 2021, the Capital Market Authority (CMA) released guidelines on share buybacks for listed companies, following the issuance of proposed guidelines on share buy-backs, in June 2020, which have been in the process of revision following public participation. The guidelines are in line with Part XVI, Section 447 of the Companies Act, 2015, that introduced a share buyback option for publicly traded companies and aims to enhance investor protection, promote liquidity and ensure transparency in share buyback transactions.The new guidelines came after Nation Media Group (NMG) became the first listed company in the Nairobi Stock Exchange (NSE) to conduct a share buyback which ran from 28th June 2021 to 24th September 2021, which saw NMG acquire 17.1 mn ordinary shares out of the targeted 20.7 mn ordinary shares, representing an 82.5% success rate. For more information on the guidelines, please see our Cytonn Weekly #46/2021,
- Suspension of the Listing of Borrower’s Negative Credit Information: On 8th November 2021, the Central Bank of Kenya (CBK) announced a 12 months suspension of listing of negative credit information for borrowers with loans below Kshs 5.0 mn, whose loans were performing previously, but have become non-performing from 1st October, 2021. The move by the CBK is an intervention measure aiming to cushion Micro Small and Medium Enterprises from adverse effects of the COVID-19 pandemic,
- Central Bank of Kenya Amendment Act, 2021 - In December 2021, President Uhuru Kenyatta signed into law the Central Bank of Kenya (CBK) Amendment Act, 2021 which confers the CBK powers to regulate the digital lending services sector and aims to amend the Central Bank of Kenya Act Chapter 491 to provide and allow for the licensing of digital credit service providers, who are currently not regulated. The act also defines relevant terms for the business of digital credit lending where a digital credit provider is a person licensed by the CBK to carry on digital credit business while a digital credit business is one of providing credit facilities or loan services through a digital channel. Further, the act aims to provide for a fair and non-discriminatory marketplace for access to credit.
- Consolidation: Consolidation activity remained one of the key highlights witnessed in 2021, as players in the sector were either acquired or merged, leading to the formation of relatively larger, well capitalized, and possibly more stable entities. The following were some of the major M&A’s activities witnessed during the year:
-
- In May 2021, Equity Group disclosed that it had had acquired an additional 7.7% stake valued at Kshs 996.0 mn, in Equity bank Congo (EBC) from the German Sovereign wealth Fund (KfW). The acquisition raised the total ownership in EBC to 94.3%, indicating that they are currently valuing the company at Kshs 14.2 bn. This followed the recent acquisition of 66.5% stake in Banque Commerciale Du Congo (BCDC) by Equity Group at a cost of Kshs 10.2 bn in August 2020. The BCDC subsidiary is already the second largest most profitable regional subsidiary, having contributed Kshs 1.3 bn to the Group’s Profit After Tax of Kshs 20.1 bn in 2020. Read more information on the transaction here,
- In May 2021, I&M Holdings PLC announced that it has completed the 90.0% acquisition of Orient Bank Limited Uganda (OBL) share capital, after receiving all the required regulatory approvals. As highlighted in our Cytonn Weekly #50/2020, I&M Holdings was set to pay Kshs 3.6 bn for the deal; which translated to a Price to Book Value (P/Bv) of 1.1x. The valuation of 1.1x P/Bv is 0.1x lower than the 7-year average which is at 1.2x P/Bv, but higher than the last one-year average, which is at 0.7x P/Bv and the average P/Bv in the listed banking stocks of 0.8x. Additionally, I&M Holdings will take over 14 branches from OBL, taking its total branches to 80, from 66 branches as at the end of 2020. Read more on the same here,
- On 25th August 2021, KCB Group announced that it had completed the 62.1% acquisition of Banque Populaire du Rwanda Plc (BPR), after receiving all the required regulatory approvals. KCB Group had agreed to purchase 62.1% stake in BPR from Atlas Mara Limited using a Price to Book Value (P/Bv) of 1.1x. According to the latest BPR financials released as of June 2021, the bank had a book value of Rwf 52.9 bn (Kshs 5.8 bn), and thus at the trading multiple of 1.1x, we expect KCB Group to have spent an estimated Kshs 6.3 bn to acquire BPR Rwanda. The valuation of 1.1x P/Bv is lower than the 7-year average which is at 1.3x P/Bv, but higher than the last one-year average, which is at 0.7x P/Bv and the average P/Bv in the listed banking stocks of 1.0x as of Q1’2021. Additionally, KCB Group will take over 135 branches from BPR, taking its total branches to 489, from 354 branches as of June 2021. Read more information on the transaction here,
- On 14th September 2021, Liberty Holdings Limited (Liberty), a financial services and property holding company completed the acquisition of 84.2 mn shares in Liberty Kenya Holdings Plc (Liberty Kenya), which represents 15.7% of the company’s issued share capital. This followed the June 2021 announcement of Liberty Holdings intention to buy 49.5 mn ordinary shares from the Conrad N. Hilton Foundation, Kimberlite Frontier Africa Master Fund, L.P. and Vanderbilt University (the KFAMF Acquisition), and a further 34.7 mn ordinary shares from Coronation Africa Frontiers Fund and Coronation All Africa Fund (the Coronation Acquisition), which represented 9.3% and 6.5% of the company’s shareholding, respectively. The completed acquisition has increased Liberty Holding’s stake to 73.5% (393.6 mn ordinary shares), from the current 57.7% (309.3 mn ordinary shares), retaining Liberty Holding’s status as the largest shareholder of Liberty Kenya. Read more information on the transaction here, and,
- In November 2021, HF Group announced the invitation of strategic investors to acquire a stake in the Company following a Proposed Transaction disclosure in their published FY’2020 Financial Statements. The Proposed Transaction aims to inject capital to the company so as to increase its liquidity and enable expansion into mainstream banking including retail and SME lending, while also reducing reliance on the Real Estate market segment. This comes after the Kshs 1.0 bn capital injection the group received from its top shareholder, Britam Holdings Plc, in January this year, which aimed at growing the firm’s full-service banking offering. The price at which an investor will buy a stake in the company is expected to be based on negotiations with the issuer. Read more on the same here.
Below is a summary of the deals in the last 7-years that have either happened, been announced or expected to be concluded:
|
Acquirer |
Bank Acquired |
Book Value at Acquisition (Kshs bn) |
Transaction Stake |
Transaction Value (Kshs bn) |
P/Bv Multiple |
Date |
|
I&M Holdings PLC |
Orient Bank Limited Uganda |
3.3 |
90.0% |
3.6 |
1.1x |
April-21 |
|
KCB Group |
Banque Populaire du Rwanda |
5.3 |
100.0% |
5.6 |
1.1x |
August 2021 |
|
KCB Group** |
ABC Tanzania |
Unknown |
100% |
0.8 |
0.4x |
Nov-20* |
|
Co-operative Bank |
Jamii Bora Bank |
3.4 |
90.0% |
1 |
0.3x |
Aug-20 |
|
Commercial International Bank |
Mayfair Bank Limited |
1 |
51.0% |
Undisclosed |
N/D |
May-20* |
|
Access Bank PLC (Nigeria) |
Transnational Bank PLC. |
1.9 |
100.0% |
1.4 |
0.7x |
Feb-20* |
|
Equity Group ** |
Banque Commerciale Du Congo |
8.9 |
66.5% |
10.3 |
1.2x |
Nov-19* |
|
KCB Group |
National Bank of Kenya |
7 |
100.0% |
6.6 |
0.9x |
Sep-19 |
|
CBA Group |
NIC Group |
33.5 |
53%:47% |
23 |
0.7x |
Sep-19 |
|
Oiko Credit |
Credit Bank |
3 |
22.8% |
1 |
1.5x |
Aug-19 |
|
CBA Group** |
Jamii Bora Bank |
3.4 |
100.0% |
1.4 |
0.4x |
Jan-19 |
|
AfricInvest Azure |
Prime Bank |
21.2 |
24.2% |
5.1 |
1.0x |
Jan-18 |
|
KCB Group |
Imperial Bank |
Unknown |
Undisclosed |
Undisclosed |
N/A |
Dec-18 |
|
SBM Bank Kenya |
Chase Bank Ltd |
Unknown |
75.0% |
Undisclosed |
N/A |
Aug-18 |
|
DTBK |
Habib Bank Kenya |
2.4 |
100.0% |
1.8 |
0.8x |
Mar-17 |
|
SBM Holdings |
Fidelity Commercial Bank |
1.8 |
100.0% |
2.8 |
1.6x |
Nov-16 |
|
M Bank |
Oriental Commercial Bank |
1.8 |
51.0% |
1.3 |
1.4x |
Jun-16 |
|
I&M Holdings |
Giro Commercial Bank |
3 |
100.0% |
5 |
1.7x |
Jun-16 |
|
Mwalimu SACCO |
Equatorial Commercial Bank |
1.2 |
75.0% |
2.6 |
2.3x |
Mar-15 |
|
Centum |
K-Rep Bank |
2.1 |
66.0% |
2.5 |
1.8x |
Jul-14 |
|
GT Bank |
Fina Bank Group |
3.9 |
70.0% |
8.6 |
3.2x |
Nov-13 |
|
Average |
|
|
76.7% |
|
1.3x |
|
|
* Announcement Date ** Deals that were dropped |
||||||
In 2021, Kenya’s operating environment was characterized by a relatively improved macro-economic environment owing to the easing of the COVID-19 restrictions in the country coupled with the gradual recovery in various sectors of the economy. In 2021, the market remained slumped with NASI’s P/E of 11.3x trading below its’ historical average of 12.9x, and below the most recent peak of 15.9x in April 2018, showing that pockets of value still exist. We are “Neutral” on the Equities markets in the short term. With the market currently trading at a premium to its future growth (PEG Ratio at 1.3x), we believe that investors should reposition towards companies with a strong earnings growth and are trading at discounts to their intrinsic value. We expect the discovery of new COVID-19 variants coupled with slow vaccine rollout in developing economies to continue weighing down the economic outlook. On the upside, we believe that the recent relaxation of lockdown measures in the country will lead to improved investor sentiments in the economy.
In 2021, the Kenyan Real Estate sector witnessed increased development activities with a general improvement in Real Estate transactions, attributed to the improved business environment. The reopening of the economy has also facilitated numerous expansion and construction activities by investors, in addition to various businesses also resuming full operations. Consequently, the Real Estate sector grew by 4.9% in Q2’2021, 0.3% points higher than the 4.6% growth recorded in Q2’2020, according to the Quarterly GDP Report by the Kenya National Bureau of Statistics’ (KNBS). Some of the factors that supported the improved performance of the sector included:
- Government’s continued focus on initiating and implementing affordable housing projects, coupled with improved investor confidence in the country’s housing market. In November 2021, the Capital Markets Authority (CMA) approved the issuance of a Kshs 3.9 bn Medium Term Note (MTN) programme which will be used to finance the construction of the ongoing Pangani Affordable Housing Project,
- Aggressive expansion by local and international retailers in the country such as Naivas, QuickMart, and Carrefour supermarket chains taking up spaces previously occupied by troubled retailers such as Tuskys, Uchumi and Nakumatt,
- Lifting of flight travel bans that led to increased number of visitor arrivals into the country, evidenced by KNBS’ October 2021 Leading Economic Indicators Report which highlighted that number of visitor arrivals came in at 72,809 in October 2021, compared to the 28,982 visitors recorded in October 2020. This in turn led to performance of serviced apartments increasing as well, and hotels also resuming full operations,
- Government’s aggressiveness in implementing infrastructure projects especially road projects such as the Nairobi Expressway, and Nairobi Western Bypass projects, among many others, which in turn continues to boost Nairobi’s positioning as a regional hub thereby supporting Real Estate investments,
- Kenya Mortgage Refinance Company efforts to make loans available to home buyers. In support of this, the average mortgage loan size increased to Kshs 8.6 mn in 2020, from Kshs 8.5 mn in 2019, according to Central Bank of Kenya’s (CBK) Bank Supervision Annual Report 2020. However, the number of mortgages reduced to 26,971 in December 2020 from 27,993 in December 2019 due to the effect of the Covid 19 depressed economy,
- Positive demographics evidenced by Kenya’s relatively high urbanization and population growth rates of 4.0% p.a and 2.3% p.a, respectively, against the global average of 1.8% p.a and 1.0% p.a, respectively, as at 2020, driving increased demand for developments, and,
- Establishment of statutory laws by the government aimed at aligning Kenya with international standards in an attempt to address the shortcomings of previous Acts. The laws are also expected to streamline Real Estate investments and transactions.
Conversely, there were challenges that impeded performance of the Real Estate sector which include:
- Financial constraints leading to various projects stalling, as banks limited lending due to the increasing non-performing loans. This is evidenced in Central Bank of Kenya’s (CBK) Quarterly Economic Review Report April- June 2021 which highlighted that gross non-performing loans to the Real Estate sector increased by 14.8% to Kshs 70.5 bn in Q1’2021, from Kshs 61.4 bn recorded in Q4’2020,
- Existing oversupply in the Nairobi Metropolitan Area (NMA) office and retail market at 7.3 mn SQFT and 3.0 mn SQFT, respectively, coupled with an oversupply of 1.7 mn SQFT in the Kenya retail market,
- Crippled demand for office spaces as people continue to advocate for remote working strategy, leading to reduced occupancies, in addition to some landlords providing rent discounts in a bid to attract and retain existing clients,
- E-commerce strategy still being adopted by some business owners, thus crippling the demand for physical retail spaces,
- Obstacles in in real estate fund raising given the high minimums of Kshs. 5 million for development REITs, limited Trustees in the market and the high levels of capital required for REIT trustees saw little to no local fundraising in the REITs market,
- Under-developed capital markets making it hard to develop pools of capital focused on projects particularly in the private markets, to complement efforts by the government. In Kenya, the main source of funding for real estate developers is banks which provide close to 95.0% of funding as compared to 40.0% in developed countries. This implies that capital markets contribute a mere 5.0% of real estate funding, compared to 60.0% in developed countries,
- Travel bans and restrictions imposed particularly in the first half of the year by key markets like the United Kingdom and United States of America, thereby affecting the number of arrivals into the country, and in turn the performance of serviced apartments and hotels, and,
- COVID-19 uncertainties as the virus continues to mutate with the most current emerging variant being Omicron. This might lead to most tourists halting their travel plans with other countries imposing strict measures to limit the spread of the virus.
In terms of performance, residential, commercial office, retail, mixed-use developments and serviced apartments sectors realized average rental yields of 4.6%, 7.2%, 7.8%, 7.2%, and 5.5%, respectively. This resulted to an average rental yield for the real estate market at 6.5%, 0.4% points higher than the 6.1% recorded in 2020. The improvement in performance was mainly attributed to improved business environment. The reopening of the economy also facilitated numerous expansions and construction activities by investors.
|
Annual Real Estate Rental Yields Summary Table, for Existing Properties |
||||||
|
|
2017 |
2018 |
2019 |
2020 |
2021 |
Y/Y Change (% Points) |
|
Average Rental Yield |
7.6% |
7.4% |
7.0% |
6.1% |
6.5% |
0.4% |
Source: Cytonn Research 2021
For the detailed real estate market review report, see our Real Estate Annual Markets Review 2021 Note.
- Residential Sector
In terms of performance, the residential sector recorded an improvement in performance, with the average total return to investors at 6.1%, an increase from the 4.7% recorded in FY’2020. On a q/q basis, the average total returns improved by 0.6% points from the 5.5% recorded in Q3’2021. The improvement is mainly on the back of the improved investor confidence in the residential market due to less uncertainties in Real Estate market compared to last year. Rental yields averaged at 4.8%, a 0.1% drop from 4.9% recorded in FY’2020 indicating inability to raise rents as the economy remains soft and spending power remains weak.
Detached units recorded an improvement in performance with average total returns to investors coming in at 5.6%, a 1.4% points y/y increase from the 4.2% recorded in FY’2020. On a q/q basis, the total returns represented a 0.8% points increase from the 4.8% recorded in Q3’2021. The improved performance is attributable to increased demand for detached units in the satellite town areas, which are spacious and affordable as evidenced by the low price per SQM at Kshs 303, compared to upper mid-end and high-end areas at Kshs 531 and Kshs 682, respectively.
Apartments recorded a significant improvement in performance with the average total returns coming in at 6.7%, a 1.5% points y/y increase from the 5.2% recorded in FY’2020. This was attributable to a 5.3% average rental yield and an average y/y price appreciation of 1.4%. On a q/q basis, the average total return increased by 0.6% from the 6.1% recorded in Q3’2021. The lower mid-end satellite towns were the best performing segment with an average total return of 7.3% compared lower mid-end satellite towns and upper mid-end areas with average total returns at 7.1% and 5.7% respectively. This performance was attributable to increased returns in the major suburb town nodes where infrastructure developments are currently ongoing.
All values in Kshs unless stated otherwise
|
Residential Market Performance Summary - FY'2021 |
||||||||
|
Segment |
Average of Price per SQM FY'2021 |
Average of Rent per SQM FY'2021 |
Average of Occupancy FY'2021 |
Average of Uptake FY'2021 |
Average of Annual Uptake FY'2021 |
Average of Rental Yield FY'2021 |
Average of Price Appreciation FY'2021 |
Total Returns |
|
Detached Units |
||||||||
|
High End |
193,715 |
682 |
89.9% |
88.1% |
14.3% |
3.9% |
1.0% |
4.9% |
|
Upper Mid-End |
142,460 |
531 |
86.7% |
79.5% |
13.9% |
4.2% |
1.8% |
6.0% |
|
Satellite Towns |
72,067 |
303 |
86.9% |
82.7% |
17.0% |
4.7% |
1.1% |
5.8% |
|
Detached Units Average |
136,081 |
505 |
87.9% |
83.4% |
15.0% |
4.3% |
1.3% |
5.6% |
|
Apartments |
||||||||
|
Upper Mid-End |
121,504 |
634 |
87.3% |
88.3% |
17.7% |
5.4% |
0.3% |
5.7% |
|
Lower Mid-End |
110,194 |
499 |
85.5% |
87.3% |
18.6% |
5.2% |
1.9% |
7.1% |
|
Satellite Towns |
77,023 |
401 |
85.0% |
83.3% |
15.5% |
5.3% |
2.0% |
7.3% |
|
Apartments Average |
102,907 |
511 |
85.9% |
86.3% |
17.3% |
5.3% |
1.4% |
6.7% |
|
Residential Market Average |
119,494 |
508 |
86.9% |
84.9% |
16.2% |
4.8% |
1.3% |
6.1% |
Source: Cytonn Research 2021
Our Outlook for the residential sector is NEUTRAL supported by the continued construction of affordable housing projects and diversified sources of finance to fund both affordable housing and mortgages. However, we expect the sluggishness of the affordable housing initiative and the low penetration of mortgages in the country to continue impeding the performance of the sector. For detached units, investment opportunity lies in areas such as Ruiru and Ngong while for apartments, investment opportunity lies in Rongai and Waiyaki Way.
- Commercial Office Sector
The commercial office sector realized a slight improvement in its overall performance in FY’2021, with the average rental yields coming in at 7.1%, 0.1 % points higher than the 7.0% recorded in 2020. The average occupancy rates increased by 0.2% to 77.9%, from 77.7% recorded in 2020. The improvement in performance was mainly driven by an improved business environment following the lifting of the COVID-19 containment measures, as well as some businesses resuming full operations hence boosting the occupancy rates. The average asking rents remained flat at Kshs 93, as some landlords still offer discounts in order to retain and attract new clients, hence the rents haven’t resumed their pre-covid rates. The table below highlights the performance of the Nairobi Metropolitan Area (NMA) Commercial Office sector over time:
All values in Kshs Unless Stated Otherwise
|
Nairobi Metropolitan Area (NMA) Commercial Office Returns since 2020 |
|||||||||
|
|
Q1' 2020 |
H1' 2020 |
Q3' 2020 |
FY' 2020 |
Q1'2021 |
H1’2021 |
Q3' 2021 |
FY'2021 |
∆ FY'2020/FY '2021 |
|
Occupancy % |
81.7% |
80.0% |
79.9% |
77.7% |
76.3% |
75.8% |
77.3% |
77.9% |
0.2% |
|
Asking Rents (Kshs/SQFT) |
97 |
95 |
94 |
93 |
92 |
93 |
93 |
93 |
0.0% |
|
Average Prices (Kshs/SQFT) |
12,535 |
12,516 |
12,479 |
12,280 |
12228 |
12224 |
12,211 |
12,279 |
0.0% |
|
Average Rental Yields (%) |
7.8% |
7.3% |
7.2% |
7.0% |
6.8% |
6.9% |
6.9% |
7.1% |
0.1% |
Source: Cytonn Research 2021
A key notable highlight for the commercial office sector during the year was;
- Insurance Regulatory Authority (IRA) and Capital Markets Authority (CMA) announced that they want to jointly buy office spaces within Nairobi premises, a move that will see it take up at least 55,000 SQFT of office space in Upper Hill with a minimum of 100 parking bays, and the building expected to sit on at least two-acre piece land. For more analysis, please see Cytonn Weekly #19/2021.
Our outlook for the NMA commercial office sector is NEUTRAL attributed to an improved business environment following the lifting of the COVID-19 containment measures, as well as some businesses resuming full operations hence boosting the occupancy rates. However, the existing oversupply at 7.3 mn SQFT, coupled with the remote working strategy still being embraced by some firms thus crippling demand for physical spaces, is expected to weigh down performance of the sector.
- Retail Sector
In FY’2021, the Retail sector recorded a 0.3% points increase in average rental yields to 7.8%, from 7.5% in 2020. The average rents and occupancies also increased by 0.6% and 1.6% points to Kshs 170 per SQFT and 76.8%, respectively, in FY’2021, from Kshs 169 per SQFT and 75.2%, respectively in FY’2020. The general improvement in performance in 2021 was due to; i) an improved business environment following the lifting of the COVID-19 containment measures, ii) aggressive expansion by local and international retailers such as Naivas, Artcaffe, QuickMart, and Carrefour, iii) increased infrastructure developments hence promoting accessibility to retail centres, iv) availability of prime retail space left by troubled retailers, and, v) positive demographics facilitating demand for spaces, goods and services.
The table below shows the performance of the retail sector in Nairobi over time;
|
Summary of Retail Sector Performance Since 2020 |
|||||||||
|
Item |
Q1'2020 |
H1'2020 |
Q3'2020 |
FY'2020 |
Q1'2021 |
H1'2021 |
Q3'2021 |
FY'2021 |
Y/Y 2021 ∆ |
|
Average Asking Rents (Kshs/SQFT) |
173 |
170 |
169 |
169 |
166 |
169 |
168 |
170 |
0.6% |
|
Average Occupancy (%) |
76.3% |
74.0% |
74.2% |
75.2% |
75.0% |
75.70% |
75.8% |
76.8% |
1.6% |
|
Average Rental Yields |
7.7% |
7.4% |
7.4% |
7.5% |
7.4% |
7.60% |
7.5% |
7.8% |
0.3% |
Source: Cytonn Research 2021
For notable highlights during the year; see (Cytonn Q1’2021 Markets-Review, Cytonn H1’2021 Markets Review, and, Cytonn Q3’2021 Markets Review highlights); For Q4’2021,
- Naivas Supermarket, a local retailer, opened a new outlet in Nairobi CBD at Uchumi City Centre along Agha Khan Walk, taking up 20,000 SQFT prime space previously occupied by Uchumi Supermarket. For more information, see Cytonn Monthly October 2021,
- Chandarana Foodplus, a local retailer opened a new outlet at new Golden Life Mall in Nakuru, bringing its total operational outlets countrywide to 22. For more information, see Cytonn Weekly # 44/2021,
- Papa John’s International Inc. announced a partnership deal with Kitchen Express to open 60 new fast-food outlets in Kenya and Uganda from 2022. For more information, see Cytonn Weekly #47/2021,
- Artcaffe Group, an international restaurant chain, announced plans to open 4 new outlets in Nairobi by the end of the year. For more information, see Cytonn Monthly November 2021,
- Naivas Supermarket opened two new outlets. The first is located at Oasis Mall in Malindi, Kilifi County, taking 28,000 SQFT of space previously occupied by Nakumatt, while the second is located in Embakasi off Airport North Road, Nairobi County taking 27,000 SQFT of space previously occupied by Tuskys Supermarket. For more information, see Cytonn Weekly #49/2021, and,
- Rhapta Square Shopping Mall along Rhapta Road in Westlands began operations in December 2021. Rhapta Square will host key retail chains such as Optica Limited, Artcaffe’ Market, Peak-a-boo Kids Shop, Good Life Pharmacy, Diamond Trust Bank (DTB), among others. For more information, see Cytonn Weekly #51/2021.
The table below shows the summary of the number of stores of the key Local and International Retailer supermarket chains in Kenya;
|
Main Local and International Retail Supermarket Chains |
|||||||||
|
Name of Retailer |
Category |
Highest number of branches that have ever existed as at FY’2018 |
Highest number of branches that have ever existed as at FY’2019 |
Highest number of branches that have ever existed as at FY’2020 |
Number of branches opened in 2021 |
Closed branches |
Current number of Branches |
Number of branches expected to be opened |
Projected number of branches FY’2021 |
|
QuickMart |
Local |
10 |
29 |
37 |
9 |
0 |
46 |
0 |
46 |
|
Chandarana |
Local |
14 |
19 |
20 |
1 |
0 |
22 |
1 |
23 |
|
Carrefour |
International |
6 |
7 |
9 |
5 |
0 |
16 |
0 |
16 |
|
Cleanshelf |
Local |
9 |
10 |
11 |
1 |
0 |
12 |
0 |
12 |
|
Tuskys |
Local |
53 |
64 |
64 |
0 |
61 |
3 |
0 |
3 |
|
Game Stores |
International |
2 |
2 |
3 |
0 |
0 |
3 |
0 |
3 |
|
Uchumi |
Local |
37 |
37 |
37 |
0 |
35 |
2 |
0 |
2 |
|
Choppies |
International |
13 |
15 |
15 |
0 |
13 |
2 |
0 |
2 |
|
Shoprite |
International |
2 |
4 |
4 |
0 |
4 |
0 |
0 |
0 |
|
Nakumatt |
Local |
65 |
65 |
65 |
0 |
65 |
0 |
0 |
0 |
|
Total |
257 |
313 |
334 |
26 |
178 |
185 |
2 |
187 |
|
Source: Online Search
We have a NEUTRAL outlook on the retail sector’s performance with the performance expected to be driven by the rapid expansion by retailers, infrastructure road and railway projects boosting accessibility, and positive demographics facilitating demand. However, the performance is expected to be impeded by; i) oversupply at 1.7 mn SQFT in the Kenyan retail sector and 3.0 mn SQFT in the NMA retail sector, ii) growing popularity of e-commerce which continues to affect occupier demand, and, iii) financial constraints hindering developments.
- Mixed Use Developments (MUDs)
In 2021, we released the Nairobi Metropolitan Area (NMA) Mixed Use Developments Report 2021. According to the report Mixed-Use Developments recorded an average rental yield of 7.2% in 2021, 0.7% points higher than the respective single-use themes which recorded average rental yield of 6.5% in the similar period. The relatively better performance was mainly attributed to; i) an improved business environment, ii) strategic and prime locations of the developments with the capability to attract prospective clients, and, iii) preference by target clients due to their convenience hence improved demand and returns to investors. The retail and commercial office theme in the MUDs recorded a 1.3% and 0.2% points increase in the average rental yield to 8.4% and 7.1%, respectively in 2021, from 7.1% and 6.9% in 2020. This was mainly due to an improved business environment leading to increased demand and uptake of spaces.
For the residential theme in the MUDs, the average rental yield declined by 0.3% points to 6.0% in 2021, from 6.3% in 2020, attributed to other landlords still offering discounts in a bid to attract more tenants as well as retaining the existing ones. Additionally, the retail, commercial office and residential themes in the MUDs performed better in 2021 when compared to single-use retail, commercial office and residential themes which realized rental yields of 7.8%, 6.6% and 5.2%, respectively in 2021. This was attributed to their incorporated live, work and play lifestyle thus more preferred, coupled with the adequate amenities available leading to their increased demand.
The table below shows the performance of Mixed-Use Developments by node in 2021;
(All Values in Kshs Unless Stated Otherwise)
|
Nairobi’s Mixed-Use Developments Market Performance by Nodes 2021 |
|||||||||||||
|
|
Retail Performance |
Commercial Office Performance |
Residential Performance |
|
|||||||||
|
Location |
Price/SQFT |
Rent/SQFT |
Occup. (%) |
Rental Yield (%) |
Price/ SQFT |
Rent/SQFT |
Occup. %) |
Rental Yield (%) |
Price/ SQM |
Rent/ SQM |
Annual Uptake % |
Rental Yield % |
Average MUD yield |
|
Karen |
23,333 |
196 |
86.7% |
8.8% |
13,233 |
117 |
85.0% |
9.0% |
|
|
|
|
8.7% |
|
Westlands |
15,833 |
173 |
70.8% |
9.5% |
12,892 |
110 |
71.7% |
7.3% |
211,525 |
1,226 |
15.6% |
7.0% |
7.8% |
|
Kilimani |
18,500 |
162 |
79.0% |
8.3% |
13,713 |
106 |
79.0% |
6.7% |
|
|
|
|
7.4% |
|
Mombasa Rd |
20,000 |
185 |
70.0% |
8.4% |
13,000 |
100 |
60.0% |
5.5% |
156,079 |
853 |
13.3% |
6.6% |
7.4% |
|
Thika Rd |
23,750 |
215 |
82.5% |
9.2% |
13,250 |
105 |
72.5% |
6.9% |
128,545 |
612 |
17.9% |
6.1% |
7.0% |
|
Upper Hill |
15,485 |
130 |
62.5% |
6.4% |
12,000 |
102 |
70.0% |
7.0% |
|
|
|
|
6.8% |
|
Eastlands |
20,000 |
124 |
75.0% |
5.5% |
12,000 |
80 |
62.5% |
5.0% |
72,072 |
360 |
10.0% |
4.2% |
5.1% |
|
Average |
18,759 |
170 |
75.9% |
8.4% |
12,924 |
106 |
73.6% |
7.1% |
142,055 |
763 |
15.0% |
6.0% |
7.2% |
|
*The average MUDs performance is based on areas where sampled projects exist |
|||||||||||||
Source: Cytonn Research 2021
For notable highlights during the year please see our Cytonn Q1’2021 Markets Review, Cytonn H1’2021 Markets Review and Cytonn Q3’2021 Markets Review Reports. In Q4’2021;
- Sheria Savings and Credit Cooperative Society (SACCO) announced plans to begin construction of Sheria Towers in Upperhill, Nairobi before the end of 2021. The Kshs 2.0 bn project will comprise of residential units, shopping centers, and commercial offices sitting on a one-acre piece of prime land along Matumbato Close near their offices. For more information, see Cytonn Weekly #45/2021
- Tatu City, a Mixed-Use developer, announced a partnership deal with Stecol Corporation, a Chinese construction and engineering firm, to develop supporting infrastructure in the final phase of Kijani Ridge located in Ruiru, Kiambu County. The project’s cost is estimated at Kshs 1.0 bn and is expected to be completed by the end of 2022. For more information, see Cytonn Weekly #47/2021
- President Uhuru Kenyatta, officially opened the Global Trade Center (GTC) Office Tower located along Waiyaki Way in Westlands. Global Trade Center is a Kshs 40.0 bn investment comprising of 6 towers has been developed by Avic International Real Estate from 2014. For more information please see our Cytonn Weekly #51/2021, and,
- During the week, Tatu City, a mixed-use developer, set up a ‘One-stop-shop’ facility in their 5,000-acre city located in Ruiru, Kiambu County. The shop will facilitate operations of the Special Economic Zone Authority (SEZA) activities which include application of permits, approvals, and licenses for ease of doing business with the government, and is expected to begin operations in January 2022. This comes after Stecol Corporation, a Chinese engineering company began Kshs 1.0 bn infrastructural works such as footpaths and street lights among other developments, on Kijani Ridge, which is part of the residential area in Tatu City. The development of the center is expected to ease delivery and accessibility of services within the city as well as promote expansion of the Mixed-Use Developments in the country, which have become preferential due to convenience and high returns offered to investors compared to single theme developments.
Our outlook on Mixed-Use Developments (MUDs) is NEUTRAL supported by the impressive returns recorded at 7.2% in 2021, from 6.9% in 2020. However, their performance is expected to be weighed down by existing oversupply at 7.3 mn SQFT in the NMA commercial office market, and oversupply in the retail market at 3.0 mn SQFT in the NMA and 1.7 mn SQFT in the Kenya retail market. Investment opportunity lies in areas with relatively high returns such as Karen and Westlands which recorded an average MUD rental yield of 8.7%, and, 7.8% respectively, against the market average of 7.2%.
- Hospitality Sector
The hospitality sector has been on a recovery path in 2021, as evidenced by the increasing number of hotels in operation, hotel bookings and bed occupancies during the year. In 2020, the hospitality sector was among the worst hit sectors by the COVID-19 pandemic following the international travel ban, lockdowns and social distancing measures put in place to curb the spread of the virus. These measures led to the decline in hotel bookings and occupancies, and, the closure of many hospitality-affiliated businesses.
In 2021, we released the Nairobi Metropolitan Area Serviced Apartments Report 2021. Overall serviced apartments’ year on year performance improved, with the occupancy rates increasing by 13.5% points to 61.5%, from 48.0% recorded in 2020. The monthly charges per SQM increased by 0.7% to Kshs 2,549 in 2021 from Kshs 2,533 recorded in 2020. The average rental yield increased by 1.5% points to 5.5% in 2021, from 4.0% recorded in 2020. This is mainly attributable to an increase in the number of local and international tourist arrivals following the lift of travel bans by countries such as the UK. This led to increased number of hotel bookings, occupancies and operational hotels during the period. The increase in the number of tourists is attributable to the; i) aggressive local marketing through price discounts, and, international marketing through the Magical Kenya platform in countries such as the Ukraine, ii) positive accolades for the Kenyan hospitality sector, iii) the return of international flights which had stalled from COVID-19 operational guidelines, and, iv) the mass vaccination currently underway in the country boosting confidence in the sector.
The table below shows the comparative analysis between 2020 and 2021;
All values in Kshs unless stated otherwise
|
Comparative Analysis-2020/2021 Market Performance |
|||||||||
|
Node |
Occupancy 2021 |
Occupancy 2020 |
Change in Occupancy |
Monthly Charge/SQM 2021 (Kshs) |
Monthly Charge/SQM 2020 (Kshs) |
% Change in Monthly Charges/SQM |
Rental Yield 2021 |
Rental Yield 2020 |
Change in Rental Yield |
|
Westlands |
68.8% |
49.4% |
19.4% |
3,569 |
3,584 |
(0.4%) |
8.3% |
6.1% |
2.2% |
|
Kileleshwa & Lavington |
57.1% |
48.1% |
9.0% |
2,571 |
2,553 |
0.7% |
6.4% |
4.3% |
2.1% |
|
Nairobi CBD |
66.6% |
42.1% |
24.6% |
2,176 |
2,122 |
2.5% |
4.9% |
2.9% |
2.0% |
|
Kilimani |
60.0% |
48.4% |
11.7% |
2,815 |
2,783 |
1.1% |
5.8% |
4.8% |
1.0% |
|
Thika Road |
56.4% |
48.1% |
8.3% |
1,748 |
1,726 |
1.3% |
3.5% |
2.0% |
1.6% |
|
Upperhill |
61.1% |
48.9% |
12.2% |
2,109 |
2,121 |
(0.6%) |
4.5% |
3.6% |
0.9% |
|
Limuru Road |
60.5% |
51.4% |
9.1% |
2,853 |
2,839 |
0.5% |
4.9% |
4.5% |
0.4% |
|
Average |
61.5% |
48.0% |
13.5% |
2,549 |
2,533 |
0.7% |
5.5% |
4.0% |
1.5% |
|
|||||||||
Source: Cytonn Research, 2021
- Westlands and Kileleshwa were the best performing nodes with a rental yield of 8.3% and 6.4%, respectively, compared to the market average of 5.5%. The submarkets recorded an increase in rental charges by 2.2% and 2.1% points, respectively, compared to an overall market increase of 1.5%. This can be attributed the strategic locations of these areas given its the proximity Nairobi CBD, availability of high quality serviced apartments, ease of accessibility, and proximity to most international organizations hence the demand.
- Thika Road was the least performing node with a rental yield of 3.5%, 2.0% points lower than the market average of 5.5% and we attribute this to the relatively low charge rates for apartments within the area given its unpopularity, the significant distance from main commercial zones, in addition to security concerns as the area is not mapped within the UN Blue Zone.
In Q4’2021 five reports related to the hospitality sector were released and below are the key takeouts;
|
# |
Report |
Key-Take Outs |
|
1. |
i. Overall, all the sampled hotels indicated that they were in operation between October and November 2021, representing a 4.0% points increase to 100%, from the 96.0% operation rate in September 2021, ii. The average bed occupancy in the month of October averaged at 56.0%, 18.0% and 4.0% points higher than 38.0% and 52.0% recorded in the months of September and November, respectively, and, iii. Local guests continued to account for majority of clientele population at 75.5% of accommodation and 76.4% restaurant services between October and November 2021, compared to 62.0% and 68.7%, respectively, during the period before the COVID-19 pandemic. For more information, please see our Cytonn Weekly #49/2021 |
|
|
2. |
i. The number of operational hotels came in at 96.0%, representing a stagnation since July 2021, ii. Local guests continued to account for majority of clientele population at 79.5% for accommodation and 78.9% for restaurant services between August and September 2021, and, iii. The average bed occupancy in September 2021 was at 38.0%, a 8.0% points increase from 30.0% in July. For more information please see our Cytonn Weekly #40/2021 |
For notable highlights during the year please see our Cytonn Q1’2021 Markets Review, Cytonn H1’2021 Markets Review and Cytonn Q3’2021 Markets Review Reports. In Q4’2021;
- Jameson Valley Holdings and Actis Limited, private equity firms, announced a Kshs 1.0 bn joint venture bid to buy three hotels, namely; Nairobi’s Fairview Hotel and Town Lodge Hotel both located along Bishop Road Upperhill, and, City Lodge Hotel located in Two Rivers, Runda. For more information, please see our Cytonn Weekly #41/2021,
- World Travel Awards (WTA), a global institution that acknowledges, rewards and celebrates excellence across all sectors of the tourism industry yearly, announced the 28th World Travel Awards For more information, please see our Cytonn Monthly – October 2021 , and,
- Actis Limited, a Private Equity Firm announced the completion of the acquisition of Fairview Hotel and Town Lodge Hotel both located at Bishop Road Upperhill, and, City Lodge Hotel in Two Rivers, Runda at a cost of Kshs 1.0 bn. For more information, please see our Cytonn Weekly #51/2021.
We have a NEUTRAL outlook for the hospitality sector and we expect the sector to be on an upward trajectory in terms of overall hotels in operations, hotel bookings, and hotel occupancy following the ambitious international marketing, positive accolades, the return of international flights and the mass vaccination currently underway in the country. However, the emergence of new COVID-19 variant Omicron, continues to pose a risk on this recovery as stricter measures may be imposed in order to curb its spread.
- Land Sector
The Nairobi Metropolitan Area (NMA) land sector recorded an average annualized capital appreciation of 2.8% in FY’2021, representing an 8.3% 10-year Compounded Annual Growth Rate (CAGR). Unserviced land in the satellite towns of the NMA recorded the highest capital appreciation at 5.8%, which is 3.0% points higher than the market average of 2.8%. This was mainly attributed to an increased demand resulting from their affordability, with the average asking price coming in at Kshs 13.5 mn, lower than the market average of Kshs 134.8 mn in 2021, and increased infrastructure developments enhancing accessibility to areas. On the other hand, average asking prices for land in the commercial zones of the NMA realized a 0.3% Year on Year (YoY) price correction. This was attributable to limited demand as developers withheld their construction plans awaiting the absorption of existing spaces particularly in the oversupplied commercial office and retail sectors.
The table below shows the summary of the NMA land performance;
All Prices in Kshs (mn) Unless Stated Otherwise
|
Nairobi Metropolitan Area Land Performance Trend |
||||||||
|
Location |
Price in 2011 |
Price in 2017 |
Price in 2018 |
Price in 2019 |
Price in 2020 |
Price in 2021 |
10 Year CAGR |
Annual Capital Appreciation 2020/'21 |
|
Unserviced land- Satellite Towns |
9.0 |
20.4 |
22.7 |
24.9 |
12.7 |
13.5 |
4.1% |
5.8% |
|
Serviced land- Satellite Towns |
6.0 |
14.4 |
14.3 |
14.3 |
14.8 |
15.4 |
9.9% |
3.8% |
|
Nairobi Suburbs - Low Rise Residential Areas |
56.0 |
82.4 |
89.4 |
91.6 |
93.8 |
96.6 |
5.6% |
3.2% |
|
Nairobi Suburbs - High Rise residential Areas |
46.0 |
134.6 |
135.0 |
137.5 |
135.7 |
137.0 |
11.5% |
1.6% |
|
Nairobi Suburbs - Commercial Areas |
156.0 |
429.8 |
447.3 |
428.5 |
413.0 |
411.2 |
10.2% |
(0.3%) |
|
54.6 |
144.5 |
155.4 |
139.4 |
134.0 |
134.8 |
8.3% |
2.8% |
Source: Cytonn Research 2021
A key notable highlight for the land sector during the year was;
President Uhuru Kenyatta officially launched the National Land Information Management System (NLIMS) marking the culmination of years of digitization of land records in Kenya. The launch of the digital land platform named ‘Ardhi Sasa’, which will be first rolled out in Nairobi then in other counties in phases, coincided with the opening of the National Geospatial Data Centre, an online depository that will contain all the land records in Kenya. For more analysis, see Cytonn Monthly, April 2021.
We have a POSITIVE outlook for the land sector supported by factors such as; i) positive demographics, ii) growing demand for land particularly in the satellite areas, iii) improving infrastructure thereby opening up areas for investment, iv) government’s efforts towards ensuring efficient and streamlined processes in land transactions, and, v) the continued focus on the affordable housing initiative driving demand for land.
- Infrastructure
The government has continued to demonstrate commitment to development of infrastructure in line with Vision 2030 aspirations to provide safe, efficient, accessible, and, sustainable transportation services. For notable highlights during the year please see our Cytonn Q1’2021 Markets Review, Cytonn H1’2021 Markets Review and Cytonn Q3’2021 Markets Review Reports. For Q4’2021;
- The County government of Turkana and the Eastern Equatorial State of South Sudan signed a Memorandum of Understanding (MoU) that will allow the continuation of the construction of the Nadapal River Section A1 road, which is part of the Lokichar-Nadapal/Nakodok road upgrade that links Kenya to South Sudan. Additionally, the Cabinet Secretary for Ministry of Transport, Infrastructure, Housing and Urban Development, Hon. James Macharia, announced that the construction of the 233.0 Km Rironi-Nakuru-Mau Summit Road toll highway from Nairobi to Mau Summit will begin by December 2021. For more information, please see our Cytonn Weekly #40/2021,
- Kenya Urban Roads Authority (KURA) announced plans to revamp sections of the 9.8 Km Ngong Road starting from Dagoretti Corner to Karen Shopping Centre. For more information, please see our Cytonn Weekly #42/2021. Additionally, KURA also announced the commencement of the conversion of the 32.0 Km Eastern Bypass into a dual carriage way at a cost of Kshs 12.5 bn. For more information, see Cytonn Weekly #46/2021,
- Kenya National Highways Authority (KENHA) announced the commencement of construction of the 29.0 Km Kinango-Kwale road in Kwale County by China Civil Engineering Construction Corporation at a cost of Kshs 3.0 bn. For more information, see Cytonn Weekly #45/2021. Additionally, KENHA also announced that they had contracted Victoria Engineering Company, to tarmac the 35.8 Km Kopasi River- Lomut – Sigor- Marich link road, in West Pokot County, at a cost of Kshs 4.4 bn. For more information, see Cytonn Weekly #47/2021,
- The Italian government through its Ambassador to Kenya, Alberto Pieri, announced plans to spend Kshs 780.0 mn on revamping dilapidated roads in Malindi such as the Mjanaheri-Ngomeni road that links Malindi to the Italian space agency San Marco. For more information, please see our Cytonn Monthly - November 2021,
- The National Government tasked the Kenya Rural Roads Authority (KeRRA) was tasked to upgrade the 54.0 Km Mto Mwagodi-Mbale-Wundanyi-Bura at a cost of Kshs 2.2 bn. For more information, see Cytonn Weekly # 44/2021. KERRA also announced plans to revamp the 36.4 Km Lurambi road in Kakamega County at a cost of Kshs 1.7 bn. For more information, please see our Cytonn Weekly #50/2021. Additionally, during the week, KERRA commenced the construction of 44.0 Km road network linking the Sub-Counties of Oljoro Orok and Ol-Kalou constituencies, in Nyandarua County at a cost of Kshs 2.0 bn. The road is expected to enhance accessibility, improve trade activities and boost real estate investments in the area, and,
- Japanese Government through the United Nations Development Program (UNDP), announced a Kshs 24.0 mn funding for the reopening of Chesogon Road linking the areas of Sigor and Marakwet, in West Pokot and Elgeyo-Marakwet counties. For more information, please see our Cytonn Weekly #51/2021.
We expect the government to continue supporting improvement of infrastructure in an aim to open up areas for investments in Kenya through provision, maintenance and management of road infrastructure. This will in turn boost the real estate sector through enhanced accessibility for investors and suppliers and the boosted property prices along these areas due to improved demand.
- Statutory Review
In 2021, the government continued to foster progressive legislation to align with the current market requirements in order to streamline Real Estate transactions. We expect the reforms to have a positive impact on the Real Estate sector as they will not only improve operations but also solve some of the current challenges being experienced in the sector. For notable highlights during the year, please see our Cytonn Q1’2021 Markets Review, Cytonn H1’2021 Markets Review and Cytonn Q3’2021 Markets Review Reports. In Q4’2021;
- The government of Kenya announced plans to review property rates after every five years as contained in the proposed National Rating Bill, 2021, to ensure the government does not lose out on the current capital appreciations of land. For more information, please see our Cytonn Weekly #41/2021, and,
- President Uhuru Kenyatta signed the Public Private Partnerships (PPP) Bill 2021 into law. The Act aims to address the shortcomings of the PPP Act 2013 by including a streamlined project processes with clear timelines, expanded procurement options and robust processes for privately initiated investment proposals. For more information, please see Cytonn Weekly #49/2021.
The legislations are expected to align Kenya with international standards and attempt to address the shortcomings of previous Acts. The institutional and operational changes are expected to make more investor-friendly processes to counter the challenges currently being experienced in the Real Estate sector.
- Listed Real Estate
In the Nairobi Stock Exchange, ILAM Fahari I-REIT closed the year trading at an average price of Kshs 6.3 per share, representing a 7.9% Year-on-Year (YoY) increase from the Kshs 5.8 per share. However, on Inception-to-Date (ITD) basis, the REIT’s performance declined by 68.5% from Kshs 20.0.
In the Unquoted Securities Platform, Acorn DREIT closed the year trading at Kshs 20.1 while the I-REIT closed at Kshs 20.6 per unit. This performance represented a 0.5% and 3.0% gain for the DREIT and I-REIT, respectively, from the Kshs 20.0 Inception price. The volumes traded for the D-REIT and I-REIT came in at 5.4 mn and 12.3 mn shares, respectively, with a turnover of Kshs 108.9 mn and Kshs 254.1 mn, respectively since Inception-to-Date.
The graph below shows Fahari I-REIT’s performance from November 2015 to December 2021:
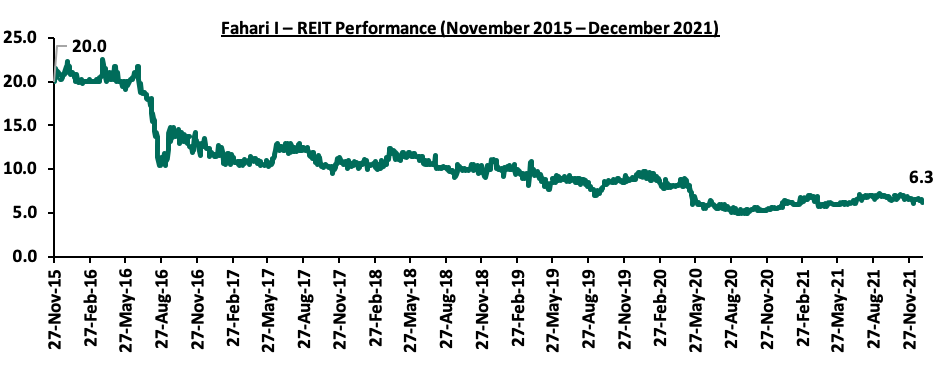
Notable highlight in the REITs sector during the year include;
- ILAM Fahari I-REIT released their H1’2021 earnings, which registered a 50.9% decline in their basic earnings per unit to Kshs 0.2 from Kshs 0.5 realized in H1’2021. This was attributed to the 18.4% decline in the total operating income to Kshs 147.1 mn, from Kshs 180.1 mn in H1’2020. The rental income came in at Kshs 136.7 mn, a 21.8% decline from the Kshs 174.7 mn recorded in H1’2020, with rental yields thereby realizing a 1.3% points YoY decline to 1.2% from 2.5% in 2020. This was mainly attributable to the low rental income generated by the retail and commercial offices struggling to attract and maintain tenants. For a more comprehensive analysis, please see our ILAM Fahari I-REIT H1’2021 Earnings Note, and,
- Acorn Holdings published their first financial statement released in H1’2021, for the D-REIT and I-REIT Investment arm which have been invested in student accommodation. Acorn D-REIT recorded profits of Kshs 266.9 mn in H1’2021 while the I-REIT profits came in at Kshs 141.3 mn. The D-REIT Performance was mainly driven by the Kshs 339.0 mn increase in the fair value of Investment Property. For a more comprehensive analysis, please see our Acorn Holdings H1’2021 Earnings Note.
Real Estate Investments Trusts (REITs) offer various benefits which include low cost exposure to real estate, tax exemption, and diversification among many others. However their performance is expected to be subdued due to; i) a general lack of knowledge on the financing instrument, ii) general lack of interest of the REIT by investors, iii) high minimum investments amounts set at Kshs 5.0 mn for D-REITs, and, iv) lengthy approval processes to get all the necessary requirements thus discouraging those interested in investing in it.
We expect the real estate sector performance to be on an upward trajectory mainly supported by; i) government’s focus to implement affordable housing projects coupled with improved investor confidence in the country’s housing market, ii) increased demand for office spaces, iii) rapid expansion by local and international retailers, iv) increased visitor arrivals into the country hence boosting the performance of hospitality sector, v) government’s aggressiveness towards infrastructure roads development thus boosting investments through accessibility, and, vi) positive demographics. However factors such as financial constraints, oversupply in the commercial office and retail sectors, and low of investor appetite in Real Estate Investments Trusts (REITs) are expected to continue impeding performance of the sector.
The graph below is a summary of real estate performance in terms of rental yields in 2021;
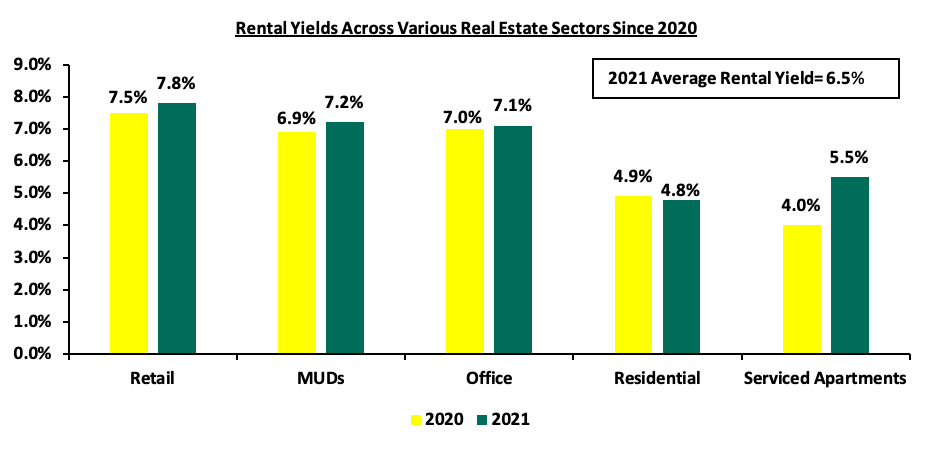
Disclaimer: The views expressed in this publication are those of the writers where particulars are not warranted. This publication, which is in compliance with Section 2 of the Capital Markets Authority Act Cap 485A, is meant for general information only and is not a warranty, representation, advice or solicitation of any nature. Readers are advised in all circumstances to seek the advice of a registered investment advisor.

- Talk to us
- Kenya
- P.O Box 20695 - 00200, Nairobi, Kenya
- Cell +254709101200
- Tel +254709101200
- WhatsApp +254741676635
- United States
- +254709101200
- DOWNLOAD OUR APP
-


- Kenya
- 8th Floor, Pinetree Plaza, Kaburu Drive, Ngong Road, Nairobi, Kenya
- USA
- Suite 1150, 1775 Eye Street NW, USA, Washington DC 20006, USA
- Investments
- High Yield
- Private Equity
- Real Estate
- Real Estate
- RiverRun Estates
- Cytonn Towers
- The Ridge
- Taraji Heights
- The Alma