Cytonn Q1’2022 Markets Review
By Research Team, Apr 4, 2022
Executive Summary
Global Markets Review
The world economy is projected to register a slower growth in 2022 than earlier envisaged, with the International Monetary Fund (IMF) projecting a 4.4% growth in 2022 down from the initial projection of a 4.9% growth. The downward revision was mainly attributable to continued presence and effects of the Omicron COVID-19 variant coupled with supply chain disruptions that continued to hinder global manufacturing growth. Advanced Economies are projected to expand by 3.9%, while Developing and Emerging Markets are projected to expand by 4.8% in 2022;
Sub-Saharan Africa Regional Review
According to the International Monetary Fund (IMF), Sub Saharan Africa is projected to register a 3.7% GDP growth in 2022, slower than the 4.0% growth recorded in 2021. The slowed economic growth is partly attributable to the emergence on new strains of COVID-19 such as the Omicron variant that necessitated imposition of measures to curb its spread coupled with increasing inflationary pressures due to broadening of price pressures of key imports such as oil.
The select currencies recorded mixed performance against the US Dollar with the South African Rand being the largest gainer YTD, gaining by 8.0% against the dollar, while the Ghanaian Cedi was the largest decliner, depreciating by 21.7% YTD. Yields on African Eurobonds increased in Q1’2022 partly attributable to investors attaching a higher risk premium on the Sub-Saharan region and other emerging markets to compensate for the increasing inflationary pressures and currency depreciation risks;
Kenya Macroeconomic Review
The Kenyan Economy is projected to grow at an average rate of 4.9% in 2022, from an estimate of 5.6% in 2021, mainly on the back of the global recovery and the easing of COVID-19 containment measures following an increase in vaccination rates and reduced infections. However, in Q1’2022, there was a general slowdown in the business environment in the private sector as evidenced by the average Purchasing Managers’ Index (PMI) for the first two months of Q1’2022 which came in at 50.3, lower than the 52.1 recorded during a similar period in 2021. Despite this deterioration, the total revenue collected for the two months amounted to Kshs 266.5 bn, 22.3% of the total revenue collected for FY’2021/2022, pointing towards continued economic recovery following the ease of COVID-19 containment measures and the effectiveness of the KRA in revenue collection;
Fixed Income
During the first quarter of 2022, T-bills were slightly oversubscribed, with the overall subscription rate coming in at 101.5%, up from 69.1% in Q4’2021. The oversubscription was partly attributable to the eased liquidity in the money market during the quarter, which saw the average interbank rate decline to 4.7%, from 5.1% in Q4’2021. Overall subscriptions for the 91-day paper declined to 89.0% from 103.9% in Q4’2021 while that of the 182-day and 364-day papers increased to 80.9% and 127.1% in Q1’2022, from 59.0% and 65.3% in Q4’2021, respectively. The yields on government securities in the secondary market were on an upward trajectory during the quarter, which saw the FTSE bond index decline by 1.1% to close at Kshs 95.0, from Kshs 96.1 recorded in Q4’2021;
During the week, T-bills remained undersubscribed, with the overall subscription rate coming in at 29.7%, down from the 55.8% recorded last week, partly attributable to the tightened liquidity in the market, with the average interbank rate coming in at 4.6%, from 4.3% recorded the previous week. The 91-day paper recorded the highest subscription rate, receiving bids worth Kshs 1.5 bn against the offered Kshs 4.0 bn, translating to a subscription rate of 38.1%, a decline from the 58.0% recorded the previous week. The subscription rate for the 182-day and 364-day papers declined to 31.3% and 24.7%, respectively, from 38.4% and 72.2%, recorded the previous week. The government accepted bids worth Kshs 7.10 bn, out of the Kshs 7.13 bn worth of bids received, translating to an acceptance rate of 99.7%, reflecting the government’s debt appetite;
Equities
During Q1’2022, the equities market was on a downward trajectory, with NASI, NSE 20 and NSE 25 declining by 6.4%, 2.9% and 4.8%, respectively. The equities market performance during the quarter was driven by losses recorded by large caps such as Safaricom, EABL, Bamburi and Equity Group of 10.0%, 9.1%, 5.9% and 4.3%, respectively. The losses were however mitigated by gains recorded by stocks such as BAT, Standard Chartered Bank (SCBK), ABSA Bank Kenya and NCBA Group of 12.4%, 12.1%, 5.1% and 2.6%, respectively. During the first quarter of 2022, listed banks in Kenya released their FY’2021 results, recording an increase in their earnings growth, with their average core Earnings per share (EPS) recording a weighted average growth of 83.2%, compared to a weighted average decline of 26.8% in FY’2020. The performance is however largely skewed by the strong EPS growth from ABSA, NCBA Group and Equity Group of 161.2%, 123.7% and 99.4%, respectively;
Real Estate
The real estate sector performance generally improved in Q1’2022 attributed to the improved operating environment supporting increased real estate property transactions. In the Nairobi Metropolitan Area (NMA), the residential sector recorded improved performance with a 0.6% points y/y increase in average total returns to 5.7% from the 5.1% recorded in Q1’2021. The commercial office sector recorded average rental yields of 7.3% in Q1’2022, representing a 1.5% points y/y increase from 6.8% recorded in Q1’2021 while the retail market recorded average rental yields of 7.5%, similar to FY’2020. The land sector recorded an average annualized capital appreciation of 2.4% in Q1’2022, with land prices in the satellite towns realizing the highest capital appreciation at 4.1% y/y. Additionally, during the quarter, ILAM Fahari I-REIT released their FY’2021 reporting a decline in Earnings per share by 183.7% to Kshs (0.7) in FY’2021, from Kshs 0.8 in FY’2020. Acorn Holdings also released their FY’2021 I-REIT and D-REIT results reporting Earnings per Unit for the two at Kshs 3.6 and Kshs 2.3, respectively.
Investment Updates:
- Weekly Rates:
- Cytonn Money Market Fund closed the week at a yield of 10.40%. To invest, dial *809#;
- Cytonn High Yield Fund closed the week at a yield of 13.90% p.a. To invest, email us at sales@cytonn.com and to withdraw the interest, dial *809#;
- Justin Mwangi, a Senior Investment Analyst, was on a panel on Twitter Spaces to discuss the Fundraising Options in Kenya for Entrepreneurs. Listen to Justin here,
- We continue to offer Wealth Management Training every Thursday and every third Saturday of the month, from 9:00 am to 11:00 am, through our Cytonn Foundation. The training aims to grow financial literacy among the general public. To register for any of our Wealth Management Trainings, click here;
- If interested in our Private Wealth Management Training for your employees or investment group, please get in touch with us through wmt@cytonn.com;
- Any CHYS and CPN investors still looking to convert are welcome to consider one of the five projects currently available for assignment, click here for the latest conversion term sheet;
- Cytonn Insurance Agency acts as an intermediary for those looking to secure their assets and loved ones’ future through insurance namely; Motor, Medical, Life, Property, WIBA, Credit and Fire and Burglary insurance covers. For assistance, get in touch with us through insuranceagency@cytonn.com;
- Cytonnaire Savings and Credit Co-operative Society Limited (SACCO) provides a savings and investments avenue to help you in your financial planning journey. To enjoy competitive investment returns, kindly get in touch with us through clientservices@cytonn.com;
Global Economic Growth:
The world economy is projected to register a slower growth in 2022 than earlier envisaged, with the International Monetary Fund (IMF) projecting a 4.4% growth in 2022 down from the initial projection of a 4.9% growth. The downward revision is mainly attributable to:
- Inflationary pressures around the globe and more so in developed economies that has resulted in hiking of interest rates to tame inflation and rolling back of stimulus packages,
- Supply chain constraints that were in existence due to the COVID-19 pandemic have been worsened by the Russia-Ukraine conflict. As a result, prices of key manufacturing inputs for majority of the economies such as energy have increased, exerting higher inflationary pressures and currency depreciation as demand for dollars goes up,
- COVID-19 remains a constraining factor for global economic growth due to emergence of new strains, and resurgence in infections in some economies such as China which have necessitated imposition of lockdowns, and,
- High debt levels in developing economies, with governments having borrowed heavily to revive economies in 2020, and the increase in the poverty levels in some regions such as the Sub-Saharan Africa is also expected to dampen the economic outlook.
Economic growth will however be supported by the increased access to vaccines and high vaccination rates that have curbed the increase in COVID-19 infection rates. Cumulatively, 58.5% of the world’s population has been fully vaccinated, against the World Health Organisation’s global target of 70.0% by H1’2022.
Global Commodities Market Performance:
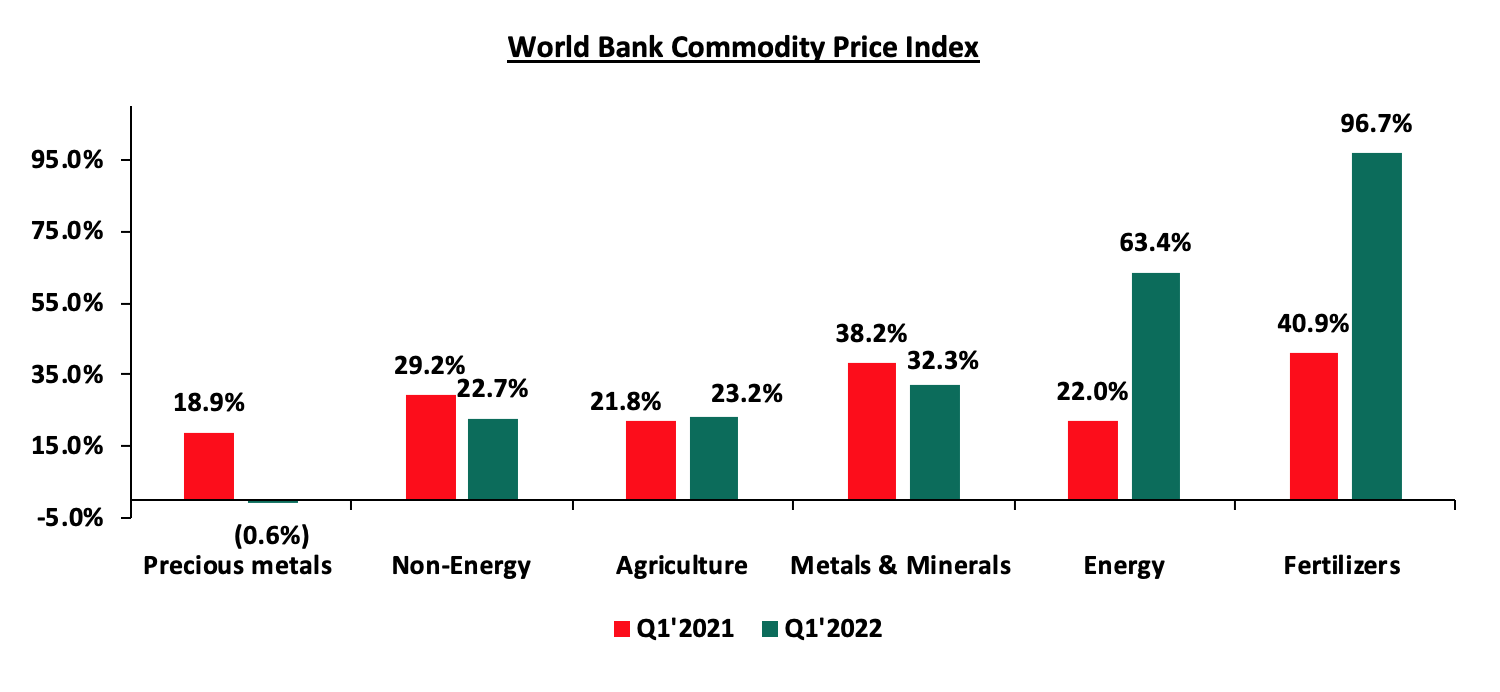
Global commodity prices registered mixed performance in Q1’2022, with prices of precious metals declining by 0.6% largely driven by reduced demand for safe haven assets in Q1’2022, as compared to a similar period last year. Fertilizer prices recorded the highest increase, gaining by 96.7% in Q1’2022, mainly attributable to mismatch between demand and supply arising from supply chain constraints, as a result of the Russian government’s decision to halt fertilizer exports in a retaliatory move following sanctions for their role in the Russia - Ukraine conflict. Key to note, Russia is the single largest producer of fertilizers. Below is a summary performance of various commodities:
Source: World Bank
Global Stock Market Performance:
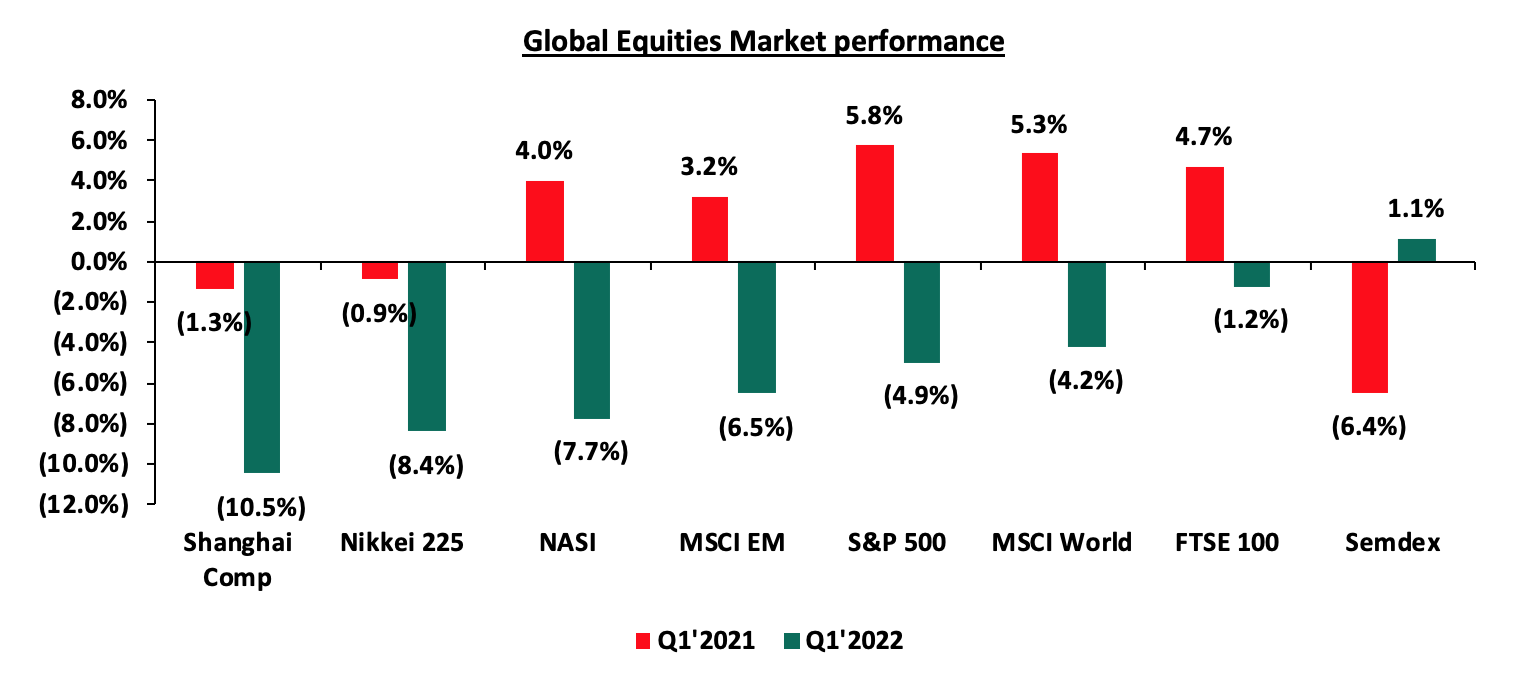
Global stock markets recorded mixed performance in Q1’2022, with most of the markets recording declines, attributable to capital outflow from the equities markets as investors sought less risky markets such as government papers. The Mauritius SEMDEX index was the only gainer, recording a 1.1% year to date gain as at 31st March 2022, while the Shanghai Composite index was the worst-performing index with losses of 10.5% YTD. Below is a summary of the performance of key indices:
Economic Growth:
According to the International Monetary Fund (IMF), Sub Saharan Africa is projected to register a 3.7% GDP growth in 2022, slower than the 4.0% growth estimate recorded in 2021. The slowed economic growth is partly attributable to the emergence on new strains of COVID-19 such as the Omicron variant that necessitated imposition of measures to curb its spread coupled with increasing inflationary pressures due to broadening of price pressures of key imports such as oil. Economic growth has further been weighed down by slow COVID-19 vaccine roll out, with the region having fully vaccinated only 12.0% of its population, as compared to a global average of 58.5%. Additionally, the region is facing debt sustainability concerns, with most of the countries having huge debt levels, with the IMF highlighting in their Regional economic outlook that five African countries were in debt distress, a further thirteen in high risk of debt distress, and 17 in moderate risk of debt distress. This is partly attributable to significant shortfalls in revenue collection and depreciating local currencies which in turn undermined their ability to service maturing debt obligations. However, the region’s growth will be supported by increase in prices for commodity exports such as oil which are expected to support growth in Nigeria and Angola while high coffee and cotton prices will support near-term recovery in Kenya, Tanzania and Ethiopia.
Currency Performance:
The vast majority of the select currencies depreciated against the US Dollar in Q1’2022 continuing the trend witnessed in FY’2021, with only the South African Rand and the Botswana Pula gaining by 8.0% and 2.4%, respectively. The Ghanaian Cedi was the worst performer in Q1’2022 as it depreciated by 24.1% against the dollar. The performance is partly attributable to increasing concerns over public debt sustainability with public debt to GDP ratio reaching 80.1% in December 2021, coupled with affirmation of a negative outlook by Fitch ratings in January 2022. This has seen Ghana’s attractiveness to foreign investors decline and subsequent decline in foreign exchange inflows. On the other hand, the South African Rand appreciation is partly attributable to rallying of commodity prices of the country’s minerals such as gold, platinum, silver and coal. The increase in commodity prices, coupled with an expected hike in interest rates have increased trade and investment activities have increased in the country. The Kenya Shilling depreciated by 1.6% in Q1’2022 to close at Kshs 115.0 against the US Dollar, compared to Kshs 113.1 recorded at the end of 2021.Below is a table showing the performance of select African currencies:
|
Select Sub Saharan Africa Currency Performance vs USD |
|||||
|
Currency |
Mar-21 |
Dec-20 |
Mar-22 |
Last 12 Months change (%) |
Q1’2022 change (%) |
|
South African Rand |
14.8 |
15.9 |
14.6 |
1.2% |
8.0% |
|
Botswanan Pula |
11.0 |
11.7 |
11.4 |
(3.6%) |
2.4% |
|
Malawian Kwacha |
776.3 |
817.3 |
818.9 |
(5.2%) |
(0.2%) |
|
Tanzania Shilling |
2,314.0 |
2,297.8 |
2,318.5 |
(0.2%) |
(0.9%) |
|
Nigerian Naira |
380.6 |
410.9 |
415.7 |
(8.4%) |
(1.2%) |
|
Ugandan Shilling |
3,660.0 |
3,544.3 |
3,595.1 |
1.8% |
(1.4%) |
|
Kenyan Shilling |
109.5 |
113.1 |
115.0 |
(4.7%) |
(1.6%) |
|
Mauritius Rupee |
40.7 |
43.3 |
45.4 |
(10.3%) |
(4.7%) |
|
Zambian Kwacha |
22.1 |
16.7 |
18.2 |
21.8% |
(8.7%) |
|
Ghanaian Cedi |
5.8 |
6.0 |
7.3 |
(20.6%) |
(21.7%) |
African Eurobonds:
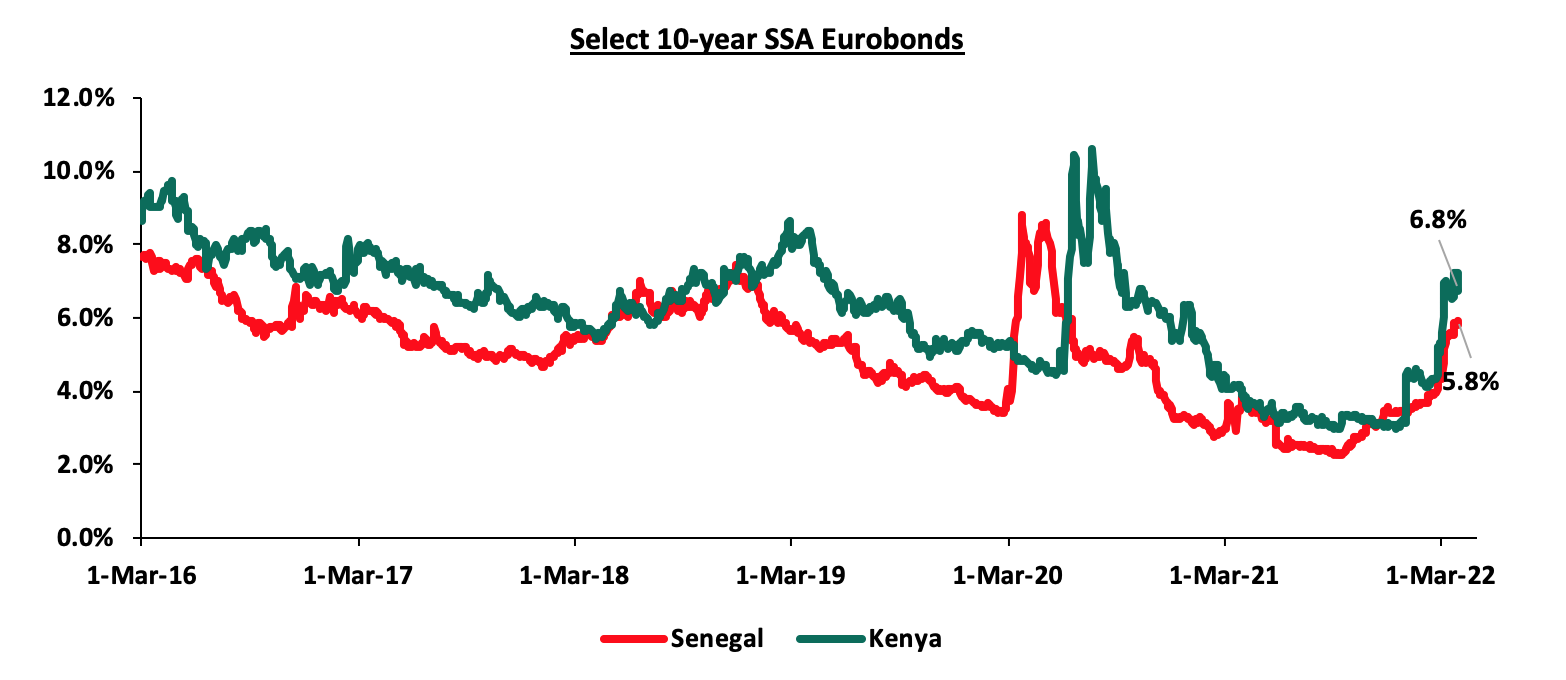
Yields on African Eurobonds generally increased in Q1’2022 partly attributable to investors attaching higher risk premium on the Sub-Saharan region and other emerging markets due to perceived higher risks arising from increasing inflationary pressures and local currency depreciation. The increase in Eurobond yields come on the back of inflationary pressures and local currency depreciation that has worsened the existing supply chain constraints. Yields on both the Kenyan and Senegal Eurobonds increased in Q1’2022 by 2.4% to 6.8% and 5.8%, from 4.4% and 2.4%, respectively, recorded in December 2021.
Below is a graph showing the Eurobond secondary market performance of select 10-year Eurobonds issued by their respective countries;
Equities Market Performance:
Sub-Saharan Africa (SSA) stock markets recorded mixed performance in Q1’2022, with South Africa’s JALSH being the best performing market gaining by 11.2% attributable to the increased foreign investor sentiments following rallying of commodity prices coupled with the appreciating local currency. Ghana’s GGSECI was the worst-performing market with a loss of 19.1%, partly attributable to the re-imposition of capital gains tax on securities listed on the Ghanaian Stock Exchange, which has seen investors prefer fixed income securities with relatively higher yields. The GGSECI has also seen capital flight from foreign investors due to uncertainties caused by inflationary and currency depreciation pressures.
Below is a summary of the performance of key exchanges:
|
Equities Markets Performance (Dollarized*) |
||||||
|
Country |
Index |
Mar-21 |
Dec-21 |
Mar-22 |
Last 12 Months change (%) |
YTD change (%) |
|
South Africa |
JALSH |
4,502.4 |
4,638.8 |
5,160.0 |
14.6% |
11.2% |
|
Nigeria |
NGSEASI |
102.6 |
103.9 |
113.0 |
10.1% |
8.7% |
|
Zambia |
LASILZ |
182.3 |
363.4 |
377.2 |
106.9% |
3.8% |
|
Rwanda |
RSEASI |
0.2 |
0.1 |
0.1 |
(28.7%) |
(0.9%) |
|
Tanzania |
DARSDEI |
1.5 |
1.6 |
1.5 |
2.5% |
(3.9%) |
|
Uganda |
USEASI |
0.4 |
0.4 |
0.4 |
(8.5%) |
(8.5%) |
|
Kenya |
NASI |
1.5 |
1.5 |
1.4 |
(9.7%) |
(9.7%) |
|
Ghana |
GGSECI |
384.9 |
464.4 |
375.6 |
(2.4%) |
(19.1%) |
|
*The index values are dollarized for ease of comparison |
||||||
GDP growth in Sub-Saharan Africa region is expected to slow in 2022 in line with the rest of the global economy. The region still faces key challenges among them emergence of new COVID-19 variants coupled with inflationary pressures worsened by global geopolitical tensions. Additionally, the region continues to suffer from high debt levels that will make them less attractive to foreign capital and high costs of debt service following expiry of Debt Service Suspension Initiative and weakening of local currencies.
The Kenyan Economy is projected to grow at an average rate of 4.9% in 2022, from an estimate of 5.6% in 2021, mainly on the back of the global recovery and the easing of COVID-19 containment measures following an increase in vaccination rates and reduced infections. The move is expected to support growth in sectors like tourism, hospitality, manufacturing and trade, which are yet to fully recover from the pandemic. The table below shows the GDP projections according to various organizations;
|
GDP Growth Rate |
|||
|
No. |
Organization |
2021 Estimates |
2022 Projections |
|
1. |
International Monetary Fund |
5.6% |
6.0% |
|
2. |
Cytonn Investments Management PLC |
5.7% |
4.5% |
|
3. |
S&P Global |
6.0% |
4.5% |
|
4. |
World Bank |
5.0% |
4.7% |
|
Average |
5.6% |
4.9% |
|
|
Forecasted in Q4’2021 |
|||
Source: Cytonn Research
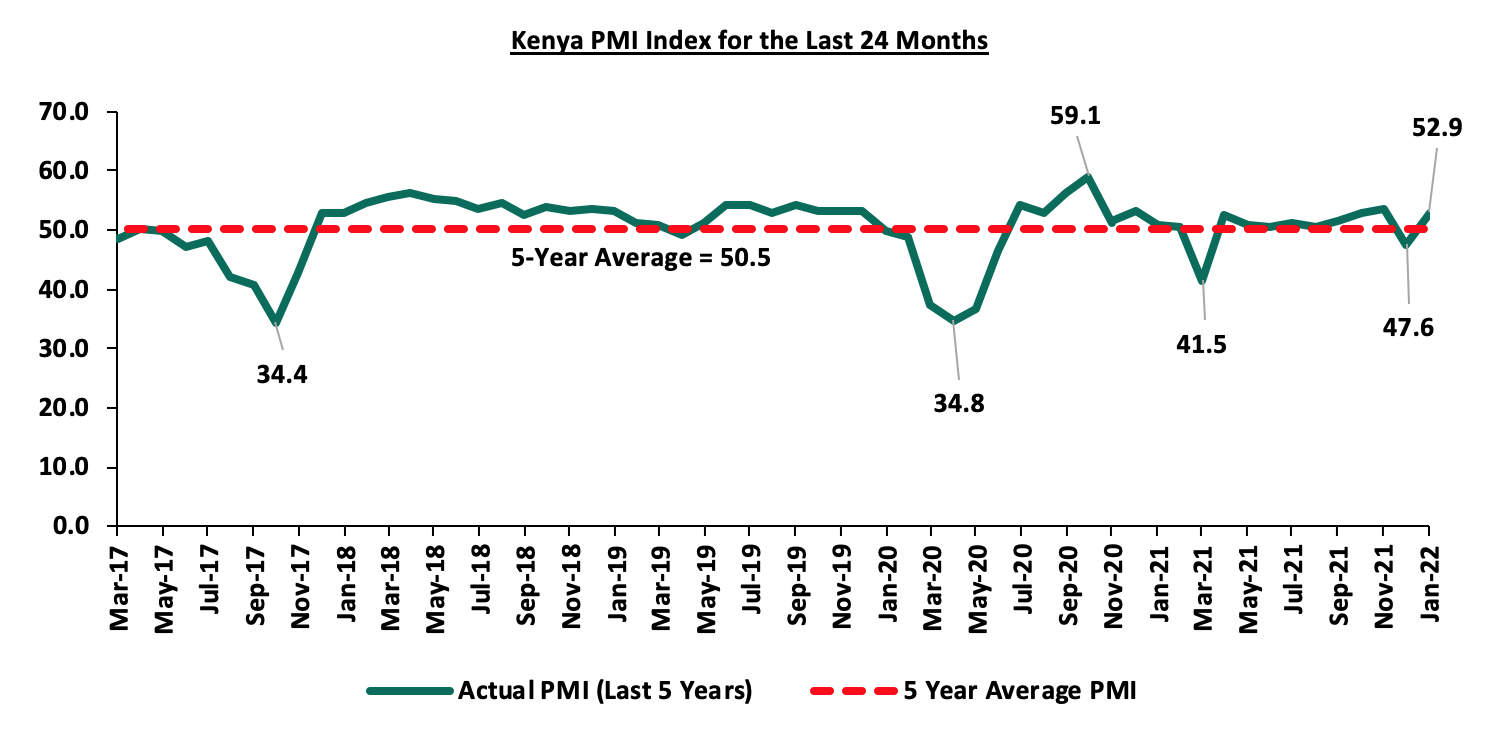
The average PMI for the first two months of Q1’2022 came in at 50.3, lower than the 52.1 recorded during a similar period in 2021 pointing towards a slowdown in the business environment in the private sector. The performance was weighed down by January’s Purchasing Managers’ Index (PMI) which came in at 47.6, marking an 8-month low largely due to lower domestic spending and travel following an uptick in price pressures and persistent COVID-19 cases from the Omicron Variant at the beginning of the year. Below is the PMI chart for the last five years:
Despite this deterioration, the total revenue collected for the two months amounted to Kshs 266.5 bn, 22.3% of the total revenue collected for FY’2021/2022 pointing towards continued economic recovery following the ease of COVID-19 containment measures and the effectiveness of the KRA in revenue collection. Additionally, Fitch Ratings affirmed Kenya’s Long-Term Foreign- Currency Issuer Default Rating (IDR) at ‘B+’ with a Negative Outlook, unchanged from the previous review in March 2021. The B+ rating was on the back of the strong economic growth, with Kenya’s economy having recorded a 9.9% growth in Q3’2021, up from a 2.1% contraction recorded in a similar period in 2020, coupled with the continued macroeconomic stability.
However, risks lie on the downside on the back of;
- Rising fuel prices driven by persistent supply chain constraints coupled with the geopolitical pressures occasioned by the Russian invasion which is expected to put pressure on the inflation basket,
- Resurgence of new and more transmissible variants of the COVID-19 virus in the country’s trading partners is expected to weigh on investment performance, funding and aggravate the country’s debt vulnerabilities,
- The uncertainties surrounding the upcoming 2022 August elections, which are likely to have a negative effect on the business environment,
- Erratic weather conditions which are already causing severe hardship and subdued growth in the agricultural sector. Should the drought intensify, this would weigh on the near-term economic outlook, and,
- External risk such as weaker global growth with the IMF revising down the projected global growth for 2022 to 4.4%, 0.5% points lower than the earlier projection of a 4.9% growth rate, higher than anticipated energy prices and tighter external financing conditions.
Inflation:
The average inflation rate declined to 5.3% in Q1’2022 compared to 5.8% in a similar period in 2021 mainly attributable to the unchanged fuel prices, during the period of review following a fuel subsidy programme under the Petroleum Development Fund. Below is the inflation chart for the last five years:
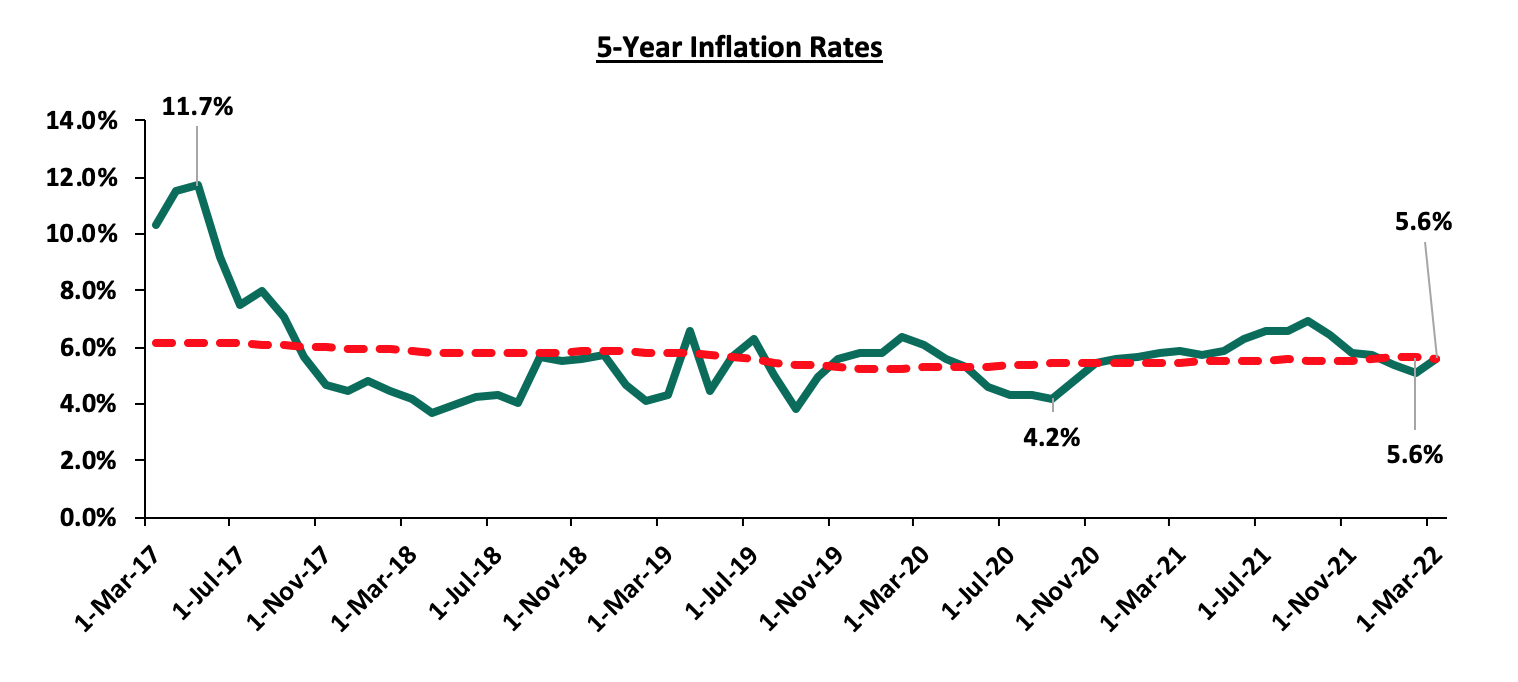
March Inflation
The y/y inflation for the month of March increased to 5.6%, from the 5.1% recorded in February 2022, in line with our expectations. The increase was mainly attributable to the increase in the y/y Food and non-alcoholic beverages, Housing, water, electricity, gas and other fuels as well as transport cost, which increased by 9.9%, 4.9% and 3.7%, respectively. Food and non-alcoholic beverages index has had the greatest increase both year on year and month on month mainly due the supply constraints of production materials and the erratic weather conditions.
The table below shows a summary of both the year on year and month on month commodity groups’ performance;
|
Major Inflation Changes – March 2022 |
|||
|
Broad Commodity Group |
Price change m/m (March-22/February-22) |
Price change y/y (March-22/March-21) |
Reason |
|
Food & Non-Alcoholic Beverages |
1.5% |
9.9% |
The m/m increase was mainly contributed by increase in prices of cooking oil, wheat flour and tomatoes among other food items. The increase was however mitigated by a decline in prices of green grams, carrots and oranges |
|
Housing, Water, Electricity, Gas and other Fuel |
0.7% |
4.9% |
The m/m increase was as a result of increase in the price cooking gas by 7.8% m/m and 38.2% since March 2021
|
|
Transport Cost |
0.6% |
3.7% |
The m/m increase was as a result of the increase in prices of super petrol and diesel in the month of March following the rise in global oil prices. This was the first rise in fuel prices since September 2021 |
|
Overall Inflation |
0.9% |
5.6% |
The m/m increase was due to a 1.5% increase in the food and non-alcoholic beverages index as compared to the 0.8% increase in the month of February |
Source: KNBS
Going forward, we expect the inflation pressures to remain elevated but within the government’s set range of 2.5% - 7.5%. However, concerns remain high on the rising food and fuel prices which are expected to put pressure on inflation, given that these are a major contributor to the inflation basket. Additionally, we believe that the fuel subsidy program by the National Treasury stands at risk of being depleted and is unsustainable, as evidenced by the increased compensation amounts which further increase the possibility of depletion. As such, fuel prices are likely to keep rising should the landed cost continue increasing and thus exert upward pressure on the inflation basket.
The Kenya Shilling:
The Kenya Shilling depreciated against the US Dollar by 1.6% in Q1’2022, to close at Kshs 115.0, from Kshs 113.1 in December 2021, marking an all-time low. The depreciation is partly attributable to increased dollar demand from the oil and energy sectors. During the week, the Kenya Shilling depreciated marginally against the US Dollar by 0.2% to close at Kshs 115.0, from Kshs 114.7 the previous week. We expect the shilling to remain under pressure as a result of:
- Rising global crude oil prices on the back of supply constraints and geopolitical pressures at a time when demand is picking up with the easing of COVID-19 restrictions and as economies reopen. Key to note, risks abound the recovery following the emergence of the new COVID-19 variants,
- Increased demand from merchandise traders as they beef up their hard currency positions in anticipation for more trading partners reopening their economies globally,
- An ever present current account deficit due to an imbalance between imports and exports, with Kenya’s current account deficit estimated to come in at 5.6% of GDP in the 12 months to February 2022 compared to the 4.3% for a similar period in 2021. The wider deficit reflects a higher import bill, particularly for oil, which more than offset increased receipts from agricultural and services exports, and remittances, and,
- The aggressively growing government debt, with Kenya’s public debt having increased at a 10-year CAGR of 18.4% to Kshs 8.0 tn in December 2021, from Kshs 1.5 tn in December 2011 thus putting pressure on forex reserves to service some of the public debt.
The shilling is however expected to be supported by:
- High Forex reserves currently at USD 7.8 bn (equivalent to 4.7-months of import cover), which is above the statutory requirement of maintaining at least 4.0-months of import cover, and the EAC region’s convergence criteria of 4.5-months of import cover. In addition, the reserves were boosted by the USD 1.0 bn proceeds from the Eurobond issued in July 2021, USD 972.6 mn IMF disbursement, USD 130.0 mn World Bank loan financing received in June 2021 and the recently approved USD 750.0 mn World Bank loan facility, and,
- Improving diaspora remittances evidenced by a 23.5% y/y increase to USD 321.5 mn as of February 2022, from USD 260.3 mn recorded over the same period in 2021, which has continued to cushion the shilling against further depreciation.
Monetary Policy:
During the quarter, the Monetary Policy Committee (MPC) met twice and in both sittings, maintained the Central Bank Rate (CBR) at 7.0% for the thirteenth consecutive time after concluding that the accommodative stance implemented in March 2020 was having the intended effects on the economy.
However, during the 29th March 2022 sitting, the committee raised concerns on the elevated global risks on the back of heightened geopolitical tensions, volatile commodity prices as well as the COVID-19 pandemic and their potential impact on the domestic economy. Below are some of the key highlights from the meeting:
- Overall inflation declined to 5.1% in February 2022 compared to 5.4% in January, 2022 mainly attributable to lower food and fuel prices which declined by 8.7% and 6.5%, respectively. Inflation is expected to remain within the Government’s target range of 2.5%-7.5% but pressure abounds in the short term following the rise in fuel and food prices,
- Private sector credit growth has been recovering, having grown by 9.1% in the twelve months to February 2022, an increase from the 8.6% recorded in December 2021. The key sectors supporting this growth include Transport and Communication (24.1%), Consumer durables (14.0%) and Manufacturing (7.6%), and,
- The current account deficit to GDP is estimated at 5.6% in the 12-months to February 2022, a 1.3% points increase, from 4.3% recorded over a similar period in 2021. Exports of goods remained strong, growing by 12.1% in the twelve months to February 2022, compared to a similar period in 2021. Receipts from exports of horticulture and manufactured goods increased by 7.9% and 31.3%, respectively, in the twelve months to February 2022 compared to a similar period in 2021. However, receipts from tea exports declined by 0.3 %, partly attributable to the impact of accelerated purchases in 2020.
The MPC concluded that the current accommodative monetary policy stance remains appropriate and therefore decided to retain the Central Bank Rate (CBR) at 7.00%, in line with our expectations. The Committee will meet again in May 2021, but remains ready to re-convene earlier if necessary.
Q1’2022 Highlights;
- The Kenya National Bureau of Statistics (KNBS) released the Quarterly Gross Domestic Product Report, highlighting that the Kenyan economy recorded a 9.9% growth in Q3’2021, up from the 2.1% contraction recorded in a similar period in 2020 pointing towards continued economic recovery. For more information, see our Cytonn Weekly #1/2022,
- The Kenya National Bureau of Statistics released the Quarterly Balance of Payments report for Q3’2021 report highlighting that Kenya’s balance of payments improved in Q3’2021, coming in at a deficit of Kshs 34.4 bn, from a deficit of Kshs 103.9 bn in Q3’2020. The decline was mainly attributable to an 11.9% increase in the stock of gross official reserve to Kshs 1,064.2 bn from Kshs 951.0 bn in Q3’2020. For more information, see our Cytonn Weekly #1/2022,
- The World Bank released the Global Economic Prospects and the Sub–Saharan Africa outlook highlighting that the Kenyan economy is expected to grow by 5.0% in 2021 and 4.7% in 2022, supported by improving exports and the positive vaccine rollout. However, the erratic weather conditions in the country is expected to weigh down the economic growth as Agriculture is the largest contributor to Kenya’s GDP growth at 20.5% in Q3’2021. For more information, see our Cytonn Weekly #2/2022,
- The National Treasury presented the Supplementary Budget for the fiscal year 2021/22 to the National Assembly. The treasury is seeking to increase the gross total budget by 3.3% to Kshs 3,377.8 bn, from the previous estimates of Kshs 3,269.2 bn. The increase in the supplementary budget is mainly on account of a 12.3% increase in funds allocated towards the Ministry of Health to Kshs 136.0 bn from the original estimates of Kshs 121.1 bn as the government amps up its fight against COVID-19, coupled with a 3.7% increase in the infrastructure budget to Kshs 202.5 bn from the earlier approved Kshs 195.2 bn. For more information, see our Cytonn Monthly - January
- Stanbic Bank released its monthly Purchasing Manager’s Index (PMI) highlighting that the index for the month of February 2022 increased to 52.9 following a nine months low of 47.6 recorded in January 2022. The index points towards strengthened business environment in the country on the back of continued economic recovery as COVID-19 cases continue to decline. For more information, see our Cytonn Monthly – February,
- The Energy and Petroleum Regulatory Authority (EPRA) released their monthly statement on the maximum fuel prices in Kenya effective 15th March 2022 to 14th April 2022 highlighting that super petrol and diesel prices increased by 3.9% and 4.5% to Kshs 134.7 per litre and Kshs 115.6 per litre, respectively, from Kshs 129.7 per litre and Kshs 110.6 per litre recorded last month. The price of Kerosene remained unchanged at Kshs 103.5 per litre, same as recorded in the previous month. For more information, see our Cytonn Weekly #11/2022,
- The World Bank approved a USD 750 mn (Kshs 80.9 bn) loan facility aimed at accelerating Kenya’s ongoing inclusive and resilient recovery from the COVID-19 pandemic, and, strengthening fiscal sustainability reforms that contribute to greater transparency and the fight against corruption. For more information, see our Cytonn Weekly #11/2022,
- The National Treasury gazetted the revenue and net expenditures for the first eight months of FY’2021/2022, ending 28th February 2022 highlighting that Total revenue collected as at the end of February 2022 amounted to Kshs 1,192.8 bn, equivalent to 67.2% of the original estimates of Kshs 1,775.6 bn and is 100.8% of the prorated estimates of Kshs 1,183.8 bn. Notably, the performance is a decline from the 103.8% outperformance recorded in the first seven months to January 2021, mainly attributable to a 26.9% decline in the monthly revenue collection to Kshs 117.6 bn in February 2022, as compared to a monthly average of Kshs 160.9 bn in the first seven months to January 2021. Cumulatively, tax revenues amounted to Kshs 1,126.4 bn, equivalent to 66.0% of the original estimates of Kshs 1,707.4 bn and 99.0% of the prorated estimates of Kshs 1,138.3 bn. For more information, see our Cytonn Weekly #11/2022, and,
- Fitch Ratings affirmed Kenya’s Long-Term Foreign- Currency Issuer Default Rating (IDR) at ‘B+’ with a Negative Outlook, unchanged from the previous review in March 2021. The B+ rating was on the back of the strong economic growth, with Kenya’s economy having recorded a 9.9% growth in Q3’2021, up from a 2.1% contraction recorded in a similar period in 2020, coupled with the continued macroeconomic stability. Fitch Ratings estimates Kenya’s real GDP growth to come in at 6.5% in 2021 and to slow down to 6.0% in 2022, due to downsides posed by the upcoming August general elections. Below is a summary of the credit ratings on Kenya released in the last two years:
|
Rating Agency |
Previous Rating |
Current Rating |
Current Outlook |
Date Released |
|
Fitch Ratings |
B+ |
B+ |
Negative |
22nd March 2022 |
|
S&P Global |
B+ |
B |
Stable |
5th March 2021 |
|
Moody’s |
B1 |
B2 |
Negative |
19th June 2020 |
For more information, see our Cytonn Weekly #12/2022.
Going forward, we expect Kenya’s economy to record a gradual recovery in 2022, growing at a rate of 4.9%, from the 5.6% estimated growth recorded in 2021. However, we foresee the emergence of new COVID-19 variants, rising global fuel prices, erratic weather conditions coupled with the high debt appetite to slow down the recovery.
Money Markets, T-Bills & T-Bonds Primary Auction:
During the first quarter of 2022, T-bills were slightly oversubscribed, with the overall subscription rate coming in at 101.5%, up from 69.1% in Q4’2021. The oversubscription was partly attributable to the improvement in liquidity in the money market during the quarter, which saw the average interbank rate decline to 4.7%, from 5.1% in Q4’2021. Overall subscriptions for the 91-day paper declined to 89.0% from 103.9% in Q4’2021 while that of the 182-day and 364-day papers increased to 80.9% and 127.1% in Q1’2022, from 59.0% and 65.3% in Q4’2021, respectively. Investors’ interest remained skewed towards the longer 364-day paper mainly due to its higher yield averaging 9.6% in comparison to the 8.1% and 7.3% average yield offered by the 182-day and 91-day papers, respectively. Yields on all the papers were on an upward trajectory with the average yields on the 364-day, 182-day and the 91-day papers increasing to 9.6%, 8.1% and 7.3%, from 8.7%, 7.7% and 7.1%, respectively recorded in Q4’2021. The acceptance rate for the quarter increased to 93.5% from 91.0% in Q4’2021, with the government accepting a total of Kshs 272.8 bn of the Kshs 292.2 bn worth of bids received during the quarter.
During the week, T-bills remained undersubscribed, with the overall subscription rate coming in at 29.7%, down from the 55.8% recorded last week, partly attributable to the tightened liquidity in the market, with the average interbank rate coming in at 4.6%, from 4.3% recorded the previous week. The 91-day paper recorded the highest subscription rate, receiving bids worth Kshs 1.5 bn against the offered Kshs 4.0 bn, translating to a subscription rate of 38.1%, a decline from the 58.0% recorded the previous week. The subscription rate for the 182-day and 364-day papers declined to 31.3% and 24.7%, respectively, from 38.4% and 72.2%, recorded the previous week. The yields on the government papers recorded mixed performance with yields on the 182-day and 91-day papers increasing by 3.0 bps and 1.9 bps, to 8.2% and 7.3%, respectively while the yield on the 364-day paper declined by 1.5 bps to 9.8%. The government accepted bids worth Kshs 7.10 bn, out of the Kshs 7.13 bn worth of bids received, translating to an acceptance rate of 99.7%, reflecting the government’s debt appetite.
Primary T-bond auctions in Q1’2022:
In Q1’2022, the government issued seven Treasury bonds and re-opened three of them on tap sale, seeking to raise Kshs 216.5 bn. The bonds were generally oversubscribed, receiving bids worth Kshs 264.9 bn against the offered Kshs 216.5 bn, translating to a subscription rate of 122.4%. The government was keen on maintaining low rates and thus accepted only Kshs 203.3 bn of the Kshs 264.9 bn worth of bids received, translating to an acceptance rate of 76.7%. The table below provides more details on the bonds issued during the quarter:
|
No. |
Issue Date |
Bond Auctioned |
Effective Tenor to Maturity (Years) |
Coupon |
Amount offered (Kshs bn) |
Actual Amount Raised (Kshs bn) |
Total bids received |
Average Accepted Yield |
Subscription Rate |
Acceptance Rate |
|
1 |
1/10/2022 |
FXD1/2020/005 |
3.4 |
11.7% |
30.0 |
27.4 |
28.4 |
13.0% |
94.6% |
96.6% |
|
2 |
1/24/2022 |
FXD2/2018/10 |
7.0 |
12.5% |
30.0 |
34.9 |
38.4 |
12.7% |
128.0% |
90.9% |
|
3 |
FXD1/2021/20 |
19.7 |
13.4% |
13.8% |
||||||
|
4 |
2/21/2022 |
IFB1/2022/019 |
19.0 |
13.0% |
75.0 |
98.6 |
132.3 |
13.0% |
176.3% |
74.6% |
|
5 |
3/14/2022 |
FXD1/2021/05 |
4.7 |
11.3% |
50.0 |
18.5 |
40.9 |
12.0% |
81.9% |
45.1% |
|
6 |
FXD1/2020/15 |
12.9 |
12.8% |
13.7% |
||||||
|
7 |
FXD1/2021/25 |
24.2 |
13.9% |
14.0% |
||||||
|
8 |
3/18/2022 |
FXD1/2021/05 (Tap-sale) |
4.7 |
11.3% |
31.5 |
23.9 |
24.9 |
12.0% |
79.0% |
95.9% |
|
9 |
FXD1/2020/15 (Tap-sale) |
12.9 |
12.8% |
13.7% |
||||||
|
10 |
FXD1/2021/25 (Tap-sale) |
24.2 |
13.9% |
14.0% |
||||||
|
Q1'2022 Total |
|
|
216.5 |
203.3 |
264.9 |
|
122.4% |
76.7% |
||
|
Q1'2022 Average |
|
12.6% |
43.3 |
40.7 |
53.0 |
13.2% |
112.0% |
80.6% |
||
|
Q4'2021 Average |
|
12.5% |
50.00 |
22.7 |
25.8 |
12.8% |
121.2% |
89.1% |
||
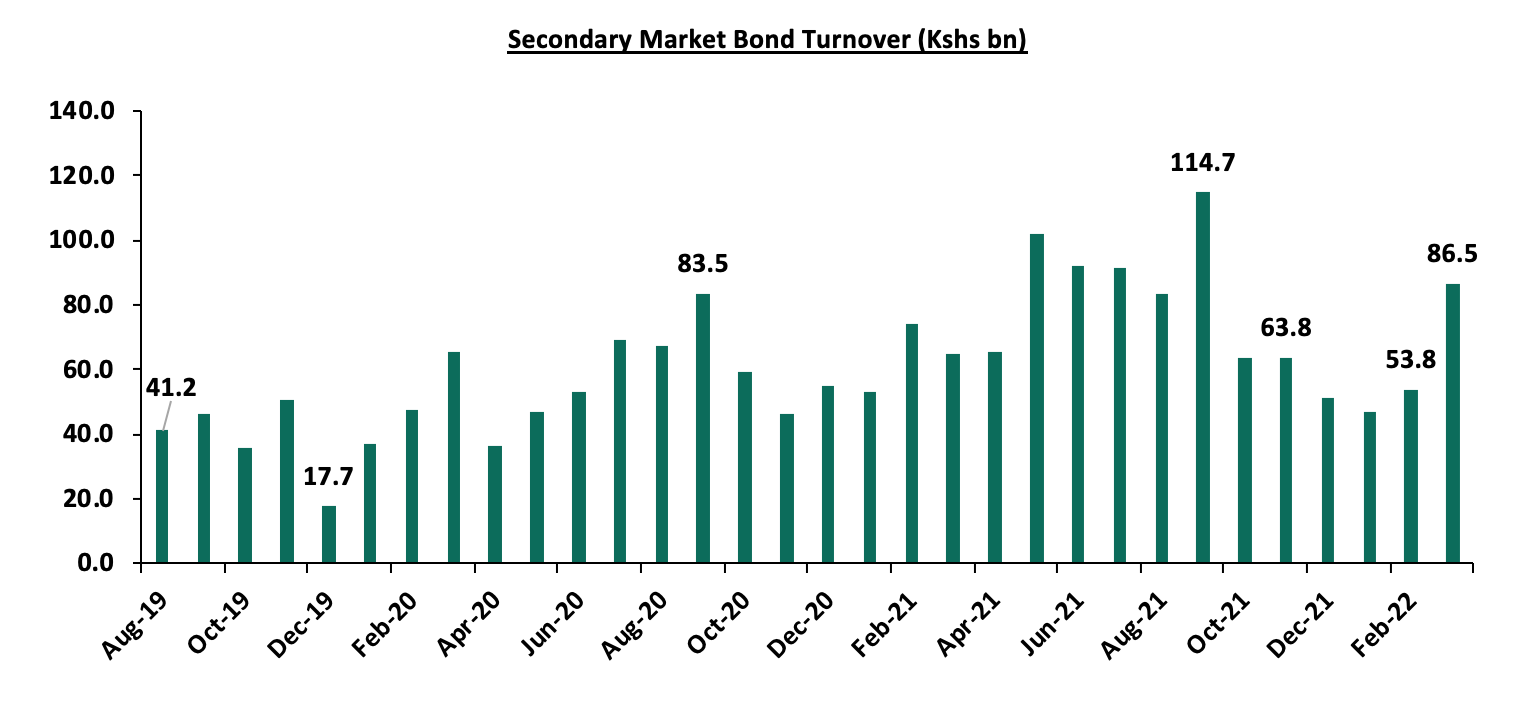
Secondary Bond Market Activity:
- Bond Turnover
In the secondary bond market there was increased activity, with the turnover increasing by 4.6% to Kshs 187.1 bn, from Kshs 178.9 bn in Q4’2021, partially attributable to the high liquidity and increased allocation to treasury bonds by local institutional investors as they sought for higher and relatively lower risk yields in the market.
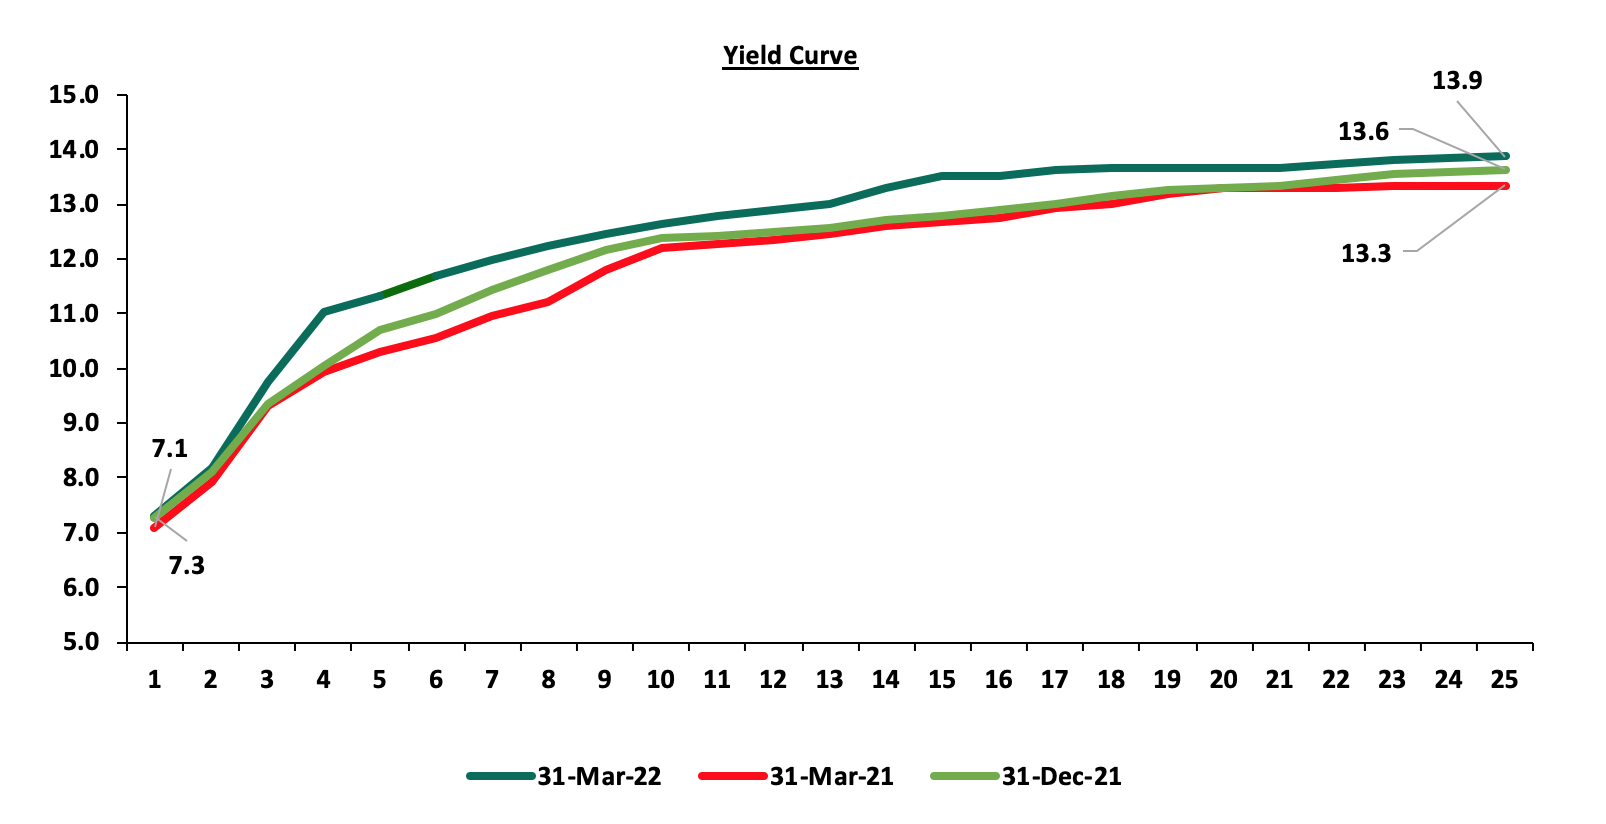
- Yield Curve
The yields on government securities in the secondary market were on an upward trajectory during the quarter, which saw the FTSE bond index decline by 1.1% to close at Kshs 95.0, from Kshs 96.1 recorded in Q4’2021. We expect the rise in the yield curve to be sustained in the coming quarter, mainly driven by increased borrowing appetite by the government as the fiscal year approaches the end coupled with investors’ hunt for higher yields. The chart below shows the yield curve movement in Q1’2022:
Money Market Performance
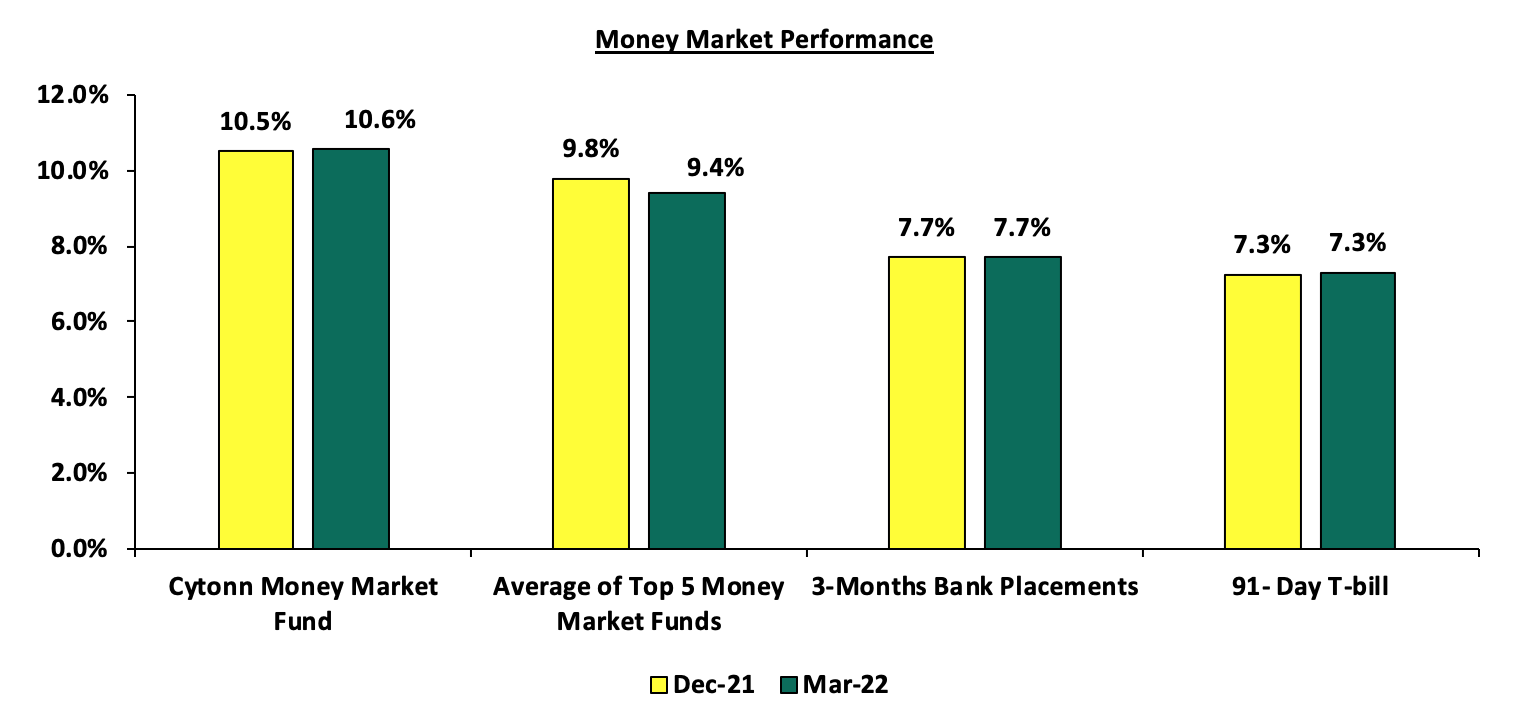
In the money markets, 3-month bank placements during the quarter, at 7.7% (based on what we have been offered by various banks), while the yield on the 91-day T-bill increased marginally by 1.9 bps to close the quarter at 7.3%. The average yield of the Top 5 Money Market Funds declined by 0.4% points to close at 9.4%, from 9.8%, recorded the previous week while the yield on the Cytonn Money Market Fund increased by 0.1% points to 10.6%, from 10.5% recorded in December 2021. The table below shows the Money Market Fund Yields for Kenyan Fund Managers as published on 1st April 2022:
|
Money Market Fund Yield for Fund Managers as published on 1st April 2022 |
||
|
Rank |
Fund Manager |
Effective Annual Rate |
|
1 |
Cytonn Money Market Fund |
10.5% |
|
2 |
Zimele Money Market Fund |
9.9% |
|
3 |
Sanlam Money Market Fund |
9.8% |
|
4 |
Nabo Africa Money Market Fund |
9.7% |
|
5 |
Madison Money Market Fund |
9.6% |
|
6 |
Apollo Money Market Fund |
9.3% |
|
7 |
Dry Associates Money Market Fund |
9.2% |
|
8 |
CIC Money Market Fund |
9.0% |
|
9 |
GenCap Hela Imara Money Market Fund |
8.7% |
|
10 |
Co-op Money Market Fund |
8.5% |
|
11 |
Orient Kasha Money Market Fund |
8.4% |
|
12 |
NCBA Money Market Fund |
8.4% |
|
13 |
ICEA Lion Money Market Fund |
8.4% |
|
14 |
British-American Money Market Fund |
8.0% |
|
15 |
Old Mutual Money Market Fund |
7.4% |
|
16 |
AA Kenya Shillings Fund |
6.3% |
Liquidity:
In Q1’2022, liquidity in the money market eased, as evidenced by the decline in the interbank rate to 4.7%, from 5.1% the previous quarter, partly attributable to government payments which offset tax remittances. Additionally, the average volumes traded in the interbank market increased by 19.6% to Kshs 12.6 bn, from Kshs 10.6 bn recorded in Q4’2021.
During the week, liquidity tightened with the average interbank rate increasing to 4.6%, from 4.3% recorded the previous week attributable to tax remittances which offset government payments as it met its end of month tax obligations. Additionally, there was a 22.4% increase in the average volumes traded in the interbank market to Kshs 13.3 bn, from Kshs 10.9 bn the previous week.
Kenya Eurobonds:
In Q1’2022, Eurobonds were on an upward trajectory attributable to reduced investor sentiment partly due to the rising geopolitical tension between Russia and Ukraine, with investors preferring safer havens and partly attributable to the affirmation of a negative outlook for Kenya’s economy by Fitch Ratings. Additionally, the United States Federal Reserve’s interest rate hike in March, saw capital outflows from emerging markets as investors shifted to the United States Bonds market.
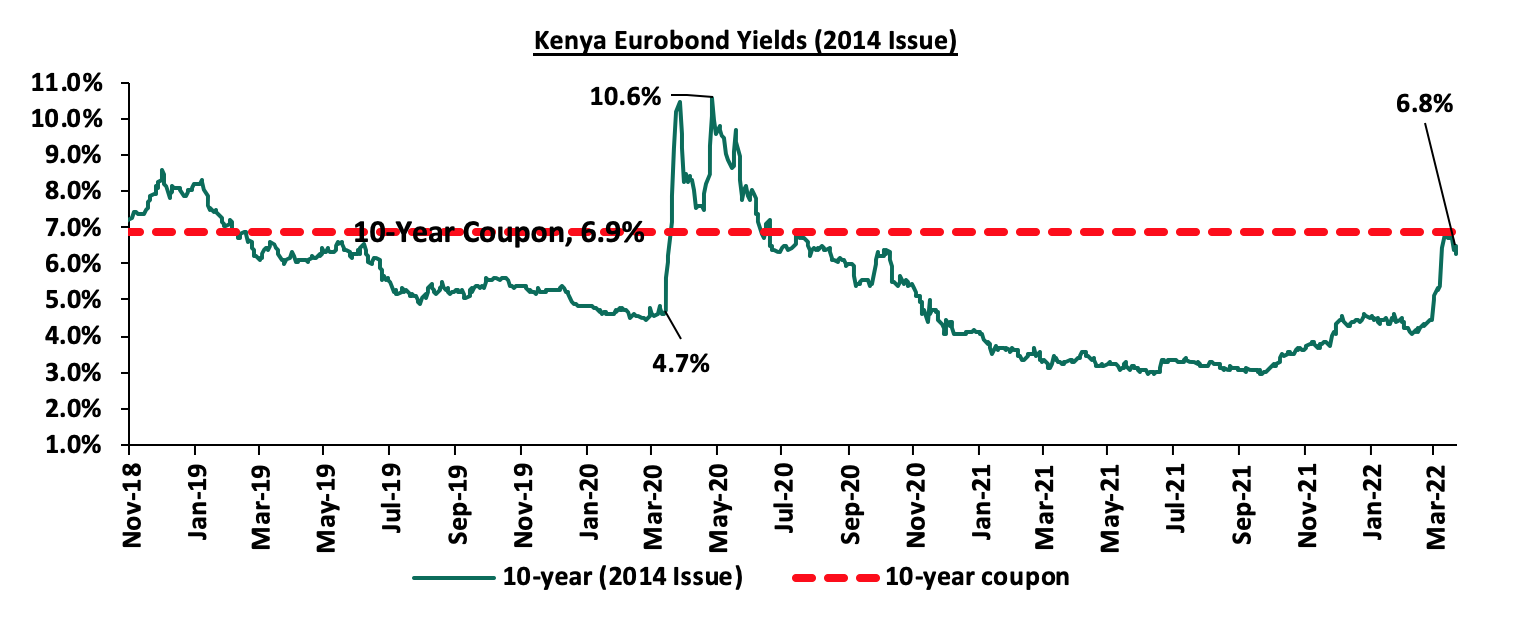
During the quarter, the yield on the 10-year Eurobond issued in 2014, increased by 2.3% points to close at 6.8%, from 4.5% recorded in Q4’2021. During the week, the yield on the 10-year Eurobond issued in 2014 decreased by 0.4% points to 6.8%, from 7.2% recorded last week.
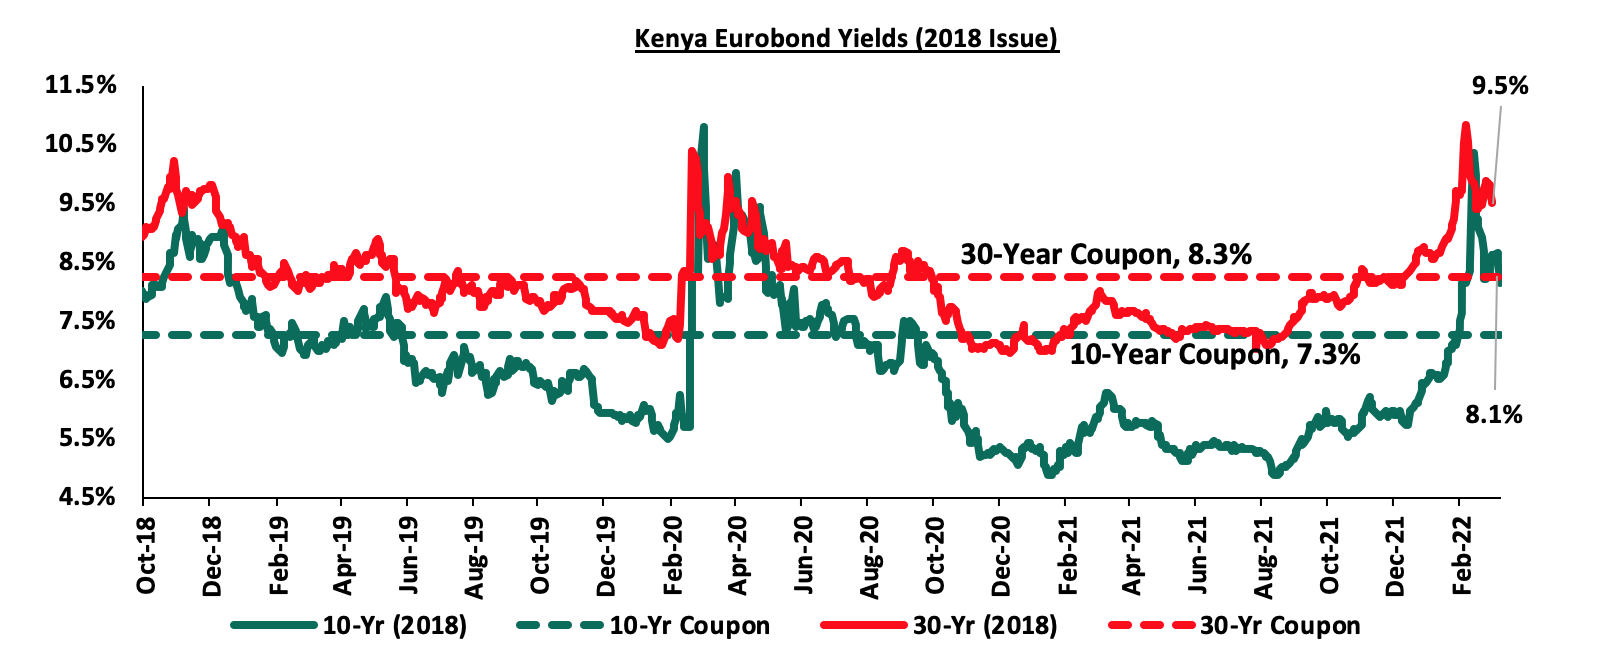
During the Quarter, the yield on the 10-year and 30-year Eurobonds issued in 2018 increased by 2.3% points and 1.4% points to close at 8.1% and 9.5%, from 5.8% and 8.1%. During the week, the yield on the 10-year and 30-year Eurobonds issued in 2018 declined by 0.5% points and 0.4% points to 8.1% and 9.5%, from 8.6% and 9.9%, respectively, recorded last week.
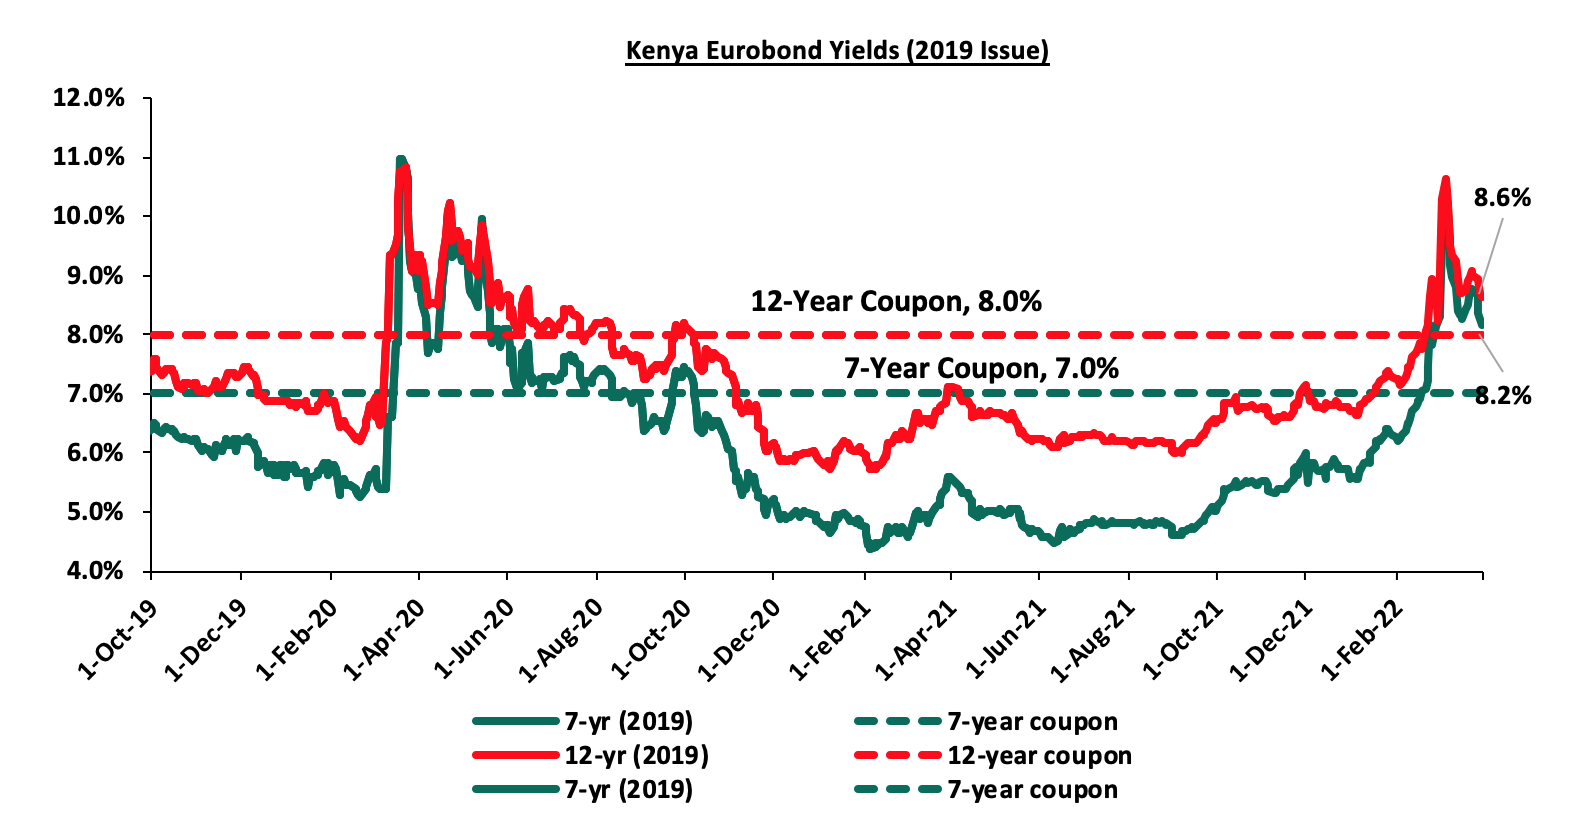
During the Quarter, the yield on the 7-year and 12-year Eurobonds issued in 2019, increased by 2.6% points and 1.9% points to close at 8.2% and 8.6%, from 5.6% and 6.7% at the end of Q4’2021. During the week, the yield on the 7-year and the 12-year Eurobonds issued in 2019 declined by 0.5% points and 0.4% points to 8.2% and 8.6% from 8.7% and 9.0%, respectively, as was recorded the previous week.
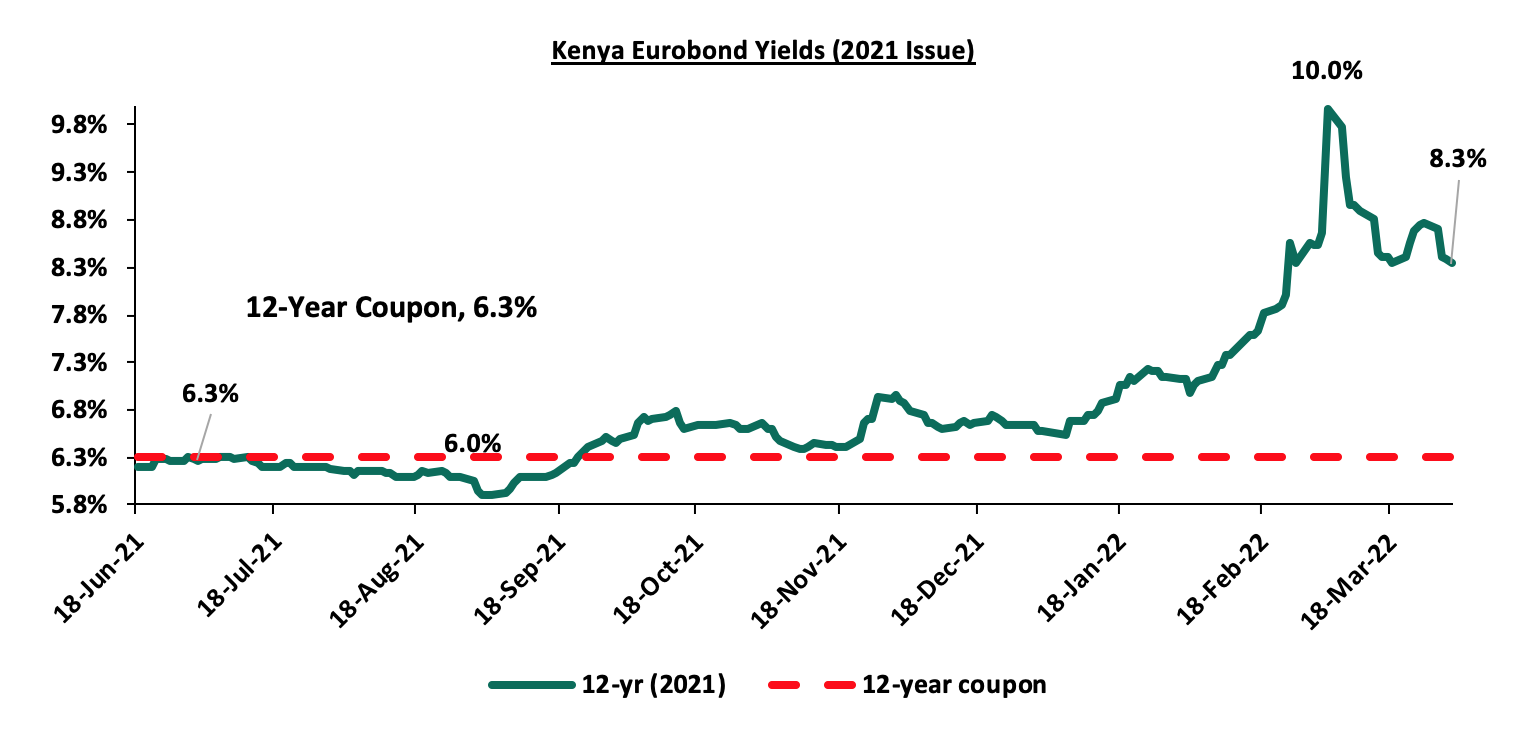
During the Quarter, the yield on the 12-year Eurobond issued in 2021 increased by 1.7% points to close at 8.3%, from 6.6% in Q4’2021. During the week, the yield on the 12-year Eurobond issued in 2021 declined by 0.5% points to 8.3%, from 8.8% recorded last week.
Rates in the Fixed Income market have remained stable due to the relatively ample liquidity in the money market. The government is 4.5% ahead of its prorated borrowing target of Kshs 508.9 bn having borrowed Kshs 531.7 bn of the Kshs 661.6 bn borrowing target for the FY’2021/2022. We expect a gradual economic recovery as evidenced by the revenue collections of Kshs 1.2 tn during the first eight months of the current fiscal year, which was equivalent to 100.8% of the prorated revenue collection target. However, despite the projected high budget deficit of 11.4% and the affirmation of the `B+’ rating with negative outlook by Fitch Ratings, we believe that the support from the IMF and World Bank will mean that the interest rate environment will remain stable since the government is not desperate for cash. Owing to this, our view is that investors should be biased towards short-term fixed-income securities to reduce duration risk.
Market Performance:
During Q1’2022, the equities market was on a downward trajectory, with NASI, NSE 20 and NSE 25 declining by 6.4%, 2.9% and 4.8%, respectively, taking their YTD performance as at the end of March to losses of 6.8%, 3.5% and 5.1% for NASI, NSE 25 and NSE 20 respectively. The equities market performance during the quarter was driven by losses recorded by large caps such as Safaricom, EABL, Bamburi and Equity Group of 10.0%, 9.1%, 5.9% and 4.3%, respectively. The losses were however mitigated by gains recorded by stocks such as BAT, Standard Chartered Bank (SCBK), ABSA and NCBA Group of 12.4%, 12.1%, 5.1% and 2.6%, respectively.
Equities turnover declined by 24.8% during the quarter to USD 244.0 mn, from USD 324.2 mn in Q4’2021. Foreign investors remained net sellers during the quarter, with a net selling position of USD 14.8 mn, from a net selling position of USD 72.9 recorded in Q4’2020.
During the week, the equities market was on a downward trajectory, with NASI, NSE 20 and NSE 25 declining by 2.7%, 0.9% and 2.3%, respectively, driven by losses recorded by Equity Group, Safaricom, Co-operative Bank and ABSA of 4.6%, 4.0%, 2.3% and 2.0%, respectively. The losses were however mitigated by gains recorded by stocks such as Diamond Trust Bank (DTB-K) and Bamburi of 3.1% and 1.1%, respectively.
During the week, equities turnover declined by 16.3% to USD 17.0 mn from USD 20.2 mn recorded the previous week, taking the YTD turnover to USD 248.2 mn. During the week, foreign investors remained net sellers, with a net selling position of USD 3.0 mn, from a net selling position of USD 0.9 mn recorded the previous week, taking the YTD net selling position to 14.8 mn.
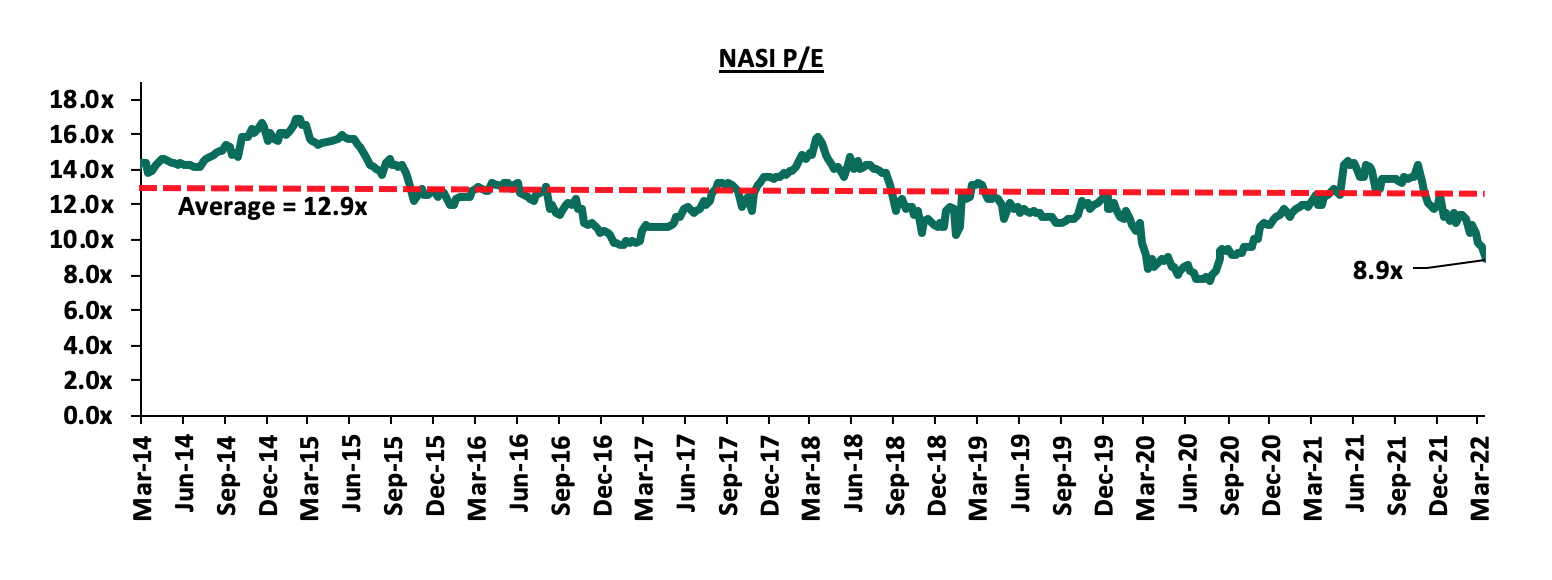
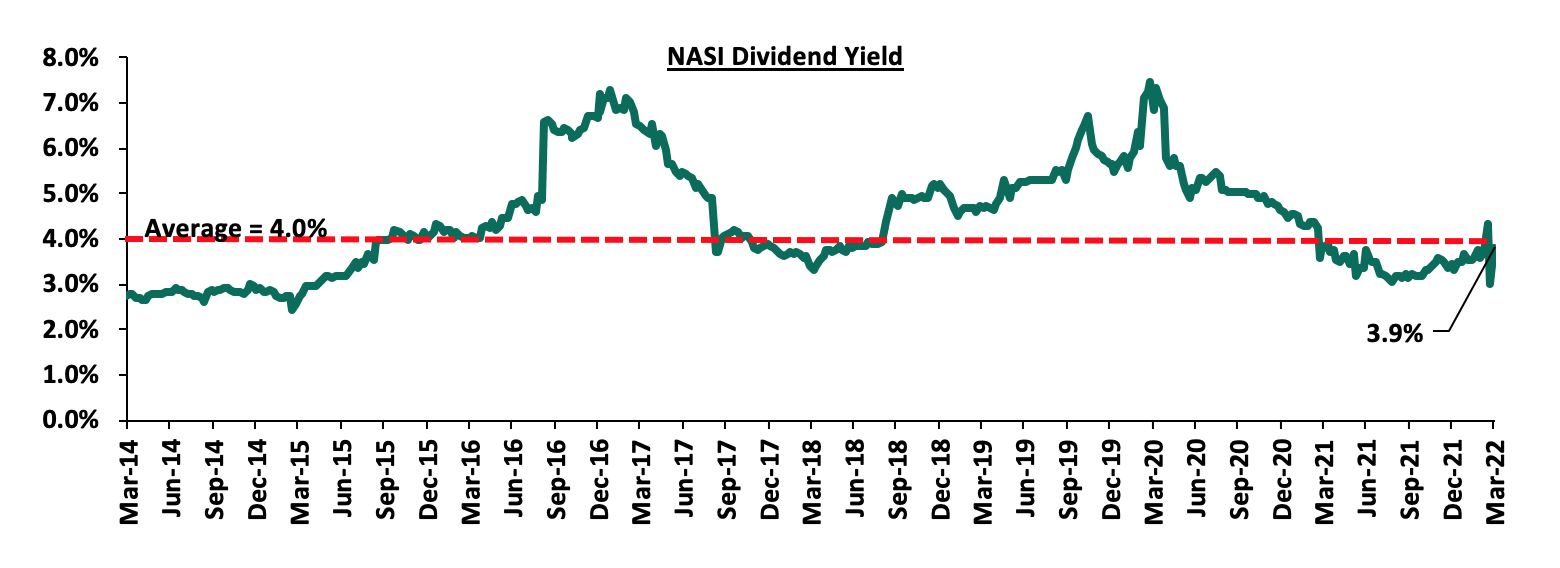
The market is currently trading at a price to earnings ratio (P/E) of 8.9x, 30.9% below the historical average of 12.9x, and a dividend yield of 3.8%, 0.2% points below the historical average of 4.0%. Notably, this week’s P/E is the lowest it has been since August 2020. Key to note, NASI’s PEG ratio currently stands at 1.1x, an indication that the market is trading at a premium to its future earnings growth. A PEG ratio greater than 1.0x indicates the market may be overvalued while a PEG ratio less than 1.0x indicates that the market is undervalued. The current P/E valuation of 8.9x is 15.6% above the most recent trough valuation of 7.7x experienced in the first week of August 2020. The charts below indicate the historical P/E and dividend yields of the market.
Earnings Releases:
- Asset Quality
The table below is a summary of the asset quality for the banks that have released
|
|
FY'2020 NPL Ratio** |
FY'2021 NPL Ratio* |
% point change in NPL Ratio |
FY'2020 NPL Coverage** |
FY'2021 NPL Coverage* |
% point change in NPL Coverage |
|
ABSA Bank Kenya |
7.7% |
7.9% |
0.2% |
71.1% |
77.7% |
6.6% |
|
KCB |
14.8% |
16.6% |
1.8% |
59.8% |
52.9% |
(6.9%) |
|
Equity Group |
11.5% |
8.6% |
(2.9%) |
62.4% |
68.7% |
6.3% |
|
NCBA Group |
14.7% |
16.0% |
1.3% |
60.9% |
73.6% |
12.7% |
|
Standard Chartered Bank Kenya |
16.0% |
16.0% |
(0.0%) |
80.6% |
84.4% |
3.8% |
|
Stanbic Bank |
11.8% |
9.3% |
(2.5%) |
60.6% |
51.8% |
(8.8%) |
|
I&M Holdings |
11.6% |
9.5% |
(2.1%) |
66.8% |
71.4% |
4.6% |
|
Diamond Trust Bank |
11.9% |
12.9% |
1.0% |
40.0% |
41.8% |
1.8% |
|
Co-operative Bank of Kenya |
18.7% |
14.6% |
(4.1%) |
50.3% |
60.6% |
10.3% |
|
HF Group |
24.6% |
21.1% |
(3.5%) |
63.4% |
73.6% |
10.2% |
|
Mkt Weighted Average |
13.3% |
12.2% |
(1.1%) |
62.3% |
65.3% |
3.0% |
|
*Market cap weighted as at 01/04/2022 |
||||||
|
**Market cap weighted as at 15/04/2021 |
||||||
Key take-outs from the table include;
- Asset quality for the listed banks that have released their FY’2021 results improved during the period, with the weighted average NPL ratio declining by 1.1% points to a market cap weighted average of 12.2%, from an average of 13.3% for the listed banking sector in FY’2020. The improvement in asset quality is attributable to declining credit risk on the back of increased business activities in 2021 driven by the gradual economic recovery,
- NPL Coverage for the listed banks increased to a market cap weighted average of 65.3% in FY’2021, from 62.3% recorded in FY’2020, as the banks increased their provisioning levels to proactively manage risks brought about by the emergence of new COVID-19 variants coupled with the slow recovery of some sectors such as tourism and hospitality and,
- KCB Group recorded a decline in their NPL coverage despite the NPL ratio rising, which would suggest modest provisioning. Given the slow recovery in some sectors locally and the high NPL ratios in some of the group’s subsidiaries, we expected the group to maintain the high provisioning to cater for the existing credit risk. Key to note, if KCB’s NPL Coverage remained at the 59.8% level recorded in 2020, the bank would have had an additional provisioning of Kshs 8.4 bn, which would have reduced the earnings per share from the reported Kshs 10.6 to Kshs 8.6.
- Summary Performance
The table below highlights the performance of the banks that have released so far, showing the performance using several metrics, and the key take-outs of the performance;
|
Bank |
Core EPS Growth |
Interest Income Growth |
Interest Expense Growth |
Net Interest Income Growth |
Net Interest Margin |
Non-Funded Income Growth |
NFI to Total Operating Income |
Growth in Total Fees & Commissions |
Deposit Growth |
Growth in Government Securities |
Loan to Deposit Ratio |
Loan Growth |
Return on Average Equity |
|
ABSA |
161.2% |
1.9% |
15.9% |
8.0% |
7.1% |
4.7% |
31.6% |
11.6% |
5.9% |
5.2% |
87.2% |
12.20% |
21.1% |
|
NCBA |
123.7% |
5.1% |
3.9% |
6.1% |
5.9% |
5.6% |
45.0% |
2.5% |
11.5% |
20.9% |
51.9% |
(1.8%) |
13.6% |
|
Equity |
99.4% |
27.9% |
37.2% |
24.8% |
6.8% |
15.8% |
39.3% |
29.4% |
29.5% |
30.0% |
61.3% |
23.0% |
26.6% |
|
KCB |
74.3% |
15.1% |
17.6% |
14.4% |
8.4% |
8.8% |
28.0% |
9.0% |
9.1% |
29.7% |
80.7% |
13.5% |
21.8% |
|
SCBK |
66.2% |
(6.1%) |
(24.7%) |
(1.6%) |
6.4% |
24.9% |
35.5% |
19.9% |
3.5% |
(4.2%) |
47.5% |
3.7% |
17.4% |
|
HF Group |
65.1% |
(8.0%) |
(12.7%) |
(2.1%) |
4.2% |
3.6% |
22.8% |
21.2% |
(5.6%) |
7.8% |
92.0% |
6.2% |
(7.2%) |
|
COOP |
53.0% |
13.9% |
17.0% |
12.9% |
8.0% |
11.0% |
32.1% |
18.1% |
7.7% |
13.7% |
76.1% |
8.2% |
17.3% |
|
Stanbic |
43.2% |
1.6% |
15.2% |
12.2% |
6.2% |
4.2% |
42.6% |
(8.5%) |
(5.8%) |
(17.4%) |
83.0% |
11.2% |
14.0% |
|
DTB |
25.1% |
9.1% |
6.9% |
10.6% |
5.1% |
3.0% |
24.0% |
10.8% |
11.2% |
11.9% |
66.5% |
5.7% |
6.8% |
|
I&M |
0.7% |
18.8% |
(0.4%) |
33.8% |
6.3% |
1.1% |
29.0% |
16.9% |
13.0% |
23.4% |
71.0% |
12.4% |
12.2% |
|
FY'21 Mkt Weighted Average* |
83.2% |
14.0% |
17.1% |
15.4% |
7.1% |
10.9% |
34.6% |
15.9% |
13.4% |
18.4% |
70.1% |
13.2% |
20.3% |
|
FY'20 Mkt Weighted Average** |
(26.8%) |
16.7% |
12.5% |
18.9% |
7.3% |
6.4% |
35.4% |
(2.1%) |
22.3% |
26.3% |
69.8% |
11.7% |
13.2% |
|
*Market cap weighted as at 01/04/2022 |
|||||||||||||
|
**Market cap weighted as at 15/04/2021 |
|||||||||||||
Key takeaways from the table above include:
- The listed banks that have released recorded an 83.2% weighted average growth in core Earnings per Share (EPS), compared to a weighted average decline of 26.8% in FY’2020 for the listed banking sector. The performance is however largely skewed by the strong performance from ABSA Bank and NCBA whose core EPS grew by 161.2% and 123.7%, respectively,
- The Banks have recorded a weighted average deposit growth of 13.4%, slower than the 22.3% growth recorded in FY’2020,
- Interest expense grew at a faster pace, by 17.4%, compared to the 12.5% growth in FY’2020. On the other hand, cost of funds declined, coming in at a weighted average of 2.8% in FY’2021, from 2.9% in FY’2020, owing to the faster growth in average interest-bearing liabilities, an indication that the listed banks were able to mobilize cheaper deposits,
- Average loan growth came in at 13.2%, 1.5% points lower than the 11.7% growth recorded in FY’2020. Additionally, the loan growth was lower than the 18.4% growth in government securities, an indication that banks shied away from lending due to uncertainties surrounding the emergence of new COVID-19 variants coupled with the slow recovery of some sectors such as tourism and hospitality,
- Interest income grew by 14.0%, compared to a growth of 16.7% recorded in FY’2020 while the weighted average Yield on Interest Earning Assets (YIEA) increased to 9.7%, from the 9.5% recorded in FY’2020 for the listed banking sector, an indication of the increased allocation to higher-yielding assets by the sector during the period. Net Interest Margin (NIM) now stands at 7.1%, 0.2% points lower than the 7.3% recorded in FY’2020 for the whole listed banking sector, and,
- Non-Funded Income grew by 10.9%, compared to the 6.4% growth recorded in FY’2020. This can be attributable to the faster growth in the fees and commission which grew by 11.0% compared to a decline of 2.1% in FY’2020, following the expiry of the waiver on fees on mobile transactions.
For the various earnings notes of the various companies, click these links:
- Stanbic Holdings FY’2021 Earnings Note;
- KCB Group FY’2021 Earnings Note;
- Cooperative Bank FY’2021 Earnings Note;
- ABSA Bank Kenya FY’2021 Earnings Note;
- Standard Chartered Bank Kenya FY’2021 Earnings Note;
- Equity Group FY’2021 Earnings Note;
- NCBA Group FY’2021 Earnings Note;
- HF Group FY’2021 Earnings Note;
- Diamond Trust Bank Kenya (DTB-K) FY’2021 Earnings Note;
- I&M Holdings FY’2021 Earnings Note;
Quarterly Highlights:
During the quarter;
- The International Finance Corporation (IFC) disclosed that it would disburse USD 165.0 mn (Kshs 18.6 bn) to Equity Bank Kenya Limited in form of a 7-year Tier 2 subordinated loan. This amount is expected to be used to shore up the Bank’s Tier 2 capital and for onward lending to climate smart projects and Small and Medium Enterprises (SMEs) in Kenya. For more information, please see our Cytonn Weekly #01/2022,
- Equity Group Holdings (EGH), announced the completion of the incorporation of a subsidiary, Equity Group Insurance Holdings Limited, a non-operating insurance holding company and issuance of a life insurance license to Equity Life Assurance Kenya (ELAK) Limited. ELAK, which is fully owned by Equity Group Insurance Holdings Limited, will conduct and undertake long-term insurance business in Kenya. This came after EGH obtained the prerequisite approvals from its shareholders and the Central Bank of Kenya (CBK), before subsequent registration and licensing from the Insurance Regulatory Authority (IRA) on 10th January 2022. For more information, please see our Cytonn Weekly #02/2022,
- The Central Bank of Kenya (CBK) recently released the Quarterly Economic Review for the period ending 30th September 2021, highlighting that the banking sector’s total assets increased by 10.6% to Kshs 5.8 tn, from Kshs 5.3 tn in September 2020. The sector’s Profit before Tax (PBT) increased by 68.2% to Kshs 49.1 bn, from Kshs 29.2 bn recorded in September 2020. For more information, please see our Cytonn Weekly #04/2022
- Moody’s Rating Agency rated the Kenyan banking sector as stable following the banks’ impressive performance in the eleven months to November 2021, with the profits before tax coming in at Kshs 178.8 bn exceeding the pre-pandemic earnings of Kshs 150.1 bn over the same period in 2019. The gradual economic recovery is expected to support banks in improving their loan quality and profitability, while capital, funding, and liquidity will remain strong, in line with our Q3’2021 Banking Sector report. For more information, please see our Cytonn Weekly #06/2022,
- Standard Africa Holdings Limited (SAHL), the majority shareholder in Stanbic Holdings, announced that it had received regulatory approval from the Capital Markets Authority for further extension to acquire increased stake of up to 75.0% in Stanbic Holdings. This comes after SAHL had received an exemption from making a full take-over under the Capital Markets (Take over and Mergers) Regulations, 2002 in July 2018. Under the exemption, SAHL aims to bring its total shareholding to up to 75.0% of Stanbic Holdings’ ordinary shares, from 72.3% as of 31st December 2021. For more information, please see our Cytonn Weekly #07/2022,
- The Central Bank of Kenya (CBK), released the Commercial Banks’ Credit Survey Report for the quarter ended December 2021. The quarterly Credit Officer Survey is undertaken by the CBK to identify the potential drivers of credit risk in the banking sector. During the quarter, 38 operating commercial banks and 1 mortgage finance company participated in the Commercial Banks Credit Officer Survey. The report highlights that the banking sector’s loan book recorded an 8.3% y/y growth, with gross loans increasing to Kshs 3.3 tn in December 2021, from Kshs 3.0 tn in December 2020. For more information, kindly see our Cytonn Weekly #10/2022,
- The Central Bank of Kenya (CBK) released the Quarterly Economic Review Report October-December 2021, highlighting that the sector’s total assets increased by 10.8% to Kshs 6.0 tn in December 2021, from Kshs 5.4 tn in December 2020 and Profit before Tax (PBT) increased by 0.4% to Kshs 49.3 bn, from Kshs 49.1 bn in Q4’2020. For more information, kindly see our Cytonn Weekly #12/2022, and,
- The Insurance Regulatory Authority of Kenya (IRA) released the Quarterly Insurance Industry Report for the period ended 31st December highlighting that the industry’s gross premiums rose by 18.5% to Kshs 276.1 bn, from Kshs 233.0 bn recorded in Q4’2020, with the general insurance business contributing 55.2% of the industry’s premium income, a 1.0% point decline from the 56.2% contribution witnessed in Q4’2020. For more information, kindly see our Cytonn Weekly #12/2022.
Cytonn Coverage:
|
Company |
Price as at 25/03/2022 |
Price as at 1/04/2022 |
w/w change |
q/q change |
YTD Change |
Year Open 2022 |
Target Price* |
Dividend Yield |
Upside/ Downside** |
P/TBv Multiple |
Recommendation |
|
Kenya Reinsurance |
2.3 |
2.2 |
(1.8%) |
(2.2%) |
(3.5%) |
2.3 |
3.2 |
4.5% |
48.4% |
0.2x |
Buy |
|
Jubilee Holdings |
274.0 |
274.8 |
0.3% |
(14.1%) |
(13.3%) |
316.8 |
381.7 |
5.1% |
44.0% |
0.5x |
Buy |
|
Liberty Holdings |
6.3 |
5.7 |
(8.9%) |
(15.4%) |
(19.3%) |
7.1 |
7.7 |
0.0% |
34.4% |
0.4x |
Buy |
|
I&M Group*** |
21.2 |
20.5 |
(3.3%) |
(0.9%) |
(4.2%) |
21.4 |
24.4 |
7.3% |
26.2% |
0.6x |
Buy |
|
KCB Group*** |
44.0 |
44.0 |
0.0% |
(3.1%) |
(3.4%) |
45.6 |
51.4 |
6.8% |
23.5% |
0.9x |
Buy |
|
Equity Group*** |
51.5 |
49.2 |
(4.6%) |
(4.3%) |
(6.8%) |
52.8 |
56.6 |
6.1% |
21.3% |
1.3x |
Buy |
|
Britam |
6.8 |
6.7 |
(2.3%) |
(11.5%) |
(11.6%) |
7.6 |
7.9 |
0.0% |
17.9% |
1.1x |
Accumulate |
|
NCBA*** |
25.9 |
25.9 |
0.0% |
2.6% |
1.8% |
25.5 |
26.4 |
11.6% |
13.5% |
0.6x |
Accumulate |
|
Co-op Bank*** |
12.9 |
12.6 |
(2.3%) |
(0.8%) |
(3.1%) |
13.0 |
13.1 |
7.9% |
11.6% |
0.9x |
Accumulate |
|
Diamond Trust Bank*** |
57.0 |
58.8 |
3.1% |
(0.8%) |
(1.3%) |
59.5 |
61.8 |
5.1% |
10.3% |
0.3x |
Accumulate |
|
Sanlam |
11.4 |
11.0 |
(3.5%) |
(4.8%) |
(4.8%) |
11.6 |
12.1 |
0.0% |
9.6% |
1.2x |
Hold |
|
Stanbic Holdings |
102.0 |
104.8 |
2.7% |
18.1% |
20.4% |
87.0 |
105.2 |
8.6% |
9.0% |
0.9x |
Hold |
|
ABSA Bank*** |
12.4 |
12.0 |
(2.8%) |
5.1% |
2.1% |
11.8 |
11.9 |
9.2% |
8.4% |
1.2x |
Hold |
|
Standard Chartered*** |
142.0 |
143.8 |
1.2% |
12.1% |
10.6% |
130.0 |
137.7 |
9.7% |
5.5% |
1.1x |
Hold |
|
HF Group |
3.2 |
3.2 |
(2.5%) |
(19.0%) |
(17.1%) |
3.8 |
3.0 |
0.0% |
(6.2%) |
0.2x |
Sell |
|
CIC Group |
2.0 |
2.2 |
10.0% |
(2.3%) |
1.8% |
2.2 |
1.9 |
0.0% |
(14.8%) |
0.8x |
Sell |
|
*Target Price as per Cytonn Analyst estimates **Upside/ (Downside) is adjusted for Dividend Yield ***For Disclosure, these are stocks in which Cytonn and/or its affiliates are invested in |
|||||||||||
We are “Neutral” on the Equities markets in the short term. With the market currently trading at a premium to its future growth (PEG Ratio at 1.1x), we believe that investors should reposition towards value stocks with strong earnings growth and that are trading at discounts to their intrinsic value. We expect the discovery of new COVID-19 variants, the upcoming Kenyan general elections and the slow vaccine rollout to continue weighing down the economic outlook. On the upside, we believe that the relaxation of COVID-19 containment measures in the country will lead to improved investor sentiments.
In Q1’2022, the Real Estate sector recorded notable activities compared to a similar period in 2021 attributable to the recovery of the Kenyan economy enabling increased Real Estate property transactions and boosting investor confidence. Some of the key factors that have continued to shape the performance of the Real Estate sector include:
- Continued focus on Affordable Housing by both the government and the private sector, for instance, the State Department of Housing and Urban Development partnered with Seascan Development Limited to construct 4,900 affordable housing units in a project dubbed Mowlem Estate in Nairobi’s Dandora area,
- Efforts by the government to provide affordable mortgages through the Kenya Mortgage Refinance Company aiming to increase home ownership. The firm rolled out a Kshs 10.5 bn Medium-Term Note (MTN) bond programme in January 2022, which recorded an oversubscription of 478.6% in the first tranche that aimed to raise Kshs 1.4 bn,
- Resumption of business operations by firms supported by the improved operating environment driving increase in office occupancies hence a better performance of the Commercial Office Sector,
- Positive demographics evidenced by Kenya’s relatively high urbanization and population growth rates of 4.0% p.a and 2.3% p.a, respectively, against the global average of 1.8% p.a and 1.0% p.a, respectively, as at 2020, driving increased demand for developments,
- Improved infrastructure opening up areas for investment such as the Nairobi Expressway, and Nairobi Western Bypass projects, among many others, and,
- Aggressive entry and expansion by local and international retailers such as Naivas, QuickMart, and Carrefour, taking up spaces previously occupied by troubled retailers such as Tuskys and Nakumatt.
However, a couple of challenges impeding performance of the sector include;
- Reduced lending to the Real Estate sector evidenced by a 3.9% decline in gross loans advanced to the Real Estate sector to Kshs 456.0 bn in FY’2021, from Kshs 439.0 bn realized in FY’2020. This is attributed to an increase in the number of Non-Performing Loans (NPLs) in the Real Estate sector by 21.6% to Kshs 74.7 bn in FY’2021 ,from Kshs 61.4 bn realized in FY’2020 according to the Central Bank of Kenya, with the increased Real Estate loan default rates being driven by the tough economic environment,
- Increase in prices of construction materials such as steel, paint, and cement which is expected to lead to slowdown in the Real Estate sector according to the Architectural Association of Kenya,
- Travel Advisories in the country which is expected to have a downturn on the performance of the Hospitality sector, such as the Travel Advisory by the United Kingdom (UK) citing heightened threat of terrorism in Kenya,
- The existing oversupply of space in some sectors e.g. 1.7 mn SQFT in the Kenyan Retail sector and 6.7mn SQFT in the Commercial Office sector,
- Shift towards e-commerce affecting demand and uptake of physical Retail spaces, and,
- Continued poor performance of the REIT market in Kenya due to lack of Knowledge and interest of the financing instrument by investors.
Despite these limitations, the Real Estate sector has registered increased activities in Q1’2022 and remains an attractive investment class. However, as 2022 is an election year, we expect a slow-down in market prices and sales volumes since investors and prospective buyers are expected to adopt a wait and see approach. The impact is expected to be temporary and the market is likely to stabilise on the back of relatively strong GDP growth at 5.2% as at Q3’2021, and an attractive demographic profile.
Market Performance:
I. Residential Sector
During Q1’2022, the residential sector recorded an improvement in performance on a YoY basis with average y/y total returns to investors coming in at 5.7%, a 0.6% points increase from 5.1% recorded in Q1’2021. However, on a q/q basis this was a 0.4% points decline from the 6.1% average total return in FY’2021. Prices in all segments saw an uptick with an overall average price appreciation of 0.9% in the residential market with the average rental yield recording a 0.2% points y/y increase to 4.8% from 4.6% recorded in Q1’2021, attributed to improvement in rental rates amid an improved economy.
|
Residential Performance Summary-Q1’2022 |
|||||||||
|
Segment |
Average of Rental Yield Q1'2022 |
Average of Price Appreciation Q1'2022 |
Total Returns Q1'2022 |
Average of Rental Yield Q1'2021 |
Average of Price Appreciation Q1'2021 |
Average of Total Returns Q1'2021 |
y/y change in Rental Yield (% Points) |
y/y change in Price Appreciation (% Points) |
y/y change in Total Returns (% Points) |
|
Detached Units |
|||||||||
|
High End |
3.9% |
1.3% |
5.2% |
3.6% |
1.0% |
4.6% |
0.3% |
0.3% |
0.6% |
|
Upper Mid-End |
4.2% |
1.1% |
5.3% |
4.5% |
0.6% |
5.0% |
(0.3%) |
0.5% |
0.3% |
|
Satellite Towns |
4.5% |
1.3% |
5.8% |
4.1% |
0.7% |
4.8% |
0.4% |
0.6% |
1.0% |
|
Detached Units Average |
4.2% |
1.2% |
5.4% |
4.1% |
0.8% |
4.8% |
0.1% |
0.4% |
0.6% |
|
Apartments |
|||||||||
|
Upper Mid-End |
5.6% |
0.5% |
6.1% |
5.2% |
0.0% |
5.2% |
0.4% |
0.5% |
0.9% |
|
Lower Mid-End |
5.2% |
0.6% |
5.8% |
5.0% |
0.2% |
5.3% |
0.2% |
0.4% |
0.5% |
|
Satellite Towns |
5.4% |
0.9% |
6.3% |
5.4% |
0.0% |
5.5% |
0.0% |
0.9% |
0.8% |
|
Apartments Average |
5.4% |
0.6% |
6.0% |
5.2% |
0.1% |
5.3% |
0.2% |
0.5% |
0.7% |
|
Residential Market Average |
4.8% |
0.9% |
5.7% |
4.6% |
0.4% |
5.1% |
0.2% |
0.5% |
0.6% |
Source: Cytonn Research 2022
A. Detached Units Performance
Detached units recorded an improvement in performance in Q1’2022 compared to Q1’2021 with average y/y returns to investors coming in at 5.4%, representing a 0.6% points y/y increase from 4.8% recorded in Q1’2021. This was attributed to investor confidence in the market, that saw transactional volumes pick amid recovery in the Real Estate market. Satellite Towns were the best performing segment with an average y/y total return of 5.8%, with Syokimau and Ngong offering the highest average y/y total returns at 6.7%. The best performing node was Redhill recording the highest average y/y total returns at 7.2%, followed by Syokimau and Ngong, and finally Athi River whose average y/y total return came in at 6.6%. Rongai and Langata recorded the lowest returns at 4.2%.
|
Detached Units Performance – Q1’2022 |
||||||||
|
Row Labels |
Average of Price per SQM Q1'2022 |
Average of Rent per SQM Q1'2022 |
Average of Occupancy Q1'2022 |
Average of Uptake Q1'2022 |
Average of Annual Uptake Q1'2022 |
Average of Rental Yield Q1'2022 |
Average of Price Appreciation Q1'2022 |
Total Returns |
|
High-End |
||||||||
|
Rosslyn |
188,415 |
819 |
85.9% |
94.4% |
13.6% |
4.7% |
1.8% |
6.5% |
|
Kitisuru |
227,272 |
736 |
92.0% |
91.2% |
12.5% |
4.2% |
1.4% |
5.6% |
|
Runda |
211,728 |
789 |
91.0% |
95.4% |
10.0% |
4.1% |
1.1% |
5.2% |
|
Karen |
185,270 |
686 |
85.3% |
88.1% |
12.3% |
3.5% |
0.8% |
4.3% |
|
Lower Kabete |
156,352 |
422 |
81.9% |
80.1% |
12.1% |
3.1% |
1.2% |
4.3% |
|
Average |
193,807 |
691 |
87.2% |
89.8% |
12.1% |
3.9% |
1.3% |
5.2% |
|
Upper Mid-End |
||||||||
|
Redhill & Sigona |
100,476 |
442 |
90.0% |
88.6% |
13.7% |
4.3% |
2.9% |
7.2% |
|
Ridgeways |
167,607 |
761 |
84.0% |
77.9% |
11.8% |
5.3% |
1.1% |
6.4% |
|
Lavington |
163,505 |
576 |
86.0% |
82.7% |
11.6% |
4.0% |
1.4% |
5.4% |
|
Loresho |
168,277 |
719 |
74.3% |
72.9% |
12.7% |
4.7% |
0.3% |
5.0% |
|
South B/C |
104,789 |
338 |
81.7% |
78.5% |
11.4% |
3.2% |
1.4% |
4.6% |
|
Runda Mumwe |
151,208 |
604 |
85.3% |
82.1% |
11.3% |
4.3% |
0.2% |
4.5% |
|
Langata |
137,432 |
282 |
88.6% |
88.9% |
10.1% |
3.5% |
0.7% |
4.2% |
|
Average |
141,899 |
532 |
84.3% |
81.7% |
11.8% |
4.2% |
1.1% |
5.3% |
|
Lower Mid-End |
||||||||
|
Syokimau/Mlolongo |
73,436 |
311 |
79.1% |
85.8% |
17.0% |
3.8% |
2.9% |
6.7% |
|
Ngong |
59,840 |
337 |
85.3% |
89.7% |
11.6% |
5.1% |
1.6% |
6.7% |
|
Athi River |
84,577 |
313 |
86.5% |
91.9% |
12.9% |
3.9% |
2.7% |
6.6% |
|
Ruiru |
65,251 |
302 |
83.8% |
71.3% |
16.0% |
5.0% |
1.5% |
6.5% |
|
Kitengela |
67,478 |
274 |
92.0% |
73.8% |
11.4% |
4.9% |
1.1% |
6.0% |
|
Thika |
63,581 |
302 |
79.8% |
79.0% |
12.3% |
5.0% |
1.0% |
6.0% |
|
Donholm & Komarock |
92,706 |
389 |
93.9% |
98.0% |
13.1% |
4.9% |
(1.0%) |
3.9% |
|
Juja |
71,242 |
266 |
75.1% |
71.4% |
14.3% |
4.5% |
1.2% |
5.6% |
|
Rongai |
80,521 |
251 |
81.1% |
87.5% |
15.5% |
3.3% |
0.9% |
4.2% |
|
Average |
73,119 |
305 |
84.1% |
83.2% |
13.8% |
4.5% |
1.2% |
5.7% |
Source: Cytonn Research 2022
B. Apartments Performance
Apartments registered improvement in Q1’2022 with average total returns recording a 0.7% points y/y increase to 6.0% in Q1’2022 from of 5.3% in Q1’2021, attributed to 0.5% points increase in y/y average price appreciation to 0.6% in Q1’2022 from 0.1% in Q2’2022. Satellite towns continued to be the best performing segment with average y/y total returns coming in at 6.3% attributed to the relatively high rental yield averaging at 5.4% and an average y/y price appreciation of 0.9%. The best performing nodes in terms of returns were Waiyaki Way, Westlands, Imara Daima, and, Ruaka which recorded an average y/y total returns of 8.4%, 8.1%,7.6%, and 7.5%, respectively attributed to relatively high rental yields coupled with resilience of house prices in the areas. Donholm and Kikuyu were the worst performing nodes which recorded average y/y total returns of 4.2% each.
|
Apartments Performance – Q1’2022 |
||||||||
|
Area |
Average of Price per SQM Q1’2022 |
Average of Rent per SQM Q1’2022 |
Average of Occupancy Q1’2022 |
Average of Uptake 2021 |
Average of Annual Uptake Q1’2022 |
Average of Rental Yield Q1’2022 |
Average of Price Appreciation Q1’2022 |
Total Returns |
|
Upper Mid-End |
||||||||
|
Westlands |
148,981 |
872 |
87.4% |
86.6% |
43.8% |
6.5% |
1.6% |
8.1% |
|
Upperhill |
136,249 |
813 |
81.3% |
92.0% |
14.8% |
5.7% |
1.0% |
6.7% |
|
Kileleshwa |
125,270 |
671 |
87.5% |
82.8% |
14.0% |
5.8% |
0.7% |
6.5% |
|
Kilimani |
104,503 |
534 |
87.1% |
93.5% |
18.2% |
6.2% |
(0.6%) |
5.6% |
|
Loresho |
120,762 |
514 |
90.7% |
94.0% |
10.0% |
4.6% |
0.1% |
4.7% |
|
Parklands |
119,893 |
559 |
88.0% |
87.3% |
13.4% |
4.8% |
0.0% |
4.8% |
|
Average |
125,943 |
660 |
87.0% |
89.4% |
19.0% |
5.6% |
0.5% |
6.1% |
|
Lower Mid-End Suburbs |
||||||||
|
Waiyaki Way |
88,082 |
526 |
86.8% |
83.9% |
22.7% |
6.3% |
2.1% |
8.4% |
|
Imara Daima |
81,101 |
409 |
86.3% |
87.7% |
12.6% |
4.9% |
2.7% |
7.6% |
|
South C |
116,853 |
699 |
82.8% |
73.9% |
23.8% |
6.1% |
1.3% |
7.4% |
|
Langata |
114,267 |
472 |
90.0% |
87.6% |
11.8% |
4.9% |
0.8% |
5.7% |
|
Race Course/Lenana |
99,563 |
618 |
87.2% |
90.3% |
19.1% |
6.1% |
(0.9%) |
5.2% |
|
Dagoretti |
85,064 |
560 |
92.0% |
95.7% |
16.9% |
6.2% |
(1.1%) |
5.1% |
|
South B |
105,102 |
451 |
82.4% |
95.2% |
17.8% |
4.2% |
0.5% |
4.7% |
|
Lower Kabete |
287,481 |
504 |
83.7% |
85.7% |
16.0% |
2.9% |
1.7% |
4.6% |
|
Kahawa West |
73,354 |
313 |
80.0% |
90.1% |
10.4% |
5.0% |
(0.4%) |
4.6% |
|
Donholm & Komarock |
79,853 |
406 |
86.6% |
89.9% |
11.6% |
5.3% |
(1.1%) |
4.2% |
|
Average |
113,072 |
496 |
85.8% |
88.0% |
16.3% |
5.2% |
0.6% |
5.8% |
|
Lower Mid-End Satellite Towns |
||||||||
|
Ruaka |
103,584 |
559 |
91.9% |
84.6% |
20.7% |
5.6% |
1.9% |
7.5% |
|
Syokimau |
69,135 |
330 |
89.9% |
83.5% |
12.7% |
5.4% |
1.5% |
6.9% |
|
Kitengela |
60,665 |
261 |
93.2% |
96.4% |
10.1% |
5.0% |
1.9% |
6.9% |
|
Athi River |
59,994 |
306 |
89.0% |
90.9% |
13.3% |
5.4% |
1.4% |
6.8% |
|
Rongai |
100,449 |
347 |
86.3% |
74.3% |
12.8% |
6.2% |
0.5% |
6.7% |
|
Ngong |
59,206 |
346 |
73.7% |
76.3% |
10.7% |
5.3% |
0.9% |
6.2% |
|
Thindigua |
99,367 |
475 |
83.6% |
83.4% |
24.2% |
5.0% |
1.2% |
6.% |
|
Ruiru |
89,094 |
493 |
84.3% |
85.9% |
21.9% |
5.7% |
(0.4%) |
5.3% |
|
Kikuyu |
80,659 |
464 |
69.9% |
79.6% |
14.0% |
4.9% |
(0.7%) |
4.2% |
|
Average |
80,239 |
398 |
84.6% |
83.9% |
15.6% |
5.4% |
0.9% |
6.3% |
Source: Cytonn Research 2022
Weekly Highlights:
During the week, Centum Real Estate, a fully-owned subsidiary of Centum Investment company kicked-off the phase one construction of its Mzizi court housing project that will comprise 270 affordable residential units at the 102-acre Two Rivers Development. It is estimated that the construction of Mzizi Court apartments will take approximately 2 years and is anticipated to be complete by Q1’2024. A detailed summary of the developments is highlighted below;
|
26 Mzizi Court Residences |
|||
|
Typology |
Plinth Area |
Price (Kshs mn) |
Price Per SQM (Kshs) |
|
1-Bed |
44 |
4.4 |
100,000 |
|
1-Bed Loft |
49 |
5.3 |
108,163 |
|
2-Bed |
69 |
6.8 |
98,551 |
|
2-Bed Duplex |
72 |
7.8 |
108,333 |
|
2-Bed with DSQ |
93 |
9.2 |
98,925 |
|
3-Bed |
95 |
9.2 |
96,842 |
|
Average |
|
|
101,802 |
Source: Centum Real Estate
The pricing of Mzizi Court apartments is relatively affordable with the average price per SQM at Kshs 101,802 compared to other developments at Two Rivers such as Riverbank whose average price per SQM stands at Kshs 166,881. This means that Two Rivers will have units that cater to the middle class with growing tastes and preferences. Other factors expected to drive demand for the units include
- Relatively good infrastructure, enhancing accessibility to commercial nodes such as Gigiri, Westlands and the CBD, thus boosting demand from Nairobi’s working class,
- Demand from expatriates such as the United Nations serving in international organizations,
- Presence of amenities such as Two Rivers Mall, Village Market, Rosslyn Riviera, Ridgeways Mall,
- Close proximity to learning institutions such as Potterhouse Runda, Sabis International, and Braeburn Ridgeways, and,
- Relatively high levels of security due to proximity to the UN Blue Zone.
Additionally, investment in mixed-use developments such as Two Rivers which also has Riverbank as one of its residential developments, continues to create operational synergies across various Real Estate themes hence enabling investors to maximize returns, either through rental income or capital appreciation. MUDs are also more convenient and preferred given that the development mix creates an upscale living environment with easy access to work places, retail stores, and/or, residential areas. In terms of performance, according to the Cytonn Mixed-Use Development Report-2021, MUDs offered better returns with the average rental yield coming in at 7.2% in 2021, 0.7% points higher than the respective single use themes which recorded average rental yield of 6.5% in the similar period.
The table below shows the performance of single-use and mixed-use development themes between 2020 and 2021;
|
Thematic Performance of MUDs in Key Nodes 2020-2021 |
||||||
|
MUD Themes Average |
Market Performance Average |
|||||
|
Rental Yield 2020 |
Rental Yield 2021 |
∆ in y/y MUD Rental yield |
Rental Yield 2020 |
Rental Yield 2021 |
∆ in y/y Market Average Rental Yield |
|
|
Retail |
7.1% |
8.4% |
1.3% |
7.7% |
7.8% |
0.1% |
|
Offices |
6.9% |
7.1% |
0.2% |
6.8% |
6.6% |
(0.2%) |
|
Residential |
6.3% |
6.0% |
(0.3%) |
5.8% |
5.2% |
(0.6%) |
|
Average |
6.9% |
7.2% |
0.3% |
6.8% |
6.5% |
(0.3%) |
|
* Market performance is calculated from nodes where sampled MUDs exist |
|
|||||
We expect the continued focus on developing affordable housing units offering convenience with the live, work and play incorporated under one development to attract demand from clients and interest from investors.Source: Cytonn Research 2021
Other highlights in Q1’2022 include; (see Cytonn Monthly- January 2022 and Cytonn Monthly-February 2022);
- Pan- African mortgage lender, Shelter Afrique in partnership with the Centre for Affordable Housing Finance in Africa (CAHF) developed a ‘Housing Affordability Calculator’ to vet proposals by developers pitching for financing of affordable housing. For more information, see Cytonn Weekly #12/2022,
- The Kakamega County Investment and Development Agency (KCIDA), in collaboration with Pinnie Agency Limited, a private developer, began the construction of 3,000 affordable housing units in 5 estates within Kakamega and Mumias towns. For more information, see Cytonn Weekly #11/2022,
- Unity Homes, a Kenyan-British housing developer announced plans to launch the construction of its third phase of housing units in Tatu City, Ruiru. The Kshs 4.3 bn project which is part of the developer’s commitment to support the government’s Big Four Affordable Housing initiative, will comprise of 1,200 apartments. For more information, see Cytonn Weekly #11/2022,
- The International Finance Corporation (IFC), an international financier, announced plans to buy Kshs 4.2 bn worth of bonds from the Kenya Mortgage Refinance Company’s (KMRC) Kshs 10.5 bn Medium Term Note Program (MTN). For more information, see Cytonn Weekly #11/2022, and,
- South Korea Government granted Kenya Kshs 685.9 mn for the construction of transport infrastructure, planning and security installations at the Konza Technopolis City Project). For more information, see Cytonn Weekly #11/2022.
Our outlook on the Residential sector is NEUTRAL as we as we expect the sector to record increased activities following focus on affordable housing, efforts by the government to avail relatively cheaper mortgage facilities to encourage home ownership. However, the sector’s performance continues to be weighed down by factors such as; i) low mortgage uptake, ii) sluggishness in the delivery of government affordable houses, iii) increase in construction materials leading to slowdown of developments, and, iv) reduced disposable income amongst Kenyans in the midst of tough economic times.
II. Commercial Office Sector
The commercial office sector retained its average rental yields and asking rents at 7.3% and Kshs 94 per SQFT, respectively, in Q1’2022. The overall occupancy rates increased by 0.3% points to 77.9% in the period of focus due to an increased demand for office spaces, as various firms resume full operations at the beginning of the year as well. The average selling prices increased as well by 0.2% to Kshs 12,113 per SQFT in Q1’2022 from Kshs 12,106 per SQFT in FY’2021, due to increased construction costs. According to Kenya National Bureau of Statistics’ (KNBS) Construction Input Price Indices, construction cost indices increased by 1.6% to 106.1 in Q4’2021, from the 104.4 that was realized in Q1’2021. The table below highlights the performance of the Nairobi Metropolitan Area (NMA) Commercial Office sector over time:
(All values in Kshs unless stated otherwise)
|
Nairobi Metropolitan Area (NMA) Commercial Office Returns Over Time |
||||||
|
Year |
Q1'2021 |
H1'2021 |
Q3'2021 |
FY'2021 |
Q1'2022 |
∆ FY'2021/Q1'2022 |
|
Occupancy % |
76.3% |
75.8% |
79.9% |
77.6% |
77.9% |
0.3% |
|
Asking Rents (Kshs) /SQFT |
92 |
93 |
94 |
94 |
94 |
0.0% |
|
Average Prices (Kshs) /SQFT |
12,228 |
12,224 |
12,479 |
12,106 |
12,113 |
0.2% |
|
Average Rental Yields (%) |
6.8% |
6.9% |
7.2% |
7.3% |
7.3% |
0.0% |
Source: Cytonn Research 2022
Gigiri and Westlands were the best performing submarkets in Q1’2022 with average rental yields of 8.8% and 8.1%, respectively, attributed to their superior locations, availability of high quality office spaces attracting prime rental prices, and, relatively good infrastructure. On the other hand, Mombasa Road recorded the least average rental yields at 5.1%, as a result of the area being popular as an industrial area hence unattractive for office investments. The table below shows the Nairobi Metropolitan Area (NMA) sub-market performance:
(All values in Kshs Unless Stated Otherwise)
|
Nairobi Metropolitan Area Commercial Office Submarket Performance Q1’2022 |
|||||||||||
|
Area |
Price (Kshs) /SQFT FY'2021 |
Rent (Kshs) /SQFT FY'2021 |
Occupancy (%) FY'2021 |
Rental Yield (%) FY'2021 |
Price (Kshs) /SQFT Q1’2022 |
Rent Kshs/ SQFT Q1’2022 |
Occupancy (%) Q1’2022 |
Rental Yield (%) Q1’2022 |
∆ in Rent |
∆ in Occupancy (% points) |
∆ in Rental Yields (% points) |
|
Gigiri |
13,500 |
119 |
81.3% |
8.6% |
13,500 |
118 |
83.3% |
8.8% |
(1.1%) |
2.0% |
0.2% |
|
Westlands |
11,972 |
104 |
75.5% |
8.1% |
11,846 |
105 |
74.5% |
8.1% |
0.7% |
(0.9%) |
0.0% |
|
Karen |
13,325 |
106 |
83.0% |
7.7% |
13,325 |
107 |
82.8% |
7.8% |
0.9% |
(0.2%) |
0.1% |
|
Parklands |
11,336 |
91 |
80.1% |
7.6% |
11,562 |
91 |
82.8% |
7.7% |
0.0% |
2.7% |
0.1% |
|
Kilimani |
12,364 |
91 |
79.8% |
7.1% |
12,440 |
91 |
80.2% |
7.1% |
0.0% |
0.4% |
0.0% |
|
Upperhill |
12,409 |
94 |
78.0% |
7.0% |
12,409 |
94 |
76.1% |
6.9% |
0.0% |
(1.9%) |
(0.1%) |
|
Nairobi CBD |
11,787 |
82 |
82.8% |
6.8% |
11,863 |
82 |
83.8% |
6.9% |
0.0% |
1.0% |
0.1% |
|
Thika Road |
12,571 |
79 |
76.3% |
5.7% |
12,571 |
78 |
77.6% |
5.7% |
(1.4%) |
1.3% |
0.0% |
|
Mombasa Road |
11,250 |
73 |
64.2% |
5.1% |
11,250 |
73 |
64.6% |
5.1% |
0.0% |
0.4% |
0.2% |
|
Average |
12,106 |
94 |
77.6% |
7.3% |
12,113 |
94 |
77.9% |
7.3% |
0.0% |
0.3% |
0.0% |
Source: Cytonn Research 2022
Notable highlight during the quarter include;
- CCI Group of companies, a business process outsourcing (BPO) provider, and, nutrition supplements distributor Max International took up approximately 60.0% of the 270,000 SQFT space at Garden City Business Park along Thika Road. For more information, see Cytonn Weekly #02/2022, and,
- Cytonn recently released its Nairobi Metropolitan Area (NMA) Commercial Office Report 2022 which was highlighting that the office market realized an improvement in its overall performance in 2021, with the average rental yields for the unserviced office spaces coming in at 7.1%, compared to the 7.0% recorded in 2020. For serviced offices, the average Y/Y rental growth came in at 0.8%, with Westlands being the best performing node. For more info, click here.
We have a NEUTRAL outlook for the NMA commercial office sector whose performance is expected to be boosted by an increase in uptake of space as various firms embark on full operations. However, the existing oversupply of space at 6.7 mn SQFT, coupled with the stagnating rental rates, is expected to weigh down performance of the sector. Investment opportunity lies in Gigiri, Westlands, and Karen which offer relatively high returns compared to the market averages.
III. Retail Sector
The retail sector performance in Q1’2022 realized a 0.1% points increase in the overall rental yields to 7.9% from the 7.8% that was recorded in FY’2021. The average rents and occupancies increased as well by 0.1% and 0.5% points, respectively, to Kshs 170 per SQFT and 77.2% in Q1’2022, from Kshs 169 per SQFT and 76.7%, respectively, in FY’2021. The improvement in performance was as a result of; i) continuous expansion by local and international retailers, ii) positive demographics driving demand for goods, retail spaces and services, iii) recognition of Kenya as a regional hub resulting to increased foreign investments in the country from retailers such as Chicken Cottage, and, iv) infrastructure developments driving retail investments in various parts of the country. The performance of the retail sector in the Nairobi Metropolitan Area over time is as shown below:
(All values in Kshs unless stated otherwise)
|
Summary of performance overtime |
||||||
|
Item |
Q1'2021 |
H1'2021 |
Q3'2021 |
FY’2021 |
Q1’2022 |
Rental Yield Change FY'2021/Q1'2022 |
|
Average Asking Rents (Kshs/SQFT) |
166 |
177 |
177 |
169 |
170 |
0.1% |
|
Average Occupancy (%) |
75.0% |
78.0% |
78.0% |
76.7% |
77.2% |
0.5% points |
|
Average Rental Yields (%) |
7.4% |
8.1% |
8.1% |
7.8% |
7.9% |
0.1% points |
Source: Cytonn Research 2022
In terms of the sub markets analysis, Karen, Kilimani and Westlands were the best performing nodes recording average rental yields of 10.0%, 9.9% and 9.5%, respectively, compared to the overall market average of 7.9%. This was mainly attributed to; i) presence of quality retail spaces fetching prime rents and yields such as Galleria, Sarit, and Yaya Centre Malls, among others, ii) presence of affluent residents with a high consumer purchasing power as the areas host high end income earners, and, iii) adequate infrastructure enhancing investments. Key to note is that Westlands realized a sharp decline of 4.0% in its overall occupancy rates as a result of additional retail space at the Global Trade Centre worth 91,419 SQFT.
Eastlands recorded the lowest yields at 5.8%, 2.1% points lower than the average market rates of 7.9%, as a result of low rental charges at Kshs 131 per SQFT against a market average of Kshs 170 Per SQFT, coupled with a stiff competition from informal retail spaces. However, key to note is that the performance is an increase from the 5.6% average yields that was realized in FY’2021, due to increased occupancy rates which came in at 73.0% in Q1’2022, a 1.4% points increase from 71.6% recorded in FY’2021.
The table below shows the submarket performance in the Nairobi Metropolitan Area (NMA):
(All values in Kshs unless stated otherwise)
|
Nairobi Metropolitan Area Retail Market Performance Q1’2022 |
||||||||||
|
Area |
Rent (Kshs) /SQFT FY'2021 |
Occupancy% FY'2021 |
Rental Yield FY'2021 |
Rent (Kshs) /SQFT Q1'2022 |
Occupancy% Q1'2022 |
Rental Yield Q1'2022 |
Q1’ 2022 ∆ in Rental Rates |
Q1’ 2022 ∆ in Occupancy (% points) |
Q1’ 2022 ∆ in Rental Yield (% points) |
|
|
Karen |
202 |
84.0% |
9.8% |
200 |
85.0% |
10.0% |
(1.5%) |
0.8% |
0.2% |
|
|
Kilimani |
183 |
86.0% |
9.8% |
183 |
86.8% |
9.9% |
0.0% |
0.8% |
0.1% |
|
|
Westlands |
213 |
78.8% |
10.0% |
214 |
72.9% |
9.5% |
4.5% |
(4.0%) |
(0.4%) |
|
|
Ngong Road |
171 |
79.0% |
7.7% |
164 |
81.0% |
8.3% |
2.1% |
2.0% |
0.6% |
|
|
Kiambu road |
180 |
75.6% |
7.9% |
179 |
77.6% |
8.1% |
(2.1%) |
1.7% |
0.2% |
|
|
Mombasa road |
148 |
75.0% |
6.8% |
146 |
78.6% |
7.0% |
(0.7%) |
3.0% |
0.2% |
|
|
Thika Road |
161 |
74.0% |
6.7% |
156 |
74.2% |
6.6% |
(2.2%) |
0.2% |
0.0% |
|
|
Satellite towns |
142 |
69.0% |
6.2% |
145 |
70.8% |
6.2% |
1.0% |
1.5% |
0.0% |
|
|
Eastlands |
133 |
71.6% |
5.6% |
131 |
73.0% |
5.8% |
(0.6%) |
1.4% |
0.2% |
|
|
Average |
169 |
76.7% |
7.8% |
170 |
77.2% |
7.9% |
0.1% |
0.8% |
0.1% |
|
Source: Cytonn Research 2022
For notable highlights during the quarter please see our Cytonn Monthly-January 2022, and Cytonn Monthly-February 2022 Reports. For the month of March 2022;
- Naivas supermarket, a local retail chain, opened its 82nd outlet at Katani, along Mombasa Road, taking up 34,299 SQFT worth of space in the area. For more analysis, please see Cytonn Weekly #11/2022,
- Simbisa Brands, Zimbabwe’s largest fast-food restaurant operator, which runs quick-service restaurants such as Chicken Inn, Pizza Inn, Bakers Inn, and Creamy Inn, announced plans to expand to 245 outlets in Kenya by June 2022 from 190 outlets as at December 2021. For more analysis, please see Cytonn Weekly #12/2022,
- Naivas supermarket, announced plans to open 3 new outlets in the next few weeks. The outlets will be located at Kiambu Mall along Kiambu Road, at Safari Center in Naivasha while the third store will be opened in Meru. For more analysis, please see Cytonn Weekly #12/2022
- During the week, Eat’N’Go Limited, an international fast food chain, announced plans to open 100 new stores in Kenya, amidst its expansion drive to open stores in various parts of Africa. The incoming outlets will be spread in various parts of Kenya beginning with Nanyuki, Kisumu, Eldoret, and Nakuru towns. The master franchisee for the Domino’s Pizza, Cold Stone Creamery, and Pinkberry Gourmet Frozen Yoghurt brands, currently has got a total of 8 outlets in Kenya; 7 in Nairobi and one in Mombasa. The move by the retailer to open the new stores in Kenya is driven by; i) a growing middle income class with a matching purchasing power, ii) stiff market competition from close rivals such as Pizza Inn, iii) positive demographics, and, iv) Kenya’s recognition as a regional hub hence attracting foreign investments, and,
- Additionally, QuickMart supermarket, a local retail chain, announced plans to open its 51st outlet at Tuskys Mall located along Lang’ata Road in Nairobi. The retailer is set to begin operations in May 2022 at a space that was previously occupied by troubled Tuskys Supermarket. Moreover, this will be the retailer’s 3rd outlet to be opened so far in 2022, with the other two having been opened in Kitengela and Machakos towns, in the months of February and March, respectively. QuickMart’s decision to open the new store is drive by i) need to step up competition from close rivals such as Naivas that has so far opened 3 new outlets in 2022, ii) increased financial muscle with Sokoni Retail Kenya having acquired a controlling stake in the retailer, iii) strategic location of the outlet along Langata Road thus promoting accessibility, and, iv) availability of prime retail space left by Tuskys. The table below shows the summary of the number of stores of the key local and international retailer supermarket chains in Kenya;
|
Main Local and International Retail Supermarket Chains |
|||||||||||
|
Name of Retailer |
Category |
Highest number of branches that have ever existed as at FY’2018 |
Highest number of branches that have ever existed as at FY’2019 |
Highest number of branches that have ever existed as at FY’2020 |
Highest number of branches that have ever existed as at FY’2021 |
Number of branches opened in 2022 |
Closed branches |
Current number of Branches |
Number of branches expected to be opened |
Projected number of branches FY’2022 |
|
|
Naivas |
Local |
46 |
61 |
69 |
79 |
3 |
0 |
82 |
3 |
85 |
|
|
QuickMart |
Local |
10 |
29 |
37 |
48 |
2 |
0 |
50 |
1 |
51 |
|
|
Chandarana |
Local |
14 |
19 |
20 |
23 |
1 |
1 |
24 |
4 |
28 |
|
|
Carrefour |
International |
6 |
7 |
9 |
16 |
0 |
0 |
16 |
0 |
16 |
|
|
Cleanshelf |
Local |
9 |
10 |
11 |
12 |
0 |
0 |
12 |
0 |
12 |
|
|
Tuskys |
Local |
53 |
64 |
64 |
3 |
0 |
61 |
3 |
0 |
3 |
|
|
Game Stores |
International |
2 |
2 |
3 |
3 |
0 |
0 |
3 |
0 |
3 |
|
|
Uchumi |
Local |
37 |
37 |
37 |
2 |
0 |
35 |
2 |
0 |
2 |
|
|
Choppies |
International |
13 |
15 |
15 |
0 |
0 |
13 |
0 |
0 |
0 |
|
|
Shoprite |
International |
2 |
4 |
4 |
0 |
0 |
4 |
0 |
0 |
0 |
|
|
Nakumatt |
Local |
65 |
65 |
65 |
0 |
0 |
65 |
0 |
0 |
0 |
|
|
Total |
|
257 |
313 |
334 |
186 |
6 |
179 |
192 |
8 |
200 |
|
Source: Online Search
We retain a NEUTRAL outlook for the retail sector with the performance expected to be mainly supported by the rapid expansion drive by local and international retailers, ii) positive demographics, and, and, iii) increased foreign investments in the country as a result of Kenya being recognized as a regional hub. However, e-commerce still being adopted by some retailers, coupled with the existing oversupply of retail spaces in the market by 3.0 mn SQFT, is expected to weigh down the overall performance of the sector. Investment opportunity lies in Karen, Kilimani, and, Westlands which offer relatively high returns compared to the market averages.
IV. Mixed Use Developments
Notable highlights during the month include;
i.CCI Group of companies, a business process outsourcing (BPO) provider, and, nutrition supplements distributor Max International took up approximately 60.0% of the 270,000 SQFT space at Garden City Business Park along Thika Road. CCI and Max International are taking up six-and-a-half floors, and, half-a-floor, respectively, at the business park with East Africa Breweries limited having being the other corporate giant that took up space at the development in November 2019. For more information, see Cytonn Weekly #02/2022.
Our outlook on Mixed-Use Developments (MUDs) is NEUTRAL supported by the impressive returns recorded at 7.2% in 2021, from 6.9% in 2020. However, their performance is expected to be weighed down by existing oversupply at 6.7 mn SQFT in the NMA commercial office market, and oversupply in the retail market at 3.0 mn SQFT in the NMA and 1.7 mn SQFT in the Kenya retail market.
V. Hospitality Sector
During Q1’2022, three Industry Reports related to the Hospitality sector were released, namely;
|
Report |
Key Take-outs |
|
Leading Economic Indicators November 2021, by the Kenya National Bureau of Statistics (KNBS) |
· International arrivals through the Jomo Kenyatta International Airport (JKIA) and Moi International Airport (MIA) increased by 5.1% to 76,706 in November 2021, from 72,809 realized in October 2021. On a YoY basis, this was a 59.3% increase from the 31,211 visitors recorded in November 2020, and, · Cement consumption increased by 4.0% to 7.5 mn metric tonnes between January and October 2021, from 7.2 mn metric tonnes realized in 2020. For more information, see Cytonn Weekly #04/2022.
|
|
Leading Economic Indicators (LEI)-December 2021, by the Kenya National Bureau of Statistics (KNBS) |
· International arrivals through the Jomo Kenyatta International Airport (JKIA) and Moi International Airport (MIA) increased by 15.2% to 90,504 in December 2021, from the 76,706 recorded the previous month, and, · The value of building plan approvals increased by 14,166.7% to Kshs 41.5 bn in Q4’2021, from the Kshs 0.3 bn realized in the similar period in 2020. For more information, see Cytonn Weekly #08/2022.
|
|
Monetary Policy Committee Hotels Survey – January 2022, by the Central Bank of Kenya |
· During the period under review, the sampled hotels indicated that they were in operation in January 2022, from November 2021, thus maintaining a 4.0% points increase to 100%, from the 96.0% operation rate in September 2021, · The average bed occupancy in the month of January 2022 averaged at 54.0%, 2.0% points higher than 52.0% recorded in the month of November 2021, and, · Local guests continued to account for majority of clientele population at 85.0% of accommodation and 81.0% restaurant services between December 2021 and Janury 2022, compared to 62.0% and 68.7%, respectively, before the COVID-19 pandemic. |
During the week, the United Kingdom (UK), issued a Travel Advisory urging its residents to desist from travelling to a number of areas in the North Eastern part of Kenya in April 2022, citing heightened threat of terrorism in parts of Kenya. The move by the UK government is expected to weigh down the performance of the tourism and hospitality sectors in general as its citizens will minimize their travel plans to cushion themselves against the terror claims despite the fact that the advisory has been issued in specific areas of the country. UK formed the 5th source market for international tourists in Kenya in H1’2021 with 16,264 visitors which was 5.3% of the total visitor arrivals at 305,635 between January and June 2021 as evidenced by the International Tourism Performance Report January to June 2021 by Tourism Research Institute of Kenya. Additionally, according to the Kenya National Bureau of Statistics(KNBS), the number of international visitors in Q4’2021 increased coming in at 240,019 hence continued Travel Advisories might have a downturn on this improvement. The graph below shows the number of international arrivals in Kenya between 2019 and 2021;
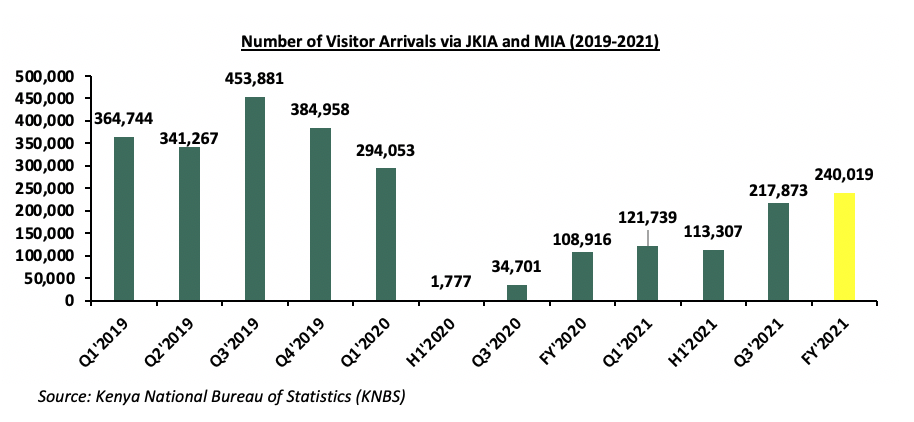
Source: Kenya National Bureau of Statistics (KNBS)
Notable highlights during Q1’2022 include;
- Global US hotel brand JW Marriott International, signed an agreement with Baraka Lodges Limited to open its first luxury safari lodge in Masai Mara, Narok County. For more information, see Cytonn Weekly #12/2022,
- Global five-star hotel brand Radisson Blu located in Nairobi Upper Hill announced plans to resume operations on 9th May 2022 following easing of the coronavirus crisis. For more information, see Cytonn Weekly #12/2022,
- Cytonn Group, under the hospitality arm of the business, launched CySuites Hospitality Management Company, a serviced apartment hotel management company, whose primary focus is optimizing operational and managerial efficiency of serviced apartments on behalf of owners as well as investors. For more information, see Cytonn Weekly #10/2022,
- The United Arab Emirate (UAE) retained Kenya in its ‘Red List’ of countries barred from visiting UAE, with other countries such as Ghana, Angola, Uganda, Guinea and Cote d’Ivoire allowed admission to the middle-eastern state in its latest review. For more information, see Cytonn 2022 Markets Outlook. However, key to note is that Kenya is currently not on the red list after having been removed by UAE on 27th January, and,
- The Kenyan government suspended all inbound and transit passenger flights from the United Arabs Emirates (UAE) for seven days effective 10th January. Additionally, the United States of America (USA), raised Kenya’s travel advisory alert from Level One to Level Three, amidst concerns of the increasing COVID-19 infections following the emergence of the Omicron variant. For more information, see Cytonn Weekly #02/2022.
We have a NEUTRAL outlook on the hospitality sector following increased international arrivals boosting tourism, improved hotel operations and occupancies. This is attributed to the mass vaccination currently underway in the country, the ambitious international marketing of Kenya as a tourist destination through the magical Kenya platform, and, positive accolades. However, the increasing Travel Advisories, and relaxation of Covid-19 measures continues to pose a risk on the performance of the sector as this may reduce international arrivals.
IV. Land Sector
The average asking rents for land in the Nairobi Metropolitan Area (NMA) recorded an overall improvement in performance in Q1’2022, with the YoY capital appreciation coming in at 2.4%. This was mainly attributed to; i) positive demographics driving demand for land, ii) improved development of infrastructure such as roads, railways, water and sewer lines, iii) proximity to amenities such as shopping malls, and, iv) increased construction activities particularly in the residential sector thus fueling demand for land. In terms of performance per node, unserviced land in the satellite towns of Nairobi recorded the highest YoY capital appreciation of 4.1% mainly due to increased demand resulting from their affordability and improved accessibility to these areas supporting demand for Real Estate investments. In support of this, the average asking prices for unserviced land came in at Kshs 12.5 mn in Q1’2022, 90.6% lower than the market average of Kshs 133.4 mn. The table below shows the overall performance of the sector during the quarter:
All Values in Kshs (mn) Unless Stated Otherwise
|
Summary of the Performance Across All regions Q1’2022 |
|||
|
Location |
Q1'2021 |
Q1'2022 |
Annualized Capital Appreciation |
|
Un-serviced land-satellite Towns |
12.0 |
12.5 |
4.1% |
|
Nairobi Suburbs- Low Rise Residential Areas |
89.9 |
93.6 |
3.9% |
|
Serviced land-Satellite Towns |
15.2 |
15.7 |
3.4% |
|
Nairobi Suburbs- High Rise Residential Areas |
134.2 |
135.1 |
0.7% |
|
Nairobi Suburbs- Commercial Areas |
410.2 |
410.1 |
0.0% |
|
Average |
132.3 |
133.4 |
2.4% |
Source: Cytonn Research 2022
Performance per node
a.In Q1’2022, unserviced land in the satellite towns of Nairobi recorded an average annualized capital appreciation of 4.1%, with prices coming in at Kshs 12.4 mn, from the Kshs 12.0 mn recorded a similar period in 2021. The improvement in performance was mainly driven by; i) affordability of land prices, ii) scarcity of land within Nairobi which in turn drive demand for land in the satellite towns, and, iii) concentration of affordable housing projects in the satellite towns thus driving demand for land. Juja was the best performing node with a YoY capital appreciation of 6.4%, attributed to; i) adequate infrastructural developments such Thika Superhighway, ii) proximity to amenities such as Juja City Mall, and, Jomo Kenyatta University, among others, and, iii) positive demographics fueling demand.
All Values in Kshs (mn) Unless Stated Otherwise
|
Satellite Towns Unserviced Land |
|||
|
Location |
Price Q1'2021 |
Price Q1'2022 |
Capital Appreciation |
|
Juja |
11.3 |
12.0 |
6.4% |
|
Athi River |
4.1 |
4.3 |
5.3% |
|
Rongai |
12.4 |
13.0 |
4.8% |
|
Limuru |
18.5 |
19.1 |
3.3% |
|
Utawala |
13.9 |
14.0 |
0.8% |
|
Average |
12.0 |
12.4 |
4.1% |
b. Land in the low rise residential areas of NMA recorded a YoY capital appreciation of 3.9% in Q1’2022, 1.5% points higher than the market average of 2.4%. These areas continue to remain attractive to investors due to; i) their serene environments, ii) privacy enhanced by the sparse population, iii) relatively affordable prices at Kshs 93.6 mn per acre compared to the high areas averaging at Kshs 135.1 mn per acre. Kitisuru was the best performing node with an average price appreciation of 7.3%, 3.4% points higher than the market average of 2.4% due to; i) ample infrastructure servicing the area such as Kitisuru Road and Waiyaki Way among others, ii) proximity to adequate amenities such as the International School of Kenya and the Two Rivers Mall among others, and, iii) strategic location as it’s connected to high end areas like Westlands, Nyari, and Runda hence attracting investments.
All Values in Kshs (mn) Unless Stated Otherwise
|
Low Rise Residential Areas |
|||
|
Location |
Price Q1'2021 |
Price Q1'2022 |
Capital Appreciation |
|
Kitisuru |
83.7 |
90.3 |
7.3% |
|
Ridgeways |
69.0 |
74.1 |
6.9% |
|
Runda |
74.8 |
77.8 |
3.8% |
|
Karen |
59.0 |
60.8 |
3.0% |
|
Spring Valley |
162.9 |
164.8 |
1.1% |
|
Average |
89.9 |
93.6 |
3.9% |
c. Serviced land in the satellite towns of Nairobi recorded an average annualized capital appreciation of 3.4% with Syokimau being the best performing area recording an average annualized capital appreciation of 15.4%. This was mainly driven by; i) strategic location along the ongoing Nairobi Expressway project promoting investments, ii) presence of the commuter train station making it easier for people to navigate various areas whilst avoiding traffic along the busy Mombasa Road, iii) relatively affordable rates at Kshs 14.5 mn per acre against the market average of Kshs 15.7 mn per acre, and iv) presence a growing middle income class driving demand for land investments. On the other hand, Ruai recorded a price correction of 6.5% attributed to reduced demand of land as investors focus on areas witnessing more Real Estate related activities, whereas it is also quite far from Nairobi CBD by approximately 30 Km.
All Values in Kshs (mn) Unless Stated Otherwise
|
Satellite Towns Serviced Land |
|||
|
Location |
Price Q1'2021 |
Price Q1'2022 |
Capital Appreciation |
|
Syokimau-Mlolongo |
12.6 |
14.5 |
15.4% |
|
Athi River |
13.2 |
14.0 |
5.8% |
|
Ruiru-Juja |
23.0 |
23.6 |
2.8% |
|
Rongai |
17.9 |
18.3 |
2.4% |
|
Thika |
11.2 |
11.2 |
0.6% |
|
Ruai |
13.1 |
12.2 |
(6.5%) |
|
Average |
15.2 |
15.7 |
3.4% |
d. The asking land prices in the high rise residential areas recorded a 0.7% annualized capital appreciation in Q1’2022, with areas within Embakasi such as Fedha and Imaara Daima being the best performing nodes with an average price appreciation of 5.2%. This was driven by; i) the affordability of land in the area, having recorded average selling prices at Kshs 74.9 mn compared to the market average of Kshs 135.1 mn, ii) close proximity of the area to major infrastructure developments such as the Nairobi Expressway, thus fueling demand, and, iii) presence of ample amenities such as the newly launched Imaara Mall. Conversely, Kileleshwa registered a 1.9% price correction attributed to reduced demands as investors continue to explore more affordable land options with an acre averaging at Kshs 295.4 mn, 54.3% higher than the market average of Kshs 135.1 mn per acre.
All Values in Kshs (mn) Unless Stated Otherwise
|
High Rise Residential Areas |
|||
|
Location |
Price Q1'2021 |
Price Q1'2022 |
Capital Appreciation |
|
Embakasi |
71.0 |
74.9 |
5.2% |
|
Kasarani |
68.1 |
70.6 |
3.5% |
|
Dagoretti |
96.4 |
99.7 |
3.3% |
|
Kileleshwa |
301.1 |
295.4 |
(1.9%) |
|
Average |
134.2 |
135.1 |
0.7% |
e. Land in the commercial zones realized a slight price correction of 0.02% in their asking prices which came in at Kshs 410.1 mn in Q1’2022, from the Kshs 410.2 mn that was recorded in Q1’2021. Westlands was the best performing node with a capital appreciation of 0.6% due to an increased demand driven by its close proximity to the Nairobi CBD, and, infrastructure developments such as the Nairobi Expressway promoting accessibility. On the other hand, Upper hill realized a price correction of 1.2% due to declined demand resulting from land in the area being expensive, with an acre averaging at Kshs 483.1 mn, 17.8% higher than the market average of Kshs 410.1 mn per acre.
All Values in Kshs (mn) unless Stated Otherwise
|
Nairobi Metropolitan Area Commercial Zones |
|||
|
Location |
Price Q1'2021 |
Price Q1'2022 |
Capital Appreciation |
|
Westlands |
415.4 |
417.8 |
0.6% |
|
Riverside |
348.3 |
350.0 |
0.5% |
|
Kilimani |
388.4 |
389.7 |
0.3% |
|
Upperhill |
488.8 |
483.1 |
(1.2%) |
|
Average |
410.2 |
410.1 |
0.0% |
Source: Cytonn Research
The land sector in Nairobi Metropolitan Area has proven to be a reliable investment avenue and has shown resilience throughout the years despite economic downturns. This is evidenced by a 2.4% YoY capital appreciation recorded this quarter. We therefore retain a POSITIVE outlook for the sector whilst expecting a similar trend to continue being witnessed throughout the year driven by; i) government’s focus on establishing infrastructure developments thus promoting demand for land, ii) increased focus on the Affordable Housing projects fuelling the need for more land, iii) positive demographics, and, iv) government’s efforts towards ensuring efficient land transactions, with the digitization of the land records in the Nairobi County expected to be completed in June 2022.
Notable highlights during the quarter include;
- The national government through the Kenya Railways Corporation announced plans to revamp select dilapidated railway lines in the country namely; i) 217.0Km Nakuru-Kisumu Meter Gauge Railway (MGR), ii) 77.8Km Gilgil-Nyahururu MGR line, and, iii) 69.1Km Kisumu-Butere railway line, at a cost of Kshs 4.5 bn. For more information, see Cytonn Monthly-January 2022,
- The National Government announced that it had begun the documentation process for the dualing of the 40 Km Mtwapa-Kilifi Road. For more information, see Cytonn Weekly #04/2022, and,
- The government of Kenya through the Kenya Rural Roads Authority (KERRA) announced that it has begun upgrading to Bitumen Standards the Mago-Mululu - Wangulu (E240) & Lusui - Vokoli (E293) Roads. The two projects are approximately 20 Kms and are estimated to cost Kshs 1.1 bn. For more information, see our Cytonn 2022 Markets Outlook report.
We expect continued construction, revamp, and completion of various projects in the infrastructure sector due to government’s aggressive focus to implement and conclude projects through various strategies such as; i) issuing of infrastructure bonds to raise funds for construction, ii) initiating project partnerships such as Pubic Private Partnerships, and, iii) priority in the YoY budget allocations.
VII.Industrial Sector
During the quarter, Grit Real Estate Income Group, a Mauritius based Real Estate Investment Company, completed the purchase of Orbit Products Africa, a warehouse and manufacturing facility located in Machakos County, at a cost of Kshs 6.1 bn. This comes after the investment firm entered a Kshs 2.9 bn loan agreement with the International Finance Corporation (IFC) in July 2021, with an aim of acquiring and developing the warehousing and manufacturing facility. For more information, see Cytonn Weekly #11/2022.
We expect Kenya’s industrial sector to continue realizing growth and development activities supported by; i) Kenya being recognized as a regional hub hence attracting investments, ii) expansion of local and international retailers seeking storage space for goods, and, iii) government focus on the Big 4 Agenda on manufacturing which is expected to influence demand for warehouses used to manufacture products, iv) improvement of infrastructure, for instance Standard Gauge Railway project which is expected to increase the output of Special Economic Zones, and, iv) e-commerce driving demand for warehouse spaces.
VIII. Listed Real Estate
In the Nairobi Stock Exchange, ILAM Fahari I-REIT closed the week trading at an average price of Kshs 5.9 per share. This represented a 1.7% and 7.8% Week-to-Date (WTD) and Year-to-Date (YTD) decline, respectively, from Kshs 6.0 per share and Kshs 6.4 per share, respectively. On an Inception-to-Date (ITD) basis, the REIT’s performance continues to be weighed down having realized a 70.5% decline from Kshs 20.0. In the Unquoted Securities Platform, as at 25th March 2022, the Acorn D-REIT traded at Kshs 20.2 per unit with a turnover of Kshs 11.7 mn while the I-REIT traded at Kshs 20.6 per unit with a turnover of Kshs 43.3 mn. This performance represented a 1.0% and 3.0% gain for the D-REIT and I-REIT, respectively, from the Kshs 20.0 Inception price. The graph below shows Fahari I-REIT’s performance from November 2015 to February 2022;
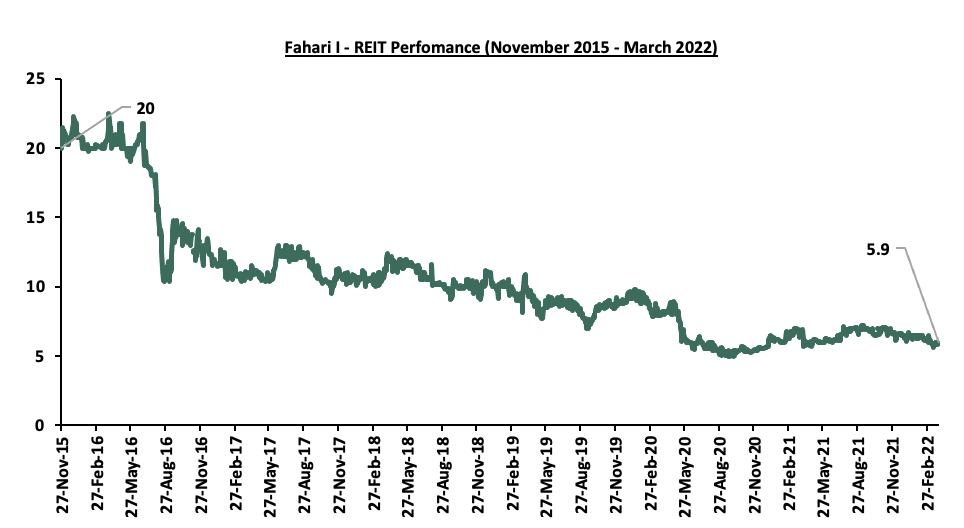
Our outlook on the REIT market is NEGATIVE. The Kenyan REIT market performance continues to be weighed down by factors such as; i) a general lack of knowledge on the financing instrument, ii) general lack of interest of the REIT by investors, iii) regulatory obstacles such as high minimum investment amount at Kshs 5.0 mn for the D-REIT, high minimum capital for REIT Trustees of Kshs. 100 million compared to Kshs. 10 million for pension trustees leading to only 3 trustees who are all banks, and, iv) lengthy approval processes to get all the necessary requirements thus discouraging those interested in investing in it.
REITs Performance – FY’2021
During the week, ILAM Fahari I-REIT, Acorn D-REIT and Acorn I-REIT released their FY’2021 earnings, highlighting mixed fortunes as the Acorn D-REIT and I-REIT recorded profits of Kshs 775.9 mn and Kshs 387.5 mn, respectively in FY’2021, while ILAM Fahari I-REIT recorded a loss of Kshs Kshs 124.0 mn in FY’2021 down from a profit of Kshs 148.0 mn in FY’2020.
The table below includes a summary of the three REIT’s performance in FY’2021:
|
Balance Sheet Items (Kshs bn) |
Acorn I-REIT FY’2021 |
Acorn D-REIT FY’2021 |
ILAM Fahari I-REIT FY’2021 |
ILAM Fahari I-REIT FY’2020 |
ILAM Y/Y Change (%) |
|
Total Assets |
3.8 |
8.4 |
3.7 |
3.9 |
(4.4%) |
|
Total Liabilities |
0.2 |
3.2 |
0.2 |
0.1 |
56.8% |
|
Total Unitholders’ Funds |
3.6 |
5.2 |
3.5 |
3.8 |
(6.2%) |
|
Income Statement Items (Kshs bn) |
|
|
|
|
|
|
Rental Income |
0.3 |
0.1 |
0.30 |
0.34 |
(12.8%) |
|
Total Operating Income |
0.4 |
0.1 |
0.30 |
0.35 |
(13.8%) |
|
Total Operating Expenses |
(0.2) |
(0.4) |
(0.2) |
(0.2) |
0.0% |
|
Investments Property Revaluation Gain/(Loss) |
0.1 |
1.1 |
(0.2) |
0.01 |
(1,760.7%) |
|
Profit/ (Loss) |
0.4 |
0.8 |
0.2 |
(0.1) |
(183.7%) |
|
Basic EPS |
2.3 |
3.5 |
(0.7) |
0.8 |
(183.7%) |
|
Ratios Summary (%) |
|
|
|
|
|
|
ROA |
10.3% |
9.9% |
(3.3%) |
3.8% |
(7.2%) points |
|
ROE |
10.8% |
14.8 |
(3.5%) |
3.9% |
(7.4% points |
|
Debt Ratio |
4.7% |
37.9% |
4.6% |
3.9% |
1.8% points |
|
PBT Margin |
87.6% |
67.7% |
(41.4%) |
42.6% |
84.0% points |
|
Rental Yield |
11.4% |
10.0% |
9.1% |
9.8% |
(0.7%) points |
|
Distribution Per Unit -Kshs (Subject to Approval) |
1.02 |
- |
0.5 |
0.6 |
0.1 |
|
Distribution Yield |
4.9% |
- |
8.5% |
10.2% |
(1.7%) points |
|
Distribution Pay-out Ratio |
93.5% |
- |
88.7% |
80.8% |
7.9% points |
Key Take outs:
ILAM Fahari I-REIT
- Earnings per unit declined by 183.7% to Kshs (0.7) in FY’2021, from Kshs 0.8 in FY’2020 as the ILAM Fahari I-REIT recorded a loss of Kshs 124.0 mn compared to a profit of Kshs 148.0 mn in FY’2020. The performance was mainly attributable to revaluation losses recorded by the property portfolio in the context of the COVID-19 pandemic, whose impact continues to be a material valuation uncertainty in the short to medium term, particularly in the retail space. This was coupled by a 18.2% decline in total operating income to Kshs 299.6 mn, from Kshs 324.5 mn in FY’2020,
- Rental income declined by 12.8% to Kshs 297.5 mn in FY’2021, from Kshs 341.2 mn in FY’2020. This was attributable to an increased vacancy at Greenspan Mall resulting from Naivas, the new anchor tenant, taking up a smaller space of 37.0% of the (GLA) compared to that previously occupied by Tuskys that occupied 48.0% of the GLA contributing up to 40.0% of the rental income collected. The loss of Tuskys not only resulted in a direct loss of revenue but also occasioned reduced footfall in the mall and low collections from the rest of the tenants, and,
- Total assets reduced by 4.4% to Kshs 3.7 bn in FY’2021 from Kshs 3.9 bn in FY’2020, driven by a 6.4% decrease in investment property to Kshs 3.3 bn from Kshs 3.5 bn in FY’2020 coupled with an 8.6% decline in property and equipment to Kshs 13.3 bn from Kshs 14.5 bn in FY’2020
Acorn D-REIT and I-REIT
- Acorn D-REIT recorded profits of Kshs 775.9 mn in FY’2021 while the I-REIT profits came in at Kshs 387.5 mn. The D-REIT Performance was mainly driven by the Kshs 339.0 mn a positive adjustment in the fair value of Investment Property to Kshs 1.1 bn
- Total assets for the I-REIT in FY’2021 stood at Kshs 3.8 bn, representing an increase of 6.8% from Kshs 3.5 bn in H1’2021, driven by a 138.8% increase in amounts due from related parties to Kshs 96.5 mn in FY’2021, from Kshs (248.8 mn) in H1’2021. The D-REIT assets stood at Kshs 8.4 bn in FY’2021, with the assets mainly in investment properties, and,
- Assets under the two REITs recorded relatively high occupancy rates averaging at 84.1% in FY’2021, compared to other Real Estate sectors such as the Commercial Office, and Retail sectors which recorded occupancy rates of 77.9% and 76.8%, respectively during the same period.
For a more comprehensive analysis, please see our ILAM Fahari I-REIT FY’2021 Earnings Note and Acorn Holdings FY’2021 Earnings Note.
Weekly Highlight:
During the week, Acorn Holdings announced plans to raise Kshs 3.2 from the Capital Markets through debut issuance of two supplementary offers which will be open to both new and existing investors with the I-REIT targeting Kshs 2.8 bn while the balance of Kshs 400.0 mn will be for the D-REIT. The money raised in the D-REIT will enable it to acquire more land, and also continue development of existing projects which include student accommodation facilities under the Qwetu and Qejani Brands, while that raised in the I-REIT, will be used to acquire two new properties in the next six months. Additionally, the firm announced that investors can expect an interim dividend pay-out at about 80.0%-90.0% of earnings as standard policy, which will be paid out twice a year in order build confidence in the asset class.
Real Estate Performance Summary and Outlook
Below is a summary of the sectorial performance in Q1’2022 and investment opportunities:
|
Theme |
Thematic Performance and Outlook Q1’2022 |
Outlook |
|
Residential |
· Apartments registered relatively higher average total returns to investors at 6.0% compared to detached markets at 5.4%, while price appreciations recorded an uptick at 0.6% and 1.2%, respectively owing to improved property transactions amid the recovering economy |
Neutral |
|
· We expect total returns to investors to improve supported by improved rental rates and capital appreciation of properties · The investment opportunity for apartments lies in areas such as Waiyaki Way, Westlands, and Ruaka which continued to post high returns. For detached units, opportunity lies in submarkets such as Redhill, Syokimau, Ngong and Rosslyn |
||
|
Office |
· The commercial office sector retained its average rental yields and asking rents at 7.3% and Kshs 94 per SQFT, respectively, in Q1’2022 · We expect performance to be boosted by an increase in uptake of space as various firms embark on full operations. However, the existing oversupply of space at 6.7 mn SQFT, coupled with the stagnating rental rates, is expected to weigh down performance of the sector |
Neutral |
|
· Investment opportunity lies in Gigiri, Westlands, and Karen which offer relatively high returns compared to the market averages |
||
|
Retail |
· The sector’s performance in Q1’2022 realized a 0.1% points increase in the overall rental yields to 7.9% from the 7.8% that was recorded in FY’2021 |
Neutral |
|
· We expect performance to be mainly supported by the rapid expansion drive by local and international retailers, positive demographics, and, increased foreign investments in the country as a result of Kenya being recognized as a regional hub. However, e-commerce still being adopted by some retailers, coupled with the existing oversupply of retail spaces in the market by 3.0 mn SQFT, is expected to weigh down the overall performance of the sector · Investment opportunity In terms of the sub markets performance lies in Karen, Kilimani, and, Westlands which were the best performing nodes with average rental yields of 10.0%, 9.9% and 9.5%, compared to the market average of 7.9% |
||
|
Hospitality |
· The hospitality sector has been on a recovery path following increased international arrivals boosting tourism, and, improved hotel operations and occupancies. This is attributed to the mass vaccination currently underway in the country and the ambitious international marketing of Kenya as a tourist destination |
Neutral |
|
· We expect the hospitality sector to be affected by the increasing Travel Advisories, and relaxation of Covid-19 measures posing a risk on the performance of tourism industry as this may reduce international arrivals |
||
|
Land |
· The land sector in Nairobi Metropolitan Area has proven to be a reliable investment avenue and has shown resilience throughout the years despite economic downturns. This is evidenced by a 2.7% YoY capital appreciation recorded this quarter |
Positive |
|
· We expect performance of the sector to be driven by; i) government’s focus on establishing infrastructure developments thus promoting demand for land, ii) increased focus on the Affordable Housing projects fueling the need for more land, iii) positive demographics, and, iv) government’s efforts towards ensuring efficient land transactions, with the digitization of the land records in the Nairobi County expected to be completed in June 2022 |
||
|
Listed Real Estate |
· The Fahari I-REIT closed the quarter trading at Kshs 5.9, representing a 7.8% Year-to-Date (YTD) decline per having opened the year trading at Kshs 6.4 per share. The share price remains low compared to Net Asset Value of the REIT at Kshs 19.6 having lost 70.5% from its initial trading price of Kshs 20.0 in November 2015. |
Negative |
Disclaimer: The views expressed in this publication are those of the writers where particulars are not warranted. This publication, which is in compliance with Section 2 of the Capital Markets Authority Act Cap 485A, is meant for general information only and is not a warranty, representation, advice or solicitation of any nature. Readers are advised in all circumstances to seek the advice of a registered investment advisor.

- Talk to us
- Kenya
- P.O Box 20695 - 00200, Nairobi, Kenya
- Cell +254709101200
- Tel +254709101200
- WhatsApp +254741676635
- United States
- +254709101200
- DOWNLOAD OUR APP
-


- Kenya
- 8th Floor, Pinetree Plaza, Kaburu Drive, Ngong Road, Nairobi, Kenya
- USA
- Suite 1150, 1775 Eye Street NW, USA, Washington DC 20006, USA
- Investments
- High Yield
- Private Equity
- Real Estate
- Real Estate
- RiverRun Estates
- Cytonn Towers
- The Ridge
- Taraji Heights
- The Alma