Regulatory response to Real Estate Funds in Kenya during COVID-19, & Cytonn Weekly #34/2021
By Research Team, Aug 29, 2021
Executive Summary
Fixed Income
During the week, T-bills were undersubscribed, with the overall subscription rate coming in at 36.5%, a decline from the 118.2% recorded the previous week attributable to the tightened liquidity in the market as evidenced by the interbank rate increasing by 0.6% points. The 364-day paper recorded the highest subscription rate, receiving bids worth Kshs 5.0 bn against the offered Kshs 10.0 bn, translating to a subscription rate of 49.6%, an increase from the 10.0% recorded the previous week. Investors’ continued interest in the 364-day paper during the week is mainly attributable to investors’ hunt for higher yields and longer tenors. The yields on the 91-day, 182-day and 364-day papers increased by 14.2 bps, 9.1 bps and 7.2 bps to 6.7%, 7.2% and 7.6%, respectively.
We are projecting the y/y inflation rate for August 2021 to remain within the range of 6.2% - 6.6%, driven by stable food prices and the additional tariffs and taxes introduced in 2021;
Equities
During the week, the equities market was on an upward trajectory, with NASI gaining by 0.5% while NSE 20 and NSE 25 both gained by 0.9%, taking their YTD performance to gains of 23.1%, 20.0% and 8.6% for NASI, NSE 25 and NSE 20, respectively. The equities market performance was mainly driven by gains recorded by banking stocks such as ABSA, Standard Chartered Bank Kenya and Equity Group, which gained by 8.4%, 3.9% and 3.3%, respectively. The gains were however weighed down by stocks such as NCBA and Bamburi which declined by 2.4% and 1.9%, respectively. During the week, HF Group, Diamond Trust Bank Kenya (DTB-K), Standard Chartered Bank Kenya (SCBK), and ABSA Bank Kenya released their H1’2021 financial results, recording a (17.4%), 20.1%, 37.5%, and 846.0% increase in their Core earnings per share respectively. Additionally, KCB Group announced that it had completed the 62.1% stake acquisition of Banque Populaire du Rwanda Plc (BPR), after receiving all the required regulatory approvals.
During the week, the Cabinet Secretary for the National Treasury and Planning, through the Capital Markets Authority (CMA), recently published two draft regulations; the Capital Markets (Collective Investment Schemes) Regulations 2021 and the Capital Markets (Collective Investment Schemes) (Alternative Investment Funds) Regulations 2021. The draft regulations have been published with the aim of seeking comments from stakeholders and the general public by 24th September 2021;
Real Estate
During the week, Stima Savings and Credit Cooperative (SACCO) Limited launched its Affordable Housing Mortgage Scheme in partnership with the Kenya Mortgage Refinance Company (KMRC), a treasury backed lender, targeting both individuals in formal and informal employment. In the retail sector, French retailer Carrefour, opened an outlet at Southfield Mall in Embakasi Nairobi, taking up about 32,000 SQFT of retail space on two floors previously occupied by Choppies Supermarket. On statutory reviews, the government of Kenya, through the Ministry of Lands and Physical Planning, published the Draft National Land Surveying and Mapping Policy, 2021 to guide the practice of land surveying and mapping in various sectors of the economy;
Focus of the Week
The Coronavirus pandemic (COVID-19), which began as a health crisis, morphed into a global economic crisis as a result of containment measures put in place worldwide to curb the spread of the virus, bringing the global economy to a standstill. Stakeholders from different sectors therefore responded by providing measures to cushion people and businesses from the negative effects of the pandemic. In this week’s focus, we seek to discuss the regulatory response to real estate funds in Kenya in the midst of the COVID-19 pandemic;
Investment Updates:
- Weekly Rates:
- Cytonn Money Market Fund closed the week at a yield of 10.63%. To invest, just dial *809#;
- Cytonn High Yield Fund closed the week at a yield of 15.57% p.a. To invest, email us at sales@cytonn.com and to withdraw the interest you just dial *809#;
- We continue to offer Wealth Management Training daily, from 9:00 am to 11:00 am, through our Cytonn Foundation. The training aims to grow financial literacy among the general public. To register for any of our Wealth Management Trainings, click here;
- If interested in our Private Wealth Management Training for your employees or investment group, please get in touch with us through wmt@cytonn.com;
- Cytonn Insurance Agency acts as an intermediary for those looking to secure their assets and loved ones’ future through insurance namely; Motor, Medical, Life, Property, WIBA, Credit and Fire and Burglary insurance covers. For assistance, get in touch with us through insuranceagency@cytonn.com;
- Cytonnaire Savings and Credit Co-operative Society Limited (SACCO) provides a savings and investments avenue to help you in your financial planning journey. To enjoy competitive investment returns, kindly get in touch with us through clientservices@cytonn.com;
Money Markets, T-Bills & T-Bonds Primary Auction:
During the week, T-bills were undersubscribed, with the overall subscription rate coming in at 36.5%, a decline from the 118.2% recorded the previous week attributable to the tightened liquidity in the market as evidenced by the interbank rate increasing by 0.6% points to 3.5% from 2.9% recorded the previous week. The 364-day paper recorded the highest subscription rate, receiving bids worth Kshs 5.0 bn against the offered Kshs 10.0 bn, translating to a subscription rate of 49.6%, an increase from the 10.0% recorded the previous week. The renewed interest in the 364-day paper is mainly attributable to investors’ hunt for higher yields. The subscription rate for the 182-day and the 91-day papers declined to 20.2% and 44.2%, from 152.3% and 118.2% recorded the previous week, respectively. The yields on the 91-day, 182-day and 364-day papers increased by 14.2 bps, 9.1 bps and 7.2 bps to 6.7%, 7.2% and 7.6%, respectively. The government continued to reject expensive bids by accepting Kshs 7.8 bn out of the Kshs 8.8 bn of bids received, translating to an acceptance of 89.4%.
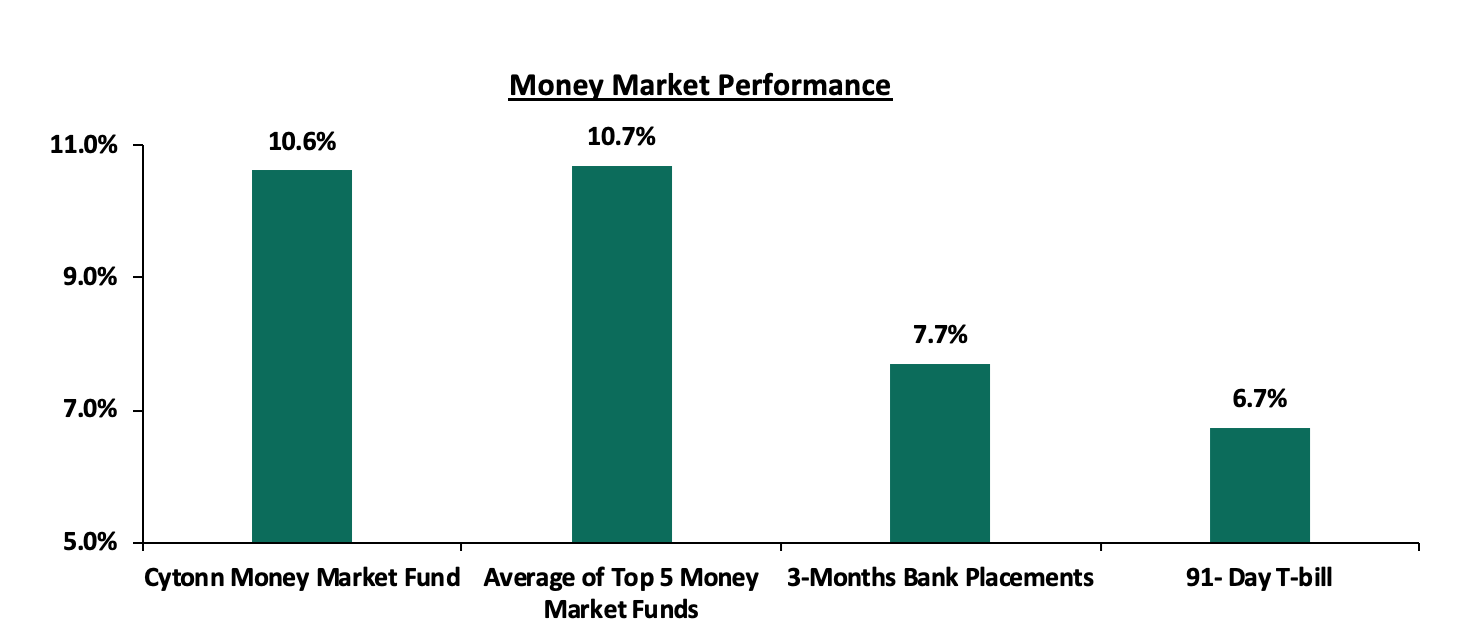
In the money markets, 3-month bank placements ended the week at 7.7% (based on what we have been offered by various banks), while the yield on the 91-day T-bill increased by 14.2 bps to 6.7%. The average yield of the Top 5 Money Market Funds increased by 0.9% points to 10.7% from 9.8% recorded the previous week. The yield on the Cytonn Money Market Fund declined by 0.1% points to 10.6%, from 10.7% recorded last week.
The table below shows the Money Market Fund Yields for Kenyan Fund Managers as published on 27th August 2021:
|
Money Market Fund Yield for Fund Managers as published on 27 August 2021 |
|||
|
Rank |
Fund Manager |
Daily Yield |
Effective Annual Rate |
|
1 |
Cytonn Money Market Fund |
10.10% |
10.63% |
|
2 |
Nabo Africa Money Market Fund |
9.52% |
9.95% |
|
3 |
Zimele Money Market Fund |
9.56% |
9.91% |
|
4 |
Madison Money Market Fund |
8.92% |
9.33% |
|
5 |
Sanlam Money Market Fund |
8.74% |
9.14% |
|
6 |
CIC Money Market Fund |
8.69% |
8.99% |
|
7 |
Apollo Money Market Fund |
9.10% |
8.95% |
|
8 |
Dry Associates Money Market Fund |
8.36% |
8.69% |
|
9 |
GenCapHela Imara Money Market Fund |
8.32% |
8.68% |
|
10 |
Co-op Money Market Fund |
8.19% |
8.54% |
|
11 |
Orient Kasha Money Market Fund |
8.18% |
8.50% |
|
12 |
British-American Money Market Fund |
8.14% |
8.48% |
|
13 |
ICEA Lion Money Market Fund |
8.01% |
8.36% |
|
14 |
NCBA Money Market Fund |
8.02% |
8.33% |
|
15 |
Old Mutual Money Market Fund |
6.97% |
7.20% |
|
16 |
AA Kenya Shillings Fund |
6.58% |
6.78% |
Liquidity:
During the week, liquidity in the money markets tightened, with the average interbank rate increasing by 0.6% points to 3.5% from 2.9% recorded the previous week, partly attributable to tax remittances and bond outflows which offset government payments. The average interbank volumes declined by 21.9% to Kshs 7.5 bn, from Kshs 9.6 bn recorded the previous week.
Kenya Eurobonds:
During the week, the yields on Eurobonds remained relatively unchanged, with the yields on the 10-year bond issued in 2014, 30-year bond issued in 2018, the 7-year bond issued in 2019, the 12-year bond issued in 2019, and, the 12-year bond issued in 2021 remaining unchanged at 3.1%, 7.3%, 4.8%, 6.2%, and 6.1%, respectively. On the other hand, the yield on the 10-year bond issued in 2018, declined by 0.1% points to 5.2% from 5.3% recorded the previous week. Below is a summary of the performance:
|
Kenya Eurobond Performance |
||||||
|
|
2014 |
2018 |
2019 |
2021 |
||
|
Date |
10-year issue |
10-year issue |
30-year issue |
7-year issue |
12-year issue |
12-year issue |
|
31-Dec-20 |
3.9% |
5.2% |
7.0% |
4.9% |
5.9% |
- |
|
30-Jul-21 |
3.3% |
5.2% |
7.3% |
4.6% |
6.2% |
6.2% |
|
20-Aug-21 |
3.1% |
5.3% |
7.3% |
4.8% |
6.2% |
6.1% |
|
23-Aug-21 |
3.2% |
5.3% |
7.3% |
4.8% |
6.2% |
6.1% |
|
24-Aug-21 |
3.1% |
5.2% |
7.0% |
4.8% |
6.2% |
6.1% |
|
25-Aug-21 |
3.1% |
5.2% |
7.3% |
4.8% |
6.2% |
6.1% |
|
26-Aug-21 |
3.1% |
5.2% |
7.3% |
4.8% |
6.2% |
6.1% |
|
27-Aug-21 |
3.1% |
5.2% |
7.3% |
4.8% |
6.2% |
6.1% |
|
Weekly Change |
0.0% |
(0.1%) |
0.0% |
0.0% |
0.0% |
0.0% |
|
MTD Change |
(0.2%) |
(0.2%) |
(0.1%) |
0.0% |
0.0% |
(0.1%) |
|
YTD Change |
(3.6%) |
0.0% |
0.3% |
0.0% |
0.3% |
- |
Source: Reuters
Kenya Shilling:
During the week, the Kenyan shilling depreciated by 0.2% against the US dollar to close the week at Kshs 109.8, from Kshs 109.5 recorded the previous week, mainly attributable to increased dollar demand from commodity and the energy sector importers which outweighed the supply of dollars from exporters. On a YTD basis, the shilling has depreciated by 0.6% against the dollar, in comparison to the 7.7% depreciation recorded in 2020. We expect the shilling to remain under pressure for the remainder of 2021 as a result of:
- Rising uncertainties in the global market due to the Coronavirus pandemic, which has seen investors continue to prefer holding their investments in dollars and other hard currencies and commodities,
- The widened current account position which increased by 0.2% points to 5.4% of GDP in the 12 months to June 2021 from 5.2% of GDP for a similar period in 2020, and,
- Demand from energy importers as they beef up their hard currency positions.
The shilling is however expected to be supported by:
- The Forex reserves, currently at USD 9.0 bn (equivalent to 5.5 months of import cover), which is above the statutory requirement of maintaining at least 4.0 months of import cover, and the EAC region’s convergence criteria of 4.5-months of import cover, and,
- Improving diaspora remittances evidenced by a 14.7% y/y increase to USD 372.6 mn in July 2021, from USD 317.8 mn recorded over the same period in 2020, which has continued to cushion the shilling against further depreciation.
Weekly Highlight
I. August Inflation Projection
We are projecting the y/y inflation rate for August 2021 to remain within the range of 6.2% - 6.6%. The key drivers being:
- The stable fuel prices in the period mid-August to mid-September 2021,
- Food prices have remained relatively stable during the month given the favorable weather and an improvement in agricultural output,
- Upward readjustment of the fuel cost charge (FCC) for electricity bills in August to Kshs 3.8 per Kilowatt hour (KWh) from Kshs 3.3 per Kilowatt hour (KWh) in July. The readjustment will increase the cost of electricity consumption for households, and,
- Upward readjustment of the domestic use water tariffs to Kshs 5.0 per cubic meter from Kshs 0.5 per cubic meter to Kshs 5.0 per cubic meter. The readjustment will increase the cost of water bills for households.
Going forward, we expect the inflation rate to remain within the government set range of 2.5% - 7.5%, even though there remains concerns on the impact of the recent increase in tariffs and taxes. Additionally, we expect the government will employ measures to manage the cost of items so as to be within the terms of the IMF Credit facility agreement entered into in February 2021, which gave conditions for a target inflation. There is also a risk of high inflation from the recently issued communication by KRA on inflation adjustment on Specific Rates of Excise Duty effective 1st October 2021. The new rates are expected to cause an upward pressure on the inflation rate in the coming months, as the burden will be passed to the consumers.
Rates in the fixed income market have remained relatively stable due to the high liquidity in the money markets, coupled with the discipline by the government as they reject expensive bids. The government is 40.8% ahead its prorated borrowing target of Kshs 114.0 bn having borrowed Kshs 160.5 bn in FY’2021/2022. We expect a gradual economic recovery going into FY’2021/2022 as evidenced by KRA collecting Kshs 1.7 tn in FY’2020/2021, a 3.9% increase from Kshs 1.6 tn collected in the prior fiscal year. However, despite the projected high budget deficit of 7.5% and the lower credit rating from S&P Global to 'B' from 'B+', we believe that the monetary support from the IMF and World Bank will mean that the interest rate environment may stabilize since the government will not be desperate for cash.
Markets Performance
During the week, the equities market was on an upward trajectory, with NASI gaining by 0.5% while NSE 20 and NSE 25 both gained by 0.9%, taking their YTD performance to gains of 23.1%, 20.0% and 8.6% for NASI, NSE 25 and NSE 20, respectively. The equities market performance was mainly driven by gains recorded by banking stocks such as ABSA, Standard Chartered Bank Kenya and Equity Group, which gained by 8.4%, 3.9% and 3.3%, respectively. The gains were however weighed down by stocks such as NCBA and Bamburi, which declined by 2.4% and 1.9%, respectively.
During the week, equities turnover reduced by 48.5% to USD 21.5 mn, from USD 41.7 mn recorded the previous week, taking the YTD turnover to USD 826.3 mn. Foreign investors remained net buyers, with a net buying position of USD 5.1 mn, from a net buying position of USD 7.7 mn recorded the previous week, taking the YTD net selling position to USD 9.4 mn.
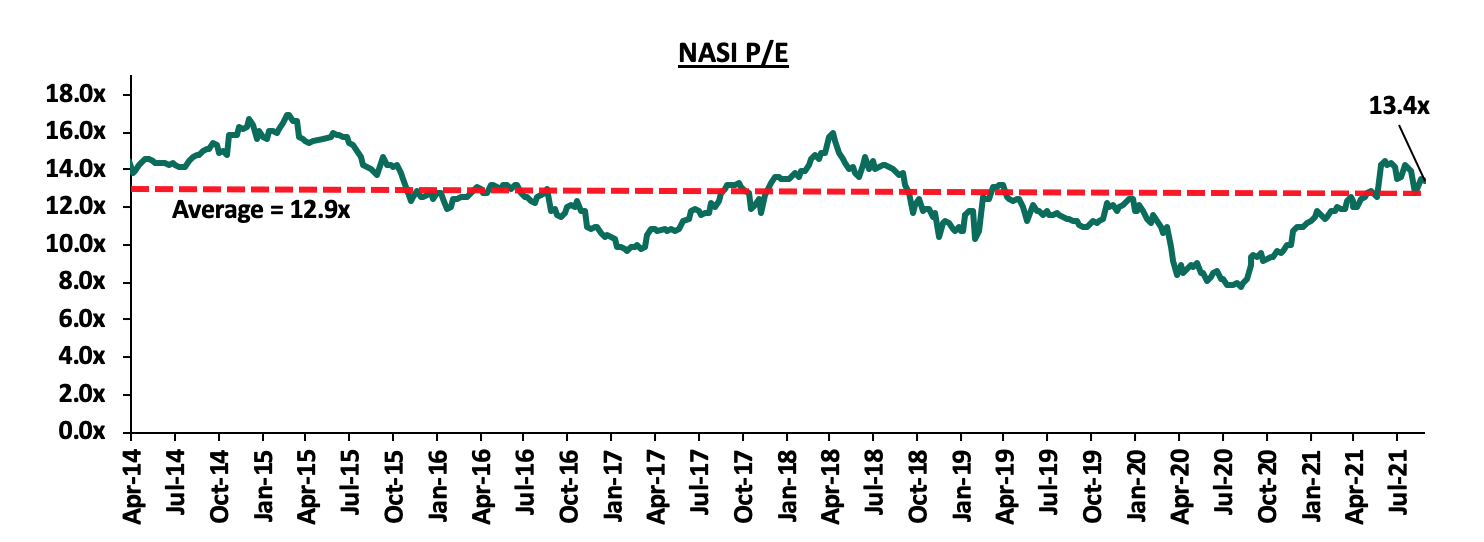
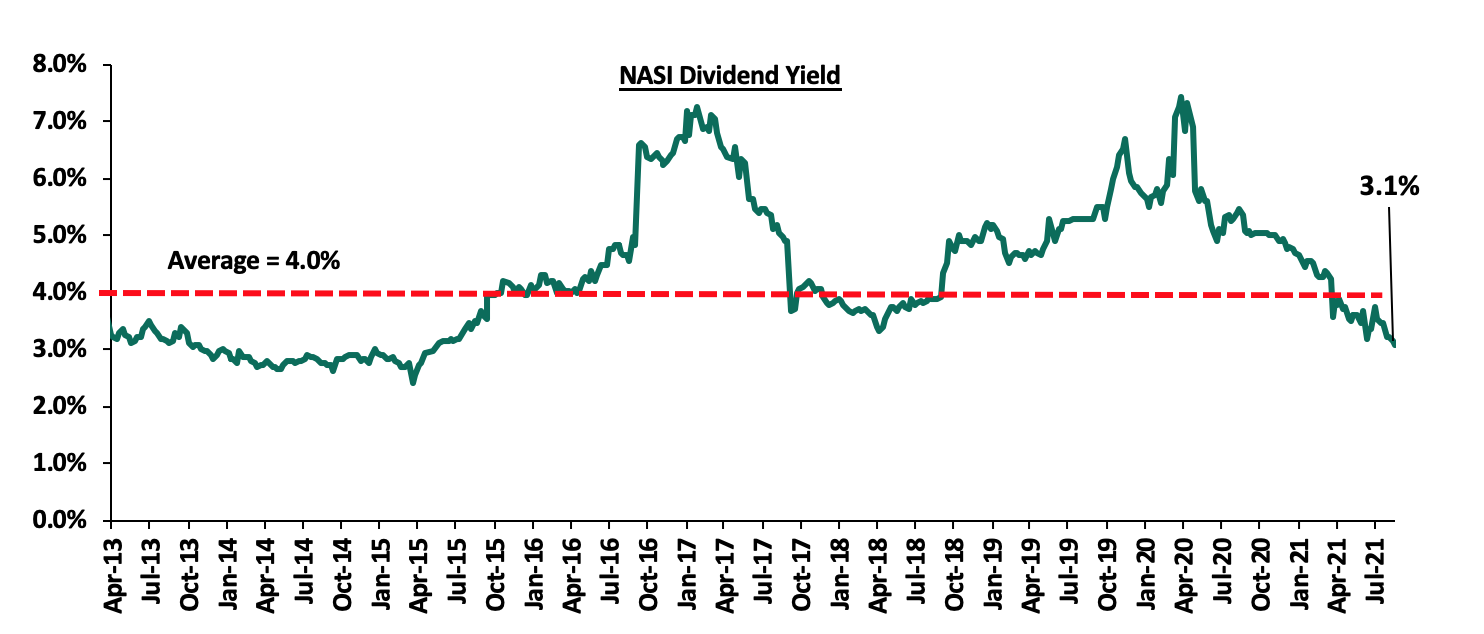
The market is currently trading at a price to earnings ratio (P/E) of 13.4x, 3.8% above the historical average of 12.9x, and a dividend yield of 3.1%, 0.9% points below the historical average of 4.0%. Key to note, NASI’s PEG ratio currently stands at 1.5x, an indication that the market is trading at a premium to its future earnings growth. Basically, a PEG ratio greater than 1.0x indicates the market may be overvalued while a PEG ratio less than 1.0x indicates that the market is undervalued. Excluding Safaricom, which is currently 61.7% of the market, the market is trading at a P/E ratio of 12.2x and a PEG ratio of 1.4x. The current P/E valuation of 13.4x is 74.3% above the most recent trough valuation of 7.7x experienced in the first week of August 2020. The charts below indicate the historical P/E and dividend yields of the market.
Weekly Highlight
I. KCB Group’s acquisition of Banque Populaire du Rwanda (BPR)
During the week, KCB Group announced that it had completed the 62.1% acquisition of Banque Populaire du Rwanda Plc (BPR), after receiving all the required regulatory approvals. As highlighted in our Cytonn Weekly #29/2021 and Cytonn Weekly #19/2021, KCB Group agreed to purchase 62.1% stake in BPR from Atlas Mara Limited using a Price to Book Value (P/Bv) of 1.1x. According to the latest BPR financials released as of June 2021, the bank had a book value of Rwf 52.9 bn (Kshs 5.8 bn), and thus at the trading multiple of 1.1x, we expect KCB Group to have spent an estimated Kshs 6.3 bn to acquire BPR Rwanda. The valuation of 1.1x P/Bv is lower than the 7-year average which is at 1.3x P/Bv, but higher than the last one-year average, which is at 0.7x P/Bv and the average P/Bv in the listed banking stocks of 1.0x as of Q1’2021. Additionally, KCB Group will take over 135 branches from BPR, taking its total branches to 489, from 354 branches as of June 2021. Below is a table showing the combined pro-forma financials for the banks:
|
Combined Pro forma Balance Sheet (Kshs bn) |
|||
|
Balance Sheet |
KCB Group H1'2021 |
BPR Rwanda H1’2021 |
Combined Entity |
|
Net Loans |
607.0 |
20.3 |
627.3 |
|
Total Assets |
1,022.2 |
44.3 |
1,066.5 |
|
Customer Deposits |
786.0 |
26.3 |
812.3 |
|
Number of Branches |
354 |
135 |
489 |
The acquisition will enhance KCB’s footprint in the region, which is in line with the group’s ‘Beyond Banking Strategy’ which is aimed at tapping into new growth opportunities regionally. Rwanda presents an ideal growth opportunity for KCB, with only about 36.0% of adults in Rwanda using banking services according to Finscope Rwanda 2020, compared to 41.0% in Kenya. Furthermore, Rwanda's banking sector's asset quality is superior to Kenya's, with an average NPL ratio of 6.2% over the last five years and 4.5% in FY'2020, compared to the average NPL ratio of 14.1% recorded by Kenya's banking sector and 14.8% recorded by KCB Group in FY'2020. Key to note, KCB Group disclosed in the announcement that it plans on merging its Rwandan subsidiary, KCB Bank Rwanda with BPR, and the merged entity shall be named BPR Bank.
Below is a summary of the deals in the last 7-years that have either happened, been announced or expected to be concluded:
|
Acquirer |
Bank Acquired |
Book Value at Acquisition (Kshs bn) |
Transaction Stake |
Transaction Value (Kshs bn) |
P/Bv Multiple |
Date |
|
I&M Holdings PLC |
Orient Bank Limited Uganda |
3.3 |
90.0% |
3.6 |
1.1x |
April-21 |
|
KCB Group |
Banque Populaire du Rwanda, and, ABC Tanzania |
5.3 (Banque Populaire du Rwanda, only. ABC Tanzania financials unknown) |
100.0% |
6.3 |
1.1x |
Acquisition of BPR Rwanda – August 2021, Nov-20* |
|
Co-operative Bank |
Jamii Bora Bank |
3.4 |
90.0% |
1 |
0.3x |
Aug-20 |
|
Commercial International Bank |
Mayfair Bank Limited |
1 |
51.0% |
Undisclosed |
N/D |
May-20* |
|
Access Bank PLC (Nigeria) |
Transnational Bank PLC. |
1.9 |
100.0% |
1.4 |
0.7x |
Feb-20* |
|
Equity Group ** |
Banque Commerciale Du Congo |
8.9 |
66.5% |
10.3 |
1.2x |
Nov-19* |
|
KCB Group |
National Bank of Kenya |
7 |
100.0% |
6.6 |
0.9x |
Sep-19 |
|
CBA Group |
NIC Group |
33.5 |
53%:47% |
23 |
0.7x |
Sep-19 |
|
Oiko Credit |
Credit Bank |
3 |
22.8% |
1 |
1.5x |
Aug-19 |
|
CBA Group** |
Jamii Bora Bank |
3.4 |
100.0% |
1.4 |
0.4x |
Jan-19 |
|
AfricInvest Azure |
Prime Bank |
21.2 |
24.2% |
5.1 |
1.0x |
Jan-18 |
|
KCB Group |
Imperial Bank |
Unknown |
Undisclosed |
Undisclosed |
N/A |
Dec-18 |
|
SBM Bank Kenya |
Chase Bank Ltd |
Unknown |
75.0% |
Undisclosed |
N/A |
Aug-18 |
|
DTBK |
Habib Bank Kenya |
2.4 |
100.0% |
1.8 |
0.8x |
Mar-17 |
|
SBM Holdings |
Fidelity Commercial Bank |
1.8 |
100.0% |
2.8 |
1.6x |
Nov-16 |
|
M Bank |
Oriental Commercial Bank |
1.8 |
51.0% |
1.3 |
1.4x |
Jun-16 |
|
I&M Holdings |
Giro Commercial Bank |
3 |
100.0% |
5 |
1.7x |
Jun-16 |
|
Mwalimu SACCO |
Equatorial Commercial Bank |
1.2 |
75.0% |
2.6 |
2.3x |
Mar-15 |
|
Centum |
K-Rep Bank |
2.1 |
66.0% |
2.5 |
1.8x |
Jul-14 |
|
GT Bank |
Fina Bank Group |
3.9 |
70.0% |
8.6 |
3.2x |
Nov-13 |
|
Average |
|
|
76.7% |
|
1.3x |
|
|
* Announcement Date ** Deals that were dropped |
||||||
1. Alternative Investment Funds Regulations
During the week, the Cabinet Secretary for the National Treasury and Planning, through the Capital Markets Authority (CMA), recently published two draft regulations; the Capital Markets (Collective Investment Schemes) Regulations 2021 and the Capital Markets (Collective Investment Schemes) (Alternative Investment Funds) Regulations 2021. The proposed regulations seek to update the current Collective Investment Scheme regulations given the change in market dynamics since the last published Regulations in 2001, as well as address emerging issues. The draft regulations have been published with the aim of seeking comments from the stakeholders and the general public by 24th September 2021.
The Alternative Investment Funds’ (AIFs) regulations seek to create a regulatory environment for privately pooled funds whose investors seek higher returns by investing in alternative asset classes. As per the draft regulations, an Alternative Investment Fund is a Collective Investment Scheme formed as a trust, limited liability partnership or a company, which acts as a privately pooled investment vehicle for two or more investors. Retirement funds, family trusts, employee schemes and holding schemes, however, cannot be deemed as or apply to become an alternative investment fund. Some of the key proposed AIF regulations include:
- An AIF fund may only raise funds through private placement by issue of a placement memorandum. The placement memorandum must however be filed with the Authority at least 30 days prior to the launch of the AIF,
- The maximum number of investors in an AIF shall be 20 investors,
- The minimum investment by an investor in an AIF should be at least Kshs 1.0 mn,
- The minimum value of an AIF’s assets at any time should be at least Kshs 10.0 mn,
- Investment guidelines;
- An AIF may invest in the following classes: (a) debt funds, (b) equity and equity linked investments, (c) hedge funds, and, (d) infrastructure funds,
- An AIF that has been granted registration for specific assets class(es) cannot change such asset class(es) except with the approval of the Authority,
- If an AIF has property whose value is over Kshs 1.0 mn, the fund manager should appoint a trustee or depositary registered with the Authority for the safekeeping of property,
- AIFs shall be required to undertake valuations of their investments, at least once in every 6 months, by an independent valuer, and,
- All AIFs shall be required to disclose to the investors at intervals not longer than a quarter of a year the value of assets held,
- The fund manager, where applicable, shall have a continuing interest in the AIF of not less than 2.5% of the scheme property or Kshs 1.0 million, whichever is lower, in the form of investment in the AIF and such interest shall not be through the waiver of management fees, and,
- The minimum tenure of an AIF shall be 3 years and shall have the option of extending the set tenure by up to 2 years. The extension must however be approved by at least of two-thirds of the investors.
The move by the Capital Markets Authority (CMA) to create regulations providing for creation and oversight of Alternative Investment Funds is a welcome move, and goes to show the merit of the numerous private offers that have always provided a home for sophisticated investors with a higher risk appetite. The regulations, if passed, may serve to deepen the capital markets even further especially for high net-worth investors who prefer regulated products but have a higher risk appetite as well. We, however, believe that the capping of maximum investors to 20 will limit the uptake of these funds and it’s not clear what is the rationale for 20 investors when there are already alternative funds in the market allowed to take up to 15,000 investors. Further, it’s not clear how the funds will be at once regulated and also private, and how this ties into Section 21 of the Capital Markets (Securities) (Public Offers, Listings and Disclosures) Regulation, 2002. Larger funds with more investors serve to boost investor confidence and limiting the number of investors will likely lead to creation of unnecessarily many AIFs or see continued preference for private offers as opposed to the regulated AIFs. Our detailed analysis of the two draft regulations shall be published in the coming month.
Earnings Releases
During the week, Standard Chartered Bank Kenya (SCBK), Diamond Trust Bank Kenya (DTB-K), ABSA Bank, and HF Group released their H1’2021 financial results. Below is a summary of their performance;
I. Diamond Trust Bank Kenya (DTB-K)
|
Diamond Trust Bank (DTB-K) H1’2021 Key Highlights |
|||
|
Balance Sheet |
|||
|
Balance Sheet items (Kshs bn) |
H1’2020 |
H1’2021 |
y/y change |
|
Government Securities |
132.5 |
158.6 |
19.7% |
|
Net Loans and Advances |
201.5 |
204.3 |
1.4% |
|
Total Assets |
388.3 |
429.6 |
10.6% |
|
Customer Deposits |
280.4 |
313.8 |
11.9% |
|
Deposits Per Branch |
2.1 |
2.3 |
11.9% |
|
Total Liabilities |
321.1 |
357.4 |
11.3% |
|
Shareholders’ Funds |
61.0 |
65.4 |
7.1% |
|
Income Statement |
|||
|
Income Statement Items (Kshs bn) |
H1’2020 |
H1’2021 |
y/y change |
|
Net Interest Income |
9.3 |
9.8 |
5.7% |
|
Net non-Interest Income |
3.2 |
3.3 |
5.5% |
|
Total Operating income |
12.4 |
13.1 |
5.6% |
|
Loan Loss provision |
1.9 |
2.3 |
23.9% |
|
Total Operating expenses |
8.0 |
8.3 |
3.7% |
|
Profit before tax |
4.5 |
4.9 |
8.8% |
|
Profit after tax |
2.6 |
3.2 |
20.1% |
|
Core EPS |
9.4 |
11.3 |
20.1% |
|
Key Ratios |
|||
|
Ratios |
H1’2020 |
H1’2021 |
% point change |
|
Yield from interest-earning assets |
9.7% |
8.9% |
(0.8%) |
|
Cost of funding |
4.4% |
4.0% |
(0.3%) |
|
Net Interest Margin |
5.6% |
5.2% |
(0.4%) |
|
Non- Performing Loans (NPL) Ratio |
8.3% |
10.4% |
2.1% |
|
NPL Coverage |
51.2% |
41.8% |
(9.4%) |
|
Cost to Income with LLP |
64.1% |
62.9% |
(1.2%) |
|
Loan to Deposit Ratio |
71.9% |
65.1% |
(6.7%) |
|
Return on average assets |
1.5% |
1.0% |
(0.5%) |
|
Return on average equity |
9.8% |
6.4% |
(3.4%) |
|
Equity to Assets |
15.7% |
15.2% |
(0.5%) |
|
Capital Adequacy Ratios |
|||
|
Ratios |
H1’2020 |
H1’2021 |
% point change |
|
Core Capital/Total Liabilities |
23.4% |
22.5% |
(0.9%) |
|
Minimum Statutory ratio |
8.0% |
8.0% |
0.0% |
|
Excess |
15.4% |
14.5% |
(0.9%) |
|
Core Capital/Total Risk Weighted Assets |
19.3% |
21.3% |
2.0% |
|
Minimum Statutory ratio |
10.5% |
10.5% |
0.0% |
|
Excess |
8.8% |
10.8% |
2.0% |
|
Total Capital/Total Risk Weighted Assets |
21.0% |
22.8% |
1.8% |
|
Minimum Statutory ratio |
14.5% |
14.5% |
0.0% |
|
Excess |
6.5% |
8.3% |
1.8% |
- The bank’s core earnings per share increased by 20.1% to Kshs 11.3, from Kshs 9.4 in H1’2020, lower than our expectations of a 25.7% increase to Kshs 11.8. The growth was driven by the 5.6% increase in total operating income, which outpaced the 3.7% increase in total operating expenses to Kshs 8.3 bn from Kshs 8.0 bn in H1’2020,
- Interest income increased by 5.7% to Kshs 16.7 bn, from Kshs 15.8 bn in H1’2020 driven by a 16.8% increase in interest income from government securities to Kshs 7.2 bn from Kshs 6.2 bn in H1’2020, coupled with a 25.6% increase in Interest income from deposit placements to Kshs 75.4 mn, from Kshs 60.0 mn in H1’2020,
- The Yield on Interest-Earning Assets declined to 8.9% from 9.7% in H1’2020, attributable to a 1.0% decline in trailing interest income, coupled with an 8.2% increase in average interest-earning assets to Kshs 360.9 bn, from Kshs 333.5 bn in H1’2020. Trailing Interest Income refers to the performance of the interest income for the past 12 consecutive months,
- Interest expense rose by 5.7% to Kshs 6.9 bn, from Kshs 6.5 bn in H1’2020, following a 9.3% increase in interest expense on customer deposits to Kshs 6.1 bn, from Kshs 5.6 bn in H1’2020. The increase was however mitigated by a 35.2% decline in interest expense on placement liabilities to Kshs 231.4 mn, from Kshs 357.0 mn in H1’2020, coupled with a 3.8% decline in other interest expenses to Kshs 572.3 mn, from Kshs 595.0 mn in H1’2020. Cost of funds declined by 0.4% points to 4.0% from 4.4% in H1’2020, owing to the 0.9% decline in trailing interest expenses, coupled with a 7.2% growth in average interest-bearing liabilities, an indication that the bank was able to mobilize cheaper deposits. Trailing interest expense refers to the performance of the interest expense for the past 12 consecutive months,
- Total operating income increased by 5.6% to Kshs 13.1 bn, from Kshs 12.4 bn in H1’2020 mainly driven by a 5.7% increase in the Net Interest Income (NII) to Kshs 9.8 bn, from Kshs 9.3 bn in H1’2020, coupled with a 5.5% increase in Non-Funded Income (NFI) to Kshs 3.3 bn, from Kshs 3.2 bn in H1’2020,
- The balance sheet recorded an expansion as Total Assets increased by 10.6% to Kshs 429.6 bn, from Kshs 388.3 bn recorded in H1’2020. This growth was largely driven by a 19.7% increase in government securities to Kshs 158.6 bn, from Kshs 132.5 bn in H1’2020, coupled with a 1.4% growth in net loans to Kshs 204.3 bn, from Kshs 201.5 bn in H1’2020,
- Total liabilities grew by 11.3% to Kshs 357.4 bn, from Kshs 321.1 bn in H1’2020, driven by a 22.8% increase in borrowings to Kshs 20.9 bn, from Kshs 17.1 bn in H1’2020, following the additional debts the bank acquired to finance its operations and boost liquidity in H1’2021, coupled with an 11.9% increase in customer deposits to Kshs 313.8 bn from Kshs 280.4 bn in H1’2020,
- Deposits per branch increased by 11.9% to Kshs 2.3 bn from Kshs 2.1 bn, as the number of branches remained unchanged at 134 in H1’2021,
- Gross Non-Performing Loans (NPLs) rose by 26.6% to Kshs 22.2 bn in H1’2021, from Kshs 17.5 bn recorded in H1’2020. Consequently, the NPL ratio rose to 10.4% from 8.3% recorded in H1’2020, due to the faster 26.6% growth in gross NPLs which outpaced the 1.4% growth in gross loans,
- General Loan Loss Provisions increased by 41.0% to Kshs 8.7 bn from Kshs 6.2 bn in H1’2020. On the other hand, the NPL coverage (having added interest in suspense) decreased to 41.8% in H1’2021, from 51.2% in H1’2020, owing to the 79.9% decline in interest in suspense, and,
- Diamond Trust Bank is currently sufficiently capitalized with a core capital to risk-weighted assets ratio of 21.3%, 10.8% points above the statutory requirement. In addition, the total capital to risk-weighted assets ratio was 22.8%, exceeding the 14.5% statutory requirement by 8.3% points. Adjusting for IFRS 9, the core capital to risk-weighted assets stood at 21.7%, while total capital to risk-weighted assets came in at 23.2%.
For a comprehensive analysis, please see our Diamond Trust Bank (DTB-K) H1’2021 Earnings Note
II. ABSA
|
ABSA Bank Kenya H1’2021 Key Highlights |
|||
|
Balance Sheet |
|||
|
Balance Sheet Items (Kshs bn) |
H1'2020 |
H1'2021 |
y/y change |
|
Government Securities |
133.9 |
121.3 |
(9.4%) |
|
Net Loans and Advances |
201.9 |
218.9 |
8.4% |
|
Total Assets |
391.9 |
398.2 |
1.6% |
|
Customer Deposits |
248.7 |
263.9 |
6.1% |
|
Deposits per branch |
3.0 |
3.1 |
4.9% |
|
Total Liabilities |
348.9 |
346.2 |
(0.8%) |
|
Shareholder's Funds |
43.0 |
52.0 |
20.9% |
|
Income Statement |
|||
|
Income Statement Items (Kshs bn) |
H1'2020 |
H1'2021 |
y/y change |
|
Net Interest Income |
11.3 |
12.0 |
6.1% |
|
Net non-Interest Income |
5.5 |
5.8 |
6.1% |
|
Total Operating income |
16.8 |
17.8 |
6.1% |
|
Loan Loss provision |
(5.4) |
(1.9) |
(63.9%) |
|
Total Operating expenses |
(13.6) |
(9.9) |
(27.0%) |
|
Profit before tax |
3.3 |
7.9 |
143.8% |
|
Profit after tax |
0.6 |
5.6 |
846.0% |
|
Core EPS |
0.1 |
1.0 |
846.0% |
|
Key Ratios |
|||
|
Income statement ratios |
H1'2020 |
H1'2021 |
% Points change |
|
Yield from interest-earning assets |
9.7% |
9.2% |
(0.5%) |
|
Cost of funding |
3.1% |
2.8% |
(0.3%) |
|
Net Interest Margin |
7.3% |
7.0% |
(0.3%) |
|
Non-Performing Loans (NPL) Ratio |
8.0% |
7.9% |
(0.1%) |
|
NPL Coverage |
63.6% |
70.9% |
7.3% |
|
Cost to Income With LLP |
80.6% |
55.5% |
(25.1%) |
|
Loan to Deposit Ratio |
81.2% |
82.9% |
1.7% |
|
Cost to Income Without LLP |
48.6% |
44.6% |
(4.0%) |
|
Return on average equity |
9.8% |
19.3% |
9.5% |
|
Return on average assets |
1.1% |
2.3% |
1.2% |
|
Equity to assets |
11.0% |
13.1% |
2.1% |
|
Capital Adequacy Ratios |
H1'2020 |
H1'2021 |
% Points change |
|
Core Capital/Total Liabilities |
16.2% |
17.7% |
1.5% |
|
Minimum Statutory ratio |
8.0% |
8.0% |
0.0% |
|
Excess |
8.2% |
9.7% |
1.5% |
|
Core Capital/Total Risk Weighted Assets |
13.8% |
14.7% |
0.9% |
|
Minimum Statutory ratio |
10.5% |
10.5% |
0.0% |
|
Excess |
3.3% |
4.2% |
0.9% |
|
Total Capital/Total Risk Weighted Assets |
16.5% |
17.3% |
0.8% |
|
Minimum Statutory ratio |
14.5% |
14.5% |
0.0% |
|
Excess |
2.0% |
2.8% |
0.8% |
Key take-outs from the earnings release include;
- Core earnings per share increased by 846.0% to Kshs 1.0, from Kshs 0.1 in H1’2020, not in line with our expectation of an increase to Kshs 0.3. The performance was driven by a 6.1% increase in Net Interest Income to Kshs 12.0 bn, from Kshs 11.3 bn recorded in H1’2020 and the decrease in the Loan Loss Provisions by 63.9% which lead to the total expenses decreasing by 27.0%,
- Interest income declined by 0.8% to Kshs 15.2 bn, from Kshs 15.3 bn in H1’2020, attributable to the 5.1% decline in interest income from government securities to Kshs 4.1 bn, from Kshs 4.3 bn in H1’2020 coupled with a 35.9% decline in interest income from placements to Kshs 80.2 mn, from Kshs 125.0 mn in H1’2020. The decline was however mitigated by a 1.3% increase in Interest income from Loans and Advances to Kshs 11.0 bn from Kshs 10.9 bn in H1’2020,
- The Yield on Interest-Earning Assets declined to 9.2%, from 9.7% in H1’2020, attributable to the faster 6.3% y/y increase in average interest earning assets to Kshs 342.2 bn, from Kshs 321.9 bn in H1’2020 that outpaced the 0.5% growth in trailing interest income,
- Interest expenses declined by 20.4% to Kshs 3.2 bn, from Kshs 4.0 bn in H1’2020, following a 74.7% decline in interest expense on placement liabilities to Kshs 0.2 bn, from Kshs 0.7 bn in H1’2020, coupled with a 7.4% decline in interest expense on customer deposits to Kshs 2.9 bn, from Kshs 3.2 bn in H1’2020. Cost of funds declined marginally by 0.3% points to 2.8%, from 3.1% in H1’2020, owing to a 6.7% growth in average interest bearing liabilities, against a 6.1% decline in trailing interest expense,
- Total operating expenses declined by 27.0% to Kshs 9.9 bn, from Kshs 13.6 bn in H1’2020, largely driven by a 63.9% decline in Loan Loss Provisions (LLP) to Kshs 1.9 bn in H1’2021, from Kshs 5.4 bn in H1’2020. However, the LLP increased 39.3% q/q from Kshs 1.3 bn in Q1’2021. The decline in operating expenses was also supported by a 12.0% decline in staff costs to Kshs 4.4 bn in H1’2021, from Kshs 5.0 bn in H1’2020,
- The balance sheet recorded an expansion as total assets rose by 1.6% to Kshs 398.2 bn, from Kshs 391.9 bn in H1’2020. This growth was largely driven by an 8.4% growth in the loan book to Kshs 218.9 bn, from Kshs 201.9 bn in H1’2020, coupled with a 54.5% increase in Placements due from other banking institutions to Kshs 5.1 bn, from Kshs 3.3 bn in H1’2020. The growth was however weighed down by a 9.4% decline in government securities to Kshs 121.3 bn, from Kshs 133.9 bn in H1’2020,
- Total liabilities declined by 0.8% to Kshs 346.2 bn, from Kshs 348.9 bn in H1’2020, driven by a 19.6% decline in other liabilities to Kshs 75.6 bn from Kshs 94.0 bn in H1’2020. On the other hand, customer deposits increased by 6.1% to Kshs 263.9 bn, from Kshs 248.7 bn in H1’2020,
- Deposits per branch increased by 4.9% to Kshs 3.1 bn, from Kshs 3.0 bn in H1’2020, with the number of branches having increased to 85 in H1’2021, from 84 in H1’2020,
- Gross Non-Performing Loans (NPLs) increased by 7.8% to Kshs 18.3 bn from Kshs 17.0 recorded in H1’2020. The NPL ratio improved to 7.9% in H1’2021, from 8.0% in H1’2020, owing to the faster 9.0% growth in gross loans (after adding back interest suspense), which outpaced the 7.8% growth in gross NPLs. General Loan Loss Provisions rose by 26.4% to Kshs 10.6 bn, from Kshs 8.4 bn in H1’2020,
- The NPL coverage increased to 70.9% in H1’2021, from 63.6% in H1’2020, owing to the 26.4% increase in General Loan Loss Provisions, which outpaced the 7.8% growth in gross non-performing loans, and,
- ABSA Bank Kenya is currently sufficiently capitalized with a core capital to risk-weighted assets ratio of 14.7%, 4.2% points above the 10.5% statutory requirement. In addition, the total capital to risk-weighted assets ratio was 17.3%, exceeding the 14.5% statutory requirement by 2.8% points. Adjusting for IFRS 9, the core capital to risk weighted assets stood at 14.8%, while total capital to risk-weighted assets came in at 17.4%.
For a comprehensive analysis, please see our ABSA Bank H1’2021 Earnings Note
III. Standard Chartered Bank Kenya
|
Standard Chartered Bank Kenya H1’2021 Key Highlights |
|||
|
Balance Sheet |
|||
|
Balance Sheet Items (Kshs bn) |
H1'2020 |
H1'2021 |
y/y change |
|
Net loans |
134.3 |
130.3 |
(3.0%) |
|
Total Assets |
327.2 |
345.6 |
5.6% |
|
Customer Deposits |
256.5 |
278.2 |
8.5% |
|
Deposits per branch |
7.7 |
7.1 |
8.5% |
|
Total Liabilities |
275.5 |
293.9 |
6.7% |
|
Shareholder's Funds |
51.7 |
51.7 |
0.0% |
|
Income Statement |
|||
|
Income Statement (Kshs bn) |
H1'2020 |
H1'2021 |
y/y change |
|
Net Interest Income |
9.4 |
9.1 |
(3.0%) |
|
Net non-Interest Income |
4.4 |
5.0 |
13.5% |
|
Total Operating income |
13.8 |
14.1 |
2.3% |
|
Loan Loss provision |
1.6 |
0.6 |
(60.7%) |
|
Total Operating expenses |
8.7 |
7.3 |
(15.8%) |
|
Profit before tax |
5.1 |
6.8 |
33.1% |
|
Profit after tax |
3.2 |
4.9 |
50.9% |
|
Core EPS (Kshs) |
9.4 |
12.9 |
37.5% |
|
Key Ratios |
|||
|
Ratios |
H1'2020 |
H1'2021 |
y/y % points change |
|
Yield from interest-earning assets |
8.8% |
7.7% |
(1.1%) |
|
Cost of funding |
2.2% |
1.5% |
(0.7%) |
|
Net Interest Margin |
6.9% |
6.4% |
(0.5%) |
|
Non- Performing Loans (NPL) Ratio |
13.9% |
15.1% |
1.2% |
|
NPL Coverage |
78.2% |
80.1% |
1.9% |
|
Cost to Income with LLP |
63.0% |
51.8% |
(11.2%) |
|
Loan to Deposit Ratio |
52.4% |
46.8% |
(5.6%) |
|
Return on average assets |
2.2% |
2.1% |
(0.1%) |
|
Return on average equity |
13.7% |
13.7% |
0.0% |
|
Equity to Assets |
15.8% |
15.0% |
(0.8%) |
|
Capital Adequacy Ratios |
|||
|
Ratios |
H1'2020 |
H1'2021 |
% point change |
|
Core Capital/Total Liabilities |
15.6% |
15.1% |
(0.5%) |
|
Minimum Statutory ratio |
8.0% |
8.0% |
0.0% |
|
Excess |
7.6% |
7.1% |
(0.5%) |
|
Core Capital/Total Risk Weighted Assets |
15.8% |
15.9% |
0.1% |
|
Minimum Statutory ratio |
10.5% |
10.5% |
0.0% |
|
Excess |
5.3% |
5.4% |
0.1% |
|
Total Capital/Total Risk Weighted Assets |
18.4% |
18.3% |
(0.1%) |
|
Minimum Statutory ratio |
14.5% |
14.5% |
0.0% |
|
Excess |
3.9% |
3.8% |
(0.1%) |
Key take-outs from the earnings release include;
- Core Earnings Per Share (EPS) increased by 37.5% to Kshs 12.9, from Kshs 9.4 recorded in H1’2020, not in line with our projections of a 18.5% increase to Kshs 11.2. The increase was mainly driven by a 15.8% decline in total operating expenses to Kshs 7.3 bn, from Kshs 8.7 bn recorded in H1’2020, coupled with a 2.3% increase in total operating income to Kshs 14.1 bn, from Kshs 13.8 bn recorded in H1’2020,
- Interest income declined by 7.5% to Kshs 11.0 bn, from Kshs 11.9 bn in H1’2020 driven by a 9.6% decline in interest income on loans and advances to Kshs 5.7 bn, from Kshs 6.3 bn in H1’2020, coupled with a 2.8% decline in interest income from government securities to Kshs 4.6 bn, from Kshs 4.8 bn in H1’2020. The decline in interest income was however mitigated by a 5.1% growth in interest income from deposits and placements with banking institutions to Kshs 0.72 bn, from Kshs 0.69 bn in H1’2020
- The Yield on Interest-Earning Assets (YIEA), declined to 7.7%, from 8.8% in H1’2020, attributable to a 6.7% decline in the trailing interest income, coupled with the 6.5% growth in the average interest-earning assets,
- Interest expense declined by 24.5% to Kshs 1.9 bn, from Kshs 2.5 bn in H1’2020, following a 24.9% decline in interest expense on customer deposits to Kshs 1.7 bn, from Kshs 2.3 bn in H1’2020, coupled with a 21.9% decline in other interest expenses to Kshs 0.1 bn, from Kshs 0.2 bn in H1’2020. Cost of funds consequently declined by 0.7% points to 1.5%, from 2.2% in H1’2020, owing to the 26.7% decline in the trailing interest expense, coupled with a 9.7% growth in average interest-bearing liabilities,
- Total operating income rose by 2.3% to Kshs 14.1 bn, from Kshs 13.8 bn recorded in H1’2020. This was driven by a 13.5% increase in Non-Funded Income (NFI) to Kshs 5.0 bn, from Kshs 4.4 bn in H1’2020. The increase was however weighed down by a 3.0% decline in Net Interest Income (NII) to Kshs 9.1 bn, from Kshs 9.4 bn in H1’2020,
- The balance sheet recorded an expansion as total assets grew by 5.6% to Kshs 345.6 bn, from Kshs 327.2 bn in H1’2020. This growth was largely driven by a 50.6% increase in placements from banking institutions to Kshs 70.9 bn, from Kshs 47.1 bn in H1’2020. The loan book, however, decreased by 3.0% to Kshs 130.3 bn, from Kshs 134.3 bn recorded in H1’2020, indicating the bank’s risk averseness and hesitancy to lend due to the credit risks involved,
- Total liabilities rose by 6.7% to Kshs 293.9 bn, from Kshs 275.5 bn in H1’2020, driven by an 8.5% increase in customer deposits to Kshs 278.2 bn, from Kshs 256.5 bn in H1’2020. Placements, however, declined by 74.2% to Kshs 0.6 bn in H1’2021, from Kshs 2.3 bn in H1’2020,
- Deposits per branch rose by 8.5% to Kshs 7.7 bn, from Kshs 7.1 bn in H1’2020 with the number of branches remaining unchanged at 36,
- Gross Non-Performing Loans (NPLs) increased by 6.9% to Kshs 22.3 bn in H1’2021, from Kshs 20.9 bn recorded in H1’2020. Consequently, the NPL ratio rose to 15.1%, from 13.9% recorded in H1’2020. The asset quality deterioration is attributable to the 6.9% growth in Gross Non-Performing Loans (NPLs), coupled with a 1.7% decline in gross loans,
- General Loan Loss Provisions increased by 8.8% to Kshs 8.8 bn, from Kshs 8.1 bn in H1’2020. The NPL coverage thus increased to 80.1%, from 78.2% in H1’2020, as the provisions (after adding back interest in suspense) increased by 9.5% in H1’2021, outpacing the 6.9% rise in the Gross Non-Performing Loans during the same period. The increase in the NPL Coverage to 80.1% in H1’2021, from 78.2% in H1’2020, suggests sufficient provisioning, and,
- Standard Chartered is currently sufficiently capitalized with a core capital to risk-weighted assets ratio of 15.9%, 5.4% points above the statutory requirement. In addition, the total capital to risk-weighted assets ratio was 18.3%, exceeding the statutory requirement by 3.8% points. Adjusting for IFRS 9, the core capital to risk-weighted assets stood at 15.9% while total capital to risk-weighted assets came in at 18.3%.
For a comprehensive analysis, please see our Standard Chartered Bank Kenya H1’2021 Earnings Note
IV. HF Group
|
HF Group H1’2021 Key Highlights |
|||
|
Balance Sheet |
|||
|
Balance Sheet items (Kshs bn) |
H1'2020 |
H1'2021 |
y/y change |
|
Net loans |
38.2 |
35.3 |
(7.5%) |
|
Total Assets |
56.5 |
53.0 |
(6.2%) |
|
Customer Deposits |
39.2 |
37.8 |
(3.5%) |
|
Deposits per branch |
1.8 |
1.7 |
(3.5%) |
|
Total Liabilities |
46.7 |
44.8 |
(4.1%) |
|
Shareholder's Funds |
9.9 |
8.2 |
(17.3%) |
|
Income Statement |
|||
|
Income Statement Items (Kshs bn) |
H1'2020 |
H1'2021 |
y/y change |
|
Net Interest Income |
1.0 |
0.9 |
(6.8%) |
|
Net non-Interest Income |
0.3 |
0.3 |
13.8% |
|
Total Operating income |
1.3 |
1.2 |
(2.2%) |
|
Loan Loss provision |
(0.3) |
(0.1) |
(78.2%) |
|
Total Operating expenses |
(1.57) |
(1.56) |
(0.2%) |
|
Profit before tax |
(0.3) |
(0.3) |
8.5% |
|
Profit after tax |
(0.3) |
(0.3) |
(17.4%) |
|
Core EPS |
(0.8) |
(0.9) |
(17.4%) |
|
Key Ratios |
|||
|
Ratios |
H1'2020 |
H1'2021 |
% point change |
|
Yield from interest-earning assets |
10.6% |
9.1% |
(1.5%) |
|
Cost of funding |
6.4% |
4.8% |
(1.6%) |
|
Net Interest Margin |
4.3% |
4.2% |
(0.1%) |
|
Non- Performing Loans (NPL) Ratio |
26.7% |
22.6% |
(4.1%) |
|
NPL Coverage |
54.3% |
65.1% |
10.8% |
|
Cost to Income with LLP |
123.0% |
125.5% |
2.5% |
|
Loan to Deposit Ratio |
97.4% |
93.3% |
(4.1%) |
|
Return on average assets |
(0.5%) |
(3.3%) |
(2.7%) |
|
Return on average equity |
(3.0%) |
(21.2%) |
(18.2%) |
|
Capital Adequacy Ratios |
|||
|
Ratios |
H1'2020 |
H1'2021 |
% point change |
|
Core Capital/Total Liabilities |
12.3% |
10.1% |
(2.2%) |
|
Minimum Statutory ratio |
8.0% |
8.0% |
0.0% |
|
Excess |
4.3% |
2.1% |
(2.2%) |
|
Core Capital/Total Risk Weighted Assets |
10.8% |
8.8% |
(2.0)% |
|
Minimum Statutory ratio |
10.5% |
10.5% |
0.0% |
|
Excess |
0.3% |
(1.7%) |
(2.0%) |
|
Total Capital/Total Risk Weighted Assets |
12.0% |
12.3% |
0.3% |
|
Minimum Statutory ratio |
14.5% |
14.5% |
0.0% |
|
Excess |
(2.5%) |
(2.2%) |
0.3% |
Key take-outs from the earnings release include;
- HF Group recorded a loss per share of Kshs 0.9 in H1’2021, higher than the loss per share of Kshs 0.8 recorded in H1’2020, which was not in-line with our expectations of a Kshs 0.4 loss per share. The performance of the group can be attributed to a faster 2.2% decline in total operating income to Kshs 1.2 bn, from Kshs 1.3 bn in H1’2020, coupled with a 0.2% decrease in total operating expenses to Kshs 1.56 bn, from Kshs 1.57 bn seen in H1’2020,
- Interest income declined by 15.8% to Kshs 2.0 bn, from Kshs 2.4 bn in H1’2020 driven by a 20.5% decline in interest income from loans and advances to Kshs 1.7 bn, from Kshs 2.1 bn in H1’2020. The decline was however mitigated by a 28.1% increase in interest income on government securities to Kshs 0.3 bn, from Kshs 0.2 bn in H1’2020,
- The Yield on Interest-Earning Assets decreased to 9.1%, from 10.6% in H1’2020, due to an 18.4% decrease in trailing interest income compared to the 4.1% decline in the average interest-earning assets (IEA),
- Interest expense declined by 22.3% to Kshs 1.1 bn, from Kshs 1.4 bn in H1’2020, driven by a 42.3% decline in other interest expenses to Kshs 191.6 mn, and a 20.8% decline in interest expense from customer deposits to Kshs 766.6 mn, from Kshs 967.5 mn in H1’2020. Interest expense on Deposits and placements from other banks grew by 55.8% to Kshs 103.4 mn, from Kshs 66.4 mn recorded in H1’2020. Cost of funds declined to 4.8% in H1’2021, from 6.4% as recorded in H1’2020. Net Interest Margin (NIM) declined to 4.2% from the 4.3% recorded in H1’2020, due to a 6.7% decrease in trailing Net Interest Income (NII), compared to a 4.1% decline in the average interest-earning assets,
- Total Operating Income declined by 2.2% to Kshs 1.2 bn, from Kshs 1.3 bn in H1’2020, attributable to the 6.8% dip in Net Interest Income (NII) to Kshs 0.9 bn, from Kshs 1.0 bn recorded in H1’2020. The decline was however mitigated by a 13.8% increase in Non-Funded Income (NFI) to Kshs 325.1 mn, from Kshs 285.6 mn recorded in H1’2020,
- The company’s balance sheet recorded a contraction as total assets declined by 6.2% to Kshs 53.0 bn, from Kshs 56.5 bn in H1’2020. This is attributable to a 7.5% decline in the loan book to Kshs 35.3 bn, from Kshs 38.2 bn recorded in H1’2020. This contraction in the loan book was however mitigated by a 1.9% rise in government securities to Kshs 4.9 bn, from the Kshs 4.8 bn recorded in H1’2020, and a 5.2% increase in placements to Kshs 1.42 bn in H1’2021, from Kshs 1.35 bn in H1’2020,
- Total liabilities decreased by 4.1% to Kshs 44.8 bn in H1’2021, from Kshs 46.7 bn in H1’2020, driven by a 12.3% decline in borrowings to Kshs 4.7 bn, from Kshs 5.3 bn in H1’2020, and a 3.5% decline in customer deposits to Kshs 37.8 bn in H1’2021, from Kshs 39.2 bn in H1’2020. There was however a 287.3% increase in placements to Kshs 0.5 bn in H1’2021, from Kshs 0.1 bn in H1’2020,
- Deposits per branch decreased by 3.5% to Kshs 1.7 bn, from Kshs 1.8 bn in H1’2020, with the number of branches remaining unchanged at 22,
- Gross non-performing loans (NPLs) declined by 21.3% to Kshs 9.4 bn, from Kshs 11.9 bn recorded in H1’2020. Consequently, the NPL ratio improved to 22.6% from the 26.7% recorded in H1’2020, following the faster 21.3% decline in NPLs that outpaced the 7.3% decline in gross loans which came in at Kshs 41.4 bn in H1’2021, from Kshs 44.6 bn recorded in H1’2020,
- General loan loss provisions increased by 8.6% to Kshs 3.2 bn in H1’2021, from Kshs 3.0 bn in H1’2020. The NPL coverage thus improved to 65.1% in H1’2021, from 54.3% in H1’2020 owing to the 8.6% increase in general loan loss provisions coupled with the 21.3% decline in gross NPLs, and,
- HF Group remains undercapitalized with a core capital to risk-weighted assets ratio of 8.8%, 1.7% points below the statutory requirement of 10.5%. In addition, the total capital to risk-weighted assets ratio came in at 12.3%, below the statutory requirement by 2.2% points. Adjusting for IFRS 9, the core capital to risk-weighted assets stood at 9.1%, while total capital to risk-weighted assets came in at 12.6%.
For a comprehensive analysis, please see our HF Group H1’2021 Earnings Note
Asset Quality
The table below is a summary of the asset quality for the companies that have released:
|
H1'2020 NPL Ratio** |
H1'2021 NPL Ratio* |
H1'2020 NPL Coverage** |
H1'2021 NPL Coverage* |
% point change in NPL Ratio |
% point change in NPL Coverage |
|
|
ABSA Bank Kenya |
8.0% |
7.9% |
63.6% |
70.9% |
(0.1%) |
7.3% |
|
Stanbic Bank |
12.1% |
9.5% |
59.3% |
51.0% |
(2.6%) |
(8.3%) |
|
Diamond Trust Bank |
8.3% |
10.4% |
51.2% |
41.8% |
2.1% |
(9.4%) |
|
Equity Group |
11.0% |
11.4% |
48.5% |
63.2% |
0.4% |
14.7% |
|
KCB |
13.8% |
14.4% |
56.9% |
61.6% |
0.6% |
4.7% |
|
Standard Chartered Bank Kenya |
13.9% |
15.1% |
78.2% |
80.1% |
1.2% |
1.9% |
|
Co-operative Bank of Kenya |
11.8% |
15.2% |
54.6% |
63.5% |
3.4% |
8.9% |
|
HF Group |
26.7% |
22.6% |
43.1% |
65.1% |
(4.1%) |
22.0% |
|
Mkt Weighted Average |
11.6% |
14.1% |
57.8% |
67.6% |
2.5% |
9.8% |
|
*Market cap weighted as at 27/08/2021 |
||||||
|
**Market cap weighted as at 28/08/2020 |
||||||
Key take-outs from the table include;
- Asset quality for the listed banks that have released deteriorated during the period, with the weighted average NPL ratio rising by 2.5% points to a market cap weighted average of 14.1%, from an average of 11.6% for the listed banking sector in H1’2020. The deterioration in asset quality was as a result of increased non-performing loans due to the increased credit risk as a consequence of the subdued business environment occasioned Covid-19 pandemic, and,
- NPL Coverage for the listed banks increased to a market cap weighted average of 67.6% in H1’2021, from 57.8% recorded in H1’2020, as the banks increased their provisioning levels due to the difficult economic conditions caused by the pandemic. Banks are expected to continue over-provisioning in 2021, albeit at a slower pace than in 2020.
Summary Performance
The table below highlights the performance of the banks that have released so far, showing the performance using several metrics, and the key take-outs of the performance;
|
Bank |
Core EPS Growth |
Interest Income Growth |
Interest Expense Growth |
Net Interest Income Growth |
Net Interest Margin |
Non-Funded Income Growth |
NFI to Total Operating Income |
Growth in Total Fees & Commissions |
Deposit Growth |
Growth in Government Securities |
Loan to Deposit Ratio |
Loan Growth |
Return on Average Equity |
|
ABSA Bank |
846.0% |
(0.8%) |
(20.4%) |
6.1% |
7.0% |
6.1% |
32.8% |
10.7% |
6.1% |
(9.4%) |
82.9% |
8.4% |
19.3% |
|
KCB |
101.9% |
13.9% |
3.8% |
17.2% |
8.7% |
5.9% |
28.9% |
(2.2%) |
3.7% |
2.2% |
77.2% |
8.4% |
19.2% |
|
Equity Group |
97.7% |
30.3% |
42.0% |
26.5% |
7.6% |
44.2% |
40.0% |
42.5% |
50.7% |
11.8% |
61.6% |
28.9% |
21.4% |
|
Standard Chartered |
37.5% |
(7.5%) |
(24.5%) |
(3.0%) |
6.4% |
13.5% |
35.4% |
19.8% |
8.5% |
(3.2%) |
46.80% |
(3.0%) |
13.70% |
|
Stanbic Bank |
37.2% |
2.1% |
(9.9%) |
9.5% |
4.4% |
10.5% |
44.3% |
3.0% |
(9.4%) |
(2.7%) |
79.9% |
(11.7%) |
11.9% |
|
Diamond Trust Bank |
20.1% |
5.7% |
5.7% |
5.7% |
5.2% |
5.5% |
25.3% |
(0.9%) |
11.9% |
19.7% |
65.1% |
1.4% |
6.4% |
|
Co-operative Bank |
2.3% |
19.0% |
20.9% |
18.3% |
8.6% |
24.3% |
35.4% |
17.8% |
6.0% |
48.7% |
73.9% |
10.7% |
12.7% |
|
HF Group |
(17.4%) |
(15.8%) |
(22.3%) |
(6.8%) |
4.2% |
13.8% |
26.1% |
34.6% |
(3.5%) |
1.9% |
93.3% |
7.5% |
(21.2%) |
|
H1'21 Mkt Weighted Average* |
148.6% |
15.9% |
13.5% |
16.9% |
7.6% |
22.2% |
35.2% |
19.0% |
19.9% |
10.3% |
69.5% |
13.3% |
17.7% |
|
H1'20 Mkt Weighted Average** |
(33.6%) |
10.4% |
10.0% |
10.9% |
7.0% |
(1.1%) |
35.2% |
(3.4%) |
18.5% |
25.9% |
71.5% |
14.5% |
15.4% |
|
*Market cap weighted as at 27/08/2021 |
|||||||||||||
|
**Market cap weighted as at 28/08/2020 |
|||||||||||||
Key takeaways from the table above include:
- The listed banks that have released recorded a 148.6% weighted average growth in core Earnings per Share (EPS), compared to a weighted average decline of 33.6% in H1’2020 for the listed banking sector. The performance is however largely skewed by the strong performance from ABSA, KCB and Equity Group,
- The Banks have recorded a weighted average deposit growth of 19.9%, faster than the 18.5% growth recorded in H1’2020,
- Interest expense grew at a faster pace, by 13.5%, compared to the 10.0% growth in H1’2020 while cost of funds declined, coming in at a weighted average of 2.4% in H1’2021, from 2.9% in H1’2020, owing to the faster growth in average interest-bearing liabilities, an indication that the listed banks were able to mobilize cheaper deposits,
- Average loan growth came in at 13.3%, higher than the 14.5% growth recorded in H1’2020. The loan growth was also faster than the 10.3% growth in government securities, an indication that the banks’ are gradually going back to lending as the economy continues to rebound,
- Interest income grew by 15.9%, compared to a growth of 10.4% recorded in H1’2020. Notably, the weighted average Yield on Interest Earning Assets (YIEA) for the eight banks increased to 9.9%, from the 9.7% recorded in H1’2020 for the listed banking sector, an indication of the increased allocation to higher-yielding assets by the sector during the period. Consequently, the Net Interest Margin (NIM) now stands at 7.6%, 0.6% points higher than the 7.0% recorded in H1’2020 for the whole listed banking sector, and,
- Non-Funded Income grew by 22.2%, compared to the 1.1% decline recorded in H1’2020. This can be attributable to the faster growth in the fees and commission which grew by 19.0% compared to a decline of 3.4% in H1’2020.
Universe of Coverage
|
Company |
Price as at 20/08/2021 |
Price as at 27/08/2021 |
w/w change |
YTD Change |
Year Open 2021 |
Target Price* |
Dividend Yield |
Upside/ Downside** |
P/TBv Multiple |
Recommendation |
|
I&M Group*** |
23.0 |
23.0 |
0.0% |
(48.7%) |
44.9 |
29.8 |
9.8% |
39.3% |
0.3x |
Buy |
|
Kenya Reinsurance |
2.5 |
2.5 |
0.4% |
7.4% |
2.3 |
3.1 |
8.1% |
33.1% |
0.3x |
Buy |
|
NCBA*** |
27.1 |
26.5 |
(2.4%) |
(0.6%) |
26.6 |
29.5 |
5.7% |
17.2% |
0.7x |
Accumulate |
|
Co-op Bank*** |
13.7 |
13.8 |
0.7% |
10.0% |
12.6 |
14.5 |
7.2% |
12.3% |
0.9x |
Accumulate |
|
KCB Group*** |
48.0 |
48.6 |
1.3% |
26.4% |
38.4 |
52.5 |
2.1% |
10.2% |
1.1x |
Accumulate |
|
Sanlam |
11.9 |
11.3 |
(5.0%) |
(13.1%) |
13.0 |
12.4 |
0.0% |
9.7% |
1.0x |
Hold |
|
Diamond Trust Bank*** |
65.0 |
65.3 |
0.4% |
(15.0%) |
76.8 |
70.0 |
0.0% |
7.3% |
0.3x |
Hold |
|
Standard Chartered*** |
134.8 |
140.0 |
3.9% |
(3.1%) |
144.5 |
134.5 |
7.5% |
3.6% |
1.1x |
Lighten |
|
Equity Group*** |
52.5 |
54.3 |
3.3% |
49.7% |
36.3 |
55.9 |
0.0% |
3.1% |
1.5x |
Lighten |
|
Liberty Holdings |
9.0 |
8.6 |
(4.7%) |
11.4% |
7.7 |
8.4 |
0.0% |
(2.1%) |
0.6x |
Sell |
|
ABSA Bank*** |
10.2 |
11.0 |
8.4% |
15.5% |
9.5 |
10.7 |
0.0% |
(2.7%) |
1.2x |
Sell |
|
Stanbic Holdings |
94.0 |
95.0 |
1.1% |
11.8% |
85.0 |
89.1 |
1.8% |
(4.4%) |
0.9x |
Sell |
|
Jubilee Holdings |
360.0 |
360.0 |
0.0% |
30.6% |
275.8 |
330.9 |
2.5% |
(5.6%) |
0.7x |
Sell |
|
Britam |
8.3 |
8.1 |
(1.9%) |
16.0% |
7.0 |
6.7 |
0.0% |
(17.5%) |
1.5x |
Sell |
|
HF Group |
4.0 |
4.0 |
0.3% |
27.1% |
3.1 |
3.2 |
0.0% |
(19.8%) |
0.2x |
Sell |
|
CIC Group |
2.8 |
2.8 |
(1.1%) |
30.3% |
2.1 |
1.8 |
0.0% |
(34.5%) |
0.9x |
Sell |
|
Target Price as per Cytonn Analyst estimates as at Q1’2021. We are currently reviewing our target prices for the banking sector coverage **Upside/ (Downside) is adjusted for Dividend Yield ***For Disclosure, these are stocks in which Cytonn and/or its affiliates are invested in Key to note, I&M Holdings YTD share price change is mainly attributable to the counter trading ex-bonus issue |
||||||||||
We are “Neutral” on the Equities markets in the short term. With the market currently trading at a premium to its future growth (PEG Ratio at 1.5x), we believe that investors should reposition towards companies with a strong earnings growth and are trading at discounts to their intrinsic value. Additionally, we expect the recent discovery of new strains of COVID-19 coupled with the introduction of strict lockdown measures in major economies to continue dampening the economic outlook.
I. Residential
During the week, Stima Savings and Credit Cooperative (SACCO) Limited launched its Affordable Housing Mortgage Scheme in partnership with the Kenya Mortgage Refinance Company (KMRC), a treasury backed lender, targeting both individuals in formal and informal employment. The purpose of the scheme is to offer affordable mortgages to members of the SACCO with bespoke terms. For individuals who are employed, the SACCO will offer a loan up to a maximum of Kshs 4.0 mn, at 9.0% interest rate, with a 25-years repayment plan. For individuals in business or those with rental income, the loan will still be capped at Kshs 4.0 mn, at 9.5% interest rate, with a repayment tenor of up to 20 years. From our analysis, and given the aforementioned terms, an employed individual will be required to make monthly payments of about Kshs 33,600 while a business home owner will pay Kshs 37,300. For salaried Kenyans, these payments are still far from affordable since contributing Kshs 33,600 for housing given an income at Kshs 50,000 is financially unviable.
Despite the unviability of the scheme for most income earners, the move by Stima SACCO and KMRC is a step in the right direction towards improving home ownership rate in the country through offering affordable mortgages. In December 2020, Stima SACCO received Kshs 69.0 mn from KMRC in its Kshs 2.8 bn debut lending to Primary Mortgage Lenders (PMLs) at 5.0% interest rate, to boost its capital liquidity for onward lending to potential home owners. However, there lacks clarity on the funding model of the company in order to maintain lending at 5.0% given that the even the government itself access 20-year funding at 13.3% rate. Other PMLs who received funding from KMRC in that period include KCB Bank which was the largest beneficiary at Kshs 2.1 bn, while Housing Finance (HF) and Tower Sacco received an allocation of Kshs 515.0 mn and 30.0 mn, respectively. KMRC has since set aside Kshs 7.0 bn for lending to PMLs in FY’2021/22 in an aim to achieve its mandate of boosting home ownership rates through issuance of affordable mortgages.
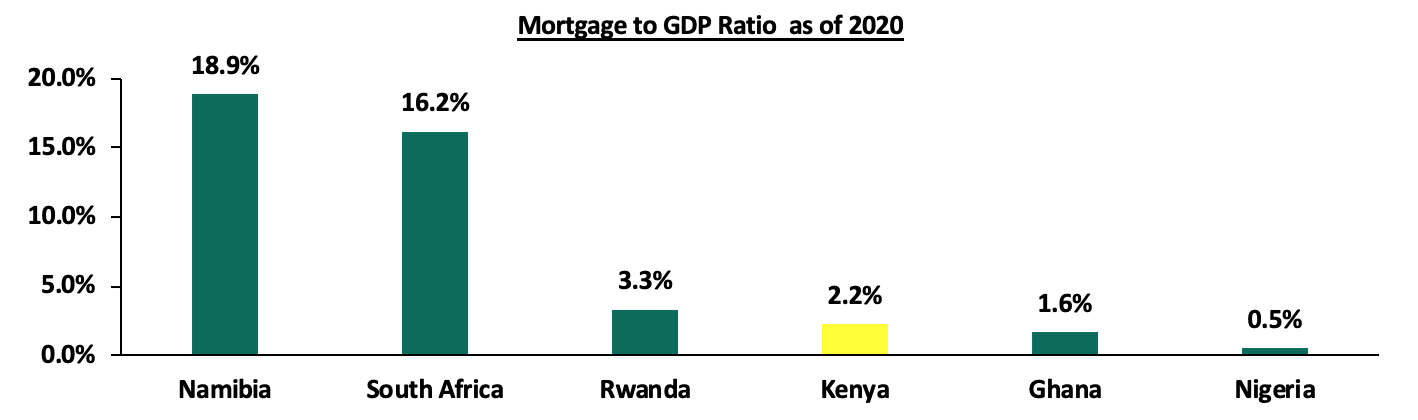
The move by Stima SACCO is likely to spark an increase in the uptake of mortgages in the country which remain constrained due to high property prices and interest rates in a country where income is very low. Given this, the Kenya mortgage to GDP ratio has continues to lag behind at 2.2% as of 2020, compared to countries such as Namibia and South Africa at 18.9% and 16.2%, respectively as shown in the graph below;
Source: Center for Affordable Housing Africa
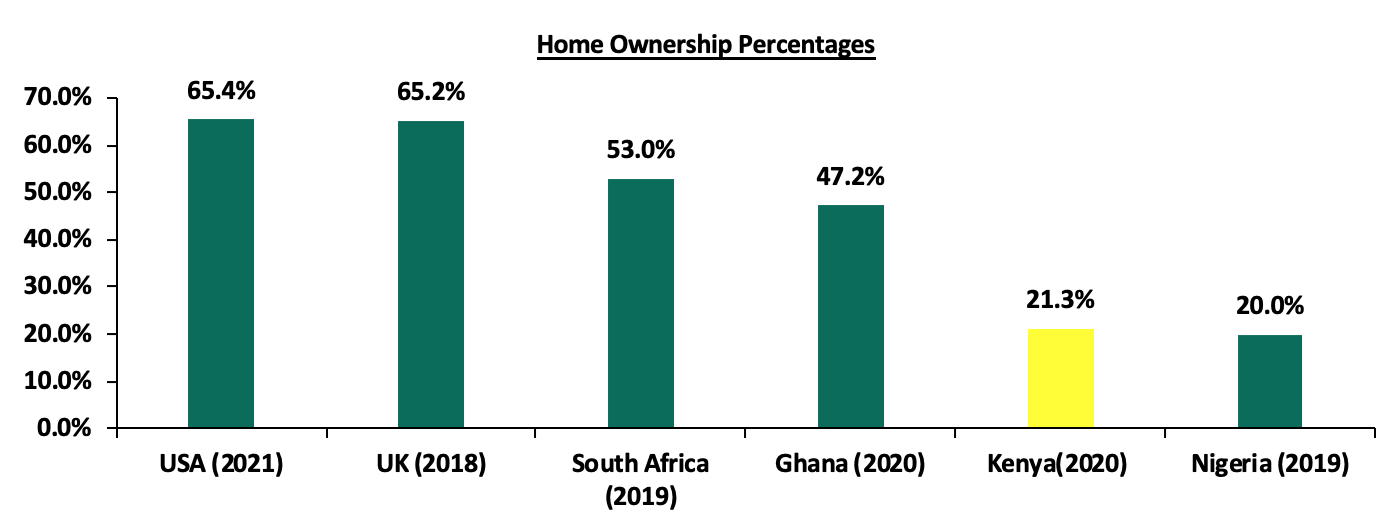
Despite the low mortgage to GDP ratio, homeownership remains an important aspiration, hence affordable mortgages are essential to increasing homeownership, currently at 21.3% compared to Ghana at 47.2% and South Africa at 53.0%, thus creating the need for acceleration. The low home ownership rate in the country is attributable to; i) the increasing number of Non-Performing Loans (NPLS) in the real estate sector, which increased by 14.8 % to Kshs 70.5 bn in Q1’2021 from Kshs 61.4 bn recorded in Q4’2020 leading to tighter underwriting standards by banks and other lending institutions, ii) exclusion of self-employed citizens due to lack of the credit information on criteria threshold for mortgage products, iii) tough economic times reducing savings and disposable income, iv) high property costs, and, v) the high initial deposits required to access mortgages.
The graph below shows the home ownership percentages of different countries compared to Kenya;
Source: Center for Affordable Housing Africa, Federal Reserve Bank
The residential sector continues to be supported by partnerships aimed at increasing the number of affordable mortgages in the country and incorporating flexible terms aimed at increasing home ownership rates.
II. Retail Sector
During the week, French retailer Carrefour, opened an outlet at the Southfield Mall in Embakasi Nairobi, taking up about 32,000 SQFT of retail space on two floors previously occupied by Choppies Supermarket. This brings its total outlets to 14, with 12 being within Nairobi county and two in Mombasa county. The move comes after the retailer announced plans to open two new stores in Kisumu’s United Mall and Mega City by August 2021, in spaces previously occupied by troubled Nakumatt and Tuskys supermarkets, respectively. The retailer has been on an aggressive expansion having opened 5 branches in 2021 taking on rivals such as QuickMart and Naivas which have each opened 4 and 6 branches in 2021, respectively. The new outlet is expected to serve the residents of Imara Daima, Nyayo Estate and Syokimau with plans to transform into a hypermarket by December 2021. The decision to take up space in Embakasi is supported by; i) accessibility of the area through major roads such as Mombasa Road, ii) exit of Choppies leaving prime retail space for uptake, and, iii) the need to reach out to the population in the area by offering e-commerce services through online sale and delivery services.
According to Cytonn H1’2021 Markets Review, Eastlands where Embakasi is classified recorded an average rent per SQFT of Kshs 136, 21.6% points lower than the market average of Kshs 169 per SQFT. The affordability of the area therefore indicates a suitable investment by Carrefour.
The table below shows the performance of the Nairobi Metropolitan Area (NMA) retail market in H1’2021;
|
Nairobi Metropolitan Area Retail Market Performance H1’2021 |
|||
|
Area |
Rent/SQFT H1'2021 (Kshs) |
Occupancy % H1'2021 |
Rental Yield H1'2021 |
|
Westlands |
209 |
80.0% |
9.7% |
|
Karen |
217 |
80.6% |
9.5% |
|
Kilimani |
173 |
82.8% |
8.9% |
|
Ngong Road |
178 |
78.8% |
8.0% |
|
Kiambu road |
178 |
68.8% |
7.1% |
|
Thika Road |
159 |
73.3% |
6.7% |
|
Mombasa road |
139 |
73.0% |
6.3% |
|
Satellite towns |
134 |
74.0% |
6.2% |
|
Eastlands |
136 |
70.0% |
5.8% |
|
Average |
169 |
75.7% |
7.6% |
Source: Cytonn Research 2021
The table below shows the summary of the number of stores of the Key local and international retailer supermarket chains in Kenya;
|
Main Local and International Retail Supermarket Chains |
|||||||||
|
Name of Retailer |
Category |
Highest number of branches that have ever existed as at FY’2018 |
Highest number of branches that have ever existed as at FY’2019 |
Highest number of branches that have ever existed as at FY’2020 |
Number of branches opened in 2021 |
Closed branches |
Current number of Branches |
Number of branches expected to be opened |
Projected number of branches FY’2021 |
|
Naivas |
Local |
46 |
61 |
69 |
6 |
0 |
75 |
4 |
79 |
|
QuickMart |
Local |
10 |
29 |
37 |
4 |
0 |
41 |
4 |
45 |
|
Chandarana Foodplus |
Local |
14 |
19 |
20 |
0 |
0 |
20 |
0 |
20 |
|
Carrefour |
International |
6 |
7 |
9 |
5 |
0 |
14 |
2 |
16 |
|
Cleanshelf |
Local |
9 |
10 |
11 |
1 |
0 |
12 |
0 |
12 |
|
Tuskys |
Local |
53 |
64 |
64 |
0 |
61 |
3 |
0 |
3 |
|
Game Stores |
International |
2 |
2 |
3 |
0 |
0 |
3 |
0 |
3 |
|
Uchumi |
Local |
37 |
37 |
37 |
0 |
35 |
2 |
0 |
2 |
|
Choppies |
International |
13 |
15 |
15 |
0 |
13 |
2 |
0 |
2 |
|
Shoprite |
International |
2 |
4 |
4 |
0 |
3 |
1 |
0 |
1 |
|
Nakumatt |
Local |
65 |
65 |
65 |
0 |
65 |
0 |
0 |
0 |
|
Total |
257 |
313 |
334 |
16 |
177 |
173 |
10 |
183 |
|
Source: Online Research
The retail sector continues to be supported by the aggressive expansions by the local and international retailers in an aim to increase their footprint in the country. This has been aided by the availability of prime space left by troubled retailers and partnerships to increase funding and operational efficiency such as Carrefour’s adopted supplier-retailer partnership technique to deal with late payment issues to the suppliers.
III. Statutory Reviews
During the week, the government of Kenya, through the Ministry of Lands and Physical Planning, published the Draft National Land Surveying and Mapping Policy, 2021 to guide the practice of land surveying and mapping in various sectors of the economy. This policy will see the amendment of the Sectional Properties Act, 2020 to make provision for;
- Phased development and mixed use developments of properties under different head titles,
- Volume of space occupied and floor area in the computation of unit factors for different uses in mixed use development, and,
- Extension and renewal of lease by unit owners.
Some of the challenges under the current regulation include; i) the lack of favor for Sectional Properties as a form of registration by developers since, if the land is under one title, then the head title cannot be surrendered to unit owners until the entire land has been developed, ii) the loss of control by land owners once the land has been developed, meaning that extra land spaces where development has not taken place cannot be accessed, iii) developmental obstacles given that land cannot be subdivided in phases to allow for surrender of separate head titles especially for large parcels where the developer is unable to carry development at once, and, iv) the lack of mechanism of maintaining minimum economically viable parcel sizes concurrently with the ability to grant individual land rights to multiple land owners especially in high density or high value areas for mixed use developments.
While the Sectional Property Act, 2020 addressed most of the bureaucratic shortcomings in land registration in the 1987 regulation, it is still focused on the separation of titles based on floor areas in a built up environment other than sectional land itself. Development through phases is therefore common in the country due to; i) unavailability of land due to speculation, ii) unaffordability of land especially in the urban areas due to the high prices, iii) financial constraints from economic recessions and hostile capital markets regulatory framework, and, iv) the need to sell finished units to fund the rest of the development stages. Once the policy is implemented, developers can undertake phased developments on large pieces of land in stages, each with a sectional title, as well as issue separate ownership documents for units of buildings on one title deed under one phase of construction, before the entire land is fully developed. Other areas that the regulation seeks to address include mining by including mining cadaster into the National Land Information Management System (NLIMS) and underground utility services to review the Survey Act and provide underground survey and mapping in order to ascertain whether the choice of new road or real estate construction will affect any existing underground installations for water, sewer or electricity. In the past, lack of information on the location of buried assets has caused practical problems that have increased costs, delayed projects and increased the risk of injury for utility owners, contractors, and road users.
The land sector continues to be supported by improved regulatory framework to not only spur development, but also reduce bureaucracies in land registration and its subsequent development.
The real estate sector performance is expected to be supported by financial institutions efforts to avail affordable mortgages to clients, expansion of local and international retailers taking up prime space left by troubled retailers, and the streamlining of the land regulations to spur development and reduce bureaucracies in land dealings.
The Coronavirus pandemic (COVID-19), which began as a health crisis, morphed into a global economic crisis as a result of containment measures put in place worldwide to curb the spread of the virus, which brought the global economy to a standstill. According to the IMF World Economic Outlook, the global GDP is estimated to have contracted by 4.4% in 2020, from a growth of 1.6% recorded in 2019. Kenya’s economy was also not spared, with the GDP estimated to have contracted by 0.1% in 2020, from a growth of 5.4% recorded in 2019. As at December 2020, the Non-Performing Loans (NPL) ratio stood at 14.1%, an increase from the 12.7% recorded in 2019. This was mainly attributable to poor performance of businesses as a result of the COVID-19 pandemic in 2020 which affected their ability to service loans. The Nairobi All Share Index (NASI) also recorded a poor performance, declining by 8.6% in 2020 due to the decline in prices of large cap stocks such as Bamburi and Equity Group, which declined by 52.7% and 31.7%, respectively. The real estate sector was also adversely affected as evidenced by the poor performance of Fahari-I-REIT, the only listed REIT in Kenya, which closed the year at Kshs 5.6, 71.8% lower than its initial listing price of Kshs 20.0. The poor performance was attributable to a decline in revenue due to COVID-19’s impact on commercial office and retail sectors, which is expected to continue suppressing rental income growth. The Kenyan government, the Central Bank of Kenya (CBK) and the Capital Markets Authority (CMA), took various measures to mitigate the negative effects of the pandemic on the economy and also to support financial markets. For this reason, we seek to build on a focus we did in 2020, on the Impact of COVID-19 on Real Estate Funds, and examine how regulators in Kenya supported real estate funds during the pandemic.
In this week’s focus, we would like to discuss the regulatory response to Real Estate Funds due to COVID-19 in Kenya, where we shall discuss the following:
- Investing in Real Estate,
- Regulatory response to Real Estate funds in Kenya,
- Case study,
- Recommendation on how regulators can support Real Estate Funds in Kenya, and,
- Conclusion
Section 1: Investing in Real Estate
Investing in real estate can either be done directly through the traditional method where an investor buys land or property, develops, then sells or rents out, or indirectly through real estate funds. To better understand real estate funds, one must first know what mutual funds are and how they work. A mutual fund is a collection of funds pooled together from individuals for the purpose of investing in underlying assets with the aim of getting returns in line with investors’ overall objectives. The underlying assets vary from the most liquid ones such as bank deposits, government securities and equities to the less liquid funds like real estate funds and other commodity funds. For real estate funds, some of the ways they may invest include;
- Investing directly in development of commercial real estate properties - This form of investing involves direct investment in commercial real estate properties across the various sectors ranging from residential, master plans, hospitality, etc.
- Investing in completed real estate assets - This involves the purchase of properties across the various sectors with the aim of getting stable income as they gain in value. An example of such a fund is Fahari-I-REIT (Kenya),
- Investing through sector specific Collective Investment Schemes (CIS) that specialize in Real Estate – These are approved and regulated Collective Investment Schemes operated by a licensed fund manager that mostly comprise of a considerable allocation to a specific underlying asset class with investors being known as unit holders. Real Estate/Property Funds typically invest at least 80.0% of the assets under management in securities issued by real estate companies with the balance comprising of cash and cash equivalents. They may either be open-ended funds that allow redemptions daily, monthly, quarterly or even annually or closed-end funds that have a fixed term and do not allow redemptions, except in limited circumstances during their life. An example of a sector specific Collective Investment Schemes (CIS) that specializes in Real Estate is the Cytonn High Yield Fund (CHYF),
- Investing through Real Estate Investment Trusts, (REITS) - REITS, as covered in our Real Estate Investment Trusts in Kenya & Cytonn Weekly #11/2021, are regulated collective investment vehicles which invest in real estate. They directly hold real estate assets and therefore engage service providers like a Property Manager. They may either invest in Income Generating Real Estate (I-Reits) or Development Real Estate (D-REITs). The units of a REIT are typically listed or traded on an Over The Counter (OTC) platform and distributions to its investors are through capital gains and dividends. Some examples of REITs in Kenya are Fahari-I-REIT, Acorn D-Reit and Acorn I-Reit,
- Investing in stocks of Real Estate Index Funds - Real Estate Index funds provide exposure to real estate by investing in a basket of REITS in the market. The Satrix Property Index Fund (South Africa), which is managed by Sanlam Investments, is an example of an index fund that invests in REITS. Kenya does not have any Real Estate Index Fund since as at today we only have 1 listed REIT despite REIT legislation coming into effect in 2013. This is as compared to South Africa where REIT regulations were also enacted in 2013 and to date has at least 36 active REITs with a market capitalization of USD 13.4 bn,
- Investing in companies undertaking Real estate investments – A real estate fund could also invest in companies whose major line of business is real estate, such as Home Africa,
- Investing in real estate debt instruments or structured products - A real estate fund could also invest in real estate through securities issued by real estate companies such as loan notes, which are real estate debt instruments which earn a fixed or variable interest. These notes may be publicly or privately issued by real estate companies looking to raise funds to fund their developments. An example of such is Cytonn Real Estate Note (CREN). Typically, each share or unit in the entity represents a 99.9% loan note to the Company, entitling the investors to interest with the balance being a nominal interest in equity entitling the investors to participate in shareholder/partner meetings, elect their representatives to a board and to have a say in certain matters. Key to note, Property Loan Stocks have been identified as one of the key reasons REITs took off so well in South Africa, as local investors already had exposure to indirect property investments. The introduction of REITs therefore just served to bring international investors on board. Local examples of Real Estate Notes and Structured Products are as summarized below:
|
|
Name of Real Estate Fund |
Type of Real Estate Fund |
|
1. |
Maiyan Holdings |
Real Estate Loan Note |
|
2. |
Heri Homes Capital LLP |
Real Estate Loan Note |
|
3. |
Cytonn Real Estate Notes (CREN) LLP |
Real Estate Loan Note |
|
4. |
Two Rivers Development Limited |
Real Estate Loan Note |
|
5. |
Cytonn High Yield Fund (CHYF) |
Sector Specific CIS |
|
6. |
Britam Wealth Management Fund LLP |
Structured Product |
Source: Cytonn Research
Benefits of Investing in Real Estate Securities
As noted above, there are a number of options available for an investor looking to invest indirectly in real estate. Some of the benefits include:
- Diversification: Capital raised by the fund is used to acquire multiple real estate assets in several geographic regions which helps spread the investment risk across a variety of properties with a number of units each,
- Inflation hedge: Real estate securities have consistently generated returns above the inflation rate, ensuring investors are earning a “real return,”
- Reduced volatility: Real estate securities are not subject to market volatility due to their low correlation with traditional investments such as stocks and bonds,
- Enhanced returns: Real estate securities offer investors better returns than traditional investments such as bank deposits,
- Professional management: Real estate securities are managed by professional fund managers who scout for the most profitable investments and strategies, and,
- No landlord duties: Owning property comes with asset and management responsibilities that many investors have no time for. Investing in a real estate fund provides benefit of owning property without direct responsibility of management.
Just like any other form of investment, Real Estate securities carry with them certain risks which include;
- Participation risk - Lack of control as investors delegate the decision making roles to the manager of the fund and therefore they have limited control over where the fund invests,
- Illiquidity risk - Although the assets are relatively liquid compared to brick and mortar investments, the underlying asset remains real estate. Consequently, there are times liquidity is not guaranteed, and,
- Market risk – Real estate sector is driven by forces of demand and supply and in moments of extreme market and economic uncertainty it becomes difficult to value real estate funds.
Effects of COVID-19 on Real Estate Funds
Real estate is generally considered by many investors to be a safe investment. However, these investments along with property prices typically rise and fall in correlation with economic growth and contraction. The novel COVID-19 pandemic brought about an unprecedented economic slowdown that scathed the real estate sector. Some of the negative effects of COVID-19 on the real estate sector include:
- An increase in rent defaults due to the reduction of disposable income which led to uncertainty of real estate returns and stifled profitability,
- Low occupancy rates especially for the commercial office sector due to ‘work from home’ arrangements which negatively affected revenue,
- Dipping in property prices which severely affected revenue and profitability,
- Huge investor withdrawals from funds as investors reassessed their investments due to the uncertain economic outlook. This saw real estate funds in the UK such as BlackRock and Schroders freeze their property funds worth £3.4 bn (Kshs 0.5 tn) and £2.4 bn (Kshs 0.4 tn) respectively,
- Disruption of supply chain networks which resulted in a slowdown of construction activities hence reducing revenues, and,
- Illiquidity of funds which was attributable to substantial valuation losses, net investor outflows and low cash holdings as the funds invest in illiquid assets.
Section 2: Regulatory response to Real Estate Funds in Kenya
Kenya has few real estate funds compared to developed markets, with the only listed Real Estate fund being Fahari I-REIT, which is regulated by the Capital Market Authority (CMA). Some of the regulated but unlisted funds in Kenya include the Acorn I-REIT and the Cytonn High Yield Fund (CHYF). Like all other real estate funds globally, the funds were adversely affected by their high exposure to real estate and therefore, interventions by different stakeholders affecting real estate had a trickle-down effect on the real estate funds. We shall discuss the measures taken by different stakeholders to mitigate the adverse effects of COVID-19 that directly affected the real estate sector in Kenya:
- The Government of Kenya (GoK): On 6th of April 2020, the Government of Kenya announced a number of tax incentives aimed at cushioning the individuals and business from the pandemic in order to support the economy. Some of the incentives affecting the real estate sector include:
- The reduction of Corporation Tax from 30.0% to 25.0%. This reduced companies’ tax liability hence boosting their profits, and,
- Reduction of the VAT from 16.0% to 14.0%, which was effective 1st April, 2020, with the aim of increasing the disposable income of individuals in order to increase consumer purchases and stimulate economic activity.
Both directives were reversed on 1st January 2021.
- The Central Bank of Kenya: CBK adopted an accommodative stance to cushion business and households from the adverse effects of COVID-19. Some of the measures taken include:
- Lowering of the Cash Reserve Ratio (CRR) - The CBK lowered the CRR to 4.25% in March 2020 from 5.25% in January 2020, which served to increase liquidity in the economy,
- Lowering of the Central Bank Rate (CBR) - The Monetary Policy Committee (MPC) lowered the CBR rate for two consecutive sittings to 7.00% in April 2020 from 7.25% in March and 8.25% in January 2020, with the aim ensuring affordable credit to customers. This led to a decline in the average commercial lending rate to 12.0% in December 2020 from 12.2% in December 2019 and an 8.4% growth in private sector credit in December 2020 compared to a 7.1% growth recorded in December 2019. Private sector credit to Real Estate sector from banking institutions increased by 7.2% percentage points to 8.7% in December 2020 from 1.5% recorded in December 2019, and,
- Providing guidelines for loan restructuring - The CBK, through their Press Release on Emergency Measures to Mitigate the Adverse Economic Effects on Bank Borrowers from the Coronavirus Pandemic on 18th March, 2020, provided guidelines to banks for loan restructuring arrangements. This required Small and Medium-sized Enterprises (SMEs) and corporate borrowers to contact their banks for assessment and restructuring of their loans based on their respective circumstances arising from the pandemic and the banks were to meet all the costs related to the extension and restructuring of loans. Restructured loans from the real estate sector ranked 2nd after trade, accounting for 20.5% of the restructured loans, indicating that the sector bore the brunt of the economic slowdown.
- The Capital Markets Authority (CMA): CMA is the primary regulator of Real Estate Funds. In response to COVID-19, the regulator took the following measures, all of them administrative:
- Allowing progression of some activities that required Annual General Meetings (AGMs) to be sanctioned – CMA, along with the Central Depository and Settlement Corporation (CDSC) and the Nairobi Securities Exchange (NSE), allowed the progression of some of the activities that are usually sanctioned during Annual General Meetings (AGMs) for listed companies such as remuneration and dividend policy deliberations. Board decisions on these matters would however be required to be tabled at the AGMs, once convened, for ratification. This enabled real estate funds continue with businesses operations,
- Virtual Annual General Meetings (AGMs) – CMA allowed companies to hold virtual AGMs in light of the movement and convening restrictions imposed to curb the spread of COVID-19. This also enabled companies to resume their operations, and,
- Relaxation of disclosure obligations - The regulator relaxed disclosure obligations in relation to publication of financial statements in two newspapers of national circulation until 30th June 2020. This was a welcome move especially by companies which had challenges in publishing this information. Companies were given a leeway to publish disclosures on online platforms such as company websites and social media platforms. Real estate funds saved on publishing costs, boosting their liquidity position.
Section 3: Case Study - The United Kingdom (UK)
Introduction
According to the Financial Stability Report by the European Central Bank, most of the suspended Real Estate funds in Europe were domiciled in the UK. For this reasons, various regulators in the UK responded to the crisis in order to cushion citizens against the tough economic times. In our study, we particularly want to pin-point actions taken by the regulators to support real estate and real estate funds. We shall review the responses by three regulatory bodies; The Government of UK, The Bank of England (BoE), and, The Financial Conduct Authority (FCA). We shall then proceed to discuss the lessons for Kenya from the regulators’ response.
Regulatory Response to support businesses impacted by Covid-19 in the UK
- The Government of UK: The government of UK implemented a raft of measures to support businesses during the economic slowdown as a result of COVID-19. Some of the measures that directly affected the real estate industry include:
- Provision of property tax holidays and Grants: The Government of UK provided Financial Support For Businesses During Coronavirus (Covid-19) by committing £29.0 bn (Kshs 4.4 tn) to support businesses in form of property tax holidays, direct grants for small firms and firms in the most-affected sectors such as retail, hospitality and leisure businesses. In January 2021, the government announced a £4.6 bn (Kshs 0.7 tn) fresh financial support package for retail, hospitality, and leisure companies, which could claim up to £9,000.0 (Kshs 1.3 mn) each,
- Temporary reductions of the VAT rate from 20.0% to 5.0% for the most affected industries: Hospitality and accommodation are integral parts of the real estate sector. In the Revenue and Customs Brief (10) 2020 of July 2020, the government announced temporary reductions of the VAT rate for hospitality, accommodation and attractions to 5.0% from 20.0%. Later in September 2020, the Government extended the VAT reduction by a year to September 2021. This was aimed at boosting the sector’s working capital which in turn boosted liquidity of the real estate sector and real estate funds,
- Provision for deferral of VAT: On 26th March 2020, the government of UK made provisions for VAT Deferrals for businesses, further boosting liquidity. Businesses were however expected to pay their pending taxes in full by 31st March 2021, and,
- Job Retention schemes: The UK also had a Job Retention Scheme, where the government supported eligible businesses by paying their employees.
- The Bank of England (BoE): The Bank of England is UK’s central bank and is tasked with ensuring the stability of the country’s financial system. The BoE, like other regulators, responded to COVID-19 by taking measures to ensure financial soundness and mitigate against adverse COVID-19 effects. Some of the measures include:
- Reducing the Bank Rate by 65 bps to 0.10%: The BoE, through a Special Monetary Policy Committee held on 19th March 2020, reduced the Bank Rate by 15 bps to 0.10% from 0.25%. This was in addition to the 50 bps reduction on 10th March 2020 to 0.25% from 0.75% to facilitate affordable credit facilities,
- Expanding the central bank's Bond Purchase Program: The BoE expanded its holding of UK government bonds and non-financial corporate bonds by £450.0 bn (Kshs 67.7 tn) in three tranches announced in March, June, and November 2020, with the aim of boosting liquidity in markets,
- Launching the joint HM Treasury-Bank of England Covid Corporate Financing Facility and three government loan guarantee schemes: The BoE launched the joint HM Treasury-BoE Covid Corporate Financing Facility and three government loan guarantee schemes; the Coronavirus Business Interruption Scheme, the Coronavirus Large Business Interruption Scheme, and the Bounce Back Loan Scheme, which was replaced by the Recovery Loan Scheme from April 2021, all which provided a total of £352.0 bn (Kshs 52.9 tn) of liquidity and loan guarantees to businesses. This was in line with the government’s agenda of providing support to businesses in the wake of COVID-19, and,
- Reducing the UK countercyclical capital buffer (CCyB) rate to 0.0%: The countercyclical capital buffer (CCyB) rate is a capital requirement applicable to banks and investments. In March 2020, as part of the BoE’s Measures in Response to the Economic Shocks from Covid-19, the regulator reduced the UK countercyclical capital buffer (CCyB) rate to 0.0%. The rate had been at 1.0% and was expected to reach 2.0% by December 2020. It was the expectation of the Financial Policy Committee (FPC) that the rate would remain at 0.0% until at least Q4’2021. The decision by the regulator was to ensure that business and individuals can rely on their banks to provide the much needed credit. Real estate and real estate funds could therefore afford cheap credit to boost their liquidity position.
Regulatory Response to support Real Estate Funds impacted by Covid-19 in UK
- The regulator proposed up to six months wait for property fund redemptions: In an effort to address the Liquidity Mismatch of Authorized Open Ended Property Funds, the regulator proposed that investors give a notice of up to 180 days to cash out in cases where a Property Fund could not quickly sell its assets to meet client redemption requests. This was in order to avoid liquidity squeezes as investors headed for the exit against the backdrop of economic uncertainty. The FCA is still consulting on this in order to come up with an informed final decision,
- The FCA gave guidance to investors on circumstances where it would be in their best interests to suspend some of their cash out orders: In his Speech to Investment Association Members, Edwin Schooling, The director of Markets and Wholesale policy at FCA gave guidance to investors on circumstances where it would be wise to suspend some of their cash out orders, for instance, if executing orders could not be achieved without significantly depleting liquidity and without selling property at a substantial discount. The regulator aimed at protecting investors while maintaining fund managers’ liquidity and ensuring operational resilience,
- FCA supported fund suspensions: The regulator, in its FCA Statement on Property Fund Suspensions, noted that the decision of managers of open-ended commercial real estate (CRE) funds to temporarily suspend dealing in situations where a fair and reasonable valuation of CRE funds could not be established and continued dealing would not in the best interests of fund investors. This boosted investors’ confidence who were assured by the regulator that suspensions were in line with international best practice and were probably in their best interest. Consequently, funds such as ASI Global Real Estate, M+G Feeder of Property Portfolio suspended their funds, which was in line with much of the property market in the UK,
- The FCA suspended the 10.0% depreciation reporting rule: The FCA, in its publication on Expectations Regarding Funds In Light of Coronavirus suspended the 10.0% depreciation rule. The MiFID Org regulation requires firms providing portfolio management services or holding retail client accounts that include leveraged investments to inform investors when the value of their portfolio or leveraged position falls by 10.0% or more compared with its value in their last periodic statement. The pandemic had triggered an increase in the 10.0% depreciation notifications due to the sharp decline in asset values, triggering fund managers to raise concerns with the authority on the impact of notifications on investors. The Regulator therefore suspended the rule in March 2020 and later in September gave a 6-month extension of the suspension. However, fund managers were still required to issue at least one notification within the current reporting period and inform clients of their decision not to further issue the notifications,
- Provided for delayed annual and half-yearly fund reports: In April 2020, the regulator announced its temporary decision of Extending Deadlines to Publish Fund Reports and Accounts. The regulator temporarily accepted delayed annual and half-yearly requests after some firms expressed their inability to meet the deadline. The relief was to last till 30th September 2020, subject to a month’s extension only when deemed necessary, and,
- Allowed virtual general meetings: FCA acknowledged the operational challenges funds were facing and allowed the funds to conduct virtual general meetings, where a unit holder would be considered present if they participated or joined the virtual meeting.
Section 4: Lessons for Kenya and Recommendations
While the real estate sector and real estate funds were affected by the COVID 19 pandemic, it is our view that the Financial Conduct Authority (FCA), the regulatory body of financial and non-financial markets in the UK, made it their aim to not only protect investors, but also the market players. Therefore, it is our view that the regulatory body in Kenya, CMA, should have done more to aid real estate funds during COVID-19 to mitigate the magnitude of liquidity stress that the funds were experiencing as a result of the slowdown in the real estate sector. As it is, the pandemic is going to be with us for a considerable amount of time, hence it remains uncertain when the real estate sector will recover fully. We recommend that the regulator do the following in order to support the real estate sector;
- Provide Leadership – The regulator should be at forefront in providing leadership in such exceptional circumstances, given investors in turbulent times are most likely to trust a third party such as the regulator. Statements assuring the public that actions taken by issuers of real estate securities, if in line with international best practice, are in their best interests in the circumstances show a regulator in tune with the prevailing circumstances and ready to support the capital markets. It is key that the regulator is always concerned about the operational resilience of funds during exceptional circumstances such COVID-19, regardless of whether they are within their regulatory ambit or not,
- Engage in robust consultation: The FCA, before coming up with regulations especially during the COVID-19 pandemic, consulted with stakeholders of interest such as investors and fund managers and other regulators such as the Bank of England through surveys, in order to come up with regulations that are a holistic reflection of the market, especially on contemporary issues such as a notice period being a prerequisite for withdrawal of funds by investors. It is key to note that consultation on the functioning of open-ended real estate funds has been ongoing since 2019 to present. The FCA has been transparent in the process publishing feedback from the respondents and their responses. They have also actively solicited for alternative proposals from market intermediaries who are the people on the ground. Kenya already has a sufficient legal framework to support public participation in law and rule making anchored in the 2010 constitution and supported by the Statutory Instruments Act. Implementation however still remains a challenge, including in the capital markets sector. The regulator should engage the market participants to better understand their challenges and get their views on how particular legislative changes may adversely affect their businesses,
- Ensuring Accountability – While the Constitution, the Statutory Instruments Act and the Fair Administrative Act set out how public bodies including regulatory bodies should exercise their rule-making powers and also how they issue their directives, express provisions in the Capital Markets Act give the role the regulator plays and the impact directives, rules and guidelines by the regulator may have on investor property rights mandating that the directives, rules and guidelines by the regulator should at all times be compatible with the regulator’s duty to not adversely impact competition, be proportionate to the risk of consumer harm or market integrity objective identified and not create undue burden to the industry. A requirement to demonstrate this, on request, may ensure the regulator always exercises due care when exercising its powers. For example, in the UK, where the FCA issues a directive or proposes to amend regulation, it clearly sets out reasons for doing so and a compatibility statement showing it has considered these principles and how it has made sure they are taken into account in its decision making process,
- Clarity on communication: The FCA consistently communicated their position on the appropriateness of actions by funds in light of the exceptional circumstances brought about by Covid 19 through various speeches and publications, promoting co-ordination between the regulator and the industry. The regulator should consider clarity in their communication and continuously engage investors to provide assurance in turbulent times. This ensures that market confidence is maintained as any matters that affect capital markets, whether in the private or public markets, affects the viability of the capital markets as a whole, and,
- Exercise Flexibility: While we would commend the regulator for exercising flexibility during COVID-19 by for example allowing virtual general meetings, we note that the regulator also needed to be flexible in its policies in view of these extraordinary times and also consider measures to accommodate players across the entire capital markets framework. After all, the Capital Markets Act gives the regulator a mandate to assure and protect investors including those who choose to invest in private markets. Working together with industry players to resolve matters rather than alienating and publicly ostracizing industry players facing challenges may not particularly be in investor interest. Taking the example of the FCA, the regulatory body in the UK, they were flexible and agile in their response to the pandemic. In the wake of unprecedented times, the regulator was flexible enough to implement policies in line with fund managers’ requests to ensure that firms were also shielded from the harsh economic times.
Section 5: Conclusion
Real estate funds and the real estate sector as a whole were adversely affected by COVID-19, but received minimal support from the regulator. In our view, regulators should not only play an oversight role in capital markets but also support industry players and provide a conducive environment for them to flourish. In Kenya, as at 2021, Fahari-I-REIT, the only listed real estate fund, has a market capitalization of USD 11.6 mn while South Africa’s REITS have a total market capitalization of USD 13.4 bn. This shows that real estate funds’ growth in Kenya remains muted compared to developed markets. Moreover, despite real estate funds and REITs being attractive investment ventures owing to their high returns and ability to beat inflation, their uptake in Kenya remains quite low. It is our view that going forward, the regulator should adopt proactive and accommodative regulations for the purpose of creating an enabling environment for real estate funds’ success in order to inspire investor-confidence and stimulate growth. The real estate sector and real estate funds also go a long way to promoting economic growth and development through development of infrastructure and promotion of the Housing agenda, in addition to creating employment. With Kenya facing a housing shortage of 2 million units, 250,000 units need to be built annually, and the best way to provide funds to plug the deficit is through capital markets and real estate funds.
Disclaimer: The views expressed in this publication are those of the writers where particulars are not warranted. This publication, which is in compliance with Section 2 of the Capital Markets Authority Act Cap 485A, is meant for general information only and is not a warranty, representation, advice or solicitation of any nature. Readers are advised in all circumstances to seek the advice of a registered investment advisor.

- Talk to us
- Kenya
- P.O Box 20695 - 00200, Nairobi, Kenya
- Cell +254709101200
- Tel +254709101200
- WhatsApp +254741676635
- United States
- +254709101200
- DOWNLOAD OUR APP
-


- Kenya
- 8th Floor, Pinetree Plaza, Kaburu Drive, Ngong Road, Nairobi, Kenya
- USA
- Suite 1150, 1775 Eye Street NW, USA, Washington DC 20006, USA
- Investments
- High Yield
- Private Equity
- Real Estate
- Real Estate
- RiverRun Estates
- Cytonn Towers
- The Ridge
- Taraji Heights
- The Alma