Restructuring an Insolvent Business – Case Study of Nakumatt Holdings, & Cytonn Weekly #12/2018
By Cytonn Research Team, Mar 25, 2018
Executive Summary
Fixed Income
Treasury bills continued to be oversubscribed this week; however, the overall subscription rate declined to 114.0%, from 139.9% recorded the previous week. Yields on the 91, 182 and 364-day T-bills remained unchanged at 8.0%, 10.4%, and 11.1%, respectively. The Monetary Policy Committee (MPC) met on 19th March 2018, and reduced the CBR by 50 bps, for the first time since July 2016, to 9.5% from 10.0%. We are projecting inflation for the month of March to come in between 4.1% and 4.3%, from 4.5% in February, largely due to the base effect, with m/m inflation expected to increase driven by an increase in prices of kerosene and diesel, and electricity prices;
Equities
During the week, the equities market was on an upward trend, with NASI, NSE 20 and NSE 25 rising 4.4%, 1.2%, and 3.9%, respectively, driven by gains in telecom and banking sector stocks such as Safaricom, Standard chartered and Barclays Bank that gained 9.9%, 7.6% and 5.9%, respectively. Equity Group, NIC Group Plc and Standard Chartered Bank released their FY’2017 results, with Equity Group registering a 14.0% increase in core earnings per share, while NIC Group and Standard Chartered registered a 4.3% and 24.0% decline in core earnings per share, respectively;
Private Equity
During the week, we witnessed two exits in the financial services sector, one of the sectors we cover alongside the education and hospitality sectors. Centum Investments finalized two exits: (i) Centum exited its investments in Platinum Credit, where it owned a 25.0% stake, to Suzerian Investment Holdings Limited, and (ii) Centum also exited its investments in GenAfrica Asset Managers, where it owned 73.4%, to New York-based Kuramo Capital LLC. The divestments are expected to realize approximately Kshs 2.7 bn in proceeds;
Real Estate
During the week, KNBS released their January 2018 issue of Leading Economic Indicators, indicating increased activity in the building, construction and tourism sectors. In the residential sector, Shelter Afrique made steps in its plan to develop 5,000 affordable homes in Africa, in countries such as Nigeria, Zambia, Morocco, Côte d'Ivoire, Congo and Kenya through the official announcement of the winners of its Design and Develop Competition launched in June 2016, and Nairobi Hospital revealed plans to provide affordable mortgages to its staff through partnership with MMC Africa Law firm and Barclays Bank of Kenya;
Focus of the Week
Business restructuring refers to a process of re-organizing a company’s ownership, operational and capital structure, in order to make a company more profitable or come out of insolvency, while a business is deemed insolvent when its liabilities exceed its assets. This week, we look at the restructuring of an insolvent business and the rescue mechanisms that can be employed, with a focus on the proposed restructuring of Nakumatt Holdings that was recently put under administration.
- This week, Cytonn Asset Managers Limited, the fund management affiliate of Cytonn Investments, received approval from the Capital Markets Authority of Kenya (CMA) to operate as a Fund Manager, through the granting of a fund management license. Speaking on being granted the license, Edwin H. Dande, the Managing Partner & CEO of Cytonn Investments, said “Cytonn is excited to be joining the list of fund managers in Kenya and we are very thankful to The Authority for having favourably considered our application. We shall do everything we can to contribute to the important work of building and deepening our capital markets. Our capital markets are core to funding businesses, which in turn create jobs and uplift standards of living.” Read the Release and what this means for Cytonn here
- Cytonn Investments Management Plc held its 2018 Market Outlook for its clients on 10th, 17th and 24th March 2018. See Event Note here
- Cytonn’s Managing Partner & CEO, Edwin H. Dande, was the keynote speaker at a Business Leadership School forum, a group of young entrepreneurs who conduct frequent meetings to build their capacity as youthful entrepreneurs, and deliberate on different entrepreneurship opportunities available for youth in Nairobi. At the forum, Edwin spoke to the group about entrepreneurship. See Event Note here
- Our Investment Analyst, Stephanie Onchwati, discussed the current cost of living in the country. Watch Stephanie on Citizen TV here
- Our Research Analyst, Nancy Murule, discussed the state of investment in property and real estate. Watch Nancy on NTV here
- Our Investment Analyst, Caleb Mugendi, discussed Equity Bank’s FY’2017 financial results. Watch Caleb on CNBC here
- Cytonn Foundation, the corporate social investment arm of Cytonn Investments that focuses on giving back to the society through skill development, held a Private Wealth Management Training (WMT) for the Management University of Africa (MUA) Staff members on 21st March 2018. See Event Note here. We continue to see very strong interest in our weekly Private Wealth Management Training (largely covering financial planning and structured products). The training is at no cost and is open only to pre-screened participants. We also continue to see institutions and investment groups interested in the trainings for their teams. The Wealth Management Trainings are run by the Cytonn Foundation under its financial literacy pillar. If interested in our Private Wealth Management Training for your employees or investment group, please get in touch with us through wmt@cytonn.com or book through this link Wealth Management Training. To view the Wealth Management Training topics, click here
- We continue to hold weekly workshops and site visits on how to build wealth through real estate investments. The weekly workshops and site visits target both investors looking to invest in real estate directly and those interested in high yield investment products to familiarize themselves with how we support our high yields. Watch progress videos and pictures of The Alma, Amara Ridge, The Ridge, and Taraji Heights. Key to note is that our cost of capital is priced off the loan markets, where all-in pricing ranges from 16.0% to 20.0%, and our yield on real estate developments ranges from 23.0% to 25.0%, hence our top-line gross spread is about 6.0%. If interested in attending the site visits, kindly register here
- For recent news about the company, see our news section here
- We have 10 investment-ready projects, offering attractive development and buyer targeted returns of around 23.0% to 25.0% p.a. See further details here: Summary of Investment-Ready Projects
- We continue to beef up the team with ongoing hires for: Risk & Compliance Associate, Financial Advisors and Unit Managers for Mt Kenya Region, among others. Visit the Careers section at Cytonn’s Website to apply
Treasury bills were oversubscribed during the week, with the overall subscription rate declining to 114.0%, from 139.9%, recorded the previous week. The subscription rates for the 91, 182 and 364-day papers came in at 54.6%, 78.2%, and 173.6% compared to 63.8%, 114.2%, and 196.0% respectively, the previous week. Yields on the 91, 182 and 364-day T-bills remained unchanged at 8.0%, 10.4%, and 11.1%, respectively. The overall acceptance rate decreased to 83.8% compared to 86.2% the previous week, with the government accepting a total of Kshs 22.9 bn of the Kshs 27.4 bn worth of bids received, against the Kshs 24.0 bn on offer. The government is currently 18.3% ahead of its domestic borrowing target for the current fiscal year, having borrowed Kshs 257.4 bn, against a target of Kshs 217.5 bn (assuming a pro-rated borrowing target throughout the financial year of Kshs 297.6 bn from the 2018 Budget Policy Statement (BPS)).
Last week, the Kenyan Government issued two bonds, a 5-year (FXD 1/2018/5) and a 20-year (FXD 1/2018/20) in a bid to raise Kshs 40.0 bn for budgetary support. The overall subscription rate for the issue came in at 128.5%, with the market weighted average bid rates coming in at 12.4% and 13.4%, 10 bps above the average accepted rates of 12.3% and 13.3%, respectively, in line with our expectations. The government accepted Kshs 31.6 bn out of the Kshs 51.4 bn worth of bids received, translating to an acceptance rate of 61.4%. However, as detailed in our Cytonn Weekly #8/2018, we don’t expect the government to come under pressure to borrow for the current fiscal year as (i) the government is currently 18.3% ahead of its domestic borrowing target, (ii) KRA is not significantly behind target in revenue collection, having collected 91.2% of their H1’2017/18 target, (iii) the government has borrowed 72.9% of its full year foreign borrowing target of Kshs 323.2 bn, up from 69.9% last week, following the signing of the Kshs 9.5 bn loan from the Japan International Cooperation Agency (JICA) for the rehabilitation of the Olkaria 1, 2 and 3 Geothermal Power Projects, and (iv) the Treasury is working on a Supplementary Budget that will see reduction of expenditure targets for this fiscal year as the development expenditure budget absorption rate remains below 80.0%.
Liquidity levels declined in the market as indicated by the rise in the interbank rate to 4.6% from 4.3% recorded the previous week, and there was a decrease in the average volumes traded in the interbank market by 9.9% to Kshs 15.2 bn, from Kshs 16.8 bn the previous week.
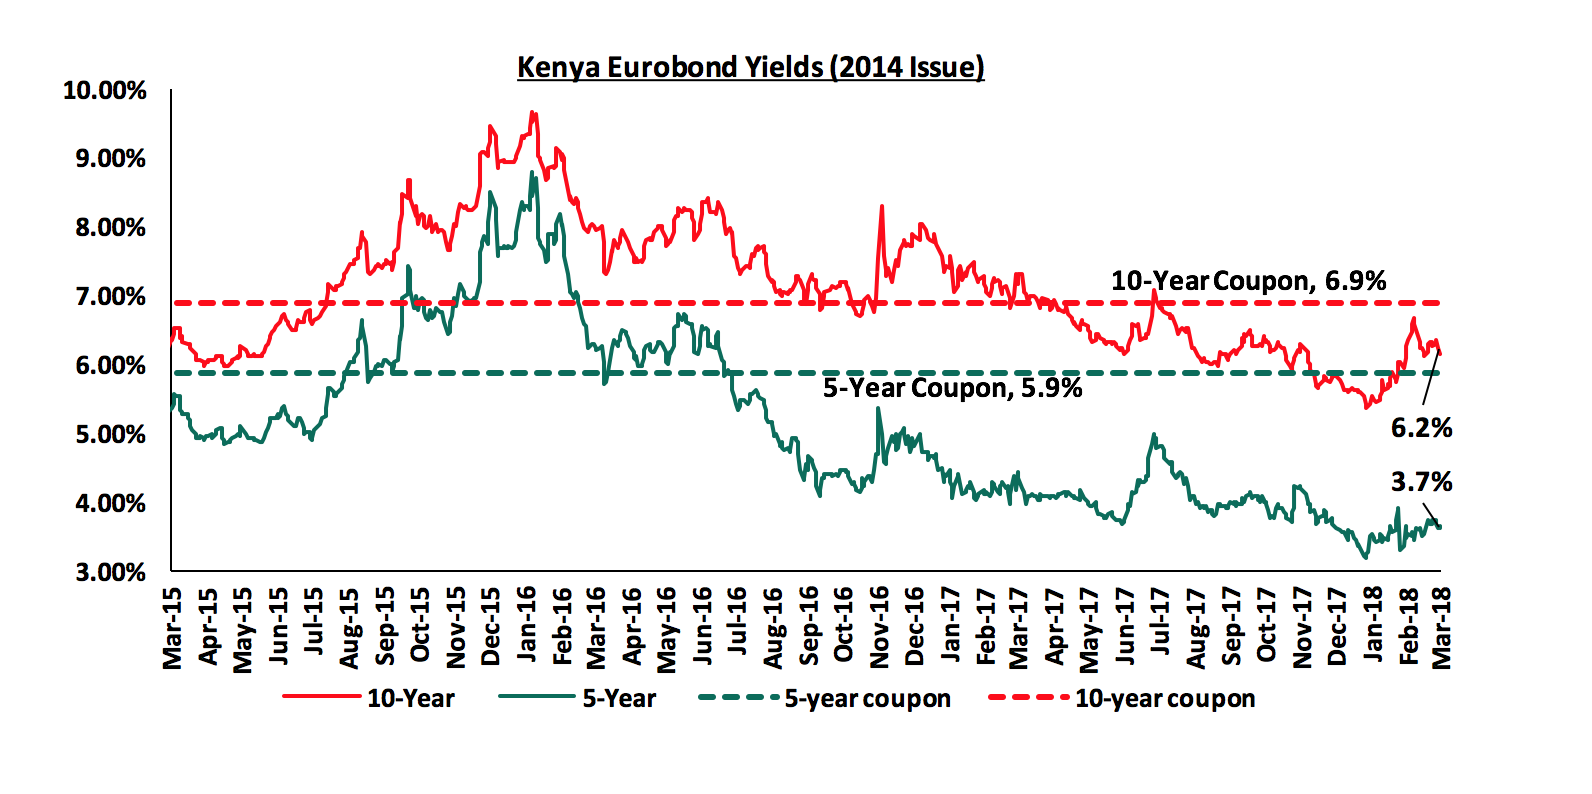
According to Bloomberg, yields on the 5-year and 10-year Eurobonds issued in June 2014 increased by 10 bps each to 3.7% and 6.2% from 3.6% and 6.1%, respectively, the previous week. Since the mid-January 2016 peak, yields on the Kenya Eurobonds have declined by 5.1% points and 3.4% points for the 5-year and 10-year Eurobonds, respectively, due to the relatively stable macroeconomic conditions in the country. Key to note that these bonds currently have 1.2 and 6.2 years to maturity for the 5- year and 10-year, respectively.
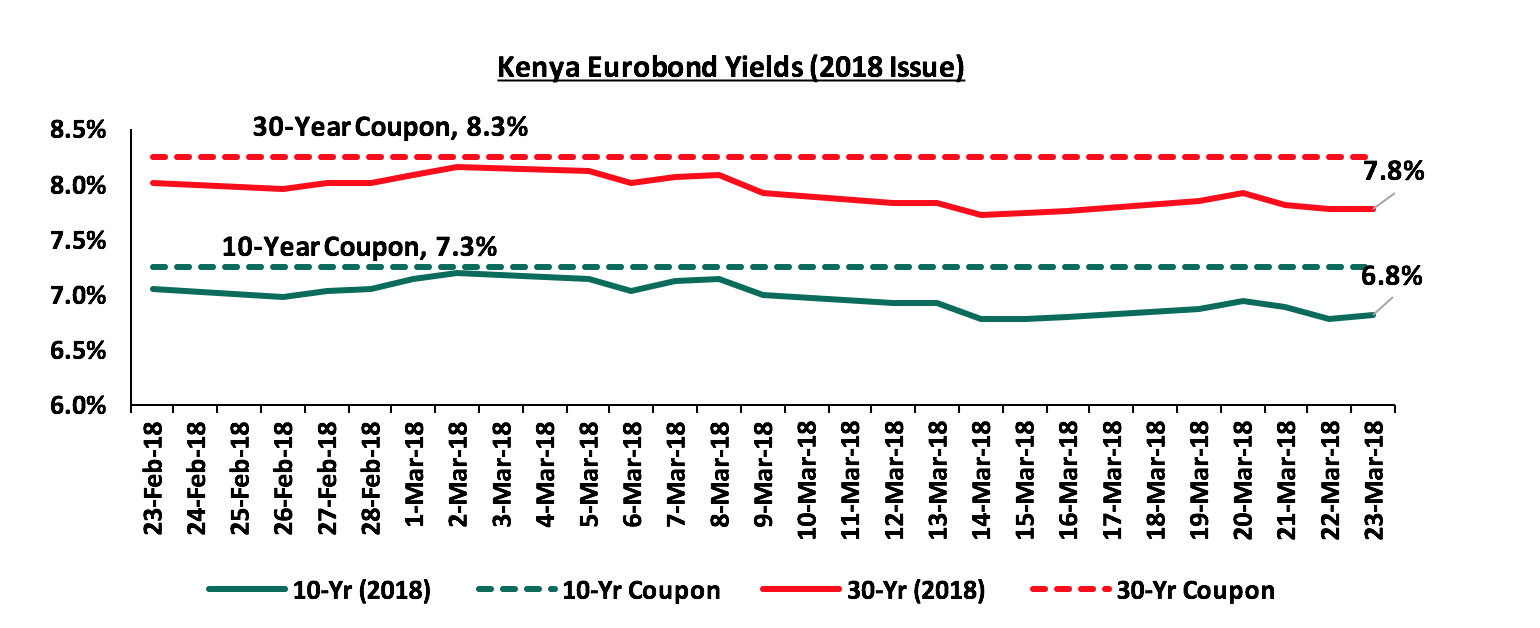
For the February 2018 Eurobond issue, during the week, the yields on the 10-year and 30-year Eurobonds remained unchanged at 6.8% and 7.8%, the previous week. Since the issue date, yields on the 10-year and 30-year Eurobonds have declined by 0.2% points each, indicating foreign investor confidence in Kenya’s macro-economic prospects.
The Kenya Shilling appreciated by 0.3% against the US Dollar, during the week, to close at Kshs 101.0, from Kshs 101.3 the previous week, mainly driven by positive sentiments from investors interested in Kenyan assets as foreign exchange reserves improved to USD 8.8 bn when proceeds from the Eurobond were called in by the Treasury. On a YTD basis, the shilling has gained 2.1% against the USD. In our view, the shilling should remain relatively stable against the dollar in the short term, supported by:
- Weakening of the USD in the global markets as indicated by the US Dollar Index, which shed 9.9% in 2017, and has shed 2.9% YTD, as the Euro and the Sterling Pound continue to strengthen against the USD with the continued recovery of the Eurozone. The USD weakened further despite the Fed rate hike that took place during the week,
- Improving diaspora remittances, which increased by 26.6% to USD 203.8 mn in December 2017 from USD 160.9 mn in December 2016, driven by a 39.2% and 30.9% increase in remittances from North America and Europe, respectively, and,
- CBK’s intervention activities, as they have sufficient forex reserves, currently at USD 8.8 bn (equivalent to 5.9 months of import cover), an increase from USD 7.2 bn previously following the receipt of proceeds from the recently issued Eurobonds, and the USD 1.5 bn (equivalent to approx. 1 month of import cover) stand-by credit and precautionary facility by the IMF, still available until September 2018, after which a new facility will be discussed.
The Monetary Policy Committee (MPC) met on Monday 19th March 2018 to review the prevailing macroeconomic conditions and gave direction on the Central Bank Rate (CBR). The MPC decided to reduce the CBR to 9.5% from 10.0%, for the first time since July 2016, noting that there was room for monetary policy easing to further support economic activity, as evidenced by:
- inflation, which eased to 4.5% in February 2018 from 4.8% in January, and has remained well within the government target range of 2.5% - 7.5%, and
- increased private sector optimism as per the MPC Private Sector Market Perception Survey conducted in March 2018 that showed that the private sector was nearly unanimously optimistic about local economic prospects in 2018. This was mainly attributed to a relatively stable operating environment, improving weather conditions, continued infrastructure investment by the government, direct flights to-and-from the USA, and perceived political stability that has resulted in improving investor confidence.
The decision to lower the CBR was not in line with our expectation to maintain the rate at 10.0% as mentioned in our MPC Note. We believed that the MPC would have adopted a wait and see approach given the stability in the macroeconomic environment, as evidenced by (i) inflation having eased to 4.5% from 4.8% since the last meeting, (ii) the government being under no pressure to borrow from the local markets since they are ahead of their domestic borrowing target, and (iii) the currency having appreciated by 1.5% since the last meeting on January 22nd, 2018. We also reasoned that maintaining the CBR would be the better move given the low private sector credit growth; lowering the CBR would effectively lower lending rates, thus making credit access by the private sector even harder. See the CBK Release.
We are projecting the inflation rate for the month of March to range between 4.1% - 4.3%, from 4.5% in February. The y/y inflation rate is expected to decline as a result of a base effect but m/m inflation is expected to rise mainly due to (i) an increase in prices of kerosene and diesel by 0.9% to Kshs 97.9 and , Kshs 77.5 per litre effective until 14th April, and (ii) an increase in electricity prices driven by an 18.6% rise in the fuel levy to Kshs 5.4 per kilowatt hour (kWh) of electricity consumed in March from Kshs 4.5 per kWh in February, as global oil prices continue to recover and we still continue to use thermal electricity powered by diesel generators. Going forward, we expect inflation to average 7.5% over the course of the year down from 8.0% in 2017, which is the upper limit of the government target range of 2.5% - 7.5%. We shall revise our inflation projection for 2018 in our quarterly review of the macroeconomic indicators that we track.
The United States Federal Open Market Committee (FOMC) met on 20th and 21th March 2018 to assess the current state of the US economy and shed light on a possible rate hike. The committee decided to hike the rate to a band of 1.50% - 1.75% from 1.25% - 1.50%. The decision was supported by:
- better forecasts for GDP growth, with the Fed raising their 2018 projection to 2.7% from 2.5% in December 2017,
- a strong labour market, with the unemployment rate at 4.1%, below the full employment target of 5.0%. The 2018 projection is at 3.8%, an improvement from the 3.9% projection as at December 2017, and
- near-target inflation expectations, with the Fed maintaining their 2018 projection at 1.9%, just shy of their 2.0% target, and raising the 2019 projection to 2.1% from 2.0% previously.
The committee observed the economic outlook has strengthened since the last meeting, owing to moderate expansion of economic activity and a stronger labor market. We expect two more rate hikes in 2018 supported by projected improved economic growth in the U.S.
Rates in the fixed income market have remained stable as the government rejects expensive bids. With the government under no pressure to borrow for this fiscal year as (i) they are currently ahead of their domestic borrowing target by 18.3%, (ii) have met 72.9% of their total foreign borrowing target for the current fiscal year, and (iii) the KRA is not significantly behind target in revenue collection, we expect interest rates to remain stable. With the expectation of a relatively stable interest rate environment, our view is that investors should be biased towards medium to long-term fixed income instruments
During the week, the equities market was on an upward trend, with NASI, NSE 20 and NSE 25 rising 4.4%, 1.2%, and 3.9%, respectively, driven by gains in the telecom and banking sector stocks such as Standard Chartered, Safaricom and Barclays Bank that gained 9.9%, 7.6% and 5.9%, respectively. For the last twelve months (LTM), NASI, NSE 20 and NSE 25 have gained 47.9%, 24.8%, and 44.7%, respectively.
Equities turnover declined by 56.3% to USD 8.3 mn from USD 19.1 mn registered last week. We expect the market to remain supported by positive investor sentiment this year, as investors take advantage of the attractive stock valuations on select counters.
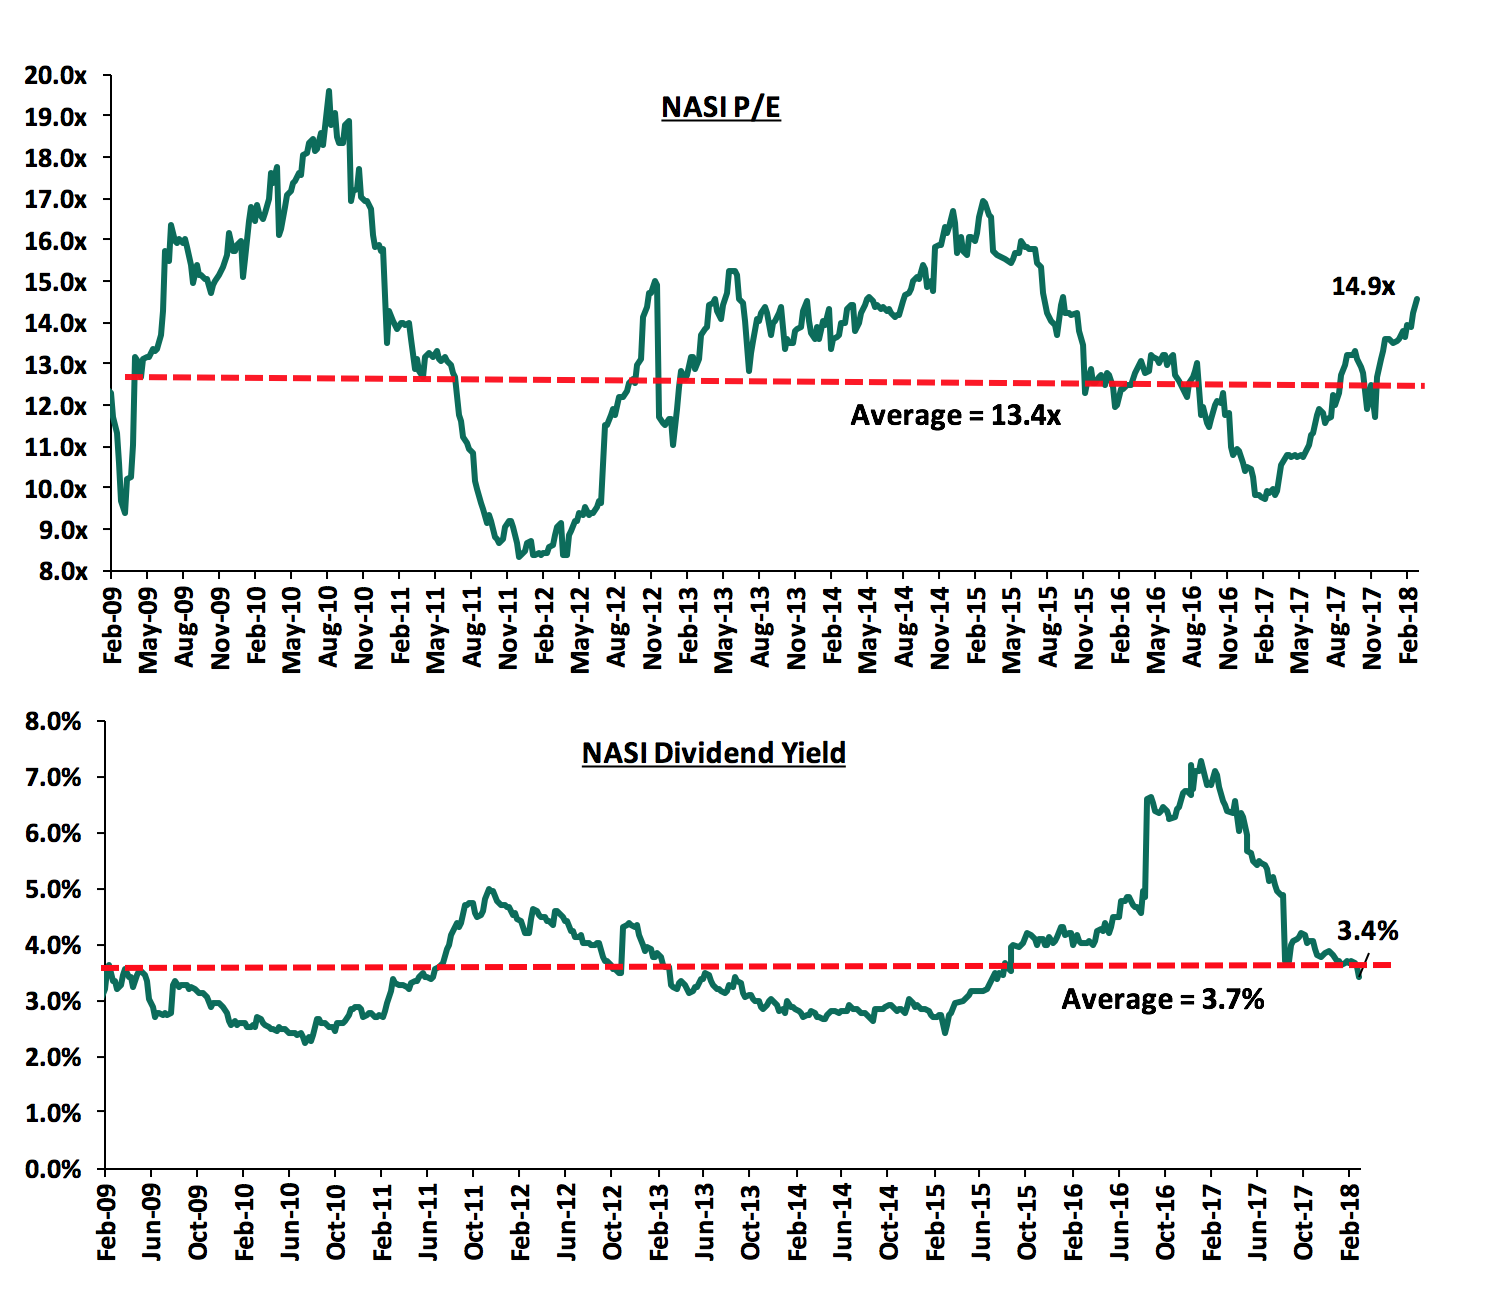
The market is currently trading at a price to earnings ratio (P/E) of 14.9x, which is 11.2% above the historical average of 13.4x, and a dividend yield of 3.4%, slightly below the historical average of 3.7%. The current P/E valuation of 14.9x is 62.0% above the most recent trough valuation of 9.2x experienced in the first week of February 2017, and 79.5% above the previous trough valuation of 8.3x experienced in December 2011.
The Central Bank of Kenya (CBK) released a report outlining the effects of the interest rate cap in the economy. Key points to note from the report include the following:
- The competition in the banking sector reduced largely due to the loss in deposits volumes by the small banks thereby reducing their lending capacity, which has led to the shift of borrowers to the larger banks,
- Banks have also increased non interest charges on loans with the most notable change coming from the appraisals in the mortgage loan facilities to a standard fee of 2.5% from an earlier 0.5% and 1% for repeat borrowers and first-time borrowers, respectively,
- There has also been a shift in the sources of revenue to non-funded income by enhancing fees and commissions. Return on equity (ROE) and return on assets (ROA) have been on the decline with the ROE and ROA being at their lowest at 19.8% in February 2017 and 2.3% in January 2017, respectively. The decline in returns has led to the reduction in capital buffers to absorb shocks as a result of increased balance sheet risks for most banks,
- Liquidity in the industry remained stable averaging above 35% against a minimum requirement of 20%,
- There was a shift in deposits with more inclination towards demand deposits following the enactment of the interest rate cap, limiting the lending capacities of banks and consequently slowing credit growth in the private sector. The CBK predicts that the borrowers locked out by the commercial banks will seek more expensive loans from institutions not subject to the rate cap such as SACCOS, Micro financial institutions, and non-regulated lenders.
In conclusion, the Central Bank noted that the interest rate cap undermined and complicated the CBK’s capability to effectively conduct its monetary policy responsibility. There has been a reduction in average loan sizes, as banks shun away from small risky borrowers, and opting to lend to the government, which offers higher returns on a risk-adjusted basis. Demand for credit increased in contrast to a decline in credit growth. Key to note is that income streams from banks are shifting, with more focus on non-interest income such as fees and commissions on loans to offset the decline in interest income.
Equity Group Holdings released FY’2017 results during the week;
Equity Group Holdings released FY’2017 results, registering a 14.0% increase in its core earnings per share (EPS) to Kshs 5.0 from Kshs 4.4 in FY’2016, higher than our expectations of a core EPS of Kshs 4.2. The performance was mainly driven by a 1.8% increase in operating income coupled with a 2.1% decline in operating expenses.
Highlights for the performance from FY’2016 to FY’2017 include:
- Total operating revenue grew by 1.8% to Kshs 65.2 bn up from Kshs 64.0 bn in FY’2016, driven by a 24.2% increase in Non-Funded Income to Kshs 27.6 bn up from Kshs 22.2 bn in FY’2016, which offset a 10% decline in Net Interest Income to Kshs 37.6 bn from Kshs 41.8 bn in FY’2016,
- Interest Income declined by 6.6% y/y to Kshs 48.4 bn from Kshs 51.8 bn in FY’2016, largely due to a 21.3% decline in interest income on loans and advances to Kshs 33.9 bn from Kshs 43.1 bn. However, interest income on government securities grew by 27.3% to Kshs 128.0 bn from Kshs 100.6 bn in FY’2016. As a result of the decline in interest income, the yield on interest-earning assets declined to 11.6% from 13.8% in FY’2016,
- Interest expense increased by 8.1% to Kshs 10.8 bn from Kshs 10.0 bn in FY’2016, following a 10.7% increase in customer deposits to Kshs 373.1 bn from Kshs 337.2 bn in FY’2016. Cost of funds came in at 2.7%, unchanged from FY’2016. Net Interest Margin declined to 9.0% from 11.1% in 2016,
- Non-Funded Income recorded a growth of 24.2% to Kshs 27.6 bn from Kshs 22.2 bn in FY’2016, driven by a 24.3% increase in Forex Income to Kshs 4.1 bn from Kshs 3.3 bn. Other fees and commissions increased by 33.9% to Kshs 5.9 bn from Kshs 4.4 bn. This growth can be credited to an increase in transactions over digital platform. The Equitel app contributed the most transactions via the online platform accounting for 94% of all transactions done in FY’2017. The revenue mix currently stands at 58:42 Funded to Non-Funded Income from the 65:35 recorded in FY’2016, owing to an increase in NFI coupled with a decline in NII,
- Total Operating expenses decreased by 2.1% to Kshs 38.3 bn from Kshs 39.1 bn in FY’2016. This was driven by a decline in the loan loss provision by 48.4% to Kshs 3.4 bn from Kshs 6.7 bn in FY’2016. The lower provisioning was justified by the Group’s risk averse attitude to risky loans during the year with the Group’s NPL ratio standing at 6.2%. Staff Costs expenses declined slightly by 1.3% to Kshs 11.5 bn from Kshs 11.6 bn FY’2016,
- The Cost to Income ratio improved to 58.7% from 61.1% in FY’2016, mainly credited to the 48.4% decline in loan loss provision (LLP). Without LLP, the cost to Income ratio deteriorated to 53.5% from 50.7% in FY’2016,
- Profit before tax experienced a growth of 7.9% to Kshs 26.9 bn from Kshs 24.9 bn, while profit after tax grew by 14.0% to Kshs 18.9 bn from Kshs 16.6 bn in FY’2016. The effective tax rate declined to 28.7% from 34.4% in FY’2016,
- The bank recommended a dividend of Kshs 2.0 per share similar to that of FY’2016, translating to a dividend yield of 3.8%
- Total assets grew by 10.7% to Kshs 524.5 bn from Kshs 473.7 bn in FY’2016, mainly driven by the 27.3% increase in government securities to Kshs 128.0 bn from Kshs 100.6 bn in FY’2016. Net loans grew by 4.9% to Kshs 279.1 bn from Kshs 266.1 bn in FY’2016,
- Total liabilities rose by 10.1% to Kshs 431.3 bn from Kshs 391.7 bn, driven by a 10.7% increase in customer deposits to Kshs 373.1 bn from Kshs 337.2 bn in FY’2016. Borrowed funds grew by 0.8% to Kshs 46.1 bn from Kshs 45.6 bn in FY’2016, while deposits per branch grew by 4% to Kshs 1.3 bn from 1.27 bn FY’2016,
- The faster growth in deposits as compared to loans led to a decline in the loan to deposit ratio (LDR) to 74.8% from 78.9% in FY’2016,
- Gross non-performing loans decreased by 18.1% to stand at Kshs 18.0 bn down from Kshs 18.8 bn in FY’2016, improving the Non-Performing Loans ratio to 6.2% from 6.8% in FY’2016,
- Shareholders’ funds increased by 13.6% to Kshs 93.1 bn from Kshs 82.0 bn in FY’2016. This is largely due to a 25.6% growth in retained earnings to Kshs 11.4 bn from Kshs 9.1 bn in FY’2016,
- Equity Group Holdings is sufficiently capitalized with a core capital to risk weighted assets ratio at 19.8%, with an excess of 9.2% above the statutory requirement of 10.5%. Total capital to risk weighted assets increased to 20.5% from 19.7% in FY’2016,
Going forward, we expect Equity Group’s growth to be propelled by;
- Channel diversification, with the Equitel mobile platform proving a key revenue driver for the bank, allowing a more efficient and customer convenient channel that allows for more transactional fee-based income, thus increasing its Non-Funded Income.
For a comprehensive analysis, see our Equity Group FY’2017 Earnings Note.
Standard Chartered Bank released FY’2017 results during the week;
Standard Chartered Bank released FY’2017 results, registering a decline of 24.0% in core earnings per share to Kshs 19.6 from Kshs 25.9 in FY’2016, higher than our expectation of a core EPS of Kshs 17.7. The performance was impacted by a 2.1% decline in operating income, coupled with a 17.7% increase in operating expenses.
Highlights for the performance from FY’2016 to FY’2017 include:
- Total operating income declined by 2.1% to Kshs 27.4 bn from Kshs 28.0 bn, as a result of a decrease in the Net Interest Income (NII) by 4.1% to Kshs 18.6 bn from Kshs 19.4 bn, while Non-Funded Income (NFI) increased by 2.3% to Kshs 8.6 bn from Kshs 8.8 bn,
- Interest income increased by 1.9% to Kshs 26.3 bn from Kshs 25.8 bn in FY’2016. The interest income on loans and advances declined by 8.1% to Kshs 13.6 bn from 14.8 bn, while interest income on government securities increased by 11.9% to Kshs 11.3 bn from Kshs 10.1 bn. As a result, the yield on interest-earning assets declined to 8.4% from 9.7% in FY’2016,
- Interest expense increased by 20.3% to Kshs 7.7 bn from Kshs 6.4 bn in FY’2016, following a 12.3% increase in the interest expense on customer deposits to Kshs 6.4 bn from Kshs 5.7 bn in FY’2016, and an increase in other interest expenses by 83.3% to Kshs 1.1 bn from Kshs 0.6 bn in FY’2016. Consequently, the cost of funds increased to 3.7% from 3.5% in FY’2016. The Net Interest Income declined by 4.1% to Kshs 18.6 bn from 19.4 bn, and as a consequence the Net Interest Margin declined to 8.4% from 9.7%,
- Non-Funded Income (NFI) increased by 2.3% to Kshs 8.8 bn from Kshs 8.6 bn in FY’2016. The growth in NFI was driven by a 33.3% increase in other income to Kshs 1.6 bn from Kshs 1.2 bn in FY’2016. Forex income decreased by 3.6% from Kshs 2.8 bn to Kshs 2.7 bn. Income from fees and commissions remained flat at Kshs 4.6 bn. The revenue mix currently stands at 68:32 Funded to Non-Funded Income from the 69:31 recorded in FY’2016, owing to an increase in NFI coupled with a decline in NII,
- Total operating expenses increased by 17.7% to Kshs 17.3 bn from Kshs 14.7 bn, largely driven by a 90.9% increase in the loan loss provision to Kshs 4.2 bn from Kshs 2.2 bn in FY’2016. The higher provisioning was as a result of aggressive lending to the retail segment, whose access to credit was affected by the interest rate cap law,
- The cost to income ratio worsened to 63.2% from 52.5% in FY’2016, due to the rise in loan loss provisioning in 2017. Without LLP, the Cost to income ratio also worsened, albeit marginally from 44.7% in FY’ 2016 to 47.9% in FY’ 2017,
- Profit before tax declined by 24.3% to stand at Kshs 10.1 bn from Kshs 13.3 bn. Profit after tax declined by 24.0% to Kshs 6.9 bn from Kshs 9.0 bn in FY’2016,
- The bank recommends a final dividend of Kshs 17 per share, subject to shareholders’ approval translating to a dividend yield of 7.3%. The proposed dividend per share declined by 15% from Kshs 20 in FY’2016,
- Total assets increased by 14.1% to Kshs 285.7 bn from Kshs 250.5 bn in FY’2016. This growth was largely driven by an increase in investment in government securities by 26.7% to stand at Kshs 104 bn from Kshs 81.7 bn in FY’2016. Also there was a 2.9% increase in the loan book to Kshs 126.3 bn from Kshs 122.7 bn,
- Total liabilities rose by 16.6% to Kshs 240.1 bn from Kshs 205.9 bn in FY’2016, driven by a 14.3% increase in total deposits to Kshs 213.3 bn in FY’2017 from Kshs 186.6 bn in FY’2016. Deposits per branch closed the year at Kshs 5.6 bn up by 14.3% from Kshs 4.9 bn in FY’2016,
- The faster increase in the deposits as compared to the loans resulted to a decrease in the loan to deposit ratio to 59.2% in FY’2016 from 65.8% in FY 2017,
- Gross non-performing loans increased by 17.3% to Kshs 17.6 bn from Kshs 15.0 bn. The NPL ratio deteriorated to 12.6% in FY’2017 from 11.3% in FY’2016 as NPLs increased at a higher rate than the loan book,
- Shareholders’ funds increased by 2.5% from Kshs 44.6 bn in FY’2016 to Kshs 45.7 bn in FY’2017. This is largely due to a 4.5% increase in retained earnings to Kshs 28.0 bn from 26.8 bn.
- Standard Chartered Bank is currently sufficiently capitalized with a core capital to risk weighted assets ratio of 15.6%, 5.1% above the statutory requirement. In addition, the total capital to risk weighted assets ratio stands at 18.5%, exceeding the statutory requirement by 4.0%.
Going forward, we expect Standard Chartered Bank’s growth to be propelled by;
- Channel diversification to more efficient and customer convenient channels such as mobile and digital channels that allow for more transactional fee-based income, thus increasing its Non-Funded Income,
- Improvements in asset quality, with the increase in NPLs causing Standard Chartered bank’s Gross Non-Performing Loans ratio to deteriorate to 12.6%, which is way above peer average of 8.2%.
For a comprehensive analysis, see our Standard Chartered Bank FY’2017 Earnings Note.
NIC Group PLC released FY’2017 results during the week;
NIC Group released FY’2017 results, registering a decline in core earnings per share by 4.3% to Kshs 6.5 in FY’2017 from Kshs 6.8 in FY’2016, in line with our expectations of Kshs 6.5. Performance was as a result of a 7.7% decline in operating income, despite a 6.8% decline in operating expenses.
Highlights for the performance from FY’2016 to FY’2017 include:
- Total operating revenue declined by 7.7% to Kshs 14.9 bn from Kshs 16.2 bn, driven by an 11.5% decline in Net Interest Income (NII), despite a 3.6% increase in Non-Funded income (NFI). NII declined by 11.5% to Kshs 10.8 bn from Kshs 12.2 bn in FY`2016, while NFI rose by 3.6% to Kshs 4.2 bn from Kshs 4.0 bn in FY'2016,
- Interest Income declined by 3.2% to Kshs 18.4 bn from Kshs 19.0 bn in FY’2016. The interest income on loans and advances alone declined by 13.2% to Kshs 13.1 bn from Kshs 15.2 bn, while interest income on government securities grew by 39.5% to Kshs 5.2 bn from Kshs 3.7 bn. However, the growth in interest income on government securities was not sufficient to offset the decline in interest income on loans. As a result, the yield on interest-earning assets declined to 10.8% from 12.5% in FY’2016,
- Interest expense grew by 11.5% to Kshs 7.6 bn from Kshs 6.9 bn in FY’2016, as a result of a 10.9% increase in interest expense on customer deposits to Kshs 6.0 bn from Kshs 5.4 bn. The cost of funds came in at 5.0% from 5.1% in FY’2016. The Net Interest Margin thus declined to 6.3% from 8.0% in FY'2016 as a result of a decline in interest income and an increase in interest expenses,
- Non-Funded Income (NFI) recorded a growth of 3.6% to Kshs 4.2 bn from Kshs 4.0 bn in FY'2016. The growth in NFI was driven by a 15.6% increase in other fees and commissions to Kshs 1.4 bn from Kshs 1.2 bn in FY'2016, and a 4.9% increase in forex trading income to Kshs 0.9 bn from Kshs 0.8 bn in FY`2016. The current revenue mix stands at 72:28 Funded to Non-Funded Income from 75:25 in FY`2016, due to an increase in NFI and a decline in NII,
- Total operating expenses declined by 6.8% to Kshs 9.3 bn from Kshs 10.0 bn, driven by a 20.5% decrease in Loan Loss Provisions to Kshs 3.0 bn from Kshs 3.7 bn in FY'2016. Staff costs remained flat at Kshs 3.2 bn as a result of a restructuring process that led to a number of staff who were declared redundant during the year being offset by new hires in FY’2017,
- The Cost to Income ratio deteriorated to 62.5% from 61.9% in FY'2016. Without LLP, the Cost to Income ratio also deteriorated to 42.6% from 38.7% in FY'2016,
- Profit before tax declined by 9.2% to Kshs 5.6 bn from Kshs 6.2 bn, while profit after tax declined by 4.3% to Kshs 4.1 bn from Kshs 4.3 bn. The effective tax rate came in at 37.9% from 52.3% in FY`2016,
- The group recommended a first and final dividend of Kshs 1.0 per share, lower than last year's 1.25 translating to a dividend yield of 2.4%. In addition, the NIC Group proposed a bonus issue of 1 share for 10 held,
- Total assets increased by 21.7% to Kshs 206.2 bn from Kshs 169.5 bn in FY'2016. This growth was driven by an increase in government securities and other securities that rose by 77.9% to Kshs 54.2 bn from Kshs 30.5 bn in FY'2016. The loan book also rose by 4.6% to Kshs 119.8 bn from Kshs 114.5 bn in FY’2016,
- Total liabilities rose by 23.2% to Kshs 171.5 bn from Kshs 139.1 bn in FY'2016, driven by a 24.2% increase in deposits to Kshs 138.9 bn from Kshs 111.8 bn in FY'2016. Deposits per branch increased by 8.0% to Kshs 3.0 bn from Kshs 2.8 bn in FY`2016 due to addition of 6 new branches during the year,
- The loan to deposit ratio declined to 86.2% from 102.4% in FY`2016, due to deposits growing faster than the loan book ,
- Gross NPLs increased by 3.7% to Kshs 11.9 bn from Kshs 11.4 bn in FY`2016 due to a tough business environment during the year. The NPL ratio however remained steady at 11.1%, compared to 11.2% in FY’2016. Gross coverage ratio improved to 48.6% from 32.8% due to increased focus on collections and the setting up of a credit advisory group (CRAG) division that worked with struggling clients to ensure that the outstanding loan is paid. The NPL by business area breakdown is at 67.7%, 21.8% and 10.5% for corporate, SME and retail, respectively,
- Shareholders’ funds for the whole group increased by 14.8% to Kshs 34.2 bn from Kshs 29.8 bn in FY’2016. However, shareholders’ funds for the bank declined by 4.3% due to restructuring of the group as certain assets were retained in the group,
- NIC Group is currently sufficiently capitalized with a core capital to total liabilities at 21.4%, 13.4% above the statutory requirement, with core capital to total risk weighted assets at 16.3%, 5.8% above the statutory requirement, total capital to total risk weighted assets at 19.6%, 5.1% above the minimum statutory requirement.
Going forward, we expect NIC Group’s growth to be propelled by looking at the following areas;
- NIC Group’s NFI is way below industry average, yet it has fee income businesses such as NIC Securities and NIC Capital. NIC Group is really performing way below its potential on fee income businesses and this should be a key area of focus to improve profitability,
- Improvements in asset quality, with the establishment of the Credit Advisory Group (CRAG) division expected to improve the credit appraisal process, and in turn reduce NIC Group’s NPLs. NIC Group’s Gross Non-Performing Loans ratio came in at 11.1%, which is way above industry average of 8.2%,
- Better deployment of deposits, which grew strongly by 24.2% leading to an 11.5% growth in interest expense, but the bank was not able to deploy the strong deposit growth into yielding assets, leading to an 11.5% drop in NII , and
- Leveraging on their diversification strategy to grow their Non-Funded Income to contribute more to total revenue, including asset finance where the bank maintains a pole position in the industry, and bancassurance through its NIC Insurance Agents.
For a comprehensive analysis, see our NIC Group FY’2017 Earnings Note.
Below is a summary of the FY’2017 results for the 7 listed banks that have released, and key take-outs from the results:
|
Listed Banks FY'2017 Earnings and Growth Metrics |
|||||||||||
|
Bank |
Core EPS Growth |
Interest Income Growth |
Interest Expense Growth |
Net Interest Income Growth |
Net Interest Margin |
Non-Funded Income (NFI) Growth |
NFI to Total Operating Income |
Growth in Total Fees& Commissions |
Deposit Growth |
Loan Growth |
Growth in Govt. Securities |
|
Equity Group |
14.0% |
(6.6%) |
8.1% |
(10.2%) |
9.0% |
24.2% |
42.0% |
22.0% |
10.7% |
4.9% |
27.3% |
|
KCB Group |
(0.1%) |
1.4% |
(3.1%) |
2.9% |
8.7% |
2.5% |
32.2% |
16.4% |
11.5% |
9.6% |
7.4% |
|
Stanbic |
(2.5%) |
(3.0%) |
(5.3%) |
(2.0%) |
5.2% |
10.0% |
44.2% |
38.6% |
24.1% |
8.1% |
42.6% |
|
NIC Group |
(4.3%) |
(3.2%) |
11.5% |
(11.5%) |
6.3% |
3.6% |
27.9% |
14.2% |
24.2% |
4.6% |
77.9% |
|
Barclays Bank |
(6.4%) |
(3.4%) |
(7.2%) |
(2.4%) |
9.7% |
(9.5%) |
27.9% |
8.6% |
12.5% |
(0.7%) |
20.1% |
|
Co-op Bank |
(10.0) |
(4.5%) |
(3.9%) |
(4.7%) |
9.2% |
5.6% |
32.4% |
0.3% |
9.2% |
7.1% |
19.7% |
|
Stanchart |
(24.0%) |
1.9% |
20.3% |
(4.1%) |
8.4% |
2.3% |
32.1% |
(0.4%) |
14.3% |
2.9% |
26.7% |
|
Weighted Average** |
(1.4%) |
(2.7%) |
2.8% |
(4.4%) |
8.7% |
8.5% |
35.1% |
13.7% |
12.5% |
5.7% |
23.4% |
* *The weighted average is based on Market Cap as at 23rd March, 2018
Key take-aways:
- Equity Group is the only bank that recorded an increase in core EPS, registering strong growth of 14.0% driven by growth in NFI. All the other 6 banks recorded a decline in core earnings per share, with the average decline in core earnings across the banking sector at 1.4%, owing to the tough operating environment as a result of the interest rate caps and political uncertainty in the country that affected the business environment,
- Average deposit growth came in at 12.5%. However, despite the average deposits having grown, the interest expense paid on deposits recorded a slower growth of 2.8% on average, indicating that banks are growing deposits but opening less interest earning accounts and possibly transferring some existing interest earning accounts to transaction accounts,
- Average loan growth has been recorded at 5.7%, however interest income has decreased by 2.7%, showing the effects of the rate cap,
- Investment in government securities has grown by 23.4%, outpacing loan growth of 5.7%, showing increased lending to the government by banks as they avoid the risky borrowers,
- The average Net Interest Margin in the banking sector currently stands at 8.7%,
- Non-funded income has grown by 8.5%, which included a Fee and Commissions growth of 13.7%. This shows that banks are charging more fee income to improve their income on loans above the rate cap maximum.
In an effort to keep our rankings of companies on the Cytonn Corporate Governance Ranking (Cytonn CGR) Report up-to-date, we continually update the rankings whenever there are changes on any of the 24 metrics that we track, and how this affects the company ranking. This week, NIC Group appointed 3 new directors to the Board, while announcing the exit of 5 Board members. This reduced the Board size to 10 members from 12. In terms of the composition, gender and ethnic diversity of the Board worsened slightly, however their score remained unchanged. Thus NIC Group’s comprehensive score remained unchanged at 66.7%, ranking position 23.
Below is our Equities Universe of Banking Coverage:
|
all prices in Kshs unless stated otherwise |
||||||||||||
|
No. |
Company |
Price as at 16/03/18 |
Price as at 23/03/18 |
w/w Change |
YTD Change |
LTM Change |
Target Price* |
Dividend Yield |
Upside/ (Downside)** |
P/TBv Multiple |
||
|
1. |
NIC Bank*** |
37.3 |
41.3 |
10.7% |
22.2% |
81.3% |
61.4 |
3.0% |
51.9% |
0.8x |
||
|
2. |
Ghana Commercial |
5.3 |
6.0 |
14.3% |
19.0% |
21.2% |
7.7 |
6.3% |
34.8% |
1.7x |
||
|
3. |
Diamond Trust Bank |
215.0 |
218.0 |
1.4% |
13.5% |
103.7% |
281.7 |
1.2% |
30.4% |
1.1x |
||
|
4. |
CRDB |
170.0 |
170.0 |
0.0% |
6.3% |
(8.1%) |
207.7 |
5.4% |
27.6% |
0.7x |
||
|
5. |
I&M Holdings |
124.0 |
125.0 |
0.8% |
(1.6%) |
48.8% |
150.4 |
2.8% |
23.1% |
1.4x |
||
|
6. |
KCB Group |
51.0 |
51.5 |
1.0% |
20.5% |
74.6% |
59.7 |
5.8% |
21.7% |
1.6x |
||
|
7. |
Union Bank Plc |
6.7 |
6.7 |
0.0% |
(14.1%) |
57.6% |
8.2 |
0.0% |
21.6% |
0.7x |
||
|
8. |
Stanbic Bank Uganda |
29.0 |
30.0 |
3.4% |
10.1% |
17.6% |
36.3 |
0.0% |
20.9% |
2.0x |
||
|
9. |
Zenith Bank |
27.8 |
30.2 |
8.6% |
17.8% |
107.6% |
33.3 |
9.8% |
20.1% |
1.4x |
||
|
10. |
HF Group*** |
10.8 |
10.8 |
(0.5%) |
3.4% |
(5.7%) |
11.7 |
4.7% |
13.5% |
0.4x |
||
|
11. |
Barclays |
12.0 |
12.7 |
5.9% |
31.8% |
45.4% |
12.8 |
7.9% |
9.1% |
1.6x |
||
|
12. |
Bank of Baroda |
120.0 |
120.0 |
0.0% |
6.2% |
9.1% |
130.6 |
0.0% |
8.8% |
1.1x |
||
|
13. |
CAL Bank |
1.2 |
1.3 |
5.6% |
21.3% |
77.0% |
1.4 |
0.0% |
6.9% |
1.2x |
||
|
14. |
Bank of Kigali |
295.0 |
295.0 |
0.0% |
(1.7%) |
21.9% |
299.9 |
4.2% |
5.8% |
1.7x |
||
|
15. |
Ecobank |
11.0 |
11.2 |
1.6% |
47.2% |
54.3% |
10.7 |
7.3% |
3.2% |
4.0x |
||
|
16. |
Co-operative Bank |
19.0 |
19.5 |
2.6% |
21.9% |
81.4% |
18.6 |
4.1% |
(0.4%) |
1.7x |
||
|
17. |
UBA Bank |
11.2 |
11.5 |
2.7% |
11.7% |
113.0% |
10.7 |
6.5% |
(0.4%) |
1.0x |
||
|
18. |
Stanchart KE |
213.0 |
234.0 |
9.9% |
12.5% |
17.0% |
201.1 |
7.3% |
(6.8%) |
1.9x |
||
|
19. |
Stanbic Holdings |
89.5 |
91.5 |
2.2% |
13.0% |
39.7% |
79.0 |
5.7% |
(7.9%) |
1.1x |
||
|
20. |
Access Bank |
11.7 |
11.3 |
(3.0%) |
8.1% |
73.6% |
9.5 |
5.8% |
(10.2%) |
0.8x |
||
|
21. |
SBM Holdings |
7.7 |
7.6 |
(0.3%) |
1.9% |
9.1% |
6.6 |
1.3% |
(12.8%) |
0.9x |
||
|
22. |
Guaranty Trust Bank |
44.9 |
46.9 |
4.6% |
15.1% |
81.8% |
37.2 |
5.8% |
(14.9%) |
2.7x |
||
|
23. |
Equity Group |
51.0 |
52.5 |
2.9% |
32.1% |
85.8% |
42.3 |
3.8% |
(15.6%) |
2.3x |
||
|
24. |
Stanbic IBTC Holdings |
50.0 |
45.7 |
(8.7%) |
6.7% |
146.8% |
37.0 |
1.1% |
(17.8%) |
2.9x |
||
|
25. |
National Bank |
8.8 |
8.5 |
(2.9%) |
(9.1%) |
42.9% |
5.6 |
0.0% |
(34.1%) |
0.3x |
||
|
26. |
Stanchart- Ghana |
34.9 |
34.8 |
(0.4%) |
37.6% |
125.9% |
19.5 |
3.2% |
(40.8%) |
5.0x |
||
|
27. |
FBN Holdings |
11.7 |
12.3 |
5.2% |
39.2% |
297.7% |
6.6 |
1.6% |
(44.2%) |
0.7x |
||
|
28. |
Ecobank Transnational |
19.8 |
17.8 |
(10.1%) |
4.7% |
81.6% |
9.3 |
3.4% |
(44.4%) |
0.9x |
||
|
*Target Price as per Cytonn Analyst estimates |
||||||||||||
|
**Upside / (Downside) is adjusted for Dividend Yield |
||||||||||||
|
***Banks in which Cytonn and/or its affiliates holds a stake. For full disclosure, Cytonn and/or its affiliates holds a significant stake in NIC Bank, ranking as the 5th largest shareholder |
||||||||||||
We are “NEUTRAL” on equities for investors with a short-term investment horizon since the market has rallied and brought the market P/E slightly above its’ historical average. However, pockets of value exist, with a number of undervalued sectors like Financial Services, which provide an attractive entry point for long-term investors, and with expectations of higher corporate earnings this year, we are “POSITIVE” for investors with a long-term investment horizon.
Centum Investments Limited, a leading East African investment firm that is cross-listed in the Kenya and Uganda Stock Exchanges, has completed a sale of its 25.0% stake in Platcorp Holdings Limited, the holding company of Platinum Credit, to Suzerain Investment Holdings Limited, for an undisclosed amount. Platinum Credit is a non-banking, non-deposit taking microfinance institution that offers emergency loans to customers in Kenya, Uganda and Tanzania. Centum invested in Platinum Credit in December 2012 with purchase of a 36.0% stake for approximately Kshs 0.8 bn, effectively valuing the microfinance institution at Kshs 2.2 bn at the time of purchase. This stake was thereafter diluted to 33.0% following the entry of a new undisclosed investor. Earlier this year, Centum sold off 8.0% through a partial exit, bringing its shareholding to 25.0%, with the 8.0% being sold for Kshs 432.0 mn, effectively valuing Platinum Credit at Kshs 5.4 bn, a 145.0% increase in value from 2012. Centum announced the sale of the remaining 25.0% for an undisclosed amount. Going by the value of Platinum Credit as at Centum’s partial exit, the divestment from Platinum is set to earn Centum about Kshs 1.3 bn. According to Centum, the investment in Platinum has delivered a 31.0% internal rate of return over the holding period since 2012.
In another transaction by Centum, they reached a deal to sell off a controlling 73.4% stake in fund manager GenAfrica (formerly Genesis Kenya Investment Management Limited) to New York-based equity fund Kuramo Capital LLC. GenAfrica manages assets of about Kshs 157.0 bn as at March 2017. The deal is subject to regulatory approval. According to Centum’s 2017 Annual Report, their stake in GenAfrica is valued at Kshs 1.4 bn. With GenAfrica’s earnings of Kshs 141.0 mn for the year ended March 2017, the transaction could have been carried out at a P/E multiple of 9.95x. Similar transactions that have been carried out in the past include the acquisition 100.0% of ApexAfrica Capital by Axis a Mauritian private equity fund in 2015 for Kshs 470.0 mn, translating to a transaction multiple of 40.2x on a P/E basis. The table below summarises the details of both transactions:
|
Asset Manager Acquired |
Acquirer |
Earnings at Acquisition (Kshs bn) |
Acquisition stake (%) |
Transaction Value (Kshs bn) |
P/E Multiple |
Date |
|
Apex Africa |
Axis (Mauritius) |
0.01 |
100 |
0.5 |
40.2x |
August 2015 |
|
GenAfrica |
Kuramo Capital |
0.1 |
73.4 |
1.4 |
9.95x |
March 2018 |
Proceeds from the sale of stakes in the two firms are expected to boost Centum’s full-year profit for the period ending March 2018. The proceeds from the sale will enable Centum to deploy capital in other planned investment opportunities across various focus sectors including Education, FMCGs, ICT, Power and Real Estate. Centum, has over the past five years exited several firms in which it is not a significant shareholder as its strategy shifted from being primarily a PE investor to adopting a project sponsor or developer business model over the years. Its aim is to achieve partial or full exits of the projects in order to realize gains. The firm in 2015 sold its stake in UAP Holdings to Old Mutual, making a gain of Kshs 2.8 bn over the book value of the stock as highlighted in our Cytonn Monthly January 2015. Also, in 2016, Centum booked a Kshs 1.0 bn gain from the sale of its 21.5% stake in insurance brokerage AON (now Minet Kenya) as highlighted in our Cytonn Weekly #14/2017. The recent two exit deals, in a timespan of one week, are a signal of a healthy local PE market driven by increased investor interest in Kenyan companies, due to strong value potential, and availability of quality investment-grade assets.
Private equity investments in Africa remains robust as evidenced by the increasing investor interest, which is attributed to; (i) rapid urbanization, a resilient and adapting middle class and increased consumerism, (ii) the attractive valuations in Sub Saharan Africa’s private markets compared to its public markets, (iii) the attractive valuations in Sub Saharan Africa’s markets compared to global markets, and (iv) better economic growth projections in Sub Sahara Africa compared to global markets. We remain bullish on PE as an asset class in Sub-Sahara Africa. Going forward, the increasing investor interest and stable macro-economic environment will continue to boost deal flow into African markets.
During the week, the Kenya National Bureau of Statistics (KNBS) released the January 2018 Leading Economic Indicators report, highlighting trends in building, construction and tourism sectors. The key take-outs were as follows:
- In building and construction, the consumption of cement rose by 8.0% to 486,964 MT in January 2018 from 450,960 Metric Tonnes (MT) in December 2017, compared to a 5.9% decline in a similar period last year. The production of cement increased by 1.7% from 502,809 MT in December 2017 to 511,328 MT in January 2018, compared to a 2.1% increase during the same period in 2016 and 2017. Furthermore, the value of buildings approved in Nairobi City Council increased by 14.7% to Kshs 18.8bn in December 2017 from Kshs 16.4bn in November 2017, compared to 6.3% decrease during the same period in 2016. We attribute this to the lodged approvals prior to the elections as investors adopted a wait-and-see approach then bounced back after the conclusion of the elections. Key to note is that there were no buildings approved between August and October 2017 as County Planning Committees were not constituted during the extended electioneering period. This resulted in an overall 41.2% decrease in the value of building approvals to Kshs. 184.7bn in 2017 from Kshs. 314.3bn in 2016, and
- In the tourism sector, the total number of visitors arriving through the Jomo Kenyatta (JKIA) and Moi International Airports (MIA) increased significantly by 45.9% to 105,862 in December 2017 from 72,573 in November 2017. The number of visitors in December 2017 was also 35.9% higher than the number recorded in December 2016 at 77,869. We attribute this growth mainly to improved security and political stability following the conclusion of the electioneering period, thus increasing tourists confidence.
The above are clear indicators of positive sentiments in the real estate and tourism sector. We therefore expect increased supply mainly in the residential sector as they contributed to 68.9% of the approvals in December 2017 and recorded a growth of 22.4% from November 2017, whereas the commercial sector is likely to witness slower development as it recorded only 0.6% growth amid speculations of oversupply. The growth in tourism is expected to further boost the hospitality sector, which had got set back during the electioneering period due to concerns of insecurity, especially in the international market.
In the residential sector this week, Nairobi Hospital announced its partnership with MMC Africa Law firm and Barclays Bank of Kenya in a move aimed at providing affordable mortgages to its staff. The mortgage scheme targets over 600 of the hospital’s employees and will see them enjoy a subsidized interest rate of 6.0% for any mortgage worth Kshs 10.0 mn and below. This is a move in the right direction as it will boost not only the uptake of mortgages but also home-ownership in line with the Kenyan Government’s Big Four agenda to increase home-ownership through the provision of affordable housing. It comes at a time when the number of active mortgage accounts in Kenya dwindled by 1.5% to 24,085 in 2017 compared to 24,458 in 2016, a negative effect of the interest cap that saw financiers tighten their underwriting standards, making access to mortgages more difficult. Other institutions that have begun initiatives to boost mortgage uptake include:
- Standard Chartered Bank, which in February 2018, introduced a scheme to have prospective homeowners borrow up to Kshs 100.0 mn at 13.0% p.a. or at 6.0% p.a. for dollar-denominated mortgages, compared to the Kenya Shilling lending rate of 14.0% at the time, which was 4.0% above the Central Bank Rate of 10.0%,
- A group of SACCOs through “Africa Tenancy Purchase Initiative” launched in July 2017 offering interest-free mortgage financing through tenant-purchase method, which will see members pay an initial 10.0% deposit and the balance paid in installments for a period of 20-years. The initiative not only eliminates interests but also overcomes the obstacle of high deposits required by some mortgage financiers of as high as 30.0% of the house value and
- The World Bank has also proposed having a Kenya Mortgage Refinance Company that mirrors successful models such as those in Malaysia and Morocco and this is expected to see the number of mortgage accounts in Kenya rise to an average of 60,000 mortgages a year from 25,000 mortgages.
We are of the view that the above initiatives, though positive, will boost mortgage uptake albeit at a low rate given the relatively low income levels of several Kenyans, with approximately 74.4% of employees in the formal sector earning Kshs 50,000 per month and below according to KNBS. Assuming 40.0% of their income is spent on mortgage installments, for a 14.0% interest 20-year loan with a 10.0% deposit, these individuals would only afford a house of at most Kshs 1.8 mn. At 6.0% interest, they would afford a house of at most Kshs 3.0 mn. It is therefore evident that developers ought to direct efforts to the provision of more affordable housing to offset the housing deficit in Kenya that currently stands at approximately 2.0 mn units, with an annual shortfall of 200,000 units according to the World Bank.
Shelter Afrique, in the past week, announced the winners of its “5,000 for 5,000 Housing Competition”, kicking off its low-cost housing plan, that will see the construction of 5,000 low-cost units across Africa in countries such as Nigeria, Zambia, Morocco, Côte d'Ivoire, Congo and Kenya. Based on sustainability, practicability, supply chain innovation, beauty and aesthetic, the Pan Africa Housing financier, picked three winners with the winner being Teteh & Associates of Ghana, second place being Morphosis Limited of Kenya, while the third place was awarded to Sharon Davis Design of New York, United States. The competition, which was part of the firm’s plan to have large-scale low-cost housing projects, will see the development of low-cost houses at a cost not more than Kshs 0.5 mn per unit. Kenya is expected to be one of the beneficiaries of the initiative, a move that is in line with the government’s plan to deliver 1.0 mn affordable housing units by 2022 e.g. the Mavoko 55-acre project, which broke ground in November 2017. This and other government incentives such as the 50.0% corporate tax relief to developers who put up at least 100 low-cost residential houses annually are likely to increase supply to the largely underserved low and lower-middle income market segments.
In the hospitality sector, Executive Residency by Best Western Nairobi received the Best Property 21 to 70 Units award at the Serviced Apartments Award 2018, held at Grange Hotel Tower Bridge in London. The serviced apartment development, which is situated along Riverside Drive, came into the market in November 2016 and offers 48, 1 and 2-bedroom fully furnished and serviced units. The development also has two meeting rooms, a restaurant, bar, swimming pool and gym. It is currently the only internationally branded serviced apartment development in Kenya, showing the opportunity in the provision of international-grade serviced apartment facilities that investors could explore. The performance of serviced apartments has been good recording 78.0% occupancy compared to hotels with 49.0% occupancy in 2017, according to Cytonn Hospitality Report 2017
We expect a continued increase in activities in the real estate sector given the conducive operating environment following political calmness and thus increased investor confidence in the economy.
This week’s focus note is on restructuring, given the ongoing restructuring of Nakumatt Holdings.
Business restructuring refers to a process of re-organizing a company’s ownership, operational and capital structure in order to make a company more profitable or come out of insolvency. The need for corporate restructuring arises because of the change in a company’s ownership structure due to a merger or takeover, adverse economic conditions, or adverse changes in the business such as bankruptcy or buyouts. Corporate restructuring may include changes in the asset structure, liability structure or both of them, thus simultaneously reducing tensions between debt and equity holders to facilitate a prompt resolution in case the company is in a distressed situation.
A business is insolvent when its liabilities exceed its assets. However, in practice, insolvency comes about when a business cannot raise enough funds to meet its obligations, or pay debts as and when they fall due. Properly called technical insolvency, it may occur even when the value of a business’ total assets exceeds its total liabilities. Mere insolvency does not afford enough ground for lenders to petition for involuntary bankruptcy of the borrower, or force liquidation of the business.
In Kenya, before the enactment of the Insolvency Act, 2015, there existed no corporate rescue mechanisms and insolvent companies capable of being turned around would inevitably be forced into liquidation, with losses to the creditors and shareholders. The two main rescue mechanisms introduced under the Insolvency Act, 2015 include;
- Administration, and
- Company Voluntary Arrangements
- Administration of Insolvent Companies
Administration is a fairly new development in Kenyan Law, it was introduced by the Insolvency Act, No. 18 of 2015 as an alternative to liquidation with the following key objectives;
- to maintain the company as a going concern,
- to achieve a better outcome for the company’s creditors than liquidation would offer, and
- to realize the property of the company in order to make distributions to secured or preferential creditors.
The process of administration is headed by an Administrator, who may be appointed by an administration order of the court, unsecured creditors, or a company or its directors. An administrator of a company is required to perform the administrator’s functions in the interests of the company’s creditors as a whole.
Once the Administrator is appointed, they are entitled to all the records of the company and are required to present a proposal to the creditors on their plan to salvage the company. The Administrator must therefore set a date for the creditors meeting and invite all the creditors that it knows of, having had access to the books of the company. Only creditors who have filed proof of debt before 4 pm of the day before the Creditors meeting are entitled to vote at the said meeting.
At the Creditors’ meeting, the Administrator must present their proposal to the Creditors who shall vote on it. The percentage of an individual vote shall be determined by the amount of debt owed to the creditor. The creditor may opt to either vote for the proposal without amendments, vote for the proposal with amendments, or reject the proposal altogether. The decision of the creditors meeting shall be final.
- Company Voluntary Arrangements
Company Voluntary Arrangements were also introduced in Kenyan law by the Insolvency Act, No. 18 of 2015. This arrangement is entered into when a company is insolvent and the directors, administrator or liquidator as the case may be, make a proposal to the company’s shareholders and its creditors on the best way to save the company from liquidation. However, there are restrictions placed on Company Voluntary Arrangements, with the arrangement not being an option in the case of the following:
- banking and insurance companies,
- companies under administration or liquidation,
- a company in respect of which a voluntary arrangement has been carried out,
- companies in public-private partnerships, and
- companies with liabilities of over Kshs 1 bn.
The Directors must appoint a person, who must be a licensed insolvency practitioner, to supervise the company for the process of implementing the voluntary arrangement. The Supervisor must within thirty days of the proposal or a longer period allowed by court, submit a report to the court detailing their opinion on the viability of the proposal and whether a meeting of the creditors should be called to vote on it and the date and time of such a meeting.
On the date of the creditors’ meeting, the creditors shall appoint a chairperson who shall divide the creditors into groups of secured creditors, unsecured creditors and preferential creditors. The Creditors shall then vote either to approve the proposal as is, approve it with modifications or reject it altogether. The proposal is approved if voted for by a majority of the members and a majority of each group present at the meeting. The proposal if approved shall be binding on the company and the creditors.
Case Study of Nakumatt Holdings
Nakumatt Holdings is a Kenyan supermarket chain. Until February 2017, Nakumatt was regarded as the largest Kenyan retailer, with 62 branches across the region, (45 in Kenya, 9 in Uganda, 5 in Tanzania and 3 in Rwanda) and a gross turnover of Kshs 52.2 bn. However, what was fueling Nakumatt’s rapid expansion was funding through debt. This included short-term borrowings, bank loans and letters of credit to its numerous suppliers. However, due to a number of reasons, Nakumatt started experiencing serious cash-flow difficulties in 2016. The retailer was therefore unable to meet its financial obligations to landlords, its suppliers and employees. It was for these reasons that the administrator was appointed by an order of the court pursuant to an application filed by unsecured creditors, and Nakumatt Holdings was placed under administration in January 2018.
PKF Consulting Limited (PKF) was appointed as Nakumatt Holdings’ administrator. This was in order to assess the possibility that the company could be revived after a full assessment of the company, and for all creditors of Nakumatt to come forward and register their claims with the retailer.
Having assessed Nakumatt’s last audited accounts as at February 2016, and management accounts as at 31 December 2017, Nakumatt’s current creditor structure was as highlighted below:
|
Current Nakumatt Creditor Structure |
||
|
Nature of Creditor |
Credit Amount (Kshs) |
% |
|
Banks |
6,904,420,252 |
19.3% |
|
Commercial Paper & Short Term Note Holders |
4,796,185,517 |
13.4% |
|
Private Placement Loans |
1,141,228,071 |
3.2% |
|
Kenya Revenue Authority |
1,817,510,671 |
5.1% |
|
Staff Related Liabilities |
1,368,081,380 |
3.8% |
|
Trade Creditors |
18,583,535,586 |
51.9% |
|
Other Creditors |
1,215,011,579 |
3.4% |
|
Total |
35,825,973,058 |
100.0% |
From the table, we find that Trade creditors had the biggest claim against Nakumatt, this includes mainly the suppliers of tradable goods on credit. Their claim accounted for 51.9% of total creditor claims, amounting to Kshs 18.6 bn. The amount of assets securing all of Nakumatt’s debts amount to Kshs 5.2 bn. Nakumatt’s liabilities thus surpass the available assets by Kshs 30.6 bn.
Following the assessment of Nakumatt’s financial position, the administrator determined that if a liquidation route was used, then out of the total creditors of Kshs 35.8 bn, Kshs 30.6 bn are unlikely to be paid. This represents a significant 85% potential loss to the creditors. In essence, all unsecured creditors, namely Trade Creditors, Commercial Paper Holders and Short Term Note holders, and private placement loan providers will suffer the maximum 100% loss of their debt amounts, as the available assets would first pay off secured creditors. Since the business model of Nakumatt can support a better outcome for all the creditors as compared to a liquidation scenario, the Administrator set out to come up with a restructuring proposal to achieve this outcome based on the company remaining a going concern.
Nakumatt’s administrator came back to creditors with a proposal that the creditors were supposed to take a vote on and if deemed fit, the company shall adopt as the way forward. The proposal highlighted the following scenarios as prerequisites in order for the proposal to be viable:
- The suppliers continue supporting Nakumatt so that the company can start generating sales,
- The landlords support the company so that the branches are available for business,
- The management agreement and financial support from Tusky’s supermarket continues to remain in place until the company can stand on its own feet.
The administrator thus proposed a debt waiver and restructuring into equity in order to ease the debt burden for the company and turn the business around, as highlighted in the tables below:
|
Creditors’ Debt Waiver and Equity Conversion |
||
|
Debt Waivers |
Debt to Equity Conversion |
|
|
Banks |
0% |
0% |
|
Staff Related Liabilities |
0% |
0% |
|
Kenya Revenue Authority |
0% |
0% |
|
Commercial Paper Debt & Private Placement |
Kshs 1,484 mn (25%) |
Kshs 4,453 mn (75%) |
|
Trade & Other Creditors |
Kshs 4,704 mn (25%) |
Kshs 14,113 mn (75%) |
|
Total |
Kshs 6,188 mn |
Kshs 18,567 mn |
|
Current Nakumatt Firm Value As Per the Administrator |
||
|
Current Firm Value |
100.0% |
Kshs 7,993 mn |
|
Nakumatt Shareholding after Debt Conversion |
||
|
Existing Shareholders |
30.1% |
Kshs 7,993 mn |
|
Creditors |
69.9% |
Kshs 18,567 mn |
|
Total Value of Company Post Conversion |
100% |
Kshs 26,559 mn |
Looking at the proposal, we find that Bank debt, Kenya Revenue Authority and Employee liabilities were treated as preferential creditors; thus exempting them from the 25.0% waiver that non-preferential creditors took on their debt, as well as the 75.0% debt to equity mandatory conversion. The current shareholder value was estimated at Kshs 7.99 bn, with the value of the creditors’ equity stake post conversion being Kshs 18.6 bn. The converted shareholders were then to assume a majority stake in the company, oversee its turn around, and finally take it to an Initial Public Offering (IPO) in the year 2024.
The administrator thus presented the proposal at the Creditors meeting for the Administration of Nakumatt Holdings Limited, which was held on 14th March 2018. The administrator had hoped to use the meeting in order to get the creditors to buy in to support the turnaround efforts of the retailer. However, a number of creditors rejected the proposal as is, citing the following issues:
- The debt waiver of 25% for the various non-preferential creditors, without a guaranteed upfront payment to cushion the waiver effect. Namely, Corporate paper and private placement loans, trade and other creditors will all lose 25% of their debts, while preferential creditors were not subjected to the same, namely the banks, employees and tax obligations to Kenya Revenue Authority (KRA). This is despite the continuous support that the company will still require from suppliers of trade goods in order to turn around the business,
- The Debt to equity conversion was also restricted to the non-preferential creditors; with banks, employees and the KRA not required to convert their debts, while the rest of the creditors were required to convert 75% of their debt obligations. In addition, the banks will still earn some interest on their debt, albeit at lower than market interest rates,
- The value assigned to current shareholders of Kshs 8.0 bn is deemed unrealistic and cannot be validated using the proposed structuring methods that will be applied. The company is worthless without the support of creditors. Thus the administrator erred in assigning the business value on this premise,
- The fact that the administrator proposed in its governance and management proposals to have 2 Board members from the existing shareholders in the New Board to run the company, citing their industry expertise. This is despite the current shareholders having put the company into the dire situation it is in currently; the attempt to assign value to current shareholders and then bring them into governance calls into question the independence of the administrator. In recent situations where some form of administration has come in, such as Chase Bank, the current shareholders have ended up with nothing
- The agreement with Tusky’s supermarket that is currently supporting the operations of the company. This raised a number of concerns with creditors as the details of the support and business intentions of Tusky’s was not made clear,
- The numerous accounts of mismanagement at the retailer, with the recent significant exceptional loss adjustment of Kshs 18.0 bn in respect to pilferage, stock shrinkage and losses due to stock obsolescence,
- Administration to be extended for a longer period beyond one year, and thereafter play the role of Monitoring Agent. This is despite the fact that the administrator chose to absolve himself from all claims and liabilities that pertains to the business restructuring and performance of the business post restructuring, and if the company does not follow out the recovery strategy and achieve the laid out milestones,
The Creditors meeting for the Administration of Nakumatt Holdings Limited held on 14th March 2018, was adjourned due to the view of the creditors that the Administrator did not fully disclose the affairs of the company. The meeting was adjourned for two weeks to enable the Administrator to amend the proposal. In addition, a section of the creditors called for the second meeting to have a vote for liquidation of the company, as they had questions about the viability of the recovery strategy. The matter is going before the High Court on the 26th of March 2018 in order for the Administrator to give an update on the process.
In our view, the proposal brought forth was not equitable and fair to all creditors. In addition, it failed to inspire confidence especially with the major stakeholders required to turn around the business, especially suppliers, landlords, and employees. We thus concur with the creditors who rejected the deal in the current format.
However, we also are aware that the best-case scenario for all creditors is a debt to equity conversion of their creditor claims, as liquidation is not in the best interest of anyone. This should include even the banks who had taken preferential debt. Case in point being the recent restructuring of Kenya Airways. In the case of Kenya Airways’ restructuring, the Government and a number of banks converted their debt into equity to the tune of Kshs 59 bn. The Government’s stake in Kenya Airways rose to 46.5% from 29.8% before the debt to equity conversion, while the bank’s consortium (KQ Lenders Co.) ended up owning 35.7% of the company. Ordinary shareholders who did not inject additional equity were diluted by 95.0%. Kenya Airways recently reported 2017 results for the first 9 months, registering a Kshs 470 mn equity position, up from a negative equity position of Kshs 44.9 bn in 2016, which can be attributed to the positive effects of the debt to equity conversion. This highlights that the company is finally in a positive equity position and can pay off its liabilities when due. We thus strongly recommend that creditors adopt the debt to equity conversion.
We would suggest the following amendments and / or considerations:
- Creditors, especially trade creditors to realize that an outright liquidation is not in anyone’s interest and consider a conversion. It may be useful for all creditors to collectively retain an investment adviser,
- The administrator to demonstrate independence from current shareholders and ascribe no value to their stake, consistent with the current realities of the business. Administrator conclusions and recommendations that are not grounded on analysis can be challenged in court hence delaying the resolution of the current situation. Attempting to ascribe 30% stake to current shareholders raises significant questions,
- Better disclosures and transparency around the numbers reported by Nakumatt and presented in the proposal, and
- All debt holders should be subject to conversion of debt to equity just as was the case in Kenya Airways.
This is the first significant private sector insolvency restructuring in Kenya under the new Act, it is important that it is done professionally and with due care since it sets a precedent to future cases.
Disclaimer: The views expressed in this publication, are those of the writers where particulars are not warranted. This publication, which is in compliance with Section 2 of the Capital Markets Authority Act Cap 485A, is meant for general information only, and is not a warranty, representation, advice or solicitation of any nature. Readers are advised in all circumstances to seek the advice of a registered investment advisor.

- Talk to us
- Kenya
- P.O Box 20695 - 00200, Nairobi, Kenya
- Cell +254709101200
- Tel +254709101200
- WhatsApp +254741676635
- United States
- +254709101200
- DOWNLOAD OUR APP
-


- Kenya
- 8th Floor, Pinetree Plaza, Kaburu Drive, Ngong Road, Nairobi, Kenya
- USA
- Suite 1150, 1775 Eye Street NW, USA, Washington DC 20006, USA
- Investments
- High Yield
- Private Equity
- Real Estate
- Real Estate
- RiverRun Estates
- Cytonn Towers
- The Ridge
- Taraji Heights
- The Alma