Update on Kigali Real Estate Investment Opportunity, & Cytonn Weekly #8/2018
By Cytonn Research Team, Feb 25, 2018
Executive Summary
Fixed Income
Treasury bills were oversubscribed during the week, with the overall subscription rate declining to 104.7%, compared to 140.5% recorded the previous week. Yields on the 91 and 182-day papers remained unchanged at 8.0% and 10.4%, respectively, while the yield on the 364-day paper declined by 10 bps to 11.1% from 11.2%, the previous week. Kenya issued its second set of Eurobonds, a 10-year and 30-year Eurobond at coupons of 7.3% and 8.3%, both 30 bps below 7.6% and 8.6%, respectively, which had been advised by the banks working on the deal. The issue was 7.0x oversubscribed with bids received at USD 14.0 bn compared to the USD 2.0 bn target;
Equities
During the week, the equities market exhibited mixed trends with NASI gaining 0.3% while NSE 25 and NSE 20 both lost 0.1%, taking their YTD performance to 5.6% and 5.3% for NASI and NSE 25, respectively, while NSE 20 is flat. For the last twelve months (LTM), NASI, NSE 25 and NSE 20 have gained 44.6%, 38.3% and 27.6%, respectively. Jubilee Insurance has launched 3 mobile apps: (i) JubiAgent Medical and JubiAgent Motor Apps for use by its agents, which will enable them sell the insurer’s motor and medical insurance policies via mobile phone, and (ii) JubiCare App for use by its customers, which will give them quick and easy access to any data on its insurance policies as well as enable them to complete renewals and carry out transactions on their policies.;
Private Equity
Africa recorded a total of 149 private equity deals in 2017, valued at USD 3.8 bn, marginally down from 150 deals recorded in 2016 valued at USD 3.9 bn, according to a report by the Africa Private Equity and Venture Capital Association (AVCA). On fundraising, Africa recorded a total of USD 2.3 bn in funds raised for Private Equity down from USD 3.4 bn raised in 2016;
Real Estate
Knight Frank released the Kenya Inside View 2018 Report, projecting a positive outlook on Kenya’s real estate sector in 2018 driven by positive fundamentals. In the retail segment, local retailer, Naivas Supermarket is expected to open a new outlet at Freedom Hall Mall in Langáta by May this year. On the infrastructural development, following a change in design, the construction of the superhighway linking Jomo Kenyatta International Airport (JKIA) and Nairobi - Nakuru highway is set to cost Kshs 21.0 bn more than the previously budgeted Kshs 38.0 bn;
Focus of the Week
In line with our Regional Expansion Strategy, we continue to assess investment opportunities in the region, in our key focus areas of Real Estate, Banking, Education, Hospitality, and Technology to enable us diversify our portfolio of investments and product range to our clients. In this report, we update the 2016 Kigali market research with the 2018 data.
- Our Investment Analyst, Stephanie Onchwati, discussed Kenya’s USD 2.0 bn Eurobond Issue and Uchumi’s H1’2018 results. Watch Stephanie on CNBC here
- Our Investment Analyst, Stephanie Onchwati, discussed Kenya’s public debt levels. Watch Stephanie on Lolwe TV here
- On Friday, 23rd February 2018, Cytonn Foundation, the Corporate Social Responsibility (CSR) arm of Cytonn Investments Management Plc, which focuses on giving back to the society through skill development, held a private Wealth Management Training (WMT) at the Cooperative University of Kenya, as part of the Foundation’s financial literacy pillar. During the training, the University staff were taken through a financial planning session with a focus on 4 key pillars; Budgeting, Debt Management, Savings, and Investments in the various asset classes. See the Event Note here. If interested in our Private Wealth Management Training for your employees or investment group please get in touch with us through wmt@cytonn.comor book through this link Wealth Management Training. To view the Wealth Management Training topics, click here
- We continue to hold weekly workshops and site visits on how to build wealth through real estate investments. The weekly workshops and site visits target both investors looking to invest in real estate directly and those interested in high yield investment products to familiarize themselves with how we support our high yields. Watch progress videos and pictures of The Alma, Amara Ridge, The Ridge, and Taraji Heights. Key to note is that our cost of capital is priced off the loan markets, where all-in pricing ranges from 16.0% to 20.0%, and our yield on real estate developments ranges from 23.0% to 25.0%, hence our top-line gross spread is about 6.0%. If interested in attending the site visits, kindly register here
- For recent news about the company, see our news section here
- We have 10 investment-ready projects, offering attractive development and buyer targeted returns of around 23.0% to 25.0% p.a. See further details here: Summary of Investment-Ready Projects
- To invest in any of our current or upcoming real estate projects, please visit Cytonn Real Estate
- Cytonn Towers, where we are only selling residential units in the first phase of residential apartments, is currently about 20.0% sold. See Cytonn Towers
- The Alma phase one which is 55.0% sold. See The Alma
- Amara Ridge has currently 100.0% uptake. See Amara Ridge
- Situ Village is currently 22.0% sold. See Situ Village
- The Ridge (Phase 1) is currently 31.0% sold. See The Ridge
- Taraji Heights is currently 14.0% sold. See Taraji Heights
- RiverRun Estates (Phase 1) is currently 11.0% sold. See RiverRun Estates
- With over 10 investment ready projects worth over Kshs 82.0 billon of project value, we shall be very selective on new real estate projects going forward, only focusing on Joint Ventures and real estate opportunities with deep value. We are increasingly focused on private equity deals. Should you have any deals in banking, insurance, education, hospitality and technology sectors, kindly email a teaser to PE@cytonn.com.
- We continue to beef up the team with ongoing hires for: Operations Business Manager – Cytonn Institute of Building Technology, Software Architect, Business Administration Associate – Procurement, Merchandise Manager and Assistant Editor – Sharpcents Newsletter, among others. Visit the Careers section at Cytonn’s Website to apply.
Treasury bills were oversubscribed during the week, with the overall subscription rate declining to 104.7%, compared to 140.5% recorded the previous week. The subscription rates for the 91, 182 and 364-day papers came in at 124.2%, 84.3%, and 117.3% compared to 116.8%, 112.2%, and 178.3%, respectively, the previous week. Yields on the 91 and 182-day papers remained unchanged at 8.0% and 10.4%, respectively, while the yield on the 364-day paper declined by 10 bps to 11.1% from 11.2%, the previous week. The overall acceptance rate increased to 96.3% compared to 81.4% the previous week, with the government accepting a total of Kshs 24.2 bn of the Kshs 25.1 bn worth of bids received, against the Kshs 24.0 bn on offer. The government is ahead of its domestic borrowing target for the current fiscal year, having borrowed Kshs 218.3 bn, against a target of Kshs 194.6 bn (assuming a pro-rated borrowing target throughout the financial year of Kshs 297.6 bn from the 2018 Budget Policy Statement (BPS) that was approved by the Cabinet).
Last week, the Kenyan Government re-opened two bonds, FXD 1/2010/15 and FXD 2/2013/15, with effective tenors of 7.1 and 10.2 years, and coupons of 10.3% and 12.0%, respectively, in a bid to raise Kshs 40.0 bn for budgetary support. The overall subscription rate for the issue came in at 60.4%, with the market weighted average bid rates coming in at 12.8% and 13.0%, 10 bps above the average accepted rates of 12.7% and 12.9%, respectively, in line with our expectations. The government accepted only Kshs 13.2 bn out of the Kshs 24.1 bn worth of bids received, translating to an acceptance rate of 54.7%. However, we don’t expect the government to come under pressure to borrow for the current fiscal year as (i) the government is currently ahead of its domestic borrowing target now that the 2018 BPS was passed and the target reduced by 27.5%. This adjustment was most likely made to accommodate plans of a Eurobond issue by the government, as the foreign borrowing target increased by 16.6%, (ii) KRA is not significantly behind target in Revenue collection; as per the Quarterly Economic and Budgetary Review for the first half of the fiscal year 2017/18, the Kenya Revenue Authority (KRA) collected Kshs 709.4 bn in revenue, against the government’s half year target of Kshs 777.7 bn and a pro-rated target of Kshs 821.6 bn (assuming a full year target of Kshs 1.6 tn), translating to 91.2% of their target and 86.0% of the pro-rated target. This figure differs slightly with KRA’s H1 Performance Review and Prospects for the FY 2017/18, according to which the government had collected Kshs 712.2 bn during the same period, 92.0% of their target and 87.0% of the pro-rated target, and (iii) successful issuance of the Eurobond which raised USD 2.0 bn (approx. Kshs 202.0 bn). Adding Kshs 24.1 bn borrowed by December 2017, this translates to 69.9% of the full year foreign borrowing target of Kshs 323.2 bn, and approx. 105.0% of their pro-rated target.
According to Bloomberg, the yield on the 5-year Eurobond rose by 10 bps to 3.6% from 3.5% while the yield on the 10-year Eurobond declined by 40 bps to close at 6.2% from 6.6%, respectively, the previous week. Since the mid-January 2016 peak, yields on the Kenya Eurobonds have declined by 5.2% points and 3.4% points for the 5-year and 10-year Eurobonds, respectively, due to the relatively stable macroeconomic conditions in the country.
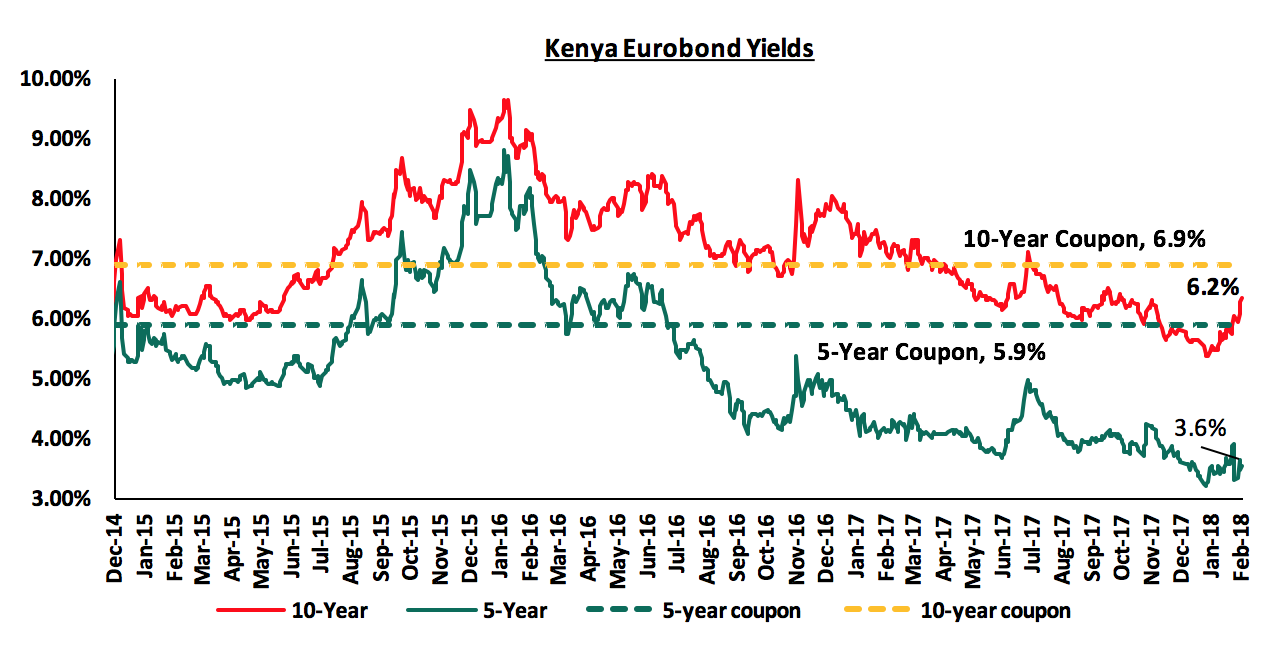
During the week, Kenya issued its second set of Eurobonds, a 10-year and 30-year Eurobond at coupons of 7.3% and 8.3%, both 30 bps below 7.6% and 8.6%, respectively, which had been advised by the banks working on the deal. The Eurobonds are listed on the London and Irish Stock Exchanges. The proceeds will go towards development expenditure and debt liability management. The issue was 7.0x oversubscribed with bids received at USD 14.0 bn as compared to the USD 2.0 bn target despite (i) Moody’s downgrade of the government’s issuer rating to “B2” from “B1” the previous week, and (ii) the International Monetary Fund (IMF) decision to withdraw their stand-by credit facility effective March 2018 citing the government’s failure to have made viable arrangements to meet the condition to lower its budget deficit to 3.7% of GDP by 2018/19 in order to extend the facility. Key to note is Kenya’s total public debt increased by 19.4% to Kshs 4.6 tn in December 2017 from Kshs 3.8 tn in December 2016, driven by a 23.9% increase in external debt. Domestic debt increased by a slower rate at 15.0%. The additional funds obtained from the Eurobond will add to the external debt burden which was at Kshs 2.3 tn as at December 2017, according to the latest data released by the CBK.
The Kenya Shilling depreciated by 0.5% against the US Dollar during the week to Kshs 101.7, from Kshs 101.3 the previous week due to increased end-month demand from oil and retail importers. On a YTD basis, the shilling has gained 1.4% against the USD. In our view, the shilling should remain relatively stable against the dollar in the short term, supported by:
- Weakening of the USD in the global markets as indicated by the US Dollar Index, which shed 9.9% in 2017, and has shed 2.4% YTD,
- Improving diaspora remittances which increased by 26.6% to USD203.8 mn in December 2017 from Kshs 160.9 bn in December 2016 driven by a 39.2% and 30.9% increase in remittances from North America and Europe, respectively, and,
- CBK’s intervention activities, as they have sufficient forex reserves, currently at USD 7.2 bn (equivalent to 4.8 months of import cover). Key to note is that the IMF met with the members of the National Treasury during the week and decided to withdraw the USD 1.5 bn stand-by facility with Kenya effective March 2018 as conditions previously agreed upon for the facility to be extended had not been met. This will deprive Kenya of approx. 1 month of import cover in case of any pressure on our Balance of Payment (BOP) position. Our BOP position improved to a surplus of 1.2% of GDP in November 2017 from a deficit of 1.3% of GDP in November 2016 supported by a capital & financial account balance surplus of approx. 8.0% of GDP, despite a current account deficit of 7.0% of GDP.
We are projecting the inflation rate for the month of February to range between 4.6% - 4.8%, from 4.8% in January. The y/y inflation rate is expected to decline as a result of a base effect but m/m inflation is expected to rise mainly due to (i) an increase in prices of kerosene, diesel and petrol by 2.6%, 2.3% and 1.5%, effective from 15th February to 14th March, as detailed in our Cytonn Weekly #7/2018, (ii) an increase in electricity prices, as Hydro-Electric Power (HEP) generation remains low and diesel-powered thermal generators used to fill in the gap result in a rise in the cost of electricity production with the increase in the cost of diesel, and (iii) an increase in food prices with pressure from the rice shortage and the pass through effect from transport costs increasing; despite maize flour prices remaining steady supported by cheap imports from Tanzania and Uganda, and the decline in wheat flour prices, now retailing at the same price as maize flour. There is also the threat of a drought brought about by La Nina, currently developing in the Equatorial Pacific Ocean. We expect inflation to average 7.5% over the course of the year down from 8.0% in 2017, which is within the government target range of 2.5% - 7.5%.
The National Treasury released the Quarterly Economic and Budgetary Review for the first half of the fiscal year 2017/18. We have summarized the report below:
amounts in Kshs bns unless stated otherwise
|
Quarterly Economic and Budgetary Review for H1’2017/18 - Budget Summary |
|||
|
Item |
H1’2017/18 |
||
|
Amount Collected/Spent |
Target |
% of Target Met |
|
|
Total revenue |
709.4 |
777.7 |
91.2% |
|
External grants |
7.8 |
25.4 |
30.8% |
|
Total revenue & external grants |
717.2 |
803.1 |
89.3% |
|
Recurrent expenditure |
647.0 |
616.2 |
105.0% |
|
Development expenditure |
173.8 |
258.2 |
67.3% |
|
Other expenditure |
84.7 |
148.5 |
57.0% |
|
Total expenditure |
905.5 |
1,022.9 |
88.5% |
|
Fiscal deficit |
(188.3) |
(219.8) |
|
|
Deficit as % of GDP |
2.2% |
2.5% |
|
|
Net foreign borrowing |
24.1 |
61.5 |
39.2% |
|
Net domestic borrowing |
183.6 |
163.5 |
112.3% |
|
Total borrowing |
207.6 |
224.9 |
92.3% |
|
GDP Estimate |
8,654.6 |
8,654.6 |
|
From the table above, key take outs include:
- The KRA met 91.2% of their HY target, having collected Kshs 709.4 bn against a target of Kshs 777.7 bn. Overall revenue and grants were at 89.3% of the target,
- Recurrent expenditure was above target at 105.0% while development expenditure was below target at 67.3%. Of recurrent expenditure, Kshs 154.8 bn was foreign and domestic interest payments, which comes to 21.8% of revenue. Total budget absorption was at 88.5% of the target, and,
- The government collected 39.2% of the net foreign borrowing target and 112.3% of the domestic borrowing target, having collected Kshs 24.1 bn and Kshs 183.6 bn from the foreign and domestic markets, respectively.
Other highlights from the report include:
- In December 2017, Kenya’s external debt was composed of 33.3% bilateral, 35.8% multilateral and 30.1% commercial debt, as compared to 33.8%, 41.2% and 24.2% in December 2016, respectively. As stated in our recent focus note on Kenya’s Public Debt, multilateral debt is mostly concessional hence cheaper, accounting for 16.0% of external debt service, while commercial loans are largely non-concessional and more expensive, accounting for 50.0% of external debt service,
- China remains our largest bilateral lender at USD 5.2 bn as at December 2017, followed by Japan at USD 824.8 mn and France at USD 622.5 mn,
- Money Supply (M3) growth was at 8.4% in November 2017, up from 6.2% in November 2016 mainly due to an increase in lending to the government, and,
- Kenya’s BOP position improved to a surplus of 1.2% of GDP in November 2017 from a deficit of 1.3% of GDP in November 2016.
In our view, the report points to a more positive outlook on government borrowing, with the government now on track towards meeting both their domestic and foreign borrowing target, though concerns still remain around the rising non-concessional debt burden.
BMI Research released their Africa Monitor for East & Central Africa dated March 2018, projecting Kenya’s GDP Growth at 5.2% in 2018, expected to be driven by (i) an easing in political risk following the prolonged political impasse over the 2017 presidential elections acting as a boost to foreign Investment, and (ii) growth in information &communication technology, financial and transportation services. Key to note is according to the 2018 BPS, the National Treasury projects GDP growth of 5.3% in Q4’2017, which would bring the year average to 4.9%. As per the 2018 BPS, the Treasury projects that GDP will grow by 5.8% in 2018. Below is a table showing that the Kenyan economy is expected to grow by an average of 5.5% as projected by various research houses, global agencies and government organizations. We shall continue to update this table anytime growth outlook is adjusted by these organizations, or in the event of new research houses expressing a view.
|
Kenya 2018 GDP Growth Outlook |
||
|
No. |
Organization |
Jan-18 |
|
1 |
Central Bank of Kenya |
6.2% |
|
2 |
Kenya National Treasury |
5.8% |
|
3 |
African Development Bank (AfDB) |
5.6% |
|
4 |
Stanbic Bank |
5.6% |
|
5 |
Citibank |
5.6% |
|
6 |
International Monetary Fund (IMF) |
5.5% |
|
7 |
World Bank |
5.5% |
|
8 |
Fitch Ratings |
5.5% |
|
9 |
Barclays Africa Group Limited |
5.5% |
|
10 |
Cytonn Investments Management Plc |
5.4% |
|
11 |
Focus Economics |
5.3% |
|
12 |
BMI Research |
5.2% |
|
13 |
Standard Chartered |
4.6% |
|
Average |
5.5% |
|
Rates in the fixed income market have remained stable as the government rejects expensive bids despite being behind their borrowing target. However, a budget deficit that is likely to result from depressed revenue collection creates uncertainty in the interest rate environment as any additional borrowing in the domestic market to plug the deficit could lead to upward pressure on interest rates. Our view is that investors should be biased towards short term fixed income instruments to reduce duration risk.
During the week, the equities market exhibited mixed trends with NASI gaining 0.3%, while NSE 25 and NSE 20 both lost 0.1%, taking their YTD performance to 5.6% and5.3% for NASI and NSE 25, respectively, while NSE 20 is flat. For the last twelve months (LTM), NASI, NSE 25 and NSE 20 have gained 44.6%, 38.3% and 27.6%, respectively. This week’s performance was attributed to gains by select large-cap stocks such as Barclays Bank and Co-op Bank, which gained 1.9%, and 0.6%, respectively.
Equities turnover increased by 64.2% to USD 44.0 mn from USD 26.8 mn the previous week. We expect the market to remain supported by positive investor sentiment this year, as investors take advantage of the attractive stock valuations in select counters.
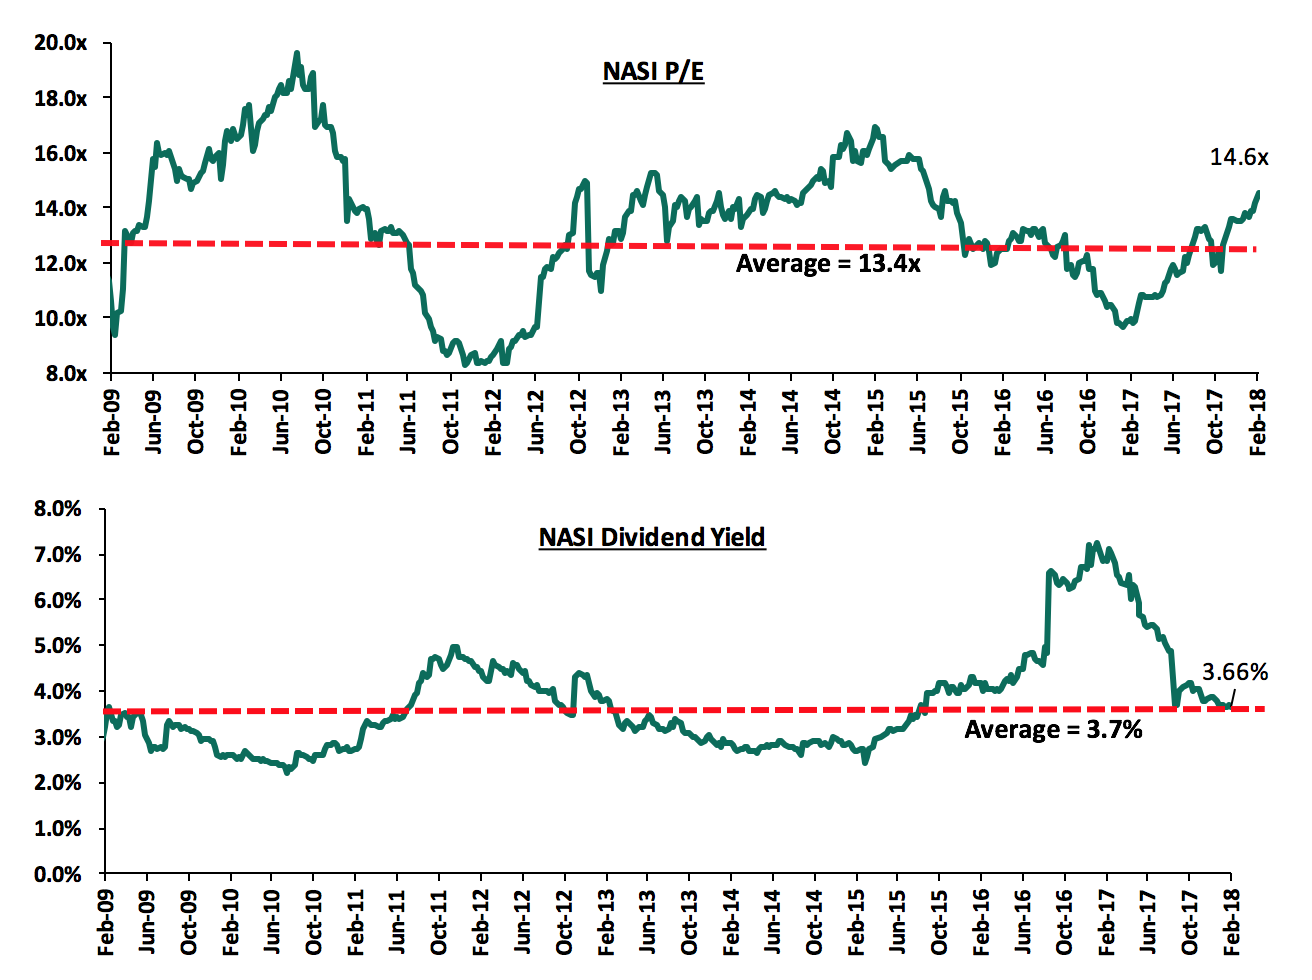
The market is currently trading at a price to earnings ratio (P/E) of 14.6x, which is 8.6% above the historical average of 13.4x, and a dividend yield of 3.7%, similar to the historical average of 3.7%. The current P/E valuation of 14.6x is 50.2% above the most recent trough valuation of 9.7x experienced in the first week of February 2017, and 75.3% above the previous trough valuation of 8.3x experienced in December 2011. In our view, there still exists pockets of value in the market, with the current P/E valuation being 13.9% below the most recent peak of 16.9x in February 2015. The charts below indicate the historical P/E and dividend yields of the market.
The IMF has once again urged Members of Parliament (MPs) to repeal the law capping interest rates, recommending total abolition of the rate cap, stating that it has had a negative impact on the economy, crowding out the private sector and curtailing growth of SMEs. They re-iterated that the caps were meant to sort out the issue of high lending rates charged by banks that discouraged borrowing but instead have now resulted in banks not extending credit to the private sector, estimating a 10.0% drop in lending to SMEs. This comes at the same time when BMI Research, in their Africa Monitor, projected slower credit growth in 2018, noting that following the passing of the September 2016 rate cap law, banks reduced their lending to clients deemed as “high risk”. Last week, the Kenya Parliamentary Budget Office (KPBO) proposed to review the law in a bid to (i) boost private sector credit growth, which was at an average of 2.4% in 2017 compared to a 5-year average of 14.4%, and (ii) to increase flexibility of the Central Bank Rate (CBR), which has remained at 10.0% since the law was passed. As we have previously mentioned in our topical notes on the interest rate cap, with the latest one being the Update on Effect of Interest Rate Cap on Credit Growth & Cost of Credit, amending or even repealing the Act would be key in sparking private sector credit growth and in turn boosting economic growth, and hence we share the IMF’s sentiments.
A.M. Best, an American-based rating agency, has downgraded Kenya Re’s financial strength rating to “B” from “B+”, and its long term issuer rating to “bb+” from “bbb- “; but revised its outlook to “stable” from “negative”, previously. The downgrades were attributed to (i) concerns around the re-insurer’s enterprise risk management (ERM) function, with the conclusion that it might be weak and incapable of accommodating growing business, (ii) uncertainty around Kenya Re’s long term ability to grow its capital base at the same rate as it is growing its revenue, and (iii) an expectation that the company might not be able to fund its regional expansion strategy. ERM involves identification of risks and opportunities specific to a business, assessing the likelihood of occurrence & magnitude of their impact, and coming up with a monitoring framework and response strategy for both. Kenya Re posted an EPS growth of 3.7% in H1’2017 driven by total revenue that grew by 7.1%, and ranked first in our Kenya Listed Insurance Sector Report, H1’2017, affirming the company’s fundamental strength. Going forward, the company should work on strengthening its ERM to enable it incorporate growing business going forward, in order to sustain its financial strength as it pursues its regional expansion strategy.
Jubilee Insurance has launched 3 mobile apps: (i) JubiAgent Medical and JubiAgent Motor Apps for use by its agents, which will enable them sell the insurer’s motor and medical insurance policies via mobile phone, and (ii) JubiCare App for use by its customers, which will give them quick and easy access to any data on its insurance policies as well as enable them to complete renewals and carry out transactions on their policies. Just recently, Jubilee also launched an Al-based chat personal assistant Julie to enhance customers’ digital experience. In our view, the launch of the apps is part of the financial services sector embracing technology to attract a wider customer base while improving operational efficiency. The apps will serve to (i) enhance Jubilee’s customer experience thus attracting more customers who have become more tech-savvy as their tastes and preferences become more skewed towards shorter, more accessible procedures, (ii) increase Jubilee’s gross earned premiums which stood at Kshs 15.6 bn in H1’2017, 14.5% up from Kshs 13.6 bn in H1’2016, the increase expected to be generated from agents, thus increasing the amount of commission paid out.
In an effort to keep our rankings of companies on the Cytonn Corporate Governance Ranking (Cytonn CGR) Report up-to-date, we continually update the rankings whenever there are changes on any of the 24 metrics that we track, and how this affects the company ranking. This week, KCB Group appointed a Non-Executive Directors to its board, Ms. Josephine Tata Djirackor, to replace Dr. Nancy Asiko Onyango who stepped down from the board following her appointment to head the Internal Audit and Inspection Office at the IMF in December 2017. KCB’s score based on our 24 metrics has remained unchanged at 91.7%, retaining its no. 1 position.
Below is our Equities Universe of Financial Services Coverage:
|
Cytonn Equities Universe of Financial Services Coverage |
||||||||
|
all prices in Kshs unless stated otherwise |
||||||||
|
No. |
Company |
Price as at 16/02/18 |
Price as at 23/02/18 |
w/w Change |
YTD Change |
Target Price* |
Dividend Yield |
Upside/ (Downside)** |
|
1. |
NIC*** |
36.0 |
35.3 |
(2.1%) |
4.4% |
61.4 |
3.5% |
77.7% |
|
2. |
KCB Group |
45.5 |
45.5 |
0.0% |
6.4% |
59.7 |
6.6% |
37.8% |
|
3. |
DTBK |
210.0 |
210.0 |
0.0% |
9.4% |
281.7 |
1.3% |
35.4% |
|
4. |
I&M Holdings |
120.0 |
116.0 |
(3.3%) |
(8.7%) |
150.4 |
2.5% |
32.2% |
|
5. |
Kenya Re |
19.5 |
19.2 |
(1.8%) |
5.8% |
24.4 |
3.8% |
31.3% |
|
6. |
Barclays |
10.7 |
10.9 |
1.9% |
13.0% |
12.8 |
9.4% |
27.4% |
|
7. |
Liberty Holdings |
13.0 |
13.0 |
0.0% |
6.6% |
16.4 |
0.0% |
26.2% |
|
8. |
Britam |
12.5 |
12.5 |
(0.4%) |
(6.7%) |
15.2 |
1.8% |
23.9% |
|
9. |
CIC Group |
5.3 |
5.4 |
1.9% |
(3.6%) |
6.2 |
1.8% |
16.6% |
|
10. |
Jubilee Insurance |
505.0 |
504.0 |
(0.2%) |
1.0% |
575.4 |
1.7% |
15.9% |
|
11. |
HF Group*** |
10.7 |
10.3 |
(4.2%) |
(1.4%) |
11.7 |
0.8% |
15.2% |
|
12. |
Sanlam Kenya |
29.0 |
27.5 |
(5.2%) |
(0.9%) |
31.4 |
1.1% |
15.1% |
|
13. |
Co-op Bank |
17.1 |
17.2 |
0.6% |
7.5% |
18.6 |
5.4% |
13.5% |
|
14. |
Equity Group |
42.8 |
42.8 |
0.0% |
7.5% |
42.3 |
4.2% |
3.1% |
|
15. |
Standard Chartered |
207.0 |
208.0 |
0.5% |
0.0% |
201.1 |
4.3% |
1.0% |
|
16. |
Stanbic Holdings |
81.0 |
82.5 |
1.9% |
1.9% |
79.0 |
5.1% |
0.9% |
|
17. |
NBK |
8.5 |
8.3 |
(1.8%) |
(11.2%) |
5.6 |
0.0% |
(32.9%) |
|
*Target Price as per Cytonn Analyst estimates |
||||||||
|
**Upside / (Downside) is adjusted for Dividend Yield |
||||||||
|
***Banks in which Cytonn and/or its affiliates holds a stake |
||||||||
|
For full disclosure, Cytonn and/or its affiliates holds a significant stake in NIC Group, ranking as the 6th largest shareholder |
||||||||
We maintain a “NEUTRAL” recommendation on equities for investors with short-term investment horizon since the market has rallied and brought the market P/E slightly above its’ historical average. However, pockets of value exist, with a number of undervalued sectors like Financial Services, and with expectations of higher corporate earnings this year, the market will be cheaper for long-term investors hence we are “POSITIVE” for investors with long-term horizon.
Africa recorded a total of 149 private equity deals in 2017, valued at USD 3.8 bn, down from 150 deals recorded in 2016 valued at USD 3.9 bn, according to a report by the Africa Private Equity Venture Capital Association (AVCA). On fundraising, Africa recorded a total of USD 2.3 bn in funds raised for Private Equity down from USD 3.4 bn raised in 2016. The slowdown in PE activity was attributed to reduced deal activity in some countries such as Kenya, whose extended uncertainty during the election period resulted in investors adopting a “wait and see” approach to deals during the year. The Information Technology sector was the most active sector for PE deals in Africa in 2017 with its number of PE deals rising to 15.0% of total PE deals in 2017, from 8.0% in 2016 and the value of funds raised in the sector for venture capital totaling to USD 560.0 mn compared to USD 366.8 mn in 2016, a 53.0% growth. A total of 124 tech start-ups raised funds, with South Africa, Kenya and Nigeria taking up 76.0% of the funding. South Africa took up USD 168.0 mn of the funding (36.0% of the total), with 42 deals funded, Kenya took up USD 147.0 mn (26.3% of the total), funding 25 deals, while Nigeria took up USD 115.0 mn (20.0% of the total), funding 17 deals. In Kenya, some of the key funding deals in the tech space in 2017 included (i) Bamba Group, a company providing SMS based solutions and data collection software for companies, raised USD 1.1 mn, (ii) BitPesa, a Kenyan digital currency payment platform closed a USD 2.5 mn funding round, (iii) Mobile credit firm, Tala, raised more than USD 30.0 mn, and (iv) Kenya’s Twiga Foods Ltd, a mobile based food supply platform raised USD 12.8 mn. We remain optimistic about investment in technology and tech-backed businesses, as the Sub-Saharan African region continues to witness increased integration of technology in businesses as well as increased automation of business processes by SMEs.
Private equity investments in Africa remains robust as evidenced by the increasing investor interest, which is attributed to; (i) rapid urbanization, a resilient and adapting middle class and increased consumerism, (ii) the attractive valuations in Sub Saharan Africa’s private markets compared to its public markets, (iii) the attractive valuations in Sub Saharan Africa’s markets compared to global markets, and (iv) better economic projections in Sub Sahara Africa compared to global markets. We remain bullish on PE as an asset class in Sub-Sahara Africa. Going forward, the increasing investor interest and stable macro-economic environment will continue to boost deal flow into African markets.
Knight Frank released their Kenya Inside View 2018 Report, highlighting the trends in the Kenyan real estate sector and their outlook for the market in 2018. The key take-outs from the report were;
- Prime residential rents in Nairobi declined during the first half of 2017 albeit at a slower rate of 2.8% compared to 3.2% during the first half of 2016. The report attributed the decline to the oversupply of prime properties for rent, which has given tenants more leverage to negotiate with landlords. Corporate budget cuts by multinational firms have also influenced the performance of the high-end residential market segment,
- Prime residential prices increased by 0.9% over the first nine months of 2017 compared to a 1.0% decrease over the same period in 2016. However, there were lower transaction volumes attributed to the interest rate capping which led to low private sector lending, and,
- The number of high net worth individuals (HNWI) in Kenya has doubled to around 9,400 over the last decade, making the country home to the 4th highest number of dollar millionaires in Africa. This group are the main drivers of the luxury market as they invest a significant portion of their wealth in property with focus on locations such as Karen that offer lifestyle products and greatest opportunities for capital appreciation.
The report is in line with Cytonn Annual Market Review 2017 which indicated that the high end segment recorded low capital appreciation rates at an average of 3.7%, in 2017 compared to 4.5% in 2016, attributed to the increased surplus in the high end market which has led to price stagnation.
On the hospitality sector, the key take outs were;
- Kenyans game reserves and the Indian Ocean Coastline are the key tourist attractions to Kenya and hence a key driver of the entire hospitality sector, noting that Diani was voted as one of the best beaches in Africa by TripAdvisor, and,
- The holiday homes market is mainly driven by local demand from wealthy families seeking 2nd homes. British and Italians are the main overseas buyers of holiday homes in Kenya, with the main areas of interest being Malindi, Watamu, Lamu and Nanyuki.
During the week, Naivas Supermarket announced plans to open a new outlet at Freedom Height Mall in Lang’ata by May this year. The store which is set to occupy 18,000 SQFT, will bring the number of Naivas outlets to 44 countrywide, and mark the retailer’s first store along Lang’ata Road. Naivas Supermarket has opened several branches in the past year, with the most recent being at the junction of Kenyatta Avenue and Moi Avenue in Nairobi CBD previously occupied by Barclays Bank and Nakumatt’s space along Moi Avenue. The retail chain is also set to be the anchor tenant at the Crystal mall, slated to open in 2018, along Mombasa Road in Athi River. The expansion of Naivas Supermarkets is a positive development in the retail sector, and highlights the growth of local retailers in the wake of stiff competition from international retailers seeking foothold in the Kenyan retail market including, Manix Clothes Stores, French retailer Carrefour and Botswana based Choppies, just to mention a few. The proliferation of retailers driven by a robust GDP growth rate projected at between 5.3% and 5.5% in 2018, increased purchasing power, and shifting consumer habits are a boost to real estate investors in malls and mixed –used developments who prefer these large retail chains as anchor tenants to bring foot traffic. However, it comes at a time when some retail chains, such as Nakumatt and Uchumi, are faced with governance, financing and supply chain management challenges leading to the closure of some of their stores. Given that retail space in Nairobi alone increased by 41.6% to 5.6mn square feet in 2017 from 3.9mn square feet in 2016, with the completion of malls such as South Field in Embakasi, we anticipate continued expansion of both local and international retail chains. However, we are of the view that they ought to exercise proper governance and planning to ensure sound investments and execution of strategy.
Other highlights this week include;
- Hemingways Watamu, a high end residence at the Kenyan Coast, reported the sale of 3 of their luxury residential apartments, off-plan. The units, valued between Kshs 45.0 and Kshs 145.0 mn, are part of the 21 units under construction as part of the facility’s refurbishment and expansion plan. The 5-star hotel located on Turtle Bay, was established in 1988 and initially had 74-rooms,
- According to STR Hotel Investor Newsletter Q4 2017, Nairobi recorded the largest RevPAR decline of 27.0% across all key African cities tracked by STR. This is attributed to the political turbulence during the electioneering period, dampening hotel demand, particularly in the months surrounding the elections in August 2017. This is higher than our projection of a 12% decline in RevPAR from Kshs 6,757 in 2016 to Kshs 5,938 in 2017, according to Cytonn Annual Market Review 2017,and
- Construction of the superhighway linking Jomo Kenyatta International Airport and Rironi, Limuru along the Nakuru- Nairobi highway, is set to cost Kshs 59.0bn, 55.3% higher than the budget of Kshs 38.0 bn, following a change in design. According to Kenya National Highways Authority (KeNHA), the current design will incorporate flyovers and underpasses on some sections of the road, unlike the previous design of an elevated highway.
Our outlook for the real estate sector in Kenya remains positive following increased economic activities in the sector and the political calmness that has resumed after the protracted electioneering period.
Following Kampala Investment Opportunity research report, Sub Saharan Africa Financial Services Report and Accra real estate investment research report, we continue to assess investments opportunities in the region, in our key focus areas of Real Estate, Banking, Education, Hospitality, and Technology to enable us diversify our portfolio of investments and product range to our clients. In line with this strategy, we continue to conduct comprehensive research of various regional markets in Sub Saharan Africa. This report is an update to the 2016 Kigali market research with the 2018 data. Rwanda is one of the fast-growing countries in Africa at a GDP growth rate estimated at 6.2% in 2017 compared to an Africa average growth of 2.4% and a sub-Saharan Africa average of 3.2% and has ranked the 41st and second-best country in Africa to do business after Mauritius which ranked 25thglobally and best in Africa according to World Bank Ease of Doing Business 2018 report.
According to the research we did in May 2016, Kigali recorded attractive rental yields of 9.3%, 10.8% and 12.3% for residential units, offices and retail space, respectively, in comparison to the January 2018, where it recorded rental yields of 8.1%, 9.8%, and 12.6% for residential units, offices and retail space, respectively. This is a 0.7% and 0.5% annual decline in rental yield for residential units and office space respectively, and 0.2% annual increase in rental yield for retail sector. The decline recorded in residential sector was mainly for 3-bedroom houses as the rental charges stabilised due to increased house supply, while decline in commercial offices performance was due to increase in office space supply outstripping demand.
This week we therefore look at our real estate findings in the residential, commercial and serviced apartment performance in Kigali.
- We start with the general overview of Rwanda and Kigali, the factors driving the real estate sector, and the challenges facing the sector in Kigali,
- We then delve into the thematic performance of real estate, while comparing the market to other real estate markets in our focus areas in the Sub Saharan Africa, which are Kenya, Uganda, and Ghana,
- We conclude with our outlook on the Kigali real estate investment opportunity.
1. Rwanda Overview
Rwanda, a member of East African Community with Kigali as the capital city, borders the Democratic Republic of Congo, Uganda, Tanzania and Burundi. Rwanda gained independence on 1st July 1962 from Belgium and is officially known as the Republic of Rwanda. Most of Rwanda territory is hilly and mountainous and has no direct access to the sea.
The country size is 24,670 SQKM with a population density of approximately 495 people per SQ KM according to the National Institute of Statistics of Rwanda (NISR). The Rwanda population is approximately 12.4 mn, growing at 2.4%, compared to Kenya, Tanzania and Uganda at 2.6%, 3.1% and 3.3% respectively. The population in Rwanda is young, an estimated 42.7% are under the age of 15 years, and 97.5% are under 65 years. The official languages in Rwanda are Kinyarwanda, English and French.
Kigali Overview
Kigali is the capital and largest city in Rwanda. Other notable towns in Rwanda are Muhanga (Gitarama), Huye (Butare), and Gisenyi, all with populations below 100,000. Kigali covers a total area of 730 SQKM and has a total population of 1.3Mn as at 2017, with a population growth rate of 2.4% and urbanization rate at 4.9%. It is divided into three districts; that is Gasabo, Nyarugenge and Kicukiro. Generally, Kigali city zoning regulations are strictly regulated by Kigali Master Plan 2013.
Infrastructure and amenities
Kigali is endowed with various developments that make it attractive for economic development;
- Kigali City is relatively less congested owing to decentralization of the CBD by having two more major commercial zones with one being an exclusively commercial centre and the other being a transport HUB,
- Kigali city comprises of Bitumen roads, paved and all-weather roads,
- Kigali city is served by one international airport in Kanombe with Bugesera International Airport under construction,
- The city is served by electricity power imported from Uganda and also generate its own power using diesel generators,
- The water and electricity are provided by the Energy, Water and Sanitation Authority (EWSA), and
- The city however has inadequate sewerage system and residents rely on septic tanks.
Factors Driving Real Estate in Kigali
- Government Incentives -These include; i) the government investment in infrastructural expansion and modernization of urban and rural infrastructure, which involves the construction of roads and provision of utilities such as water and electricity in development sites,
- Political Stability - political stability with well-functioning institutions, rule of law and zero tolerance to corruption,
- Housing Deficit - The affordable housing demand in Kigali for 2012-2022 is estimated at 186,163 Dwelling Units (DU) with an average demand of 16,923 affordable Dwelling Units per year according to Planet Consortium 2012 Housing for the City of Kigali report, hence increasing investment activities by the government and developers with the aim of meeting the demand,
- Economic Growth - Rwanda’s real GDP growth recorded an estimated growth of 6.2% in 2017 from 5.9% in 2016, an indicator of macro-economic stability that is conducive for growth. Rwanda was also ranked the 41st and second-best country in Africa to do business in after Mauritius which ranked 25th and best in Africa according to World Bank Ease of Doing Business 2018 report,
- Demographics - Rwanda has a population of approximately 12.4 Mn people and growing at a rate of 2.4% compared to the global average of 1.2%. The urban population stands at 30.7% of the total population and urbanization rate of 4.9% p.a. hence creating increased demand for real estate developments, and
- Master Plan- Strict Implementation of zoning regulations guided by the Kigali master plan introduced in 2013, which outlines the conditions and plans for development in Kigali. This is a visionary project which will see planned development in the area and control urban sprawl in future.
Despite the above factors driving real estate in Rwanda, the sector continues to face major challenges that have discouraged potential investors from investing in the real estate sector in Rwanda. These include;
- High Construction Cost- The construction cost in Rwanda is high, since it imports most of the construction materials. However, the country is trying to bridge the gap, with companies such as Cimerwa, Rwanda’s sole cement producer and S&H Industries that produces stone-coated tiles (Hippo brand),
- High Cost of Financing- Funding real estate developments has resulted in excessive debt financing, with a debt interest rate ranging from 17% - 19% per annum on the Rwandan Franc. The market also does not embrace presales but rather prefer to buy after completion of the project or sometimes during the construction. In addition, Development bank of Rwanda is the only main lender providing development loans, and
- Low Purchasing Power- The high mortgage rates makes it hard for Rwandese to borrow to finance the purchase of houses given the low levels of income, with approximately 66% of the population, earning less than USD. 243 per month. Currently, the value of mortgage to GDP stands at 3.6% against Sub Saharan Africa average of 5.0%.
2. Market Performance
- Residential Sector
Generally, the residential sector is picking up, with increased supply of apartments and detached units to bridge the housing deficit gap in Kigali. The demand for housing in Kigali is approximately 16,923 units p.a with a supply of 800-1,000 units p.a according to Planet Consortium 2012 Housing for the City of Kigali report and only a quarter of these units are apartments the rest being detached units. The housing demand is mainly on affordable housing segment which can serve 54.1% of the population. Key to note is, 80 % of the market prefers to acquire housing through mortgages and currently the borrowing rate average at 18% p.a.
The sector is mainly dominated by standalone units, since Rwandese community appreciates exclusivity thus lower demand for densely populated developments. However, the sector has witnessed increase in apartments in Kigali city suburbs. The developers are targeting investors purchasing these apartments as a yielding asset targeting the renters market. These investors are mainly expatriates and Rwandese diaspora.
The residential sector is largely driven by (i) Stable economic growth, (ii) positive demographics, (iii) housing deficit, and (iv) government incentives
The Key target residential market in Kigali is as shown below;
|
The Target Market for Housing in Rwanda |
||||
|
Target Group |
Monthly Income (RWF) |
Monthly Income (USD) |
% of Population |
Developer |
|
High End |
Over 900,000 |
Over 1,139 |
3.8 |
Private Sector |
|
Mid- End |
Between 200,000 and 900,000 |
Between 253 and 1,139 |
29.5 |
Public & Private Sector |
|
Affordable Housing |
Between 33,500 and 200,000 |
Between 42 and 253 |
54.1 |
Public & Private Sector |
|
Social Housing (Subsidy) |
Below 33,500 |
Below 42 |
12.6 |
Public Sector |
|
||||
Source: RHA/Affordable Housing development for Government Employees
In our research we however covered the following key market segments;
- High-End: These include estates in Kigali such as; Nyarutarama, Kimihurura and Kacyiru
- Mid-End: These include Kibagabaga, Kanombe, Gisozi, Kagugu and Rusororo
Below is the apartment performance analysis;
|
A. High End Market Performance |
||||||||||||
|
Typology |
Unit Plinth Area (SM) |
Price 2018 USD |
Price in Kshs |
Price per SM (USD) |
Rent in USD |
Rent in Kshs |
Rent per SM (USD) |
Annual Uptake |
Rental Yield |
Price App. |
Total Returns |
|
|
2 -bed |
109 |
113,350 |
12.2Mn |
1,034 |
820 |
84,460 |
7.5 |
48.4% |
8.8% |
4.9% |
13.7% |
|
|
3-bed |
139 |
145,800 |
15.7Mn |
1,031 |
1,000 |
103,000 |
7.2 |
49.2% |
8.6% |
8.0% |
16.6% |
|
|
Average |
1,033 |
7.4 |
48.8% |
8.7% |
6.5% |
15.1% |
||||||
|
B. Middle income Market Performance |
||||||||||||
|
Typology |
Unit Plinth Area (SM) |
Price 2018 USD |
Price in Kshs |
Price per SM (USD) |
Rent in USD |
Rent in Kshs |
Rent per SM (USD) |
Annual Uptake |
Rental Yield |
Price App. |
Total Returns |
|
|
2 -bed |
114 |
97,195 |
10.4Mn |
836 |
539 |
55,492 |
4.7 |
43.0% |
6.8% |
3.3% |
10.1% |
|
|
3-bed |
146 |
103,198 |
11.1Mn |
753 |
625 |
64,375 |
4.6 |
51.4% |
7.5% |
4.7% |
12.2% |
|
|
Average |
795 |
4.7 |
47.2% |
7.2% |
4.0% |
11.2% |
||||||
|
||||||||||||
Source: Cytonn Research 2018
Below is the Detached unit’s performance analysis;
|
A. High End Market |
|||||||||||
|
Typology |
Unit Plinth Area (SM) |
Price 2018 USD |
Price in Kshs |
Price per SM (USD) |
Rent in USD |
Rent in Kshs |
Rent per SM (USD) |
Annual Uptake |
Rental Yield |
Price App. |
Total Returns |
|
3 -bed |
248 |
166,465 |
17.9Mn |
671 |
1,167 |
121,067 |
5.1 |
35.1% |
9.1% |
5.0% |
14.1% |
|
4-bed |
308 |
257,081 |
26.8Mn |
811 |
1,775 |
190,813 |
5.2 |
17.8% |
7.7% |
1.0% |
8.8% |
|
Average |
741 |
5.1 |
26.5% |
8.4% |
3.0% |
11.5% |
|||||
|
B. Middle-lower income Market |
|||||||||||
|
Typology |
Unit Plinth Area (SM) |
Price 2018 USD |
Price in Kshs |
Price per SM (USD) |
Rent in USD |
Rent in Kshs |
Rent per SM (USD) |
Annual Uptake |
Rental Yield |
Price App. |
Total Returns |
|
3 -bed |
193 |
65,407 |
7.0Mn |
351 |
483 |
51,286 |
2.6 |
45.5% |
8.9% |
4.7% |
13.6% |
|
4-bed |
211 |
80,901 |
8.7Mn |
382 |
519 |
55,844 |
2.5 |
42.6% |
7.8% |
3.6% |
11.4% |
|
Average |
367 |
2.5 |
44.0% |
8.3% |
4.2% |
12.5% |
|||||
|
|||||||||||
Source: Cytonn Research 2018
In summary,
|
Segment |
Unit Type |
Average Price per SM(USD) |
Average Rent per SM(USD) |
||||
|
Annual Uptake |
Rental Yield |
Price App. |
Average Returns |
||||
|
High- End |
Apartments |
1,033 |
7.4 |
48.8% |
8.7% |
6.5% |
15.1% |
|
Middle income- End |
Apartments |
795 |
4.7 |
47.2% |
7.2% |
4.0% |
11.2% |
|
High- End |
Detached Units |
741 |
5.1 |
26.5% |
8.4% |
3.0% |
11.5% |
|
Middle income- End |
Detached Units |
367 |
2.5 |
44.0% |
8.3% |
4.2% |
12.5% |
|
Average |
41.6% |
8.1% |
4.4% |
12.6% |
|||
|
|||||||
Source: Cytonn Research 2018
Below is the summary of the trend analysis between 2016 -2018;
|
Market Average – Apartments Trend Analysis |
||||||
|
Type of Housing |
Annual Uptake |
Yield 2016 |
Price appreciation |
Yield 2018 |
% change in Yield |
Annual % change in Yield |
|
2 bedrooms |
45.7% |
7.5% |
4.1% |
7.8% |
0.3% |
0.2% |
|
3 bedrooms |
49.2% |
11.9% |
6.4% |
8.0% |
-3.9% |
-2.2% |
|
Average |
47.4% |
9.7% |
5.2% |
7.9% |
-1.8% |
-1.0% |
|
Market Average – Stand Alone Units Trend Analysis |
||||||
|
Type of Housing |
Annual Uptake |
Yield 2016 |
Price appreciation |
Yield 2018 |
% change in Yield |
Annual % change in Yield |
|
3 bedrooms |
40.3% |
11.9% |
4.9% |
9.0% |
-2.9% |
-1.7% |
|
4 bedrooms |
30.2% |
5.6% |
2.3% |
7.8% |
2.2% |
1.3% |
|
Average |
35.3% |
8.8% |
3.6% |
8.4% |
-0.4% |
-0.2% |
|
||||||
|
||||||
|
||||||
|
||||||
Source: Cytonn Research 2018
- Commercial Sector
Commercial buildings in Kigali embrace mixed use concepts, with most of the developments comprising of retail space in the lower floors and office space in upper floors. The office sector in Kigali is at Peak/maturity stage attributed to increased supply in office space over the last 5 years. Over the last five years, the Kigali market has witnessed accelerated increase in commercial office space, changing the Kigali skyline, with developments such as M-peace plaza, Kigali city tower and Kigali heights among others, mainly concentrated in Nyarugenge which is the CBD. In additional 70,000 SQM are in the pipeline for the next two years according to Knight Frank Africa report 2017. This has therefore resulted to decline in rental prices and occupancy rates.
The commercial sector is mainly driven by; (i) Government activities, (ii) Growth in SME’s, (iii) International Players, (iv) Positive economic growth and (v) Infrastructural developments
Below is the summary of the commercial sector performance analysis;
|
Office Grade |
Market Share |
Rent Per Sqm USD |
Rent Per SqM Kshs |
Rental Yield (2018) |
Occupancy (2018) |
Change in Rent ($) |
% change in Rent |
change in occupancy |
% change in yield |
Annual % change in yield |
|
Grade A & B |
72.7% |
19.1 |
1,964 |
9.9% |
76.1% |
-0.7 |
-3.3% |
-3.4% |
-1.3% |
-0.7% |
|
Grade C |
27.3% |
14.3 |
1,598 |
9.7% |
96.3% |
-0.2 |
-0.9% |
-3.7% |
-0.5% |
-0.3% |
|
Average |
17.7 |
1,818 |
9.8% |
82.2% |
-0.5 |
-2.4% |
-3.5% |
-1.0% |
-0.5% |
|
|
Retail Space |
21.0 |
2,168 |
12.6% |
89.0% |
2.2 |
11.6% |
-6.3% |
0.3% |
0.2% |
|
|
||||||||||
|
||||||||||
|
||||||||||
|
||||||||||
|
||||||||||
|
||||||||||
Source: Cytonn Research 2018
- Hospitality
The hospitality industry in Rwanda recorded an average growth rate of 8.8% over the last 8 years according to the Africa Hotel Report 2017. In 2015, Rwanda welcomed 1.3 mn visitors, up from 1.2 mn in 2014 and 1.1 mn in 2013. In the same year, MICE tourism (meetings, incentives, conferences and exhibitions) earned Rwanda $37.7 mn — up from $29 mn the previous year. After the Rwanda Convention Bureau was established, visitors for conferences nearly doubled from 17,950 to 35,100 and revenue from MICE events increased from US$29.6 mn in 2014 to US$47 mn in 2016.
There are approximately 200 hotels and 4,500 hotels rooms in Rwanda according to Rwanda Development Board, with international brands such as; Marriott, Serena and Radisson Blu, which operates Radisson Blu and Park Inn.
The sector is largely driven by i) political stability thus boosting investor confidence and also the growth of the expatriate community ii) MICE and International Tourism iii) Aggressive marketing strategy by the government iv) free entry visas for all African citizens arriving at its borders and v) availability of public interests.
Serviced Apartments
The Serviced Apartments sector is still in its nascent stage in Kigali, with most apartments having come into the market from 2015 onwards. However, there has been a growing demand for the serviced apartments with occupancies at 67.2%.
In Kigali, 1 bed and 2 beds are the most popular typology with average occupancies of 72.5% and 77.3% respectively, with most of the serviced apartments being let, usually within long term contracts. The high demand for serviced apartments is attributed to the high numbers of expatriates in Rwanda, given the countries good security and political stability.
Performance summary is as shown below;
|
Typology |
Size |
Average Daily Rate (USD) |
Average Daily Rate(Kshs) |
Average Monthly Rate(USD) |
Average monthly rate(Kshs) |
Average Daily Rate Per SQM(USD) |
Average Monthly Rate per sqm(USD) |
Average Occupancy |
Average Rental yield |
|
Studio |
38 |
120 |
12,360 |
1,200 |
123,600 |
3.2 |
21 |
54.3% |
6.9% |
|
1 Bedroom |
65 |
181 |
18,597 |
1,594 |
145,917 |
2.8 |
15.6 |
72.5% |
5.1% |
|
2 Bedroom |
101 |
223 |
23,003 |
2,558 |
263,508 |
2.2 |
18 |
77.3% |
5.9% |
|
3 Bedroom |
245 |
717 |
73,817 |
6,000 |
618,000 |
2.9 |
17.7 |
51.7% |
5.8% |
|
Average |
137 |
374 |
38,472 |
3,384 |
342,475 |
2.6 |
17.1 |
67.2% |
5.6% |
|
*Studios have been excluded from the analysis since there were only two comparable, of which one was set aside for short term guests only |
|||||||||
|
|||||||||
|
|||||||||
|
|||||||||
Source: Cytonn Research 2018
- Land Sector Analysis
|
Unserviced Plots - Asking Prices |
||||
|
Area |
price(USD)/SQM |
Price per Acre (USD) |
Price Per Acre (RWF) |
Price Per Acre (Kshs) |
|
Nyarutarama |
180 |
719,287 |
618.6 mn |
77.3 mn |
|
Kibagabaga |
81 |
323,188 |
277.9 mn |
34.7 mn |
|
Kagugu |
43 |
172,152 |
148.1 mn |
18.5 mn |
|
Gisozi |
49 |
197,200 |
169.6 mn |
21.2 mn |
|
Remera |
106 |
425,597 |
366.0 mn |
45.8 mn |
|
Kicukiro |
56 |
290,378 |
249.7 mn |
31.2 mn |
|
Gacuriro |
66 |
265,389 |
228.2 mn |
28.5 mn |
|
Kabuga |
30 |
120,000 |
103.2 mn |
12.9 mn |
|
CBD |
250 |
1,000,000 |
860.0 mn |
107.5 mn |
|
Rusororo |
33 |
131,783 |
113.3 mn |
14.2 mn |
|
Average |
89 |
364,497 |
313.5 mn |
39.2 mn |
|
||||
Source: Cytonn Research 2018
- Summary Kigali Real Estate Sector Performance Summary
|
Theme |
Occupancy Rates (2018) |
Annual Uptake (2018) |
Price App. (2018) |
Rental Yield (2018) |
Rental Yield (2016) |
% change in Rental Yield |
Annual % change in Rental Yield |
|
Residential |
41.3% |
4.4% |
8.1% |
9.3% |
-1.2% |
-0.7% |
|
|
Office |
82.5% |
9.8% |
10.8% |
-1.0% |
-0.5% |
||
|
Retail |
89.4% |
12.6% |
12.3% |
0.3% |
0.2% |
||
|
Serviced Apartments |
67.2% |
5.6% |
|||||
|
Average |
79.7% |
41.3% |
4.4% |
9.0% |
10.8% |
-0.6% |
-0.3% |
|
|||||||
Source: Cytonn Research 2018
Comparative Analysis
Source: Cytonn Research 2018
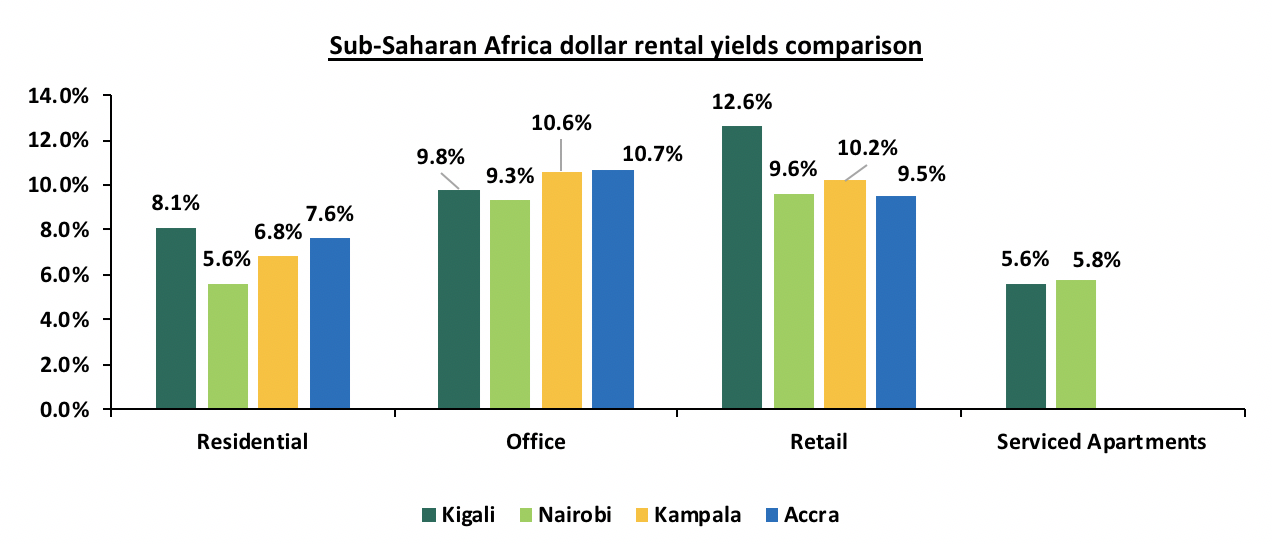
In comparison with other cities in Sub-Saharan Africa, Kigali has higher dollarized rental yields than any other key cities in residential and retail sector at an average rental yield of 8.1% and 12.6% respectively. Kigali outperforms Nairobi market in Residential, retail and office with rental yields of 8.1%,12.6% and 9.8% respectively, compared to Nairobi with 5.6%, 9.6% and 9.3% respectively. The Kigali market is however nascent and small as the City has a population of 1.3mn against Accra’s 2.4mn, Nairobi’s 4.1mn and Kampala’s 1.5mn people according to the country’s respective statistical bureaus
We further delve to identify the specific investment areas, of which we ranked the areas, based on annual uptake, Yield and Land price and the recommendations area as below:
- Outlook on the Kigali real estate investment opportunity
|
Theme |
Performance (2018) |
Recommendation/Outlook |
Area of Focus |
Outlook |
|
Residential |
The residential sector has an average rental yield of 8.1% at an uptake of 42.6%p. a, recording an annual decline in rental yield of 0.7%. This is mainly due to stability in rental charges due to increase in housing units supply |
For apartments focus on 3-bed units in High end areas with a total return of 15.1% |
3 – bed apartments in areas such as Kagugu, Gacuriro and Kibagabaga |
|
|
For standalone units, focus on 3-bed units in the mid-end segments with total returns of 12.5% and 44% annual uptake |
3-bed units in areas such as Nyarutarama and Rusororo |
|||
|
Commercial Office |
On average, the monthly rent per square metre in Kigali is USD. 17.7, with an occupancy rate of 82.2% hence a rental yield of 9.8% |
The office market is on a declining trend and vacancy rates are likely to increase due to increasing supply, outstripping demand |
Areas in the outskirts of CBD such as Kimihurura |
|
|
Retail Sector |
On average, the monthly rent per square metre in Kigali is USD. 21.0, with an occupancy rate of 89.0% hence a rental yield of 12.6% |
The outlook is positive with the retail sector recording an annual 0.2% increase in rental yields and the government ban of open air market |
Urban areas outside Kigali CBD such as Remera and Nyarutarama |
|
|
Serviced Apartments |
Serviced apartments have a high average occupancy of 67.2% and a rental yield of 5.6% |
The serviced apartments sector is positive, hence our recommendation focussing on the sector with bias to 2-bedroom units |
High end areas such as Nyarutarama and Kacyiru |
 |

We have a positive outlook for the Kigali real estate market driven by the high housing demand, attractive returns, political stability, a positive demographic profile and government support through incentives. And our preferred investment areas are mid to high end residential, Retail sector and Serviced Apartments.
For comprehensive market research on residential, commercial and serviced apartments in Kigali and its environs, refer to the full report here: Kigali Real Estate Investment Opportunity
Disclaimer: The views expressed in this publication, are those of the writers where particulars are not warranted. This publication, which is in compliance with Section 2 of the Capital Markets Authority Act Cap 485A, is meant for general information only, and is not a warranty, representation, advice or solicitation of any nature. Readers are advised in all circumstances to seek the advice of a registered investment advisor.

- Talk to us
- Kenya
- P.O Box 20695 - 00200, Nairobi, Kenya
- Cell +254709101200
- Tel +254709101200
- WhatsApp +254741676635
- United States
- +254709101200
- DOWNLOAD OUR APP
-


- Kenya
- 8th Floor, Pinetree Plaza, Kaburu Drive, Ngong Road, Nairobi, Kenya
- USA
- Suite 1150, 1775 Eye Street NW, USA, Washington DC 20006, USA
- Investments
- High Yield
- Private Equity
- Real Estate
- Real Estate
- RiverRun Estates
- Cytonn Towers
- The Ridge
- Taraji Heights
- The Alma