Ruaka Real Estate Investment Opportunity, & Cytonn Weekly #11_2019
By Cytonn Research Team, Mar 17, 2019
Executive Summary
Fixed Income
T-bills recorded an over-subscription during the week, with the performance rate rising to 156.9%, from 90.9% recorded the previous week. The oversubscription is attributable to favorable liquidity conditions in the money market during the week following the end of the monthly Cash Reserve Requirement (CRR) cycle. The yields on the 91-day, 182-day, and 364-day papers declined by 4.9 bps, 4.6 bps, and 3.0 bps to 6.8%, 8.3%, and 9.4%, respectively. During the week, the Energy Regulatory Commission (ERC) released their monthly statement on the maximum retail prices in Kenya effective from 15th March 2019 to 14th April 2019. Petrol prices have increased by 1.3% to Kshs 101.4, from Kshs 100.1 per litre previously, while diesel and kerosene prices have increased by 0.7% and 3.1% to Kshs 96.6 and 99.5 per litre, respectively, from Kshs 96.0 and 96.5 per litre, previously;
Equities
During the week, the equities market recorded mixed performances, with NASI and NSE 25 gaining by 1.3% and 0.9%, respectively, while NSE 20 declined by 0.7%, taking their YTD performance to gains of 12.5%, 2.2%, and 10.9%, for NASI, NSE 20 and NSE 25, respectively. Barclays Bank of Kenya released their FY’2018 financial results, recording a 7.1% growth in core earnings per share to Kshs 1.4, from Kshs 1.3 in FY’2017. A ruling by the High Court of Kenya declared the provisions of the Banking (Amendment) Act 2016, which stipulates a cap on interest rates offered by commercial banks to 4.0% points above the Central Bank Rate (CBR), which is currently at 9.0%, to be unconstitutional and thus no longer applicable. Implementation of this ruling was however suspended for 12-months;
Private Equity
African Private Equity and Venture Capital Association (AVCA) released their 2018 Annual African Private Equity Data Tracker. The report highlights private equity activity in 2018 in terms of (i) fundraising, (ii) deal tally and value, and (iii) exits. According to the report, the total value of African private equity (PE) fundraising increased by 12.5% to USD 2.7 bn in 2018, from USD 2.4 bn in 2017, indicating investors’ confidence in Africa’s PE industry. Although the total deal value decreased slightly by 10.3% to USD 3.5 bn in 2018, from USD 3.9 bn in 2017, the total number of deals rose by 8.8% reaching 186 reported PE deals in 2018, from 171 deals reported in 2017. The number of PE exits recorded in Africa in 2018 dropped to 46, from 52 in 2017;
Real Estate
Kenya National Bureau of Statistics (KNBS) released its December 2018 issue of Leading Economic Indicators, reporting a decline in the value of building approvals by the Nairobi City County as well as cement consumption in Kenya in 2018. In the residential sector, Erdemann Property Limited, a Kenyan-based developer, broke ground on a Kshs 7.0 bn affordable housing project named “The River Apartments” in Ngara Estate, Nairobi comprising of 2,720 units, while in the land sector, the Ministry of Lands announced that the Lands Information Management System (LIMS) is expected to go live on 1st April 2019;
Focus of the Week
This week, we update our research findings on the Ruaka real estate market by looking at the residential market performance in the area, the factors that have contributed to its attractiveness to investors and analyzing the potential returns to investors in the area. From Cytonn Research conducted in December 2018, Ruaka recorded returns of 12.5%, 1.4% points higher than 11.1% annual total returns in June the same year, mainly due to a 7.3% annual increase in property prices fueled by land price growth and the increased demand for housing in the area by the growing middle-class population.
- Cytonn Asset Managers, our regulated affiliate, launched its Money Market Fund, called Cytonn Money Market Fund on March 11th, 2019. The current yield on the fund is 10.21% per annum;
- Cytonn Investments now has agents in the following towns; Eldoret, Embu, Kakamega, Kericho, Kisii, Kisumu, Meru, Mombasa, Naivasha, Nanyuki and Nyahururu. For a list of all the agents and their locations, click here;
- Faith Maina, Investments Analyst at Cytonn, was on Citizen T.V to discuss the economic impact of Gikomba fire on the traders. Watch Faith here;
- On Thursday, 14th March 2019, Cytonn Investments held an event to launch Cytonn Dhan, an initiative by the firm to connect with the Asian Markets. See Event Note;
- For an exclusive tour of our developments, visit: Sharp Investor’s Tour and for more information, email us at sales@cytonn.com;
- Following the recent approval by Retirement Benefits Authority (RBA), for Cytonn Asset Managers to manage pension funds, we are looking for business development consultants and agents with networks in the pensions industry to build our pensions business at very attractive commissions. If interested in being an agent or know someone who can be an agent, kindly contact us at pensions@cytonn.com;
- Following the completion and handover of Amara Ridge in Karen, we have now launched our next Karen project, dubbed Applewood, a Kshs 2.5 bn residential development located in Miotoni, Karen. This signature development shall comprise luxury homes, each sitting on 1/2 acre. We invite you to the exhibition of Applewood which is ongoing at the Amara Ridge Clubhouse (Location pin: https://goo.gl/maps/B3GVnu8pHyn) from 9:00 am to 5:00 pm daily. Call 0709 101 000 or email resales@cytonn.com to reserve a villa! See Video here;
- We continue to hold weekly workshops and site visits on how to build wealth through real estate investments. The weekly workshops and site visits target both investors looking to invest in real estate directly and those interested in high yield investment products to familiarize themselves with how we support our high yields. Watch progress videos and pictures of The Alma, Amara Ridge, and The Ridge. Key to note is that our cost of capital is priced off the loan markets, where all-in pricing ranges from 16.0% to 20.0%, and our returns on real estate developments range from 23.0% to 25.0%, hence our top-line gross spread is about 6.0%. If interested in attending the site visits, kindly register here;
- We continue to see very strong interest in our weekly Private Wealth Management Training (largely covering financial planning and structured products). The training is at no cost and is open only to pre-screened participants. We also continue to see institutions and investment groups interested in the training for their teams. Cytonn Foundation, under its financial literacy pillar, runs the Wealth Management Training. If interested in our Private Wealth Management Training for your employees or investment group, please get in touch with us through wmt@cytonn.com. To view the Wealth Management Training topics, click here;
- For recent news about the company, see our news section here;
- We have 10 investment-ready projects, offering attractive development and buyer targeted returns of around 23.0% to 25.0% p.a. See further details here: Summary of Investment-Ready Projects;
- We continue to beef up the team with ongoing hires for Financial and Real Estate Advisors for our offices in Nairobi, Nakuru, Kisumu, and Nyeri. Visit the Careers Section on our website to apply.
T-Bills & T-Bonds Primary Auction:
T-bills recorded an over-subscription during the week, with the performance rate rising to 156.9%, from 90.9% recorded the previous week. The oversubscription is attributable to favorable liquidity conditions in the money market during the week following the end of the monthly Cash Reserve Requirement (CRR) cycle. The yields on the 91-day, 182-day, and 364-day papers declined by 4.9 bps, 4.6 bps, and 3.0 bps to 6.8%, 8.3%, and 9.4%, respectively. The acceptance rate for T-bills dropped to 63.5%, from 89.4% the previous week, with the government accepting Kshs 23.9 bn of the Kshs 37.6 bn worth of bids received. The subscription rate for the 91-day, 182-day, and 364-day papers rose to 76.7%, 79.6% and 266.2% from 16.9%, 61.4% and 149.9%, recorded the previous week, respectively, with investors’ participation remaining skewed towards the longer dated paper. The demand for the longer-dated paper is attributable to the scarcity of newer short-term bonds in the primary market.
For the month of March, the Kenyan Government has issued a 25-year Infrastructure Bond issue no: IFB, 1/2019/25 with a coupon rate of 12.2%, which is the longest infrastructure bond issue in history, in a bid to raise Kshs 50.0 bn for partial funding of infrastructure projects in the transport, water and energy sectors. The long tenor of the bond is in line with the CBK’s objective of lengthening the maturity profile of public debt in order to reduce refinancing risk. Despite IFB’s historically recording higher subscription rates than other Treasury Bonds due to the tax-free incentive translating to higher investment yields, we do not expect the issue to generate significant interest due to duration risk associated with long-term papers. We expect the weighted average of accepted bids to come in at 12.5% - 12.7%.
Liquidity:
The average interbank rate rose marginally to 3.9%, from 3.8% the previous week, while the average volumes traded in the interbank market declined by 72.4% to Kshs 2.8 bn, from Kshs 10.3 bn the previous week. Despite the marginal rise in the inter-bank rate, liquidity conditions remained favorable following the end of the monthly Cash Reserve Requirement (CRR) cycle and driven by government payments.
Kenya Eurobonds:
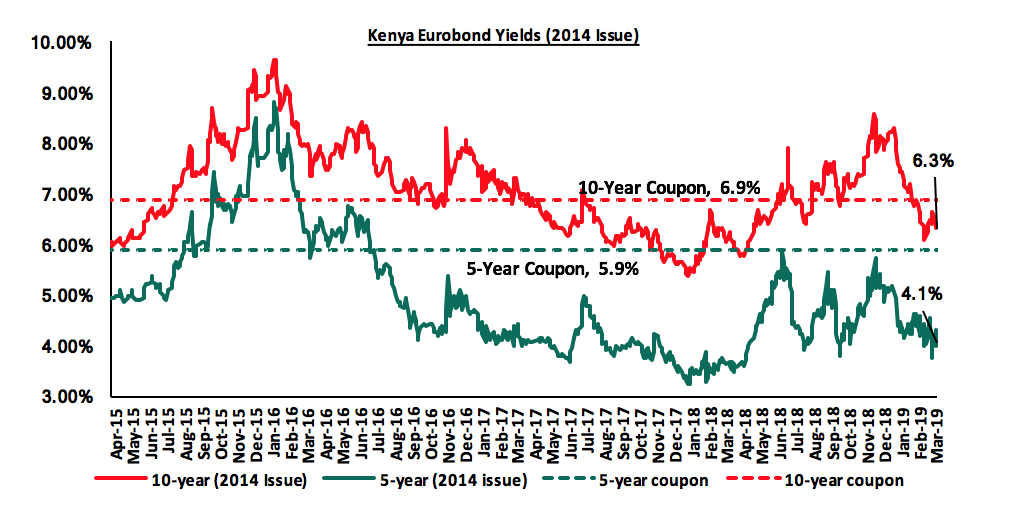
According to Bloomberg, the yield on the 10-year and 5-year Eurobonds issued in 2014 declined by 0.3% points and 0.1% points to 6.3% and 4.1% from 6.6% and 4.2%, the previous week, respectively. Since the mid-January 2016 peak, yields on the Kenyan Eurobonds have declined by 4.7% points and 3.3% points for the 5-year and 10-year Eurobonds, respectively, an indication of the relatively stable macroeconomic conditions in the country. Key to note is that these bonds have 0.3-years and 5.3-years to maturity for the 5-year and 10-year, respectively.
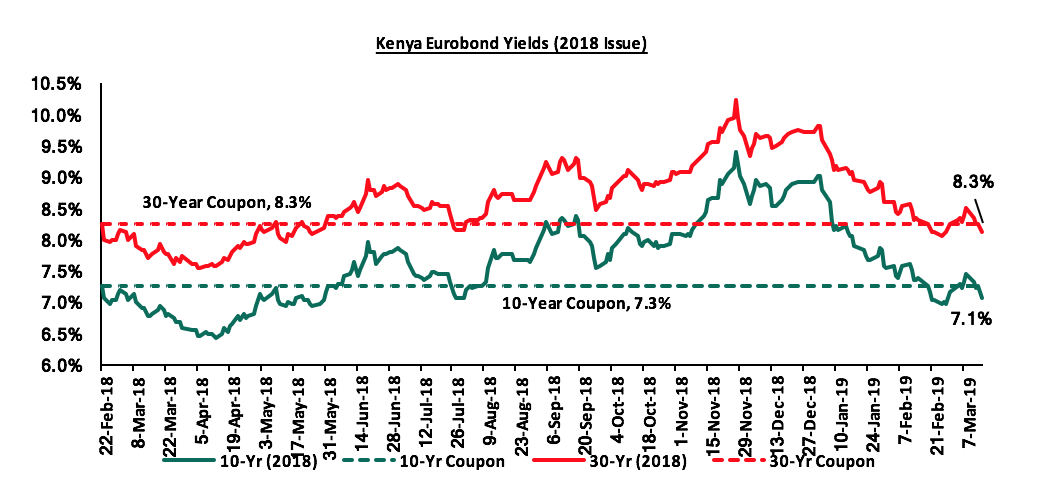
 For the February 2018, Eurobond issue, during the week, the yields on both the 10-year and 30-year Eurobonds declined by 0.3% points and 0.4% points to 7.1% and 8.1%, from 7.3% and 8.5% the previous week, respectively. Since the issue date, the yields on both the 10-year and 30-year Eurobond have declined by 0.2% points.
 The Kenya Shilling:
During the week, the Kenya Shilling edged down by 0.5% against the US Dollar to Kshs 100.2, from Kshs 99.7 the previous week. The performance was attributable to high dollar demand from the manufacturing and energy sector, which outweighed inflows from diaspora remittances. The Kenya Shilling has appreciated by 1.6% year to date, and in our view the shilling should remain relatively stable to the dollar in the short term, supported by:
- The narrowing of the current account deficit with preliminary data on balance of payments indicating continued narrowing to 4.6% of GDP in the 12-months to January 2019, from 5.5% recorded in January 2018. The decline has been attributed to improved agriculture exports, increased diaspora remittances, strong receipts from tourism, and lower food and SGR-related equipment relative to 2017,
- Improving diaspora remittances, which increased by 38.6% in 2018 to USD 2.7 bn, from USD 1.9 bn recorded in 2017. The rise is due to;
- Increased uptake of financial products by the diaspora due to financial services firms, particularly banks, targeting the diaspora, and,
- New partnerships between international money remittance providers and local commercial banks making the process more convenient,
- CBK’s activities in the money market, such as repurchase agreements and selling of dollars, and,
- High levels of forex reserves, currently at USD 8.1 bn, equivalent to 5.3-months of import cover, above the statutory requirement of maintaining at least 4.0-months of import cover, and the EAC region’s convergence criteria of 4.5-months of import cover.
Highlights of the Week:
During the week, the Energy Regulatory Commission (ERC) released their monthly statement on the maximum retail fuel prices in Kenya effective from 15th March 2019 to 14th April 2019. Below are the key take-outs from the statement:
Petrol prices have increased by 1.3% to Kshs 101.4, from Kshs 100.1 per litre previously, while diesel and kerosene prices have increased by 0.7% and 3.1% to Kshs 96.6 and 99.5 per litre, respectively, from Kshs 96.0 and 96.5 per litre, previously. The changes in prices are attributable to:
- An increase in the average landing costs of imported super petrol by 3.7% to USD 568.6 per ton in February, from USD 548.2 per ton in January. Landing costs for diesel and kerosene as well increased by 2.8% and 9.2% to USD 561.6 per ton and USD 650.2 per ton in February, respectively, from USD 546.4 per ton and USD 595.8 per ton in January, and,
- The Free on Board (FOB) price of Murban crude oil lifted in February 2018 also increased by 8.9% to USD 66.4 per barrel from USD 61.0 per barrel in January 2019.
The increase in prices was, however, mitigated by the 1.1% appreciation of the Kenyan Shilling against the US Dollar to Kshs 100.2 in February, from Kshs 101.3 in January. Consequently, we expect a rise in the transport index, which carries a weighting of 8.7% in the total consumer price index (CPI), due to the increased petrol and diesel prices. We will release our inflation projection for the month of March 2019 in next week’s report.
Rates in the fixed income market have remained stable as the government rejects expensive bids, despite being 2.7% behind its domestic borrowing target for the current financial year, having borrowed Kshs 220.4 bn against a pro-rated target of Kshs 226.6 bn. A budget deficit is likely to result from depressed revenue collection, creating uncertainty in the interest rate environment as additional borrowing from the domestic market goes to plug the deficit. Despite this, we do not expect upward pressure on interest rates due to increased demand for government securities, driven by improved liquidity in the market owing to the relatively high debt maturities. Our view is that investors should be biased towards medium-term fixed income instruments to reduce duration risk associated with long-term debt, coupled with the relatively flat yield curve on the long-end due to saturation of long-term bonds.
Market Performance:
During the week, the equities market recorded mixed performances, with NASI and NSE 25 gaining by 1.3% and 0.9%, respectively, while NSE 20 declined by 0.7%, taking their YTD performance to gains of 12.5%, 2.2%, and 10.9%, for NASI, NSE 20 and NSE 25, respectively. The performance in NASI was driven by gains in large cap stocks such as Equity Group, Barclays Bank of Kenya, and Safaricom, which gained by 4.9%, 3.9% and 2.8%, respectively.
Equities turnover declined by 45.1% during the week to USD 30.7 mn, from USD 55.8 mn the previous week, taking the YTD turnover to USD 380.7 mn. Foreign investors turned net buyers for the week, with a net buying position of USD 3.2 mn, a decline from last week’s net buying position of USD 4.6 mn.
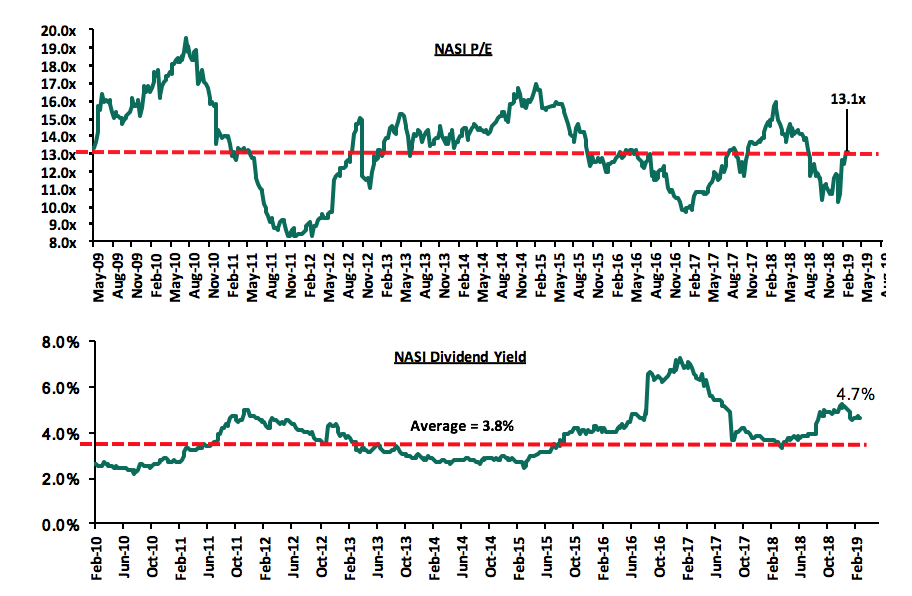
The market is currently trading at a price to earnings ratio (P/E) of 13.1x, 2.2% below the historical average of 13.4x, and a dividend yield of 4.7%, above the historical average of 3.8%. With the market trading at valuations below the historical average, we believe there is value in the market. The current P/E valuation of 13.1x is 35.1% above the most recent trough valuation of 9.7x experienced in the first week of February 2017, and 57.8% above the previous trough valuation of 8.3x experienced in December 2011. The charts below indicate the historical P/E and dividend yields of the market.
Earnings Releases
During the week, Barclays Bank of Kenya released their FY’2018 financial results. Core earnings per share increased by 7.1% to Kshs 1.4, from Kshs 1.3 in FY’2017, above our expectation of a 2.7% increase to Kshs 1.31. The performance was driven by a 4.7% increase in total operating income, despite the 5.8% increase in total operating expenses. The variance in core earnings per share growth against our expectations was largely due to the 24.3% increase in Loan Loss Provisions (LLP) to Kshs 3.9 bn, from Kshs 3.1 bn in FY’2017, against our expectation of a 4.1% decline in LLP to Kshs 3.0 bn. Highlights of the performance from FY’2017 to FY’2018 include:
- Total operating income increased by 4.7% to Kshs 31.7 bn, from Kshs 30.3 bn in FY’2017. This was due to a 0.9% increase in Net Interest Income (NII) to Kshs 22.0 bn, from Kshs 21.8 bn in FY’2017, coupled with the 14.7% rise in Non-Funded Income (NFI) to Kshs 9.7 bn, from Kshs 8.5 bn in FY’2017,
- Interest income increased by 7.0% to Kshs 29.1 bn, from Kshs 27.2 bn in FY’2017. This was driven by a 27.8% growth in interest income from government securities to Kshs 7.4 bn, from Kshs 5.8 bn in FY’2017, and a 1.3% increase in interest income on loans and advances to Kshs 21.5 bn, from Kshs 21.3 bn in FY’2017. The yield on interest-earning assets however declined to 11.4% from 12.1% in FY’2017, attributed to a decline in yields on government securities as well as a decline in lending rates due to the two CBR cuts last year, coupled with the faster 19.2% y/y increase in interest earning assets to Kshs 276.9 bn, from Kshs 232.2 bn in FY’2017,
- Interest expenses increased by 31.6% to Kshs 7.1 bn, from Kshs 5.4 bn in FY’2017, following a 76.2% increase in the interest expense on placement liabilities to Kshs 0.9 bn, from Kshs 0.5 bn in FY’2017, as the bank sought to support deposit growth amidst tight liquidity in the money market. Moreover, interest expense on customer deposits rose 26.7% to Kshs 6.1 bn, from Kshs 4.8 bn in FY’2017, on the back of the strong deposit growth of 11.5% y/y experienced in 2018. Consequently, the cost of funds rose to 3.5% from 2.9% in FY’2017. Thus, the Net Interest Margin (NIM) declined to 8.6%, from 9.1% in FY’2017,
- Non-Funded Income (NFI) rose by 14.7% to Kshs 9.7 bn, from Kshs 8.5 bn in FY’2017. The growth was mainly driven by a 65.5% growth in fees and commissions on loans to Kshs 1.1 bn, from Kshs 0.6 bn in FY’2017, coupled with the 14.5% rise in forex trading income to Kshs 3.3 bn from Kshs 2.9 bn, which outpaced the 1.4% decline in other fees and commissions to Kshs 4.57 bn from Kshs 4.64 bn. As a result, the revenue mix shifted to 69:31 funded to non-funded income from 72:28 in FY’2017, as NFI grew faster than NII,
- Total operating expenses increased by 5.8% to Kshs 21.1 bn from Kshs 19.9 bn, largely driven by a 24.3% increase in Loan Loss Provisions (LLP) to Kshs 3.9 bn in FY’2018, from Kshs 3.1 bn in FY’2017, coupled with an 11.1% increase in other operating expenses to Kshs 7.4 bn in FY’2018, from Kshs 6.7 bn in FY’2017, which outweighed the 3.4% decline in staff costs to Kshs 9.8 bn from Kshs 10.1 bn in FY’2017, with the bank having laid off 323 staff in 2017,
- Consequently, the Cost to Income Ratio (CIR) deteriorated, albeit marginally, to 66.4%, from 65.8% in FY’2017. Without LLP, the cost to income ratio improved to 54.2%, from 55.5% in FY’2017, highlighting the rise in the cost of risk to 12.2% from 10.3% in FY’2017,
- Profit before tax increased by 2.7% to Kshs 10.7 bn, up from Kshs 10.4 bn in FY’2017. Profit after tax grew by 7.1% to Kshs 7.4 bn in FY’2018, from Kshs 6.9 bn in FY’2017, due to the effective tax rate declining to 30.0% from 33.0% in FY’2017,
- The bank recommends a final dividend of Kshs 0.9 per share, having already paid an interim dividend of Kshs 0.2 per share, translating to a total dividend payout of Kshs 1.1 per share, a 10.0% rise from Kshs 1.0 paid in FY’2017, which translates to a dividend yield of 9.3%,
- The balance sheet recorded an expansion as total assets increased by 19.8% to Kshs 324.8 bn, from Kshs 271.2 bn in FY’2017. This growth was largely driven by a 58.9% increase in government securities to Kshs 92.9 bn, from Kshs 58.5 bn in FY’2017, coupled with a 5.3% increase in their loan book to Kshs 177.4 bn, from Kshs 168.4 bn in FY’2017,
- Total liabilities rose by 23.6% to Kshs 280.6 bn, from Kshs 227.1 bn in FY’2017, driven by a 73.5% increase in Placement Liabilities to Kshs 5.3 bn, from Kshs 3.1 bn in FY’2017, coupled with a 78.5% increase in other liabilities to Kshs 67.9 bn from Kshs 38.0 bn in FY’2017. Customer deposits also increased, as they rose by 11.5% to Kshs 207.4 bn, from Kshs 186.0 bn in FY’2017. Deposits per branch increased by 20.8% to Kshs 2.5 bn, from Kshs 2.0 bn in FY’2017, with the number of branches having reduced by 7 to 84 from 91 as at the end of 2017,
- The faster growth in deposits as compared to loans led to a decline in the loan to deposit ratio to 85.5% from 90.5% in FY’2017,
- Gross Non-Performing Loans (NPLs) rose by 10.3% to Kshs 13.9 bn in FY’2018 from Kshs 12.6 bn in FY’2017. The NPL ratio thus deteriorated to 7.4% in FY’2018 from 7.1% in FY’2017. General Loan Loss Provisions rose by 17.5% to Kshs 6.5 bn from Kshs 5.6 bn in FY’2017. However, The NPL coverage declined marginally to 69.2% in FY’2018 from 70.0% in FY’2017, as interest in suspense declined by 5.2% to Kshs 3.1 bn from Kshs 3.3 bn in FY’2017,
- Shareholders’ funds increased marginally by 0.2% to Kshs 44.2 bn in FY’2018 from Kshs 44.1 bn in FY’2017, as the 6% increase in the revaluation reserve to Kshs 0.5 bn from Kshs 0.3 bn in FY’2017, was weighed down by the 1.9% decline in retained earnings to Kshs 35.9 bn from Kshs 36.6 bn in FY’2017,
- Barclays Bank Kenya is currently sufficiently capitalized with a core capital to risk-weighted assets ratio of 14.4%, 3.9% above the statutory requirement. In addition, the total capital to risk-weighted assets ratio was 16.4%, exceeding the statutory requirement by 1.9%. Adjusting for IFRS 9, the core capital to risk weighted assets stood at 14.7%, while total capital to risk-weighted assets came in at 16.7%,
- The bank currently has a Return on Average Assets (ROaA) of 2.7%, and a Return on Average Equity (ROaE) of 16.8%.
Key Take-Outs:
- The bank’s asset quality deteriorated albeit marginally, with the NPL ratio deteriorating to 7.4% from 7.1% in FY’2017, as the gross NPLs rose by 10.3%. This was attributed to the corporate, real estate and SME book, as various entities cited the delayed payments by government and a relatively tougher operating environment in 2018. However, the bank continued to demonstrate prudence, as the NPL coverage remained relatively high, at 69.2%, albeit slightly lower than the 70.0% in FY’2017. With the ongoing economic recovery, the bank’s asset quality is likely to continue improving, across the other segments such as SMEs and the real estate segments,
- There was a rapid expansion of Non-Funded Income, as it expanded by 14.7% y/y. The growth was largely driven by increased usage of the Bank’s digital application platform, “Timiza”, which was launched in March 2018, and has already disbursed approximately Kshs 10.0 bn, to its approximately 3.0 mn client base. Furthermore, with increased transactions (70.0% of all transactions) being done via alternative channels, the bank benefited from higher transactional revenue. This has increased Barclay’s NFI contribution to revenue to 31.0%, which is still lower than its peer average at 35.0% NFI contribution to revenue, indicating the bank can still do more to grow its alternative revenue streams, and,
- The bank recorded relatively strong growth in its balance sheet, as deposits grew by 11.5% y/y, and were channeled to Government Securities Investments, which grew by 58.9% and loans and advances that grew by 5.3%y/y, the highest recorded by the bank in the rate cap era. The growth in interest earning assets helped support increased interest income revenue, despite the decline in yields of both the government securities and loans, with the Central Bank Rate (CBR) declining by 100 bps during the year.
For more information, please see our Barclays Bank of Kenya FY’2018 Earnings Note
With 3 banks having released their FY’2018 results, the table below highlights their key operating metrics;
|
Bank |
Core EPS Growth |
Interest Income Growth |
Interest Expense Growth |
Net Interest Income Growth |
Net Interest Margin |
Non-funded income Growth |
NFI to Total Operating Income |
Growth in Total Fee and Commissions |
Deposit Growth |
Growth in Govt Securities |
Loan to Deposit ratio |
Loan Growth |
Return on average equity |
|
Stanbic Bank |
45.7% |
13.8% |
19.2% |
14.0% |
5.0% |
18.3% |
45.1% |
15.5% |
13.5% |
3.7% |
79.7% |
22.1% |
14.3% |
|
KCB Group |
21.8% |
4.1% |
14.1% |
0.9% |
8.2% |
(0.1%) |
32.0% |
(25.3%) |
7.6% |
9.1% |
84.8% |
7.9% |
21.9% |
|
Barclays Bank |
7.1% |
7.0% |
31.6% |
0.9% |
8.6% |
14.7% |
30.6% |
65.5% |
11.5% |
58.9% |
85.5% |
5.3% |
16.8% |
|
Weighted Average* |
21.7% |
6.6% |
19.9% |
3.1% |
7.8% |
7.2% |
33.8% |
7.4% |
9.7% |
22.3% |
84.1% |
9.6% |
19.2% |
|
Weighted Average 2017 |
(1.0%) |
(2.4%) |
2.6% |
(3.8%) |
8.4% |
9.1% |
33.6% |
13.4% |
12.5% |
22.2% |
80.0% |
6.1% |
17.6% |
*Weighted By Market cap as at December 31st 2018
Key take-outs from the table above include:
- Three listed banks have released results for FY’2018, and have recorded a 21.7% average increase in core Earnings Per Share (EPS), compared to a sector average decline of 1.0% in FY’2017,
- The banks recorded weaker deposit growth, which came in at 9.7%, slower than the 12.5% growth recorded in FY’2017. Despite the slower deposit growth, interest expenses increased by 19.9%, compared to a growth of 2.6 % in FY’2017 indicating that the banks have been mobilizing expensive deposits,
- Average loan growth came in at 9.6%, which was higher than 6.1% recorded in FY’2017, indicating an improvement in credit extension to the real economy, despite the interest rate cap. Government securities on the other hand recorded a growth of 22.3% y/y, just above the 22.2% recorded in FY’2017, and which outpaced the growth in loans. This indicates that banks’ continued preference towards investing in government securities, which offer better risk-adjusted returns. Interest income increased by 6.6%, compared to a decline of 2.4% recorded in FY’2017, as banks adapted to the interest rate cap regime, with increased allocations to government securities. The Net Interest Income (NII) thus grew by 3.2% compared to a decline of 3.8% in FY’2017,
- The average Net Interest Margin for the three banks currently stands at 7.8%, down from the sector average of 8.4% recorded in FY’2017, despite the Net Interest Income by increasing 3.2% y/y, and,
- Non-funded Income grew by 7.2 % y/y, slower than 9.1% recorded in FY’2017. The growth in NFI was weighed down as total fee and commissions grew by 7.4%, slower than the 13.4% growth recorded in FY’2017.
Weekly Highlights
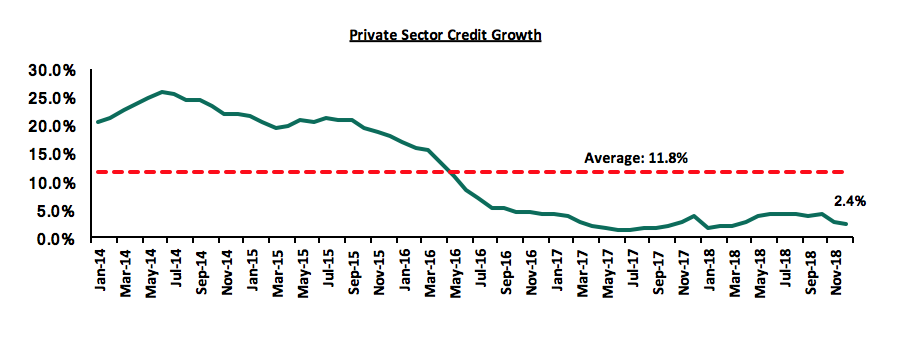
A ruling by a three-Judge High Court Bench in Nairobi declared the Banking (Amendment) Act 2016 to be unconstitutional. Enacted in in 2016, the law stipulates a deposit and loan-pricing framework that provided for: (i) a cap on lending rates at 4.0% above the Central Bank Rate (CBR), and (ii) a floor on the deposit rates at 70.0% of the CBR, which was scrapped in October 2018. Following the ruling, the cap on lending rates at 4.0% above the Central Bank Rate (CBR) will no longer be effective, after the 12-months implementation period. Noting that the implementation of this rule would come with a lot of disruption to the Financial Services sector, the High Court suspended the effect of the declaration for 12-months, thus allowing Parliament time to reconsider sections that were declared unconstitutional by the High Court. The ruling follows a series of calls to amend the Act with the most recent being a proposal that was tabled by Mr. Moses Kuria, the Member of Parliament for Gatundu South in January 2019. The proposal made was to amend the Act to allow credit consumers negotiate for interest rates on loans, depending on their risk profile, with an upper limit of up to 6.0% above the existing interest rate cap levels. This would have seen borrowers be able to access credit at rates of a maximum of 19.0% per annum compared to the current rate of 13.0 %. The Central Bank of Kenya echoed this sentiment and lauded the members of parliament for acknowledging the negative effect of interest rate capping on the economy. CBK Governor Dr. Patrick Njoroge has also maintained his stand that the law should be completely overhauled to encompass a system that allows banks to adopt a risk-based lending approach. These efforts have been in a bid to try and improve credit extension to the private sector, comprised largely of the Micro, Small and Medium Enterprises (MSMEs), as private sector credit growth (highlighted in the chart below) averaged 3.3% in 2018, way below the 5-year average of 11.8%.
 The suspension duration is expected to serve as a transition period to avoid disruption of current contractual agreements between banks and their customers and, on the other hand, allow parliament to assess and ammend the provisions in contention. As such, the status of the rate cap law still hangs on the balance and we expect the final outcome to be determined by:
- Political Motives: Nothing fundamental has been put on the table to make the members of parliament change their mind on the rate cap. As we get closer to the next general election, the resolve by parliamentarians to side with the electorate can only get stronger,
- Excecutive Influence: In our view, the Executive’s stand is what will determine whether the repeal of the rate cap goes through or not. As witnessed recently during the revision of the budget allocations, it is clear that the Executive can decide the direction they want parliament to vote on a matter.
Universe of Coverage
Below is a summary of our SSA universe of coverage:
|
Banks |
Price as at 8/03/2019**** |
Price as at 15/03/2019**** |
w/w change |
YTD Change |
Target Price* |
Dividend Yield |
Upside/Downside** |
P/TBv Multiple |
|
Diamond Trust Bank |
140.0 |
139.0 |
(0.7%) |
(11.2%) |
283.7 |
1.9% |
106.0% |
0.8x |
|
GCB Bank |
3.8 |
4.0 |
5.0% |
(13.0%) |
7.7 |
9.5% |
102.5% |
0.9x |
|
Access Bank |
6.0 |
6.0 |
(0.8%) |
(12.5%) |
9.5 |
6.7% |
66.4% |
0.4x |
|
CRDB |
135.0 |
125.0 |
(7.4%) |
(16.7%) |
207.7 |
0.0% |
66.2% |
0.5x |
|
Zenith Bank |
25.0 |
22.2 |
(11.0%) |
(3.7%) |
33.3 |
12.2% |
62.3% |
1.1x |
|
I&M Holdings |
90.0 |
90.0 |
0.0% |
5.9% |
138.6 |
3.9% |
57.9% |
0.9x |
|
UBA Bank |
7.7 |
7.7 |
0.0% |
(0.6%) |
10.7 |
11.1% |
51.0% |
0.5x |
|
KCB Group*** |
44.0 |
44.3 |
0.7% |
18.3% |
61.3 |
7.9% |
46.3% |
1.4x |
|
Ecobank |
7.8 |
7.7 |
(0.1%) |
3.2% |
10.7 |
0.0% |
38.6% |
1.7x |
|
Co-operative Bank |
14.6 |
15.0 |
2.4% |
4.5% |
19.9 |
5.4% |
38.5% |
1.3x |
|
CAL Bank |
1.0 |
1.0 |
5.1% |
5.1% |
1.4 |
0.0% |
35.9% |
0.8x |
|
Equity Group |
41.0 |
43.0 |
4.9% |
23.4% |
56.2 |
4.7% |
35.3% |
2.0x |
|
NIC Group |
37.0 |
37.1 |
0.1% |
33.3% |
48.8 |
2.7% |
34.4% |
1.0x |
|
Stanbic Bank Uganda |
29.0 |
29.0 |
0.0% |
(6.5%) |
36.3 |
4.0% |
29.1% |
2.1x |
|
HF Group |
6.0 |
5.4 |
(9.3%) |
(1.8%) |
6.6 |
6.4% |
27.8% |
0.2x |
|
Bank of Kigali |
275.0 |
265.0 |
(3.6%) |
(11.7%) |
299.9 |
5.2% |
18.4% |
1.5x |
|
Union Bank Plc |
7.0 |
7.0 |
0.0% |
25.0% |
8.2 |
0.0% |
16.4% |
0.7x |
|
SBM Holdings |
6.1 |
6.0 |
(1.3%) |
0.7% |
6.6 |
5.0% |
14.3% |
0.9x |
|
Barclays Bank |
11.4 |
11.9 |
3.9% |
8.2% |
12.5 |
8.4% |
13.9% |
1.6x |
|
Guaranty Trust Bank |
37.3 |
35.4 |
(5.1%) |
2.8% |
37.1 |
6.8% |
11.6% |
2.3x |
|
Standard Chartered |
199.0 |
197.5 |
(0.8%) |
1.5% |
196.3 |
6.3% |
5.7% |
1.6x |
|
Bank of Baroda |
134.0 |
130.0 |
(3.0%) |
(7.1%) |
130.6 |
1.9% |
2.4% |
1.2x |
|
Stanbic Holdings |
93.0 |
100.0 |
7.5% |
10.2% |
92.6 |
5.9% |
(1.6%) |
0.9x |
|
National Bank |
5.7 |
5.0 |
(11.9%) |
(5.6%) |
4.9 |
0.0% |
(2.4%) |
0.4x |
|
Standard Chartered |
21.0 |
21.0 |
0.0% |
0.0% |
19.5 |
0.0% |
(7.3%) |
2.6x |
|
FBN Holdings |
8.1 |
8.2 |
1.2% |
3.1% |
6.6 |
3.0% |
(16.1%) |
0.4x |
|
Stanbic IBTC Holdings |
48.0 |
48.1 |
0.2% |
0.3% |
37.0 |
1.2% |
(21.8%) |
2.5x |
|
Ecobank Transnational |
14.0 |
13.5 |
(3.6%) |
(20.6%) |
9.3 |
0.0% |
(31.3%) |
0.5x |
*Target Price as per Cytonn Analyst estimates
**Upside / (Downside) is adjusted for Dividend Yield
***Banks in which Cytonn and/or its affiliates holds a stake.
****Stock prices indicated in respective country currencies
We are “Positive” on equities for investors as the sustained price declines have seen the market P/E decline to below its historical average. We expect increased market activity, and possibly increased inflows from foreign investors, as they take advantage of the attractive valuations, to support the positive performance.
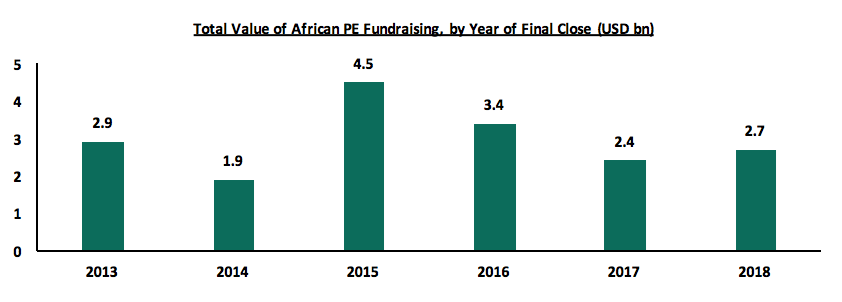
African Private Equity and Venture Capital Association (AVCA) released their 2018 Annual African Private Equity (PE) Data Tracker. The report highlights private equity activity in 2018 in terms of (i) fundraising, (ii) deal tally and value, and (iii) exits.
I. Fundraising
The total value of African PE fundraising increased by 12.5% to USD 2.7 bn in 2018 from USD 2.4bn in 2017 as highlighted in the chart below. This indicates a positive shift in investors’ confidence in Africa’s PE industry following declines in 2016 and 2017, after a peak in 2015, which saw a handful of large funds achieving final closes during the year.
II. Deal Tally and Value
The total value of deals reported decreased by 10.3% to USD 3.5 bn in 2018, from USD 3.9 bn in 2017, as highlighted in the chart below. The total number of deals rose significantly reaching 186 reported PE deals in 2018 from 171 deals reported in 2017. The report also ranked industries according to their contribution to total deal value between 2013 and 2018. The communications services accounted for the largest share of deal value at 27.0%, followed by the utilities sector, which recorded 21.0%. In terms of geography, West Africa accounted for 25.0% of the total value of PE deals recorded between 2013 and 2018. North Africa accounted for 13.0%, while Eastern Africa accounted for 8.0% of the total deal value.
We expect PE activity in Africa to expand driven by, (i) economic growth, (ii) political stability, and (iii) positive investor sentiment.

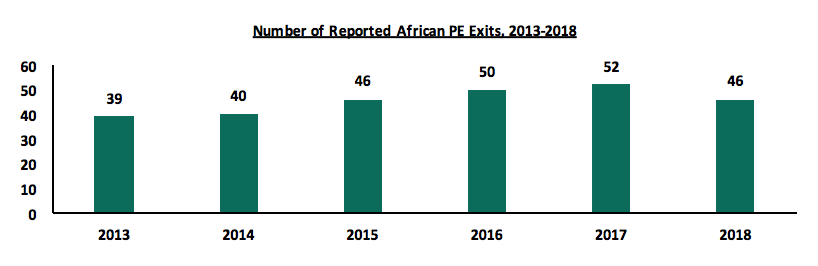
III. Exits
With 46 recorded exits, 2018 marked a drop in overall exit activity compared to the previous year’s high of 52. This was largely due to a fall in the number of exits recorded in South Africa (representing 20.0% of exit
volume in 2018, compared with 42.0% from 2013 to 2017), against a backdrop of heightened macroeconomic uncertainty in the country.
In terms of exit routes, the growing trend of exits to PE buyers (secondary sales), which emerged in 2016, persisted in 2018 accounting for 37.0% of exits reported compared to 35.0% in 2017. However, 2018 also saw a relative rebound in the share of exits to trade buyers to 39.0% from 25.0% the previous year. This led to trade buyers representing the largest volume of exit routes in 2018, followed by PE and other financial buyers at 37%. IPOs and capital market exit continued to represent the lowest share of recorded exits at 2.0%.
We expect increased exit activity driven by development and diversification of exit routes. Initial Public Offering (IPO) exits still remain a concern and we expect this trend of PE firms exiting by way of IPOs to remain considerably low given the tedious procedures involved in a company going the IPO way. A shift in this trend is only achievable if there is an improvement in the local capital markets by putting in place measures that will: (i) make the process of companies going public by means of an IPO easier, (ii) encourage disclosures for non-listed companies in order to improve transparency and accessibility of information, which boosts investor confidence, making it easier for firms to raise capital during IPOs, and (iii) encourage foreign participation through improved regulation, good economic fundamentals and empowering private initiatives.
In Kenya, the Nairobi Securities Exchange has introduced Ibuka Program, an incubation and acceleration platform that will help address the listing drought at the bourse and we expect that will open up more private equity exit channels.
IV. Regional Outlook
The report highlighted the key private equity markets in Africa namely;
- South Africa, which accounted for 70.0% of the total value of PE deals in Southern Africa between 2013 and 2018, is expected to play a key role in the growth of African private equity driven by an improving economic environment,
- Nigeria accounted for 73.0% of the total value of PE deals in West Africa between 2013 and 2018. Efforts that were made by the government to enhance the country’s credibility contributed to the significant growth in Foreign Direct Investment, which accounted for 18.6% (USD 530.6 mn) of total capital imported in Q3’2018 according to data from Nigerian Bureau of Statistics (NBS). Overall, the outlook for 2019 remains positive as further growth is projected for the region, and,
- Kenya accounted for 59.0% of the total value of PE deals in East Africa between 2013 and 2018. Its liberalized, diversified and advanced economy, supported by a fast-growing middle class and strong demand for high-value goods and services has made it an attractive investment hub for global investors.
We maintain a positive outlook on private equity investments in Africa as evidenced by the increasing investor interest, which is attributed to; (i) economic growth, which is projected to improve in Africa’s most developed PE markets, (ii) attractive valuations in Sub Saharan Africa’s private markets compared to its public markets, and (iii) attractive valuations in Sub Saharan Africa’s markets compared to global markets. Going forward, the increasing investor interest, stable macro-economic and political environment will continue to boost deal flow into African markets.
- Industry Reports
During the week, Kenya National Bureau of Statistics (KNBS) released its December 2018 issue of Leading Economic Indicators (LEI), highlighting an overall drop in construction activities in 2018, and growth in the tourism sector. According to the report:
- The value of building plan approvals by the Nairobi City County declined by 12.9% to Kshs 210.3 bn in 2018, from Kshs 240.7 bn in 2017, indicating a slow-down in developer activity during the year. We attribute this mainly to;
- The credit crunch since the implementation of the Banking Amendment Act (2016) that has led to a reduction in private sector credit to 3.3% in 2018, compared to a 5-year (2013-2018) average of 11.8%, as banks prefer to lend to lower risk entities such as the government,
- A reduction in effective demand amid the growing supply in the commercial sector and in the upper-end residential market, that has led to a surplus of 2.0 mn and 5.3 mn square feet of space in the retail and commercial office sectors, respectively, and 3.0% points decline in average occupancy rates in the residential sector to 81.0% in 2018, from 84.0% in 2017, according to Cytonn Research. Developers are therefore holding back on new projects as they await to sell out the existing stock, and,
- Uncertainty over building approvals following demolitions of allegedly legally approved buildings in 2018.
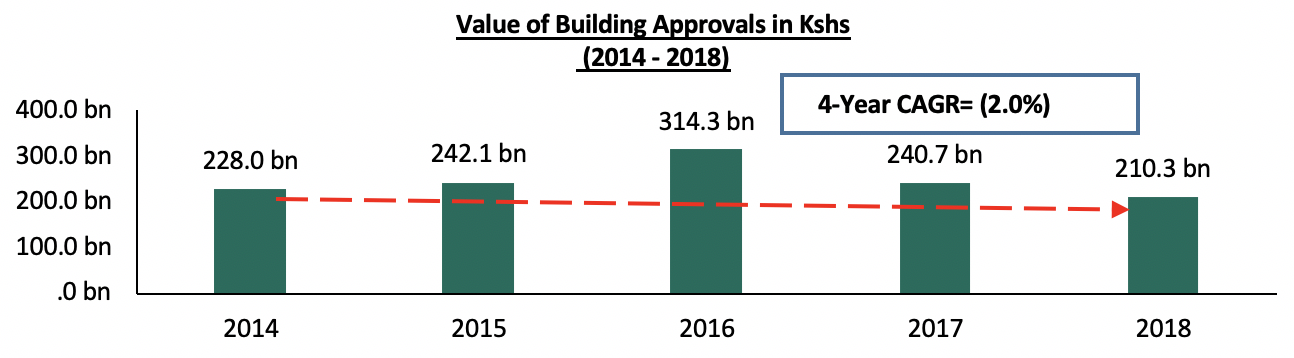
Source: Kenya Bureau of Statistics (KNBS)
- The quantity of cement consumed recorded a 5.0% decline to 5.5 mn metric tonnes in 2018, from 5.8mn metric tonnes in 2017, while production decreased by 8.5% to 5.6 mn metric tonnes from 6.2 mn metric tonnes in 2018 and 2017, respectively. The reduction in consumption and production of cement illustrates reduced activities in the construction sector during the year. In addition to the decrease in real estate development activities highlighted above, this can also be attributed to lower infrastructural development such as the slowdown of the Standard Gauge Railway Phase 2A.
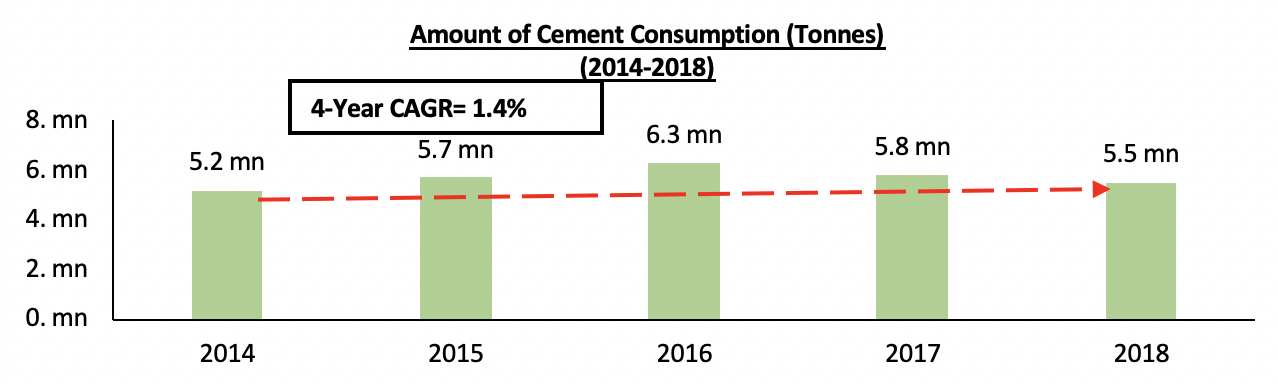
Source: Kenya Bureau of Statistics (KNBS)
- In the tourism sector, the number of tourist arrivals at the Jomo Kenyatta International Airport (JKIA) and the Moi International Airport increased by 13.0% from 858,432 for the period between January and November 2017 to 969,854 during the same period in 2018. We attribute this to the improved security and political stability, which have continued to boost tourists’ confidence in the country and thus making it a preferred travel destination for both business and holiday travelers.
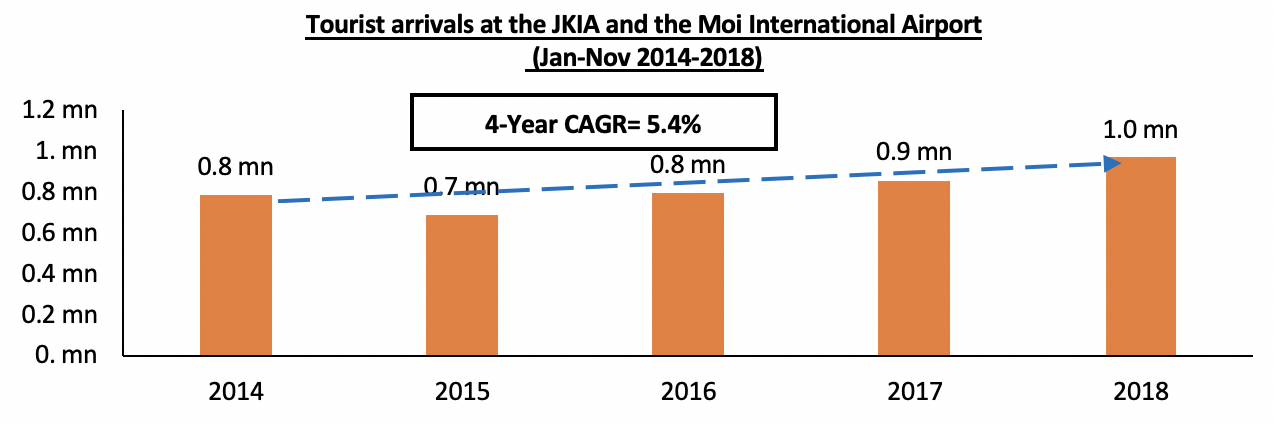
*The numbers are for the period between January and November every year
Source: Kenya National Bureau of Statistics (KNBS)’
Supported by the above statistics, we retain a Neutral outlook for the real estate sector, as we expect the surplus supply in the retail, commercial office, and high-end residential sectors to result in decreased activities in the respective sectors. However, we have a positive outlook for the hospitality sector and mid-end and low-end residential sector, as we expect improved performance boosted by the demand for hospitality services and the continued focus on the provision of affordable housing, respectively.
- Residential Sector
During the week, Erdemann Property Limited, a Kenyan-based real estate developer, broke ground on a Kshs 7.0 bn affordable housing project, dubbed The River Estate in Ngara, Nairobi set to deliver approximately 2,720 units. The project, which will be jointly financed jointly the National Government and the Nairobi County Government, will be done in 2 phases, with Phase 1 set for completion in December 2020 and Phase 2 in December 2021. It will comprise of 1-bedroom, 2-bedroom Type A and 2-bedroom Type B residential units selling at an introductory cash price of Kshs 2.9 mn, Kshs 3.9 mn and Kshs 3.5 mn, respectively. Some of the unique features in the development will include cabro paved roads, 2 basement parking spaces, 3 elevators per tower and commercial units, among others. The project is part of the national government’s pledged affordable housing projects under the Big Four Agenda, with other planned projects in areas such as Mavoko, Makongeni and Shauri Moyo in Nairobi. These efforts have been in a bid to meet the existing housing deficit in Kenya of approximately 2.0 mn houses according to the National Housing Corporation. Some of the initiatives and incentives introduced by the government to drive the agenda include:
- Introduction of partnerships with private developers by availing public land for development,
- Waiving of building approval fees for all affordable housing projects in Nairobi City County,
- Setting up of the Kenya Mortgage Refinancing Company (KMRC) to enable longer-term mortgages at affordable rates,
- Setting up the National Housing Development Fund (NHDF) aimed at enabling potential home-buyers to save towards home-ownership and consequently offer offtake for housing developments, and
- Introduction of the 15.0% corporate tax on the resulting profits, instead of the normal 30.0% for developers who put up at least 100 low-cost housing units.
We expect these measures to enhance the development of affordable housing units in the country by both the private and public sectors. However, we are of the view that, in order to facilitate the achievement of the agenda, other issues that need to be addressed to include; i) the current high cost of construction, ii) infrastructural development especially in satellite towns, iii) private sector funding which could be facilitated by the deepening of capital markets, and iv) legislative reviews such as the amendment of laws to allow people to use their pension to guarantee house purchases.
- Land Sector
This week, the Ministry of Lands announced that the Lands Information Management System (LIMS) is expected to go live on 1st April 2019. The system is expected to shorten the lands registration process by 61-days, to 12-days, from 73-days required by the manual system. Currently, property registration consists of nine processes namely, title search, land rent clearance, land rate clearance, requisition of file valuation, site visits and reporting, registration of title, payment of stamp duty and endorsement and assessment of the deal. With the Lands Information Management System (LIMS), three of those processes, that is, land rent clearance, land rate clearance and requisition of file valuation will be completely moved online, five of them which include title search, consent to transfer, title registration, payment of stamp duty, and assessment and endorsement of the deal will be partially digitized, while the rest will be retained as manual processes. The Lands Ministry had announced the plans to digitize the processes on the Lands Information Management System in early 2018 in order to speed up the registration processes. We expect the digitization of the processes to enhance time saving, cost reduction and transparency in the registration of land and thus encourage property development.
- Infrastructure
China Road and Bridge Corporation (CRBC), a Chinese engineering and construction firm, is set to secure a Kshs 2.5 bn contract to refurbish the Nairobi commuter railway network. According to the Ministry of Transport, Cabinet Secretary, Hon James Macharia, the firm should not be subjected to competitive bidding as it already has the required technical capacity and pre- requisite railway experience. Other projects undertaken by the firm in Kenya include; the completed Mombasa- Nairobi Standard Gauge Railway (Phase 1) and the ongoing Phase 2A from Nairobi to Naivasha. The Nairobi commuter railway track is part of the Kshs 10 bn fund set aside to ease traffic congestion in Nairobi, and is aimed at facilitating the operation of 11 second hand locomotives, 20 halts, the refurbishment of mini stations in the city such as the Kitengela Railway Station, upgrading of the Ruiru, Kikuyu, Syokimau and Embakasi lines and the Nairobi Central Station. On completion, we expect the railway network to improve ease of access to satellite towns such as Kitengela, Ruiru, Kikuyu, Embakasi, and Syokimau, thus result in increased economic activities, and demand for property. Currently, the average price of land in satellite towns stands at Kshs 23.0 mn and has been growing with a 7- year CAGR of 14.1% from an average of Kshs 9.0 mn in 2011 boosted by improving infrastructure and the growing demand for development class land. We thus expect the refurbishment of the railway network to result in an increase in the land value in the areas it will serve.
We expect the real estate sector to continue recording increase activities driven by; i) the improving infrastructure, digitalization of the land registration process and the continued focus on the provision of affordable housing by both the private sector players and the government.
In June 2018, we published a Research Note on Ruaka suburb, where Cytonn has two residential developments, The Alma and Taraji Heights. According to the June 2018 note, the area recorded average returns of 11.1% p.a, with the rental yield and capital appreciation coming in at 5.3% and 5.8%, respectively. This week, we look into why the area is still a great investment opportunity, by updating and analyzing our research data as at December 2018 that shows Ruaka’s residential market performance in terms of uptake, rental yield, capital appreciation and return to investors in the real estate sector. The performance in 2018 came in at 12.5% p.a, 1.4% points higher than 11.1% annual total returns in June the same year, mainly due to a 7.3% annual increase in property prices fueled by land price growth and the increased demand for housing in the area by the growing middle-class population.
In this week’s topical, we shall cover the following:
- Overview of Ruaka
- The Factors Driving the Growth in Ruaka
- Ruaka Residential Market Performance
- Ruaka Compared to Nairobi Metropolitan Area Residential Market
- Conclusion and Recommendation
- Overview of Ruaka
Ruaka is a suburb within Kiambu County, located approximately 10-km from Nairobi Central Business District (CBD) to the North West. The area is accessible via Limuru Road and the Northern Bypass. On completion, the proposed Western Bypass will also link Ruaka to the Nairobi - Nakuru Highway at Gitaru. Approximately 7-years ago, Ruaka was primarily an agricultural area, however, this has been phased out by the development of both residential and commercial properties.
- The Factors Driving Growth in Ruaka
Real estate in the area has grown over the years, driven by:
- Good Transport Network: The area is accessible through main roads such as Limuru Road and the Northern Bypass, which links it to Kiambu Road. The area will also be served by the proposed Western Bypass, which on completion will link Ruaka to the Nairobi-Nakuru Highway at Gitaru. These roads connect Ruaka to and from several neighboring areas such as Westlands, Kiambu Town, Runda, Limuru, and Waiyaki Way, thus making the area easily accessible;
- Presence of International Organizations: The presence of international organizations such as the United Nations (UN), United Nation Environmental Program (UNEP) in Gigiri, and International Organization for Migration (IOM) - Migration Health Assessment Centre, has attracted foreigners who not only boost the appeal of the town, but also create a market for residential and commercial real estate;
- Relaxation of Zoning Restrictions: Ruaka town has seen an increase in high density developments that have resulted in an increase in the value of real estate property. Land prices in Ruaka have grown at a 7- year CAGR of 12.2% from Kshs 40.0 mn per acre as at 2011 to Kshs 89.7 mn per acre as at 2018;
- Security: Improvement in security in the area, with county measures on security and a general increase in security personnel in the country;
- Hotels, Malls, and Recreational Facilities: Large commercial mixed-use developments such as Two Rivers, Riviera Mall and the Village Market surround Ruaka. This is in addition to hotels such as Tribe at the Village Market and Trademark Hotel along Limuru Road. The large retail and commercial footprint create an opportunity for employment, thus favoring property development to house this increase in personnel.
Despite the above factors, the main challenge facing the Ruaka market is slow infrastructural development in comparison to the rate of housing development in the area, leading to challenges such as frequent traffic snarl-ups within the town. There is, therefore, need for better planning and infrastructural development including road expansion and installation of a sewer system to accommodate the growing population.
- Ruaka Residential Market Performance
The relatively high rate of urbanization at 4.3%, compared to a global average of 2.0%, and the expansion of the middle-class in Kenya has led to increased demand for housing in satellite towns and areas within the Nairobi Metropolitan Area, such as Ruaka and Ruiru, leading to an increase in land and property prices in these areas. Land in Ruaka is currently priced at approximately Kshs 89.7 mn per acre, and this is relatively high compared to other satellite towns such as Ngong, Utawala, and Ruiru, whose prices per acre are Kshs 13.8 mn, Kshs 12.8 mn and Kshs 20.6 mn, respectively, according to Cytonn Research. In December 2018, we conducted research in order to update on the residential market performance in Ruaka, where we focused on the following;
- Unit Sizes of Apartments: This is to be used to establish what the market is offering and also determine the home buyers’ preferences for sizes of houses;
- Selling Prices of Apartments: This will give an overview of the average exit prices of apartments in the area;
- Rental Rates of Apartments: This informs on the average rental prices, and yields for investment analysis;
- Uptake: This gives an indication of the rate at which apartments have been bought hence indicating the attractiveness of residential property in the area.
Below is the summarized performance:
- Annual Uptake: Ruaka recorded a relatively higher average annual uptake of 24.0% in 2018, compared to the residential market average of 22.8%. This means that developers in the market are able to recoup their investments within a short period of time, through the sale of units,
- Occupancy: In terms of occupancy, Ruaka market recorded an average rate of 97.1%, compared to the residential market average of 81.0%, indicating higher demand for housing units in Ruaka market,
- Rental Yield: Ruaka market’s rental yield came in at 5.2%, 0.5% points higher than the residential market’s average of 4.7%. This thus means that investors in the Ruaka market are able to fetch higher than market average rents and occupancy rates,
- Price Appreciation: Ruaka market recorded a 7.3% y/y price appreciation, compared to the residential market average of 4.2% y/y, indicating higher growth of the demand for property in Ruaka,
- Total Returns: On average, the total returns for Ruaka came in at 12.5% in 2018, 3.6% points higher than the 8.9% recorded by the residential market on overall, indicating that investors in Ruaka are able to achieve significantly higher returns.
|
Residential Market Performance Summary |
|||
|
Metric |
Residential Market Average |
Ruaka Market Average |
% Points Difference |
|
Annual Uptake |
22.8% |
24.0% |
1.2% |
|
Occupancy |
81.0% |
97.1% |
16.1% |
|
Rental Yield |
4.7% |
5.2% |
0.5% |
|
Price Appreciation |
4.2% |
7.3% |
3.1% |
|
Total Returns |
8.9% |
12.5% |
3.6% |
|
· The total returns for Ruaka came in at 12.5% in 2018, 3.6% points higher than the 8.9% recorded by the residential market on overall, indicating that investors in Ruaka are able to achieve significantly higher returns |
|||
Source: Cytonn Research
The table below shows the summarized performance for each unit typology;
|
(All values in Kshs unless stated otherwise) |
||||||||||||
|
Summary of the Ruaka Residential Market Performance |
||||||||||||
|
Typology |
Unit Plinth Area (SQM) |
Price 2016 |
Price 2017 |
Price Dec 2018 |
Rent Dec 2018 |
Price per SQM’18 |
Rent per SQM ‘18 |
Annual Uptake |
Occupancy ‘18 |
Rental Yield’18 |
y/y price appreciation |
Total Returns Dec 18 |
|
1-bed |
55 |
5.2m |
5.8m |
6.2m |
30,000 |
113,077 |
505 |
25.0% |
100.0% |
4.5% |
10.7% |
15.2% |
|
2-bed |
87 |
8.4m |
8.7m |
8.9m |
39,429 |
99,531 |
438 |
22.7% |
95.8% |
5.3% |
6.7% |
12.0% |
|
3-bed |
122 |
10.6m |
11.2m |
11.5m |
50,200 |
88,832 |
431 |
23.7% |
95.5% |
5.7% |
4.5% |
10.2% |
|
Average |
100,480 |
458 |
24.0% |
97.1% |
5.2% |
7.3% |
12.5% |
|||||
|
· Ruaka Residential market recorded average total returns of 12.5% in 2018 |
||||||||||||
Source: Cytonn Research 2018
- 3-bedroom units recorded the highest average rental yield of 5.7%, while 1 and 2-bedroom units recorded rental yields of 4.5% and 5.3%, respectively;
- On price appreciation, 1-bedroom units recorded the highest at 10.7%, compared to 2 and 3-bedroom units at 6.7% and 4.5%, respectively;
- The 1-bedroom units had the highest price per square metre at Kshs 113,077, compared to 2 and 3-bedroom prices per sqm at Kshs 99,531 and Kshs 88,832, respectively;
- Overall, 1 and 2-bedroom apartments have the highest total returns at 15.2% and 12.0%, respectively, and we attribute this to higher demand for the 1 and 2-bedroom units boosted by the increased preference of units by single adults and young couples thus the high demand for the same. 3-bedroom units also tend to perform well in gated communities and high-density developments as they attract family units.
- Ruaka Compared to Nairobi Metropolitan Area Residential Market
Ruaka market recorded improved performance in December 2018 compared to June 2018, with average total returns coming in at 12.5% in December 2018, 1.4% points higher than 11.1% in June the same year. We attribute this to the increased demand for housing in the area mainly by the growing middle-class population. In addition, Ruaka was ranked as one of best low mid-end satellite towns to invest in, according to our Cytonn 2018 Market Review Report, among areas such as Donholm and Thindigua, which were ranked top with 14.4% and 13.8% total returns, respectively.
Below is a summary of the performance of the low mid- end areas:
|
(All Values in Kshs Unless Stated Otherwise) |
|||||||
|
Top 5: Lower Mid-End Areas |
|||||||
|
Location |
Average Price per SQM |
Average Rent per SQM |
Average Annual Uptake |
Average Occupancy |
Average Rental Yield |
Average Price Appreciation |
Average Total Returns |
|
Donholm & Komarock |
81,015.5 |
402.1 |
25.0% |
100.0% |
6.0% |
8.4% |
14.4% |
|
Thindigua |
97,510.2 |
502.5 |
24.6% |
81.9% |
4.1% |
9.6% |
13.8% |
|
Ruaka |
100,480.1 |
458.0 |
23.8% |
97.1% |
5.2% |
7.3% |
12.5% |
|
Athi River |
68,490.1 |
359.3 |
23.6% |
73.1% |
4.4% |
6.2% |
10.6% |
|
Rongai |
59,695.5 |
345.2 |
20.3% |
83.30% |
5.5% |
3.6% |
9.1% |
|
Average |
81,438 |
413 |
23.5% |
87.1% |
5.0% |
7.0% |
12.0% |
|
· Donholm-Komarock posted the highest total returns owing to a relatively high rate of price appreciation driven by high demand from investors. The area offers relatively affordable rental rates while being in close proximity to the CBD and other nodes such as Mombasa Road and Thika Road, thus high occupancy rates |
|||||||
Source: Cytonn Research
The lower mid-end segment registered higher average total returns of 12.0% in comparison to the upper mid-end segment with 10.9%. This is as the areas are preferable to majority of Nairobi’s population consisting of young families and the working-class due to their affordability and infrastructural improvements that have rendered them increasingly convenient, hence the growing uptake. Donholm and Ruaka had the highest occupancy rates at 100.0% and 97.0%, respectively, indicating high levels of demand.
In addition, Ruaka market also recorded higher returns than the top areas in the upper mid- end market such as Riverside, Kilimani, and Westlands, which recorded returns of 11.6%, 11.5%, and 10.3%, respectively.
Below is the summary of the upper mid- end market performance:
|
(All Values in Kshs Unless Stated Otherwise) |
|||||||
|
Top 5: Upper Mid-End Areas |
|||||||
|
Row Labels |
Average Price per SQM |
Average Rent per SQM |
Average of Annual Uptake |
Average Occupancy |
Average Rental Yield |
Average Price Appreciation |
Average Total Returns |
|
Riverside |
175,085.2 |
763.8 |
24.7% |
88.9% |
4.4% |
7.1% |
11.6% |
|
Kilimani |
127,423.8 |
721.8 |
29.7% |
90.3% |
5.7% |
5.7% |
11.5% |
|
Westlands |
135,041.3 |
757.5 |
27.9% |
87.5% |
5.7% |
4.7% |
10.3% |
|
Loresho |
115,289.5 |
573.5 |
24.0% |
90.4% |
5.4% |
4.8% |
10.3% |
|
Spring Valley |
147,453.1 |
552.9 |
22.5% |
63.6% |
3.4% |
6.5% |
9.9% |
|
Average |
138,209.9 |
704.2 |
26.6% |
89.3% |
5.3% |
5.6% |
10.9% |
|
Ruaka Market |
100,480.1 |
458.0 |
23.8% |
97.1% |
5.2% |
7.3% |
12.5% |
|
· Riverside registered the highest price appreciation with 7.1% in comparison to the market average of 5.6%, while Westlands and Kilimani registered the highest average rental yields as they attract premium rents while offering relatively affordable prices |
|||||||
Source: Cytonn Research
Key to note, Ruaka market returns also outperformed other asset classes such as government bills with the 364-day, 182-day, and 91-day T-bills recording yields of 10.0%, 9.0%, and 7.3% respectively, while in the equities market, NASI recorded a 18.0% decline in 2018.
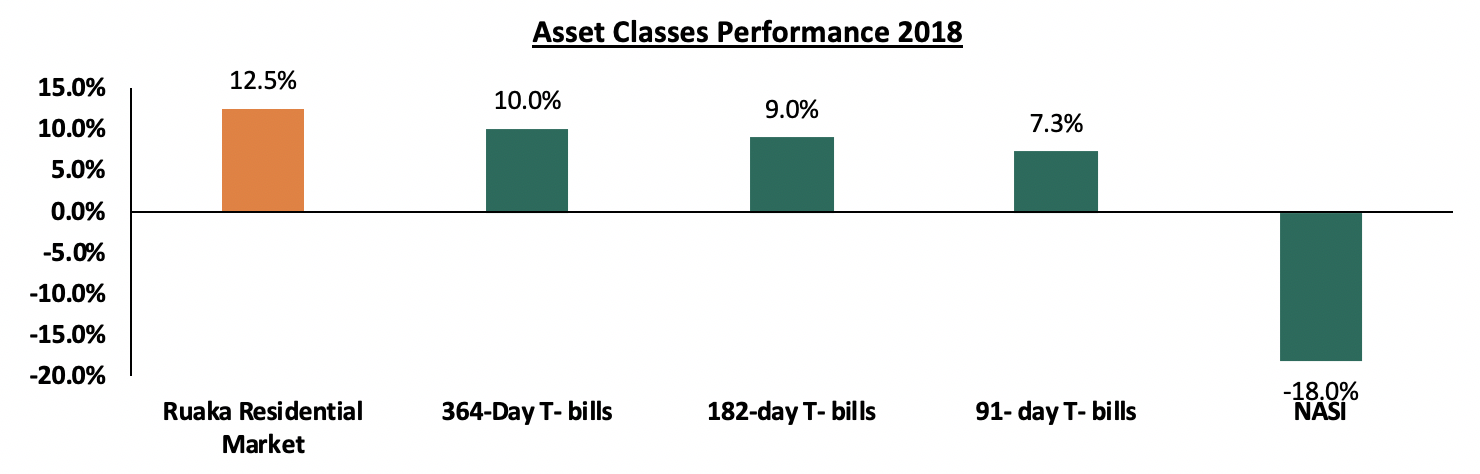
Source: Cytonn Research 2018
- Conclusion & Recommendation
Ruaka remains an attractive investment area, evidenced by the residential apartments’ total returns of on average 12.5%, compared to the average residential market returns of 8.9%. Some of the drivers of real estate in this area include; i) the growing demand for land and housing in satellite towns, ii) the construction of the Western Bypass, which will enhance access in the area, and iii) the availability of social amenities and the growing state of investment grade developments in Ruaka. Therefore, we expect continued increase in property prices in the area, and this should accelerate with the upcoming Western Bypass, thus the market still presents a good investment opportunity. For details on our projects at Ruaka, see the links for Taraji Heights and The Alma.
Disclaimer: The views expressed in this publication are those of the writers where particulars are not warranted. This publication, which is in compliance with Section 2 of the Capital Markets Authority Act Cap 485A, is meant for general information only and is not a warranty, representation, advice or solicitation of any nature. Readers are advised in all circumstances to seek the advice of a registered investment advisor.

- Talk to us
- Kenya
- P.O Box 20695 - 00200, Nairobi, Kenya
- Cell +254709101200
- Tel +254709101200
- WhatsApp +254741676635
- United States
- +254709101200
- DOWNLOAD OUR APP
-


- Kenya
- 8th Floor, Pinetree Plaza, Kaburu Drive, Ngong Road, Nairobi, Kenya
- USA
- Suite 1150, 1775 Eye Street NW, USA, Washington DC 20006, USA
- Investments
- High Yield
- Private Equity
- Real Estate
- Real Estate
- RiverRun Estates
- Cytonn Towers
- The Ridge
- Taraji Heights
- The Alma