Student Housing in the Nairobi Metropolitan Area, & Cytonn Weekly #08/2022
By Cytonn Research, Feb 27, 2022
Executive Summary
Fixed Income
During the week, T-bills were undersubscribed, with the overall subscription rate coming in at 63.6%, down from the 111.5% recorded the previous week. The undersubscription is partly attributable to the concurrent Kenya Mortgage Refinance Mortgage Company (KMRC) bond issue which recorded a subscription rate of 478.6% as investors preferred the higher yield of 12.5% on offer. The 364-day paper recorded the highest subscription rate, receiving bids worth Kshs 9.2 bn against the offered Kshs 10.0 bn, translating to a subscription rate of 92.2%, a decline from the 151.3% recorded the previous week. The subscription rate for the 182-day paper declined to 40.3%, from 101.5% recorded the previous week, while that of the 91-day paper increased to 50.3%, from 37.2% recorded the previous week. The yields on the government papers recorded mixed performance, with the yields on the 364-day and the 91-day papers increasing by 4.0 bps and 0.4 bps to 9.8% and 7.3%, respectively, while that of the 182-day paper declined by 1.3 bps to 8.1%. The government accepted bids worth Kshs 12.7 bn, out of the Kshs 15.3 bn worth of bids received, translating to an acceptance rate of 83.1%;
In the Primary Bond Market, the government reopened three bonds, FXD1/2021/05, FXD1/2020/15 and FXD1/2021/25, with tenors to maturity of 4.7 years, 12.9 years, and 24.2 years, respectively, in a bid to raise Kshs 50.0 bn for budgetary support. The period of sale for the issue runs from 24th February 2022 to 8th March 2022;
We are projecting the y/y inflation rate for February 2022 to fall within the range of 5.3% - 5.7%, compared to the 5.4% recorded in January 2022, mainly driven by increasing food prices resulting from increased costs of production;
Equities
During the week, the equities market was on a downward trajectory, with NASI, NSE 20 and NSE 25 declining by 4.2%, 1.7% and 3.2% respectively, taking their YTD performance to losses of 4.2%, 1.6% and 3.2% for NASI, NSE 20 and NSE 25, respectively. The equities market performance was driven by losses recorded by large cap stocks such as Safaricom of 6.1%, with NCBA and Diamond Trust Bank (DTB-K) both recording losses of 3.4%. The losses were however mitigated by gains recorded by stocks such as BAT of 1.4%;
Real Estate
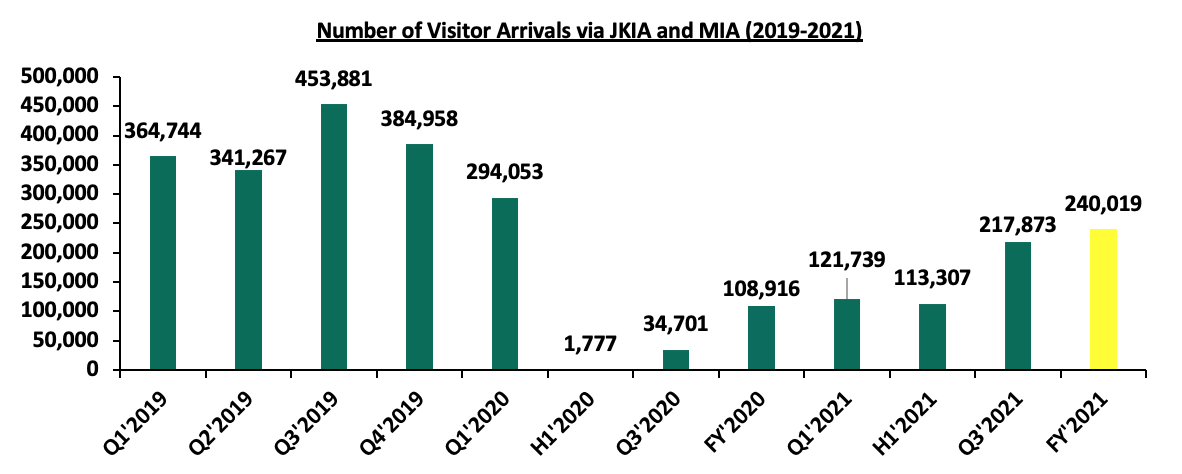
During the week, the Kenya National Bureau of Statistics (KNBS) released the December 2021 Leading Economic Indicators (LEI) report highlighting that the overall number of arrivals through Jomo Kenyatta International Airport (JKIA) and Moi International Airport (MIA) increased by 54.6% to 240,019 visitors in Q4’2021, from 108,916 visitors during the same period in 2020, whereas the value of building plan approvals increased by 14,166.7% to Kshs 41.5 bn in Q4’2021, from the Kshs 0.3 bn realized in the similar period in 2020;
In the Residential sector, the Nairobi Metropolitan Services (NMS) began the redevelopment of 10 estates in Nairobi County, with an aim of constructing 60,000 affordable housing units. Additionally, the Capital Markets Authority (CMA) announced that the first tranche of the Kshs 10.5 bn Kenya Mortgage Refinance Company’s (KMRC) Medium Term Note (MTN) program recorded an oversubscription of 478.6%. In the retail sector, Naivas Supermarket, a local retail chain opened a new outlet at the new Imaara Mall along Mombasa road. In the listed Real Estate, ILAM Fahari I-Reit closed the week trading at an average price of Kshs 6.2 per share, whereas Acorn DREIT closed the week trading at Kshs 20.2 and the I-REIT at Kshs 20.6 per unit;
Focus of the Week
The concept of student housing as a Real Estate asset class has continued to gain traction globally, and in Kenya, its niche in the market is evidenced by the increased investor appetite which has supported launch of numerous student housing developments, especially in areas surrounding institutions of higher learning, with Acorn Group as the leading brand in the sector. This week we updated our research on the student housing market in the Nairobi Metropolitan Area by evaluating market performance of student hostels in 10 areas.
Investment Updates:
- Weekly Rates:
- Cytonn Money Market Fund closed the week at a yield of 10.41%. To invest, dial *809#;
- Cytonn High Yield Fund closed the week at a yield of 13.91% p.a. To invest, email us at sales@cytonn.com and to withdraw the interest, dial *809#;
- Justin Mwangi, an Investments Analyst, was on Metropol TV to discuss Kenya’s economic review. Watch Justin here;
- We continue to offer Wealth Management Training every Wednesday and every third Saturday of the month, from 9:00 am to 11:00 am, through our Cytonn Foundation. The training aims to grow financial literacy among the general public. To register for any of our Wealth Management Trainings, click here;
- If interested in our Private Wealth Management Training for your employees or investment group, please get in touch with us through wmt@cytonn.com;
- Any CHYS and CPN investors still looking to convert are welcome to consider one of the five projects currently available for conversion, click here for the latest conversion term sheet;
- Cytonn Insurance Agency acts as an intermediary for those looking to secure their assets and loved ones’ future through insurance namely; Motor, Medical, Life, Property, WIBA, Credit and Fire and Burglary insurance covers. For assistance, get in touch with us through insuranceagency@cytonn.com;
- Cytonnaire Savings and Credit Co-operative Society Limited (SACCO) provides a savings and investments avenue to help you in your financial planning journey. To enjoy competitive investment returns, kindly get in touch with us through clientservices@cytonn.com;
Real Estate Updates:
- For an exclusive tour of Cytonn’s real estate developments, visit: Sharp Investor's Tour, and for more information, email us at sales@cytonn.com;
- Phase 3 of The Alma is now ready for occupation. To rent please email properties@cytonn.com;
- We have 8 investment-ready projects, offering attractive development and buyer targeted returns; See further details here: Summary of Investment-ready Projects;
- For recent news about the group, see our news section here;
Hospitality Updates:
- We currently have promotions for Staycations. Visit cysuites.com/offers for details or email us at sales@cysuites.com;
Money Markets, T-Bills Primary Auction:
During the week, T-bills were undersubscribed, with the overall subscription rate coming in at 63.6%, down from the 111.5% recorded the previous week. The undersubscription is partly attributable to the concurrent Kenya Mortgage Refinance Mortgage Company (KMRC) bond issue which recorded a subscription rate of 478.6% as investors preferred the higher yield of 12.5% on offer. The 364-day paper recorded the highest subscription rate, receiving bids worth Kshs 9.2 bn against the offered Kshs 10.0 bn, translating to a subscription rate of 92.2%, a decline from the 151.3% recorded the previous week. The subscription rate for the 182-day paper declined to 40.3%, from 101.5% recorded the previous week, while that of the 91-day paper increased to 50.3%, from 37.2% recorded last week. The yields on the government papers recorded mixed performance, with the yields on the 364-day and the 91-day papers increasing by 4.0 bps and 0.4 bps to 9.8% and 7.3%, respectively, while that of the 182-day paper declined by 1.3 bps to 8.1%. The government accepted bids worth Kshs 12.7 bn, out of the Kshs 15.3 bn worth of bids received, translating to an acceptance rate of 83.1%.
In the Primary Bond Market, the government reopened three bonds, FXD1/2021/05, FXD1/2020/15 and FXD1/2021/25, with tenors to maturity of 4.7 years, 12.9 years, and 24.2 years, respectively, in a bid to raise Kshs 50.0 bn for budgetary support. The period of sale for the issue runs from 24th February 2022 to 8th March 2022. The coupon rates are 11.3%, 12.8% and 13.9% for FXD1/2021/05, FXD1/2020/15 and FXD1/2021/25, respectively. We expect investors to prefer the longer dated paper, FXD1/2021/25, in search of higher yields. The bonds are currently trading in the secondary market at yields of 11.6%, 13.0% and 13.7%, for FXD1/2021/05, FXD1/2020/15 and FXD1/2021/25, respectively, and as such, our recommended bidding range for the three bonds is: 11.4%-11.8% for FXD1/2021/05, 12.8%-13.2% for FXD1/2020/15 and 13.5%-13.9% for FXD1/2021/25 within which range bonds of a similar tenor are trading at.
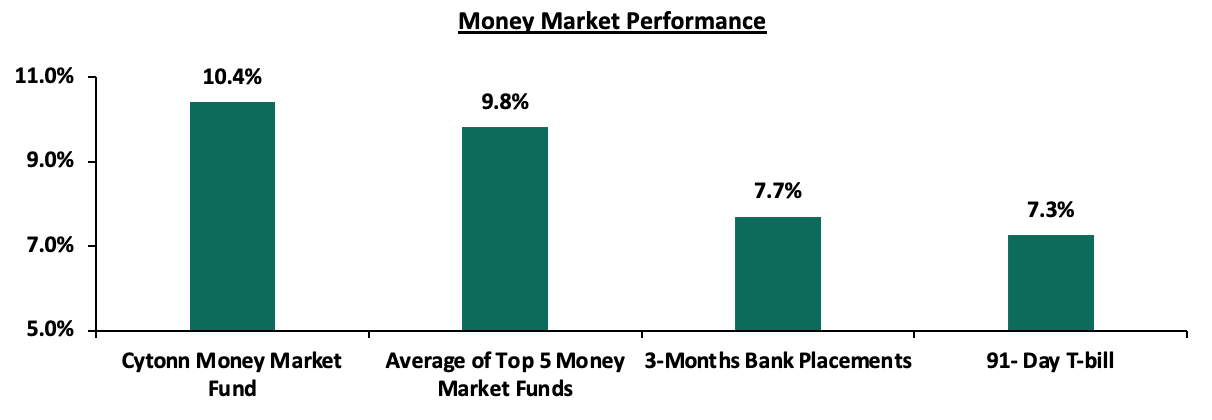
In the money markets, 3-month bank placements ended the week at 7.7% (based on what we have been offered by various banks), while the yield on the 91-day T-bill increased by 0.4 bps to 7.3%. The average yield of the Top 5 Money Market Funds increased marginally by 0.1% points to 9.8%, from 9.7% recorded the previous week. The yield of the Cytonn Money Market Fund declined marginally by 0.1% points to 10.4%, from 10.5% recorded the previous week.
The table below shows the Money Market Fund Yields for Kenyan Fund Managers as published on 25th February 2022:
|
Money Market Fund Yield for Fund Managers as published on 25th February 2022 |
||
|
Rank |
Fund Manager |
Effective Annual Rate |
|
1 |
Cytonn Money Market Fund |
10.4% |
|
2 |
Zimele Money Market Fund |
9.9% |
|
3 |
Nabo Africa Money Market Fund |
9.7% |
|
4 |
Sanlam Money Market Fund |
9.6% |
|
5 |
Madison Money Market Fund |
9.5% |
|
6 |
Apollo Money Market Fund |
9.4% |
|
7 |
GenCapHela Imara Money Market Fund |
9.0% |
|
8 |
CIC Money Market Fund |
8.9% |
|
9 |
Dry Associates Money Market Fund |
8.9% |
|
10 |
Orient Kasha Money Market Fund |
8.6% |
|
11 |
Co-op Money Market Fund |
8.6% |
|
12 |
ICEA Lion Money Market Fund |
8.4% |
|
13 |
NCBA Money Market Fund |
8.4% |
|
14 |
British-American Money Market Fund |
8.3% |
|
15 |
AA Kenya Shillings Fund |
7.7% |
|
16 |
Old Mutual Money Market Fund |
7.3% |
Source: Business Daily
Liquidity:
During the week, liquidity in the money markets tightened, with the average interbank rate increasing to 5.5% from 4.5%, recorded the previous week, partly attributable to settlement of government securities coupled with tax remittances which offset government payments. The average interbank volumes traded decreased by 57.2% to Kshs 5.0 bn, from Kshs 11.8 bn recorded the previous week.
Kenya Eurobonds:
During the week, the yields on Eurobonds were on an upward trajectory attributable to increased sell offs by foreign investors. The yields on the 10-year bond issued in 2014 increased by 0.7% points to 5.0%, while the yields on the 10-year and 30-year bonds issued in 2018 increased by 1.0% and 0.6% points to 8.1% and 9.5%, respectively. The 7-year and 12-year bonds issued in 2019 increased by 1.1% and 0.9% points to 8.1% and 8.6%, respectively. The 12-year bond issued in 2021 increased by 0.8% points to 8.6%. Below is a summary of the performance:
|
Kenya Eurobond Performance |
||||||
|
|
2014 |
2018 |
2019 |
2021 |
||
|
Date |
10-year issue |
10-year issue |
30-year issue |
7-year issue |
12-year issue |
12-year issue |
|
3-Jan-22 |
4.4% |
5.8% |
8.1% |
5.6% |
6.7% |
6.6% |
|
1-Feb-22 |
4.2% |
6.6% |
8.6% |
6.3% |
7.1% |
7.1% |
|
18-Feb-22 |
4.3% |
7.1% |
8.9% |
7.0% |
7.7% |
7.8% |
|
21-Feb-22 |
4.4% |
7.4% |
9.1% |
7.1% |
8.1% |
7.9% |
|
22-Feb-22 |
4.4% |
7.5% |
9.1% |
7.2% |
8.2% |
7.9% |
|
23-Feb-22 |
4.5% |
7.6% |
9.2% |
7.5% |
8.2% |
8.0% |
|
24-Feb-22 |
5.0% |
8.1% |
9.5% |
8.1% |
8.6% |
8.6% |
|
Weekly Change |
0.7% |
1.0% |
0.6% |
1.1% |
0.9% |
0.8% |
|
MTD Change |
0.8% |
1.5% |
0.9% |
1.8% |
1.5% |
1.5% |
|
YTD Change |
0.6% |
2.3% |
1.4% |
2.5% |
1.9% |
2.0% |
Source: Central Bank of Kenya
Kenya Shilling:
During the week, the Kenyan shilling remained relatively stable, depreciating marginally by 0.1% against the US dollar to close the week at Kshs 113.8, from Kshs 113.7 recorded the previous week, partly attributable to increased dollar demand from the oil and energy sectors. Key to note, this is the lowest the Kenyan shilling has ever depreciated against the dollar. On a YTD basis, the shilling has depreciated by 0.6% against the dollar, in comparison to the 3.6% depreciation recorded in 2021. We expect the shilling to remain under pressure in 2022 as a result of:
- Increased demand from merchandise traders as they beef up their hard currency positions in anticipation for more trading partners reopening their economies globally,
- An ever present current account deficit due to an imbalance between imports and exports, with Kenya’s current account deficit estimated to come in at 5.4% of GDP in 2021, having expanded by 27.4% in Q3’2021 to Kshs 184.6 bn, from Kshs 145.0 bn recorded in Q3’2020, attributable to a robust increase in merchandise imports by 39.6% to Kshs 321.8 bn in Q3’2021, from Kshs 230.5 bn in Q3’2020,
- The aggressively growing government debt, with Kenya’s public debt having increased at a 10-year CAGR of 18.4% to Kshs 8.0 tn in December 2021, from Kshs 1.5 tn in December 2011 thus putting pressure on forex reserves to service some of the public debt, and,
- Rising global crude oil prices on the back of supply constraints at a time when demand is picking up with the easing of COVID-19 restrictions and as economies reopen. Key to note, risks abound this global recovery following the emergence of the new COVID-19 variants.
The shilling is however expected to be supported by:
- High Forex reserves currently at USD 8.1 bn (equivalent to 5.0-months of import cover), which is above the statutory requirement of maintaining at least 4.0-months of import cover, and the EAC region’s convergence criteria of 4.5-months of import cover. In addition, the reserves were boosted by the USD 1.0 bn proceeds from the Eurobond issued in July 2021 coupled with the USD 972.6 mn IMF disbursement and the USD 130.0 mn World Bank loan financing received in June 2021, and,
- Improving diaspora remittances evidenced by a 21.7% y/y increase to USD 338.7 mn in January 2022, from USD 278.3 mn recorded over the same period in 2021, which has continued to cushion the shilling against further depreciation.
Weekly Highlight:
- February 2022 Inflation projections
We are projecting the y/y inflation rate for February 2022 to fall within the range of 5.3% - 5.7%. The key drivers include:
- Fuel prices for the period 15th February 2022 to 14th March 2022 remained unchanged at Kshs 129.7 per litre for Super Petrol, Kshs 110.6 per litre for Diesel and Kshs 103.5 per litre for Kerosene. With fuel being a major contributor to Kenya's headline inflation, maintaining constant fuel prices is expected to have a muted impact on the inflation basket,
- Increasing food prices as evidenced by the 8.9% y/y increase in the prices food & non-alcoholic beverages as of January 2022 due to increased costs of production. Food prices increased by 1.1% m/m from December 2021 mainly due to increases in the prices of sifted maize flour, kale, spinach and irish potatoes among other food items, and,
- The price of electricity reduced by 15.7% in January 2022 marking the first phase of compliance with President Uhuru Kenyatta’s directive to cut the cost of electricity by 30.0% in order to reduce the cost of living. The reduction in electricity costs helped prices of goods remain stable during the month of February 2022 due to lower production costs. Additionally, the further 15.0% reduction in the cost of electricity is expected to be done within Q1’2022, which will help mute inflationary pressures going forward.
Going forward, we expect the inflation rate to remain within the government’s set range of 2.5% - 7.5%. However, concerns remain high on the widening trade deficit as global fuel prices continue to rise due to supply bottlenecks. The rising global fuel prices could deplete the fuel subsidy program currently in place and further lead to a depreciation of the local currency.
Rates in the Fixed Income market have remained stable due to the relatively ample liquidity in the money market. The government is 16.7% ahead of its prorated borrowing target of Kshs 443.2 bn having borrowed Kshs 517.3 bn of the Kshs 658.5 bn borrowing target for the FY’2021/2022. We expect a gradual economic recovery as evidenced by the revenue collections of Kshs 1.1 tn during the first seven months of the current fiscal year, which is equivalent to 103.8% of the prorated revenue collection target. However, despite the projected high budget deficit of 11.4% and the lower credit rating from S&P Global to 'B' from 'B+', we believe that the support from the IMF and World Bank will mean that the interest rate environment will remain stable since the government is not desperate for cash. Owing to this, our view is that investors should be biased towards short-term fixed-income securities to reduce duration risk.
Markets Performance
During the week, the equities market was on a downward trajectory, with NASI, NSE 20 and NSE 25 declining by 4.2%, 1.7% and 3.2% respectively, taking their YTD performance to losses of 4.2%, 1.6% and 3.2% for NASI, NSE 20 and NSE 25, respectively. The equities market performance was driven by losses recorded by large cap stocks such as Safaricom of 6.1%, with NCBA and Diamond Trust Bank (DTB-K) both recording losses of 3.4%. The losses were however mitigated by gains recorded by stocks such as BAT of 1.4%.
During the week, equities turnover increased by 21.0% to USD 20.5 mn, from USD 17.0 mn recorded the previous week, taking the YTD turnover to USD 155.8 mn. Foreign investors remained net sellers, with a net selling position of USD 3.6 mn, from a net selling position of USD 0.5 mn recorded the previous week, taking the YTD net selling position to USD 2.4 mn.
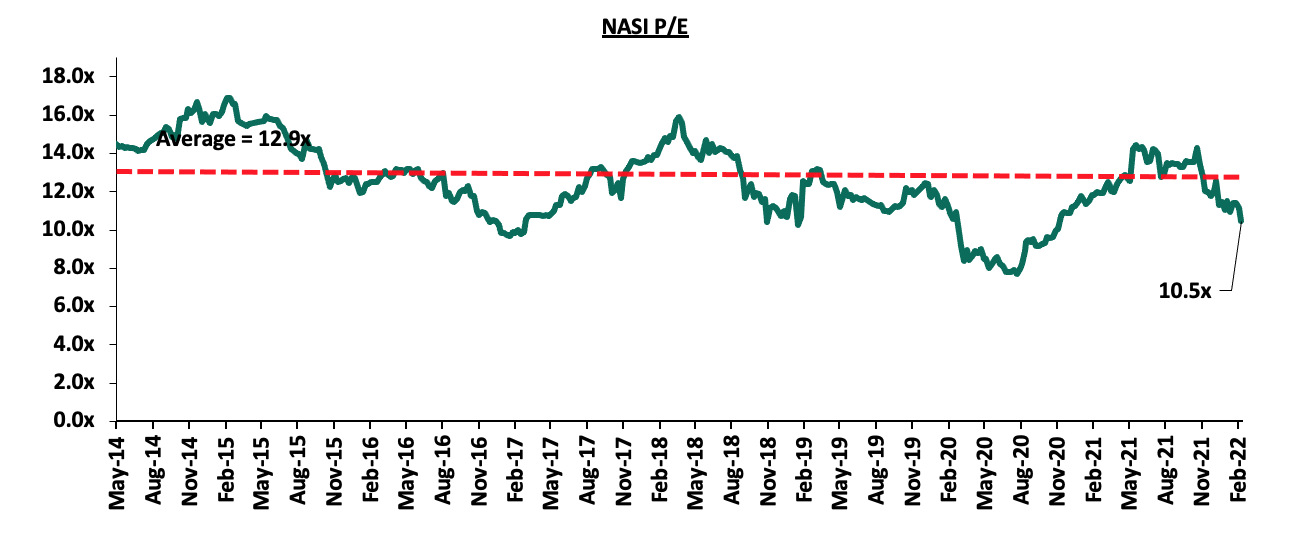
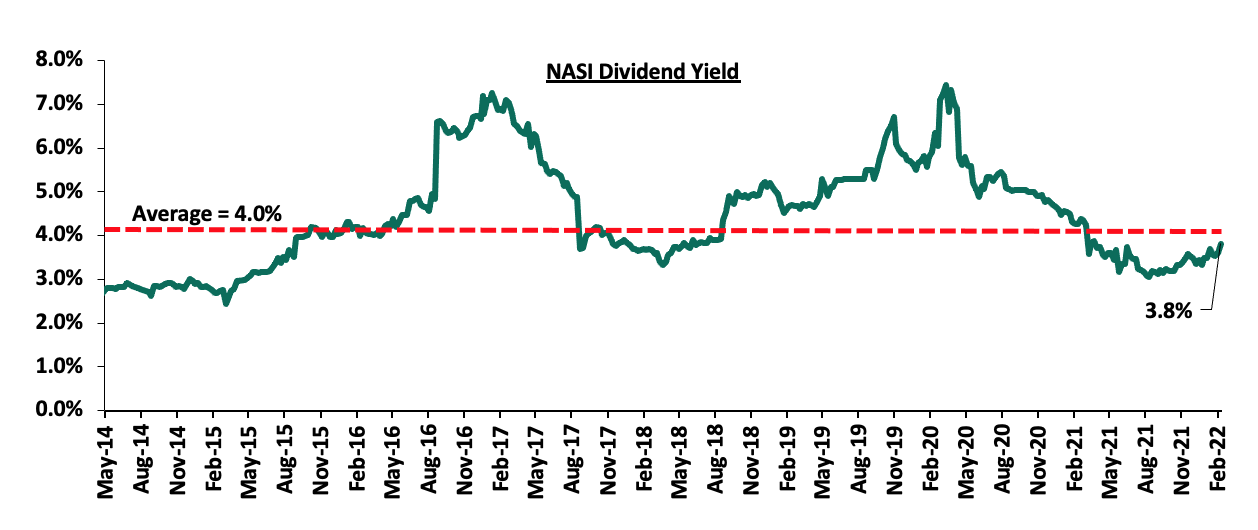
The market is currently trading at a price to earnings ratio (P/E) of 10.5x, 19.0% below the historical average of 12.9x, and a dividend yield of 3.8%, 0.2% points below the historical average of 4.0%. Notably, this week’s P/E is the lowest it has been since November 2020. Key to note, NASI’s PEG ratio currently stands at 1.3x, an indication that the market is trading at a premium to its future earnings growth. Basically, a PEG ratio greater than 1.0x indicates the market may be overvalued while a PEG ratio less than 1.0x indicates that the market is undervalued. The current P/E valuation of 10.5x is 35.8% above the most recent trough valuation of 7.7x experienced in the first week of August 2020. The charts below indicate the historical P/E and dividend yields of the market.
Universe of coverage:
|
Company |
Price as at 18/02/2022 |
Price as at 25/02/2022 |
w/w change |
YTD Change |
Year Open 2022 |
Target Price* |
Dividend Yield |
Upside/ Downside** |
P/TBv Multiple |
Recommendation |
|
Kenya Reinsurance |
2.3 |
2.3 |
0.4% |
(0.9%) |
2.3 |
3.2 |
8.8% |
48.8% |
0.2x |
Buy |
|
Jubilee Holdings |
292.8 |
275.8 |
(5.8%) |
(12.9%) |
316.8 |
381.7 |
3.3% |
41.7% |
0.5x |
Buy |
|
I&M Group*** |
21.5 |
21.3 |
(0.9%) |
(0.5%) |
21.4 |
24.4 |
10.6% |
25.0% |
0.6x |
Buy |
|
KCB Group*** |
46.0 |
45.0 |
(2.3%) |
(1.3%) |
45.6 |
51.4 |
2.2% |
16.5% |
0.9x |
Accumulate |
|
NCBA*** |
25.1 |
24.2 |
(3.4%) |
(4.9%) |
25.5 |
26.4 |
6.2% |
15.2% |
0.6x |
Accumulate |
|
Britam |
7.0 |
6.9 |
(2.3%) |
(9.0%) |
7.6 |
7.9 |
0.0% |
14.5% |
1.1x |
Accumulate |
|
Standard Chartered*** |
134.3 |
132.3 |
(1.5%) |
1.7% |
130.0 |
137.7 |
7.9% |
12.1% |
1.0x |
Accumulate |
|
Co-op Bank*** |
13.2 |
12.9 |
(2.3%) |
(1.2%) |
13.0 |
13.1 |
7.8% |
9.4% |
1.0x |
Hold |
|
Equity Group*** |
52.5 |
51.8 |
(1.4%) |
(1.9%) |
52.8 |
56.6 |
0.0% |
9.4% |
1.3x |
Hold |
|
Diamond Trust Bank*** |
59.0 |
57.0 |
(3.4%) |
(4.2%) |
59.5 |
61.8 |
0.0% |
8.4% |
0.2x |
Hold |
|
Liberty Holdings |
6.8 |
7.3 |
6.8% |
2.8% |
7.1 |
7.7 |
0.0% |
5.5% |
0.5x |
Hold |
|
Stanbic Holdings |
96.3 |
94.3 |
(2.1%) |
8.3% |
87.0 |
94.7 |
4.0% |
4.6% |
0.8x |
Lighten |
|
ABSA Bank*** |
12.0 |
12.0 |
0.0% |
2.1% |
11.8 |
11.9 |
0.0% |
(0.7%) |
1.2x |
Sell |
|
CIC Group |
2.2 |
2.2 |
0.9% |
0.0% |
2.2 |
1.9 |
0.0% |
(13.2%) |
0.8x |
Sell |
|
HF Group |
3.5 |
3.4 |
(2.0%) |
(9.5%) |
3.8 |
3.0 |
0.0% |
(14.2%) |
0.2x |
Sell |
|
Sanlam |
15.0 |
15.0 |
0.0% |
29.9% |
11.6 |
12.1 |
0.0% |
(19.6%) |
1.6x |
Sell |
|
*Target Price as per Cytonn Analyst estimates **Upside/ (Downside) is adjusted for Dividend Yield ***For Disclosure, these are stocks in which Cytonn and/or its affiliates are invested in |
||||||||||
We are “Neutral” on the Equities markets in the short term. With the market currently trading at a premium to its future growth (PEG Ratio at 1.3x), we believe that investors should reposition towards value stocks with strong earnings growth and that are trading at discounts to their intrinsic value. We expect the discovery of new COVID-19 variants, the upcoming Kenyan general elections and the slow vaccine rollout to continue weighing down the economic outlook. On the upside, we believe that the relaxation of lockdown measures in the country will lead to improved investor sentiments in the economy.
- Industry Report
During the week, the Kenya National Bureau of Statistics (KNBS) released the December 2021 Leading Economic Indicators (LEI) report. The LEI report highlights the performance of major economic indicators such as international arrivals, building plan approvals, among others. The key highlights related to the Real Estate sector include;
- Overall international arrivals through Jomo Kenyatta International Airport (JKIA) and Moi International Airport (MIA) increased by 15.2% to 90,504 in December 2021, from the 76,706 recorded the previous month. The overall number of arrivals came in at 240,019 in Q4’2021, representing a 54.6% increase from the 108,916 visitors during the same period in 2020. The remarkable performance was mainly attributed to;
-
- Lowered travel restrictions and advisories from countries such as UK,
- Increased roll out of vaccines which boosted the confidence of visitors into the Kenyan market,
- Increased leisure activities amidst the festive season which in turn fueled visitor arrivals,
- Positive accolades with Nairobi being announced Africa’s leading business travel destination in the 2021 World Travel Awards, and,
- Aggressive marketing of Kenya’s tourism and hospitality market through the Magical Kenya platform to key tourism markets.
The reopening of the economy played a huge part in improving the visitor arrivals and we expect that in the near term, the numbers will be back to the pre pandemic ones. The graph below shows the number of international arrivals in Kenya between 2019 and 2021:
- The value of building plan approvals increased by 14,166.7% to Kshs 41.5 bn in Q4’2021, from the Kshs 0.3 bn realized in the similar period in 2020. This was mainly attributed to the backlog clearance of pending building plan approvals, as well as increased construction activities especially in the residential and infrastructure sectors. Some of the key ongoing projects include; i) the Nairobi expressway project which is expected to be completed in March 2022, ii) Western Bypass, iii) Pangani Affordable Housing project, and iv) Athi River Waterfront affordable housing Project, among many others. The graph below shows the value of building plan approvals in the Nairobi Metropolitan Area between 2019 and 2021:
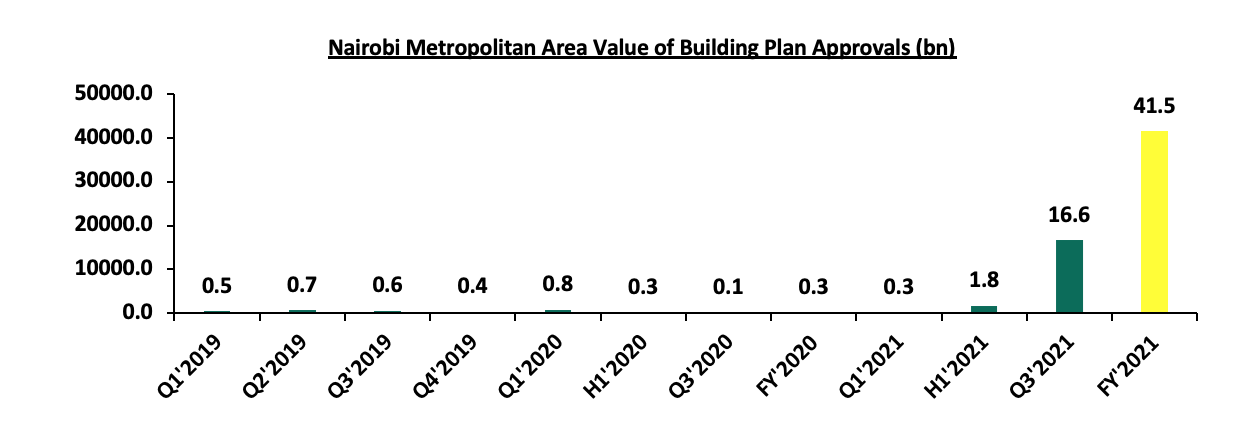
Source: Kenya National Bureau of Statistics (KNBS)
We expect the Real Estate sector to continue making remarkable growth and improved performance mainly fueled by increasing number of visitor arrivals into the country, coupled with the increased expansion and construction activities.
- Residential Sector
During the week, the Nairobi Metropolitan Services (NMS) began the redevelopment of 10 various estates in Nairobi County, with an aim of constructing 60,000 affordable housing units. These units are part of the second phase of Nairobi estates redevelopment programme and will be distributed as follows; i) Woodely-6,000, ii) Bahati-12,000, iii) Maringo-8,000, iv) Lumumba-10,000, v) Embakasi-4,000, vi) California-2,500, vii) Kariobangi North-1,500, and, viii) Bondeni-774. The remaining 15,226 units will be distributed between Jericho and Ziwani estates. The first phase of the programme included seven other estates in Nairobi such as Uhuru Estate, Ngong Road phase I and II, and Old Ngara among other projects. These projects are expected to;
- Provide low cost homes to residents targeting affordable developments,
- Improve living standards of residents through easing the accessibility to decent homes, and,
- Improve the low home ownership rates in Kenya, which is currently at 21.3% in urban areas as at 2020, compared to other African countries such as South Africa and Ghana at 53.0% and 47.2%, respectively.
The graph below shows the home ownership percentages of different countries compared to Kenya;
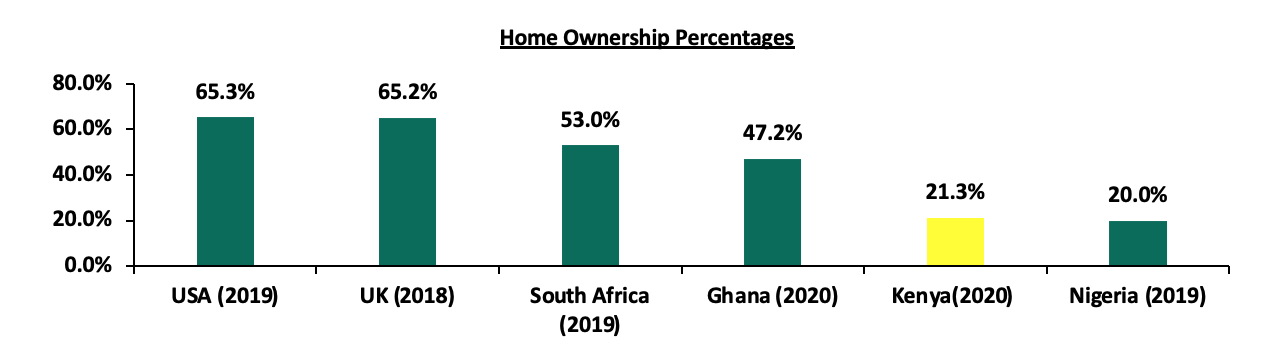
Source: Centre for Affordable Housing Africa, Federal Reserve Ban
As per our topical on Affordable Housing Program in Nairobi Metropolitan Area, the initiative continues to gain traction in Kenya evidenced by government’s efforts to implement projects through various strategies such as i) issuing of corporate bonds e.g. the Kshs 3.9 bn bond for investing in Pangani Affordable Housing, ii) Public Private Partnerships, and, iii) increased budget allocation to the housing sector evidenced by the 33.9% increase in allocation to Kshs 21.8 bn in FY’2021/22, from Kshs 20.4 bn in FY’2020/21. Currently, there are 327,082 number of registered applicants in the Boma Yangu Portal with some key ongoing projects being; i) River Estate in Ngara, ii) Stoni Athi River Waterfront project, and, iii) Starehe project, among many others. Despite these efforts, the program continues to face a couple of setbacks that have caused the projects to stall such as financial constraints fueled by the high construction costs, and, inadequate infrastructure.
Additionally, during the week, the Capital Markets Authority (CMA) announced that the first tranche of the Kshs 10.5 bn Kenya Mortgage Refinance Company’s (KMRC) Medium Term Note (MTN) program recorded an oversubscription of 478.6%, attributable to the attractive returns offered by the bond of 12.5%. KMRC aimed to raise a total of Kshs 1.4 bn in the first tranche, received bids worth Kshs 8.1 bn and only accepted bids worth Kshs 1.4 bn. The bond oversubscription follows East African Breweries Limited’s Kshs 11.0 bn bond that was oversubscribed in October 2021 by 344.5%, a sign of investor’s high appetite for the bond market. As highlighted in our Cytonn Weekly #02/2022, KMRC will disburse the capital to participating primary mortgage lenders (PMLs), such as banks, microfinance institutions and Savings and Credit Cooperatives (SACCOs) at a 5.0% rate, for onward lending to homebuyers at single digit rates.
We expect the residential sector to record more construction activities and developments supported by government’s efforts to provide affordable homes which is part of the Big 4 Agenda. The efforts by the government to make mortgages available through the KMRC is also expected promote home ownership rate in Kenya.
- Retail Sector
During the week, Naivas Supermarket, a local retail chain opened a new outlet at the new Imaara Mall along Mombasa road. This brings the retailer’s total operating outlets to 81 and the 2nd outlet to be opened in 2022, after launching a new outlet at Greenspan Mall on 18th February 2022 in a space that was previously occupied by Tuskys supermarket. The move to open the new store at Imaara Mall is driven by; i) positive demographics, ii) stiff market competition from its rivals such as QuickMart and Chandarana stores that have each opened a branch so far in 2022, and, iii) strategic location of the mall along Mombasa road enhancing ease of accessibility to the store. In terms of performance, according to our Cytonn Annual Markets Review 2021, Mombasa road where Imaara Mall lies recorded average rents per SQFT of Kshs 148 compared to the market average of Kshs 170 per SQFT, hence supporting the retailer’s decision to open the new store in the area due to affordability.
The table below shows the submarket performance of nodes in the Nairobi Metropolitan Area (NMA):
|
Nairobi Metropolitan Area Retail Market Performance FY’2021 |
|||
|
Area |
Rent Kshs /SQFT FY’2021 |
Occupancy% FY’2021 |
Rental Yield FY’2021 |
|
Westlands |
213 |
78.8% |
10.0% |
|
Karen |
202 |
84.0% |
9.8% |
|
Kilimani |
183 |
86.0% |
9.8% |
|
Ngong Road |
171 |
79.0% |
7.7% |
|
Kiambu road |
180 |
74.2% |
7.7% |
|
Mombasa road |
148 |
75.0% |
6.8% |
|
Thika Road |
161 |
74.0% |
6.7% |
|
Satellite towns |
142 |
69.0% |
6.2% |
|
Eastlands |
133 |
71.6% |
5.6% |
|
Average |
170 |
76.8% |
7.8% |
Source: Cytonn Research 2021
The table below shows the summary of the number of stores of the Key local and international retailer supermarket chains in Kenya;
|
Main Local and International Retail Supermarket Chains |
||||||||||
|
Name of Retailer |
Category |
Highest number of branches that have ever existed as at FY’2018 |
Highest number of branches that have ever existed as at FY’2019 |
Highest number of branches that have ever existed as at FY’2020 |
Highest number of branches that have ever existed as at FY’2021 |
Number of branches opened in 2022 |
Closed branches |
Current number of Branches |
Number of branches expected to be opened |
Projected number of branches FY’2022 |
|
Naivas |
Local |
46 |
61 |
69 |
79 |
2 |
0 |
81 |
0 |
81 |
|
QuickMart |
Local |
10 |
29 |
37 |
47 |
1 |
0 |
49 |
0 |
49 |
|
Chandarana |
Local |
14 |
19 |
20 |
23 |
1 |
1 |
24 |
4 |
28 |
|
Carrefour |
International |
6 |
7 |
9 |
16 |
0 |
0 |
16 |
0 |
16 |
|
Cleanshelf |
Local |
9 |
10 |
11 |
12 |
0 |
0 |
12 |
0 |
12 |
|
Tuskys |
Local |
53 |
64 |
64 |
3 |
0 |
61 |
3 |
0 |
3 |
|
Game Stores |
International |
2 |
2 |
3 |
3 |
0 |
0 |
3 |
0 |
3 |
|
Uchumi |
Local |
37 |
37 |
37 |
2 |
0 |
35 |
2 |
0 |
2 |
|
Choppies |
International |
13 |
15 |
15 |
0 |
0 |
13 |
0 |
0 |
0 |
|
Shoprite |
International |
2 |
4 |
4 |
0 |
0 |
4 |
0 |
0 |
0 |
|
Nakumatt |
Local |
65 |
65 |
65 |
0 |
0 |
65 |
0 |
0 |
0 |
|
Total |
257 |
313 |
334 |
185 |
4 |
179 |
190 |
4 |
194 |
|
Source: Online Search
We expect the retail sector to continue witnessing expansion activities by local and international retailers such as Naivas, and Carrefour, mainly driven by; i) positive demographics, ii) infrastructure developments opening up areas for accessibility and investments, as well as, iii) the improved business environment promoting transactions and activities. However, the existing oversupply at 1.7 mn SQFT in the Kenyan retail sector and 3.0 mn SQFT in the NMA retail sector, the growing popularity of e-commerce, and, business uncertainties brought about by the incoming elections, is expected to weigh down the performance of the sector.
- Listed Real Estate
In the Nairobi Stock Exchange, ILAM Fahari I-Reit closed the week trading at an average price of Kshs 6.2 per share. This represented a 1.6% and 3.1% Week-to-Date (WTD) and Year-to-Date (YTD) decline, respectively, from Kshs 6.3 per share and Kshs 6.4 per share, respectively. On Inception-to-Date (ITD) basis, the REIT’s performance continues to be weighed down having realized a 69.0% decline from Kshs 20.0. In the Unquoted Securities Platform, Acorn D-REIT closed the week trading at Kshs 20.2 while the I-REIT closed at Kshs 20.6 per unit. This performance represented a 1.0% and 3.0% gain for the D-REIT and I-REIT, respectively, from the Kshs 20.0 Inception price. The Kenyan REIT market performance continues to be weighed down by; i) a general lack of knowledge on the financing instrument, ii) general lack of interest of the REIT by investors, and, iii) lengthy approval processes to get all the necessary requirements thus discouraging those interested in investing in it. The graph below shows Fahari I-REIT’s performance from November 2015 to February 2022:
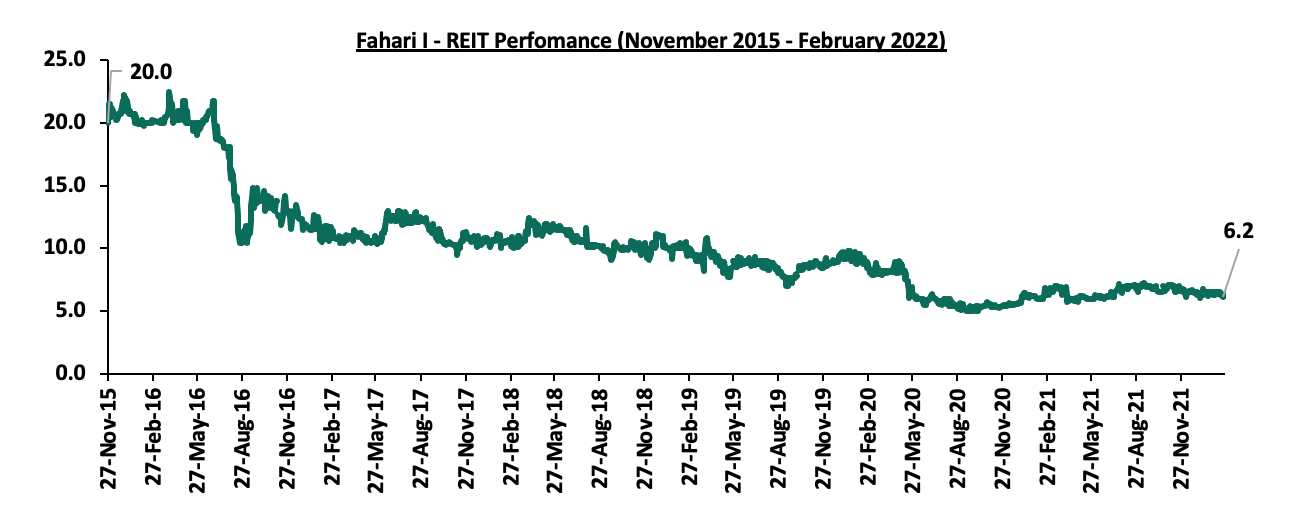
We expect the Real Estate sector to be on an upward trajectory supported by the continuous development activities in the residential sector, KMRC’s efforts to provide home loans to buyers, rapid expansion by retailers, and increased international arrivals into the country. However, the low investor appetite for the REIT market is expected to weigh down performance of the sector.
In 2020, we released a topical named ‘Student Housing Market in Kenya’ where we explained the concept of student housing, surveyed the market and gave recommendations on investment opportunity in the asset class. Student housing or purpose-built student accommodation (PBSA), refers to housing that has been designed specifically to meet the demands and requirements of the modern-day student. Most student housing facilities range from studios to flats with a cluster of up to eight rooms sharing living quarters. It also comprises of shared social spaces which provide amenities such as cable TV, laundry facilities and even organized social events, with others also offering gym facilities. Most of these facilities and amenities are positioned in central locations and with all-inclusive rents hence making PBSA popular to students. The concept has continued to gain traction globally, and in Kenya, its niche in the market is evidenced by the high investor appetite which has supported launch of numerous student housing developments, especially in areas surrounding institutions of higher learning.
This week we updated our research on the student housing market in the Nairobi Metropolitan Area with the aim of evaluating the market performance and offering recommendation on investment opportunity by covering;
- Global Overview of Student Housing,
- Student Housing in Kenya,
- Nairobi Metropolitan Area (NMA) Student Housing Market Performance,
- Recommendation, and,
- Conclusion
Section I: Global Overview of Student Housing
The growth of student housing has generally been driven by the increasing number of student enrollment against the backdrop of limited supply. The development of the sector has been in line with the globalization of higher education, supported by migration and international student numbers increasing in key developed countries such as the United Kingdom (UK) and the United States of America (USA). With this, other markets have recognized the importance of student housing in bridging the demand-supply gap while fueling domestic economic growth through returns. Most universities have initiated national internationalization programs and improved the marketing of their universities to attract and cater for international students who are the best potential clients for PBSA.
The United States of America (USA), for example, has a capacity of approximately 2.8 mn beds in private purpose-built student housing units against a university enrollment of approximately 20.0 mn students with a demand of 8.5 mn beds from students who prefer to live off-campus. Additionally, according to Savills, a global Real Estate services provider, the US is the largest inbound market for international students at about 1.0 mn which further necessitates the need for investment in student housing. This continues to drive the need to invest in student housing facilities to accommodate the growing number of international students.
In the United Kingdom (UK), more than 728,000 students applied to start a full-time undergraduate course at UK universities for the 2020/21 academic year. However, the approximate bed capacity stood at approximately 600,000 beds according to Knight Frank. Further, the UK is the world’s second most popular destination for international students, who are much more likely to live in PBSA than domestic students. As for the Australian student housing market which is placed third in terms of hosting international students, student bed capacity stood at 109,000 against a university enrollment of approximately 1.6 mn students as at 2020.
With demand outweighing supply, investment in student housing has taken shape with the global student housing investment volume totalling USD 18.0 bn (Kshs 2.0 tn) as at 2019 and the breakdown is as shown in the graph below;
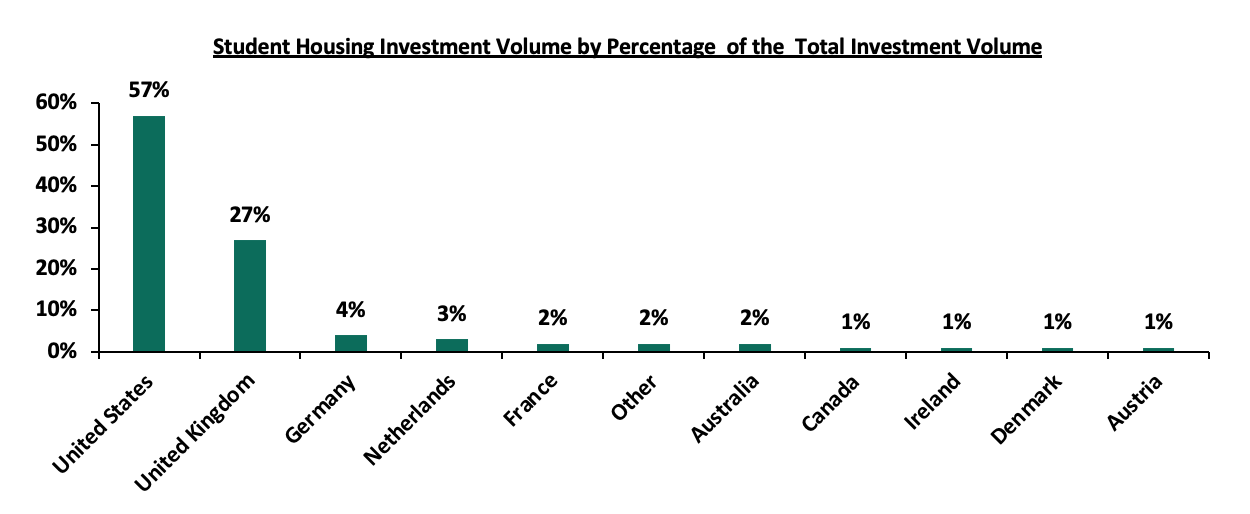
Source: Knight Frank; Online Sources
Major institutional investors in the student housing market include sovereign wealth funds (SWF), pension funds, insurance funds, as well as large-scale Real Estate developers. The most common methods of investing include buying properties to earn rental income whereas others invest in Real Estate Investment Trusts (REITs) that own student accommodation.
In terms of returns, according to Savills, the sub-sector registered relatively high returns surpassing other Real Estate classes such as conventional residential and commercial sectors.
Source: Savills UK
In the Sub-Saharan Africa region, South Africa is a leader in the provision of higher education in Africa. Its universities are consistently ranked among the best in Africa. This recognition has resulted in strong demand from domestic, regional and international students. According to the International Finance Corporation, in 2020, the number of students enrolled at public and private universities in South Africa was estimated to be 1.2 mn students. However, as of 2020, there were approximately 223,000 purpose-built student beds available in South Africa for public universities and TVET college students. Given a bed-to-student provision ratio of 68.0%, there is an estimated supply-demand gap of approximately 600,000 beds. With enrollments set to grow to almost 1.6 million by 2025, this demand gap is set to grow to around 781,000 beds by 2025. These, coupled with population growth in the youth segment, government funding for post-school education, and household income growth have fueled demand for student housing in the county.
South Africa is considered to have the most mature PBSA market in Africa followed by Kenya and Nigeria. When compared to mature markets such as the United Kingdom, it is clear that African markets are lagging behind in terms of tertiary enrolment rates. However, even though these enrolment rates are lower compared to the United Kingdom, it is to be noted that the African markets have a comparatively larger student population, which in turn drives demand in the PBSA market. As African markets start to mature, it is reasonable to expect that the student population will continue to grow as more students are able to afford to enroll in institutions of higher learning, which will further drive the need for PBSA on the continent.
The table below shows comparison of key student housing markets in Africa compared to the UK;
|
Comparison of Student Housing Markets-2020 |
|||||
|
# |
Typology |
United Kingdom |
South Africa |
Kenya |
Nigeria |
|
Country Population |
66.3 mn |
58.6 mn |
52.6 mn |
201.0 mn |
|
|
Tertiary Enrolment Rates |
61.4% |
22.4% |
11.5% |
10.2% |
|
|
Student Population (2018) |
1,840,000 |
2,160,000 |
995,000 |
2,040,000 |
|
|
PBSA Stock (No. of Beds) |
651,000 |
223,110 |
41,400 |
- |
|
|
Average Rental Prices* (USD per bed per month) |
Studio/Single Room |
1,771 - 1,994 |
320 |
149 |
149 |
|
Bed in double room |
N/A |
286 |
76 – 142 |
67 |
|
|
Bed in 3+ room |
N/A |
199 |
60 – 128 |
42 |
|
|
Old University Stock |
639-879 |
- |
10-50 |
- |
|
|
Occupancy Rates |
98% |
95-100% |
98 - 99% |
98% |
|
|
Maturity of PBSA Markets |
Emerging |
Emerging |
Nascent but Emerging |
Nascent |
|
Source: JLL
Other factors driving growth of student housing include;
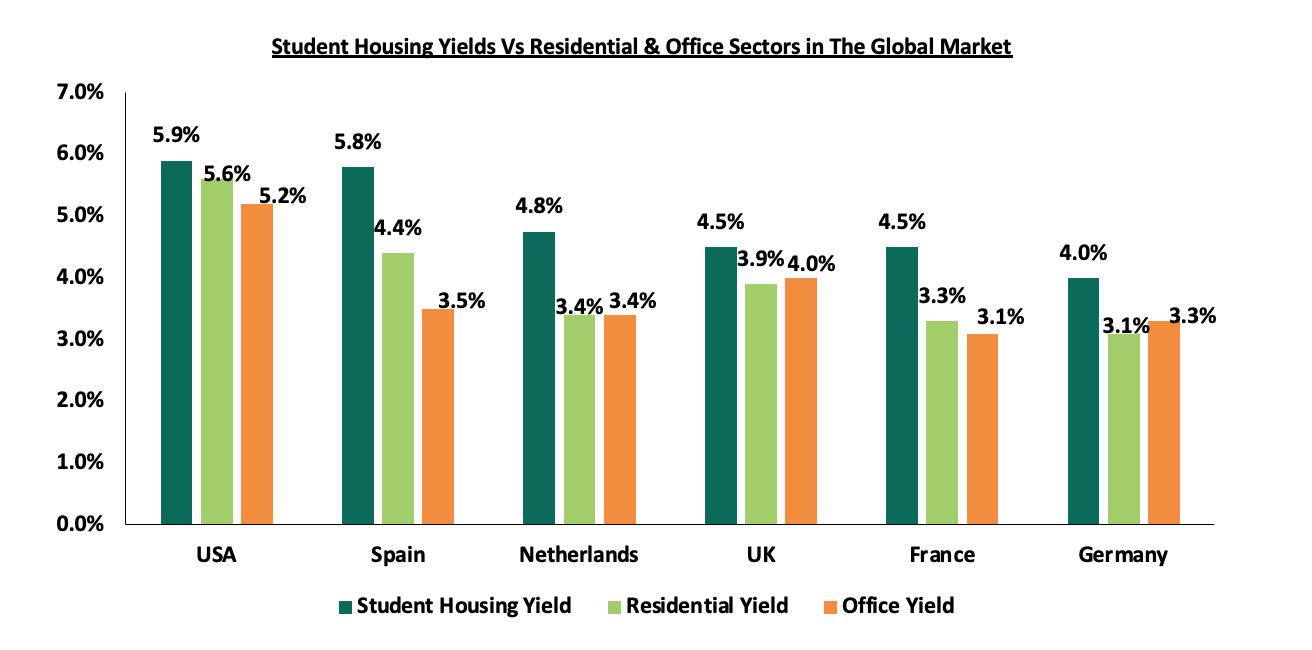
- Attractive Returns - According to Savills, a UK-based Real Estate services provider, student housing in the UK and the US delivered average rental yields of 4.5% and 5.9%, respectively, compared to the residential theme which delivered 3.9% and 5.6%, respectively, while the commercial office theme delivered 4.0% and 5.2% respectively. The trend of student housing delivering relatively high returns cuts across most countries and as such, the sector continues to attract high net-worth investors seeking strong returns on their investment,
- Hedge Against Economic Headwinds - Student housing has proven to be resilient especially during economic downturns such as the one caused by the COVID-19 pandemic, as well as the usual Real Estate cycles where yields may be affected by the economic environment. This is as student enrolment increases every year despite the prevailing economic climate, and even tends to spike during economic downturns as more people seek to diversify their skillsets,
- Expanding Middle Class – With the global rise of the middle class, the growth in disposable incomes has led to student mobility as more people seeking quality higher education can access it, hence creating a ready market for student housing, and,
- Need to Cater for International Students - The development of student housing has gone hand in hand with the globalization of higher education. As migration and international student numbers have become hot topics in the UK and US, other markets have recognized their importance as a tool to fuel domestic economic growth. They have initiated national internationalization programs and improved the marketing of their universities to attract international students and provide them with an exceptional student experience through modern Purpose Built Student Housing (PBSA).
Section II: Student Housing in Kenya
With Kenya being an emerging market for student housing, the concept has continued to gain traction by attracting private sector developers, investors, and operators. With the current available stock at 301,060, the student housing gap has attracted private sector participation to increase supply in order to cater to student preferences. Some of the factors that have driven demand for student housing in Kenya;
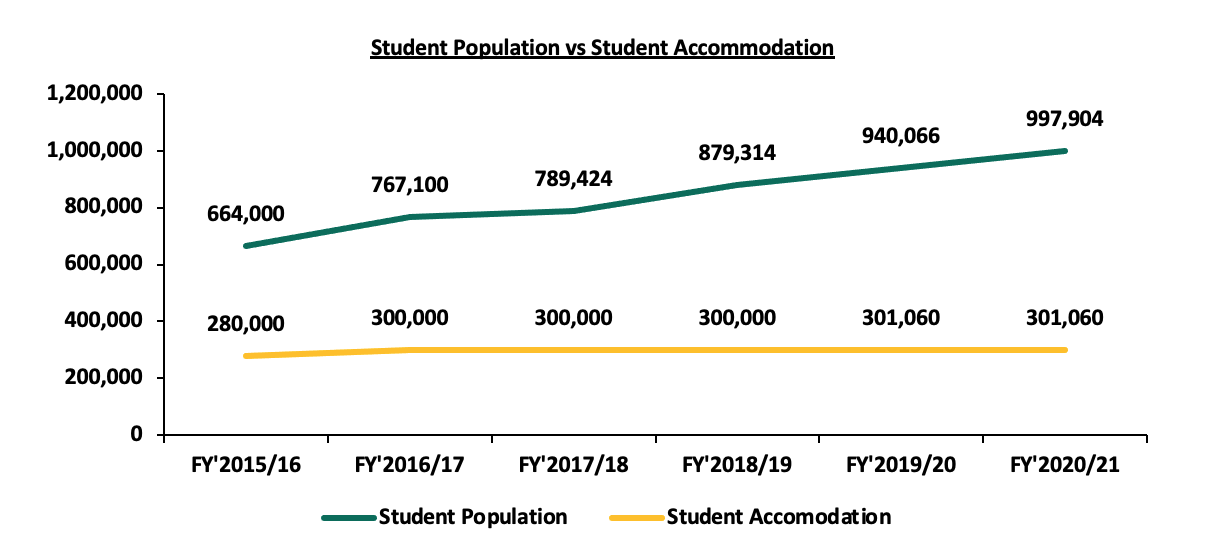
- Rapidly Growing Student Population: According to Kenya National Bureau of Statics (KNBS) 2021 Economic Survey, the student population in universities and vocational centres stood at 997,904 in FY’2020/21 from 664,000 in FY’2014/15. This represented a 5-yr CAGR of 8.5%, further expanding the student housing deficit by approximately 60,000 units. The numbers are set to increase as the university/college age demographic continues to grow. According to the 2019 population and housing census data, the number of individuals between 18-24 year who mostly represents university and vocational entry students was 6.4 mn, representing 13.4% of the total Kenyan population of 47.6 mn. The graph below shows the student population Vs the available student accommodation between 2015-2020;
Source: KNBS, Online Sources
- Increase in Tertiary Institutions: According to the KNBS, the overall number of Technical and Vocational Education and Training (TVET) institutions increased by 7.5% to 2,301 in 2020, from 2,140 in 2019. This increase especially in satellite branches is supported by government policy to increase the number of higher learning institutions to accommodate the growing student population that necessitates investment in student accommodation,
- Public Policy: Government measures such as scrapping visa requirements for other African countries is a boost for enrolment of international students to local institutions. In addition, the Kenya National Qualifications Authority has become more aggressive in fast-tracking recognition and equating of qualifications obtained from different countries, and the verification of certificates to ensure that they were genuine. To make Kenya more attractive, KNQA has planned to include upgrading accommodation facilities, setting out clearly defined academic calendars, and establishing international student directorates to assist learners. These will result in greater demand for quality student housing.
A few private sector players have taken interest in the concept of student housing, with institutional investors focusing their investment grade portfolio within Nairobi County. The key market players as shown below;
|
Purpose-Built Student Housing Investors in Kenya |
|||||
|
Key Players |
Type |
Brand |
Investment Areas |
Portfolio |
Expected Incoming Supply |
|
Acorn/Helios |
Joint Venture |
Qwetu/Qejani |
Ruaraka, Madaraka, Parklands, Jogoo Road, Thika Road, Hurlingham |
3,000 |
50,000 |
|
Century Developments Ltd/Kuramo |
Joint Venture |
- |
Nairobi County |
- |
10,000 |
|
Student Factory Africa/ Betonbouw B |
Joint Venture |
Student Village |
Karen |
- |
4500 |
|
Questworks |
Developer |
Parallelfour |
Madaraka |
<200 |
800 |
|
Defoca (Kenya Defense Forces Old Comrades Association) |
Owner |
Kafoca Studyville |
Madaraka |
500 |
- |
|
Total |
3,700 |
65,200 |
|||
Online Research
Incoming supply of student housing over the past 2 years has been limited by the COVID-19 pandemic which presumably slowed down the investment volumes and brought about the trend of online-learning which further limited demand for student accommodation. However, as vaccination programs accelerate to manage spread of the virus, the market has witnessed growing investor confidence and initiative in unlocking growth opportunities. One of the major trends that have been witnessed in the Kenyan market is Acorn Holding’s listing their development REIT (D-REIT) and income REIT (I-REIT) at the Nairobi Stock Exchange at a cost of Kshs 7.5 bn in February 2021. The REITs have been trading on the Unquoted Securities Platform (USP), which was launched in December 2020, with Acorn aiming to tap into Kenya’s capital market raise funds for growing its capacity in student hostels.
Despite the factors driving demand, supply of student housing continues to lag behind owing to the notion that provision of student accommodation is the role of the institutions of higher learning. The shortage of purpose-built student accommodation is further attributable to:
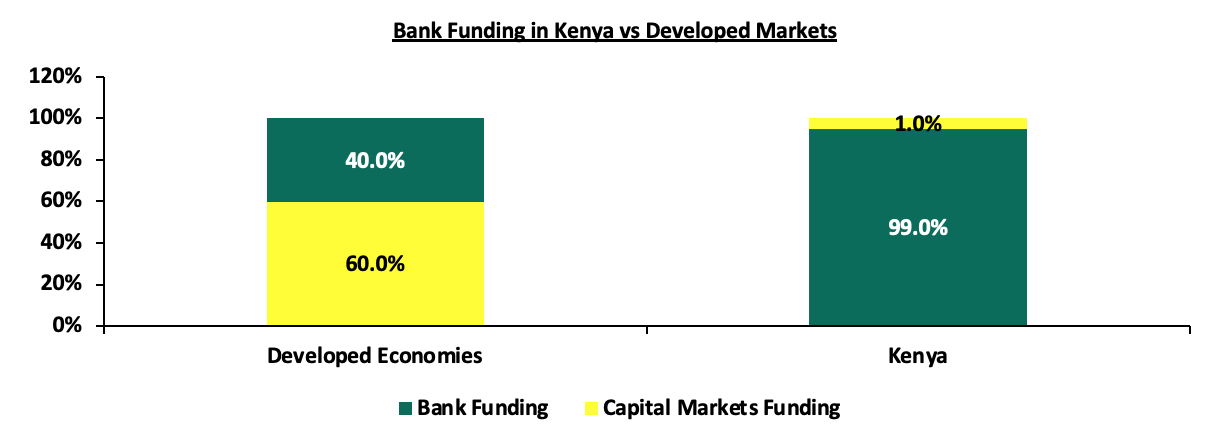
- Insufficient Access to Funding - Unlike in the developed markets where investors can easily secure debt and equity financing, obtaining financing for local developers has been difficult due to reluctance of lending institutions to finance such private developers and therefore apply strict underwriting standards. Additionally, the local capital markets, which can be a source of long-term funding remains relatively undeveloped. For instance, in Kenya, the capital markets contribute a mere 1.0% of Real Estate funding while banks contribute 99.0%, compared to 60.0% and 40.0% respectively in developed countries. The chart below compares bank funding in Kenya and capital markets,
Source: World Bank
- Ineffectiveness of Public-Private Partnerships (PPPs) - Public-private partnerships (PPPs) in Kenya face challenges such as; i) difficulties in managing the multi-stakeholder nature of most of the PPP projects, ii) lack of appropriate legal frameworks in Kenya to enable transfer of public land into special purpose vehicles to be able to attract private capital and bank debt, and, iii) the extended time-frame of PPPs while private developers prefer to exit projects within 3-5 years. The PPP hostel projects have a design, build, own, operate and transfer model, where the developers will recoup their return after an approximate 20-year period and this is unattractive to investors who prefer to exit early,
- High Land Costs - Land in urban areas in Kenya has continued to soar, driven by demand for development class land which has also led to its shortage, especially in Nairobi, where the price per acre averages Kshs 134.8 mn as at 2021, according to Cytonn Research, and,
- Inadequate Expertise - Purpose-built student housing accommodation requires high development and management expertise, which the majority of developers lack capacity for hence making them shy away from investment in the sector.
Section IV: Nairobi Metropolitan Area (NMA) Student Housing Market Performance
We conducted research and analysed data of 10 areas in the NMA namely; Parklands, Madaraka, Ruiru, Kahawa Sukari, Thome, Juja, Rongai, Athi River, Karen, and Thika. The student housing market in Kenya comprises of studio units and shared units of up to 8 beds with the most stock of shared spaces being that of 2 beds in a unit. These facilities have continued to offer amenities such as tuck shops, back-up generators, CCTV and 24/7 security teams, secure biometric access, common rooms with DSTV, gyms, and game rooms, laundry machines, separate study rooms, and some even offer shuttle services. The rents for PBSA range from Kshs 10,000 with the highest in the market currently being Kshs 34,000 per month.
In the overall performance, the student housing market recorded slight improvement in 2022, with the average rental yield coming in at 7.0%, a 0.1% marginal improvement from 6.9% recorded in 2020. The average rent per SQM increased by 18.3% to Kshs 505 in 2022, from Kshs 427 in 2020. However, the average occupancy rate registered at 1.7% points decline to 79.6% in 2022, from 81.4% in 2020. The table below gives a summary of the comparison in market performance between 2020 and 2022;
|
Comparison of Student Housing Performance in Nairobi Metropolitan Area (2020-2022) |
|||||||||
|
Number of Persons per Room |
Average Rent per SQM 2020 |
Average Rent per SQM 2022 |
∆ in % |
Average Occupancy 2020 |
Average Occupancy 2022 |
∆ in % Points |
Average Rental Yield 2020 |
Average Rental Yield 2022 |
∆ in % points |
|
1 |
637 |
690 |
8.4% |
76.8% |
80.4% |
3.6% |
11.7% |
11.3% |
(0.5%) |
|
2 |
457 |
526 |
15.1% |
81.2% |
81.6% |
0.4% |
8.9% |
8.7% |
(0.2%) |
|
4 |
345 |
445 |
29.0% |
81.0% |
77.9% |
(3.1%) |
6.7% |
7.1% |
0.3% |
|
6 |
270 |
357 |
32.5% |
86.5% |
78.7% |
(7.9%) |
5.6% |
5.7% |
0.1% |
|
Average |
427 |
505 |
18.1% |
81.4% |
79.6% |
(1.7%) |
*6.9% |
*7.0% |
0.1% |
|
|||||||||
The key take outs include;
- The relatively marginal improvement in 2022 was attributed to the COVID-19 pandemic that saw students shift to online learning hence reducing demand for student accommodation. However, as the economy reopened, landlords increased their rental rates in a bid to compensate for losses recorded in 2020 hence the relatively high rent per SQM at Kshs 505 in 2022. In comparison to other Real Estate themes, rent per SQM in student housing is in line with that of the residential sector which came in at Kshs 508 per SQM in 2021. However, it is relatively lower than that of the commercial office and retail sectors which came in at Kshs 93 per SQFT and Kshs 170 per SQFT, respectively in 2021,
- The rooms occupied by 1 person registered the highest rental yield at 11.3% in 2020. However, this represented 0.4% points decline from 11.7% recorded in 2020, and,
- 2-sharing rooms recorded the highest occupancy rate at 81.6% in 2022. On average, the private hostels charge Kshs 10,467 per month compared to university-let hostels, which charge a maximum of Kshs 3,000 per month.
We also analysed the data depending on the market segments, i.e upper mid-end markets, which tend to host private universities and the low mid-end and satellite towns which largely host mid-tier colleges and public universities. The upper mid-end segment remained the best performing as it generally attracts relatively higher rental rates that average at Kshs 622 per SQM in comparison to the low mid-end markets with Kshs 456 per SQM. In terms of rental yield, the upper mid end segment registered a 0.5% points increase in rental yield to 10.0% in 2022 from 9.5% in 2020. On the other hand, rental yield in the lower mid end segment remained unchanged at 7.5%, similar to 2020.
|
Nairobi Metropolitan Area Student Housing Summary 2022 |
|||||
|
Upper Mid-End Student Housing |
|||||
|
Area |
Average of Plinth Area |
Average of Rent 2022 |
Average of Rent per SQM 2022 |
Average Occupancy Rate 2022 |
Average Rental Yield |
|
Karen |
17 |
10,967 |
646 |
84.6% |
11.1% |
|
Thome |
25 |
16,278 |
657 |
78.9% |
10.5% |
|
Madaraka |
24 |
15,518 |
607 |
74.6% |
9.2% |
|
Parklands/Waiyaki Way |
21 |
12,038 |
577 |
78.2% |
9.2% |
|
Grand Total |
22 |
13,700 |
622 |
79.1% |
10.0% |
|
Lower Mid-End Student Housing |
|||||
|
Area |
Average of Plinth Area |
Average of Rent 2022 |
Average of Rent per SQM 2022 |
Average Occupancy Rate 2022 |
Average Rental Yield |
|
Rongai |
19 |
11,692 |
629 |
82.1% |
10.5% |
|
Kahawa Sukari/Wendani |
21 |
10,989 |
537 |
81.3% |
8.9% |
|
Ruiru |
19 |
9,471 |
517 |
78.6% |
8.3% |
|
Athi River |
25 |
8,458 |
388 |
86.8% |
6.9% |
|
Thika |
13 |
4,607 |
368 |
72.1% |
5.4% |
|
Juja |
14 |
4,133 |
297 |
87.9% |
5.3% |
|
Grand Total |
18 |
8,225 |
456 |
81.5% |
7.5% |
NB: The yields are calculated assuming an average development cost per SQM of Kshs 59,000 for purpose built student housing |
|||||
Source: Cytonn Research 2022
- Rental Rates – Thome and Karen Estates attracted the highest rent per SQM at Kshs 657 and Kshs 646, respectively. These areas host top tier private universities such as Catholic University of Eastern Africa and United States International University thus attracting students largely from the middle class and high-income families. Generally, the average monthly rental rates fluctuate based on location, the type of institutions targeted, which tend to warrant differences in terms of the quality of student housing and amenities expected by the students. Additionally, hostels within Nairobi County tend to charge higher than satellites owing to the relatively high land costs, which are passed onto the tenants,
- Amenities - Rental properties in the off-campus market offer a number of amenities, many of which are absent in on-campus housing. Three amenities that are available off-campus and almost non-existent on campus include; hot showers, wireless internet access and DSTV,
- Occupancy Rates – The low mid-end segment registered a higher average occupancy rate averaging 81.5% compared to upper mid-end areas with 79.1%. This is because the former tend to attract more student populations owing to their affordability with some opting to commute.
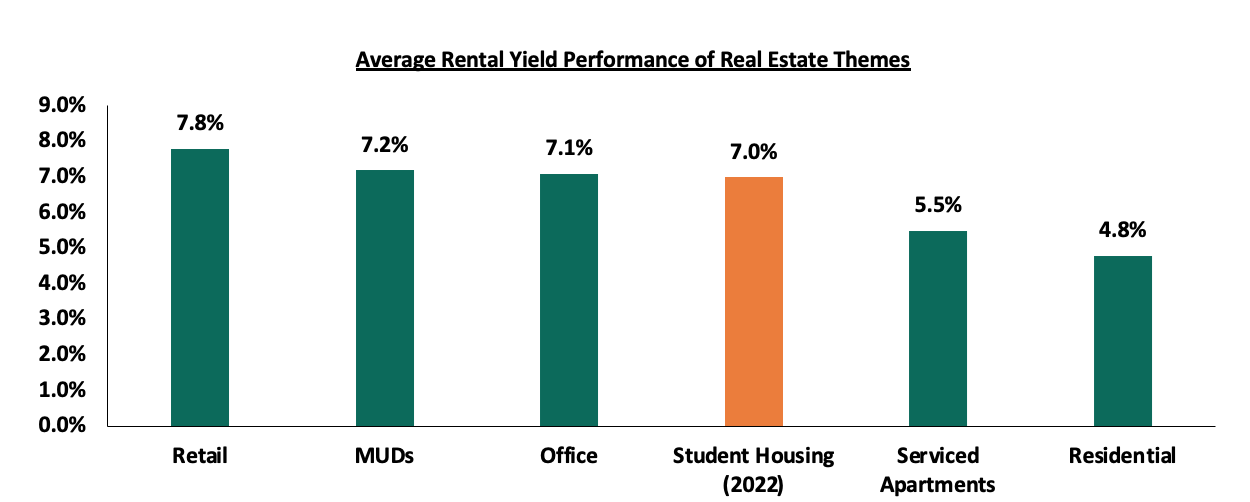
In comparison to other asset classes within the Real Estate sector, student housing posted a relatively high rental yield averaging 7.0% and surpassing serviced apartments and residential sectors which recorded 5.5% and 4.8% as at 2021, respectively, as shown below;
Source: Cytonn Research 2022
Section IV. Recommendation
For purpose-built student accommodation to be more attractive to students and enable investors benefit from high occupancy rates and consistent rental income, we recommend that investors should;
- Develop accommodation facilities that are in-line with international standards such as; i) high-quality finishes and amenities, ii) thoughtful and market-specific design, and iii) are located in close proximity to universities, ideally less than five minutes walking distance, and,
- Conduct thorough research to identify the niche markets.
Additionally, to support private sector participation in bridging the demand-supply gap in student housing, the government should;
- Remove Obstacles in the Capital Markets such as reducing minimum investments to reasonable amounts in order to access a wider pool of investors. Currently, the minimum investment for sector specific funds is Kshs 1.0 mn, while that for Development-Real Estate Investments Trusts (D-REIT) is currently at Kshs 5.0 mn hence crippling private sector’s participation in the development of student housing in Kenya, and,
- Reduce Bureaucracy and Regulatory Hindrances in the Working of PPPs by addressing such as, lack of a revenue sharing mechanism and lack of a mechanism to transfer public land to a Special Purpose Vehicle (SPV) to facilitate easier access to private sector funds through the use of the land as security.
Investment opportunities in Nairobi Metropolitan Area lies in markets such as Karen, Thome and Madaraka with relatively high rental yields of 11.1%, 10.5% and 9.2% attributed the areas hosting private universities in Kenya popular with international students, namely, United States International University (USIU) and Strathmore University, and as such, we expect that the region will continue to present a large gap for quality purpose-built accommodation.
Section V: Conclusion
With the continued development of PBSA and the increasing number of options available, coupled with amenities provided, students are increasingly choosing PBSA as their desired accommodation. PBSA is far better at catering to student’s needs which students are very much willing to pay for due to convenience and quality. It is clear that there is demand for student accommodation and PBSA is becoming more important and as such, we expect to witness more developments to cater for the rising number of student in institutions of higher learning. However, the trend towards online-learning due to the pandemic poses a challenge to the incoming supply of PBSA as this may reduce occupancy rates in the developments.
Disclaimer: The views expressed in this publication are those of the writers where particulars are not warranted. This publication, which is in compliance with Section 2 of the Capital Markets Authority Act Cap 485A, is meant for general information only and is not a warranty, representation, advice or solicitation of any nature. Readers are advised in all circumstances to seek the advice of a registered investment advisor.

- Talk to us
- Kenya
- P.O Box 20695 - 00200, Nairobi, Kenya
- Cell +254709101200
- Tel +254709101200
- WhatsApp +254741676635
- United States
- +254709101200
- DOWNLOAD OUR APP
-


- Kenya
- 8th Floor, Pinetree Plaza, Kaburu Drive, Ngong Road, Nairobi, Kenya
- USA
- Suite 1150, 1775 Eye Street NW, USA, Washington DC 20006, USA
- Investments
- High Yield
- Private Equity
- Real Estate
- Real Estate
- RiverRun Estates
- Cytonn Towers
- The Ridge
- Taraji Heights
- The Alma