Cytonn H1’2022 Markets Review
By Cytonn Research, Jul 3, 2022
Executive Summary
Global Markets Review
According to the World Bank’s June 2022 Report, the Global Economy is projected to grow at a slower rate of 2.9% in 2022, 1.2% points lower than the initial growth outlook of 4.1% projected in January. The deceleration from the 5.7% growth in 2021 is broad-based with advanced economies projected to decelerate at 2.6% while Developing and Emerging markets are projected to decelerate at 3.4%. The key challenges to the global economic growth remain the high commodity prices and continued monetary policy tightening. The high global inflation is also expected to remain elevated and surpass central banks’ targets as a result of persistent supply disruptions, tight labor markets, and surging commodity prices catalyzed by Russia-Ukraine conflict;
Sub-Saharan Africa Regional Review
According to the World Bank, the Sub-Saharan economy is projected to grow at 3.7% in 2022, which is significantly lower than the 4.2% growth estimates recorded in 2021. The expected slowdown in the region’s growth will be driven by continued supply constraints, outbreaks of new coronavirus variants and increasing inflation rates. Concerns also remain high on the inflated import bill and widening trade deficit as oil prices continue to rise due to supply bottlenecks worsened by the geopolitical tensions arising from the Russia-Ukraine invasion given that most countries in the Sub-Saharan African are net importers;
All the select currencies depreciated against the US Dollar in H1’2022 as compared to H1’2021 where most currencies recovered following a sharp depreciation in 2020. During the first half of 2022, debt sustainability in the Sub-Saharan Africa remained a major concern with public debt to GDP ratio at 61.0% in 2021 and is expected to remain elevated in 2022. Additionally, Sub-Saharan Africa (SSA) stock markets recorded mixed performance in H1’2022, with most of the markets recording negative returns, attributable to continued depreciation of the currencies in Sub-Saharan Africa which has seen continued selloffs by foreign investors as they opt to invest in more secure bond markets with higher yields;
Kenya Macroeconomic Review
According to the Kenya National Bureau of Statistics (KNBS) Q1’2022 Quarterly GDP Report, the Kenyan economy recorded a 6.8% expansion in Q1’2022, up from the 2.7% growth recorded in Q1’2021. The performance was bolstered by rebounds in most economic activities, which had contracted significantly in the Q1’2021 as a result of COVID-19 control measures. However, H1’2022 saw increased inflationary pressures with the average inflation rate increasing to 6.3%, compared to 5.9% in H1’2021, largely attributable to a rise in food and fuel prices stemming from persistent supply bottlenecks. This was reflected in the business environment, which deteriorated noticeably as consumers cut back on spending, with the average Stanbic Purchasing Managers Index (PMI) coming in at 49.7 in the first five months of 2022, unchanged from what was recorded in the same period in 2021;
Fixed Income
During the first half of 2022, T-bills were undersubscribed, with the overall subscription rate coming in at 89.3%, down from 109.7% in H1’2021, as investors shifted their interest to the bond market, where the longer-term offered higher yields and recorded an over-subscription of 106.8% in H1’2022. Overall subscriptions for the 91-day, 182-day, and 364-day papers came in at 109.0%, 69.0% and 101.7% in H1’2021, from 87.8%, 58.5% and 167.9% in H1’2021, respectively, with investors’ participation skewed towards the 91-day paper. Additionally, the yield curve was on an upward trajectory with a notable increase in the yields on all the bonds, leading to a 1.4% decline in the FTSE bond index year to date;
During the week, T-bills remained undersubscribed with the overall subscription rate coming in at 37.1 %, from 88.3% recorded the previous week. The undersubscription was partly attributable to the tightened liquidity in the money market with the average interbank rates increasing to 5.3%, from the 5.2% recorded the previous week. The yields on the government papers continued to increase, with the yields on the 364-day, 182-day and the 91-day papers increasing by 1.1 bps, 3.3 bps and 17.2 bps to 10.0%, 9.2% and 8.1%, respectively. The continued increase is partly attributable to investors attaching higher risk premium on the country due to perceived higher risks arising from increasing inflationary pressures and local currency depreciation. In the Primary bond Market, the government reopened two bonds, namely: FXD2/2013/15 and FXD2/2018/15 with effective tenors of 5.8 years and 11.3 years, respectively, in a bid to raise Kshs 40.0 bn for budgetary support. The period of sale runs until 19th July 2022;
Equities
During Q2’2022, the equities market was on a downward trajectory, with NASI, NSE 25 and NSE 20 declining by 19.8%, 16.8% and 12.1%, respectively, taking their H1’2022 to losses of 25.2%, 21.0% and 15.2% for NASI, NSE 25 and NSE 20 respectively. The equities market performance during the quarter was driven by losses recorded by large caps such as Safaricom, BAT, ABSA Bank and Diamond Trust Bank (DTB-K) of 26.9%, 17.8%, 16.1% and 15.3%, respectively;
During the week, the equities market was on an upward trajectory with NSE 25, NASI and NSE 20 gaining by 7.2%, 6.6% and 3.1%, respectively, taking their YTD performance to losses of 25.2%, 21.0% and 15.2%, for NASI, NSE 25 and NSE 20, respectively. The equities market performance was mainly driven by gains recorded by large-cap stocks such as EABL, Equity Group, Safaricom and KCB Group of 20.6%, 10.3%, 8.4% and 6.3%, respectively. The gains were however weighed down by losses recorded by BAT, Diamond Trust Bank (DTB-K), Standard Chartered Bank (SCBK) which declined by 1.4%, 1.1% and 0.8%, respectively;
Real Estate
During the H1’2022, the Real Estate sector recorded increased activity, attributed to the recovery of the sector following increased property transactions. In support of this, the sector grew by 6.1% in Q1’2022, a 0.4% increase from the 5.7% growth that was recorded in Q4’2021 as per Kenya National Bureau of Statistics’ (KNBS) Q1’2022 Gross Domestic Product report. In the Nairobi Metropolitan Area (NMA), the residential sector registered improved performance with average total returns coming in at 5.8%, 0.3% points increase from 5.5% recorded in H1’2021. The average rental yield for office spaces slightly increased by 0.02% points to 7.35% from 7.33% in FY’2021, mainly driven by an increase in the average rental rates, while the average rental yield for retail spaces remained the same at 7.8%, when compared to FY’2021 performance. The average selling prices for land in the Nairobi Metropolitan Area (NMA) recorded an overall improvement in performance with the YoY capital appreciation coming in at 3.1%.
Investment Updates:
- Weekly Rates:
- Cytonn Money Market Fund closed the week at a yield of 10.51%. To invest, dial *809#;
- Cytonn High Yield Fund closed the week at a yield of 13.92% p.a. To invest, email us at sales@cytonn.com and to withdraw the interest, dial *809#;
- On our weekly Twitter Spaces session, we had a discussion on “Taking Stock of the Fiscal Year 2021/2022” which was moderated by Kevin Karobia, an Investment Analyst at Cytonn. Listen to the conversation here,
- We continue to offer Wealth Management Training every Wednesday and every third Saturday of the month, from 9:00 am to 11:00 am, through our Cytonn Foundation. The training aims to grow financial literacy among the general public. To register for any of our Wealth Management Trainings, click here;
- If interested in our Private Wealth Management Training for your employees or investment group, please get in touch with us through wmt@cytonn.com;
- Any CHYS and CPN investors still looking to convert are welcome to consider one of the five projects currently available for assignment, click here for the latest term sheet;
- Cytonn Insurance Agency acts as an intermediary for those looking to secure their assets and loved ones’ future through insurance namely; Motor, Medical, Life, Property, WIBA, Credit and Fire and Burglary insurance covers. For assistance, get in touch with us through insuranceagency@cytonn.com;
- Cytonnaire Savings and Credit Co-operative Society Limited (SACCO) provides a savings and investments avenue to help you in your financial planning journey. To enjoy competitive investment returns, kindly get in touch with us through clientservices@cytonn.com;
Real Estate Updates:
- For an exclusive tour of Cytonn’s Real Estate developments, visit: Sharp Investor's Tour, and for more information, email us at sales@cytonn.com;
- Phase 3 of The Alma is now ready for occupation. To rent please email properties@cytonn.com;
- We have 8 investment-ready projects, offering attractive development and buyer targeted returns; See further details here: Summary of Investment-ready Projects;
- For Third Party Real Estate Consultancy Services, Cytonn currently offers services to other parties with regards to property research, business cases, property development, sales and marketing, and, construction and project management. For more details and any enquiries, email us at rdo@cytonn.com;
- For recent news about the group, see our news section here;
Hospitality Updates:
- We currently have promotions for Staycations. Visit cysuites.com/offers for details or email us at sales@cysuites.com;
Introduction
According to the World Bank’s June 2022 Report, the global economy is projected to grow at a slower rate of 2.9% in 2022, 1.2% points lower than their initial growth outlook of 4.1%, largely driven by a projected 3.4% slow growth in emerging markets and developing economies, coupled with a 2.6% deceleration in advanced economies. The slow growth has been driven by rising energy prices, less favorable financial conditions, and supply chain disruptions, all of which have been exacerbated by the war in Ukraine. In emerging markets and developing economies, the economy is expected to grow at a slower rate of 3.4%. The slow growth is attributable to spill overs from the war in Ukraine causing commodity price volatility, higher input costs, trade disruptions, and weaker confidence. Going forward, there is no projected rebound next year with the global growth forecasted to slightly increase by 3.0% in 2023. The key challenges going forward are high commodity prices and continued monetary tightening.
Commodity Prices:
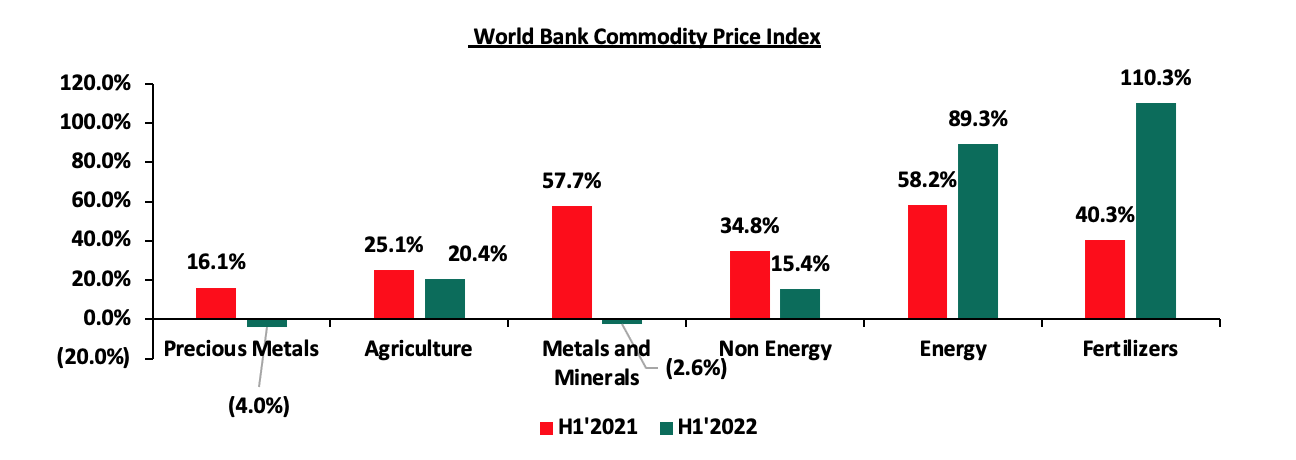
Global commodity prices registered mixed performance in H1’2022, with prices of precious metals declining by 4.0% largely driven by reduced demand for safe haven assets, a situation accentuated by the United States interest rate hike that has seen investors opt for higher-yield-bearing assets. On the other hand, fertilizer prices recorded the highest increase, gaining by 110.3% in H1’2022, mainly attributable to mismatch between demand and supply arising from supply chain constraints, as a result of Russian government’s decision to halt fertilizer exports in retaliatory move following sanctions for their role in the Russia-Ukraine Conflict. Key to note, Russia is the single largest producer of fertilizers exporting fertilizers worth USD 12.5 bn, accounting for 15.1% of the total fertilizer exports in 2021. Below is a summary performance of various commodities:
Source: World Bank
According to the World Bank, the Sub-Saharan economy is projected to grow at 3.7% in 2022, which is significantly lower than the 4.2% growth estimates recorded in 2021. The expected slowdown in the region’s growth will be driven by continued supply constraints, outbreak of new COVID-19 variants and increased inflationary pressures. Concerns also remain high on the inflated import bill and widening trade deficit as oil prices continue to rise due to supply bottlenecks worsened by the geopolitical tensions arising from the Russia-Ukraine invasion given that most countries in the Sub-Saharan African are net importers.
Debt sustainability in Sub-Saharan Africa continues to be a major concern and as per World Bank’s Africa’s Pulse April 2022 , the region’s public debt to GDP ratio increased to 61.0% in 2021, from 60.0% in 2020. The public debt is expected to remain elevated following tightened global financial condition due to policy rates increase in the developed economies. Additionally, many countries are providing subsidies in order to mitigate inflationary pressures which could worsen public finance, increase public debt and weigh down on debt sustainability.
Currency Performance
All the select currencies depreciated against the US Dollar in H1’2022 as compared to H1’2021 where most currencies recovered following a sharp depreciation in 2020. The continued depreciation of the currencies in Sub-Saharan Africa is attributable to the increased inflationary pressures in many countries in the region given the effects of Russia’s invasion of Ukraine on commodity prices and supply chains. The Ghanaian Cedi was the worst performer in H1’2022 having depreciated by 29.1% on YTD. The performance is attributable to a deteriorating macroeconomic environment, amid increasing concerns over public debt sustainability with the public debt to GDP ratio reaching 81.8% in 2021 and is projected to rise further to 84.6% in 2022, coupled with affirmation of a negative outlook by Fitch ratings in May 2022. The Kenya Shilling depreciated by 4.1% in H1’2022 to close at Kshs 117.8 against the US Dollar, compared to Kshs 113.2 recorded at the beginning of the year. Below is a table showing the performance of select Sub-Saharan African currencies:
|
Select Sub Saharan Africa Currency Performance vs USD |
|||||
|
Currency |
Jun-21 |
Jan-22 |
Jun-22 |
Last 12 Months change (%) |
YTD change (%) |
|
Nigerian Naira |
410.5 |
412.4 |
415.1 |
(1.1%) |
(0.6%) |
|
South African Rand |
14.3 |
15.9 |
16.0 |
(12.1%) |
(0.9%) |
|
Tanzanian Shilling |
2319 |
2,304.5 |
2,330.5 |
(0.5%) |
(1.1%) |
|
Zambian Kwacha |
22.6 |
16.7 |
17.2 |
24.0% |
(2.6%) |
|
Mauritius Rupee |
42.7 |
43.6 |
45.0 |
(5.3%) |
(3.1%) |
|
Botswana Pula |
10.8 |
11.7 |
12.2 |
(12.8%) |
(3.8%) |
|
Kenyan Shilling |
107.9 |
113.2 |
117.8 |
(9.2%) |
(4.1%) |
|
Ugandan Shilling |
3556.8 |
3,544.6 |
3,749.5 |
(5.4%) |
(5.8%) |
|
Malawian Kwacha |
805.8 |
816.8 |
1,019.5 |
(26.5%) |
(24.8%) |
|
Ghanaian Cedi |
5.8 |
6.1 |
7.9 |
(35.9%) |
(29.1%) |
Source: S&P Capital
African Eurobonds:
During H1’2022, Africa Eurobonds recorded reduced activity with the latest issuers being Nigeria and Angola who raised USD 1. 3 bn and USD 1.8 bn in March and April 2022, respectively. The Africa’s appetite for foreign-denominated debt has been slowed down by pressures arising from the Russia-Ukraine tension and concerns around global interest rate hikes as a result of increasing inflationary pressures across most developed and developing countries.
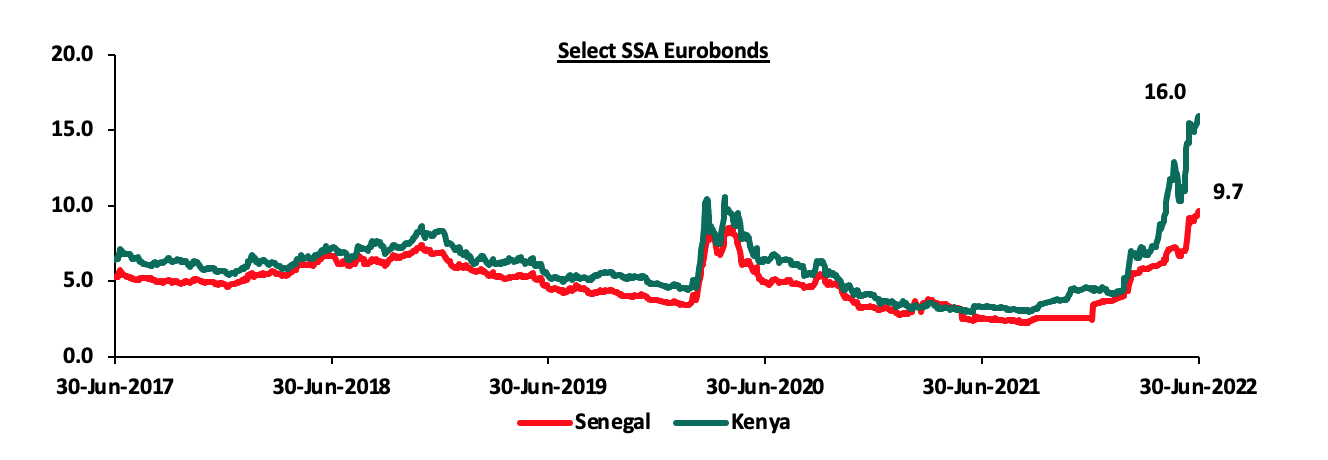
Yields on African Eurobonds increased significantly in H1’2022 partly attributable to investors attaching higher risk premium on the Sub-Saharan region and other emerging markets due to perceived higher risks arising from increasing inflationary pressures and local currency depreciation. The increase in Eurobond yields come on the back of inflationary pressures and local currency depreciation that has worsened the existing supply chain constraints. Yields on the Kenyan and Senegal Eurobonds increased in H1’2022 by 11.6% points and 7.3% points to 16.0% and 9.7%, from 4.4% and 2.4%, respectively, recorded at the end of December 2021. Key to note, Kenya cancelled the issuance of Kshs 115.0 bn Eurobond in June 2022 due to the elevated yields.
Below is a 5-year graph showing the Eurobond secondary market performance of select 10-year Eurobonds issued by the respective countries:
Equities Market Performance
Sub-Saharan Africa (SSA) stock markets recorded mixed performance in H1’2022, with Nigeria’s NGSEASI being the best performing market gaining by 19.6% attributable to the increased foreign investor sentiments amid rising of commodity prices. Kenya’s NASI was the worst-performing market with a loss of 32.5%, partly attributable to a deterioration in the business environment following uncertainties around the upcoming general election. Below is a summary of the performance of key indices:
|
Equities Market Performance (Dollarized*) |
||||||
|
Country |
Index |
Jun-21 |
Jan-22 |
Jun-22 |
Last 12 Months change (%) |
YTD change (%) |
|
Nigeria |
NGSEASI |
91.6 |
104.1 |
124.5 |
35.9% |
19.6% |
|
Zambia |
LASILZ |
205.5 |
362.2 |
398.6 |
94.0% |
10.1% |
|
Rwanda |
RSEASI |
0.1 |
0.1 |
0.1 |
(2.2%) |
0.02% |
|
Tanzania |
DARSDSEI |
0.6 |
0.6 |
0.6 |
(5.0%) |
(6.4%) |
|
South Africa |
JALSH |
4,682.5 |
4,639.6 |
4,197.9 |
(10.3%) |
(9.5%) |
|
Uganda |
USEASI |
0.4 |
0.4 |
0.3 |
(27.7%) |
(23.5%) |
|
Ghana |
GGSECI |
455.8 |
454.6 |
318.1 |
(30.2%) |
(30.0%) |
|
Kenya |
NASI |
1.6 |
1.5 |
1.0 |
(37.3%) |
(32.5%) |
|
*The index values are dollarized for ease of comparison |
||||||
Source: S&P Capital
GDP growth in Sub-Saharan Africa region is expected to record slow growth, in line with the rest of the global economy. Additionally, some of the countries are suffering from high debt levels that increased to 61.0% of GDP in 2021, from 60.0% of GDP in 2020 making them less attractive to foreign capital. The significant weakening of the currencies has made debt service also become more costly.
According to the Kenya National Bureau of Statistics (KNBS) Q1’2022 Quarterly GDP Report the Kenyan economy recorded a 6.8% expansion in Q1’2022, up from the 2.7% growth recorded in Q1’2021. The performance was bolstered by rebounds in most economic activities, which had contracted significantly in the Q1’2021 as a result of COVID-19 control measures. The Kenyan Economy is projected to grow at an average of 5.1% in 2022 according to various organizations as shown below:
|
No. |
Organization |
2022 Projections |
|
|
International Monetary Fund |
5.7% |
|
|
National Treasury |
6.0% |
|
|
World Bank |
5.5% |
|
|
S&P Global |
4.4% |
|
|
Cytonn Investments Management PLC |
4.0% |
|
Average |
5.1% |
|
Source: Cytonn Research
The growth will largely be supported by the gradual recovery of the economic environment as well as continued vaccine inoculation. However, risks lie on the downside on the economic outlook mainly due to;
- The persistent geopolitical pressures occasioned by the Russian-Ukrainian war which has seen increased inflationary pressures,
- Persistent supply chain constraints which have led to the rise of commodity prices,
- The resurgence of COVID-19 infections in the country and the country’s trading partners, and,
- Uncertainties surrounding the upcoming August 2022 elections which could lead to economic disruptions.
Key to note, Kenya’s general business environment has continued to deteriorate with the average Purchasing Manager’s Index for the first five months of 2022 standing at 49.7 mainly on the back of increased commodity prices which have seen reduced consumer spending.
Inflation:
The average inflation rate increased to 6.3% in H1’2022, compared to 5.9% in H1’2021, attributable to 13.8% and 7.1% year on year increases in food and oil prices, respectively, in H1’2022. Notably, the price of super petrol, diesel and kerosene have increased by 22.7%, 26.6% and 23.6% to Kshs 159.2 per litre, Kshs 140.0 per litre and Kshs 127.9, from Kshs 129.7 per litre, Kshs 110.6 per litre and Kshs 103.5 per litre, year to date. Inflation for the month of June 2022 came in at 7.9%, the highest since August 2017, and an increase from the 7.1% recorded in May, attributable to a 1.2%, 1.5% and 0.9% increase in the food and non-alcoholic beverages index, household and equipment as well as the transport index. The June 2022 y/y inflation rate is the highest since August 2017. Below is the inflation chart for the last five years:
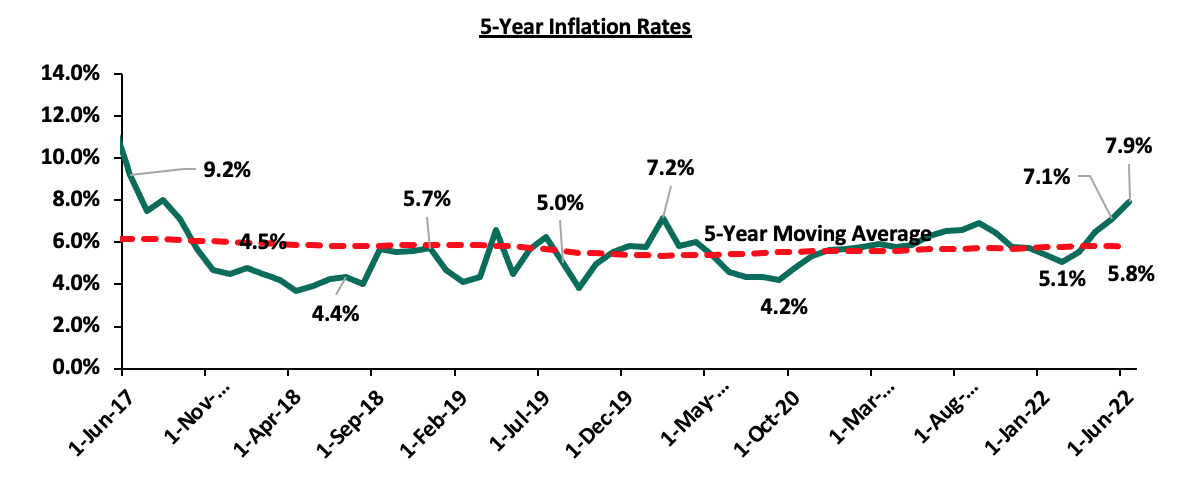
For the first time in five years, Kenya’s inflation has surpassed the government’s target range of 2.5% - 7.5%, despite efforts by the Monetary Policy Committee (MPC) to contain the rise by raising the Central Bank Rate (CBR) to 7.5%. The increase is largely attributable to the increase in food and fuel prices amid supply chain constraints coupled with a depreciating currency. This comes at a time, when the government expected a USD 244.0 mn (Kshs 28.8 bn) approval from the International Monetary Fund (IMF) under the Extended Credit Facility (ECF) and the Extended Fund Facility (EFF) arrangement whose one of the requirements is that inflation remains within the government range. Going forward, we expect inflationary pressures to remain elevated on the back of rising fuel prices and consequently an increase in the rise of basic commodities given that fuel is a major input in most sectors. Additionally, the National Treasury has indicated that the fuel subsidy under the Petroleum Development Fund is inefficient and is likely to adjust the fuel prices upwards with a view of eliminating the fuel subsidy in the FY’2022/2023. The move is expected to increase inflationary pressures even further as fuel is a major input to the inflation basket and consequently put more pressure on the government to raise the CBR. However, we believe that the fiscal stance is likely to have minimal impact on inflation given that the rise is primarily due to external shocks and is largely pegged on how soon supply chains stabilize.
The Kenyan Shilling:
The Kenyan Shilling depreciated against the US Dollar by 4.1% in H1’2022, to close at Kshs 117.8, from Kshs 113.1 at the end of Q4’2021, partly attributable to increased dollar demand in the energy, oil and manufacturing sectors. Key to note, this is the lowest the Kenyan shilling has ever depreciated against the dollar. During the week, the Kenya Shilling depreciated against the US Dollar by 0.2% to close at 117.9, from 117.7 the previous week. We expect the shilling to remain under pressure in 2022 as a result of:
- Continued rise in global crude oil prices on the back of persistent supply chain bottlenecks further exacerbated by the Russian-Ukrainian geopolitical pressures at a time when demand is picking up with the easing of COVID-19 restrictions and as economies reopen. Key to note, risks abound the recovery following the resurgence of COVID-19 infections in the country,
- Increased demand from merchandise traders as they beef up their hard currency positions in anticipation for more trading partners reopening their economies globally,
- An ever-present current account deficit due to an imbalance between imports and exports, with Kenya’s current account deficit estimated to come in at 5.1% of GDP in the 12 months to April 2022 compared to the 4.8% for a similar period in 2021. The wider deficit reflects a higher import bill, particularly for oil, which more than offset increased receipts from agricultural and services exports, and remittances, and,
- The aggressively growing government debt, with Kenya’s public debt having increased at a 10-year CAGR of 19.8% to Kshs 8.5 tn in April 2022, from Kshs 1.4 tn in April 2011 thus putting pressure on forex reserves to service some of the public debt. It is worth noting that the average GDP growth over the same period has been 3.9%, an indicator that the increase in debt is not translating into GDP growth.
The shilling is however expected to be supported by:
- High Forex reserves currently at USD 8.0 bn (equivalent to 4.7-months of import cover), which is above the statutory requirement of maintaining at least 4.0-months of import cover, and the EAC region’s convergence criteria of 4.5-months of import cover. In addition, the reserves were boosted by the USD 750.0 mn World Bank loan facility received in March 2022 and are expected to be boosted further by the expected USD 244.0 mn from the International Monetary Fund (IMF), and,
- Improving diaspora remittances evidenced by a 7.6% y/y increase to USD 339.7 mn as of May 2022, from USD 315.8 mn recorded over the same period in 2021 which has continued to cushion the shilling against further depreciation. In the May 2022 diaspora remittances figures, North America remained the largest source of remittances to Kenya accounting for 59.9% in the period, followed by Europe at 17.8% while the rest of the world accounted for 22.3% of the total.
Monetary Policy:
The Monetary Policy Committee (MPC) met thrice in H1’2022 and for the first time since April 2020, increased the Central Bank Rate by 50.0 bps to 7.5% from 7.0%, in the third sitting in May 2022. The MPC noted that there was a scope for tightening of the monetary policy given the high rate of inflation which was expected to continue increasing on the back of rising global fuel and commodity prices. The Committee will meet again in July 2022, but remains ready to re-convene earlier if necessary.
Fiscal Policy:
The total Kenyan budget for the FY’2022/2023 is projected to increase by 10.3% to Kshs 3.3 tn from the Kshs 3.0 tn in FY’2021/2022 while the total revenue is set to increase by 20.0% to Kshs 2.4 tn from the Kshs 2.0 tn in FY’2021/2022. The increase is mainly due to a 25.4% increase in ordinary revenue to Kshs 2.1 tn for FY’2022/2023, from the Kshs 1.8 tn in FY’2021/22 with the increase largely depended on the continued economic recovery. However, risks abound the projection mainly on the back of uncertainties surrounding the resurgence of COVID-19 infections as well as the August 2022 elections that could disrupt the economic environment. For more information, see our note on Kenya’s FY’2022/2023 Budget Review.
For the FY’2021/2022, we expect the government to meet its revenue collection target having collected Kshs 1,718.7 bn, equivalent to 95.0% of the revised estimates of Kshs 1,808.3 bn for FY’2021/2022 and 103.7% of the prorated estimates of Kshs 1,657.6 bn in the first eleven months of FY’2021/2022. Notably, the total expenditure amounted to Kshs 2,636.6 bn, equivalent to 80.4% of the revised estimates of Kshs 3,279.8 bn, and 87.7% of the prorated expenditure estimates of Kshs 3,006.5 bn, an indication of modest spending by the government. The total borrowings as at the end of May 2022 amounted to Kshs 955.7 bn, equivalent to 66.3% of the revised estimates of Kshs 1,441.1 bn and 72.3% of the prorated estimates of Kshs 1,321.0 bn.
Going forward, we expect the government to implement additional initiatives to help maintain the current trend of meeting revenue collection targets.
Weekly Highlights:
- Q1’2022 GDP Growth
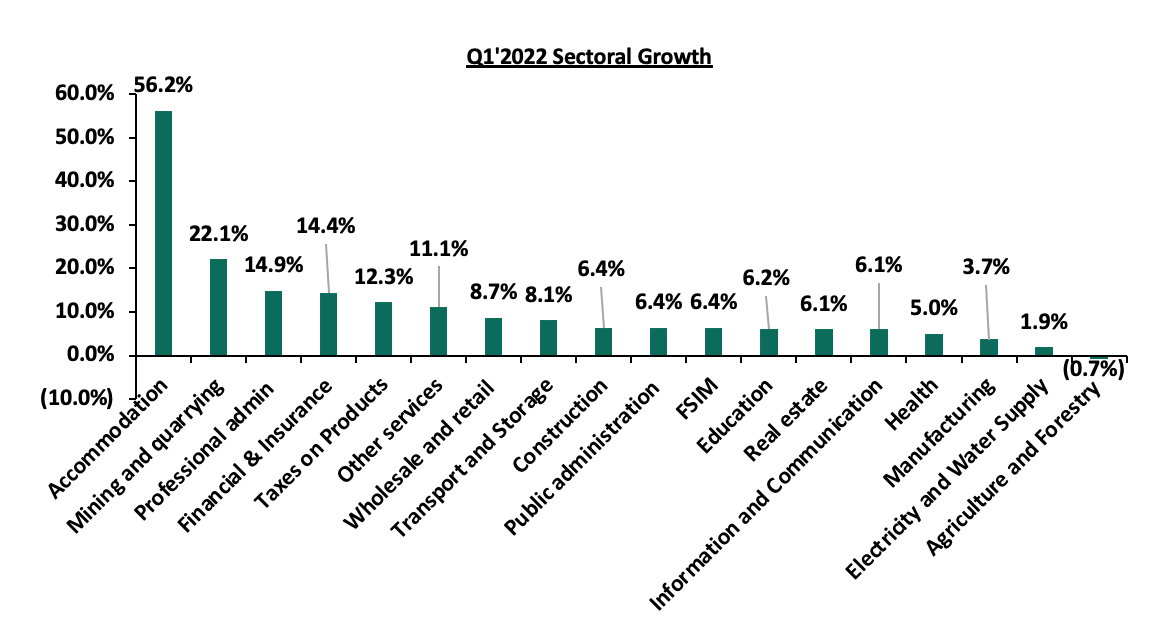
The Kenya National Bureau of Statistics (KNBS) released the Quarterly Gross Domestic Product Report, highlighting that the Kenyan economy recorded a 6.8% growth in Q1’2022, up from the 2.7% growth recorded n Q1’2022, pointing towards continued economic recovery. The performance was largely supported by rebounds in most economic activities, with significant growth being recorded in sectors like transportation and storage (8.1%), accommodation and Food Serving activities (56.2%) as well as Professional, administrative and Support Services (14.9%) among others. The key take-outs from the report include;
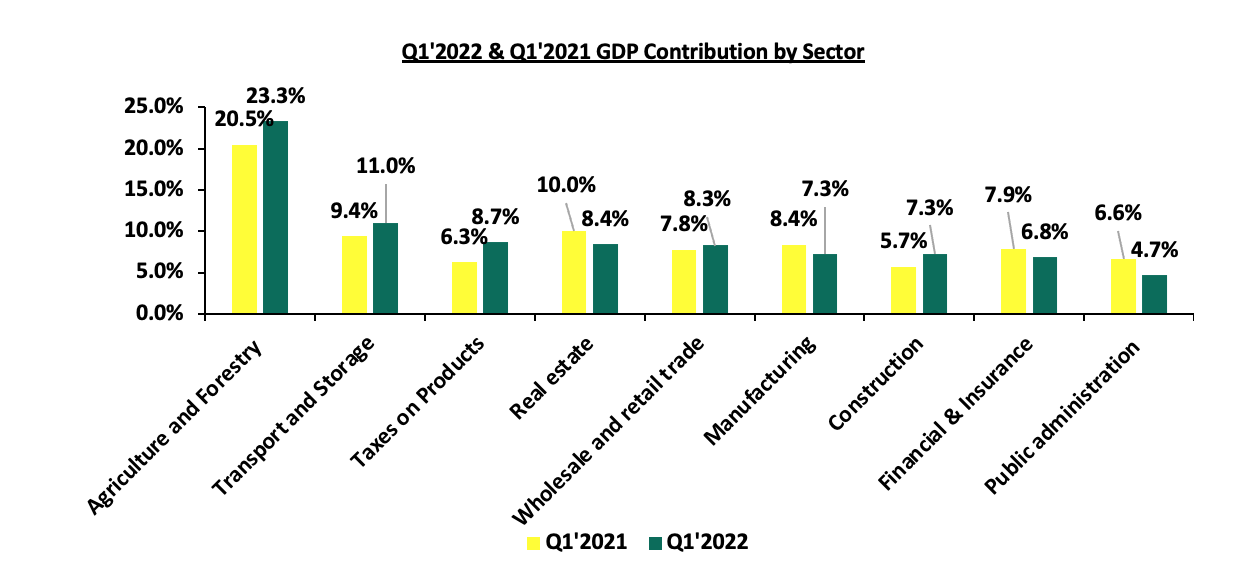
- Sectoral Contribution to Growth - The biggest gainer in terms of sectoral contribution to GDP was agriculture, increasing by 2.8% points to 23.3% from 20.5% Q1’2021, while public administration was the biggest loser, declining by 1.9% points to 4.7% in Q1’2022, from 6.6% in Q1’2021. The accommodation and food services sector recorded the highest growth rate in Q1’2022 growing by 56.2% compared to the 33.3% contraction recorded in Q1’2021 mainly attributable to the relaxation of most COVID – 19 travel and other restrictions which saw activity in the sector increase. The chart below shows the top contributors to GDP by sector in Q1’2022:
Source: KNBS Q1’2022 and Q1’2021 GDP Report
- Continued subdued Growth in the Agricultural Sector – Agriculture, Forestry and Fishing activities recorded a decline of 0.7% in Q1’2022 compared to a 0.4% growth in Q1’2021. The contraction during the quarters was primarily attributed to lower rainfall in Q4’2021, as well as the delayed onset of rains during the quarter under review, resulting to lower agricultural production. The sector's poor performance was reflected by declines recorded in horticultural exports and tea production. However, increased production of cane, milk, and coffee cushioned the sector from a deeper slump,
- Gradual growth in the manufacturing sector - The manufacturing sector reported a growth of 3.7% in Q1’2022 compared to a 2.1% growth in a similar period of review in 2021, mainly supported by a 6.4% growth in the food sector. However, the sectoral contribution declined by 1.1% points to 6.8%, from 7.9% in Q1’2021, and,
- Rebound in the Accommodation and Food services sector- The sector recorded 56.2% growth in Q1’2022 compared to a 33.3% contraction recorded in Q1’2021, attributable to the relaxation of COVID-19 containment restrictions on the back of a positive vaccine rollout. Additionally, the sectoral contribution increased to 1.0% from 0.5% recorded in Q1’2021. The chart below shows the different sectoral GDP growth rates for Q1’2022:
Source: KNBS Q1’2022 GDP Report
According to the National Treasury, the Kenyan economy is expected to grow by 6.0% in 2022 supported by recovery in the agriculture and service sectors. However, we note that the agricultural sector remains subdued largely due to erratic weather conditions and constrained supply of products such as fertilizers. Going forward, we expect Kenya’s GDP to continue growing in tandem with the global economy supported by recovery in sectors like accommodation and food services sector, manufacturing and retail. On the downside, concerns remain elevated on the resurgence of COVID-19 infections and the upcoming August elections.
- Kenya Q1’2022 Balance of Payments
The Kenya National Bureau of Statistics released the Quarterly Balance of Payments report for Q1’2022 report highlighting that Kenya’s balance of payments deteriorated in Q1’2022, coming in at a deficit of Kshs 120.6 bn, from a deficit of Kshs 25.3 bn in Q1’2021. The performance was mainly attributable to the 186.0% decline in the financial account balance. The deterioration was however mitigated by a 39.7% contraction of the current account deficit to Kshs 95.0 bn, from Kshs 157.5 bn in Q1’2021. The table below shows the breakdown of the various balance of payments components, comparing Q1’2022 and Q1’2021:
|
Q1’2022 Balance of Payments |
|||
|
Item |
Q1'2021 |
Q1'2022 |
% Change |
|
Current Account Balance |
(157.5) |
(95.0) |
(39.7%) |
|
Capital Account Balance |
2.2 |
7.4 |
228.8% |
|
Financial Account Balance |
107.3 |
92.2 |
(186.0%) |
|
Net Errors and Omissions |
17.0 |
(125.2) |
(838.5%) |
|
Balance of Payments |
(25.3) |
(120.6) |
376.9% |
All values in Kshs bns
Key take-outs from the table include;
- The current account deficit (value of goods and services imported exceeds the value of those exported) contracted by 39.7% to Kshs 95.0 bn, from Kshs 157.5 bn in Q1’2021, mainly attributable to 19.2% increase in the secondary income balance to Kshs 184.1 bn, from Kshs 154.5 bn recorded in Q1’2020,
- The financial account balance (the difference between the foreign assets purchased by domestic buyers and the domestic assets purchased by the foreign buyers) declined by 186.0% to a surplus of Kshs 92.2 bn, from a surplus of Kshs 107.3 bn in Q1’2021. On the other hand, the stock of gross official reserves increased by 14.3% to stand at Kshs 969.3 bn, from 847.8 bn in Q1’2021, and,
- Consequently, the Balance of Payments (BoP) position deteriorated to a deficit of Kshs 120.6 bn from a deficit of Kshs 25.3 bn in Q1’2021, mainly due to the 186.0% decline in the financial account balance.
During the period of review, the Kenya shilling remained under pressure, depreciating by 5.0% y/y to close the quarter at Kshs 115.0, from Kshs 109.5 at the end of Q1’2021. However, the shilling was supported by the sufficient forex reserves held by the Central Bank of Kenya which increased by 6.8% in the same period to close the quarter at USD 7.8 bn, from USD 7.3 bn recorded at the end of Q1’2021. We expect modest recovery in most sectors of the economy in 2022 including the tourism sector which will consequently support the country’s forex reserves. However, the recovery is largely determined by the stability of the global economy as well as the vaccine rollout in the country.
- Finance Act 2022
The Cabinet Secretary for the National Treasury tabled the Finance Bill 2022 on 13th April 2022 to the parliament for discussion and was assented into law by the President of Kenya on 22nd June 2022. As highlighted in our Cytonn Weekly #15/2022, the proposed tax measures in the Finance Bill 2022, were expected to add Kshs 50.4 bn to the exchequer for the fiscal year 2022/23. After discussion and consideration by the parliament, some of the proposals were approved, some rejected and some amended. Below, we highlight the key tax changes in the assented Finance Act as a follow up to our previous highlight;
Under the Income Tax Act;
- The Finance Bill 2022 proposal to increase digital service tax (DST) to 3.0% from the current 1.5% was rejected by the parliament. However, the proposal to exempt non-resident entities with a permanent establishment in Kenya from DST was approved.We expect the products and services offered by digital platforms to continue supporting small business growth at an affordable price. We also expect to see more firms enter the market as this is a welcoming move,
- The Finance bill proposal to increase the Capital Gains Tax (CGT) on transfer or sale of property by an individual or company to 15.0% from the current 5.0% was approved. The bill however, provides an exemption for firms that are certified by the Nairobi International Financial Center Authority, highlighting that the applicable rate on the transfer of an investment shall be the prevailing rate at the time the investment was made if (i) the firm invests Kshs 5.0 bn in Kenya, and, (ii) the transfer of such investment is made after five years. Additionally, the proposal to tax gains from financial derivatives for foreigners under the CGT rate of 15.0% was also approved. However, gains arising from financial derivatives that are traded at the Nairobi Securities Exchange will be exempted.
We expect an increase in the price of property as the move is expected to result in increased dealing and transaction costs. In the financial derivatives market, we expect an even slower uptake with the introduction of the policy,
Under the Excise Duty Act;
- The Finance Bill proposal to empower the Kenya Revenue Authority’s Commissioner General to exempt specific excisable products from the annual inflation adjustments depending on the economic circumstances in the relevant year was approved. However, the Commissioner General has to seek approval from the cabinet secretary.
We expect that this provision will allow the Commissioner General to exempt critical products like fuel from inflationary adjustment particularly for periods when fuel prices are high, in order to prevent further increase in the cost of living, - The Finance Bill 2022 proposal to increase excise duty on various goods such as non-alcoholic beverages, cosmetic and beauty products, powdered beer and spirits, among others was approved. We expect the contribution of excise duty tax to total tax revenue to increase from the current 13.8% as estimated for the Fiscal Year 2022/2023 in the Budget Statement and consequently aid in narrowing the gap between revenues and expenditure, and,
- The Finance Bill proposal to add various goods such as hatching eggs imported by licensed hatcheries, neutral spirits imported by registered pharmaceutical manufacturers and locally manufactured passenger motor vehicles to the list of tax-exempt items was approved by the parliament.
We expect the policy to aid in boosting the manufacturing and health sectors which are part of the big four agenda. On the downside, we expect the policy to have a negative effect on the total excise duty collected.
Under the Value Added Tax Act;
- The Finance Bill 2022 proposal to remove maize flour, cassava flour, wheat and meslin flour from the list of tax-exempt goods under the Second Schedule to the Value Added Tax (VAT) Act 2013 was rejected.
With items like maize flour being a staple meal in Kenyan households, we expect reduced pressure on the cost of living as well as the inflation basket given that food is a headline contributor to Kenya’s inflation.
Overall, we expect the adoption of the Finance Act 2022 will result in an upward adjustment to the Excise Duty Tax, Income Tax, and Value Added Tax, thereby increasing revenue collection. However, we are of the view that the Kenya Revenue Authority should consider more ways to broaden the tax base in order to ensure that the increased taxes do not burden taxpayers and that we reduce our reliance on debt.
Money Markets, T-Bills Primary Auction:
During the first half of 2022, T-bills were undersubscribed, with the overall subscription rate coming in at 89.3%, down from 109.7% in H1’2021, as investors shifted their interest to the bond market, where the longer-term offered higher yields and recorded an over-subscription of 106.8% in H1’2022. Overall subscriptions for the 91-day, 182-day, and 364-day papers came in at 109.0%, 69.0% and 101.7% in H1’2021, from 87.8%, 58.5% and 167.9% in H1’2021, respectively, with investors’ participation skewed towards the 91-day paper. The average yields on the 364-day, 182-day and 91-day papers increased by 80.8 bps, 63.0 bps and 44.2 bps to 9.7%, 8.4% and 7.5% in H1’2022, from 8.9%, 7.7% and 7.0%, respectively, in H1’2021. The acceptance rate increased to 92.7%, in H1’2022 from 79.7% in H1’2021, with the government accepting a total of Kshs 496.7 bn out of the Kshs 535.9 bn worth of bids received.
During the week, T-bills remained undersubscribed with the overall subscription rate coming in at 37.1 %, from 88.3% recorded the previous week. The undersubscription was partly attributable to the tightened liquidity in the money market with the average interbank rates increasing to 5.3%, from the 5.2% recorded the previous week. The 91-day paper recorded the highest subscription rate, receiving bids worth Kshs 4.7 bn against the offered Kshs 4.0 bn, translating to a subscription rate of 118.2%, a decrease from the 201.4% recorded the previous week. The continued preference for the 91-day paper is partly attributable to investors’ preference for the shorter-dated paper as they seek to avoid duration risk. The subscription rate for the 364-day and 182-day papers declined to 24.4% and 17.5%, from 82.9% and 48.5%, respectively, recorded the previous week. The yields on the government papers continued to increase, with the yields on the 364-day, 182-day and the 91-day papers increasing by 1.1 bps, 3.3 bps and 17.2 bps to 10.0%, 9.2% and 8.1%, respectively. The continued increase is partly attributable to investors attaching higher risk premium on the country due to perceived higher risks arising from increasing inflationary pressures and local currency depreciation. The government accepted a total of Kshs 7.8 bn worth of bids out of Kshs 8.9 bn bids received, translating to an acceptance rate of 87.7%.
In the Primary bond Market, the government reopened two bonds, namely: FXD2/2013/15 and FXD2/2018/15 with effective tenors of 5.8 years and 11.3 years, respectively, in a bid to raise Kshs 40.0 bn for budgetary support. The coupon rates for the bonds are 12.0% for FXD2/2013/15 and 12.8% for FXD2/2018/15. We expect investors to prefer the longer dated paper as they search for higher yields. The bonds are currently trading in the secondary market at yields of 12.6% and 13.7%, for FXD2/2013/15 and FXD2/2018/15, respectively, as such, our recommended bidding ranges for the two bonds are: 12.4%-12.8% for FXD2/2013/15 and 13.5%-13.9% for FXD3/2018/15. The period of sale runs until 19th July 2022.
In addition to the re-opened bonds, the government issued a tap sale for an infrastructure bond, IFB1/2022/18 with an effective tenor of 18.0 years and a coupon rate of 13.7%. The tap sale seeks to raise Kshs 20.0 bn for budgetary support, with the initial offer having attempted to raise Kshs 75.0 bn. The initial offer recorded an oversubscription of 101.8% but the government accepted only Kshs 73.8 bn, out of the Kshs 76.4 bn worth of bids received, translating to an acceptance rate of 96.6%. The bond is currently trading in the secondary market at a rate of 13.6% and the period of sale runs until Thursday, 7th July 2022 or upon attainment of quantum, whichever comes first.
Primary T-Bond Auctions in H1’2022
During H1’2022, the Government issued five new bonds, reopened seven and issued seven bonds on tap-sale seeking to raise Kshs 456.5 bn. The bonds were generally oversubscribed receiving bids worth Kshs 487.6 bn translating to an overall subscription rate of 106.8%. The government was keen to maintain low rates only accepting Kshs 406.2 bn. The table below provides more details on the bonds issued during the period:
|
Issue Date |
Bond Auctioned |
Tenor to Maturity (Years) |
Coupon |
Amount offered (Kshs bn) |
Actual Amount Raised (Kshs bn) |
Total bids received |
Average Accepted Yield |
Subscription Rate |
Acceptance Rate |
|
10/1/2022 |
FXD1/2020/005 |
3.4 |
11.7% |
30.0 |
27.4 |
28.4 |
13.8% |
94.6% |
96.6% |
|
24/1/2022 |
FXD1/2022/03 |
7.0 |
12.5% |
30.0 |
34.9 |
38.4 |
11.8% |
128.0% |
90.9% |
|
FXD1/2021/15 |
19.7 |
13.4% |
13.9% |
||||||
|
13/6/2022 |
IFB1/2022/18 |
19.0 |
13.0% |
75.0 |
98.6 |
132.3 |
13.0% |
176.3% |
74.6% |
|
14/3/2022 |
FXD1/2021/05 |
4.7 |
11.3% |
50.0 |
18.5 |
40.9 |
12.0% |
81.9% |
45.1% |
|
FXD1/2020/15 |
12.9 |
12.8% |
13.7% |
||||||
|
FXD1/2021/25 |
24.2 |
13.9% |
14.0% |
||||||
|
18/3/2022 |
FXD1/2021/05 - Tapsale |
4.7 |
11.3% |
31.5 |
23.9 |
24.9 |
12.0% |
79.0% |
95.9% |
|
FXD1/2020/15 - Tapsale |
12.9 |
12.8% |
13.7% |
||||||
|
FXD1/2021/25 -Tapsale |
24.2 |
13.9% |
14.0% |
||||||
|
11/4/2022 |
FXD1/2022/03 |
3.0 |
11.8% |
40.0 |
33.1 |
34.0 |
11.8% |
85.1% |
97.3% |
|
FXD1/2022/15 |
15.0 |
13.9% |
30.0 |
27.6 |
32.5 |
13.9% |
108.5% |
84.9% |
|
|
16/5/2022 |
FXD1/2022/10 |
10.0 |
13.5% |
60.0 |
31.7 |
43.12 |
13.5% |
71.9% |
73.6% |
|
FXD1/2021/25 |
24.1 |
13.9% |
14.0% |
||||||
|
23/5/2022 |
FXD1/2022/10 - Tapsale |
10.0 |
13.5% |
10.0 |
17.0 |
17.0 |
13.5% |
170.0% |
100.1% |
|
FXD1/2021/25 -Tapsale |
24.1 |
13.9% |
13.9% |
||||||
|
13/06/2022 |
IFB1/2022/018 |
18.0 |
13.7% |
75.0 |
73.8 |
76.4 |
13.7% |
101.8% |
96.6% |
|
11/4/2022 |
FXD1/2022/03 - Tap Sale |
3.0 |
11.8% |
25.0 |
19.6 |
19.61 |
11.8% |
78.4% |
99.9% |
|
25/4/2022 |
FXD1/2022/15 - Tap Sale |
15.0 |
13.9% |
13.9% |
|||||
|
H1'2022 Average |
13.4 |
13.0% |
41.5 |
36.9 |
44.3 |
13.3% |
106.8% |
86.9% |
|
|
H1'2021 Average |
13.6 |
12.4% |
37.00 |
24.7 |
33.7 |
12.6% |
150.0% |
77.9% |
|
Secondary Bond Market Activity:
- Bond Turnover:
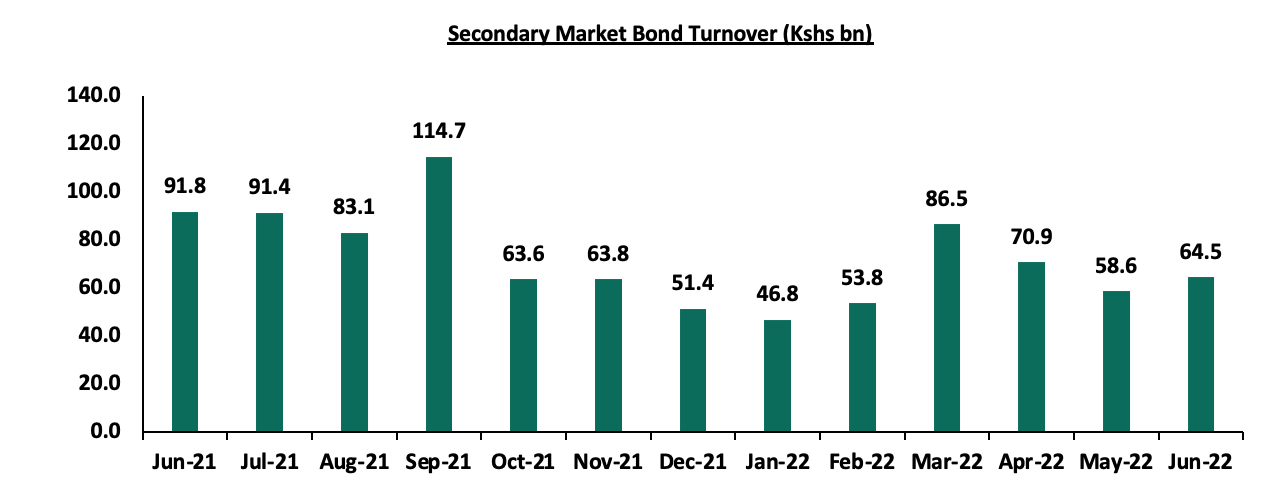
The secondary bond market recorded decreased activity, with the turnover decreasing by 15.5% to Kshs 381.1 bn, from Kshs 451.0 bn in H1’2021, partially attributable to local institutional investors decreasing their allocation to treasury bonds as most of them increased lending to the private sector. The chart below shows the bonds turnover over the last one year;
- Yield Curve:
During H1’2022, the yield curve was on an upward trajectory, with a notable increase in the yields on all the bonds, leading to a 1.4% decline in the FTSE bond index. The chart below shows the yield curve movement during H1’2022: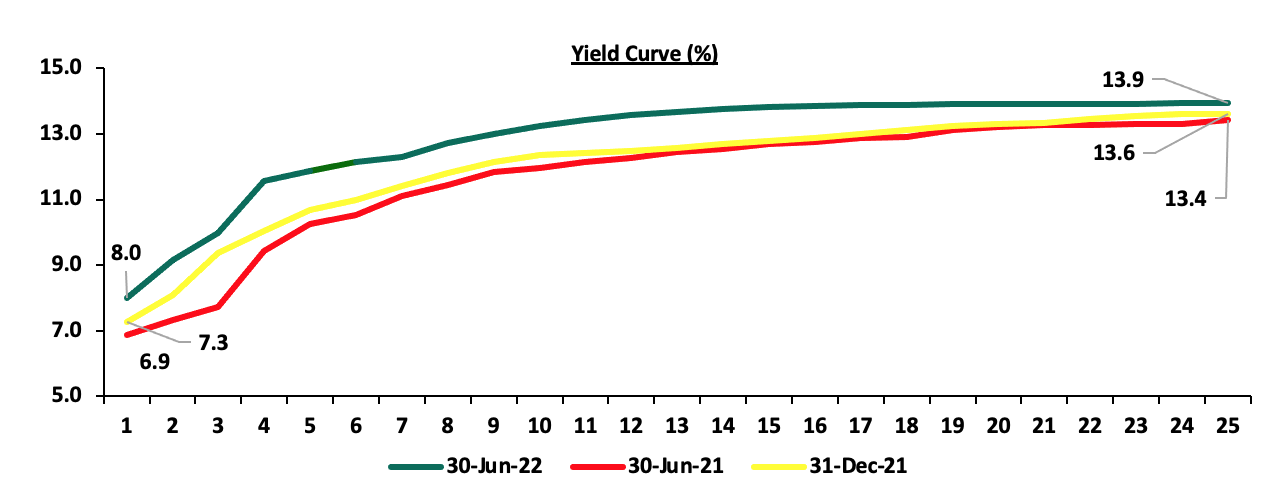
Money Market Performance
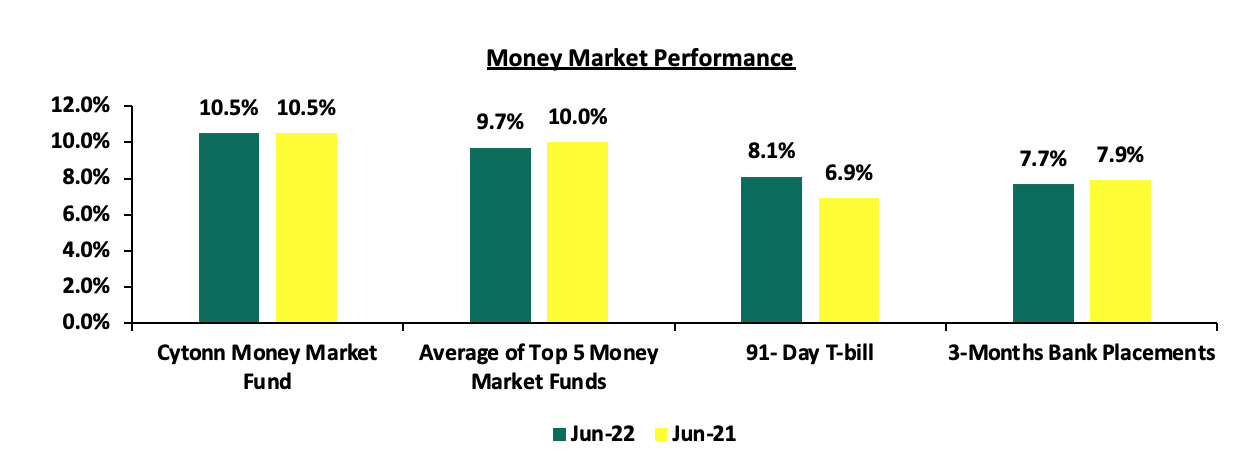
The 3-month bank placements recorded 7.7% as at the end of H1’2022, 0.2% points lower than the 7.9% recorded at the end of H1’2021 (based on what we have been offered by various banks). The average 91-day T-bill rate increased by 1.2% points to 8.1% in H1’2022 from 6.9% in H1’2021, while the average of Top 5 Money Market Funds declined by 0.3% points to 9.7% from 10.0% in H1’2021. The yield on the Cytonn Money Market (CMMF) remained relatively unchanged at 10.5% in H1’2022, as was recorded in H1’2021.
During the week, 3-month bank placements ended the week at 7.7% (based on what we have been offered by various banks), while the yield on the 91-day T-bill increased by 0.2% points to 8.1%. The average yield of the Top 5 Money Market Funds and the Cytonn Money Market Fund remained relatively unchanged at 9.7% and 10.5% respectively, as was recorded last week.
The table below shows the Money Market Fund Yields for Kenyan Fund Managers as published on 1st July 2022:
|
Money Market Fund Yield for Fund Managers as published on 1st July 2022 |
||
|
Rank |
Fund Manager |
Effective Annual Rate |
|
1 |
Cytonn Money Market Fund |
10.5% |
|
2 |
Zimele Money Market Fund |
9.9% |
|
3 |
Sanlam Money Market Fund |
9.6% |
|
4 |
Apollo Money Market Fund |
9.3% |
|
5 |
Nabo Africa Money Market Fund |
9.2% |
|
6 |
Dry Associates Money Market Fund |
9.1% |
|
7 |
Madison Money Market Fund |
9.1% |
|
8 |
Co-op Money Market Fund |
9.0% |
|
9 |
CIC Money Market Fund |
9.0% |
|
10 |
GenCap Hela Imara Money Market Fund |
8.8% |
|
11 |
NCBA Money Market Fund |
8.7% |
|
12 |
Old Mutual Money Market Fund |
8.7% |
|
13 |
ICEA Lion Money Market Fund |
8.7% |
|
14 |
Orient Kasha Money Market Fund |
8.3% |
|
15 |
British-American Money Market Fund |
7.4% |
|
16 |
AA Kenya Shillings Fund |
6.39% |
Source: Business Daily
Liquidity:
In H1’2022, liquidity in the money markets eased, with the average interbank rate coming in at 4.7%, from 4.9% during H1’2021. The eased liquidity in the market was partly attributable to government payments and increased bond inflows as investors sought to take advantage of the high yields. Additionally, the average volumes traded in the interbank market increased by 44.3% to Kshs 15.7 bn, from Kshs 10.9 bn recorded in H1’2021.
During the week, liquidity in the money markets slightly tightened, with the average interbank rate rising to 5.3% from 5.2% recorded the previous week, partly attributable to tax remittances that offset government payments. The average interbank volumes traded increased by 6.9% to Kshs 18.3 bn from Kshs 17.1 bn recorded the previous week.
Kenya Eurobonds:
During H1’2022, the yields on all Eurobonds were on an upward trajectory, partly attributable to investors attaching higher risk premium on the country due to perceived higher risks arising from increasing inflationary pressures, local currency depreciation and the uncertainties surrounding the upcoming elections. In the period under review, the 10-year Eurobond issued in 2014 recorded the highest increase having increased by 13.7% points to 17.0%, from 3.3% recorded in H1’2021.
Similarly, during the week, the yields on all Eurobonds were on an upward trajectory with the 10-year Eurobond issued in 2014 increasing the most by 1.7% points to 17.0%, from 15.3%. The table below shows the summary of the performance of the Kenyan Eurobonds as of 30th June 2022;
|
Kenya Eurobond Performance |
||||||
|
2014 |
2018 |
2019 |
2021 |
|||
|
Date |
10-year issue |
10-year issue |
30-year issue |
7-year issue |
12-year issue |
12-year issue |
|
30-Jun-21 |
3.3% |
5.4% |
7.4% |
4.8% |
6.3% |
6.3% |
|
3-Jan-22 |
4.4% |
8.1% |
8.1% |
5.6% |
6.7% |
6.6% |
|
24-Jun-22 |
15.3% |
13.7% |
12.8% |
14.8% |
13.0% |
11.9% |
|
27-Jun-22 |
15.3% |
13.8% |
13.0% |
15.2% |
13.1% |
12.1% |
|
28-Jun-22 |
15.7% |
13.9% |
13.2% |
15.1% |
13.2% |
12.3% |
|
29-Jun-22 |
16.0% |
14.2% |
13.4% |
15.9% |
13.4% |
12.7% |
|
30-Jun-22 |
17.0% |
14.7% |
13.7% |
16.1% |
13.8% |
12.0% |
|
Weekly Change |
1.7% |
1.0% |
0.9% |
1.3% |
0.8% |
0.1% |
|
Y/Y Change |
13.7% |
9.3% |
6.4% |
11.3% |
7.5% |
5.8% |
|
YTD Change |
12.6% |
6.6% |
5.6% |
10.5% |
7.1% |
5.4% |
Source: Central Bank of Kenya (CBK)
Rates in the Fixed Income market have remained relatively stable due to the relatively ample liquidity in the money market. The government closed FY’2021/2022 5.9% ahead of its Kshs 664.0 bn borrowing target, having borrowed a total of Kshs 703.2 bn. We expect sustained gradual economic recovery as evidenced by the revenue collections of Kshs 1.7 tn during the first eleven months of the current fiscal year, which was equivalent to 103.7% of the prorated revenue collection target. Additionally, despite the projected high budget deficit of 8.1% and the affirmation of the `B+’ rating with negative outlook by Fitch Ratings, we believe that the support from the IMF and World Bank will mean that the interest rate environment will remain stable since the government is not desperate for cash. Owing to this, our view is that investors should be biased towards short-term fixed-income securities to reduce duration risk.
Market Performance:
During Q2’2022, the equities market was on a downward trajectory, with NASI, NSE 25 and NSE 20 declining by 19.8%, 16.8% and 12.1%, respectively, taking their H1’2022 to losses of 25.2%, 21.0% and 15.2% for NASI, NSE 25 and NSE 20 respectively. The equities market performance during the quarter was driven by losses recorded by large caps such as Safaricom, BAT, ABSA Bank and Diamond Trust Bank (DTB-K) of 26.9%, 17.8%, 16.1% and 15.3%, respectively.
Equities turnover declined by 27.3% in H1’2022 to USD 466.0 mn, from USD 641.2 mn in H1’2021. Foreign investors remained net sellers in H1’2022 with a net selling position of USD 105.9 mn, from a net selling position of USD 27.6 mn recorded in H1’2021.
During the week, the equities market was on an upward trajectory with NSE 25, NASI and NSE 20 gaining by 7.2%, 6.6% and 3.1%, respectively, taking their YTD performance to losses of 25.2%, 21.0% and 15.2%, for NASI, NSE 25 and NSE 20, respectively. The equities market performance was mainly driven by gains recorded by large-cap stocks such as EABL, Equity Group, Safaricom and KCB Group of 20.6%, 10.3%, 8.4% and 6.3%, respectively. The gains were however weighed down by losses recorded by BAT, Diamond Trust Bank (DTB-K), Standard Chartered Bank (SCBK) which declined by 1.4%, 1.1% and 0.8%, respectively.
During the week, equities turnover declined by 13.8% to USD 19.4 mn from USD 22.5 mn recorded the previous week, taking the YTD turnover to USD 472.8 mn. Foreign investors remained net sellers, with a net selling position of USD 6.6 mn, from a net selling position of USD 13.6 mn recorded the previous week, taking the YTD net selling position to USD 108.1 mn.
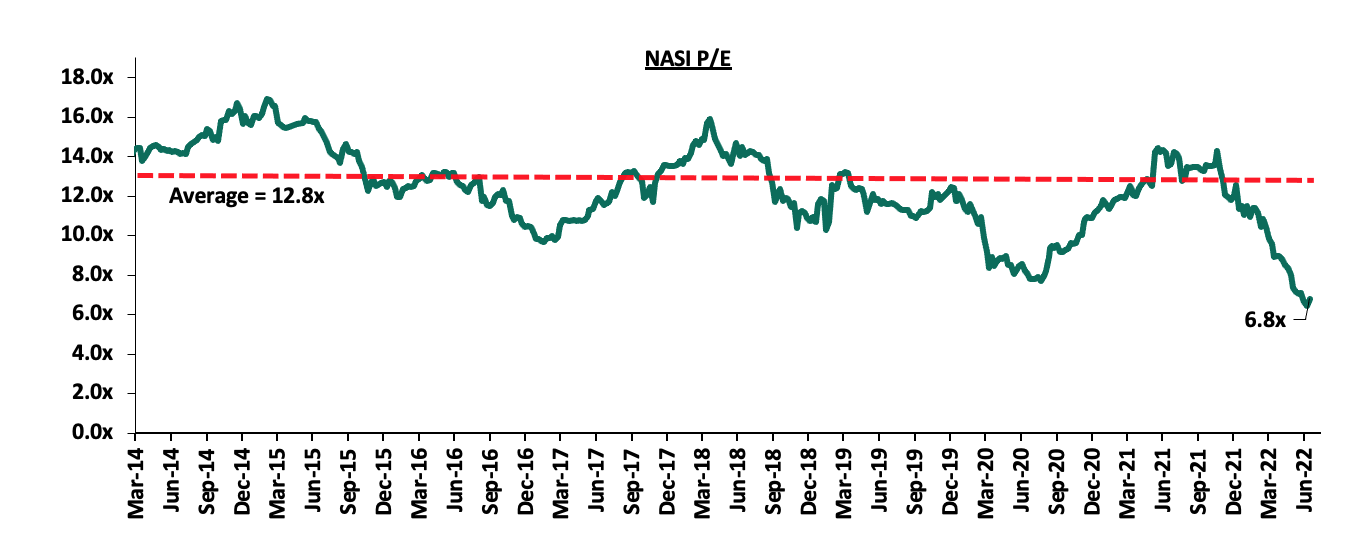
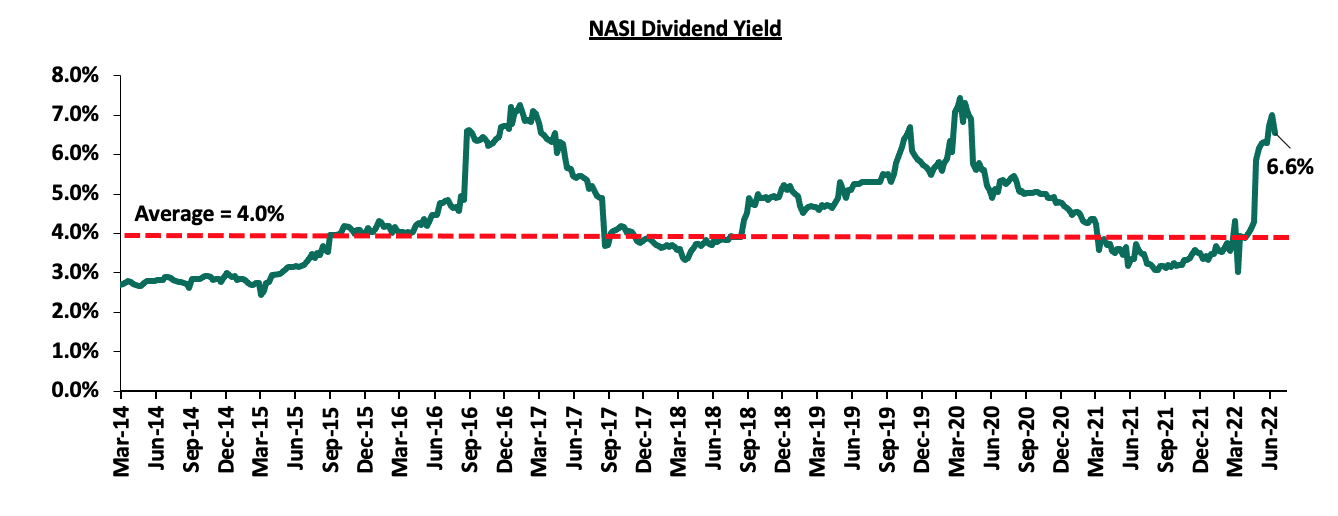
The market is currently trading at a price to earnings ratio (P/E) of 6.8x, 46.8% above the historical average of 12.8x, and a dividend yield of 6.6%, 2.6% points below the historical average of 4.0%. Key to note, NASI’s PEG ratio currently stands at 0.9x, an indication that the market is undervalued relative to its future growth. A PEG ratio greater than 1.0x indicates the market may be overvalued while a PEG ratio less than 1.0x indicates that the market is undervalued.
The charts below indicate the historical P/E and dividend yields of the market;
Listed Banks’ FY’2021 and Q1’2022 Performance
During the first half of 2022, the listed banking sector released their FY’2021 and Q1’2022 results, recording y/y earnings growth of 82.9% and 37.9% in their core EPS in FY’2020 and Q1’2022, respectively. For more information, kindly see our FY’2021 and Q1’2022 Banking Sector Reports.
Key Half-Year Highlights:
During the second quarter of 2022;
- Britam Holdings (the parent company), and Britam Life Assurance (subsidiary), jointly announced that the two firms were finalizing on an agreement to sell their stakes in Equity Group Holdings to the International Finance Corporation (IFC) and the IFC Financial Institutions Growth (FIG) Fund, and expected to finalize the transactions by end of April 2022. Britam Holdings sought to sell 166,390,750 shares in EGH (110,901,488 shares to IFC and 55,489,262 shares to the IFC FIG Fund), constituting 4.4% of EGH’s issued shares, while Britam Life Assurance Company planned to sell 86,719,611 shares (53,620,247 shares to IFC and 33,099,364 shares to the IFC FIG Fund), and constituting 2.3% of EGH’s issued capital. For more information, please see our Cytonn Weekly #14/2022,
- The Insurance Regulatory Authority (IRA), announced that Resolution Insurance Company had been placed under statutory management by the Commissioner of Insurance, following continued challenges by the insurer to meet its obligations such as settling claims to claimants, policyholders and other creditors, coupled with failure to mitigating inherent risks. The regulator appointed the Policyholders Compensation Fund (PCF) as the Statutory Manager of Resolution Insurance Company for a period of 12 months, commencing 5th April 2022, the date at which all existing policies ceased to exist. For more information, please see our Cytonn Weekly #14/2022,
- Equity Group Holdings Plc announced that it has injected USD 100.0 mn (Kshs 11.5 bn) to its subsidiary in the Democratic Republic of Congo (DRC), Equity BCDC, in order to fund development projects as well as large manufacturing and mining companies in the DRC given the country’s diverse and immense natural resources as well as the sectors contribution to economic growth. Notably, the two sectors contribute only 7.0% to the Group’s loan book, thus providing an opportunity that the bank can tap into, to diversify its revenues and risk exposure. For more information, please see our Cytonn Weekly #15/2022,
- The Capital Markets Authority (CMA) announced that it had made public the Draft Capital Markets Public Offers Listing and Disclosures Regulation 2002, which are meant to replace the Public Listing and Disclosures Regulations 2022, which have been in place since 2002, with the only amendments done in 2016. The main aim of the Draft Regulations is to provide a more enabling environment in Kenya’s Capital Markets in order to spur more listings in the Nairobi Securities Exchange. For more information, please see our Cytonn Weekly #18/2022,
- Sanlam Limited, a South African financial services group listed on the Johannesburg Stock Exchange, announced that it had entered into a definitive Joint Venture agreement for a term of 10 years with Allianz SE, a global integrated financial services firm listed on the Frankfurt Stock Exchange with the aim to leverage on the two entities footprints in Africa and create a leading Pan-African financial services group, with an estimated equity value of Kshs 243.7 bn. For more information, please see our Cytonn Cytonn Weekly #18/2022,
- Equity Group and the International Finance Corporation (IFC) signed a partnership agreement in support of the sustainable development of Africa strategic plan by the Group which saw IFC and its partners commit USD 165.0 mn (Kshs 19.2 bn) towards Equity’s `Africa Recovery and Resilience Plan. For more information, please see our Cytonn Weekly #19/2022,
- The Central Bank of Kenya (CBK), released the Commercial Banks’ Credit Survey Report for the quarter ended March 2022. During the quarter, 38 operating commercial banks and 1 mortgage finance company participated in the Commercial Banks Credit Survey. The report highlighted that the banking sector’s loan book recorded an 11.2% y/y growth, with gross loans increasing to Kshs 3.4 tn in March 2022, from Kshs 3.0 tn in March 2021. On a q/q basis, the loan book increased by 4.1% from Kshs 3.2 tn in December 2021. For more information, please see our Cytonn Weekly #23/2022,
- Centum Investment Company PLC, announced that it had entered into a binding agreement to sell its 83.4% shareholding in Sidian Bank to Access Bank PLC, for a consideration of Kshs 4.3 bn subject to relevant approval from the Central bank of Kenya and the Competition Authority of Kenya. The acquisition added to Access Bank’s foray into the Kenyan Banking sector and follows the acquisition of Transnational Bank, completed in February 2020. For more information, please see our Cytonn Weekly #23/2022, and,
- The Central Bank of Kenya (CBK) released the Quarterly Economic Review for the period ending 31st March 2022, highlighting that the sector’s total assets increased by 1.6% to Kshs 6.1 tn in March 2022, from Kshs 6.0 tn in December 2021. The sector’s Profit Before Tax recorded a 16.2% increase in Profit before Tax (PBT) to Kshs 57.3 bn in Q1’2022, from Kshs 49.3 bn in Q4’2021. For more information, please see our Cytonn Weekly #24/2022.
For significant market highlights from Q1’2022, please see our Cytonn Q1’2022 Markets Review.
Universe of Coverage:
|
Company |
Price as at 24/06/2022 |
Price as at 01/07/2022 |
w/w change |
YTD Change |
Target Price* |
Dividend Yield |
Upside/ Downside** |
P/TBv Multiple |
Recommendation |
|
Kenya Reinsurance |
2.0 |
2.0 |
2.0% |
(10.9%) |
3.2 |
4.9% |
60.7% |
0.2x |
Buy |
|
Jubilee Holdings |
260.0 |
255.0 |
(1.9%) |
(19.5%) |
379.4 |
5.5% |
54.3% |
0.5x |
Buy |
|
Liberty Holdings |
5.5 |
5.4 |
(1.8%) |
(23.5%) |
7.8 |
0.0% |
44.4% |
0.4x |
Buy |
|
KCB Group*** |
36.7 |
39.0 |
6.3% |
(14.4%) |
52.2 |
7.7% |
41.5% |
0.8x |
Buy |
|
I&M Group*** |
17.0 |
17.0 |
0.0% |
(20.6%) |
22.3 |
8.8% |
40.0% |
0.5x |
Buy |
|
ABSA Bank*** |
10.2 |
10.6 |
3.9% |
(9.8%) |
13.6 |
10.4% |
38.7% |
1.1x |
Buy |
|
Co-op Bank*** |
10.9 |
11.0 |
1.4% |
(15.4%) |
14.1 |
9.1% |
37.3% |
0.8x |
Buy |
|
NCBA*** |
23.9 |
23.7 |
(0.6%) |
(6.9%) |
29.1 |
12.7% |
35.4% |
0.6x |
Buy |
|
Britam |
6.1 |
5.7 |
(6.9%) |
(24.6%) |
7.7 |
0.0% |
35.1% |
0.9x |
Buy |
|
Equity Group*** |
39.0 |
43.0 |
10.3% |
(18.5%) |
54.4 |
7.0% |
33.5% |
1.1x |
Buy |
|
Sanlam |
13.0 |
12.0 |
(7.7%) |
3.9% |
15.9 |
0.0% |
32.5% |
1.3x |
Buy |
|
Diamond Trust Bank*** |
50.3 |
49.7 |
(1.1%) |
(16.5%) |
62.4 |
6.0% |
31.6% |
0.2x |
Buy |
|
Standard Chartered*** |
125.0 |
124.0 |
(0.8%) |
(4.6%) |
137.0 |
11.3% |
21.8% |
1.0x |
Buy |
|
Stanbic Holdings |
91.5 |
99.0 |
8.2% |
13.8% |
109.8 |
9.1% |
20.0% |
0.9x |
Buy |
|
CIC Group |
2.0 |
2.0 |
2.0% |
(7.8%) |
2.1 |
0.0% |
5.0% |
0.7x |
Hold |
|
HF Group |
3.0 |
3.3 |
10.0% |
(12.9%) |
2.8 |
0.0% |
(15.4%) |
0.2x |
Sell |
|
*Target Price as per Cytonn Analyst estimates **Upside/ (Downside) is adjusted for Dividend Yield ***For Disclosure, these are stocks in which Cytonn and/or its affiliates are invested in |
|||||||||
We are “Neutral” on the Equities markets in the short term due to the current adverse operating environment and huge foreign investor outflows, and, “Bullish” in the long term due to current cheap valuations and expected global and local economic recovery.
With the market currently trading at a discount to its future growth (PEG Ratio at 0.9x), we believe that investors should reposition towards value stocks with strong earnings growth and that are trading at discounts to their intrinsic value. We expect the current high foreign investors sell-offs, the upcoming Kenyan general elections and the slow vaccine rollout to continue weighing down the economic outlook in the short term.
During the H1’2022, the Real Estate sector recorded increased activities, attributed to the recovery of the sector following increased Real Estate property transactions. In support of this, Real estate sector grew by 6.1% in Q1’2022, a 0.4% increase from the 5.7% growth that was recorded in Q4’2021 as per Kenya National Bureau of Statistics’ (KNBS) Q1’2022 Gross Domestic Product report. Some of the factors that supported the sector’s growth include;
- Continued focus on Affordable Housing by both the government and the private sector, for instance, the Nairobi Metropolitan Services (NMS) revamping housing estates in select parts of Nairobi County such as Uhuru and Outering estates,
- Efforts by the government to provide affordable mortgages through the Kenya Mortgage Refinance Company aiming to increase home ownership. The government budgetary allocation of Kshs 3.5 bn to the Kenya Mortgage Refinance Company (KMRC) for FY’2021/22 boosted liquidity to Primary Mortgage Lenders for onward lending to homebuyers,
- Increased business operations by firms and Small and Medium Sized Enterprises (SMEs), supported by the improved operating environment driving increase in office occupancies hence a better performance of the industrial and, commercial office Sector,
- Positive demographics evidenced by Kenya’s relatively high urbanization and population growth rates of 4.0% p.a and 2.3% p.a, respectively, against the global average of 1.8% p.a and 1.0% p.a, respectively, as at 2020, driving increased demand for developments and affordable homes,
- Improved infrastructure opening up areas for investment such as the recently completed Nairobi Expressway, and ongoing Nairobi Western Bypass projects, among many others, and,
- Aggressive entry and expansion by local and international retailers such as Naivas and QuickMart, taking up spaces previously occupied by troubled retailers such as Tuskys and Nakumatt.
However, a couple of challenges impeding performance of the sector include;
- Reduced lending to the Real Estate sector evidenced by a 3.9% decline in gross loans advanced to the Real Estate sector to Kshs 456.0 bn in FY’2021, from Kshs 439.0 bn realized in FY’2020. This is attributed to an increase in the number of Non-Performing Loans (NPLs) in the Real Estate sector by 21.6% to Kshs 74.7 bn in FY’2021 ,from Kshs 61.4 bn realized in FY’2020 according to the Central Bank of Kenya, with the increased Real Estate loan default rates being driven by the tough economic environment,
- Increase in prices of construction materials such as steel, paint, and cement which is expected to lead to slowdown in the Real Estate sector according to the Architectural Association of Kenya,
- Continued travel advisories in the country which are yet to be lifted, that is expected to have a downturn on the performance of the Hospitality sector, such as the travel advisory by the United Kingdom (UK) citing heightened threat of terrorism in Kenya,
- The existing oversupply of space in some sectors such as the 1.7 mn SQFT and 6.7 mn SQFT oversupply in the Kenyan retail sector and the commercial office sector,
- Shift towards e-commerce affecting demand and uptake of physical retail spaces, and,
- Continued poor performance of the REIT market in Kenya due to lack of Knowledge and interest of the financing instrument by investors.
Despite these limitations, the Real Estate sector has registered increased activities in H1’2022 and remains an attractive investment class. However, as 2022 is an election year, we expect a slow-down in activities in Q3’2022 owing to uncertainties brought about by the upcoming general election coupled with the tough economic environment. The impact is expected to be temporary and the market is likely to stabilise on the back of an expected relatively strong GDP growth.
Sectoral Market Performance
- Residential Sector
During H1’2022, the residential sector registered improved performance with average total returns coming in at 5.8%, 0.3% points increase from 5.5% recorded in H1’2021.This was attributed to an improvement in the residential average y/y price appreciation which came in at 0.9%, 0.3% points higher compared to a price appreciation of 0.6% recorded in H1’2021. Market uptake remained subdued coming in at 14.3% on average, 1.2% points lower than 15.1% recorded in H1’2021, indicating reduced demand for residential units attributed to constrained purchasing power. However, the average price per SQM came in at Kshs 118,652, 0.7% higher than the Kshs 117,865 recorded in H1’2021, due to an uptick of house prices attributed to increased property transactions and construction costs.
(All Values are in Kshs unless stated otherwise)
|
Residential Market Performance Summary |
||||||||||||
|
Segment |
Average of Price per SQM H1’2022 |
Average of Annual Uptake H1’2022 |
Average of Rental Yield H1’2022 |
Average of Price Appreciation H1’2022 |
Total Returns H1’2022 |
Average of Rental Yield H1’2021 |
Average of Price Appreciation H1’2021 |
Average of Total Returns H1’2021 |
y/y change in Rental Yield (% Points) |
y/y change in Price Appreciation (% Points) |
y/y change in Total Returns (% Points) |
|
|
High End |
191,754 |
12.6% |
4.0% |
1.5% |
5.5% |
3.7% |
1.1% |
4.8% |
0.3% |
0.4% |
0.7% |
|
|
Upper Mid-End |
146,515 |
12.6% |
4.5% |
0.9% |
5.5% |
4.6% |
1.2% |
5.8% |
(0.1%) |
(0.3%) |
(0.3%) |
|
|
Lower Mid-End |
73,037 |
15.0% |
5.0% |
0.8% |
5.8% |
4.3% |
1.1% |
5.5% |
0.7% |
(0.3%) |
0.3% |
|
|
Detached Average |
137,102 |
13.4% |
4.5% |
1.1% |
5.6% |
4.2% |
1.1% |
5.4% |
0.4% |
0.3% |
0.8% |
|
|
Upper Mid-End |
125,794 |
16.2% |
5.3% |
0.3% |
5.6% |
5.3% |
0.3% |
5.6% |
0.0% |
0.0% |
0.0% |
|
|
Lower Mid-End |
93,772 |
15.0% |
5.4% |
0.3% |
5.8% |
5.3% |
0.9% |
6.2% |
0.1% |
(0.6%) |
(0.4%) |
|
|
Satellite Towns |
81,043 |
14.6% |
5.3% |
1.4% |
6.7% |
5.6% |
(0.9%) |
4.7% |
(0.3%) |
0.5% |
2.0% |
|
|
Apartments Average |
100,203 |
15.3% |
5.4% |
0.7% |
6.0% |
5.4% |
0.1% |
5.5% |
0.0% |
0.6% |
0.5% |
|
|
Residential Market Average H1’2022 |
118,652 |
14.3% |
4.9% |
0.9% |
5.8% |
4.8% |
0.6% |
5.5% |
0.1% |
0.3% |
0.3% |
|
|
||||||||||||
Source: Cytonn Research 2022
- Detached Units Performance
The detached market registered improved performance with average total returns coming in at 5.6% in H1’2022 thus representing a 0.2% points y/y increase from 5.4% recorded in H1’2021. On a q/q basis, the average total returns registered 0.2% points increase from 5.4% recorded in Q1’2022. The average rental yields came in at 4.5%, 0.3% points higher than 4.2% recorded in H1’2021 attributable to increased rental rates while price appreciation remained flat, coming in at 1.1% in H1’2022.
The lower mid-end segment was the best performing with an average total return of 5.8% compared to the high-end and upper mid-end segments whose average total returns came in at 5.5% and 5.4%, respectively, attributed to the higher rental yield of 5.0% compared to the rental yields of 4.5% and 4.0% for the upper mid-end and high-end segments, respectively. Notably, all nodes in the high-end and upper mid-end segments recorded price appreciations bringing their averages to 1.5% and 0.9%, respectively. Ngong, Rongai and Donholm & Komarock are the nodes in the lower-mid end segment that recorded price corrections of 0.2%, 0.5% and 1.0%, respectively.
Ruiru was the best performing node in the detached market with an average total return of 7.8% attributed to the relatively high average rental yield, which came in at 5.9% and price appreciation at 1.9%. Redhill followed closely with an average total return of 7.5% while the worst performing node was Donholm &Komarock which recorded an average total return of 3.3%, 2.3% points lower than the detached market average of 5.6%.
(All values in Kshs unless stated otherwise)
|
Detached Units Performance H1’2022 |
||||||||
|
Area |
Average of Price per SQM H1'2022 |
Average of Rent per SQM H1'2022 |
Average of Occupancy H1'2022 |
Average of Uptake H1'2022 |
Average of Annual Uptake H1'2022 |
Average of Rental Yield H1'2022 |
Average of Price Appreciation H1'2022 |
Total Returns |
|
High-End |
||||||||
|
Rosslyn |
182,441 |
803 |
88.4% |
98.1% |
14.5% |
4.7% |
2.8% |
7.5% |
|
Karen |
185,270 |
693 |
86.0% |
92.2% |
12.8% |
3.7% |
2.0% |
5.7% |
|
Kitisuru |
227,272 |
757 |
93.4% |
87.6% |
12.3% |
4.2% |
1.2% |
5.4% |
|
Lower Kabete |
152,061 |
458 |
98.8% |
89.3% |
13.4% |
3.6% |
1.2% |
4.8% |
|
Runda |
211,728 |
746 |
93.5% |
96.3% |
10.0% |
4.1% |
0.3% |
4.4% |
|
Average |
191,754 |
691 |
92.0% |
92.7% |
12.6% |
4.0% |
1.5% |
5.5% |
|
Upper Mid-End |
||||||||
|
Redhill & Sigona |
99,491 |
462 |
88.9% |
96.2% |
14.4% |
4.7% |
1.7% |
6.4% |
|
Ridgeways |
167,607 |
778 |
82.2% |
87.4% |
12.8% |
5.0% |
1.1% |
6.1% |
|
Runda Mumwe |
152,592 |
743 |
89.1% |
89.7% |
12.4% |
5.1% |
0.6% |
5.7% |
|
South B/C |
110,313 |
410 |
89.5% |
88.5% |
12.8% |
4.2% |
1.1% |
5.3% |
|
Loresho |
168,134 |
713 |
80.5% |
83.1% |
13.2% |
4.9% |
0.3% |
5.2% |
|
Langata |
139,714 |
401 |
92.6% |
89.4% |
10.0% |
3.8% |
1.0% |
4.8% |
|
Lavington |
187,753 |
632 |
91.2% |
90.9% |
12.7% |
4.0% |
0.5% |
4.5% |
|
Average |
146,515 |
591 |
87.7% |
89.3% |
12.6% |
4.5% |
0.9% |
5.4% |
|
Lower Mid-End |
||||||||
|
Ruiru |
66,949 |
345 |
85.4% |
82.0% |
18.6% |
5.9% |
1.9% |
7.8% |
|
Juja |
71,548 |
305 |
86.3% |
80.9% |
16.8% |
5.5% |
1.2% |
6.7% |
|
Kitengela |
64,659 |
294 |
85.3% |
79.9% |
12.3% |
4.9% |
1.4% |
6.3% |
|
Ngong |
59,840 |
348 |
89.2% |
94.9% |
12.3% |
6.5% |
(0.2%) |
6.3% |
|
Syokimau/Mlolongo |
74,096 |
328 |
86.6% |
90.1% |
18.2% |
4.5% |
1.5% |
6.0% |
|
Athi River |
84,693 |
352 |
86.6% |
93.5% |
13.1% |
4.3% |
1.6% |
5.9% |
|
Rongai |
80,521 |
277 |
95.4% |
95.4% |
16.4% |
4.0% |
1.1% |
5.1% |
|
Thika |
62,315 |
301 |
82.3% |
86.3% |
13.5% |
5.3% |
(0.5%) |
4.8% |
|
Donholm & Komarock |
92,706 |
409 |
92.5% |
99.5% |
13.3% |
4.3% |
(1.0%) |
3.3% |
|
Average |
73,037 |
329 |
87.7% |
89.2% |
15.0% |
5.0% |
0.8% |
5.8% |
Source: Cytonn Research 2022
- Apartments Performance
Apartments recorded improved performance with average returns to investors coming in at 6.0% in H1’2022, 0.5% points increase from 5.5% recorded in H1’2021. On a q/q basis, the performance remained flat, similar to the total returns in Q1’2022 at 6.0%. The average y/y price appreciation registered a 0.6% y/y increase to 0.7% in H1’2022, up from the price appreciation of 0.1% in H1’2021. However, the rental yields remained flat at 5.4% in H1’2022 similar to the same period last year.
Satellite towns were the best performing segment with an average total return of 6.7%, attributed to the relatively high average rental yield of 5.3% and average y/y price appreciation of 1.4%. The good performance was driven by demand for renting units in satellite towns due to their affordability. Performance of the upper mid-end segment remained flat compared to a similar period last year at 5.6%, while the lower mid-end suburbs segment registered 0.4% points decline in average total returns which came in at 5.8% in H1’2022.
Thindigua and Ruaka recorded the highest annual total returns in the apartments market at 7.5% and 7.4%, respectively supported by a relatively high price appreciation which came in at 2.2% for each of the nodes. This is due to continued demand in the area driven by the area’s proximity to upper markets such as Runda and proximity to social amenities. Waiyaki Way recorded the highest returns in the lower mid-end suburb segment at 7.3%, compared to the segment’s market average of 5.8% as well as the highest price appreciation at 1.1% compared to the segment’s average of 0.3%. The area’s performance is boosted by the improving infrastructure especially construction of the Nairobi Expressway that boosted property prices upon completion. The least performing segments were Upperhill and Langata which recorded an average total return of 4.0% each, and this was attributed to their price corrections of 1.1% and 0.6%, respectively.
(All values in Kshs unless stated otherwise)
|
Apartments Performance H1’2022 |
||||||||
|
Area |
Average of Price per SQM H1'2022 |
Average of Rent per SQM H1'2022 |
Average of Occupancy H1'2022 |
Average of Uptake H1'2022 |
Average of Annual Uptake H1'2022 |
Average of Rental Yield H1'2022 |
Average of Price Appreciation H1'2022 |
Total Returns |
|
Upper Mid-End |
||||||||
|
Westlands |
146,211 |
848 |
83.8% |
87.2% |
24.9% |
5.9% |
0.1% |
6.0% |
|
Kileleshwa |
126,053 |
675 |
83.4% |
87.7% |
15.0% |
5.5% |
0.4% |
5.9% |
|
Kilimani |
104,371 |
667 |
84.2% |
92.5% |
22.0% |
5.8% |
0.1% |
5.9% |
|
Loresho |
122,101 |
543 |
87.8% |
97.2% |
10.4% |
4.7% |
1.2% |
5.9% |
|
Parklands |
120,858 |
595 |
82.8% |
90.2% |
13.7% |
4.8% |
1.0% |
5.8% |
|
Upperhill |
135,167 |
770 |
80.5% |
88.7% |
11.1% |
5.1% |
(1.1%) |
4.0% |
|
Average |
125,794 |
683 |
83.8% |
90.6% |
16.2% |
5.3% |
0.3% |
5.6% |
|
Lower Mid-End Suburbs |
||||||||
|
Waiyaki Way |
88,518 |
537 |
84.1% |
86.6% |
18.3% |
6.2% |
1.1% |
7.3% |
|
South C |
117,736 |
723 |
82.3% |
79.6% |
18.2% |
6.1% |
0.4% |
6.5% |
|
Imara Daima |
80,559 |
421 |
87.3% |
89.6% |
12.9% |
5.2% |
1.2% |
6.4% |
|
Dagoretti |
85,017 |
572 |
88.1% |
81.2% |
14.4% |
5.9% |
0.1% |
5.9% |
|
Donholm & Komarock |
77,683 |
394 |
93.1% |
93.9% |
12.5% |
5.8% |
0.1% |
5.9% |
|
Race Course/Lenana |
99,676 |
633 |
81.9% |
93.6% |
19.9% |
5.9% |
(0.1%) |
5.8% |
|
Kahawa West |
74,409 |
314 |
88.8% |
92.5% |
10.7% |
5.2% |
0.6% |
5.7% |
|
South B |
105,460 |
463 |
82.4% |
95.2% |
14.9% |
4.2% |
0.2% |
4.4% |
|
Langata |
114,887 |
537 |
81.2% |
88.1% |
13.0% |
4.5% |
(0.6%) |
4.0% |
|
Average |
93,772 |
510 |
85.5% |
88.9% |
15.0% |
5.4% |
0.3% |
5.8% |
|
Lower Mid-End Satellite Towns |
||||||||
|
Thindigua |
100,679 |
499 |
87.2% |
78.1% |
17.5% |
5.4% |
2.2% |
7.5% |
|
Ruaka |
108,906 |
551 |
81.0% |
85.0% |
22.0% |
5.2% |
2.2% |
7.4% |
|
Kikuyu |
82,246 |
489 |
71.5% |
84.5% |
14.9% |
5.2% |
2.1% |
7.3% |
|
Ngong |
60,737 |
360 |
78.0% |
81.6% |
11.5% |
5.6% |
1.6% |
7.2% |
|
Ruiru |
89,850 |
493 |
84.3% |
85.9% |
17.3% |
5.6% |
1.4% |
7.0% |
|
Athi River |
61,317 |
335 |
83.3% |
93.7% |
13.7% |
5.5% |
1.2% |
6.7% |
|
Syokimau |
68,552 |
332 |
87.4% |
89.8% |
12.1% |
5.0% |
1.6% |
6.6% |
|
Rongai |
96,990 |
311 |
88.8% |
75.1% |
12.1% |
5.8% |
(0.1%) |
5.7% |
|
Kitengela |
60,108 |
278 |
82.7% |
96.3% |
10.1% |
4.9% |
0.1% |
5.0% |
|
Average |
81,043 |
405 |
82.7% |
85.6% |
14.6% |
5.3% |
1.4% |
6.7% |
Source: Cytonn Research 2022
Notable highlights in H1’2022 include (See Q1’2022, Cytonn Monthly-April 2022 and Cytonn Monthly-May 2022 Highlights);
- Housing Finance Group (HFG), a Kenyan financial institution, disclosed in its FY’2021 Annual Report that it had received Kshs 474.9 mn from the Kenya Mortgage Refinance Company (KMRC) for onward lending to potential house buyers in the country. For more information, see Cytonn Weekly #24/2022, and,
- The Nairobi Metropolitan Services (NMS) began the second phase of revamping housing estates in select parts of Nairobi County. This followed the completion of the first phase of the rehabilitation process in May 2022, which included 760 housing units in; Kariobangi South, Buruburu, Kariokor and Jamhuri estates. For more information, see Cytonn Weekly #23/2022,
Our outlook for the residential sector remains NEUTRAL as we expect increased development activities in the residential sector despite expected slowdown in transactions with the upcoming general elections. For apartments, the best opportunity is investment in areas such as Thindigua, Ruaka, Waiyaki Way, and Kikuyu driven by returns, appreciation as well as state of infrastructure and amenities; for detached units, the best investment opportunity is in areas such as Ruiru, Rosslyn, Juja and Redhill, driven by uptake and the current performance in terms of returns to investors.
- Commercial Office Sector
In H1’2022, the average rental yield for office spaces in the Nairobi Metropolitan Area (NMA) slightly increased by 0.02% points to 7.35%, from 7.33% in FY’2021. This was mainly driven by average rental rates per SQFT which increased by 1.1% to Kshs 95 in the period under review, from Kshs 94 per SQFT in FY’2021. The average occupancy rate came in at 77.9%, a 0.3% increase from the 77.6% rate that was realized in FY’2021, attributed to various business resuming operations. However, on a q/q basis the occupancy rates remained the same at 77.9%, signifying mild activities in the sector. The average selling prices per SQFT increased by 0.3% to Kshs 12,142 in H1’2022, from Kshs 12,106 in FY’2021, as a result of the increased construction costs. The table below highlights the performance of the Nairobi Metropolitan Area (NMA) Commercial Office sector over time:
(All values in Kshs unless stated otherwise)
|
Nairobi Metropolitan Area (NMA) Commercial Office Returns Over Time |
|||||||
|
Year |
Q1'2021 |
H1'2021 |
Q3'2021 |
FY'2021 |
Q1'2022 |
H1’2022 |
∆ FY'2021/Q1'2022 |
|
Occupancy % |
76.3% |
75.8% |
79.9% |
77.6% |
77.9% |
77.9% |
0.3% |
|
Asking Rents (Kshs) /SQFT |
92 |
93 |
94 |
94 |
94 |
95 |
1.1% |
|
Average Prices (Kshs) /SQFT |
12,228 |
12,224 |
12,479 |
12,106 |
12,113 |
12,142 |
0.3% |
|
Average Rental Yields (%) |
6.8% |
6.9% |
7.2% |
7.33% |
7.3% |
7.35% |
0.02% |
Source: Cytonn Research 2022
In terms of submarket performance, Gigiri, Westlands and Karen recorded the highest rental yields of 8.6% 8.1% and 7.9%, respectively, in H1’2022 compared to the market average of 7.3%. Their performance was mainly driven by the presence of high-quality office spaces that generate prime rents. On the other hand, Mombasa Road recorded the least average rental yield of 5.1%. This was driven by the low rental rates that the office spaces in the area attracts, which came in at Kshs 73 per SQFT in H1’2022, 23.2% lower than the market average of Kshs 95 per SQFT. The table below shows the Nairobi Metropolitan Area (NMA) sub-market performance:
(All values in Kshs Unless Stated Otherwise)
|
Nairobi Metropolitan Area Commercial Office Submarket Performance H1’2022 |
|||||||||||
|
Area |
Price (Kshs) /SQFT FY'2021 |
Rent (Kshs) /SQFT FY'2021 |
Occupancy (%) FY'2021 |
Rental Yield (%) FY'2021 |
Price (Kshs) /SQFT H1’2022 |
Rent Kshs/ SQFT H1’2022 |
Occupancy (%) H1’2022 |
Rental Yield (%) H1’2022 |
∆ in Rent |
∆ in Occupancy (% points) |
∆ in Rental Yields (% points) |
|
Gigiri |
13,500 |
119 |
81.3% |
8.6% |
13,500 |
118 |
81.0% |
8.6% |
(0.8%) |
(0.3%) |
0.0% |
|
Westlands |
11,972 |
104 |
75.5% |
8.1% |
11,853 |
105 |
74.6% |
8.1% |
0.8% |
(0.9%) |
0.0% |
|
Karen |
13,325 |
106 |
83.0% |
7.7% |
12,385 |
107 |
83.0% |
7.9% |
1.0% |
0.0% |
0.2% |
|
Parklands |
11,336 |
91 |
80.1% |
7.6% |
11,662 |
90 |
82.8% |
7.6% |
(0.6%) |
2.7% |
0.0% |
|
Kilimani |
12,364 |
91 |
79.8% |
7.1% |
12,385 |
90 |
80.2% |
7.1% |
(0.2%) |
0.4% |
0.0% |
|
Upperhill |
12,409 |
94 |
78.0% |
7.0% |
12,409 |
94 |
76.2% |
6.9% |
0.0% |
(1.8%) |
(0.1%) |
|
Nairobi CBD |
11,787 |
82 |
82.8% |
6.8% |
11,812 |
82 |
83.9% |
6.9% |
0.0% |
1.1% |
0.1% |
|
Thika Road |
12,571 |
79 |
76.3% |
5.7% |
12,571 |
78 |
77.6% |
5.7% |
(1.9%) |
1.3% |
0.0% |
|
Mombasa Road |
11,250 |
73 |
64.2% |
5.1% |
11,225 |
73 |
65.0% |
5.1% |
0.0% |
0.8% |
0.0% |
|
Average |
12,106 |
94 |
77.6% |
7.33% |
12,142 |
95 |
77.9% |
7.35% |
1.1% |
0.3% |
0.0% |
Source: Cytonn Research 2022
Notable highlights in H1’2022 include;
- CCI Group of companies, a business process outsourcing (BPO) provider, and, nutrition supplements distributor Max International took up approximately 60.0% of the 270,000 SQFT space at Garden City Business Park along Thika Road. For more information, see Cytonn Weekly #02/2022,
- Jubilee Holdings, an international insurance company, purchased Coca-Cola East Africa’s former head office located in Upper Hill, Nairobi, at a cost of Kshs 1.1 bn. The insurance firm is expected to begin its operations in the Grade A Commercial Office building that has a total 116,350 SQFT sitting on a 3.2 acre piece of land, in September 2022, upon completion of the renovations. For more information, see Cytonn Weekly #14/2022, and,
- Housing Finance Group (HFG), a Kenyan financial institution, announced plans to sell its head office, Rehani House, located in Nairobi’s Central Business District by the end of 2022. The 13-storey building will be sold at an undisclosed amount, following the financier’s need to acquire additional capital to repay its loan obligations. For more information, please see Cytonn Weekly #20/2022.
We have a NEUTRAL outlook (but leaning towards the negative) for the NMA commercial office sector whose performance continues to stagnate as a result of; i) the existing oversupply of space at 6.7 mn SQFT thus weighing down the optimum performance of the sector, ii) slow uptake of office spaces fueled by some firms still embracing remote working strategy, and, iii) high cost of living resulting from the high construction costs. Investment opportunity lies in Gigiri, Westlands, and Karen which offer relatively high returns compared to the market averages.
- Retail Sector
In H1’2022, the average rental yield for retail spaces in the Nairobi Metropolitan Area (NMA) remained the same at 7.8%, when compared to FY’2021 performance. The average rental rates increased by 0.6% to Kshs 173 per SQFT, from the Kshs 169 per SQFT that was recorded in FY’2021, driven by an increase in quality retail spaces such as the GTC Shopping Mall in Westlands. Average occupancy rates however declined by 0.8% points to 75.9% in H1’2022, from 77.2% realized in FY’2021. This was as a result of the excess supply of retail spaces which is currently at 3.0 mn SQFT, thus in turn straining the optimum occupancy rates. The performance of the retail sector in the Nairobi Metropolitan Area over time is as shown below:
(All values in Kshs unless stated otherwise)
|
Summary of performance overtime |
|||||||
|
Item |
Q1'2021 |
H1'2021 |
Q3'2021 |
FY’2021 |
Q1’2022 |
H1’2022 |
Rental Yield Change FY'2021/H1'2022 |
|
Average Asking Rents (Kshs/SQFT) |
166 |
177 |
177 |
169 |
170 |
173 |
0.6% |
|
Average Occupancy (%) |
75.0% |
77.96% |
78.0% |
76.7% |
77.2% |
75.9% |
(0.8) points |
|
Average Rental Yields (%) |
7.4% |
8.1% |
8.1% |
7.8% |
7.9% |
7.8% |
(0.0%) points |
Source: Cytonn Research 2022
Kilimani, Westlands, and, Karen were the best performing nodes with average rental yields of 9.7%, 9.0% and 8.9%, respectively, compared to the overall market average of 7.8%. The remarkable performance was driven by; i) the presence of quality retail spaces fetching prime rents and yields, ii) their superior locations containing affluent residents with a high consumer purchasing power, and, iii) adequate infrastructure enhancing investments. On the other hand, retail spaces in Eastlands recorded the lowest yields at 5.9%, 1.9% points lower than the average market rates of 7.8%, as a result of low rental charges at Kshs 133 per SQFT against a market average of Kshs 173 Per SQFT, coupled with a stiff competition from informal retail spaces. The table below shows the submarket performance in the Nairobi Metropolitan Area (NMA):
(All values in Kshs unless stated otherwise)
|
Nairobi Metropolitan Area Retail Market Performance H1’2022 |
|||||||||
|
Area |
Rent (Kshs) /SQFT FY'2021 |
Occupancy% FY'2021 |
Rental Yield FY'2021 |
Rent (Kshs) /SQFT H1'2022 |
Occupancy% H1'2022 |
Rental Yield H1'2022 |
H1’ 2022 ∆ in Rental Rates |
H1’ 2022 ∆ in Occupancy (% points) |
H1’ 2022 ∆ in Rental Yield (% points) |
|
Kilimani |
183 |
86.0% |
9.8% |
182 |
85.0% |
9.7% |
(0.5%) |
(1.0%) |
(0.1%) |
|
Westlands |
213 |
78.8% |
10.0% |
215 |
72.9% |
9.0% |
0.8% |
(5.9%) |
(1.0%) |
|
Karen |
202 |
84.0% |
9.8% |
205 |
78.6% |
8.9% |
1.7% |
(5.4%) |
(0.9%) |
|
Kiambu road |
180 |
74.2% |
7.7% |
187 |
73.3% |
8.1% |
3.8% |
(0.9%) |
0.3% |
|
Ngong Road |
171 |
79.0% |
7.7% |
169 |
78.0% |
7.5% |
(0.9%) |
(1.0%) |
(0.3%) |
|
Thika Road |
161 |
74.0% |
6.7% |
165 |
74.8% |
7.3% |
2.5% |
0.8% |
0.6% |
|
Mombasa road |
148 |
75.0% |
6.8% |
150 |
78.5% |
7.3% |
1.2% |
3.5% |
0.5% |
|
Satellite towns |
142 |
69.0% |
6.2% |
138 |
70.7% |
6.0% |
(3.0%) |
1.7% |
(0.2%) |
|
Eastlands |
133 |
71.6% |
5.6% |
133 |
74.2% |
5.9% |
0.0% |
2.6% |
0.3% |
|
Average |
170 |
76.8% |
7.8% |
173 |
75.9% |
7.8% |
0.6% |
(0.6%) |
0.0% |
Source: Cytonn Research 2022
For notable highlights in H1’2022, please see our Cytonn Q1’2022 Markets Review, Cytonn Monthly-April 2022, and Cytonn Monthly-May 2022 Reports.
For the month of June 2022, French private equity firm Amethis, and the International Finance Cooperation (IFC) consortium, sold an estimated 30.0% stake in Naivas supermarket to IBL Group of Mauritius and other investors, for an undisclosed amount. From the 30.0% sale transaction by IFC and Amethis, IBL Group purchased the largest the stake thus becoming its largest investment worldwide, and the first in East Africa. This signifies the investors’ high appetite for Kenya’s retail sector, particularly Naivas which continues to outshine other retailers in the country. For more information, see our Cytonn weekly #25/2022.
NMA’s retail sector performance continues to be highly driven by; i) the rapid expansion drive by local and international retailers, ii) positive demographics, and, iii) increased foreign investments in the country as a result of Kenya being recognized as a regional hub. However, factors such as e-commerce, coupled with the existing oversupply of retail spaces in the market by 3.0 mn SQFT in the Nairobi Metropolitan Area, is expected to weigh down the overall performance of the sector, thus we retain a NEUTRAL outlook for the sector’s performance. Investment opportunity lies in Karen, Kilimani, and, Westlands which offer relatively high returns compared to the market averages.
- Mixed Use Developments
Notable highlights in the Mixed-Use Developments in H1’2022 (see Q1’2022 highlights) include;
- Gateway Real Estate Africa (GREA), a private development company specializing in turnkey construction, began the construction of CCI Group of Companies’ commercial office project in Tatu City, Ruiru constituency. CCI Group which is the largest international contact center operator in Africa currently have their offices at the Garden City Business Park, whereas they are looking to expand their operations into Tatu City. For more information, see Cytonn Weekly #24/2022, and,
- Sheria Savings and Credit Cooperative Society (SACCO) announced plans to build a Mixed-Use Development tower in Nairobi’s Upper Hill Matumbato Close, at a cost of Kshs 3.3 bn, by December 2025. The project set to be next to the current location of the Sheria SACCO offices, will sit on a one-acre piece of land that they bought in the year 2004 at a cost of Kshs 20.0 mn. For more information, see Cytonn Monthly- April 2022,
Mixed-use developments are expected to continue gaining traction as they offer the live, work and play concept thus convenient for the rising sophisticated middle-income earners with huge demand for exceptional lifestyles, relatively higher returns to investors compared to single-use theme developments, and, a diversified portfolio to investors hence risk spread in the case a thematic sector is performing negatively in the market.
Our outlook on Mixed-Use Developments (MUDs) is NEUTRAL supported by the impressive returns recorded at 7.2% in 2021, from 6.9% in 2020. However, their performance is expected to be weighed down by existing oversupply at 6.7 mn SQFT in the NMA commercial office market, and oversupply in the retail market at 3.0 mn SQFT in the NMA and 1.7 mn SQFT in the Kenya retail market.
- Hospitality Sector
In H1’2022, three hospitality related industry reports were released and the key-take outs were as stated below;
|
# |
Report |
Key Take-out |
|
1 |
The Central Bank of Kenya’s Monetary Policy Committee Hotels Survey-May 2022 |
|
|
2 |
The Leading Economic Indicators March 2022, by Kenya National Bureau of Statistics |
|
|
3 |
|
For notable highlights in H1’2022, please see our Cytonn Q1’2022 Markets Review, Cytonn Monthly-April 2022, and Cytonn Monthly-May 2022 Reports.
For the month of June;
- Kisumu Lakefront Development Corporation (KLDC), in partnership with Gad Works Projects Limited, announced plans to build beach apartments worth Kshs 539.0 mn in Usoma, Kisumu County. The project will have 119 units, a restaurant, a floating swimming pool in the lake and an aqua park. For more information, see Cytonn Weekly #25/2022, and,
- PrideInn Hotels and Resorts, a local hospitality Group, signed a third management agreement with Azure Hospitality Group to manage their hotel at Signature Mall located along Mombasa Road. The hotel now dubbed PrideInn Plaza consists of 64 rooms, 9 conference halls, a restaurant, a launch, and, a bar, and will be wholly run by PrideInn which signed a management contract with Azure Hotels and Resorts in 2020 to merge operations. For more analysis, see Cytonn Weekly #24/2022.
We have a NEUTRAL outlook on the hospitality sector following improved hotel operations and occupancies. This is attributed to the mass vaccination currently underway in the country, the ambitious international marketing of Kenya as a tourist destination through the magical Kenya platform, and, the World Rally Championship which is expected to be hosted until 2026. However, the continued Travel Advisories, and relaxation of Covid-19 measures continues to pose a risk on the performance of the sector evidenced by the reduced international arrivals in Q1’2022 coupled with setback of 12.7% reduced budgetary allocation to Kshs 15.8 bn for the FY’2022/23.
- Land Sector
The average selling prices for land in the Nairobi Metropolitan Area (NMA) recorded an overall improvement in performance in H1’2022, with the YoY capital appreciation coming in at 3.1%. This signified the continued rise in the demand for development land mainly attributed to;
- Kenya’s high population and urbanization growth rates currently at 2.3% and 4.0%, respectively, compared to the world’s 1.1% and 1.9%, respectively,
- Government’s continued focus on the development of infrastructure such as roads, railways, water and sewer lines,
- Proximity to amenities such as shopping malls, institutions, and organizations among others, and,
- Increased construction activities particularly in the residential and infrastructure sectors thus fueling demand for land.
In terms of performance per node, un-serviced land in the satellite towns of Nairobi recorded the highest YoY capital appreciation of 7.8%. This was mainly due to: increased demand resulting from their affordability, scarcity of land within Nairobi which in turn drove demand for land in the satellite towns, concentration of affordable housing projects in the satellite towns thus driving demand for land, and, improved accessibility to these areas supporting demand for Real Estate investments. In support of this, the average asking prices for unserviced land came in at Kshs 14.7 mn in H1’2022, which is lower than the market average of Kshs 128.2 mn. The table below shows the overall performance of the sector during the quarter:
All Values in (mn) Kshs Unless Stated Otherwise
|
Summary of the Performance Across All regions H1’2022 |
|||
|
Location |
H1'2021 |
H1'2022 |
Annualized Capital Appreciation |
|
Un-serviced land-satellite Towns |
13.5 |
14.7 |
7.8% |
|
Nairobi Suburbs- Low Rise Residential Areas |
123.8 |
130.5 |
5.2% |
|
Serviced land-Satellite Towns |
15.7 |
16.1 |
3.5% |
|
Nairobi Suburbs- Commercial Areas |
404.6 |
403.4 |
(0.3%) |
|
Nairobi Suburbs- High Rise Residential Areas |
76.7 |
76.3 |
(0.5%) |
|
Average |
126.8 |
128.2 |
3.1% |
Source: Cytonn Research 2022
Performance per node
- In H1’2022, unserviced land in the satellite towns of Nairobi recorded an average annualized capital appreciation of 7.8%, with Juja being the best performing node with a YoY capital appreciation of 6.4% attributed to; i) adequate infrastructural developments such Thika Superhighway, ii) proximity to amenities such as Spur Mall, Juja Mall, and, Jomo Kenyatta University, among others, and, iii) positive demographics fueling demand. On the other hand, Athi River and Rongai recorded price corrections of 0.7% and 2.7% to kshs 18.9 mn and Kshs 4.4 mn, respectively, from Kshs 19.0 mn and Kshs 4.5 mn, respectively, as a result of a slight decline in the demand for land in the areas.
All Values in Kshs mn Unless Stated Otherwise
|
Satellite Towns Unserviced Land |
|||
|
Location |
Price H1'2021 |
Price H1'2022 |
Capital Appreciation |
|
Juja |
10.6 |
12.2 |
14.8% |
|
Limuru |
21.2 |
24.1 |
13.8% |
|
Utawala |
12.4 |
14.1 |
13.8% |
|
Rongai |
19.0 |
18.9 |
(0.7%) |
|
Athi River |
4.5 |
4.4 |
(2.7%) |
|
Average |
13.5 |
14.7 |
7.8% |
- The asking prices for land in the low-rise residential areas of Nairobi surburbs recorded a YoY capital appreciation of 5.2% in H1’2022, 2.1% points higher than the market average of 3.1%. These areas continue to remain attractive to investors due to; i) their serene environments attracting demand particularly from the high-end income earners, ii) privacy enhanced by the sparse population, iii) relatively affordable prices at Kshs 95.4 mn per acre compared to the high-rise areas averaging at Kshs 133.7 mn per acre. Ridgeways was the best performing node with an average price appreciation of 15.5%, 8.1% points higher than the market average of 7.4% due to; i) its exclusivity driving demand for residential development land, ii) availability of development land, iii) ample infrastructure servicing the area such as Kiambu and Ridgeways Roads among others, iv) proximity to adequate amenities such as Ridgeways Mall, and Kigwa Ridge School among others, and, v) strategic location as it’s connected to high end areas like Muthaiga, and Garden Estate hence attracting investments.
All Values in Kshs mn Unless Stated Otherwise
|
Low Rise Residential Areas |
|||
|
Location |
Price H1'2021 |
Price H1'2022 |
Capital Appreciation |
|
Ridgeways |
68.8 |
81.4 |
15.5% |
|
Kitisuru |
77.9 |
90.3 |
13.7% |
|
Runda |
74.3 |
81.7 |
9.0% |
|
Karen |
59.6 |
62.0 |
3.8% |
|
Kileleshwa |
300.9 |
305.8 |
1.6% |
|
Spring Valley |
161.0 |
161.7 |
0.4% |
|
Average |
123.8 |
130.5 |
5.2% |
Source: Cytonn Research 2022
- Serviced land in the satellite towns of Nairobi recorded an average annualized capital appreciation of 3.4% with Syokimau being the best performing area recording an average annualized capital appreciation of 17.5%. This was mainly driven by; i) its strategic location along the recently completed Nairobi Expressway project promoting investments, ii) presence of the commuter train station making it easier for people to navigate various areas whilst avoiding traffic along the busy Mombasa Road, iii) relatively affordable land prices which came in at Kshs 13.9 mn per acre against the market average of Kshs 15.7 mn per acre, and iv) presence a growing middle income class driving demand for land investments. On the other hand, Ruai recorded a price correction of 13.9% attributed to reduced demand of land as investors focus on areas witnessing more Real Estate related activities.
All Values in (mn) Kshs Unless Stated Otherwise
|
Satellite Towns Serviced Land |
|||
|
Location |
Price H1'2021 |
Price H1'2022 |
Capital Appreciation |
|
Syokimau-Mlolongo |
11.8 |
13.9 |
17.5% |
|
Thika |
10.4 |
11.6 |
11.5% |
|
Ruiru-Juja |
25.3 |
25.9 |
2.2% |
|
Rongai |
20.0 |
20.4 |
1.8% |
|
Athi River |
13.1 |
13.3 |
1.6% |
|
Ruai |
13.5 |
11.6 |
(13.9%) |
|
Average |
15.2 |
15.7 |
3.4% |
Source: Cytonn Research 2022
- The asking prices for land in the high-rise residential areas of the NMA recorded an overall 0.5% price correction in H1’2022, with prices coming in at Kshs 76.3 mn from Kshs 76.7 mn that was realized in H1’2021. The decline in performance was mainly driven by the reduced demand for land in these areas, as a result of the inadequate land for development.
All Values in (mn) Kshs Unless Stated Otherwise
|
High Rise Residential Areas |
|||
|
Location |
Price H1'2021 |
Price H1'2022 |
Capital Appreciation |
|
Dagoretti |
95.2 |
95.2 |
0.0% |
|
Embakasi |
67.2 |
66.9 |
(0.5%) |
|
Kasarani |
67.7 |
95.2 |
(1.2%) |
|
Average |
76.7 |
76.3 |
(0.5%) |
Source: Cytonn Research 2022
- Land in the commercial zones realized a price correction of 0.3% in their asking prices which came in at Kshs 403.4 mn in H1’2022, from the Kshs 404.6 mn that was recorded in H1’2021. Riverside and Westlands were the best performing nodes with capital appreciations of 2.2% and 1.1%, respectively, due to increased demand for development land in the areas driven by; their close proximity to the Nairobi CBD, presence of various international organizations, and, infrastructure developments such as the Riverside Drive and Nairobi Expressway promoting accessibility. Some of the ongoing projects in these areas include: The Cube and Sandalwood both located in Riverside, and, One Principal Place and the Piano both located in Westlands. On the other hand, Upper hill and Kilimani realized price corrections of 3.2% and 0.3%, respectively, due to declined demand for development resulting from land in the area being expensive.
All Values in (mn) Kshs Unless Stated Otherwise
|
Nairobi Metropolitan Area Commercial Zones |
|||
|
Location |
Price H1'2021 |
Price H1'2022 |
Capital Appreciation |
|
Riverside |
335.7 |
343.1 |
2.2% |
|
Westlands |
413.6 |
418.3 |
1.1% |
|
Kilimani |
381.7 |
380.4 |
(0.3%) |
|
Upperhill |
488.8 |
483.1 |
(3.2%) |
|
Average |
404.6 |
403.4 |
(0.3%) |
Source: Cytonn Research
We retain a POSITIVE outlook for the land sector in the Nairobi Metropolitan Area that continues to be a reliable investment avenue having shown resilience throughout the years despite economic downturns. We expect a similar trend to continue being witnessed throughout the year driven by; i) government’s focus on establishing infrastructure developments thus promoting demand for land, ii) increased focus on the Affordable Housing projects fuelling the need for more land, iii) positive demographics, and, iv) government’s efforts towards ensuring efficient land transactions.
- Infrastructure Sector
For notable highlights in H1’2022, please see our Cytonn Q1’2022 Markets Review, Cytonn Monthly-April 2022, and Cytonn Monthly-May 2022 Reports. For the month of June 2022;
- The African Development Bank (AfDB) announced plans to loan Kshs 17.5 bn towards the upgrade of the Nairobi-Nakuru Highway project totaling 233 Km, in July 2022. This represents 9.4% of the Kshs 180.0 bn road project, which is a Public Private Partnership (PPP) project between the National Government, and, a consortium made up of Vinci Highways SAS, Meridian Infrastructure Africa Fund, and, Vinci Concessions SAS. For more information, see Cytonn Weekly #23/2022, and,
- The national government through the Kenya Rural Roads Authority (KeRRA) resumed the construction of the 54.0 Km Mto Mwagodi-Mbale-Wundanyi-Bura road project, that stalled for more than six months due to financial constraints. For more information, see Cytonn Weekly #23/2022.
We expect continued construction, revamp, and completion of various projects in the infrastructure sector due to government’s aggressive focus to implement and conclude projects through various strategies such as; i) issuing of infrastructure bonds to raise funds for construction, ii) initiating project partnerships such as Joint Ventures and Public Private Partnerships, and, iii) high priority in the YoY budget allocations, with the sector having been allocated Kshs 212.5 bn in the FY’2022/2023 Budget Statement, which is a 6.4% representation of the Kshs 3.3 tn total budget.
- Industrial Sector
Notable highlights in H1’2022 include,
- Grit Real Estate Income Group, a Mauritius based Real Estate Investment Company, completed the purchase of Orbit Products Africa, a warehouse and manufacturing facility located in Machakos County, at a cost of Kshs 6.1 bn. This comes after the investment firm entered a Kshs 2.9 bn loan agreement with the International Finance Corporation (IFC) in July 2021, with an aim of acquiring and developing the warehousing and manufacturing facility. For more information, see Cytonn Weekly #11/2022,
- Botswana’s listed Real Estate firm Letlole La Rona Limited (LLR) signed a deal with Grit Real Estate Income Group, to buy a 30.0% stake, in Orbit Products Africa’s manufacturing facilities in Mlolongo, at an initial cost of Kshs 842.0 mn. For more information, see Cytonn Weekly #21/2022, and,
- Purple Dot International Limited, a Real Estate development firm, announced plans to develop a warehousing hub worth Kshs 600.0 mn at the Harvest Industrial Park in Athi River, Machakos County. The warehouse facility, which will total 7,425 SQFT, will consist of 24 units with three level spaces. For more information, please see Cytonn Weekly #20/2022.
Kenya’s Real estate industrial sector has realized various activities that has mainly been fuelled by; i) Kenya being recognized as a regional hub hence attracting investments, ii) expansion of local and international retailers seeking storage space for goods, iii) government focus on the Big 4 Agenda on manufacturing which is expected to influence demand for warehouses used to manufacture products, iv) improvement of infrastructure developments promoting transport of goods, and, v) e-commerce driving demand for warehouse spaces. We expect these factors to continue driving the performance of the sector.
- Statutory Reviews
In H1’2022;
- The Landlord and Tenant Bill of 2021 was tabled to the Senate for consideration having been passed by the National Assembly. The Bill aims to consolidate the laws relating to renting of business and residential premises, regulating the relationship between the landlord and tenant in order to promote stability in the rental sector, and, establish tribunals to provide for the adjudication of disputes. For more information, see Cytonn Weekly #16/2022, and,
- The Finance Act 2022 highlighted that a property includes land, building, aircraft, ship, or motor vehicle, thus sufficient to serve as security for unpaid taxes. Additionally, the bill highlighted a 15.0% increase for the Capital Gains Tax (CGT) on transfer or sale of property by an individual or company, from the current 5.0%. For more information, see Cytonn Weekly #15/2022.
We expect these regulations to provide clarification as well as streamline activities in the Real Estate sector, thus in turn foster the growth and performance of the economy as a whole. However, the increased CGT rate is expected to weigh down property transaction processes, as well as the uptake of properties as result of them being costly.
- Listed Real Estate
In the Nairobi Stock Exchange, ILAM Fahari I-REIT closed the month of June trading at an average price of Kshs 6.0 per share. The performance represented a 6.3% Year-to-Date (YTD) decline and a 70.0% Inception-to-Date (ITD) decline, from Kshs 6.4 and Kshs 20.0, respectively. The graph below shows Fahari I-REIT’s performance from November 2015 to 30th June 2022:
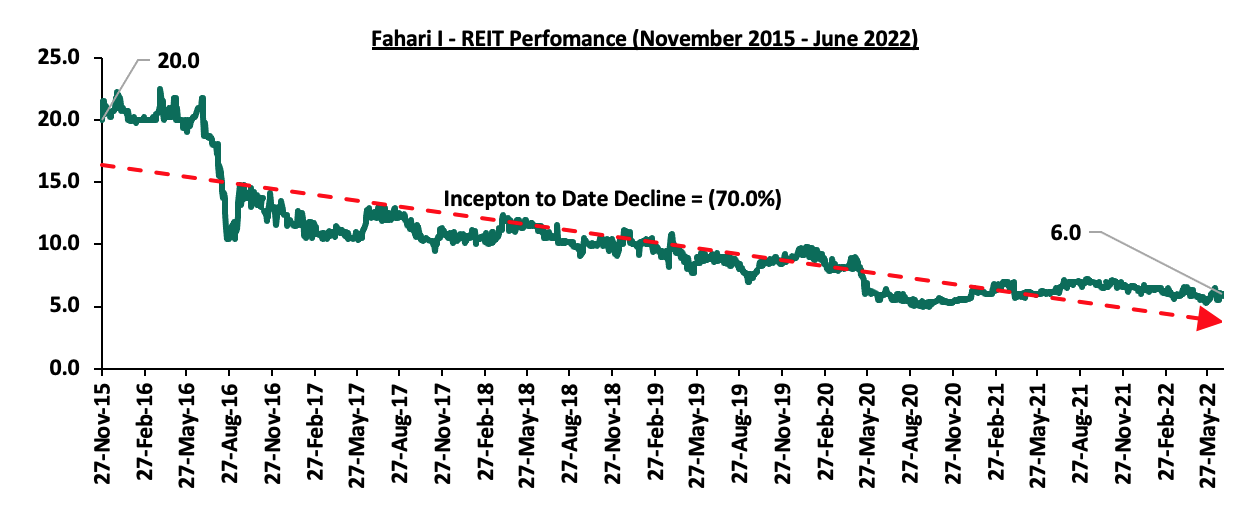
REITs offer various benefits which include low cost exposure to Real Estate, tax exemption, and diversification among many others, however, our outlook for the sector is NEUTRAL as its performance is expected to still be constrained by factors such as; i) Inadequate investor knowledge of the instrument, ii) Lengthy approval process, iii) High Minimum Capital Requirements for a Trustee of Kshs 100.0 mn, iv) Subdued performance of some Real Estate sectors due to the COVID-19 pandemic, and, v) High Minimum Investment Amounts Set at Kshs 5.0 mn.
Real Estate Performance Summary and Outlook
Below is a summary of the sectorial performance in H1’2022 and investment opportunities:
|
Theme |
Thematic Performance and Outlook H1’2022 |
Outlook |
|
Residential |
|
Neutral |
|
||
|
Commercial Office Sector |
|
Neutral (Leaning towards negative) |
|
||
|
Retail Sector |
|
Neutral |
|
||
|
Mixed-Use Developments (MUDs) |
|
Neutral |
|
||
|
Hospitality |
|
Neutral |
|
||
|
Land Sector |
|
Positive |
|
||
|
Listed Real Estate |
|
Neutral |
Disclaimer: The views expressed in this publication are those of the writers where particulars are not warranted. This publication, which is in compliance with Section 2 of the Capital Markets Authority Act Cap 485A, is meant for general information only and is not a warranty, representation, advice or solicitation of any nature. Readers are advised in all circumstances to seek the advice of a registered investment advisor

- Talk to us
- Kenya
- P.O Box 20695 - 00200, Nairobi, Kenya
- Cell +254709101200
- Tel +254709101200
- WhatsApp +254741676635
- United States
- +254709101200
- DOWNLOAD OUR APP
-


- Kenya
- 8th Floor, Pinetree Plaza, Kaburu Drive, Ngong Road, Nairobi, Kenya
- USA
- Suite 1150, 1775 Eye Street NW, USA, Washington DC 20006, USA
- Investments
- High Yield
- Private Equity
- Real Estate
- Real Estate
- RiverRun Estates
- Cytonn Towers
- The Ridge
- Taraji Heights
- The Alma