Sub-Saharan Africa Eurobonds Performance in 2023 & Cytonn Weekly #02/2024
By Research Team, Jan 14, 2024
Executive Summary
Fixed Income
During the week, T-bills were oversubscribed for the second consecutive week, with the overall oversubscription rate coming in at 241.5% up from the oversubscription rate of 134.5% recorded the previous week. Investors’ preference for the shorter 91-day paper persisted, with the paper receiving bids worth Kshs 44.6 bn against the offered Kshs 4.0 bn, translating to an oversubscription rate of 1,114.4%, higher than the oversubscription rate of 657.8% recorded the previous week. The subscription rate for the 182-day paper increased steeply to 101.0% from 46.7% recorded the previous week, while the subscription rate for the 364-day paper increased to 32.9% from 13.0%, recorded the previous week. The government accepted a total of Kshs 46.0 bn worth of bids out of Kshs 58.0 bn of bids received, translating to an acceptance rate of 79.3%. The yields on the government papers were on an upward trajectory with the yields on the 364-day, 182-day, and 91-day papers increasing by 11.3 bps, 9.6 bps, and 8.6 bps to 16.4%, 16.2%, and 16.1%, respectively;
In the primary market, the Central Bank of Kenya released the auction results for the newly issued bond FXD1/2024/003 with a tenor to maturity of 3.0 years and the re-opened bond FXD1/2023/005 with a 4.5-year tenor to maturity. The bonds were oversubscribed with the overall subscription rate coming in at 106.1%, receiving bids worth Kshs 37.2 bn against the offered Kshs 35.0 bn. The government accepted bids worth Kshs 25.0 bn, translating to an acceptance rate of 67.3%. The weighted average yield of accepted bids came in at 18.4% and 18.8% for FXD1/2024/003 and FXD1/2023/005, respectively, while the coupon rates for the FXD1/2024/003 and FXD1/2023/005 were set at 18.4% and 16.8%, respectively. The coupon rate for the newly issued bond FXD1/2024/003 is 4.2% points higher than that of FXD1/2023/003 at 14.2%. With the Inflation rate at 6.6% as of December 2023, the real return of the bonds is 11.8% and 12.2% for the FXD1/2024/003 and FXD1/2023/005, respectively.
Equities
During the week, the equities market recorded mixed performances, with NASI gaining by 0.3%, while NSE 25, NSE 20, and NSE 10 all declined by 0.3%, taking the YTD performance to gains of 1.2%, 1.2%, 0.9%, and 0.3% for NSE 25, NSE 10, NASI and NSE 20, respectively. The equities market performance was driven by gains recorded by large-cap stocks such as Safaricom, Stanbic Bank, and Equity Group of 2.2%, 0.4%, and 0.4% respectively. The gains were, however, weighed down by losses recorded by large-cap stocks such as Bamburi, DTBK, and Absa Bank of 6.7%, 3.8%, and 3.0% respectively;
Real Estate
During the week President Ruto launched various affordable housing projects in the country including; Kapsuswa Affordable Housing Project and Pioneer Affordable Housing Project both located in Uasin Gishu County and Nanyuki Affordable Housing in Laikipia County;
In the infrastructure sector, President Ruto launched the tarmacking of several road projects, which included Lamuria-Solio-Kihara primary school roads, and Boiman-Kwa Mumbi road in Laikipia and Nyandarua Counties respectively;
In regulated Real Estate Funds sector, under the Real Estate Investment Trusts (REITs) segment, Fahari I-REIT closed the week trading at an average price of Kshs 6.3 per share in the Nairobi Securities Exchange representing a 4.6% gain from Kshs 6.1 recorded the previous week;
On the Unquoted Securities Platform, as at 1st December 2023, Acorn D-REIT and I-REIT closed the week trading at Kshs 25.3 and Kshs 21.7 per unit, a 26.6% and 8.3% gain for the D-REIT and I-REIT, respectively, from the Kshs 20.0 inception price. In addition, Cytonn High Yield Fund (CHYF) closed the week with an annualized yield of 18.0%, remaining relatively unchanged from the previous week;
Focus of the Week
The international Eurobonds market has over the years allowed countries in the Sub-Saharan Africa (SSA) region to raise funding to refinance maturing debt obligations, finance their budget deficits and undertake heavy infrastructural projects. In 2023, Sub-Saharan Africa (SSA) was largely excluded from the international Eurobonds market due to high interest rates demanded by investors. The only exception was Gabon, which issued a USD 0.5 bn blue bond as a swap of new debt to retire more expensive old debt. This is a stark contrast to 2022 when SSA, specifically Nigeria and Angola, issued Eurobonds amounting to USD 3.0 bn. In our focus this week, we provide a detailed analysis of Sub-Saharan Africa (SSA) Eurobonds performance in the year 2023, examining the factors driving the high yields and the debt sustainability concerns within the regions, followed by our outlook on yield performance in 2024;
Investment Updates:
- Weekly Rates:
- Cytonn Money Market Fund closed the week at a yield of 15.50% p.a. To invest, dial *809# or download the Cytonn App from Google Play store here or from the Appstore here;
- Cytonn High Yield Fund closed the week at a yield of 17.97% p.a. To invest, email us at sales@cytonn.com and to withdraw the interest, dial *809# or download the Cytonn App from Google Play store here or from the Appstore here;
- We continue to offer Wealth Management Training every Monday, from 10:00 am to 12:00 pm. The training aims to grow financial literacy among the general public. To register for any of our Wealth Management Trainings, click here;
- If interested in our Private Wealth Management Training for your employees or investment group, please get in touch with us through wmt@cytonn.com;
- Cytonn Insurance Agency acts as an intermediary for those looking to secure their assets and loved ones’ future through insurance namely; Motor, Medical, Life, Property, WIBA, Credit and Fire and Burglary insurance covers. For assistance, get in touch with us through insuranceagency@cytonn.com;
- Cytonn Asset Managers Limited (CAML) continues to offer pension products to meet the needs of both individual clients who want to save for their retirement during their working years and Institutional clients that want to contribute on behalf of their employees to help them build their retirement pot. To more about our pension schemes, kindly get in touch with us through pensions@cytonn.com;
Real Estate Updates:
- For more information on Cytonn’s real estate developments, email us at sales@cytonn.com;
- Phase 3 of The Alma is now ready for occupation and the show house is open daily. To join the waiting list to rent, please email properties@cytonn.com;
- For Third Party Real Estate Consultancy Services, email us at rdo@cytonn.com;
- For recent news about the group, see our news section here;
Hospitality Updates:
- We currently have promotions for Staycations. Visit cysuites.com/offers for details or email us at sales@cysuites.com;
Money Markets, T-Bills Primary Auction:
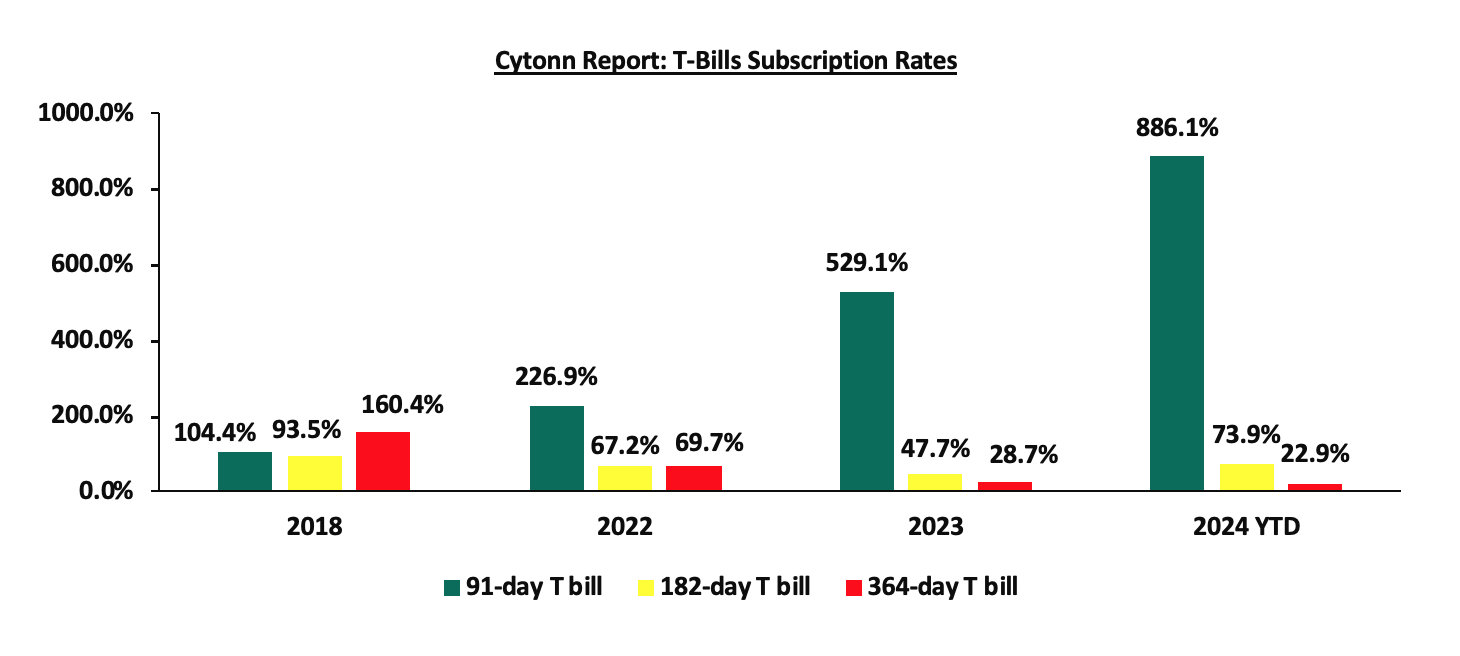
During the week, T-bills were oversubscribed for the second consecutive week, with the overall oversubscription rate coming in at 241.5% up from the oversubscription rate of 134.5% recorded the previous week. Investors’ preference for the shorter 91-day paper persisted, with the paper receiving bids worth Kshs 44.6 bn against the offered Kshs 4.0 bn, translating to an oversubscription rate of 1,114.4%, higher than the oversubscription rate of 657.8% recorded the previous week. The subscription rate for the 182-day paper increased steeply to 101.0% from 46.7% recorded the previous week, while the subscription rate for the 364-day paper increased to 32.9% from 13.0%, recorded the previous week. The government accepted a total of Kshs 46.0 bn worth of bids out of Kshs 58.0 bn of bids received, translating to an acceptance rate of 79.3%. The yields on the government papers were on an upward trajectory with the yields on the 364-day, 182-day, and 91-day papers increasing by 11.3 bps, 9.6 bps, and 8.6 bps to 16.4%, 16.2%, and 16.1%, respectively. The chart below compares the overall average T-bill subscription rates obtained in 2018, 2022, 2023, and 2024 Year-to-date (YTD):
In the primary market, the Central Bank of Kenya released the auction results for the newly issued bond FXD1/2024/003 with a tenor to maturity of 3.0 years and the re-opened bond FXD1/2023/005 with a 4.5-year tenor to maturity. The bonds were oversubscribed with the overall subscription rate coming in at 106.1%, receiving bids worth Kshs 37.2 bn against the offered Kshs 35.0 bn. The government accepted bids worth Kshs 25.0 bn, translating to an acceptance rate of 67.3%. The weighted average yield of accepted bids came in at 18.4% and 18.8% for FXD1/2024/003 and FXD1/2023/005, respectively, while the coupon rates for the FXD1/2024/003 and FXD1/2023/005 were set at 18.4% and 16.8%, respectively. The coupon rate for the newly issued bond FXD1/2024/003 is 4.2% points higher than that of FXD1/2023/003 at 14.2%. With the Inflation rate at 6.6% as of December 2023, the real return of the bonds is 11.8% and 12.2% for the FXD1/2024/003 and FXD1/2023/005, respectively.
Money Market Performance:
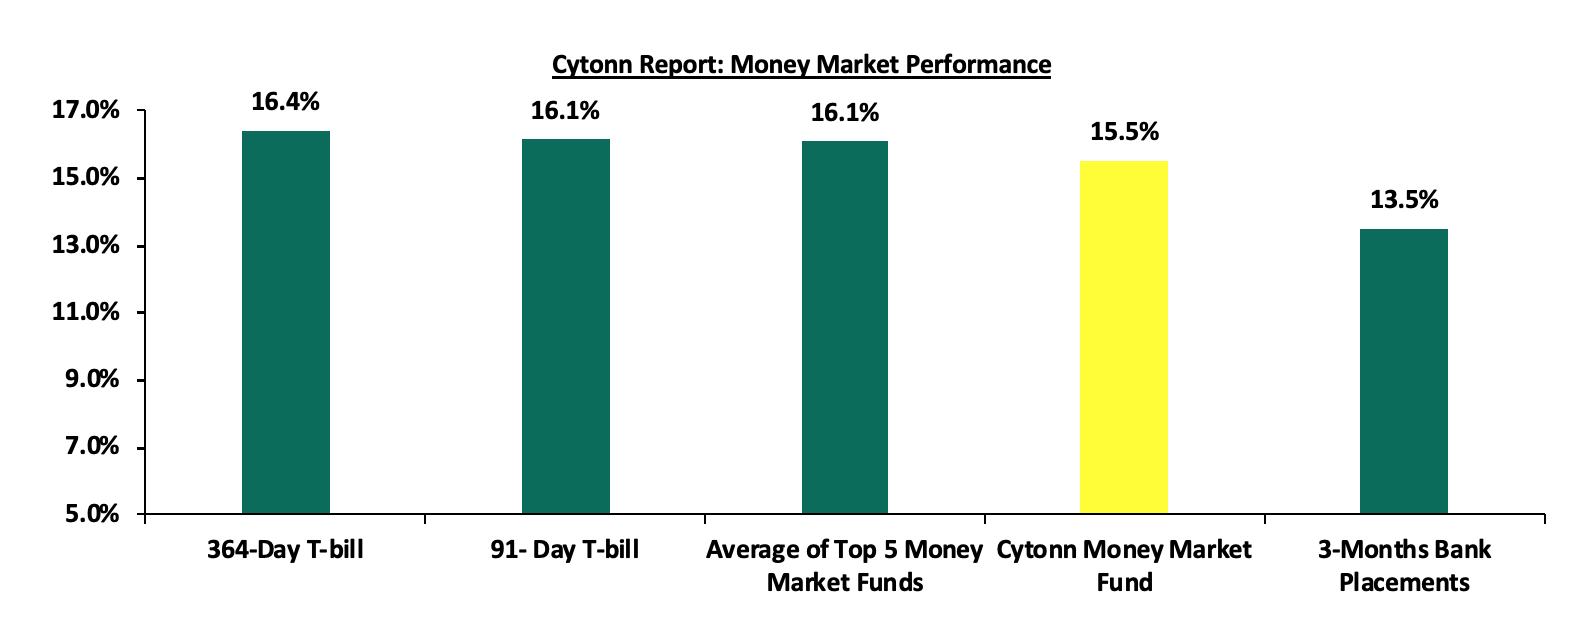
In the money markets, 3-month bank placements ended the week at 13.5% (based on what we have been offered by various banks), and the yields on the 364-day paper increased by 11.3 bps to 16.4% and 91-day T-bill yield increased by 8.6 bps to 16.1%. The yields of the Cytonn Money Market Fund increased slightly by 3.0 bps to remain relatively unchanged at 15.5% recorded the previous week, and the average yields on the Top 5 Money Market Funds increased by 7.6 bps to 16.1%, from 16.0% recorded the previous week.
The table below shows the Money Market Fund Yields for Kenyan Fund Managers as published on 12th January 2024:
|
Cytonn Report: Money Market Fund Yield for Fund Managers as published on 12th January 2024 |
||
|
Rank |
Fund Manager |
Effective Annual |
|
1 |
Etica Money Market Fund |
16.5% |
|
2 |
Lofty-Corban Money Market Fund |
16.3% |
|
3 |
GenAfrica Money Market Fund |
16.2% |
|
4 |
Nabo Africa Money Market Fund |
16.0% |
|
5 |
Cytonn Money Market Fund (Dial *809# or download the Cytonn app) |
15.5% |
|
6 |
Apollo Money Market Fund |
15.4% |
|
7 |
Kuza Money Market fund |
14.8% |
|
8 |
Enwealth Money Market Fund |
14.8% |
|
9 |
Madison Money Market Fund |
14.5% |
|
10 |
Co-op Money Market Fund |
13.9% |
|
11 |
Sanlam Money Market Fund |
13.7% |
|
12 |
GenCap Hela Imara Money Market Fund |
13.2% |
|
13 |
Mayfair Money Market Fund |
13.2% |
|
14 |
AA Kenya Shillings Fund |
13.0% |
|
15 |
Jubilee Money Market Fund |
12.9% |
|
16 |
Orient Kasha Money Market Fund |
12.8% |
|
17 |
Old Mutual Money Market Fund |
12.7% |
|
18 |
Absa Shilling Money Market Fund |
12.7% |
|
19 |
Dry Associates Money Market Fund |
12.6% |
|
20 |
KCB Money Market Fund |
12.5% |
|
21 |
CIC Money Market Fund |
12.0% |
|
22 |
ICEA Lion Money Market Fund |
11.7% |
|
23 |
Equity Money Market Fund |
11.5% |
|
24 |
Mali Money Market Fund |
11.5% |
|
25 |
British-American Money Market Fund |
9.0% |
Source: Business Daily
Liquidity:
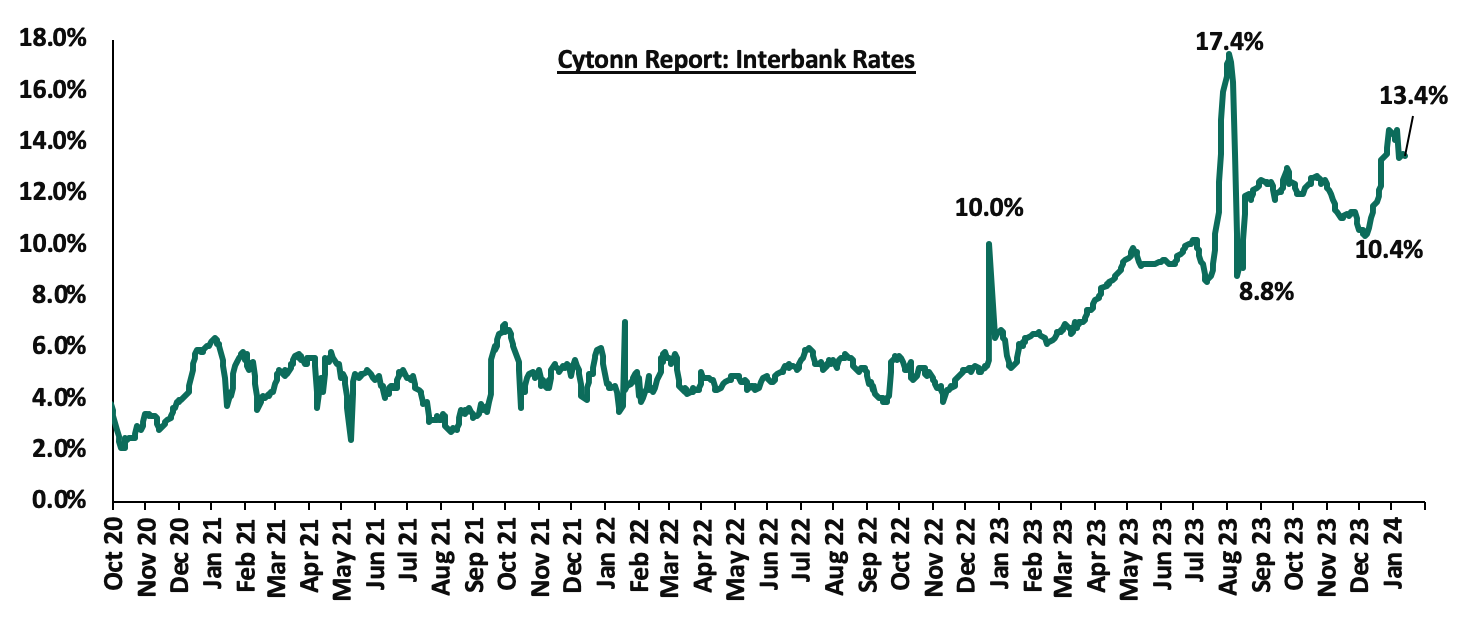
During the week, liquidity in the money markets eased, a reversal from the increase over the last four weeks, with the average interbank rate decreasing to 13.4% from 14.3% recorded the previous week, partly attributable to the government payments that offset tax remittances. The average interbank volumes traded increased by 0.1% to remain relatively unchanged at Kshs 21.7 bn recorded the previous week. The chart below shows the interbank rates in the market over the years:
Kenya Eurobonds:
During the week, the yields on Eurobonds were on a downward trajectory, with the yields on the 10-year Eurobond issued in 2014 decreasing the most by 0.9% points, to 14.7% from 15.5% recorded the previous week, while the yields on the 30-year Eurobond issued in 2018 decreased the least by 0.1% points to 10.4% from 10.5% recorded the previous week. The table below shows the summary of the performance of the Kenyan Eurobonds as of 12th January 2024;
|
Cytonn Report: Kenya Eurobonds Performance |
||||||
|
|
2014 |
2018 |
2019 |
2021 |
||
|
Tenor |
10-year issue |
10-year issue |
30-year issue |
7-year issue |
12-year issue |
12-year issue |
|
Amount Issued (USD) |
2.0 bn |
1.0 bn |
1.0 bn |
0.9 bn |
1.2 bn |
1.0 bn |
|
Years to Maturity |
0.4 |
4.1 |
24.1 |
3.4 |
8.4 |
10.4 |
|
Yields at Issue |
6.6% |
7.3% |
8.3% |
7.0% |
7.9% |
6.2% |
|
01-Jan-24 |
13.6% |
9.8% |
10.2% |
10.1% |
9.9% |
9.5% |
|
04-Jan-24 |
15.5% |
10.5% |
10.5% |
11.1% |
10.3% |
9.9% |
|
05-Jan-24 |
15.9% |
10.6% |
10.6% |
11.2% |
10.4% |
10.0% |
|
08-Jan-24 |
16.3% |
10.6% |
10.6% |
11.2% |
10.4% |
10.0% |
|
09-Jan-24 |
16.0% |
10.6% |
10.6% |
11.2% |
10.5% |
10.0% |
|
10-Jan-24 |
15.4% |
10.4% |
10.5% |
10.9% |
10.3% |
9.9% |
|
11-Jan-24 |
14.7% |
10.2% |
10.4% |
10.7% |
10.1% |
9.8% |
|
Weekly Change |
(0.9%) |
(0.3%) |
(0.1%) |
(0.4%) |
(0.2%) |
(0.2%) |
|
MTD Change |
1.1% |
0.4% |
0.2% |
0.6% |
0.2% |
0.2% |
|
YTD Change |
1.1% |
0.4% |
0.2% |
0.6% |
0.2% |
0.2% |
Source: Central Bank of Kenya (CBK) and National Treasury
Kenya Shilling:
During the week, the Kenya Shilling depreciated against the US Dollar by 1.2% to close at Kshs 159.9, from Kshs 157.9 recorded the previous week. On a year-to-date basis, the shilling has depreciated by 1.8% against the dollar, adding to the 26.8% depreciation recorded in 2023. We expect the shilling to remain under pressure in 2024 as a result of:
- An ever-present current account deficit which came at 3.5% of GDP in Q3’2023 from 6.4% recorded in a similar period in 2022,
- The need for government debt servicing, continues to put pressure on forex reserves given that 67.1% of Kenya’s external debt was US Dollar denominated as of June 2023, and,
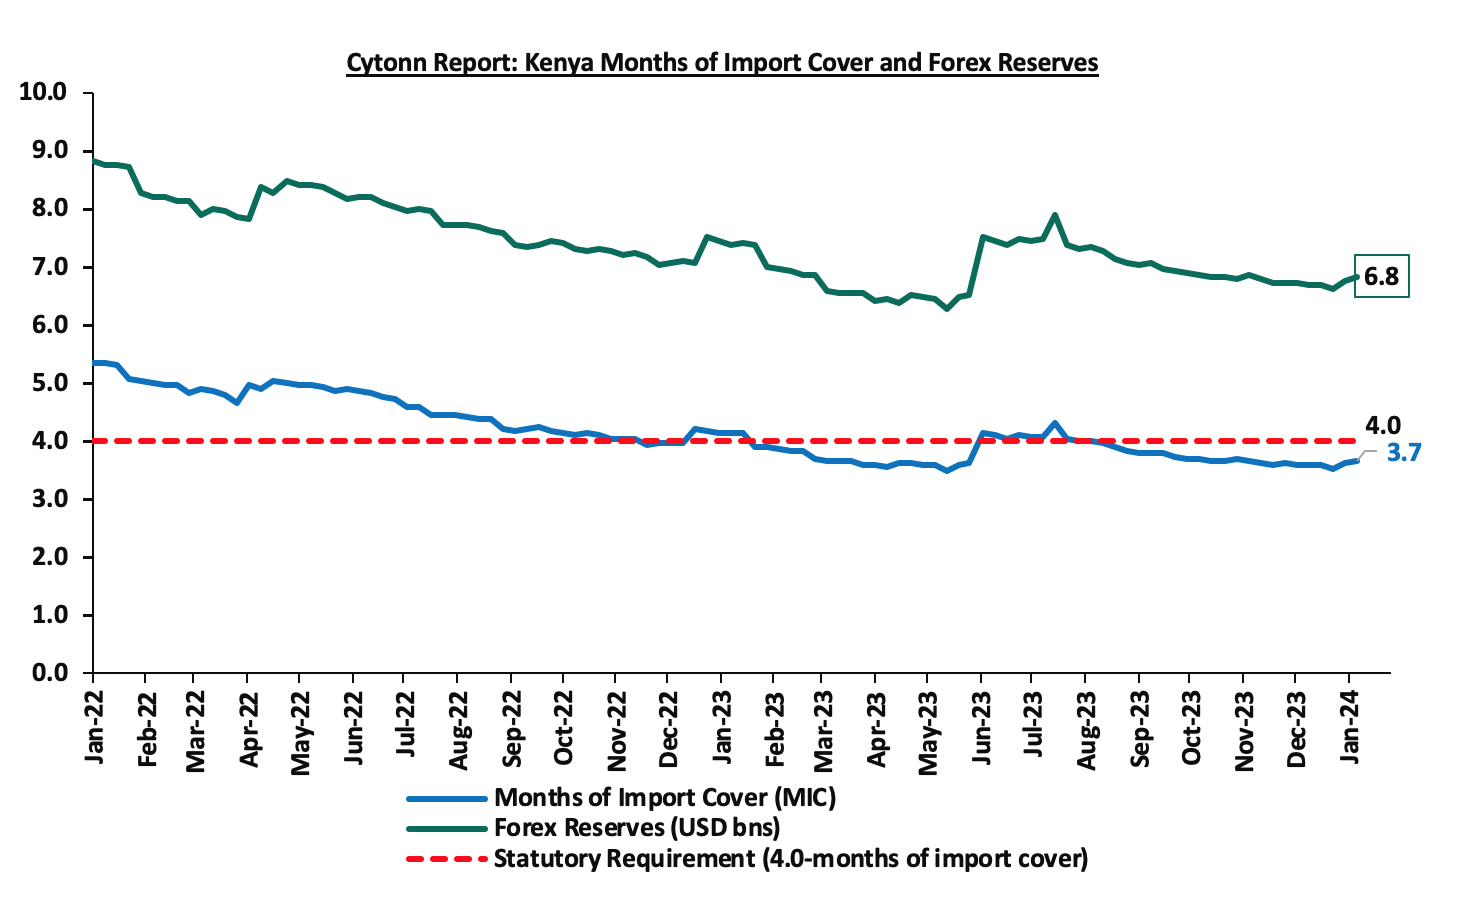
- Dwindling forex reserves, currently at USD 6.8 mn (equivalent to 3.7 months of import cover), which is below the statutory requirement of maintaining at least 4.0 months of import cover.
The shilling is however expected to be supported by:
- Diaspora remittances standing at a cumulative USD 3,817.4 mn as of November 2023, 4.0% higher than the USD 3,670.6 mn recorded over the same period in 2022, which has continued to cushion the shilling against further depreciation. In the November 2023 diaspora remittances figures, North America remained the largest source of remittances to Kenya accounting for 57.2% in the period, and,
- The tourism inflow receipts which came in at USD 268.1 mn in 2022, a significant 82.9% increase from USD 146.5 mn inflow receipts recorded in 2021, and tourist arrivals improved by 34.1% in the 12 months to October 2023, compared to a similar period in 2022.
Key to note, Kenya’s forex reserves increased during the week to USD 6.83 from USD 6.78 bn recorded the previous week, equivalent to 3.7 months of import cover higher than 3.6 months of import cover recorded the previous week, but remained below the statutory requirement of maintaining at least 4.0 months of import cover. The chart below summarizes the evolution of Kenya's months of import cover over the years:
Rates in the Fixed Income market have been on an upward trend given the continued high demand for cash by the government and the occasional liquidity tightness in the money market. The government is 36.6% behind of its prorated net domestic borrowing target of Kshs 256.4 bn, having a net borrowing position of Kshs 162.7 bn out of the domestic net borrowing target of Kshs 471.4 bn for the FY’2023/2024. Therefore, we expect a continued upward readjustment of the yield curve in the short and medium term, with the government looking to maintain the fiscal surplus through the domestic market. Owing to this, our view is that investors should be biased towards short-term fixed-income securities to reduce duration risk.
Market Performance:
During the week, the equities market recorded mixed performances, with NASI gaining by 0.3%, while NSE 25, NSE 20, and NSE 10 all declined by 0.3%, taking the YTD performance to gains of 1.2%, 1.2%, 0.9%, and 0.3% for NSE 25, NSE 10, NASI and NSE 20, respectively. The equities market performance was driven by gains recorded by large-cap stocks such as Safaricom, Stanbic Bank, and Equity Group of 2.2%, 0.4%, and 0.4% respectively. The gains were, however, weighed down by losses recorded by large-cap stocks such as Bamburi, DTBK, and Absa Bank of 6.7%, 3.8%, and 3.0% respectively.
During the week, equities turnover increased by 181.4% to USD 4.3 mn from USD 1.5 mn recorded the previous week, taking the YTD total turnover to USD 5.8 mn. Foreign investors became net sellers for the first time in three weeks with a net selling position of USD 0.6 mn, from a net buying position of USD 0.2 mn recorded the previous week, taking the YTD foreign net selling position to USD 0.5 mn.
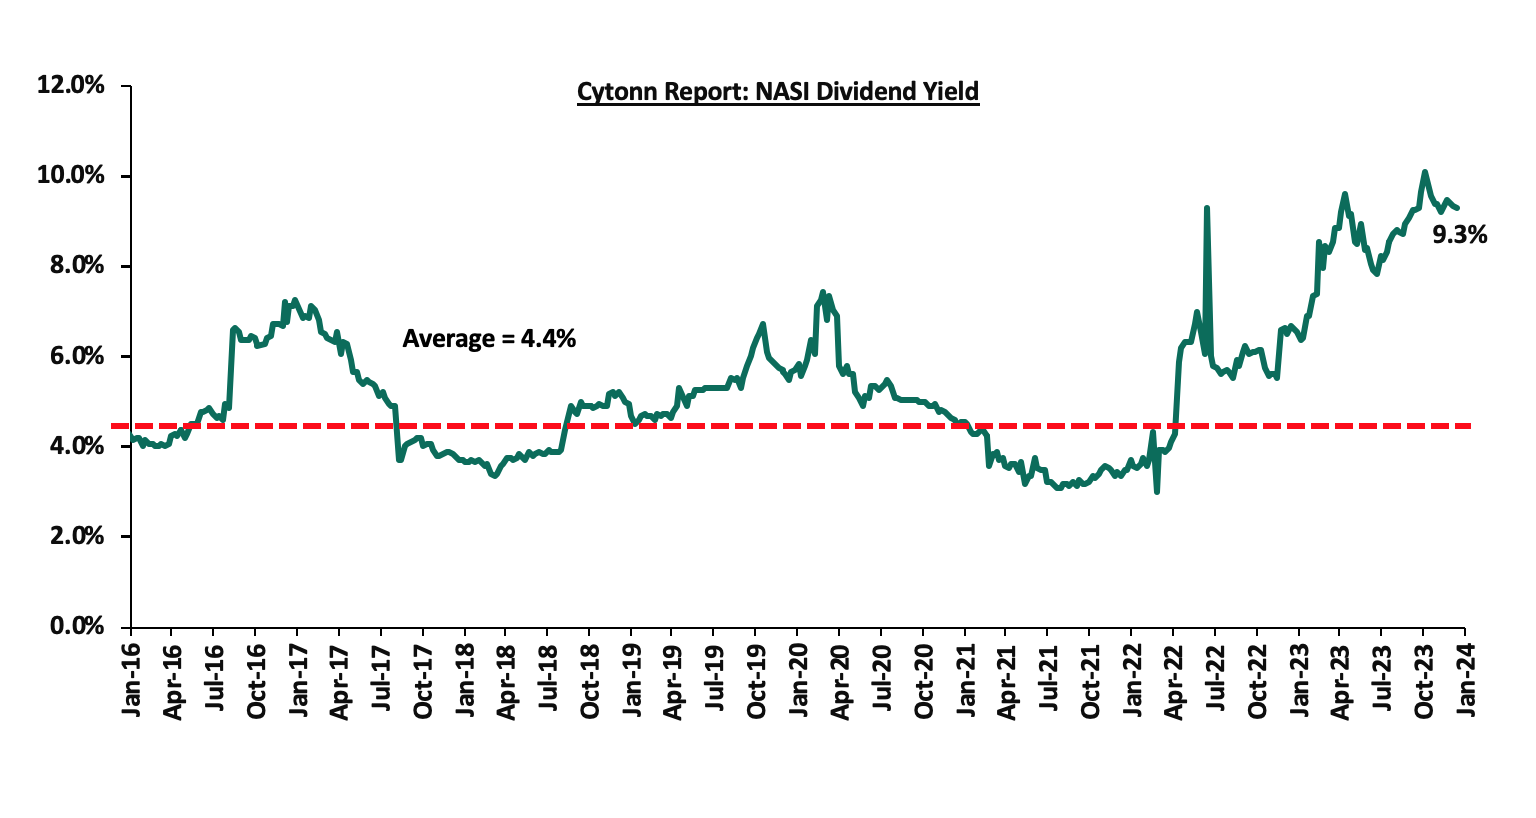
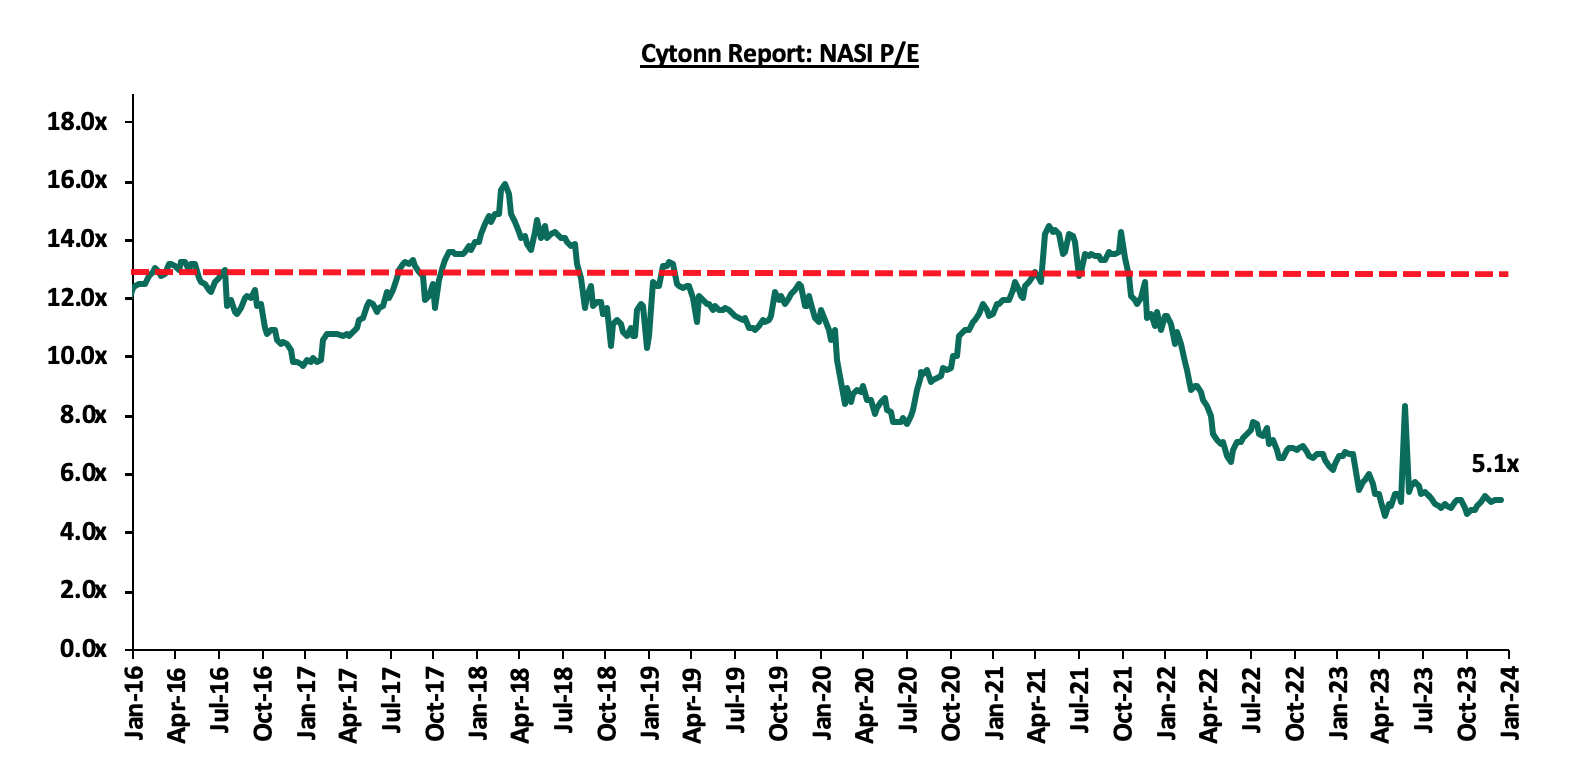
The market is currently trading at a price-to-earnings ratio (P/E) of 5.1x, 57.7% below the historical average of 12.1x. The dividend yield stands at 9.3%, 4.9% points above the historical average of 4.4%. Key to note, NASI’s PEG ratio currently stands at 0.7x, an indication that the market is undervalued relative to its future growth. A PEG ratio greater than 1.0x indicates the market is overvalued while a PEG ratio less than 1.0x indicates that the market is undervalued. The charts below indicate the historical P/E and dividend yields of the market;
Universe of Coverage:
|
Cytonn Report: Universe of Coverage |
|||||||||
|
Company |
Price as at 05/01/2024 |
Price as at 12/01/2024 |
w/w change |
YTD Change |
Target Price* |
Dividend Yield |
Upside/ Downside** |
P/TBv Multiple |
Recommendation |
|
Sanlam |
5.6 |
6.0 |
7.1% |
0.0% |
10.3 |
0.0% |
71.5% |
1.7x |
Buy |
|
Jubilee Holdings |
185.0 |
180.0 |
(2.7%) |
(2.7%) |
260.7 |
6.7% |
51.5% |
0.3x |
Buy |
|
KCB Group*** |
22.6 |
22.0 |
(2.4%) |
0.2% |
31.2 |
9.1% |
50.9% |
0.4x |
Buy |
|
Diamond Trust Bank*** |
46.5 |
44.8 |
(3.8%) |
0.0% |
58.5 |
11.2% |
41.9% |
0.2x |
Buy |
|
ABSA Bank*** |
11.7 |
11.3 |
(3.0%) |
(2.2%) |
14.6 |
11.9% |
41.2% |
0.9x |
Buy |
|
I&M Group*** |
17.5 |
17.5 |
0.0% |
0.3% |
22.1 |
12.9% |
39.1% |
0.4x |
Buy |
|
NCBA*** |
38.1 |
37.8 |
(0.7%) |
(2.7%) |
48.3 |
11.2% |
39.0% |
0.8x |
Buy |
|
Kenya Reinsurance |
1.8 |
2.0 |
6.6% |
5.4% |
2.5 |
10.3% |
39.0% |
0.2x |
Buy |
|
Co-op Bank*** |
11.3 |
11.3 |
0.0% |
(0.9%) |
13.8 |
13.3% |
36.0% |
0.5x |
Buy |
|
Equity Group*** |
35.7 |
35.8 |
0.4% |
4.7% |
42.8 |
11.2% |
30.7% |
0.8x |
Buy |
|
Stanbic Holdings |
111.3 |
111.8 |
0.4% |
5.4% |
132.8 |
11.3% |
30.1% |
0.8x |
Buy |
|
Standard Chartered*** |
162.3 |
161.0 |
(0.8%) |
0.5% |
185.5 |
13.7% |
28.9% |
1.1x |
Buy |
|
Liberty Holdings |
4.2 |
5.0 |
18.5% |
29.5% |
5.9 |
0.0% |
18.4% |
0.4x |
Accumulate |
|
Britam |
4.9 |
5.1 |
3.6% |
(0.4%) |
6.0 |
0.0% |
16.6% |
0.7x |
Accumulate |
|
CIC Group |
2.2 |
2.3 |
2.7% |
(1.3%) |
2.5 |
5.8% |
16.4% |
0.7x |
Accumulate |
|
HF Group |
3.4 |
3.4 |
1.8% |
(1.2%) |
3.9 |
0.0% |
14.4% |
0.2x |
Accumulate |
We are “Neutral” on the Equities markets in the short term due to the current tough operating environment and huge foreign investor outflows, and, “Bullish” in the long term due to current cheap valuations and expected global and local economic recovery.
With the market currently being undervalued to its future growth (PEG Ratio at 0.7x), we believe that investors should reposition towards value stocks with strong earnings growth and that are trading at discounts to their intrinsic value. We expect the current high foreign investors' sell-offs to continue weighing down the equities outlook in the short term.
- Residential sector
During the week, President Ruto launched the Pioneer Affordable Housing project located in Uasin Gishu County. The project will comprise of 1,506 housing units incorporating one, two and three-bedroom typologies, a kindergarten, mixed-use commercial spaces, a social hall, and extensive supportive infrastructure including sewer and water infrastructure. Development of the project will be on a 13.0-acre piece of land, and is set to be completed in 2026. The tables below give a summary of the unit types, sizes and prices for social housing and affordable housing units respectively;
|
Cytonn Report: Pioneer Affordable Housing Project-Social Housing |
||||
|
Typology |
Size (SQM) |
Price (Kshs in mns) |
Price per SQM |
Monthly Payment |
|
1-bedroom |
20 |
0.8 |
42,000 |
3,200 |
|
2-bedroom |
30 |
1.2 |
42,000 |
4,800 |
|
3-bedroom |
40 |
1.7 |
42,000 |
6,400 |
|
Average |
30 |
1.3 |
4,2000 |
4,800 |
Source: Online Research
|
Cytonn Report: Pioneer Affordable Housing Project-Affordable Housing |
||||
|
Typology |
Size (SQM) |
Price (Kshs in mns) |
Price per SQM |
Monthly Payment |
|
Studio |
20 |
1.0 |
48,000 |
5,200 |
|
2-bedroom |
30 |
1.7 |
56,000 |
6,400 |
|
3-bedroom |
40 |
1.9 |
48,000 |
10,400 |
|
Average |
30 |
1.5 |
50,666 |
7,333 |
Source: Online Research
We expect, upon implementation, the project will stimulate economic activities in the area as local artisans in the Jua Kali sector stand to benefit from the sourcing of materials locally. In support of this, artisans will be engaged to manufacture windows, hedges, and doors. In addition, the project is expected to provide employment to approximately 1,500 youths, by creating both direct and indirect jobs.
Additionally, the President launched the Kapsuswa Affordable Housing Project, also located in Uasin Gishu County. The project will sit on a 3.2-acre piece of land and aims at developing 220 housing units consisting of 60 studio apartments, 40 one-bedroom units, 100 two-bedroom units, and 20 three-bedroom units. The project will also include a primary school; Kidiwa Primary school comprising grades 1 to 9. Notably, the Kapsuswa project will engage more than 500 youths directly in construction and is estimated to create close to 3,000 jobs both directly and indirectly.
In Laikipia County, President Ruto laid the foundation for the construction of 200 housing situated on a 2.5-piece acre of land under the Nanyuki Affordable Housing project. The project will comprise 60 studio apartments, 20 one-bedroom units, 100 two-bedroom units and 20 three-bedroom units, out of which, 20.0% of one- and two-bedroom units will be put under Tenant Purchase Scheme (TPS). The project will also entail a wide range of facilities including; social halls, commercial shops, a playing area, tree nursery, electricity and water connection, tarmacked roads, and fibre internet connectivity.
Furthermore, Kilifi County government, in partnership with the National government identified 11 sites for the construction of affordable housing units. The government plans to build two mini-cities in the coastal region, and has identified Mtwapa and Mariakani as suitable locations on which it intends to build 10,000 housing units. Moreover, the State Department for Housing and Urban Development also announced the construction of 20,000 affordable housing units across the Coast region. The initiative is to be spearheaded by the National Housing Corporation (NHC), which owns about 60.0 acres of land in Changamwe, Mombasa. The units that will be subdivided into; 10,000 affordable housing, 4,000 social housing, and 6,000 affordable market housing units. The two development projects underscore the growing momentum of affordable housing projects in the coastal counties, which unlike their counterparts, have lagged behind and subsequently witnessed a scarcity of affordable housing projects (AHP) over the years.
In general, these developments confirm the government’s sustained efforts to provide affordable housing and effectively address the urgent housing needs within the country, as well as highlight the growing importance of the role counties play in provision of affordable housing. We expect the projects will; i) contribute to easing unemployment in the country by providing direct and indirect jobs to the local communities, ii) assist in solving the 80.0% housing deficit in the country which represents 200,000 units annually, iii) raise the standards of living and quality of life of residents and surrounding local community, and, iv) contribute to the general growth of the country’s economy.
Going forward, we expect to witness an increase in the number of affordable housing projects launched, commissioned, and completed in the year by both the government and the private sector. We also expect the government will continue to intensify its efforts to make progress towards delivering 200,000 units annually. This is evidenced by the increased activities initiated by the National government in collaboration with County governments, in providing land for the development of affordable housing projects to the private sector under Public-Private Partnerships (PPPs) arrangements.
- Infrastructure Sector
During the week, President Ruto launched several road projects, including Lamuria-Solio-Kihara primary school road, in Laikipia County and Boiman-Kwa-Mumbi Road in Nyandarua County. President Ruto highlighted that the two projects will cover over 400-Kilometres and are poised to boost the agricultural sector in the region.
We note that enhanced infrastructure plays a pivotal role in connecting remote areas to new opportunities, facilitating access to markets, and catalyzing economic activities as well as contributing to the growth of Real Estate. These projects cement the government’s efforts to open up the country through road networks which act as arteries to economic activities. With increased accessibility and connectivity between farms and markets, agricultural products will reach buyers in the market in due time. Additionally, local youths stand to benefit from job opportunities generated from the projects thus stimulating increased economic activities in the area. These projects are in line are the government’s agenda of improving livelihood through job and wealth creation.
Moving forward, we expect to witness an increase in the number of infrastructure projects rolled out as the government strives to improve the country’s infrastructure. We however note that Kenya’s infrastructure sector may witness a slowdown in the number of initiated and completed construction and maintenance projects compared to previous years, particularly in the roads sector. This is primarily due to a reduction in budgetary allocations in the FY’2023/24.
- Regulated Real Estate Funds
- Real Estate Investments Trusts (REITs)
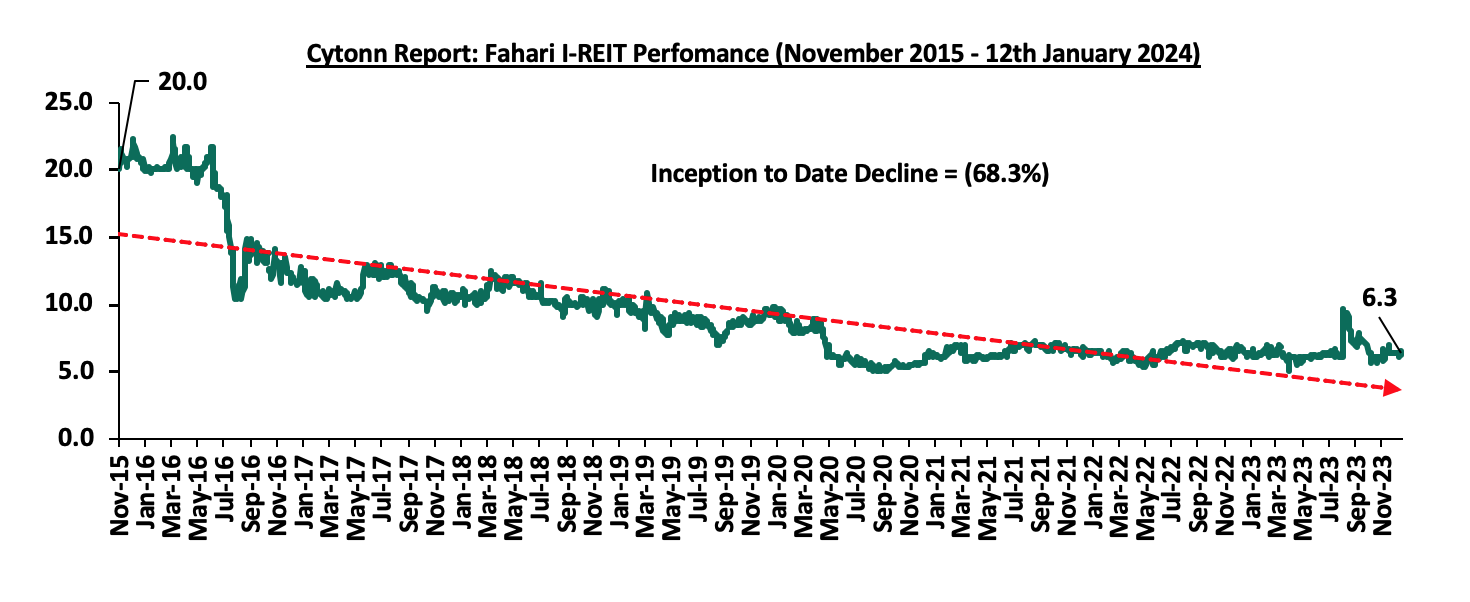
In the Nairobi Securities Exchange, ILAM Fahari I-REIT closed the week trading at an average price of Kshs 6.3 per share. The performance represents a 4.6% gain from Kshs 6.1 per share recorded last week, taking it to a 0.6% Year-to-Date (YTD) gain from Kshs 6.3 per share recorded on 3rd January 2023. Additionally, the performance represents a 68.3% Inception-to-Date (ITD) loss from the Kshs 20.0 price. The dividend yield currently stands at 10.3%. The graph below shows Fahari I-REIT’s performance from November 2015 to 12th January 2024;
In the Unquoted Securities Platform Acorn D-REIT and I-REIT traded at Kshs 25.3 and Kshs 21.7 per unit, respectively, as of 1st December 2023. The performance represented a 26.6% and 8.3% gain for the D-REIT and I-REIT, respectively, from the Kshs 20.0 inception price. The volumes traded for the D-REIT and I-REIT came in at 12.3 mn and 30.7 mn shares, respectively, with a turnover of Kshs 257.5 mn and Kshs 633.8 mn, respectively, since inception in February 2021.
REITs provide various benefits like tax exemptions, diversified portfolios, and stable long-term profits. However, the continuous deterioration in the performance of Kenyan REITs and the restructuring of their business portfolios is hampering major investments that had previously been made. The other general challenges include; i) inadequate comprehension of the investment instrument among investors, ii) prolonged approval processes for REIT creation, iii) high minimum capital requirements of Kshs 100.0 mn for trustees, and, iv) minimum investment amounts set at Kshs 5.0 mn, continue to limit the performance of the Kenyan REITs market.
- Cytonn High Yield Fund (CHYF)
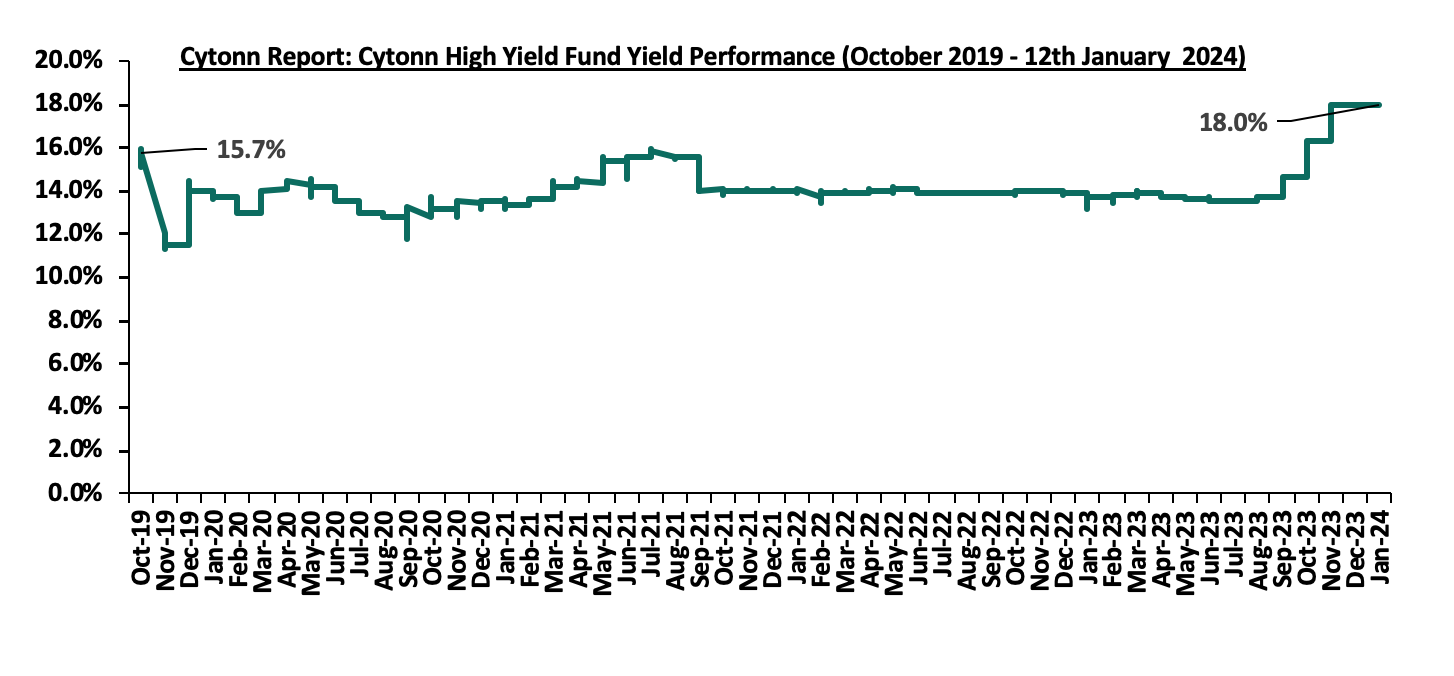
Cytonn High Yield Fund (CHYF) closed the week with an annualized yield of 18.0%, remaining relatively unchanged from the previous week. The performance remained constant at 18.0% yield recorded on 1st January 2024, and represented a 2.3% points Inception-to-Date (ITD) increase from the 15.7% yield. The graph below shows Cytonn High Yield Fund’s performance from November 2019 to 12th January 2024;
Notably, the CHYF has outperformed other regulated Real Estate funds with an annualized yield of 18.0%, as compared to Fahari I-REIT and Acorn I-REIT with yields of 10.3%, and 2.8% respectively. As such, the higher yields offered by CHYF makes the fund one of the best alternative investment resource in the Real Estate sector. The graph below shows the yield performance of the Regulated Real Estate Funds;
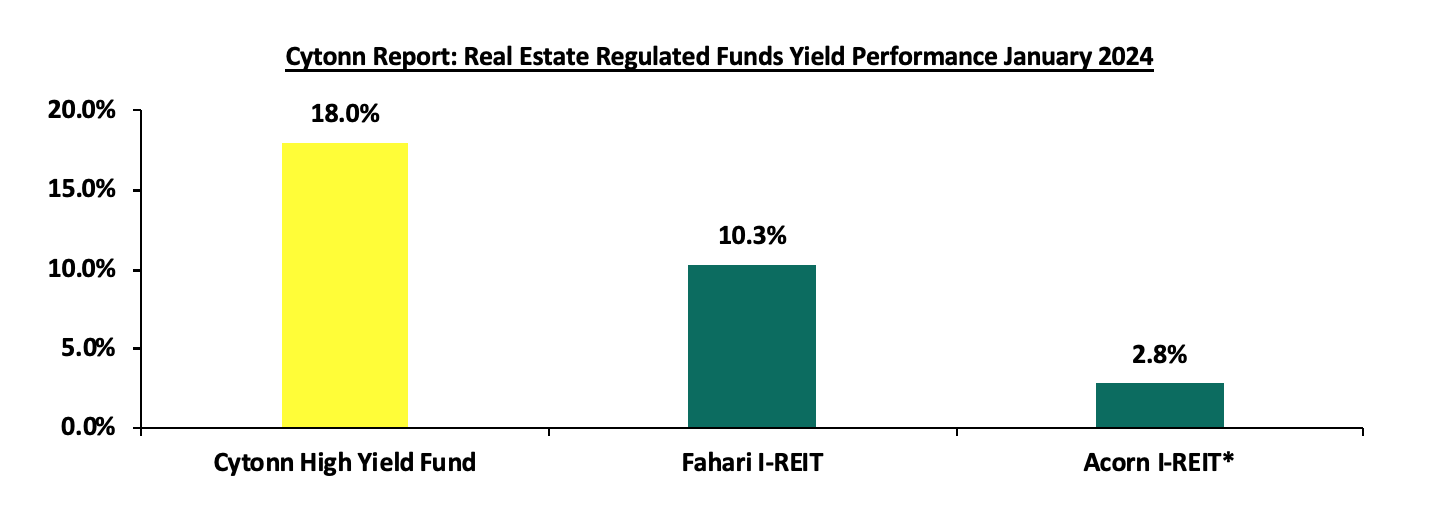
*H1’2023
Source: Cytonn Research
We expect the performance of Kenya’s Real Estate sector will be supported by; i) increased initiations and development of affordable housing projects expected to boost the residential sector, ii) relatively positive demographics in the country necessitating the demand for housing and Real Estate, and, iii) continued infrastructural improvements opening up new areas for investments. However, factors such as rising costs of construction, limited investor knowledge in REITs, and, existing oversupply in select Real Estate sectors will continue to hinder optimal performance of the sector by limiting developments and investments.
Eurobonds are fixed income debt instruments issued in a currency other than the currency of the country or market in which they are issued, mostly denominated in a currency that is widely traded and accepted globally, like the US Dollar or the Euro. Generally, Eurobonds allow issuers to tap into a broader investor base allowing for diversification in capital sourcing. Hence, Sub-Saharan Eurobonds, of which most are listed on the London and Irish stock exchanges, allow governments and corporations to raise funds by issuing bonds in a foreign currency. Majority of countries in the region issue Eurobonds to finance maturing debt obligations, finance their budget deficits and undertake heavy infrastructural projects.
In 2023, Sub-Saharan Africa (SSA) was largely excluded from the international Eurobonds market due to high interest rates demanded by investors. The only outlier was Gabon, which issued a USD 0.5 bn blue bond, but even this was an exception as it was a swap for a cheaper rate tied to conservation efforts. This is a stark contrast to 2022 when SSA, specifically Nigeria and Angola, issued Eurobonds amounting to USD 3.0 bn. The difficulty in issuing Eurobonds is due to increasing USA rates and spreads, limiting most African countries’ access to the primary market. Additionally, investors are demanding more compensation due to rising inflation across most African countries. As a result of the restricted international bond market, SSA governments have turned to concessional lenders like the World Bank and IMF, with countries like Ivory Coast, Kenya, and Senegal obtaining high value credit facilities from the IMF. Key to note, the region’s continued economic recovery has been dented by surging import bills that have strained the external and fiscal balances of commodity-importing countries. In order to finance their fiscal deficits as well as existing debt, the countries in the region are expected to return to the market for further issuance.
We have previously covered topicals including the “Sub-Saharan Africa (SSA) Eurobonds: 2019 Performance” in January 2020, where we expected the Eurobond yields to stabilize mainly on the back of loosened monetary policy regimes in advanced countries. Additionally, we did a topical on “Sub-Saharan Africa Eurobond Performance 2022” in July 2022, where we expected yields to continue rising on the back of economic performance uncertainties, with investors attaching a higher risk premium on the region and increased interest in the developed economies. This week we analyze the Sub-Saharan Africa (SSA) Eurobond performance in 2023 and 2024 year to date, given the significantly rising rates in the developed countries. The analysis will be broken down as follows:
- Background of Eurobonds in Sub-Saharan Africa,
- Analysis of Existing Eurobond Issues in Sub-Saharan Africa,
- Debt Sustainability in the Sub-Saharan African region, and,
- Outlook on SSA Eurobonds Performance.
Section I: Background of Eurobonds Issued in Sub-Saharan Africa
The international capital markets remained largely inaccessible to countries in the Sub-Saharan Africa region in 2023, with no new Eurobond issues on the international Eurobonds market during the year. The funding crunch is attributed to the high interest rates demanded by investors attaching high risk premium in the region following the elevated inflation, debt sustainability concerns, and weakening local currencies.
Notably, Gabon became the first African country to do a debt-for-nature swap by issuing a USD 0.5 bn blue bond, with an enhanced credit rating of Aa2 from Moody’s, higher than the country’s rating of Caa1 in August 2023. The blue bond has a tenure of 15 years and its coupon rate was set at 6.1%. Debt swap was completed on 3rd September 2023 with The Charlotte, a US bank, taking point on the 15-year-long conservation and refinancing project and effectively reducing the interest rate on Gabon's debt. Blue bonds are financial tools that governments and development banks use to raise funds from investors to fund marine conservation projects like promoting sustainable fisheries and protecting marine ecosystems.
Considering the blue bond issue by Gabon, the region raised USD 0.5 bn from the international market in 2023, compared to USD 3.0 bn raised in 2022 due to heightened risk perception which has pushed up interest rates and caused yields on previously issued bonds to rise significantly making it unfeasible for countries in the SSA region to issue new Eurobonds. Consequently, Cameroon postponed its USD 333.2 mn international bond issuance until 2024, following the creditworthiness analysis by Fitch Ratings in November 2023 downgrading its outlook. Similarly, Kenya cancelled its plans of issuing new Eurobonds in 2023 to refinance the upcoming Eurobond due in 2024, instead opting for concessional loans from the IMF and the World Bank in addition to syndicated loans as an alternative.
Section II: Analysis of Existing Eurobond Issues in Sub-Saharan Africa
Yields on the select SSA Eurobonds recorded a mixed performance with 4 out of the 6 selected countries registering a decline in Eurobond yields in FY’2023, a slight improvement from FY’2022 where the yields were on an upward trajectory. Despite the slight decline in the Eurobond yields, the rates remained relatively elevated attributable to investors attaching higher risk premium on the Sub-Saharan region and other emerging markets due to heightened debt sustainability concerns coupled with sustained inflationary pressures and local currency depreciation. Notably, the USA raised its Federal interest rates by 100 basis points in 2023 strengthening the US Dollar against other currencies thereby drawing investors to the US market at the expense of emerging and developing markets such as the SSA region. According to the International Monetary Fund (IMF), the Sub-Saharan region is expected to record slower economic growth of 3.3% in 2023 as compared to 4.0% growth recorded in 2022. The subdued economic growth is attributed to rising central bank rates aimed at alleviating inflationary pressures, coupled with the supply chain disruptions resulting from the continuing Russian-Ukrainian conflict and the rising geopolitical tensions in the Middle East region. The table below highlights the recent performance of select African Eurobonds:
|
Cytonn Report: Yield Changes in Select SSA Eurobonds Issued Before 2023 |
|||||||||
|
Country |
Issue Tenor (years) |
Issue Date |
Maturity Date |
Coupon |
Yield as at 31st Dec 2021 |
Yield as at 31st Dec 2022 |
Yield as at 31st Dec 2023 |
2022 y/y change (%Points) |
2023 y/y change (%Points) |
|
Kenya |
10 |
Jun-14 |
Jun-24 |
7.3% |
4.3% |
12.7% |
12.3% |
8.4% |
(0.4%) |
|
Senegal |
10 |
Jul-14 |
Jul-24 |
6.3% |
3.3% |
8.8% |
6.4% |
5.6% |
(2.4%) |
|
Ethiopia |
10 |
Dec-14 |
Dec-24 |
6.6% |
21.9% |
34.4% |
50.5% |
12.5% |
16.0% |
|
Ghana |
11 |
Sep-14 |
Jan-26 |
8.1% |
10.4% |
46.2% |
54.4% |
35.8% |
8.2% |
|
Benin |
6 |
Jun-19 |
Jun-26 |
5.8% |
3.7% |
6.3% |
6.5% |
2.5% |
0.2% |
|
Kenya |
8 |
May-19 |
May-27 |
7.0% |
5.7% |
9.9% |
9.0% |
4.1% |
(0.8%) |
|
Ghana |
7 |
Nov-20 |
Nov-27 |
6.4% |
10.4% |
35.7% |
37.4% |
25.3% |
1.7% |
|
Kenya |
10 |
Feb-18 |
Feb-28 |
7.3% |
5.7% |
10.3% |
9.7% |
4.6% |
(0.6%) |
|
Ghana |
7 |
Jul-21 |
May-29 |
7.8% |
10.9% |
28.9% |
27.3% |
18.0% |
(1.7%) |
|
Benin |
11 |
Jan-21 |
Jan-32 |
4.9% |
5.1% |
8.4% |
8.0% |
3.3% |
(0.4%) |
|
Ivory Coast |
12 |
Nov-20 |
Jan-32 |
5.9% |
5.5% |
8.5% |
7.6% |
3.0% |
(0.8%) |
|
Kenya |
12 |
May-19 |
May-32 |
8.0% |
6.7% |
10.4% |
9.6% |
3.7% |
(0.8%) |
|
Ivory Coast |
11 |
Feb-21 |
Dec-32 |
4.9% |
5.3% |
8.2% |
7.5% |
2.9% |
(0.7%) |
|
Kenya |
12 |
Jun-21 |
Jun-34 |
6.3% |
6.5% |
9.6% |
9.3% |
3.1% |
(0.3%) |
|
Kenya |
30 |
Feb-18 |
Feb-48 |
8.3% |
8.1% |
10.8% |
10.1% |
2.7% |
(0.7%) |
|
Senegal |
30 |
Mar-18 |
Mar-48 |
4.8% |
6.9% |
9.9% |
8.9% |
3.0% |
(1.0%) |
|
Benin |
31 |
Jan-21 |
Jan-52 |
4.9% |
6.9% |
9.7% |
8.9% |
2.8% |
(0.8%) |
Source: Reuters
From the table above,
- Yields on Ethiopia’s Eurobond recorded the largest jump, increasing by 16.0% points following the heightened debt distress signals culminating in the country defaulting on a USD 33.0 mn coupon payment in December 2023. Consequently, S&P Global and Fitch Ratings downgraded the rating on the Eurobond to default status, casting doubt on its ability to repay the USD 1.0 bn Eurobond due in December 2024. The country’s economy has been struggling due to the effects of the COVID-19 pandemic, followed by the two-year civil war which ended in November 2022. As such, Ethiopia is pursuing debt-service suspension for the years 2023 and 2024 from its creditors,
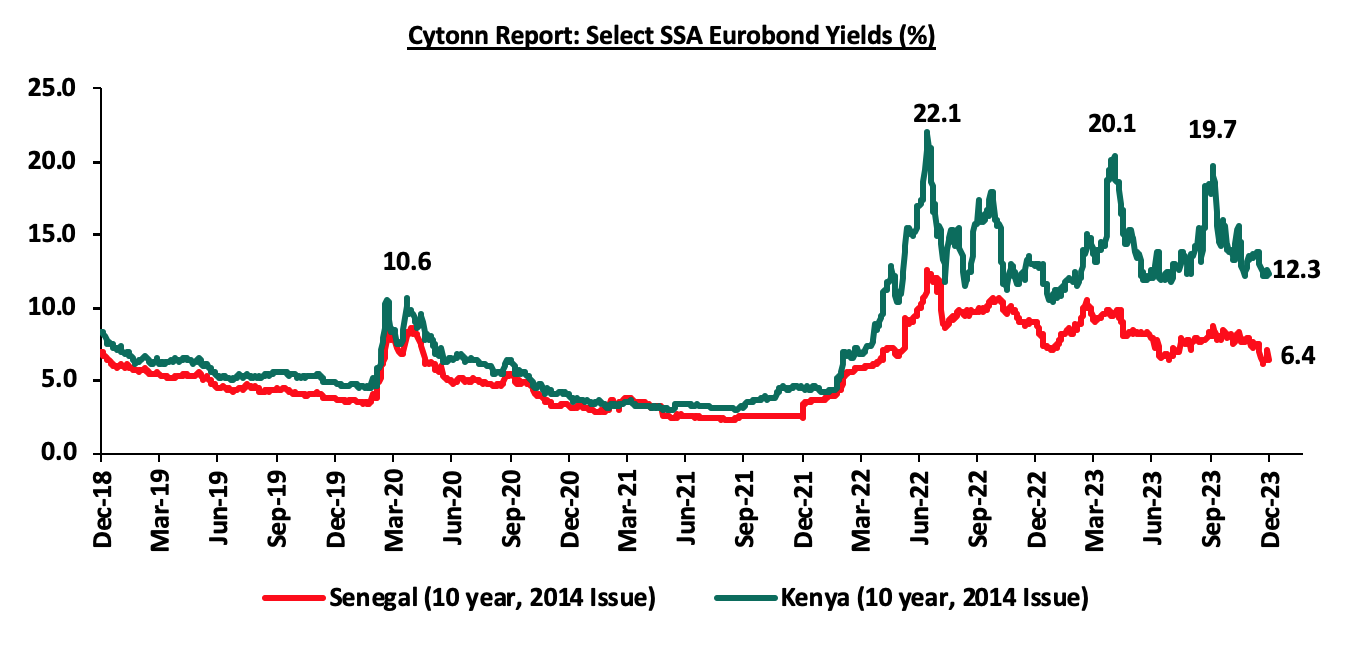
- Yields on Kenyan Eurobonds also recorded marginal declines at an average of 0.6% with the 10-year Eurobond issued in 2014, declining by 0.4% points to 12.3% in December 2023, from 12.7% recorded in December 2022 partly attributable to the reassurances by the government on its ability to meet is debt obligations with the country making payment of USD 67.8 mn due in December 2023 and its efforts to acquire a concessional loan from the IMF and the World Bank, and
- Yields on Senegal’s Eurobonds recorded the most decline at an average of 1.3% with yields of the 10-year Eurobond issued in 2014 declining by 2.4% points to 6.4% in December 2023, from 8.8% recorded in December 2022. This is mainly attributable to improved investor sentiment on Senegal with the economic growth estimated to be 4.1% in 2023, a slight improvement from 4.0% in 2022, coupled with favourable medium-term growth outlook with oil and gas production set to start in 2024.
The graph below summarizes the average YTD change in the Eurobond yields of select countries;
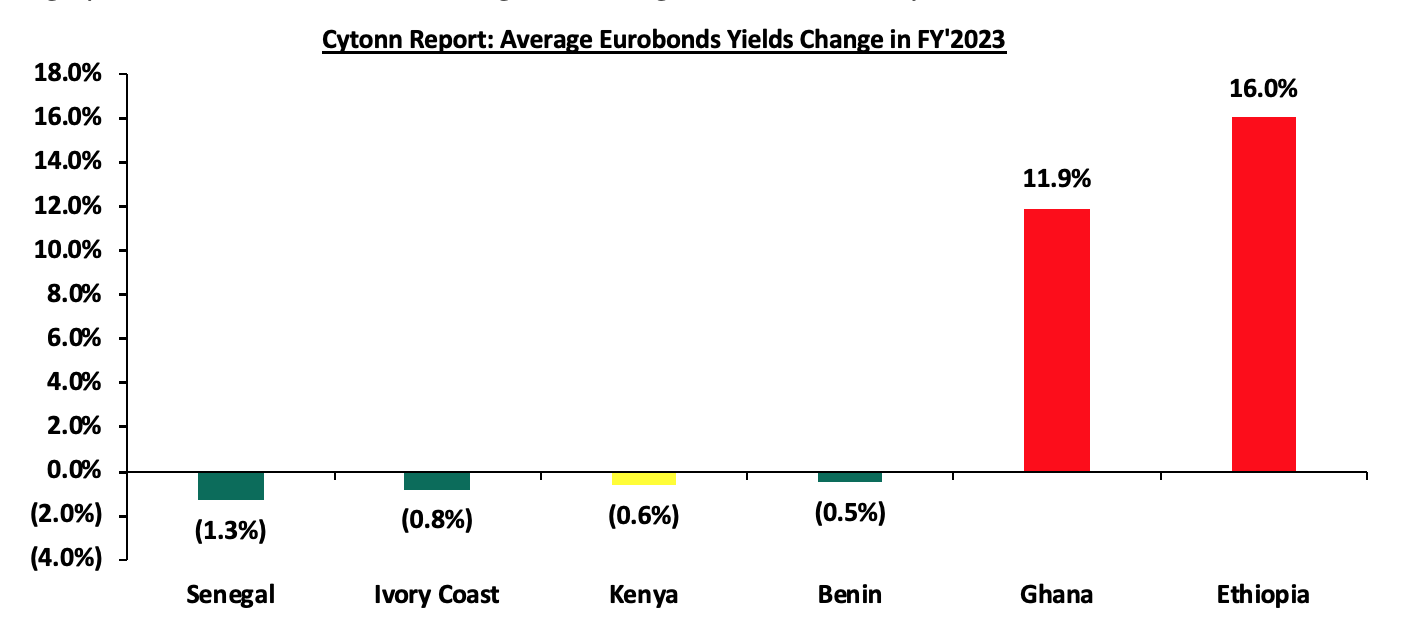
Source: Reuters
*Average yields increase calculated as an average of the Country’s Eurobonds yields increase
Eurobonds, being denominated in foreign currency, imply that a depreciation in a country’s local currency leads to increased costs. These costs are incurred when purchasing foreign currency to service existing debt obligations. Below is a summary of the performance of the different resident currencies as at the end of June 2022:
|
Cytonn Report: Select Sub-Saharan Africa Currency Performance vs USD |
|||||
|
Currency |
Dec-21 |
Dec-22 |
Dec-23 |
2022 y/y change (%) |
2023 y/y change (%) |
|
Mauritius Rupee |
43.5 |
43.9 |
44.0 |
(0.9%) |
(0.1%) |
|
Ugandan Shilling |
3,544.7 |
3,717.5 |
3,783.9 |
(4.9%) |
(1.8%) |
|
Botswana Pula |
11.7 |
12.8 |
13.4 |
(9.4%) |
(5.0%) |
|
Tanzanian Shilling |
2,297.8 |
2,308.9 |
2,510.0 |
(0.5%) |
(8.7%) |
|
South African Rand |
15.9 |
16.9 |
18.5 |
(6.3%) |
(9.5%) |
|
Kenyan Shilling |
113.1 |
123.4 |
156.5 |
(9.1%) |
(26.9%) |
|
Ghanaian Cedi |
6.0 |
8.6 |
12.0 |
(43.3%) |
(39.1%) |
|
Zambian Kwacha |
16.7 |
18.1 |
25.8 |
(8.4%) |
(42.4%) |
|
Malawian Kwacha |
816.4 |
1,026.4 |
1,689.7 |
(25.7%) |
(64.6%) |
|
Nigerian Naira |
413.0 |
447.1 |
896.6 |
(8.3%) |
(100.5%) |
Source: S&P Capital
In 2023, all select Sub-Saharan African currencies depreciated against the US Dollar, mainly on the back of the deteriorated business environment occasioned by the elevated inflationary pressures in the region, high debt servicing costs that continue to deplete foreign exchange reserves, coupled with monetary policy tightening by advanced economies. Notably, the USA Fed raised its rates by 100 bps in 2023 from a range of 4.25%-4.50% in December 2022 to a range of 5.25%-5.50% in July 2023. Furthermore, the high cost of importation in the region continues to put pressure on the local currencies.
The Nigerian Naira recorded the worst performance having depreciated by 100.5% against the Dollar in 2023. The weakening of the Naira was driven by the deteriorated macroeconomic environment, evidenced by the country’s elevated inflationary pressure, with the November 2023 inflation rate hitting a record high of 28.2%. The Central Bank of Nigeria tightened its monetary policy stance by raising interest rates to 18.8% in July 2023. Furthermore, Nigeria’s Central Bank adopted a floating exchange rate regime resulting in the devaluation of the previously overvalued currency, thus aligning it more closely with its black-market rate. Similarly, the Kenya Shilling depreciated by 26.8% in 2023 to close at Kshs 156.5 against the US Dollar, compared to Kshs 123.4 recorded at the beginning of the year. The performance was driven by increased Dollar demand from importers, especially oil and energy sectors, the ever-present current account deficit, and the need for government debt servicing which has continued to put pressure on the country’s forex reserves. The chart below shows the year-on-year performance of select Sub-Saharan African countries in FY’2023;
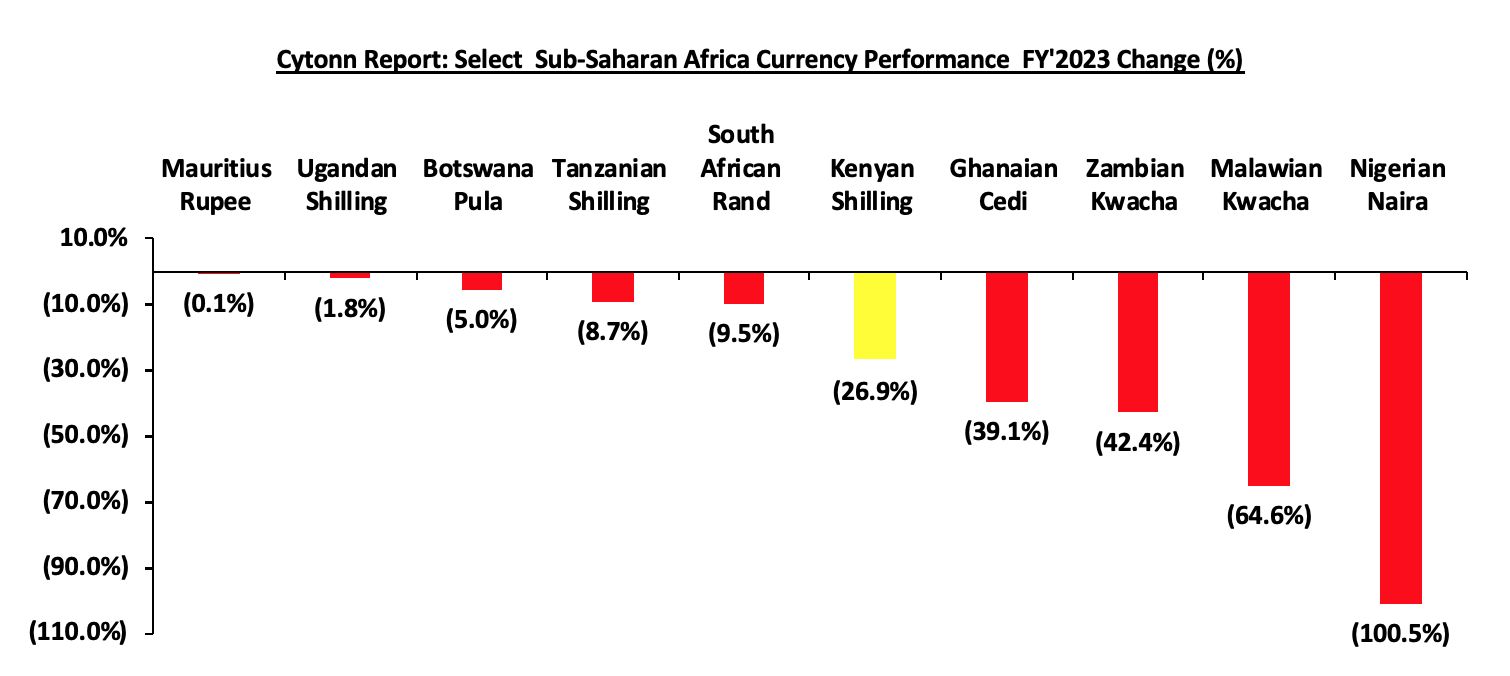
Going forward, we expect continued depreciation of the local currencies given the continued rise in global crude oil prices following supply chain disruptions arising from the Russia’s invasion of Ukraine.
Section III: Debt Sustainability in the Sub-Saharan Africa Region
Debt sustainability has long been an issue in the SSA region due to persistent fiscal deficits which have resulted in ballooning public debt levels. The onset of the COVID-19 pandemic followed by supply chain disruptions resulting from the Russia-Ukraine conflict and the rising geopolitical tensions in the Middle East region have exacerbated the situation in the SSA region, resulting in subdued economic growth. Furthermore, aggressive hiking of the US Federal rate to strengthen the US Dollar has resulted in increased debt servicing burden for most SSA countries given the high level of foreign debt. In December 2023, Ethiopia became the third African country to default on its international government debt after the COVID-19 pandemic, joining the ranks of Zambia and Ghana which defaulted on their sovereign debts in November 2020 and December 2022, respectively. Kenya has also been in the spotlight in 2023 given the upcoming Eurobond maturity of USD 2.0 bn due in 2024, with the yields on its Eurobonds experiencing high volatility following the downgrading of Kenya’s credit outlook by global credit rating agencies. For more information on credit rating actions affecting Kenya and Ethiopia’s Eurobond default, read our report: Cytonn Annual Markets Review 2023. Below is a summary of public debt to GDP ratios of the select Sub-Saharan African countries:
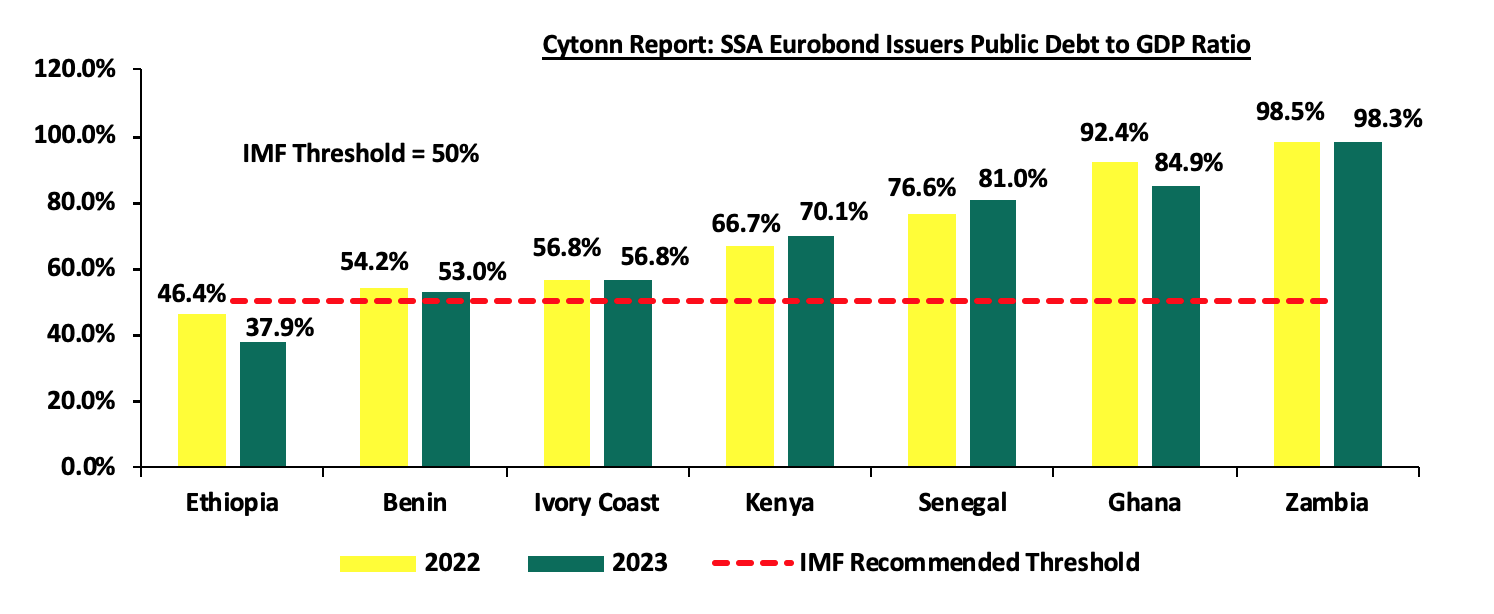
Source: IMF, CBK
From the graph above the key take outs include;
- Public debt to GDP ratio for the select SSA countries recorded mixed performance with Senegal’s ratio increasing the most, while Ethiopia recorded the largest decline. Senegal’s public debt to GDP ratio came in at 81.0% in 2023, a 4.4% increase from 76.6% recorded in 2021, mainly attributable to the IMF loan disbursements of USD 1.5 bn under the EFF/ECF program and USD 0.3 bn under the RSF program, which were approved in June 2023. Notably, Senegal’s outstanding public debt stood at CFAF 14,618.4 bn (USD 24.3 bn) as at the end of June 2023, with external debt accounting for 75.0% of the total debt. Despite the high debt levels and the upcoming Eurobond maturity of USD 0.5 bn due in July 2024, the country’s credit outlook has remained stable with Moody’s maintaining a rating of Ba3 stable during the year mainly driven by the growth-friendly fiscal consolidation efforts by the government and favourable medium term growth outlook with oil and gas production set to kick off in 2024,
- Kenya’s public debt to GDP ratio increased by 3.4% points to 70.1% in 2023, from 66.7% recorded in 2022. The increase in debt stock has been partly driven by the persistent fiscal deficit averaging 7.6% of the GDP over the last five years, and projected to come in at 5.4% of the GDP in FY’2023/24 budget. Kenya’s outstanding public debt stood at Kshs 10,706.9 bn (USD 67.3 bn) as of September 2023, with external debt accounting for 54.3% of the total debt. Kenya’s debt levels have been of concern in 2023, with global credit rating agencies such as Standard & Poor (S&P) Global, Fitch, and Moody’s downgrading the country’s credit outlook from stable to negative due to weakening liquidity position brought about by limited access to the international market and undersubscription of domestic bond issuances limiting Kenya’s capacity to service its debt. The downgrades of Kenya’s credit score have limited the country’s ability to access cheaper loans in the international financial markets to refinance the USD 2.0 bn Eurobond due in June 2024, with the yields on the 10-year 2014 Eurobond Issue reaching a high of 20.3% on 3rd October 2023. Below is a 5-year graph showing the Eurobond secondary market performance of select 10-year Eurobonds due in 2024 issued by Kenya and Senegal;
- Despite Ethiopia registering the lowest debt to GDP ratio from the select SSA countries, with a ratio of 37.9%, the country defaulted on a USD 33.0 mn coupon payment in December 2023 casting doubt on its ability to repay the USD 1.0 bn Eurobond due in December 2024. The default comes on the back of the subdued economic growth due to the effects of the COVID-19 pandemic, followed by the two-year civil war which ended in November 2022. Ethiopia’s request for debt relief under the G20’s Common Framework in 2021 was unsuccessful, leaving the country to carry out debt restructuring negotiations with its creditors for debt-service suspension in 2023 and 2024. China, which stands as the major creditor to Ethiopia agreed to debt-service suspension in November, 2023 to give debt service break to the country which is currently dealing with high inflation rates, currently standing at 28.3% as of November 2023, as well as depleted foreign reserves. Consequently, S&P Global downgraded the bond to “Default” on December 15, 2023, followed by Fitch Ratings which downgraded the rating on the Eurobond to “Default”(D) from “near default”(C) on 27th December, 2023 and also downgraded Ethiopia’s long-term foreign currency rating to “restricted default” (RD) from “C”. The debt default by Ethiopia could result in far reaching ramifications such as loss of investor confidence, limited access to funding and high borrowing costs hurting the already struggling economy. Many countries in Sub-Saharan Africa region are on the verge of debt distress according to IMF Economic Outlook-Sub-Saharan Africa , with debt-to GDP ratio largely stabilizing at 60.0% in the region, mainly on the back of increasing spending and reduced revenue collection during the COVID-19 pandemic,
- Zambia’s public debt to GDP ratio was the highest from the group, coming in at 98.3% in 2023, a marginal decrease from 98.5% in 2022. The high ratios reflect Zambia’s indebtedness with outstanding foreign debt with the country failing to meet its Eurobonds interest payment amounting to USD 98.6 bn in 2020 and 2021. Consequently, the government applied for debt service suspension under the common framework of G20 and Paris Club Debt Service Suspension Initiative (DSSI). In June 2023, Zambia reached an agreement with its bilateral creditors led by China and France, who agreed to extend the maturities on their loans worth USD 6.3 bn over 20 years, with a three-year grace period during which only payments on interest will be due. This step allowed the country to unlock concessional loans with the IMF approving a loan of USD 189.0 mn following completion of the first review of the ECF/EFF program in July 2023, followed by USD 187.0 mn approved under the second review completed in December 2023. In December 2023, Fitch Ratings affirmed Zambia's Long-Term Foreign-Currency Issuer Default Rating (IDR) at 'RD’(Restricted Default) implying that the country’s credit risk remains high. According to the IMF, Zambia’s economy growth is estimated to be 3.6% in 2023, a decline from the 4.7% growth recorded in 2022, and,
- Ghana’s debt to GDP ratio remained elevated at 84.9% in 2023 despite this being a 7.5% decline from the ratio of 92.4% registered in 2022. The country reached a staff level agreement with the IMF in December 2022 for a USD 3.0 bn credit facility under the ECF program. However, this agreement came with conditions on a number of economic conditions which led the government to announce suspension of payments on selected external debt affecting some of its Eurobond issues. In addition, the government announced a Domestic Debt Exchange programme (DDEP) in December 2022 involving the exchange of the local currency denominated bonds as at 1st December 2022 with new bonds maturing in 2027, 2029, 2032 and 2037, with the annual coupons for the new bonds set at 0.0%, in 2023, 5.0% in 2024 and 10.0% from 2025 till maturity. These drastic reforms saw S&P Global downgrade the country’s credit rating to “Selective Default” in December 2022. In February 2023, Fitch Ratings downgraded the country’s Long-Term Foreign-Currency (LTFC) Issuer Default Rating (IDR) to 'RD' (Restricted Default) from 'C', and maintained the same rating in November 2023 an indication of the continuing debt crisis. Key to note, the IMF approved USD 3.0 bn ECF arrangement in May 2023, allowing for immediate disbursement of USD 0.3 bn to support the economy.
Section IV: Outlook on SSA Eurobonds Performance
- Elevated Eurobond Yields – Despite most countries registering marginal declines in Eurobond yields, the rates remain elevated following the debt sustainability concerns arising from the surge in government financing needs as a result of the sustained fiscal deficits, cumulative depreciation in exchange rates, rising interest payments, and elevated inflationary pressures. Due to this, Investors are factoring in increased risk premiums for the region to compensate for the increased perceived risk. With the Eurobond market remaining dormant with no new issuances in 2023, the region sought alternative avenues to bridge the fiscal deficits, primarily turning towards elevated external borrowing from bilateral institutions such as the IMF and the World Bank. The continued reliance on external borrowing exerted additional pressure on the region's debt levels. In addition, the expected interest rate hikes, driven by the need to curb rising inflation, particularly in major economies, could trigger a shift in investor behaviour. Capital flight, especially from emerging markets, is foreseen as investors seek refuge in the more attractive bond markets of advanced economies. The shift in investment preferences is likely to cause lower subscriptions to Eurobond issues throughout 2024. Consequently, the subdued demand may contribute to lower bond prices, resulting in an increase in yields,
- Public debt to GDP ratios will continue to rise – According to the World Bank’s Africa’s Pulse October 2023, the public debt to GDP ratio in region has over the last 10 years increased by 28.0% points to 57.0% in 2022, from the 29.0% in 2012 with the median debt-to-GDP ratio for low-income-countries (LICs) in Sub-Saharan Africa reaching 55.0%, while for middle-income-countries in the region reached 58.0%. The public debt-to-GDP ratio has risen on a broad basis, driven by persistent fiscal deficits and slowing economic growth. The high debt levels in the region is partly attributable to significant shortfalls in revenue collection and depreciating local currencies which in turn undermined their ability to service maturing debt obligations as evidenced by countries like Ethiopia which fell into a default in 2023 after missing a USD 33.0 mn coupon payment on its USD 1.0 bn Eurobond maturing in December 2024. As such, we believe that there is need for African countries to come up with ways to mitigate debt vulnerabilities, strengthen the process of debt resolutions where necessary, and apply policy measures to improve debt sustainability metrics, and,
- Debt distress and sustainability concerns - From the regional economic outlook by IMF, over half of the region’s low-income countries are either at high risk of debt distress or already in distress, many with a trend shift toward market financing, which is more costly than loans from official creditors hence making debt service obligations to intensify further. In-addition the World Bank’s report points out that, debt distress risks in the region remain high and have been amplified since the COVID-19 pandemic. The share of International Development Association–eligible countries in the region at high risk or already in debt distress has expanded to 55.0% in 2023 from 27.0% in 2015. The debt surge in the region came along with a shift in its composition away from concessional borrowing toward private creditors and non-Paris Club bilateral creditors. As such, debt service burden and vulnerability to external shocks have increased. The debt service ratios were estimated at 31.0% of revenues in the region in 2022 thus depleting the resources available to support public investments and social programs. With reduced exports in the region, we expect continued deterioration of the region’s debt sustainability given the rising sovereign and corporate spreads as well as debt servicing costs which in turn could lead to a series of defaults.
Measures that the SSA Region Can Take to Improve Its Credit Ratings
- Engagement with International Institutions – The region should actively seek engagement with prominent international financial institutions as a strategic measure to enhance its creditworthiness. Collaborating with institutions such as the International Monetary Fund (IMF) and the World Bank provides Sub-Saharan African countries with access to financial resources, technical expertise, and policy advice. By doing so, countries in the Sub-Saharan African region can benefit from tailored programs that address country-specific economic challenges,
- Diversification of Revenue Sources – The region should put more efforts on diversifying their economies by encouraging the growth of non-traditional sectors such as technology, agribusiness, manufacturing, and renewable energy as well as Implement structural reforms to improve the ease of doing business and attract foreign direct investment (FDI) which would in turn increase the region’s revenue collection and mitigate the impacts of external shocks,
- Debt Management – Implement comprehensive debt management strategies that encompass short, medium, and long-term objectives which regularly assess the cost and risk profile of the debt portfolio as well as Prioritizing refinancing high-cost debt with lower-cost alternatives to reduce debt service obligations in the region. One way to achieve this is through debt-for-nature swaps as in the case of Gambia,
- Efficient Tax Collection – The region should strengthen tax collection and administration to improve revenue collection without increasing tax rates significantly. This can be done through broadening the tax base while ensuring tax policies are equitable and do not disproportionately burden the lower-income segments of the population,
- Social and Economic Development Initiatives – The region should focus on prioritizing investments in social and economic development projects such as Infrastructure development, education, and healthcare in order to boost the overall economic growth and in turn provide a long-term stability,
- Diaspora remittances & Tourism Promotion – The region should prioritize developing its low hanging sources of dollars, such as diaspora and tourism to bring in foreign currency. This can be achieved by putting in place policies to support the tourism industry, marketing tourist attractions and strengthening security within the region,
- Fiscal Responsibility and Transparency – The region should eliminate the rampant corruption associated with SAA countries and ensure that borrowed funds are allocated to projects with measurable economic and social impact. This can be achieved through the establishment of independent oversight bodies tasked with monitoring the implementation of projects funded through external borrowing. Budgetary discipline coupled with transparent reporting mechanisms must be upheld to prevent unnecessary expenditures, with a clear emphasis on directing funds towards initiatives that promote development, and,
- Development of Robust Capital Markets: – SSA countries should prioritize enhancing capital markets to elevate their credit ratings. Developing transparent, efficient, and well-regulated capital markets attracts diverse investors, both locally and internationally. This will help in broadening investment opportunities, increasing liquidity and participation from institutional investors. Strengthening capital markets is crucial to instil investor confidence, drive economic growth, and improve credit ratings in Sub-Saharan Africa.
Conclusion: From our analysis, the unfavourable credit ratings, rising debt levels, and subdued investor confidence in the Sub-Saharan Africa region will continue to put pressure on the International Eurobond market. As such, the region will have to commit to a comprehensive restructuring of their economies to address the root causes of the subdued Eurobond market conditions. This involves promoting economic growth and creating a more favourable investment environment to both service existing debt and curtail the necessity for future borrowings.
Disclaimer: The views expressed in this publication are those of the writers where particulars are not warranted. This publication, which is in compliance with Section 2 of the Capital Markets Authority Act Cap 485A, is meant for general information only and is not a warranty, representation, advice or solicitation of any nature. Readers are advised in all circumstances to seek the advice of a registered investment advisor

- Talk to us
- Kenya
- P.O Box 20695 - 00200, Nairobi, Kenya
- Cell +254709101200
- Tel +254709101200
- WhatsApp +254741676635
- United States
- +254709101200
- DOWNLOAD OUR APP
-


- Kenya
- 8th Floor, Pinetree Plaza, Kaburu Drive, Ngong Road, Nairobi, Kenya
- USA
- Suite 1150, 1775 Eye Street NW, USA, Washington DC 20006, USA
- Investments
- High Yield
- Private Equity
- Real Estate
- Real Estate
- RiverRun Estates
- Cytonn Towers
- The Ridge
- Taraji Heights
- The Alma