Nairobi Metropolitan Area (NMA) Infrastructure Report 2023, & Cytonn Weekly #45/2023
By Cytonn Research, Nov 12, 2023
Executive Summary
Fixed Income
During the week, T-bills were oversubscribed for the second consecutive week, with the overall subscription rate coming in at 255.6%, higher than the oversubscription rate of 102.8% recorded the previous week. Investors’ preference for the shorter 91-day paper persisted, with the paper receiving bids worth Kshs 37.3 bn against the offered Kshs 4.0 bn, translating to an oversubscription rate of 931.4%, higher than the oversubscription rate of 562.0% recorded the previous week. The subscription rates for the 182-day and 364-day papers increased significantly to 185.9% and 55.1%, from 12.8% and 9.1% respectively, recorded the previous week. The government accepted a total of Kshs 61.2 bn worth of bids out of Kshs 61.4 bn of bids received, translating to an acceptance rate of 99.7%. The yields on the government papers continued to rise, with the yields on the 364-day, 182-day and 91-day papers increasing by 17.6 bps, 13.4 bps and 10.0 bps to 15.6%, 15.4% and 15.3%, respectively;
In the primary bond market, the Central Bank of Kenya released the auction results for the newly issued infrastructure bond IFB1/2023/6.5 with a tenor to maturity of 6.5 years. The bond was oversubscribed with the overall subscription rate coming in at 177.8%, receiving bids worth Kshs 88.9 bn against the offered Kshs 50.0 bn. The government accepted bids worth Kshs 67.1 bn, translating to an acceptance rate of 75.4%. The market average yield of the accepted bids came in at 17.9% which is comparable to a yield of 21.1% on a tax effected basis, while the coupon rate for the IFB1/2023/6.5 was set at 17.9%;
Equities
During the week, the equities market recorded mixed performance, with NASI, NSE 25 and NSE 10 gaining by 3.7%, 0.2% and 0.5% respectively, while NSE 20 declined by 1.6%, taking the YTD performance to losses of 30.1%, 26.3% and 15.2% for NASI, NSE 25, and NSE 20, respectively. The equities market performance was mainly driven by gains recorded by large-cap stocks such as Safaricom and Equity Group of 15.9% and 0.5% respectively. The gains were however weighed down by losses recorded by stocks such as Co-operative Bank, Absa and NCBA Bank of 6.2%, 6.1% and 5.8% respectively;
Real Estate
During the week, Hass Consult, a consulting and Real Estate Development firm based in Kenya, published its House Price Index Q3’2023 and Land Price Index Q3’2023 reports highlighting the performance of the residential and land Real Estate sectors;
In the hospitality sector, Swiss-Belhotel International, a global hotel management chain based in Hong-Kong took over management of Nairobi Safari Club, Kenya's first all-suite luxury accommodation;
In regulated Real Estate Funds sector, under the Real Estate Investment Trusts (REITs) segment, Fahari I-REIT closed the week trading at an average price of Kshs 6.0 per share in the Nairobi Securities Exchange, representing a 1.0% decline from the Kshs 6.1 recorded the previous week;
On the Unquoted Securities Platform as at 27th October 2023, Acorn D-REIT and I-REIT closed the week trading at Kshs 25.3 and Kshs 21.7 per unit, a 26.6% and 8.3% gain for the D-REIT and I-REIT, respectively, from the Kshs 20.0 inception price. In addition, Cytonn High Yield Fund (CHYF) closed the week with an annualized yield of 16.4%, remaining relatively unchanged from the previous week;
Focus of the Week
Infrastructure constitutes the fundamental systems essential for the proper functioning of utility services, encompassing systems like water, transport, energy, internet, sewer and drainage networks, among others. These critical systems significantly impact a country's performance and survival, and their inadequacy can lead to economic stagnation. In our focus this week, we will be reviewing the status of infrastructure in the Nairobi Metropolitan Area (NMA), with a major focus on roads, water and sewer network coverage. This is because infrastructure continues to be a major priority in government’s economic agenda;
Investment Updates:
- Weekly Rates:
- Cytonn Money Market Fund closed the week at a yield of 14.55% p.a. To invest, dial *809# or download the Cytonn App from Google Playstore here or from the Appstore here;
- Cytonn High Yield Fund closed the week at a yield of 16.41% p.a. To invest, email us at sales@cytonn.com and to withdraw the interest, dial *809# or download the Cytonn App from Google Play store here or from the Appstore here;
- We continue to offer Wealth Management Training every Monday, from 10:00 am to 12:00 pm. The training aims to grow financial literacy among the general public. To register for any of our Wealth Management Trainings, click here;
- If interested in our Private Wealth Management Training for your employees or investment group, please get in touch with us through wmt@cytonn.com;
- Cytonn Insurance Agency acts as an intermediary for those looking to secure their assets and loved ones’ future through insurance namely; Motor, Medical, Life, Property, WIBA, Credit and Fire and Burglary insurance covers. For assistance, get in touch with us through insuranceagency@cytonn.com;
- Cytonn Asset Managers Limited (CAML) continues to offer pension products to meet the needs of both individual clients who want to save for their retirement during their working years and Institutional clients that want to contribute on behalf of their employees to help them build their retirement pot. To more about our pension schemes, kindly get in touch with us through pensions@cytonn.com;
Real Estate Updates:
- For more information on Cytonn’s real estate developments, email us at sales@cytonn.com;
- Phase 3 of The Alma is now ready for occupation and the show house is open daily. To join the waiting list to rent, please email properties@cytonn.com;
- For Third Party Real Estate Consultancy Services, email us at rdo@cytonn.com;
- For recent news about the group, see our news section here;
Hospitality Updates:
- We currently have promotions for Staycations. Visit cysuites.com/offers for details or email us at sales@cysuites.com;
Money Markets, T-Bills Primary Auction:
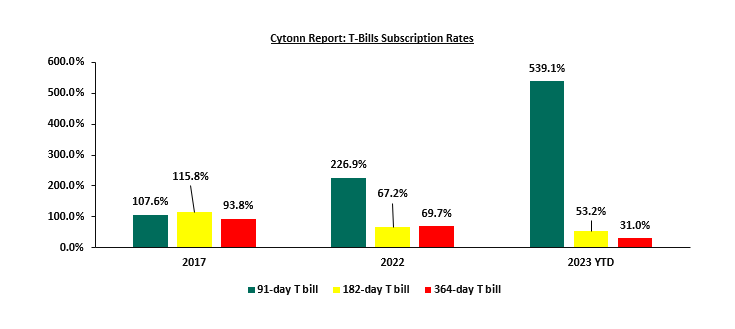
During the week, T-bills were oversubscribed for the second consecutive week, with the overall subscription rate coming in at 255.6%, higher than the oversubscription rate of 102.8% recorded the previous week Investors’ preference for the shorter 91-day paper persisted, with the paper receiving bids worth Kshs 37.3 bn against the offered Kshs 4.0 bn, translating to an oversubscription rate of 931.4%, higher than the oversubscription rate of 562.0% recorded the previous week. The subscription rates for the 182-day and 364-day papers increased significantly to 185.9% and 55.1%, from 12.8% and 9.1% respectively, recorded the previous week. The government accepted a total of Kshs 61.2 bn worth of bids out of Kshs 61.4 bn of bids received, translating to an acceptance rate of 99.7%. The yields on the government papers continued to rise, with the yields on the 364-day, 182-day and 91-day papers increasing by 17.6 bps, 13.4 bps and 10.0 bps to 15.6%, 15.4% and 15.3%, respectively. The chart below compares the overall average T- bills subscription rates obtained in 2017, 2022 and 2023 Year to Date (YTD):
In the primary bond market, the Central Bank of Kenya released the auction results for the newly issued infrastructure bond IFB1/2023/6.5 with a tenor to maturity of 6.5 years. The bond was oversubscribed with the overall subscription rate coming in at 177.8%, receiving bids worth Kshs 88.9 bn against the offered Kshs 50.0 bn. The government accepted bids worth Kshs 67.1 bn, translating to an acceptance rate of 75.4%. The market average yield of the accepted bids came in at 17.9% which is comparable to a yield of 21.1% on a tax effected basis, while the coupon rate for the IFB1/2023/6.5 was set at 17.9%.
Money Market Performance:
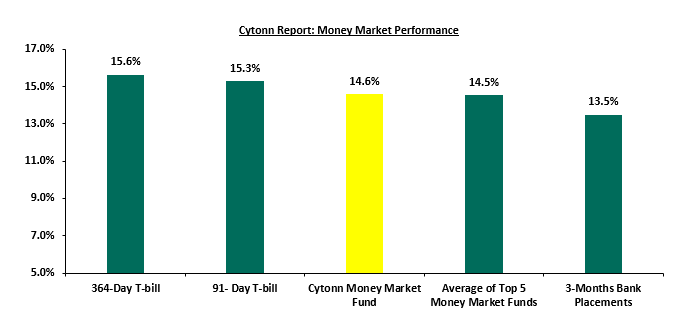
In the money markets, 3-month bank placements ended the week at 13.5% (based on what we have been offered by various banks), and the yields on the 364-day and 91-day T-bill increased by 17.6 bps and 10.0 bps to 15.6% and 15.3%, respectively. The yields of the Cytonn Money Market Fund increased by 9.0 bps to 14.6% from 14.5% recorded the previous week, and the average yields on the Top 5 Money Market Funds increased by 17.6 bps to 14.5%, from 14.3% recorded the previous week.
The table below shows the Money Market Fund Yields for Kenyan Fund Managers as published on 10th November 2023:
|
Cytonn Report: Money Market Fund Yield for Fund Managers as published on 10th November 2023 |
||
|
Rank |
Fund Manager |
Effective Annual |
|
1 |
GenAfrica Money Market Fund |
15.0% |
|
2 |
Cytonn Money Market Fund |
14.6% |
|
3 |
Enwealth Money Market Fund |
14.5% |
|
4 |
Lofty-Corban Money Market Fund |
14.5% |
|
5 |
Apollo Money Market Fund |
14.1% |
|
6 |
Etica Money Market Fund |
14.1% |
|
7 |
Madison Money Market Fund |
14.0% |
|
8 |
Nabo Africa Money Market Fund |
14.0% |
|
9 |
GenCap Hela Imara Money Market Fund |
13.5% |
|
10 |
Jubilee Money Market Fund |
13.4% |
|
11 |
Co-op Money Market Fund |
13.1% |
|
12 |
Kuza Money Market fund |
13.0% |
|
13 |
Sanlam Money Market Fund |
12.9% |
|
14 |
Old Mutual Money Market Fund |
12.5% |
|
15 |
Absa Shilling Money Market Fund |
12.4% |
|
16 |
KCB Money Market Fund |
12.1% |
|
17 |
Dry Associates Money Market Fund |
11.6% |
|
18 |
CIC Money Market Fund |
11.6% |
|
19 |
Equity Money Market Fund |
11.5% |
|
20 |
ICEA Lion Money Market Fund |
11.4% |
|
21 |
Orient Kasha Money Market Fund |
11.0% |
|
22 |
AA Kenya Shillings Fund |
11.0% |
|
23 |
Mali Money Market Fund |
10.5% |
|
24 |
British-American Money Market Fund |
9.5% |
Source: Business Daily
Liquidity:
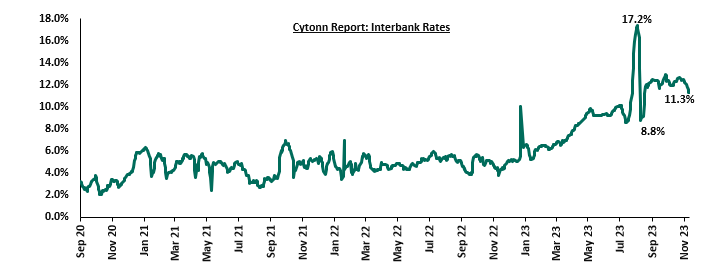
During the week, liquidity in the money markets eased, with the average interbank rate decreasing to 11.7% from 12.3% recorded the previous week, partly attributable to government payments that offset tax remittances. The average interbank volumes traded decreased by 7.2% to Kshs 13.3 bn from Kshs 14.3 bn recorded the previous week. The chart below shows the interbank rates in the market over the years:
Kenya Eurobonds:
During the week, the yields on Eurobonds recorded mixed performance, with the yield on the 10-year Eurobond issued in 2014 increasing the most by 1.4% points to 15.5%, from 14.1% recorded the previous week. The table below shows the summary of the performance of the Kenyan Eurobonds as of 9th November 2023;
|
Cytonn Report: Kenya Eurobonds Performance |
||||||
|
|
2014 |
2018 |
2019 |
2021 |
||
|
Tenor |
10-year issue |
10-year issue |
30-year issue |
7-year issue |
12-year issue |
12-year issue |
|
Amount Issued (USD) |
2.0 bn |
1.0 bn |
1.0 bn |
0.9 bn |
1.2 bn |
1.0 bn |
|
Years to Maturity |
0.6 |
4.3 |
24.3 |
3.5 |
8.5 |
10.6 |
|
Yields at Issue |
6.6% |
7.3% |
8.3% |
7.0% |
7.9% |
6.2% |
|
02-Jan-23 |
12.9% |
10.5% |
10.9% |
10.9% |
10.8% |
9.9% |
|
01-Nov-23 |
14.6% |
13.1% |
12.0% |
13.5% |
12.5% |
11.8% |
|
02-Nov-23 |
14.1% |
12.8% |
11.7% |
13.1% |
12.1% |
11.5% |
|
03-Nov-23 |
13.9% |
12.5% |
11.6% |
12.6% |
11.9% |
11.2% |
|
06-Nov-23 |
14.1% |
12.5% |
11.6% |
12.6% |
11.9% |
11.2% |
|
07-Nov-23 |
14.9% |
12.5% |
11.5% |
12.7% |
11.9% |
11.2% |
|
08-Nov-23 |
14.9% |
12.5% |
11.6% |
12.8% |
11.8% |
11.2% |
|
09-Nov-23 |
15.5% |
12.7% |
11.7% |
13.1% |
12.0% |
11.3% |
|
Weekly Change |
1.4% |
(0.2%) |
(0.1%) |
0.0% |
(0.1%) |
(0.2%) |
|
MTD Change |
0.8% |
(0.4%) |
(0.3%) |
(0.4%) |
(0.5%) |
(0.5%) |
|
YTD Change |
2.5% |
2.2% |
0.8% |
2.2% |
1.2% |
1.4% |
Source: Central Bank of Kenya (CBK) and National Treasury
Kenya Shilling:
During the week, the Kenya Shilling depreciated against the US Dollar by 0.4% to close at Kshs 151.7, from Kshs 151.1 recorded the previous week. On a year to date basis, the shilling has depreciated by 22.9% against the dollar, adding to the 9.0% depreciation recorded in 2022. We expect the shilling to remain under pressure in 2023 as a result of:
- An ever-present current account deficit which came at 3.7% of GDP in Q2’2023 from 6.0% recorded in a similar period last year,
- The need for government debt servicing, continues to put pressure on forex reserves given that 67.1% of Kenya’s external debt was US Dollar denominated as of June 2023, and,
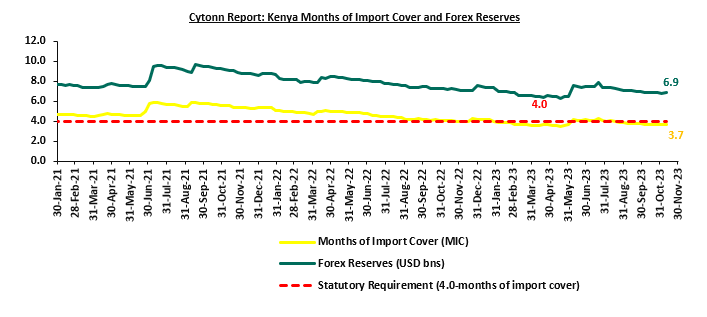
- Dwindling forex reserves currently at USD 6.8 bn (equivalent to 3.7-months of import cover), which is below the statutory requirement of maintaining at least 4.0-months of import cover.
The shilling is however expected to be supported by:
- Diaspora remittances standing at a cumulative USD 3,106.7 mn in 2023 as of September 2023, 3.8% higher than the USD 2,992.5 mn recorded over the same period in 2022, which has continued to cushion the shilling against further depreciation. In the September 2023 diaspora remittances figures, North America remained the largest source of remittances to Kenya accounting for 57.0% in the period, and,
- The tourism inflow receipts which came in at USD 268.1 bn in 2022, a significant 82.9% increase from USD 146.5 bn inflow receipts recorded in 2021.
The chart below summarizes the evolution of Kenya months of import cover over the years:
Rates in the Fixed Income market have been on an upward trend given the continued high demand for cash by the government and the occasional liquidity tightness in the money market. The government is 14.8% ahead of its prorated net domestic borrowing target of Kshs 117.2 bn, having a net borrowing position of Kshs 134.6 bn out of the domestic net borrowing target of Kshs 316.0 bn for the FY’2023/2024. Therefore, we expect a continued upward readjustment of the yield curve in the short and medium term, with the government looking to bridge the fiscal deficit through the domestic market. Owing to this, our view is that investors should be biased towards short-term fixed-income securities to reduce duration risk.
Market Performance:
During the week, the equities market recorded mixed performance, with NASI, NSE 25 and NSE 10 gaining by 3.7%, 0.2% and 0.5% respectively, while NSE 20 declined by 1.6%, taking the YTD performance to losses of 30.1%, 26.3% and 15.2% for NASI, NSE 25, and NSE 20, respectively. The equities market performance was mainly driven by gains recorded by large-cap stocks such as Safaricom and Equity Group of 15.9% and 0.5% respectively. The gains were however weighed down by losses recorded by stocks such as Co-operative Bank, Absa and NCBA Bank of 6.2%, 6.1% and 5.8% respectively.
During the week, equities turnover increased by 153.1% to USD 10.4 mn, from USD 4.1 mn recorded the previous week, taking the YTD total turnover to USD 613.0 mn. Foreign investors remained net sellers for the fifth consecutive week with a net selling position of USD 2.1 mn, from a net selling position of USD 0.3 mn recorded the previous week, taking the YTD foreign net selling position to USD 287.6 mn.
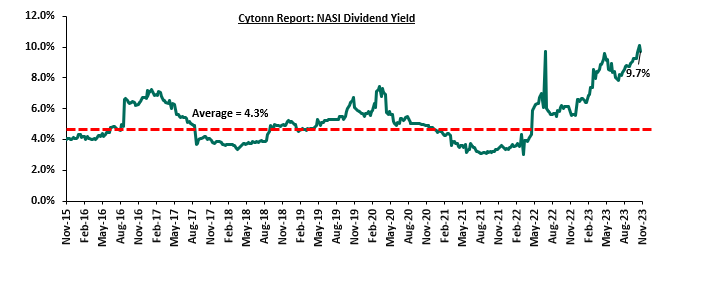
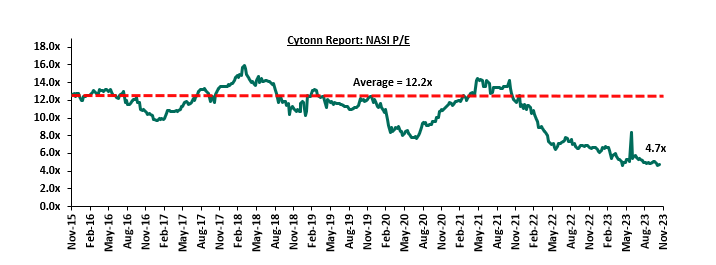
The market is currently trading at a price to earnings ratio (P/E) of 4.7x, 61.0% below the historical average of 12.2x. The dividend yield stands at 9.7%, 5.4% points above the historical average of 4.3%. Key to note, NASI’s PEG ratio currently stands at 0.6x, an indication that the market is undervalued relative to its future growth. A PEG ratio greater than 1.0x indicates the market is overvalued while a PEG ratio less than 1.0x indicates that the market is undervalued. The charts below indicate the historical P/E and dividend yields of the market;
Universe of Coverage:
|
Cytonn Report: Equities Universe of Coverage |
|||||||||
|
Company |
Price as at 03/11/2023 |
Price as at 10/11/2023 |
w/w change |
YTD Change |
Target Price* |
Dividend Yield |
Upside/ Downside** |
P/TBv Multiple |
Recommendation |
|
KCB Group*** |
16.4 |
16.1 |
(1.8%) |
(58.1%) |
30.7 |
12.5% |
100.2% |
0.3x |
Buy |
|
Liberty Holdings |
3.7 |
3.5 |
(6.2%) |
(30.6%) |
5.9 |
0.0% |
58.7% |
0.3x |
Buy |
|
Kenya Reinsurance |
1.7 |
1.8 |
1.7% |
(6.4%) |
2.5 |
11.4% |
57.4% |
0.1x |
Buy |
|
Jubilee Holdings |
182.0 |
182.0 |
0.0% |
(8.4%) |
260.7 |
6.6% |
49.8% |
0.3x |
Buy |
|
Sanlam |
6.9 |
6.8 |
(1.4%) |
(29.0%) |
10.3 |
0.0% |
49.1% |
1.9x |
Buy |
|
ABSA Bank*** |
11.5 |
10.8 |
(6.1%) |
(11.9%) |
14.8 |
12.6% |
41.8% |
0.9x |
Buy |
|
Diamond Trust Bank*** |
45.0 |
44.1 |
(2.0%) |
(11.6%) |
58.1 |
11.4% |
40.6% |
0.2x |
Buy |
|
I&M Group*** |
17.3 |
17.5 |
1.2% |
2.6% |
21.8 |
12.9% |
38.9% |
0.4x |
Buy |
|
Co-op Bank*** |
11.4 |
10.7 |
(6.2%) |
(12.0%) |
13.5 |
14.1% |
33.0% |
0.5x |
Buy |
|
NCBA*** |
37.2 |
35.0 |
(5.8%) |
(10.1%) |
43.2 |
12.1% |
28.4% |
0.7x |
Buy |
|
Equity Group*** |
37.1 |
37.3 |
0.5% |
(17.2%) |
42.6 |
10.7% |
25.5% |
0.8x |
Buy |
|
Stanbic Holdings |
105.0 |
100.8 |
(4.0%) |
(1.2%) |
118.2 |
12.5% |
25.1% |
0.7x |
Buy |
|
Standard Chartered*** |
155.8 |
152.8 |
(1.9%) |
5.3% |
170.9 |
14.4% |
24.1% |
1.0x |
Buy |
|
CIC Group |
2.2 |
2.0 |
(8.7%) |
4.7% |
2.5 |
6.5% |
20.7% |
0.6x |
Buy |
|
Britam |
5.0 |
4.9 |
(1.2%) |
(5.6%) |
6.0 |
0.0% |
20.1% |
0.7x |
Buy |
|
HF Group |
3.8 |
3.8 |
(0.8%) |
20.0% |
3.2 |
0.0% |
(16.0%) |
0.2x |
Sell |
We are “Neutral” on the Equities markets in the short term due to the current tough operating environment and huge foreign investor outflows, and, “Bullish” in the long term due to current cheap valuations and expected global and local economic recovery.
With the market currently being undervalued to its future growth (PEG Ratio at 0.6x), we believe that investors should reposition towards value stocks with strong earnings growth and that are trading at discounts to their intrinsic value. We expect the current high foreign investors sell-offs to continue weighing down the equities outlook in the short term.
- Industry Report
During the week, Hass Consult, a consulting and Real Estate Development firm based in Kenya, published its House Price Index Q3’2023 Report. The report highlights the performance of the residential Real Estate Sector in the Nairobi Metropolitan Area (NMA). The following are the main findings of the report:
- The average quarter-on-quarter (q/q) selling prices for all the properties registered a 1.1% decline in Q3’2023, compared to 0.8% increase in Q3’2022. The performance was mainly subdued by price corrections of 1.7% and 0.9% in detached and semi-detached house prices respectively. However, the performance was supported by a 1.5% increase in the selling prices of apartments. On a year-on-year (y/y) basis, the average selling prices for properties dropped by 3.7%, compared to the 10.3% increase that was recorded in Q3’2022. The decline in property prices is attributable to the rising inflation which has subsequently eroded the purchasing power of consumers,
- The overall asking rents of housing units in the NMA during Q3’2023 increased slightly by 0.4% q/q, compared to a 0.2% decline recorded in Q3’2022. On a y/y basis, the average asking rent dropped 1.5% compared to the 2.1% increase recorded in Q3’2022. The decline in performance was attributable to decreased rents in detached and semi-detached houses, registering y/y corrections of 0.7% and 0.4% respectively in Q3’2023, as landlords adjusted rents to support occupancy amid renters preferring more affordable apartments, whose average rents grew by 5.9% y/y,
- Apartments recorded the highest y/y increase in asking rents of 5.9% in Q3’2023, a 0.3% increase from Q3’2022. Detached and semi-detached units realized price corrections of 3.6% and 5.2% respectively during the period under review. The declines were attributable to the progressive expansion of the middle class preferring to rent apartments owing to their affordability,
- In the Nairobi Suburbs detached and semi-detached houses market, Langata was the best performing having recorded a y/y sales price appreciation of 10.3% attributable to i) good connectivity road network facilitated by infrastructural developments such as the Southern Bypass and Lang’ata road, ii) its proximity to the Central Business District (CBD), and, iii) Langata’s affordability compared to neighboring areas such as Karen. On the other hand, Runda experienced the highest y/y decline of 10.9% attributed to decrease in demand for houses in area for affordable choices,
- In the Nairobi Suburbs apartments, Lang’ata remained to be the best performing region recording a y/y capital appreciation of 10.2%, due to i) its close proximity to social commercial, social, and recreational amenities such as The Hub, and Waterfront Karen malls ii) enhanced access due to infrastructure improvements on key connecting roads including rehabilitation of Ngong Road and link road joining Ngong Road to Lang’ata Road, iii) close proximity to Central Business District and due to good road connectivity reducing commute time, and, iv) a growing middle class population in the areas driving demand for apartments in the area upwards. On the other hand, Riverside realized the highest y/y price correction of 10.6% attributed to city residents opting for neighboring areas such as Westlands and Spring Valley,
- In the satellite towns, houses in Ngong’ recorded the highest y/y price appreciation at 14.7% driven by increased demand resulting from, i) proximity to commercial, social,educational institutions and recreational amenities such as Milele Mall, and The Hub, ii) its close proximity to prime areas such as Karen, leading to spill over pricing effects particularly in Miotoni and Kerarapon areas, iii) improved infrastructure development such as the Ngong’ Road thus enhancing accessibility, and, iv) growing middle income population in the area supporting demand. Conversely, houses in Limuru realized the highest y/y price correction of 9.3% attributed to reduced demand owing to the region’s location which is far from Nairobi CBD and other major urban business nodes, and main transportation hubs such as the Jomo Kenyatta International Airport (JKIA), Standard Gauge Railway (SGR), among others, and,
- In satellite towns’ apartments, Kiambu recorded the highest y/y price appreciation of 7.8% which was supported by good infrastructure access and growing population. Conversely, Kitengela realized the highest y/y price correction of 10.9% attributed to stiff competition faced from neighbourhoods such as Athi River, Mlolongo, and Syokimau, which are strategically located along the Mombasa-Nairobi Highway enhancing accessibility and demand by buyers as well as their closer proximity to amenities such as Crystal Rivers and Signature malls, and the Nairobi CBD.
The findings of the report are in line with our Cytonn Q3’2023 Market Review, highlighting that the residential apartments market in NMA recorded a y/y increase of 0.1% to 6.1% in Q3’2023 from 6.0% in Q3’2022. The apartment market remains stable driven by the sustained demand for rental and subdued demand for purchasing houses attributable to reduced purchasing power of buyers as a result of tax increases and the rising inflation in the country.
Hass consult also released Land Price Index Q3’2023 Report which highlights the performance of Real Estate land sector in the Nairobi Metropolitan Area (NMA). The following were the key take outs from the report;
- The average q/q selling prices for land in the Nairobi suburbs grew by 0.4%, compared to 0.8% drop recorded in Q3’2022. On a y/y basis the performance represented 0.8% increase, compared to the 0.3% decrease recorded in Q3’2022. Consequently, q/q and y/y land prices in satellite towns of Nairobi increased by 2.7% and 6.3% respectively, compared to the 1.6% and 9.5% growth respectively, recorded in Q3’2022. The market improvement continues to demonstrate the sector’s resilience, with demand growing on the back of emerging opportunities in retail, manufacturing, and logistics needed to serve the rapidly urbanizing towns as well as the Nairobi CBD,
- Langata, was the best performing node in the Nairobi suburbs with a y/y price appreciation of 12.1%. This was attributed to; i) its close proximity to commercial, social, educational institutions and recreational amenities, ii) enhanced access due to good infrastructure, iii) close proximity to Central Business District and its centrality in location in relation to other key urban areas, and, iv) a growing middle-class population in the areas driving demand in the area. Conversely, land in Kileleshwa recorded the highest y/y price correction of 2.8%. This attributed to the land buyer’s preference to neighboring Kilimani which proves to be more strategic for developers, and,
- For satellite town, Ngong was the best performing node with a y/y capital appreciation of 21.3%, followed by Thika which recorded a y/y capital appreciation of 18.0%. The improvement in performance in Ngong was driven by; i) increased demand for land due to its affordability, ii) its close proximity to the Nairobi CBD and major urban nodes as well as opulent residential areas such as Karen, and, iii) good infrastructure enhancing connectivity. On the other hand, land prices in Thika were supported by access to infrastructural facilities such as roads as well as a growing young population in the area mainly composed of students driving demand of rentals in the area upwards. Conversely, Limuru was the worst performing node with a y/y price correction of 4.9%, attributable to increased competition from the neighboring areas which are closer in proximity to the CBD and other urban areas.
The findings of the report are also in line with our Cytonn Q3’ 2023 Market Review which highlighted that the overall average selling prices for land in the NMA appreciated by 3.2% to record an average price per acre of Kshs 129.0 mn per acre in Q3’2023. This was mainly attributed to; i) increased construction activities especially in the residential sector driven by the government’s affordable housing agenda, ii) positive demographics driving demand for land upwards, facilitated by high population and urbanization growth rates of 1.9% and 3.7% respectively, and, iii) government’s increased focus on the development of infrastructure such as road which has opened up new areas increasing demand for land hence rise in land prices.
- Hospitality Sector
During the week, Swiss-Belhotel International, a global hotel management chain based in Hong-Kong took over management of Nairobi Safari Club, Kenya's first all-suite luxury accommodation. The hotel, which is situated within the 16-storey Lilian Towers, located along Koinange street, Nairobi Central Business District (CBD) is set to undergo a rebranding, and will be renamed to Safari Club by Swiss-Belhotel. Nairobi Safari Club boasts of a selection of 146 suites, ranging from studio to expansive presidential suites, and caters to a clientele seeking upscale living spaces and amenities.
The deal forms part of the group’s ambitious expansion plan to expand its footprints across Africa, with already existing operations in Egypt and Tanzania. Swiss-Belhotel whose operations have mainly been concentrated in Asia, has a growing portfolio of 125 hotels, resorts and projects in countries such as China, Indonesia, Malaysia, Philippines, Vietnam, Bahrain, Egypt, Iraq, Kuwait, Oman, Qatar, Saudi Arabia, United Arab Emirates, Australia, New Zealand, and Tanzania.
The decision by Swiss-Bel Hotel Group comes at a time when the Kenyan hospitality industry is witnessing increased hotel expansions with both local and global brands opening new facilities following the continued recovery of the sector. In support of this, Hotel Chain Development Pipelines in Africa Report 2023 by W Hospitality Group highlights that 25 global hotel brands are considering opening new facilities in Kenya as of 2023. This translates to an additional 3,729 new hotel rooms ranking Kenya at position seven and among the top ten hotspots for upcoming luxury hotels as shown below;
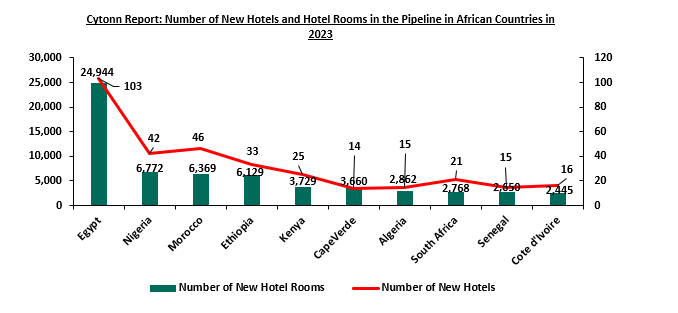
Source: Hotel Chain Development Pipelines in Africa 2023
Notably, in 2023 so far we have witnessed expansions by international hotel chains and hospitality brands such as such as JW Marriott of the Bonvoy Global, Pan Pacific Hotels Group and Miftah Concierge, a leading provider of tailored lifestyle management and luxury travel services. Additionally, the deal is coming at a time when the hospitality industry in Kenya is continuing to garner global positive acclaim and recognition, amid numerous positive awards and accolades won by several local and international brands based in Kenya at the recently concluded at the 30th World Travel Awards and 17th World Luxury Hotel Awards. Furthermore, Kenya recently was voted as Africa's Leading Destination at the 2023 World Travel Awards. Nairobi and Diani also emerged as Africa’s top destinations in leading business travel and beach destinations respectively.
In our view, we expect that going forward, the sector’s performance will be supported by factors such as; i) continued recognition of Kenya’s hospitality sector through positive awards and accolades, ii) aggressive marketing campaigns by the Kenya Tourism Board on the Magical Kenya platforms, iii) concerted efforts to promote local and regional tourism, iv) development of niche products such as cruise tourism, adventure tourism, culture and sports tourism, v) continuous opening and expansions by local and international hotel brands such as JW Marriott of the Bonvoy Global and Pan Pacific Hotels Group in the country, and, vi) counties efforts to boost tourism in efforts aimed at enhancing County revenue collections. However, the sector's optimal performance is expected to be subdued by challenging economic conditions such as rising operational costs attributed to the rising inflation, and, recently issued travel advisories by multiple governments, including those of China and the United States amidst concerns of possible security breaches and threats.
- Regulated Real Estate Funds
- Real Estate Investments Trusts (REITs)
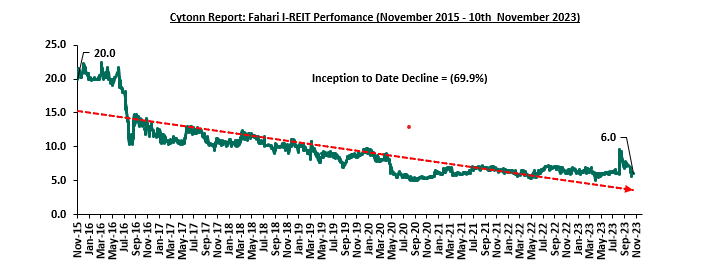
In the Nairobi Securities Exchange, ILAM Fahari I-REIT closed the week trading at an average price of Kshs 6.0 per share. The performance represents a 1.0% decline from Kshs 6.1 per share recorded last week, taking it to a 11.2% Year-to-Date (YTD) loss from Kshs 6.8 per share recorded on 3 January 2023. Additionally, the performance represents a 69.9% Inception-to-Date (ITD) loss from the Kshs 20.0 price. The dividend yield currently stands at 10.8%. The graph below shows Fahari I-REIT’s performance from November 2015 to 10th November 2023;
In the Unquoted Securities Platform, Acorn D-REIT and I-REIT traded at Kshs 25.3 and Kshs 21.7 per unit, respectively, as of 27th October 2023. The performance represented a 26.6% and 8.3% gain for the D-REIT and I-REIT, respectively, from the Kshs 20.0 inception price. The volumes traded for the D-REIT and I-REIT came in at 12.3 mn and 30.7 mn shares, respectively, with a turnover of Kshs 257.5 mn and Kshs 633.8 mn, respectively, since inception in February 2021.
REITs provide various benefits like tax exemptions, diversified portfolios, and stable long-term profits. However, the continuous deterioration in performance of the Kenyan REITs and restructuring of their business portfolio is on top of other general challenges such as; i) inadequate comprehension of the investment instrument among investors, ii) prolonged approval processes for REITs creation, iii) high minimum capital requirements of Kshs 100.0 mn for trustees, and, iv) minimum investment amounts set at Kshs 5.0 mn, continue to limit the performance of the Kenyan REITs market.
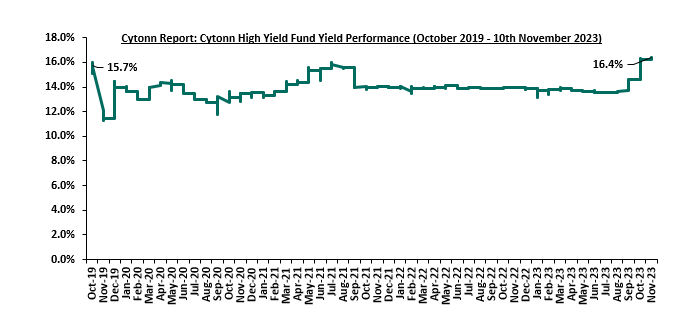
- Cytonn High Yield Fund (CHYF)
Cytonn High Yield Fund (CHYF) closed the week with an annualized yield of 16.4%, remaining relatively unchanged the previous week. The performance represented a 2.5%-points Year-to-Date (YTD) increase from 13.9% yield recorded on 1st January 2023, and 0.7%-points Inception-to-Date (ITD) increase from the 15.7% yield. The graph below shows Cytonn High Yield Fund’s performance from November 2019 to 10th November 2023;
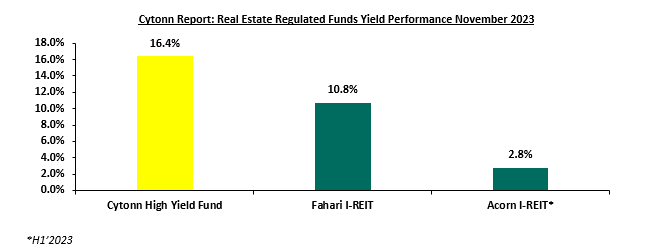
Notably, the CHYF has outperformed other regulated Real Estate funds with an annualized yield of 16.4%, as compared to Fahari I-REIT and Acorn I-REIT with yields of 10.8%, and 2.8% respectively. As such, the higher yields offered by CHYF makes the fund one of the best alternative investment resource in the Real Estate sector. The graph below shows the yield performance of the Regulated Real Estate Funds;
Source: Cytonn Research
We expect the Kenyan Real Estate sector will continue to be resilient supported by; i) increased launch and completions of affordable housing projects in line with the government’s affordable housing agenda, ii) increased demand for Real Estate and properties facilitated by positive demographics above global averages, iii) increased tourist arrivals into the country gearing towards pre-COVID levels, iv) continued recognition of Kenya as a regional business hub attracting foreign investments into the country, and, v) increased positive awards and accolades in the hospitality industry accorded to both local and international hotel brands positioning the country as a vibrant tourism market. However, rising costs of construction hindering developments, existing oversupply in select Real Estate sectors weighing down on absorption rates, reduced budgetary allocations to the infrastructure sector will hamper the optimal performance of the sector, and, dismal performance of the REIT asset class owing to various factors including inadequate comprehension of the investment instrument among investors.
In May 2022, we released the Nairobi Metropolitan Area (NMA) Infrastructure Report 2022, which highlighted that there were 940.5 Km ongoing construction and rehabilitation projects in the NMA worth Kshs 97.3 bn. This was a slight increase from the 939.6 Km projects worth Kshs 162.4 bn that was recorded in 2021. Both water and sewer connectivity increased by 1.0% points to 55.8% and 19.0% in 2020 from 54.8% and 18.0% in 2019, respectively in the NMA. Kenya’s electricity coverage also stood at 70.0%, which represents a 0.3%-points increase from the 69.7% realized in 2019. These instances among many others signifies government’s efforts to better the country through infrastructure developments.
As a follow up to the aforementioned infrastructure report, we shall focus on highlighting the status of infrastructure in the Nairobi Metropolitan Area (NMA), with a major focus on roads, water and sewer network coverage. This is so because infrastructure continues to be a major priority in government’s economic agenda. Therefore, this topical will cover the following:
- Introduction,
- Infrastructure Trends in Kenya,
- State of Infrastructure in the Nairobi Metropolitan Area,
- Importance of Roads, Water, and, Sewer Network Availability to the Real Estate Sector, and,
- Conclusion and Recommendation.
Introduction
Infrastructure constitutes the fundamental systems essential for the proper functioning of utility services, encompassing systems like water, transport, energy, internet, sewer and drainage networks, among others. These critical systems significantly impact a country's performance and survival, and their inadequacy can lead to economic stagnation. In Kenya, the government has actively pursued various financial strategies to support infrastructure development, acknowledging its capital-intensive nature. These financial strategies encompass Public Private Partnerships (PPPs), the issuance of infrastructure bonds, debt financing, and substantial budgetary allocations.
In Kenya, the largest focus on infrastructure by the government has been road networks. Over the years, the government has invested heavily in road development and maintenance, with the country’s road assets estimated at over Kshs. 3.5 tn, representing one of the largest public investments in Kenya. According to the Kenya National Highways Authority (KeNHA) 2020/2021 – 2022/2023 Strategic Plan, the Authority scheduled to design 5,862 km of roads, develop 2,655 km of roads, acquire right of way for 4,266 km of roads, increase the percentage of paved roads in good condition by 15%, and increase the percentage of unpaved roads in good condition by 30.0%. The total amount required to implement the FY’2020/2021 – 2022/2023 Strategic Plan amounted to Kshs 464.0 bn, financed through exchequer budgetary allocation of Kshs 295.4 bn, with the internal resource gap of Kshs 168.6 bn catered through PPPs and internally generated revenues.
For water systems, the Kenya National Bureau of Statistics (KNBS) indicates that the number of Water Purification Points (WPPs) is slated to increase to 355 in FY'2022/23, from 343 in FY'2021/22 attributed to the expected completion and rehabilitation of various water projects. In addition, a total of 38,278 boreholes were drilled in FY'2021/22 as an alternative source of water following unreliable water supply. The number of boreholes is further expected to increase in FY’2023, with the private sector accounting for 90.4% of the total boreholes drilled. As such, the government needs to increase its focus on providing reliable water supply infrastructure.
Section II: Infrastructure Trends in Kenya
- Roll Out and Completion of Infrastructure Projects
The Kenyan infrastructure sector has witnessed the initiation and implementation of numerous projects primarily driven by the government's determination and sustained focus on developing various parts of the country, especially road projects. As these projects are undertaken, they generate employment opportunities, boosting economic activity and creating a ripple effect as workers contribute to local businesses. Improved connectivity resulting from these developments facilitates smoother trade, attracting investments and fostering economic growth. Furthermore, upgraded infrastructure enhances productivity, encourages innovation, and elevates the overall quality of life for citizens. Some of the projects include; extension of the Standard Gauge Railway (SGR) to Kisumu and Isiolo, development of the Dongo Kundu Special Economic Zone, development of Nairobi Railway City, and construction of airports, airstrips and a modern cruise ship terminal in Mombasa. Additionally, the government is pursuing the completion of major infrastructure projects that were previously halted, signaling renewed commitment to infrastructural developments. Such projects include the dualling of Rironi-Mau Summit Highway, Kenol-Sagana-Marua highway Phase 3 and 4, and the Eastern Bypass Highway Phase 2.
- Enhanced Technology Integration
There is a notable emphasis on the integration of advanced technologies in infrastructure projects in Kenya, meant to promote efficiency and sustainability of infrastructure. This includes the geospatial technology in monitoring the construction and maintenance of roads, leveraging real-time data for optimal efficiency during project delivery. In addition, water supply projects are incorporating novel technologies for enhanced purification processes. This deliberate embrace of technology not only ensures that Kenya's infrastructure remains at the forefront of innovation but also contributes to the nation's broader digital transformation agenda, aligning its infrastructure with global standards in smart urban development. The integration of these technologies not only ensures that infrastructure is at the forefront of innovation but also contributes to the nation's digital transformation, aligning Kenya with global standards in smart infrastructure.
- Inclusive Infrastructure Planning
There has been a shift towards inclusive infrastructure planning, emphasizing considerations for the diverse needs of the population. This holistic approach involves integrating accessibility, environmental impact assessments, and social inclusivity into project designs. For instance, the KeNHA 2020/2021 – 2022/2023 Strategic Plan includes commitments to decrease the carbon footprint resulting from highway construction works by 5.0%, measures to cut down on dust, air, and noise pollution at construction sites by 50.0%, engagement in reforestation efforts along both existing and newly constructed road corridors by planting 36,000 trees, and guaranteeing the full execution of an environmental and social management plan across all projects, aimed at achieving a 100.0% implementation rate.
The objective is to create infrastructure that not only meets basic requirements but also contributes to a more sustainable and equitable society. Projects are now evaluated not only on their functional utility but also on their ability to foster social cohesion, environmental responsibility, and inclusivity, reflecting a comprehensive understanding of the role infrastructure plays in shaping the nation's future.
- Financing Strategies
- Budgetary Allocations
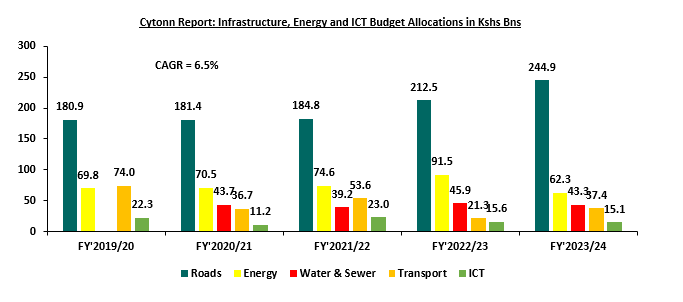
The government’s year-on-year budgetary allocations continue to play a pivotal role in steering Kenya's infrastructure development. In the FY’2023/24, the total budget allocation for infrastructure, energy and ICT stands at a substantial Kshs 468.2, recording a 12.4% increase from the Kshs 416.4 bn recorded for the preceding FY’2022/23. This underscores the recognition of the capital-intensive nature of infrastructure projects and their direct impact on job creation and regional economic growth. The chart below illustrates the growth in budgetary allocations for infrastructure, energy and ICT over the last five fiscal years:
Source: National Treasury of Kenya
- Issuance of Infrastructure Bonds
The issuance of infrastructure bonds has become a significant financial strategy, providing substantial funding for infrastructure projects beyond the constraints of annual budget allocations. In June 2023, the Central Bank of Kenya (CBK) floated the IFB1/2023/07 infrastructure bond which sought to raise Kshs 60.0 bn. The bond registered an oversubscription rate of 367.5%, at a yield of 15.8%, which is comparable to a yield of 18.6% on a tax effected basis. In addition, the recently issued IFB1/2023/6.5 infrastructure bond was oversubscribed by 177.8%, with the government accepting bids worth Kshs 67.1 bn at a yield of 17.9%, which is comparable to a yield of 21.1% on a tax effected basis. Investors' heightened interest in these bonds is attributed to the appealing feature of tax-exempt coupons, enhancing their attractiveness and providing investors with a valuable avenue for portfolio diversification. These infrastructure bonds not only serve as a reliable source of financing but also reflects the confidence of investors in the government's commitment to infrastructure development. The funds generated from these bonds contribute significantly to advancing ongoing and upcoming infrastructure projects, fostering economic growth and development.
- Public Private Partnerships (PPPs)
Public Private Partnerships continue to be a key strategy in the implementation of major infrastructure projects in Kenya. The collaboration between the public sector and private entities introduces efficiency, innovation, and additional financial resources into project execution. Notable examples include the Nairobi Expressway, a PPP project between the national government through the Kenya National Highways Authority (KENHA) and the China Road and Bridge Construction Corporation (CRBC).
The involvement of the private sector in infrastructure projects mitigates the financial burden on the government and introduces a level of expertise and efficiency often associated with private enterprise. The success of PPPs is evident in their role in the Western Bypass, Nairobi Bulk Water Supply Project, Nairobi Commuter Rail Project, Kajiado – Imaroro and Ngong – Kiserian – Isinya roads project, and the Solid Waste Treatment Plant Project in Nairobi City County, among others. This collaborative approach not only accelerates project implementation but also aligns with global best practices in infrastructure development.
- Road Maintenance Levy Fund
Established to ensure a dedicated source of funding for road maintenance, the Road Maintenance Levy Fund (RMLF) is generated through a levy imposed on fuel, and then channeled to rehabilitate road networks across the country. According to the Annual Public Roads Programme 2022/2023, Kenya has witnessed an improvement in its road networks, with the good roads network expanding to 18.2% in 2018 from a modest 9.9% in 2009. Simultaneously, the proportion of poor road networks has notably decreased to 37.0% in 2018, marking a significant decline from the 58.9% recorded in 2009. This is through the government’s continued road improvement efforts, supported by the levy. During FY’2022/23, a total of Kshs 67.2 bn is projected to be collected under the RMLF, representing an increase of 22.1% compared to FY’2021/22, which is expected to further go into rehabilitating bad roads into better conditions. This is as RMLF employs a systematic approach to revenue collection, facilitated through the Kenya Roads Board (KRB). This strategic framework ensures the efficient allocation of resources, enabling a targeted and responsive approach to road maintenance.
- Credits and Grants from Development Partners
Kenya continues to leverage grants from international development partners as a crucial source of funding for its infrastructure projects. These partnerships provide not just financial resources, technical expertise, and knowledge transfer. For instance, the World Bank, such as through the Kenya Urban Support Program (KUSP), has been a significant contributor to Kenya's urban infrastructure development endeavors. The government's ability to secure favorable financing terms and conditions from development partners enables the implementation of projects that might otherwise be financially challenging. The prudent utilization of grants ensures the successful execution of projects while minimizing the burden on the national budget.
Section III: State of Infrastructure in the Nairobi Metropolitan Area (NMA)
For our analysis, we covered the current supply of infrastructure in the Nairobi Metropolitan Area and projects that are currently underway with a focus on roads, water supply, and sewerage systems. The counties of focus within the NMA include Nairobi, Kiambu, Machakos, and Kajiado Counties. Below is the analysis of the infrastructure provision in the Nairobi Metropolitan Area;
- Roads
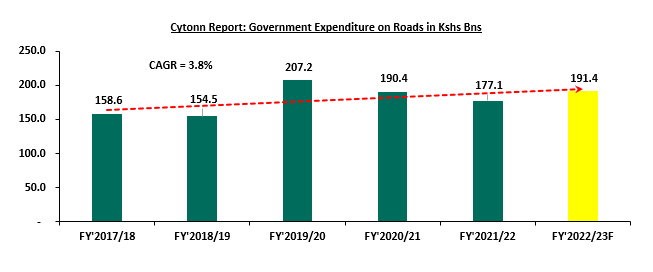
According to the Economic Survey 2023, road transport was the leading contributor to the value output of the transport and storage sector, accounting for 77.5% of the sector’s value output at Kshs 2.2 tn. This stood in contrast to the overall value output of the entire transport and storage sector which amounted to Kshs 2.8 tn, indicating that road transport is the predominant mode of transportation in the country. In terms of expenditure, in line with the government’s continued efforts to address the country’s growing need for road infrastructure through increased budgetary allocations, the survey report highlighted that government’s expenditure on roads is expected to increase by 8.0% to Kshs 191.4 bn in FY’2022/23 from Kshs 177.1 bn in FY’2021/22. In support of this, according to the FY’2022/2023 budget statement, government increased budgetary allocation to the roads sector by 15.0% to Kshs 212.5 bn from Kshs 184.8 bn in FY’2021/22, highlighting the government's key focus on development and rehabilitation of roads across the country. Owing to the government’s consistent efforts, road network in the country stands at 246,757 Km out of which 162,055 Kms are classified and constitutes one of the country’s largest public investments. This according to the latest Annual Public Roads Programme (APRP) 2023/24 Report published by Kenya Roads Board. The graph below shows the Kenyan government’s expenditure on roads during the last five years;
Source: Kenya National Bureau of Statistics (KNBS)
However, recent developments relating to government expenditure as revealed by the National Treasury indicate a shift in government’s spending priorities, signaling reduced roads expenditure in the FY’2023/24, as a result of significant budgetary cuts. According to the Supplementary Budget FY’2023/24, allocation to the State Department of Roads reduced by 8.3% to Kshs 230.1 bn from Kshs 250.8 bn. This was attributed to the redirection of funds to other key sectors such as education, as well as to address mounting costs over debt repayment, on the back of increasing debt obligations exacerbated by the continued depreciation of the Kenyan Shilling. As such, we anticipate that the overall roads expenditure in the FY’2023/24 will reduce significantly. In light of this, we expect to witness a reduction in the number of roads projects initiated and completed in the country during the FY’2023/24 period, as the sector grapples to stabilize and deliver results amid significant budgetary slashes.
The State Department of roads is responsible for development, maintenance and management of road infrastructure in the country. The Department delivers the road maintenance functions through several state corporations namely; i) Kenya Roads Board (KRB), which is responsible for overseeing the road network and coordinating the maintenance, rehabilitation and development using Roads Maintenance Levy Fund (RMLF), ii) Kenya National Highways Authority (KENHA) which oversees the management, development and maintenance of National Trunk Roads in Classes S, A, and B, iii) Kenya Rural Roads Authority, (KeRRA), which is responsible for the management, development and maintenance of National Trunk Roads in Class C, iv) Kenya Urban Roads Authority, (KURA), which is responsible for the management, development and maintenance of urban roads in cities and municipalities, and, v) Kenya Wildlife Service (KWS), which is responsible for management, development and maintenance of roads in National Parks and National Game Reserves. The table below highlights the definitions of different road classes and overseeing bodies;
|
Cytonn Report: Road Classification in Kenya |
|||
|
# |
Road Class |
Definition |
Overseeing Body |
|
1 |
Superhighway (S) |
Highway connecting two or more cities/towns meant to carry safely a large volume of traffic at the highest legal speed of operation. |
KeNHA |
|
2 |
International Trunk Road (A) |
Roads forming strategic routes and corridors, connecting international boundaries at identified immigration entry and exit points and international terminals such as international air or sea ports |
KeNHA |
|
3 |
National Trunk Road (B) |
Roads forming important national routes linking national trading or economic hubs, county headquarters and other nationally important centres to each other and to the national capital or to Class A roads |
KeNHA |
|
4 |
Primary Road (C) |
Roads forming important regional routes, linking County headquarters or other regionally important centres, to each other and to class A or B roads |
KeRRA |
|
5 |
Secondary Road (D) |
Roads linking constituency headquarters, municipal or town council centres and other towns to each other and to higher class roads |
KURA |
Source: Kenya Roads Board
In terms of performance, in the Nairobi Metropolitan Area (NMA), a total of 91.7 Km road networks constructions valued at Kshs 43.7 bn have been completed between 2022 and 2023 so far. Some of the notable projects completed during the period include Nairobi Western Bypass and Rehabilitation & Upgrading of Eastlands Phase II Road. In comparison with FY’2021/22 performance, this is a decrease from the 132.8 Km road networks worth Kshs 93.1 bn recorded. This was attributed to an increase in projects initiations over the period, subsequently resulting in an expansion of the projects pipeline. Below is a summary of completed road network coverage in the Nairobi Metropolitan Area (NMA) between 2022 and November 2023;
(All Values in Kshs Bns Unless Stated otherwise)
|
Cytonn Report: Roads Completed in Nairobi Metropolitan Area 2022-2023 |
||
|
County |
Coverage (in Km) |
Cost (Kshs) |
|
Kiambu |
17.0 |
2.2 |
|
Nairobi |
74.7 |
41.5 |
|
Total |
91.7 |
43.7 |
Source: KeNHA, KeRRA, KURA
In addition to the aforementioned completed road networks projects, the Nairobi Metropolitan Area (NMA) boasts of 1,131.6 Km of ongoing construction and rehabilitation projects valued at Kshs 86.3 bn. This represents a significant increase from the 940.5 Km projects worth 97.3 bn that was recorded in 2022. Some of the ongoing construction projects include; i) Kenol - Ngoleni - Kaani / Mutituni – Kaseve, ii) Athi River Machakos Turn Off, iii) dualling of Nairobi Eastern Bypass (From Baraka Roundabout to Ruiru/Kamiti Junction), iv) rehabilitation of Thika Town roads, v) improvement of access to Kibera housing project, vi) rehabilitation of Kasarani - Mwiki Road, and, vii) construction of Ngong-Suswa road in Machakos, Kiambu, Nairobi and Kajiado Counties respectively. Below is a summary of the ongoing road network coverage in the NMA;
(All Values in Kshs Bns Unless Stated otherwise)
|
Cytonn Report: Summary of Nairobi Metropolitan Area Ongoing Road Projects |
|||
|
County |
Total Coverage (in Km) |
Status |
Cost (Kshs) |
|
Kajiado |
142.4 |
61.8% |
7.3 |
|
Nairobi |
70.3 |
61.7% |
12.2 |
|
Kiambu |
685.4 |
54.6% |
49.7 |
|
Machakos |
233.5 |
53.4% |
17.1 |
|
Total |
1,131.6 |
|
86.3 |
|
Average |
|
57.9% |
|
Source: KeNHA, KeRRA, KURA
- Water Supply
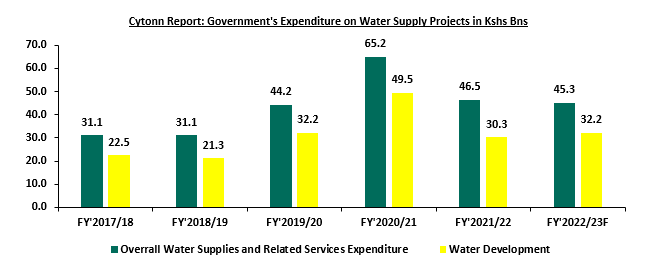
According to the Economic Survey 2023 report, water supply accounted for 13.2% of the environment and natural resources sector value output at Kshs 64.6 bn. This was in comparison to the overall environment and natural resources sector which recorded a value output of Kshs 487.3 bn, representing a 3.6% share contribution to the country’s Gross Domestic Product (GDP) as at 2022. In terms of expenditure, the report highlights that the government’s expenditure on water supplies and related services is projected to decrease slightly by 2.7% to Kshs 45.3 bn in FY’2022/23 from Kshs 46.5 bn in FY’2021/22, as a result of the completion of some major projects, and a tightened fiscal framework. Notable projects completed during the period under review include Siyoi Muruny, Habasweni and Karimenu II water projects, as well as rehabilitation of water supply projects at Ijara, Marsabit and Mandera. However, expenditure on water development is projected to increase by 6.4% to Kshs 32.3 bn in FY’2022/23 from Kshs 30.3 bn in FY’2021/22, signifying government’s continued efforts to increase the supply and access to safe and adequate water across various parts of the country by through drilling boreholes and maintenance of water purification points. The graph below shows government’s expenditure on water supply projects and related services in the last five years;
Source: Kenya National Bureau of Statistics
In the Nairobi Metropolitan Area (NMA) most sources of water originate from piped water systems and boreholes. In terms of water coverage performance, the Water Services Regulatory Board (WASREB’s) Impact Issue Report No.14 highlights NMA’s average water coverage declined by 4.0% to 51.8% in 2021 from 55.8% in 2020 despite water connections increasing during the period under review. This was attributed to high population and urbanization growth rates outpacing the development of water infrastructure services. According to the Kenya National Bureau of Statistics, population in the NMA increased by 1.8% to 9.8 mn people in 2021, from 9.6 mn in 2020, and is projected to continue growing as the same rate to reach 10.1 mn persons in 2023. Additionally, the World Bank puts urbanization rates in Kenya at 3.7%. These factors have put a strain on existing water systems to meet increasing demand thus leading to water coverage declines. Some of the completed water projects include: i) Makadara East water supply project, ii) Westlands bulk water transfer system project, iii) Embakasi West water project, iv) Nairobi Northern collector tunnel water project, iv) Mavoko water supply project, v) extension of water supply networks in Kiambu town, Gituamba, Ndumberi, Karunga and Mburera areas, and vi) UNICEF borehole projects in Kajiado county among others.
In terms of coverage per county, Nairobi registered the highest water coverage at 88.0% compared to NMA’s average of 51.8%, as at 2021, due to presence of adequate water supply systems and networks. On the other hand, Kajiado recorded the least water coverage at 22.0%, which is 9.0% points decline from 31.0% that was recorded in 2020. This was attributed to inadequate water supply with the problem being compounded by the a high population growth rate at 2.5% compared to Kenya’s 1.8%, according to the Kenya National Bureau of Statistics. WASREB defines water coverage as the number of people served with drinking water expressed as a percentage of the total population within the service area of a utility. The table below show the Nairobi Metropolitan Area water coverage as at 2021:
|
Cytonn Report: Nairobi Metropolitan Area Water Coverage |
||
|
County |
2021 |
2020 |
|
Nairobi |
88.0% |
79.0% |
|
Kiambu |
69.0% |
67.0% |
|
Machakos |
28.0% |
46.0% |
|
Kajiado |
22.0% |
31.0% |
|
Average |
51.8% |
55.8% |
Source: Water Services Regulatory Board (WASREB)
Below is a list of some of the water and sewer system companies within the Nairobi Metropolitan Area;
|
Cytonn Report: Nairobi Metropolitan Area Water and Sewer Service Providers |
|||
|
Company |
County |
Company |
County |
|
Kiambu Water and Sewerage Company |
Kiambu |
Nairobi City Water & Sewerage Company |
Nairobi |
|
Thika Water and Sewerage Company |
Kiambu |
Runda Water Services Provider |
Nairobi |
|
Ruiru-Juja Water and Sanitation |
Kiambu |
Machakos Water and Sewerage Company |
Machakos |
|
Limuru Water and Sewerage Company |
Kiambu |
Mavoko Water and Sewerage Company |
Machakos |
|
Kikuyu Water and Sewerage company |
Kiambu |
Kangundo–Matungulu Water and Sewerage Company |
Machakos |
|
Gatundu Water and Sanitation Company |
Kiambu |
Mwala Water and Sanitation Company |
Machakos |
|
Karimenu Water and Sanitation Company |
Kiambu |
Oloolaiser Water and Sewerage Company |
Kajiado |
|
Kikuyu Water and Sewerage company |
Kiambu |
Nol-Turesh Loitokitok Water & Sanitation Company |
Kajiado |
|
Karuri Water and Sewerage Company |
Kiambu |
Olkejuado Water and Sewerage Company |
Kajiado |
|
Athi Water Works Development Agency |
Nairobi |
Tanathi Water Works Development Agency |
Machakos |
Source: Water Services Regulatory Board
In efforts to bridge the gap of inadequate water and sewer systems within the Nairobi Metropolitan Area, the government has initiated several projects to achieve its goals including;
- Utawala, Mihango Area water supply project in Nairobi county,
- Ruiru water treatment plant project in Kiambu county,
- Limuru, Loroho and Gitiha Areas water supply project in Kiambu county,
- Kiambaa Water Supply Project in Kiambu county,
- Gatundu Water Supply project in Kiambu County,
- Oloitoktok water supply and sanitation project in Kajiado county,
- Namanga mega water project in Kajiado county,
- Mwala Cluster and Matungulu Water Supply and Sanitation project in Machakos County, and,
- Machakos water supply project, among others.
- Sewer Systems
Sewer systems in the Nairobi Metropolitan Area recorded an average network coverage of 24.5% in 2021, a notable increase of 5.5% points from the 19.0% recorded in 2020, according to the Impact Report Issue No. 14 published by the Water Services Regulator Board (WASREB). This was attributed to the completion of numerous projects during the period such as i) Nairobi sanitation connection projects in informal settlements, ii) Gatundu, Karimenu and Karure sewer systems, iii) Thika and Juja sewer lines expansion by 30 Km, iv) Ruiru sewer project, v) Oloitok sanitation project, and vi) Athi River sewer lines construction and upgrade projects among others.
Notably, Nairobi County led with the highest coverage at 50.0%, while counties like Kajiado had minimal connectivity with majority of the population still relying on alternative systems such pit latrines, septic tanks, and bio digesters. Notably, during the period under review, Kajiado joined the list of counties in the NMA with sewerage systems, a noteworthy shift considering the county’s sewerage coverage as at 2020 stood at zero percent, according to the Impact Report Issue No.13. The table below shows the water and sewer coverage of various counties within the NMA as at 2021;
|
Cytonn Report: Nairobi Metropolitan Area Sewer Systems Coverage |
||
|
County |
Sewer Coverage 2021 |
Sewer Coverage 2020 |
|
Nairobi |
50.0% |
51.0% |
|
Kiambu |
28.0% |
11.0% |
|
Machakos |
15.0% |
14.0% |
|
Kajiado |
5.0% |
0.0% |
|
Average |
24.5% |
19.0% |
Source: Water Services Regulatory Board (WASREB)
However, despite the significant improvement in terms of sewerage coverage witnessed in 2021, the above statistics depict a clear gap and need for the establishment of additional, adequate sewer systems in the Nairobi Metropolitan Area. In targeted initiatives to address the disparity, enhance the currently limited network coverage and achieve universal access to sewered sanitation services by 2030 (Vision 2030), the government has initiated several sewer network projects with the aim of augmenting sewerage infrastructure coverage in the Nairobi Metropolitan Area. Some of the ongoing sewer infrastructure projects include;
- Riruta Sewer Extension Works in Nairobi city,
- Donholm and Savannah Sewer Rehabilitation and Upgrade Project in Nairobi County,
- Njiru Sewer Line Extension Project in Nairobi County,
- Construction of Machakos Sewerage Project in Machakos County,
- Kiambu Ruaka Sewerage Project in Kiambu County,
- Mavoko National Housing Corporation Sewerage Project in Machakos County,
- Isinet Public Sanitation Facility in Kajiado County,
- Mwala Constituency Sanitation Project Phase 3 in Machakos County, and,
- Machakos Sewerage Project, among many others.
Notably, considering the huge capital investment required for sewerage systems development universal access to sewered sanitation services by 2030 appears untenable. As such, this target has now been revised under the National Water and Sanitation Investment Plan (NAWASIP) framework to a target of achieving 40.0% sewered and 60.0% non-sewered in urban areas, by 2030.
The table below presents a summary of infrastructure coverage in the Nairobi Metropolitan Area;
|
Cytonn Report: Summary of Infrastructure Coverage in the Nairobi Metropolitan Area |
|||||
|
# |
County |
Ongoing Road Projects Coverage in Km (as at 2023) |
Completed Road Projects in Km (2022 - 2023) |
Water Coverage (as at 2021) |
Sewer Coverage (as at 2021) |
|
1 |
Nairobi |
70.3 |
74.7 |
88.0% |
50.0% |
|
2 |
Kiambu |
685.4 |
17.0 |
69.0% |
28.0% |
|
3 |
Machakos |
233.5 |
- |
28.0% |
15.0% |
|
4 |
Kajiado |
142.2 |
- |
22.0% |
5.0% |
|
|
Total |
1,131.6 |
91.7 |
|
|
|
|
Average |
|
|
51.8% |
24.5% |
Source: KeRRA, KURA, KeNHA, WASREB
Section IV: Importance of Roads, Water, and, Sewer Network Availability to the Real Estate Sector
The connection between infrastructure and Real Estate is a crucial one, with a profound impact on property values, development, and urban living. As such, the lack thereof affects the delivery of high-quality property stock. In this section, we outline the effects of infrastructure availability to the property sector;
- Opening up Areas for Investments: Establishment of infrastructure such as roads networks opens up surrounding areas to property investments by promoting ease of accessibility. Some of notable developments launched around major roads include the Global Trade Centre, Crystal Rivers Mall, and Imaara Mall, located along the Nairobi Expressway project, Mi Vida Homes and Garden City Business park along the Thika Superhighway, mushrooming residential estates such as Pinecourt located in close proximity to the Nairobi Eastern Bypass among others,
- Improved Property Prices: Essential infrastructure elements such as properly maintained roads, water supply, and sewer systems are key factors in influencing property values within a specific location. In support of this, according to Cytonn Q3’2023 Markets Review, serviced land in the satellite towns of the Nairobi Metropolitan Area (NMA) recorded higher average selling prices at Kshs 18.3 mn, compared to the average selling prices of the unserviced land in the satellite towns of the NMA which came in at Kshs 16.4 mn,
- Reduction of Development Costs: Presence of readily available infrastructure amenities such as sewer systems and piped water connections eases the burden of construction to developers by reducing the costs which could otherwise be incurred by them. The Center for Affordable Housing Finance Africa (CAHF), estimates that infrastructure costs accounts for averagely 11.0% of total developmental costs,
- Enhancing Trade Operations: The existence of robust infrastructure significantly bolsters commercial activities within a given region. For instance, the provision of essential utilities such as electricity, water, sewer, and drainage systems, among other infrastructure amenities, plays a pivotal role in optimizing the functionality of businesses within an area, in contrast to regions with limited infrastructure, where business operations face significant challenges,
- Promoting Tourism and Attracting Foreign Investments: A well-developed infrastructure framework not only encourages domestic investment but also attracts foreign capital. The sustained progress in infrastructure development and associated advancements has garnered global acclaim for Kenya, as a distinguished regional hub. Consequently, Kenya has witnessed a surge in foreign investments positively impacting its property market, with the entry of prominent investors such as Café Java, Grit Real Estate, CCI Group of Companies, Carrefour, Miftah Concierge, Artcaffe, Marriot Bonvoy, Pan Pacific group of hotels among others. Furthermore, the presence of adequate infrastructure, including airports, airstrips, and road networks, contributes to the growth of tourism by improving accessibility to the country and facilitating the movement of tourists to various destinations, and,
- Enhance the Quality of Housing Stock: Presence of adequate infrastructural amenities such as roads, water supply and sanitation services including sewerage systems significantly enhances the quality of delivered housing stock. Subsequently, adequate infrastructure improves living standards of citizens in a country, contrary to an area with inadequate infrastructure.
Section V: Conclusion and Recommendation
To gauge Real Estate investment opportunities based on infrastructure, we looked at the key infrastructural sectors and ranked them in terms of performance and availability as follows;
The points are 1-4, with 4 awarded to the Best Performing Area Based on Infrastructure Availability
|
Cytonn Report: County Ranking based on the State of Infrastructure Development 2022 - October 2023 |
||||||
|
County |
Completed Roads |
Roads in Pipeline |
Water Connectivity |
Sewer Connectivity |
Average Points |
Rank |
|
Nairobi |
4 |
1 |
4 |
4 |
3.3 |
1 |
|
Kiambu |
3 |
4 |
3 |
3 |
3.3 |
1 |
|
Machakos |
1 |
3 |
2 |
2 |
2.0 |
3 |
|
Kajiado |
1 |
2 |
1 |
1 |
1.3 |
4 |
Source: Cytonn Research
Based on the above infrastructure services, Nairobi and Kiambu are the best Counties for Real Estate developments such as residential units, due to the presence of adequate completed road networks, and, adequate water and sewer connectivity. Some of the areas to invest in Nairobi County due to the presence adequate infrastructure include; Westlands, Gigiri, Ridgeways, Karen, Runda, Kilimani, Upperhill, Parklands, Upperhill, Spring Valley, Kileleshwa, Syokimau among many others. Some of the best areas to implement Real Estate investments in Kiambu county include; Thika, Kiambu town, Ruiru, and Juja among others. Kajiado ranks at the bottom of all four counties, due to absence of adequate infrastructural amenities such as sewered sanitation services, water connectivity and low volume of road networks.
We anticipate that Kenya’s infrastructure sector and consequently the Nairobi Metropolitan Area (NMA) will witness a slowdown in the number of initiated and completed construction and maintenance projects going forward, particularly roads. This is primarily due to a reduction in budgetary allocations in the FY’2023/24. Furthermore, we expect the reduction in country’s overall development budget by Kshs 41.9 bn to Kshs 765.7 bn from Kshs 807.6 bn will have a knock-on effect to the infrastructure sector. Consequently, we anticipate that going forward, there will be a decline in the number of infrastructure projects completed, while the number of stalled infrastructure projects across the country is expected to rise due to insufficient funding. While it is acknowledged that the government is turning to Public-Private Partnerships (PPPs) to bridge financing gaps, it is our opinion that a heightened focus on PPPs is essential to overcome funding constraints. This is primarily because PPPs leverage private sector resources and expertise, fostering sustainable infrastructure development and economic growth.
Disclaimer: The views expressed in this publication are those of the writers where particulars are not warranted. This publication, which is in compliance with Section 2 of the Capital Markets Authority Act Cap 485A, is meant for general information only and is not a warranty, representation, advice or solicitation of any nature. Readers are advised in all circumstances to seek the advice of a registered investment advisor.

- Talk to us
- Kenya
- P.O Box 20695 - 00200, Nairobi, Kenya
- Cell +254709101200
- Tel +254709101200
- WhatsApp +254741676635
- United States
- +254709101200
- DOWNLOAD OUR APP
-


- Kenya
- 8th Floor, Pinetree Plaza, Kaburu Drive, Ngong Road, Nairobi, Kenya
- USA
- Suite 1150, 1775 Eye Street NW, USA, Washington DC 20006, USA
- Investments
- High Yield
- Private Equity
- Real Estate
- Real Estate
- RiverRun Estates
- Cytonn Towers
- The Ridge
- Taraji Heights
- The Alma