Unit Trust Funds Performance, Q1’2020, & Cytonn Weekly #32/2020
By Cytonn Research, Aug 9, 2020
Executive Summary
Fixed Income
During the week, T-bills remained oversubscribed, with the subscription rate coming in at 135.0% up from 118.7% the previous week, mainly supported by the high liquidity in the money markets. The highest subscription rate was on the 91-day paper, which came in at 213.0%, down from 396.5% recorded the previous week. On the other hand, the subscription for the 182-day paper increased to 96.0% from 24.7% recorded the previous week, while that of the 364-day paper increased to 142.7% from 101.5% recorded the previous week. The oversubscription in recent weeks has partly been attributable to the high liquidity in the money market, as well as Bank’s preference towards government securities as opposed to lending to the private sector in the wake of the COVID-19 pandemic, which has heightened credit risk. During the week, Stanbic Bank’s Monthly Purchasing Manager’s Index (PMI) for July was released, highlighting that Kenyan firms have shown renewed improvement in economic conditions mainly attributable to the lifting of regional border controls, which led to a sharp rise in output and new business. The seasonally adjusted PMI came in at 54.2 in July, an improvement from the 46.6 recorded in June, and the first time it has moved past the 50.0 mark since December 2019;
Equities
During the week, the equities market was on a downward trend, with NASI, NSE 20 and NSE 25 recording declines of 2.0%, 2.6% and 2.3%, respectively, taking their YTD performance to losses of 21.5%, 33.8%, and 27.1%, for NASI, NSE 20 and NSE 25, respectively. The NASI performance was driven by declines recorded by large-cap stocks, with the highest declines being recorded in ABSA, KCB and NCBA, which lost by 4.4%, 4.2%, and 3.9%, respectively. During the week, the Central Bank of Kenya approved the acquisition of a 90.0% stake of Jamii Bora’s shareholding by Co-operative Bank, to be completed on 21st August 2020 after the deal received all regulatory approval following approval by the National Treasury on 4th August 2020;
Real Estate
During the week, Shoprite Holdings, a South African based international retailer, announced the closure of its branch in Nyali Mombasa, effective 31st August, revealing that trading at the branch was not viable, while InterContinental Hotel, located along City Hall Way in Nairobi, halted its operations, sacking all employees amid the coronavirus economic tumble. In addition, the Ministry of Transport, Infrastructure, Housing and Urban Development, and Public Works, through the State Department for Housing and Urban Development, published an expression of interest (EOI) for strategic partners seeking to collaborate with the government in the development of the “The Nairobi Railway City”, a multi-modal, transit-oriented, urban development in the capacity of master developers and developers;
Focus of the Week
Following the release of Unit Trust Fund Managers’ results for Q1’2020, we examine the performance of Unit Trust Funds, especially Money Market Funds, which is the most popular Unit Trust Funds investment with a market share of 88.2% in Q1’2020, an increase from 87.0% in FY’2019;
- Weekly Rates:
- Cytonn Money Market Fund closed the week at a yield of 10.72%. To invest, just dial *809#;
- Cytonn High Yield Fund closed the week at a yield of 12.94% p.a. To invest, email us at sales@cytonn.com and to withdraw interest you just dial *809#
- Phase 1 of The Alma is now 100% sold and we are now running promotions:
- For Phase 1: Get a 10% rent discount on units we manage for investors;
- For inquiries, please email us on properties@cytonn.com;
- For an exclusive tour of Cytonn’s real estate developments, visit: Sharp Investor's Tour and for more information, email us at sales@cytonn.com;
- We continue to offer Wealth Management Training daily, from 9:00 am to 11:00 am, through our Cytonn Foundation. The training aims to grow financial literacy among the general public. To register for any of our Wealth Management Training, click here;
- For Pension Scheme Trustees and members, we shall be having different industry players talk about matters affecting Pension Schemes and the pensions industry at large. Join us every Wednesday from 9:00 am to 11:00 am for in-depth discussions on matters pension;
- Cytonn continues to inform the market on the importance of retirement planning and issues affecting the pensions industry. In this week's article we focus on the adequacy of NSSF savings for your retirement here;
- If interested in our Private Wealth Management Training for your employees or investment group, please get in touch with us through wmt@cytonn.com;
- For recent news about the company, see our news section here;
- We have 10 investment-ready projects, offering attractive development and buyer targeted returns. See further details here: Summary of Investment-ready Projects.
Money Markets, T-Bills & T-Bonds Primary Auction:
During the week, T-bills remained oversubscribed, with the subscription rate coming in at 135.0% up from 118.7% the previous week, mainly supported by the high liquidity being experienced in the money markets. The highest subscription rate was on the 91-day paper, which came in 213.0%, down from 396.5% recorded the previous week. On the other hand, the subscription for the 182-day paper increased to 96.0% from 24.7% recorded the previous week, while that of the 364-day paper increased to 142.7% from 101.5% recorded the previous week. The oversubscription in recent weeks has partly been attributable to the high liquidity in the money market, as well as Bank’s preference towards government securities as opposed to lending to the private sector in the wake of the COVID-19 pandemic, which has heightened credit risk. The yields on the 91-day paper and 182-day paper remained unchanged at 6.1% and 6.5%, similar to what was recorded the previous week, while that of the 364-day papers increased to 7.5% from 7.4% recorded last week. The acceptance rate increased to 94.1%, from 82.8% recorded the previous week, with the government accepting Kshs 30.5 bn of the Kshs 32.4 bn worth of bids received, higher than the weekly quantum of Kshs 24.0 bn.
The Treasury opened a tap sale for a 20-year bond, FXD2/2018/20, on the primary bond auction with an effective tenor of 18 years. The issue was oversubscribed with the subscription rate coming in at 100.7%, as the government received bids worth Kshs 40.3 bn, higher than the Kshs 40.0 bn offered, mainly attributable to the high liquidity in the money markets. The yield on the bond came in at 12.9%. The government accepted bids at cost (with accrued interest) worth Kshs 41.0 bn out of the Kshs 40.3 bn worth of bids received, translating to an acceptance rate of 101.8%.
For the month of August, the Government has issued a new 11-year amortized infrastructure bond namely, IFB1/2020/11 with an effective tenor of 11-years for a total value of Kshs 70.0 bn for funding of infrastructure projects in the FY2020/21 budget estimates. The bond has a coupon rate of 10.9% and the period of sale ends on 18thAugust 2020. We expect the bond to be oversubscribed, mainly due to the high liquidity in the market in addition to the bond’s attractiveness since it is tax-free. Our recommended bidding range is 11.4% - 11.6% for IFB1/2020/11, given that infrastructure bonds with a similar tenor are currently trading at 11.4%.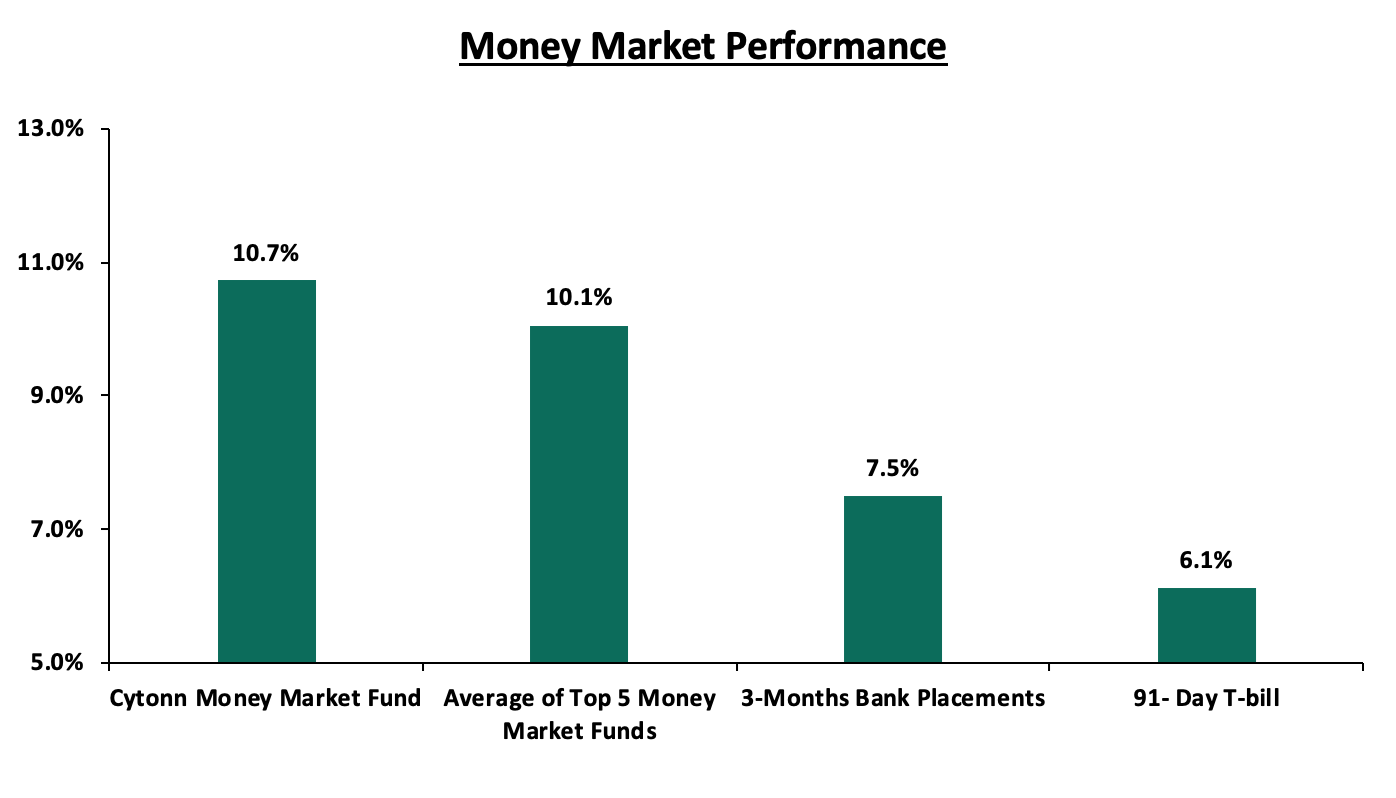
In the money markets, 3-month bank placements ended the week at 7.5% (based on what we have been offered by various banks), while the yield on the 91-day T-bill remained unchanged at 6.1%, similar to what was recorded the previous week. The average yield of Top 5 Money Market Funds declined marginally to 10.1% from 10.2% recorded the previous week. The yield on the Cytonn Money Market remained unchanged at 10.7%, similar to what was recorded the previous week.
Liquidity:
The money market remained liquid during the week with the average interbank rate coming in at 2.5%, up from the 2.3% recorded the previous week and below the 2019 average of 4.3%, mainly supported by government payments and maturing TADS of Kshs 162.2 mn. (TADs are used when the securities held by the CBK for Repo purposes are exhausted or when CBK considers it desirable to offer longer tenor options). The average interbank volumes declined by 55.7% to Kshs 10.3 bn, from Kshs 23.2 bn recorded the previous week. According to the Central Bank of Kenya, commercial banks’ excess reserves came in at Kshs 23.2 bn in relation to the 4.25% Cash Reserve Ratio.
Kenya Eurobonds:
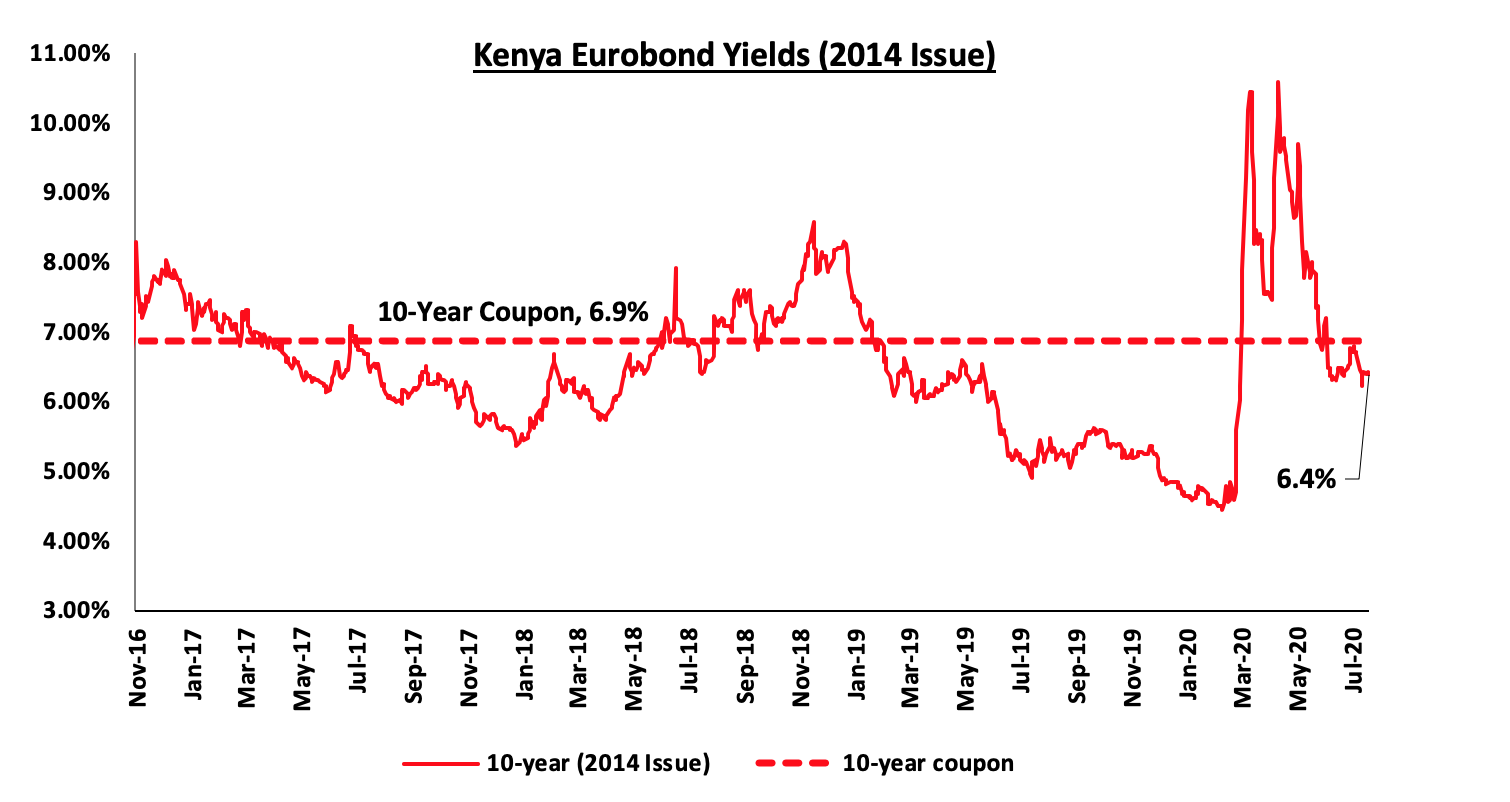
According to Reuters, the yield on the 10-year Eurobond issued in June 2014 remained unchanged at 6.4% during the week, similar to what was recorded the previous week.
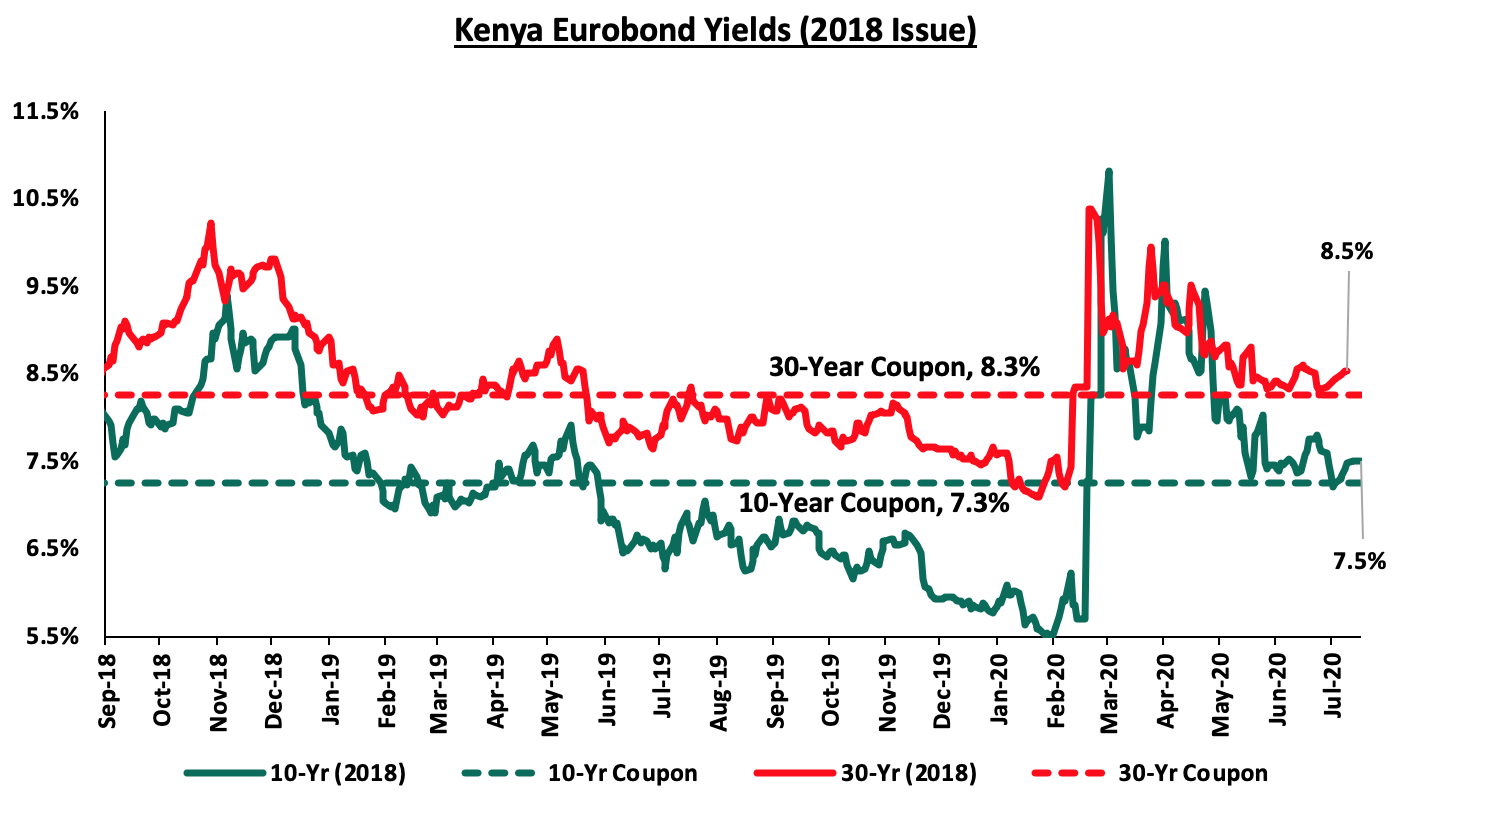
The yields on the 10-year Eurobond issued in 2018 remained unchanged at 7.5%, similar to what was recorded the previous week. The yield on the 30-year Eurobonds issued in 2018, on the other hand, increased marginally by 0.1% points to close at 8.5%, from the 8.4% recorded the previous week.
The yields on the 7-year Eurobond and 12-year Eurobond issued in 2019 remained unchanged at 7.4% and 8.2% respectively, similar to what was recorded the previous week.

Kenya Shilling:
During the week, the Kenya Shilling depreciated by 0.3% against the US Dollar to close the week at Kshs 108.0, from Kshs 107.7, recorded the previous week, attributable to increased demand for hard currencies from importers who are resuming business after the easing of the pandemic restrictions. On a YTD basis, the shilling has depreciated by 6.6% against the dollar, in comparison to the 0.5% appreciation in 2019. We expect continued pressure on the shilling due to:
- Demand from merchandise and energy sector importers as they beef up their hard currency positions,
- A deteriorating current account position, with the current account deficit deteriorating by 10.2% during Q1’2020, to Kshs 110.9 bn, from Kshs 100.6 bn recorded in Q1’2019 attributable to;
- 0% decline in the secondary income (transfers recorded in the balance of payments whenever an economy provides or receives goods, services, income or financial items) balance, to Kshs 124.1 bn, from Kshs 128.0 bn in Q1’2019, and,
- A 67.0% decline in the services trade balance (the difference between the imports and exports of services) to Kshs 20.4 bn, from Kshs 61.9 bn.
The shilling is however expected to be supported by:
- High levels of forex reserves, currently at USD 9.3 mn (equivalent to 5.6-months of import cover), above the statutory requirement of maintaining at least 4.0-months of import cover, and the EAC region’s convergence criteria of 4.5-months of import cover, and,
- Improving diaspora remittances evidenced by the 24.0% increase to USD 258.2 mn in May 2020, from USD 208.2 seen the previous month. In terms of y/y performance, diaspora remittances increased by 6.2% to USD 258.2 mn in May 2020, from USD 243.2 mn recorded in May 2019.
Weekly Highlight:
Stanbic Purchasing Manager’s Index
During the week, Stanbic Bank’s Monthly Purchasing Manager’s Index (PMI) for July was released, highlighting that Kenyan firms have shown renewed improvement in economic conditions mainly attributable to the lifting of regional border controls, which led to a sharp rise in output and new business. The seasonally adjusted PMI came in at 54.2 in July, an improvement from the 46.6 recorded in June, and the first time it has moved past the 50.0 mark since December 2019. Key to note, a PMI reading of above 50 indicates improvements in the business environment, while a reading below 50 indicates a worsening outlook.
Companies indicated that the lifting of COVID-19 related restrictions helped generate higher sales in July. Customer demand similarly increased during the month together with new orders from European countries leading to a surge in new business. Additionally, output levels expanded at the sharpest pace since May 2018, pointing to a partial recovery in activity given that it was also the first upturn in seven months. Purchasing activity rose steadily as relaxed travel restrictions helped firms receive inputs quicker than June with delivery times improving at the fastest rate in 16 months. Workforce numbers continued to fall although at a slower pace compared to previous months. Despite the improved conditions, it is important to note that businesses were still downbeat regarding the year’s outlook which is highly dependent on an end to the pandemic that largely remains uncertain. In our view, we expect the business environment to continue facing downward pressure for the better part of the year, given that coronavirus cases continue to increase in the hundreds on a daily basis and the fact that the economic recovery is pegged on how fast the spread of the virus can be contained.
Rates in the fixed income market have remained relatively stable as the government rejects expensive bids. The government is 128.4% ahead of its current domestic borrowing target of 486.2 bn, having borrowed Kshs 128.1 bn against a prorated target of Kshs 56.1 bn. As a result of depressed revenue collection with the revenue target for FY’2020/2021 at Kshs 1.9 tn, we expect a higher budget deficit, which the Treasury estimates at 7.5% of GDP, creating uncertainty in the interest rate environment as additional borrowing from the domestic market will be required to plug in the deficit. Owing to this uncertain environment, our view is that investors should be biased towards short-term fixed income securities to reduce duration risk.
Market Performance
During the week, the equities market was on a downward trend, with NASI, NSE 20 and NSE 25 recording declines of 2.0%, 2.6% and 2.3%, respectively, taking their YTD performance to losses of 21.5%, 33.8%, and 27.1%, for NASI, NSE 20 and NSE 25, respectively. The NASI performance was driven by declines recorded by large-cap stocks, with the highest declines being recorded in ABSA, KCB and NCBA, which lost by 4.4%, 4.2%, and 3.9%, respectively.
Equities turnover rose by 90.0% during the week to USD 26.9 mn, from USD 14.2 mn recorded the previous week, taking the YTD turnover to USD 961.2 mn. Foreign investors turned net sellers during the week, with a net selling position of USD 1.3 mn, from a net buying position of USD 0.5 mn recorded the previous week, taking the YTD net selling position to USD 266.9 mn.
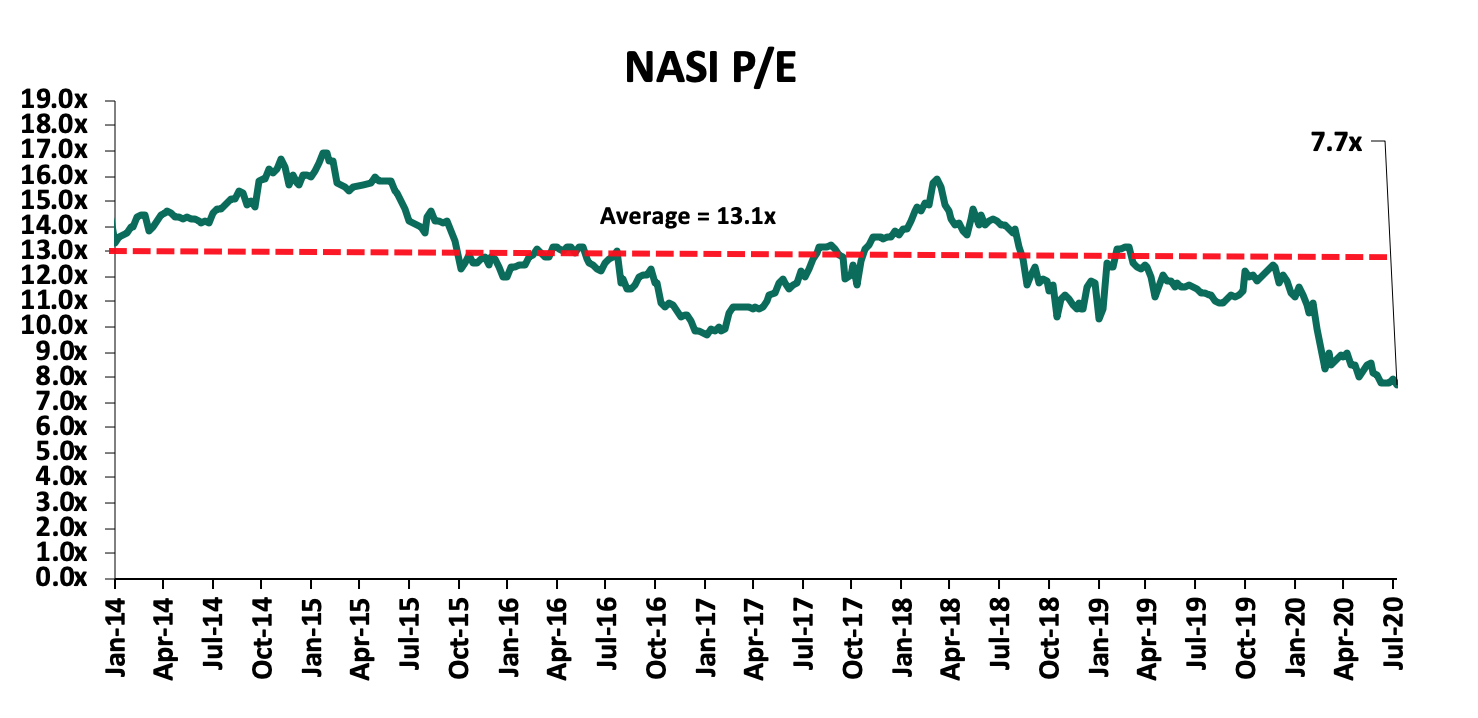
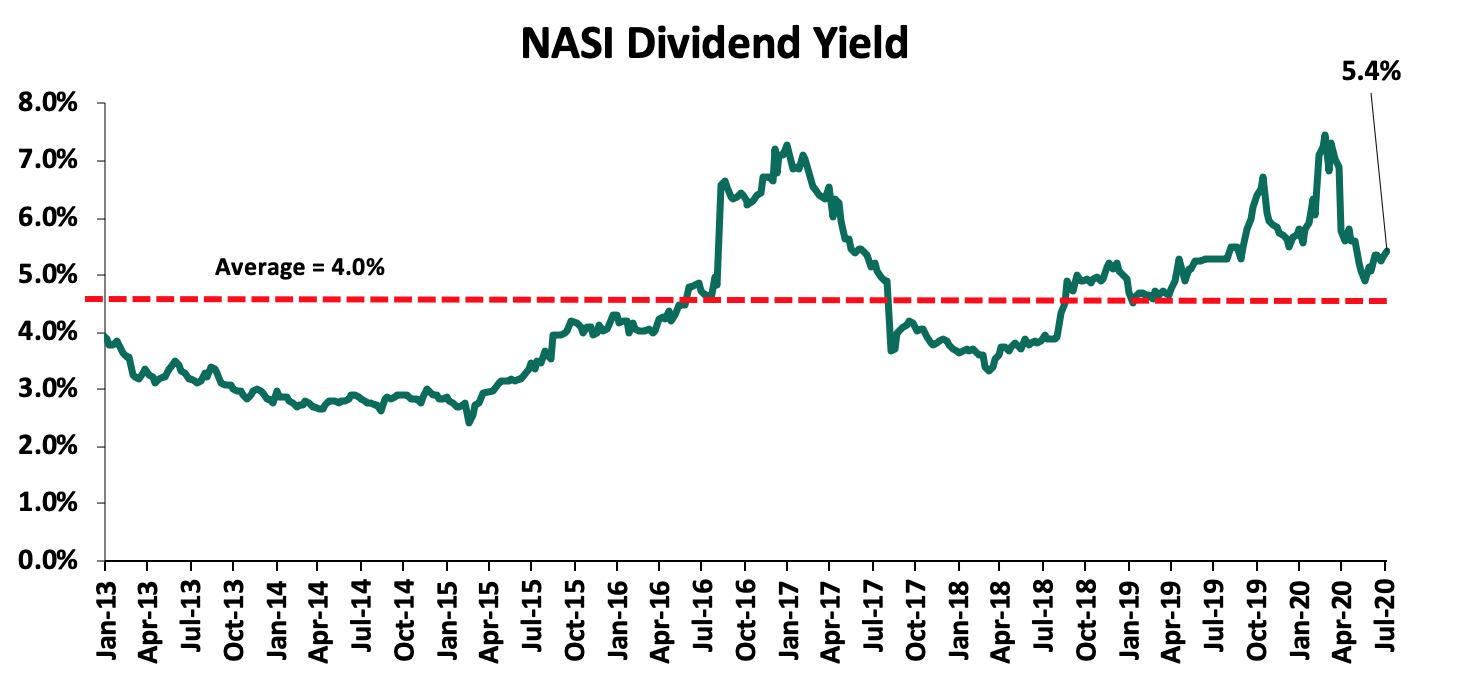
The market is currently trading at a price to earnings ratio (P/E) of 7.7x, 41.1% below the historical average of 13.1x. The average dividend yield is currently at 5.4%, 0.1% points above the 5.3% recorded the previous week, and 1.4% points above the historical average of 4.0%. The rise in dividend yield is attributable to price declines recorded by most stocks, however, the dividend yield has been weighed down by the decision by most companies to withhold dividend payments. With the market trading at valuations below the historical average, we believe there are pockets of value in the market for investors with higher risk tolerance and are willing to wait out the pandemic. The current P/E valuation of 7.7x is 1.4% below the most recent valuation trough of 7.8x experienced in the second week of July 2020. The charts below indicate the historical P/E and dividend yields of the market.
Weekly Highlight
During the week, the Central Bank of Kenya approved the acquisition of a 90.0% stake of Jamii Bora’s shareholding by Co-operative Bank, to be completed on 21stAugust 2020 after the deal received all regulatory approval following approval by the National Treasury on 4thAugust 2020. In March 2020, Co-operative bank opened talks of a 100.0% acquisition of Jamii Bora Bank (JBB) before varying their offer to a 90.0% stake for Kshs 1.0 bn effectively valuing Jamii Bora Bank at Kshs 1.1 bn. The transaction voted by the shareholders of Jamii Bora involved;
- The issuance of additional 224.1 mn new Class A shares to Co-operative bank, subject to Co-operative Bank paying the aggregate subscription price of Kshs 1.0 bn, effectively valuing the new shares at Kshs 4.46 per share,
- The existing issued 24.9 mn shares in JBB of Kshs 66.0 per share were reclassified to Class B, increasing JBB’s total shares outstanding to 249.0 mn shares from 24.9 mn shares, with the existing shareholders being diluted to 10.0%, and,
- The transaction was carried out at a price-to-book value (P/Bv) of 0.3x (at acquisition JBB had a book value of Kshs 3.4 bn), which is a 66.7% discount to the current listed banks trading book value of 0.9x, and 78.6% below the historical average P/Bv of 1.4x for the Kenyan Bank transactions in the last 5 years as highlighted in our Cytonn Weekly #26/2020; this indicates that JBB’s book value was likely overstated due to bad loans hence the heavy discount.
We believe that continued bank consolidation efforts in Kenya, as highlighted in our Q1’2020 Banking Report, will lead to a stable banking sector, as consolidation continues to eliminate weaker banks. In our view, banks will continue to consolidate to form strategic partnerships and well-capitalized entities capable of navigating the relatively tough operating environment induced by stiff competition. The table below highlights the various transactions in the banking sector in the last 5-years that have either happened, been announced or expected to be concluded:
|
Acquirer |
Bank Acquired |
Book Value at Acquisition (Kshs. Bns) |
Transaction Stake |
Transaction Value |
P/Bv Multiple |
Date |
|
Co-operative Bank |
Jamii Bora Bank |
3.4 |
90.0% |
1.0 |
0.3x |
Aug-20 |
|
Commercial International Bank |
Mayfair Bank Limited |
1.0 |
51.0% |
Undisclosed |
N/A |
May-20* |
|
Access Bank PLC (Nigeria) |
Transnational Bank PLC. |
1.9 |
100.0% |
1.4 |
N/A |
Feb-20* |
|
KCB Group |
National Bank of Kenya |
7.0 |
100.0% |
6.6 |
0.9x |
Sep-19 |
|
CBA Group |
NIC Group |
33.5 |
53%:47% |
23.0 |
0.7x |
Sep-19 |
|
Oiko Credit |
Credit Bank |
3.0 |
22.8% |
1.0 |
1.5x |
Aug-19 |
|
CBA Group** |
Jamii Bora Bank |
3.4 |
100.0% |
1.4 |
0.4x |
Jan-19 |
|
AfricInvest Azure |
Prime Bank |
21.2 |
24.2% |
5.1 |
1.0x |
Jan-19 |
|
KCB Group |
Imperial Bank |
Unknown |
Undisclosed |
Undisclosed |
N/A |
Dec-18 |
|
SBM Bank Kenya |
Chase Bank Ltd |
Unknown |
75.0% |
Undisclosed |
N/A |
Aug-18 |
|
DTBK |
Habib Bank Kenya |
2.4 |
100.0% |
1.8 |
0.8x |
Mar-17 |
|
SBM Holdings |
Fidelity Commercial Bank |
1.8 |
100.0% |
2.8 |
1.6x |
Nov-16 |
|
M Bank |
Oriental Commercial Bank |
1.8 |
51.0% |
1.3 |
1.4x |
Jun-16 |
|
I&M Holdings |
Giro Commercial Bank |
3.0 |
100.0% |
5.0 |
1.7x |
Jun-16 |
|
Mwalimu SACCO |
Equatorial Commercial Bank |
1.2 |
75.0% |
2.6 |
2.3x |
Mar-15 |
|
Centum |
K-Rep Bank |
2.1 |
66.0% |
2.5 |
1.8x |
Jul-14 |
|
GT Bank |
Fina Bank Group |
3.9 |
70.0% |
8.6 |
3.2x |
Nov-13 |
|
Average |
75.9% |
1.4x |
||||
|
* Announcement Date ** Deals that were dropped |
||||||
Universe of Coverage:
We are currently reviewing our target prices for the Banking and Insurance sector coverage.
We are “Neutral” on equities for investors because, despite the sustained price declines, which have seen the market P/E decline to below its historical average presenting investors with attractive valuations in the market, the economic outlook remains grim.
- Retail Sector
During the week, Shoprite Holdings, a South African based international retailer, announced the closure of its branch in Nyali Mombasa, effective 31st August, revealing that trading at the branch was not viable. This brings the number of remaining outlets in Kenya to 2: at Garden City and Westgate Mall in Nairobi. This follows the continued scaling down of the retailer's operations across the continent has recently announced plans to sell all or a majority stake of its business in Nigeria, citing re-evaluation of its operating model. According to the retailer’s trading statement, its South African division grew by 8.7% while sales at its supermarkets outside South Africa fell by 1.4%. We attribute the reduced revenue inflows to constrained spending power among consumers due to a tough financial environment in the wake of the ongoing pandemic, which has resulted in the slowdown of the global economy. This, in addition to the exit of other retailers such as Botswana’s Choppies, and the existing oversupply of retail space with the introduction of 0.8 mn SQFT of retail space in 2019, has continued to impact on the Kenya retail sector occupancy rates which dropped by 0.3% points to 80.0% in H1’2020, from 80.3% in FY’2019 Cytonn H1’2020 Market Review.
In our view, the scaling down by retailers is attributed to constrained spending power among consumers due to a tough financial environment in the wake of the ongoing pandemic, which has resulted in reduced disposable income. However, we expect decentralization, as in the case of international financial institutions such as International Finance Corporation (IFC) buying into companies such as Naivas, will strengthen the retailers’ financial muscle thus boosting operations. Nevertheless, we expect the sector’s performance to continue being phased by the tough economic environment, in addition to the shift to e-commerce.
- Hospitality Sector
During the week, global chain International Hotels Group, announced the halting of operations and closure of the InterContinental Hotel, located along City Hall Way in Nairobi, amid the coronavirus economic tumble. Intercontinental Hotels Corporation Limited and the Kenya government each own 33.8% of Kenya Hotel Properties (KHP), the holding company that owns the 389- key 5-star hotel. InterContinental Hotel was already struggling before the pandemic outbreak and was declared technically insolvent as it could not service its debts that stood at Kshs 717 million in 2019 and the reduced revenue inflows due to the ongoing pandemic have thus exacerbated the financial strain. This follows the suspension of operations by other players such as Fairmont Norfolk, which had in May announced halting of its operations due to financial constraints but retracted the employees’ redundancy notice after the intervention of the Office of the Attorney General. The strain is also evidenced by the ongoing activities such as the auctioning of hotels such as 56- key Laibon Hotel in South B, as the hospitality sector continues to grapple with the effects of the Coronavirus pandemic, which has seen hotel occupancy rates at record lows, mainly due to its reliance on tourism, as travel restrictions and social distancing rules continue to result in reduced demand for hospitality services, coupled by the cancellation of meetings, conferences and events.
Despite the hospitality sector being the hardest hit by the COVID-19 pandemic due to its over-reliance on tourism, the sector continues to attract global investors, with global hotel groups, Accor Hotels, and Radisson Hotel Group announcing in July that they would continue with their expansion plans in Kenya and the African region as a whole despite the slump in the sector due to the pandemic. This affirms Kenya’s hospitality sector’s attractiveness to global investors driven by; (i) heightened security, (ii) recognition of Kenya as a regional hub, (iii) relaxation of travel advisories by governments of key tourism markets, and (iv) political stability that has prevailed in the country. We expect the sector’s recovery to commence in the near term on the back of government policies aimed at cushioning the sector such as the government’s directive to re-open hotels and restaurants in major towns, the Ministry of Tourism’s post-corona recovery strategy fund of Kshs 500.0 mn, the government’s 8-point stimulus program which, among others, seeks to offer soft loans to hotels and related establishments through the Tourism Finance Corporation (TFC) thus stimulating the hospitality sector, and, the tourism sector’s plan to repackage their products in order to appeal to a wider scope of domestic tourists.
- Master Planned Developments
During the week, the Ministry of Transport, Infrastructure, Housing and Urban Development, and Public Works, through the State Department for Housing and Urban Development, published an expression of interest (EOI) inviting strategic partners seeking to collaborate with the government in the development of the “The Nairobi Railway City”, a multi-modal, transit-oriented, urban development in the capacity of master developers and developers. The government will provide 425 acres of development land (292 acres of this is owned by the Kenya Railways and currently serving as the Nairobi Railway Station) and off-site infrastructure. The project covers the area between Haile Selassie Avenue, Uhuru Highway and Bunyala road. The development has been designated as a project of strategic national importance and designated a Special Planning Area (SPA); by the conferment of this status;
- The City has been identified as suitable for intensive and specialized development activity thus provides a framework for its physical development and management, and guides the development control processes within that area,
- The declaration cuts planning and construction approval bureaucracy for investors and developers and fast tracks the city as a private sector development of national significance, and,
- The SPA also provides a sound legal basis for the planning process, which in turn strengthens the case for the plan's implementation, which the government is embarking upon, in addition to providing a rallying point and a stronger bargain for an alliance of actors working together.
The project, which is part of the Nairobi Integrated Urban Development Plan, is aimed at expanding the capital's CBD in a manner that is sustainable in line with transit-oriented development practices. The plan includes the building of a new railway station that allows for the integration of Bus Rapid Transit (BRT) and other public transport modes. The project is divided into three main components;
- Meeting facilities, incentive conferences, and exhibitions, which will be located along Bunyala Road,
- An economic zone comprising hi-tech industries and small and medium enterprises, and,
- A residential complex in Landi Mawe and Industrial Area- including a school, park, and affordable housing units to accommodate approximately 28,000 residents.
The implementation of the project is estimated to take a total of 20 years at a cost of Kshs 27.9 billion. Some of the goals of the proposed development include; (i) to promote and further enhance the global competitiveness of Nairobi City, (ii) providing a framework for coordinating public and private investment, (iii) capture land value for the sustainable urban regeneration of the area and development, (iv) transport improvement through the development of an integrated railway transportation network, and (v) serve as critical project and initiative for Kenya’s efforts in a post-COVID recovery period.
The call for strategic partners to collaborate with the government on the proposed City indicates that the latter continues to enlist the help of the private sector for financing and development of infrastructure and affordable housing, for instance with the River Estate, a 2,720-unit housing project being developed by Edermann Property Limited, a Kenyan based real estate firm and financed jointly by the national and county government. However, in our view, in the case if the Railway City, requirements such as a developer’s ability to mobilize cash or financing amounting to a minimum of Kshs 7.5 billion at any one given time, and have an annual turnover above Kshs 10 billion over the last five years is unfavorable for most local developers especially in the wake of a tough economic environment. Other challenges likely to face the collaboration include; (i) regulatory hindrances such as lack of a mechanism to transfer public land to a Special Purpose Vehicle (SPV) to facilitate access to private capital through the use of the land as security, (ii) lack of clarity on returns and revenue-sharing, and (iii) the extended time-frame of Public Private Partnerships (PPPs) while private developers prefer to exit projects within 3-5 years. Nevertheless, with the conferment of the Railway City as an SPA, we expect some hurdles such as the slow approval processes to be eliminated thus enhancing the successful implementation of the project. If successful, we expect the project to spur economic growth through creation of jobs, opening up of areas for development mainly with the improved transport system and reduced traffic congestion within the Nairobi CBD and neighboring nodes, in addition to complementing the ongoing efforts in the resolving of the existing housing deficit within the low and middle-income segment.
Despite the effects of the COVID-19 pandemic taking a toll on the Kenyan economy, we expect the real estate sector to be cushioned by the resilience of the hospitality and retail sectors, and collaborative development activities between the private sector and the Kenyan government through PPPs.
Unit Trust Funds, “UTFs”, are collective investment schemes that pool money together from many investors and are managed by professional Fund Managers, who invest the pooled funds in a portfolio of securities to achieve objectives of the trust. Following the release of Unit Trust Fund Managers’ results for Q1’2020, we examine the performance of Unit Trust Funds, especially Money Market Funds, which is the most popular Unit Trust Funds investment with a market share of 88.2% in Q1’2020, an increase from 87.0% in FY’2019. In our previous focus on Unit Trust Funds, we looked at the FY’2019 Performance by Unit Trust Fund Managers. In this note, we focus on the Q1’2020 performance by Unit Trust Fund Managers, where we shall analyze the following:
- Performance of the Unit Trust Funds Industry,
- Performance of Money Market Funds,
- Comparing Annualized Unit Trust Funds AUM Growth with Bank Deposits Growth, and,
- Conclusion
Section I: Performance of the Unit Trust Funds Industry
As defined above, Unit Trust Funds are essentially investment schemes that pool money from investors and are managed by a professional Fund Manager who invests the pooled funds in a portfolio of securities to achieve objectives of the trust. The funds in the unit trust earn returns in the form of dividends, interest income, and/or capital gains depending on the asset class the funds are invested in. The main types of Unit Trust Funds include;
- Money Market Fund – This fund invests in short-term debt securities with high credit quality such as treasury bills and commercial paper. The fund offers high-income yield, liquidity as well as capital stability. Risk adverse investors are prone to invest in Money Market Funds in times of high stock market volatility;
- Equity Fund – This fund aims to offer superior returns over the medium to longer-term by maximizing capital gains and dividend income through investing in listed equity securities. To maintain liquidity, the fund reduces its high exposure in the equities market through diversifying its portfolio of shares in various sectors;
- Balanced Fund – These are funds in which the investments are diversified across the Equities and the fixed income market. The fund offers its investors with long-term growth as well as reasonable levels of income; and,
- Fixed Income Fund – This fund invests in interest-bearing securities, which include treasury bills, treasury bonds, preference shares, corporate bonds, loan stock, approved securities, notes and liquid assets consistent with the portfolio’s investment objective.
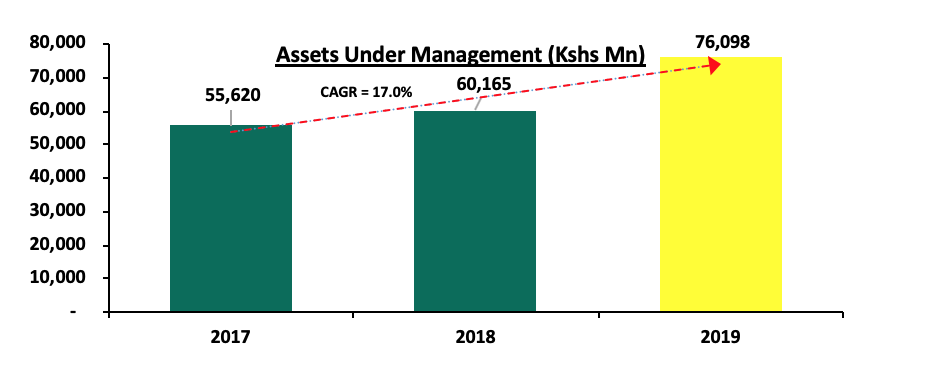
In line with Capital Market Regulations (2002) Part IV (32), Unit Trust Funds Managers released their Q1’2020 results. As per the results, the overall Assets under Management (AUM) of the industry grew at a rate of 0.32% to Kshs 76.3 bn in Q1’2020, from Kshs 76.1 bn as at FY’2019. In the last two-years, Assets under Management of the Unit Trust Funds have grown at a CAGR of 17.0% to Kshs 76.1 bn in FY’2019 from Kshs 55.6 bn recorded in FY’2017.
This growth can be largely attributable to:
- Affordability to Retail Investors: Unit Trust Funds have become more accessible to retail investors, with a majority of the Collective Investment Schemes’ (CIS) in the market requiring an initial investment ranging between Kshs 100.0 - Kshs 10,000.0,
- Diversification: Unit Trust Funds are also advantageous in terms of offering investors the opportunity of diversifying their portfolios by providing them with access to a wider range of investment securities even with limited capital, which would have not been accessible if they invested on their own, and,
- Liquidity: Compared to other investment options such as equities, unit trusts are liquid, as it is easy to sell and buy units without depending on supply and demand at the time of investment or exit. Furthermore, the advent of digitization and automation within the industry has enhanced liquidity enabling an investor to receive their funds within 3 to 5 working days if they are withdrawing to their bank accounts, and immediate access to funds when withdrawing via M-Pesa.
According to the Capital Markets Authority, there are 24 approved collective investment schemes made up of 92 funds in Kenya as of Q1’2020. Out of the 24 however, only 19 are currently active while 5 are inactive. The table below outlines the performance of Fund Managers of Unit Trust Funds in terms of Assets under Management:
|
Assets Under Management (AUM) for the Approved and Active Collective Investment Schemes |
||||
|
No. |
Fund Managers |
FY'2019 AUM (Kshs mns) |
Q1’2020 AUM (Kshs mns) |
AUM Growth* FY'2019 – Q1’2020 |
|
1 |
CIC Asset Managers |
29,717.30 |
29,784.61 |
0.9% |
|
2 |
British American Asset |
9,780.44 |
10,004.44 |
9.2% |
|
3 |
ICEA Lion |
8,020.37 |
8,040.88 |
1.0% |
|
4 |
Commercial Bank of Africa |
7,194.76 |
7,724.84 |
29.5% |
|
5 |
Old Mutual |
6,245.85 |
6,133.07 |
(7.2%) |
|
6 |
Sanlam Investments |
2,735.42 |
3,320.20 |
85.5% |
|
7 |
African Alliance Kenya |
2,082.48 |
1,883.44 |
(38.2%) |
|
8 |
Dry Associates |
1,662.44 |
1,781.43 |
28.6% |
|
9 |
Stanlib Kenya |
1,917.09 |
1,419.50 |
(103.8%) |
|
10 |
Madison Asset Managers |
1,594.61 |
1,371.96 |
(55.9%) |
|
11 |
Zimele Asset Managers |
1,099.42 |
1,102.31 |
1.1% |
|
12 |
Nabo Capital (Centum) |
1,157.85 |
940.98 |
(74.9%) |
|
13 |
Cytonn Asset Managers |
717.33 |
757.76 |
22.5% |
|
14 |
Amana Capital |
590.08 |
597.22 |
4.8% |
|
15 |
Apollo Asset Managers |
523.05 |
471.51 |
(39.4%) |
|
16 |
Genghis Capital |
466.00 |
458.86 |
(6.1%) |
|
17 |
Equity Investment Bank |
424.34 |
397.05 |
(25.7%) |
|
18 |
Alpha Africa Asset Managers |
164.28 |
143.39 |
(50.9%) |
|
19 |
Co-op Trust Investment Services Limited |
5.26 |
10.84 |
424.5% |
|
|
Total |
76,098.4 |
76,344.30 |
1.1% |
|
*Annualized Growth |
||||
Source: Capital Markets Authority: Collective Investments Scheme Quarterly Report
Key to note from the above table:
- Assets Under Management: CIC Asset Managers remains the largest overall Unit Trust Fund Manager with an AUM of Kshs 29.8 bn in Q1’2020, from an AUM of Kshs 29.7 bn as at FY’2019 translating to a 0.9% annualized AUM growth,
- Market Share: CIC Asset Managers remains the largest overall Unit Trust with a market share of 39.0%, an decline from 44.1% in 2019, and,
- Growth: In terms of growth, Co-op Trust Investments recorded the strongest annualized growth of 424.5%, with its market share declining to 0.01% from 0.9% in FY’2019. Stanlib Kenya recorded the largest decline of 103.8%, with its market share declining to 1.9% from 2.5% in FY’2019.
Among unit trust products, Money Market Funds continued to be the most popular product in terms of market share, with 88.2%, an increase from 87.0% in FY’2019 as shown in the table below;
|
Assets Under Management (AUM) by Type of Collective Investment Scheme (All values in Kshs mns unless stated otherwise) |
||||||
|
No. |
Product |
FY'2019 AUM |
Q1’2020 AUM |
FY'2019 Market Share |
Q1’2020 Market Share |
Variance |
|
1 |
Money Market Funds |
66,193.0 |
67,358.0 |
87.0% |
88.2% |
1.2% |
|
2 |
Equity Fund |
4,485.2 |
3,631.6 |
5.9% |
4.8% |
(1.1%) |
|
3 |
Balanced Fund |
1,312.0 |
1,166.5 |
1.7% |
1.5% |
(0.2%) |
|
4 |
Others |
4,108.1 |
4,188.2 |
5.4% |
5.5% |
0.1% |
|
|
Total |
76,098.4 |
76,344.3 |
100.0% |
100.0% |
|
Source: Capital Markets Authority: Collective Investments Scheme Quarterly Report
During the period under review, Money Market Funds recorded 1.8% growth in the Assets under Management, and consequently, their market share rose to 88.2% from 87.0% recorded in FY’2019, driven by local investors’ preference for capital preservation during the period of review defined by high volatility in the equities market. Key to note, risk adverse investors are prone to invest in Money Market Funds in times of high stock market volatility. While Equity Funds have the potential to outperform stock market indices and deliver better yields than Money Market Funds over the medium to long-term, preservation of capital in Money Market Funds is the main contributory factor for its popularity in Kenya. Balanced Funds, on the other hand, ranked third in comparison to other products, with a market share of 1.5% in Q1’2020 from 1.7% recorded in FY’2019. Balanced Funds offer investors a reasonable level of current income and long-term capital growth, achieved by investing in a diversified spread of equities and fixed income securities. Having a medium risk profile, Balanced Funds carry a high potential for growth in the near future, as they are suitable for pension schemes, treasury portfolios of institutional clients, co-operatives, and high-net-worth individuals amongst others. The Other Funds include Income Funds, Growth Funds, Wealth Funds, Diversified Funds, and Bond Funds.
Section II: Performance of Money Market Funds
Money Market Funds (MMFs) in the recent past have gained popularity in Kenya with growth rates outperforming that of bank deposits. According to the Central Bank of Kenya data, the average deposit rate declined to 7.0% post the removal of the deposit rate cap floor from an average of 7.7% when the legislation was in place. Money Market Funds, in contrast, have been able to offer investors more attractive yields from their investments owing to their diversified asset allocation that maximizes returns on a risk-adjusted basis. As per the regulation, funds in MMFS’ are invested in liquid interest-bearing securities that have a weighted average maturity of less than 12-months. These securities include bank deposits, securities listed on NSE, and securities issued by the government. The allocation to these three asset classes in Q1’2020 was 27.3%, 10.5%, and 50.5% for bank deposits, securities listed on NSE, and securities issued by the Government of Kenya, respectively in Q1’2020. As such, the Fund is best suited for investors who require a low-risk investment that offers capital stability, liquidity, and a high-income yield. The Fund is also a good safe haven for investors who wish to switch from a higher risk portfolio to a low risk, high-interest portfolio, especially during times of high stock market volatility.
- Top Five (5) Money Market Funds by Yields
During the period under review, the following Money Market Funds had the highest average effective annual yield declared, with the Cytonn Money Market Fund having the highest effective annual yield at 11.0% against the industrial average of 8.7%.
|
Top 5 Money Market Funds by Yield in Q1’2020 |
||
|
Rank |
Money Market Funds |
Effective Annual Rate (Average Q1’2020) |
|
1 |
Cytonn Money Market Fund |
11.0% |
|
2 |
Zimele Money Market Fund |
9.9% |
|
3 |
Nabo Africa Money Market Fund |
9.9% |
|
3 |
Alphafrica Kaisha Money Market Fund |
9.8% |
|
4 |
CIC Money Market Fund |
9.8% |
|
|
Industrial Average |
8.7% |
Section III: Comparing Annualized Unit Trust Funds AUM Growth with Bank Deposits Growth
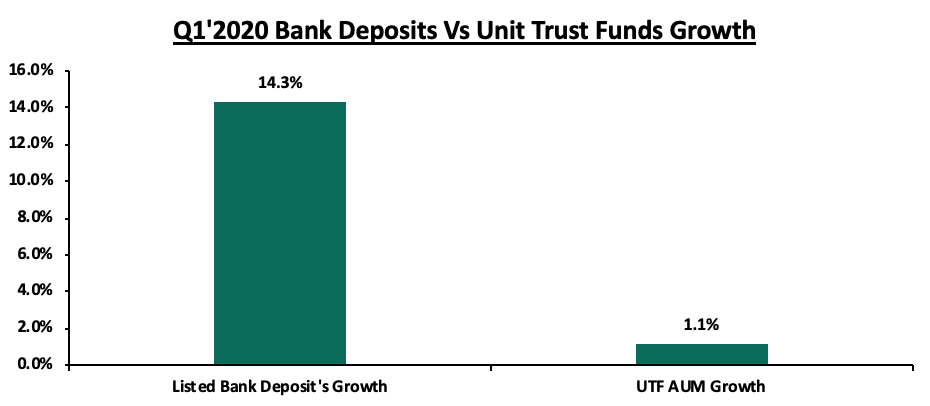
Unit Trust Funds assets recorded an annualized growth of 1.1% in Q1’2020, compared to a growth of 26.5% in FY’2019, while the listed bank deposits grew by 14.3% in Q1’2020 compared to a growth of 12.7% recorded in FY’2019.
|
Year |
FY’2018 |
FY’2019 |
Q1’2020 |
|
Listed Bank Deposit Growth |
11.3% |
12.7% |
14.3% |
|
Unit Trust AUM Growth |
4.3% |
26.5% |
1.1% |
The reason for the popularity of Money Market Funds in Kenya is attributable to the fund's affordability in its initial and additional investment requirements, its high liquidity as well as the daily compounding of interest. While initial deposit and additional investments may vary depending on the fund, Money Market Funds present a low risk, affordable and high-yielding investment opportunity for investors and capital preservation, a key feature of MMFs. Other than the ease of investing, Money Market Funds also provide individual investors with economies of scale through pooling their funds together and making investments that would otherwise be out of reach for individual investors. Thus, they benefit from the economies of scale created in the form of diversification, cost savings, and attractive returns on investments.
*Growth is annualized
As shown in the bar chart above, bank deposit growth at 14.3% way outpaced UTFs growth of 1.1%, and save for the year 2019, bank deposit growth usually outpace UTFs growth, an indication that our capital markets potential and growth remains constrained. Additionally, our Mutual Funds/UTFs to GDP ratio at 5.4% is still very low compared to global average of 61.8%, showing that we need to improve our Unit Trust Funds formation.
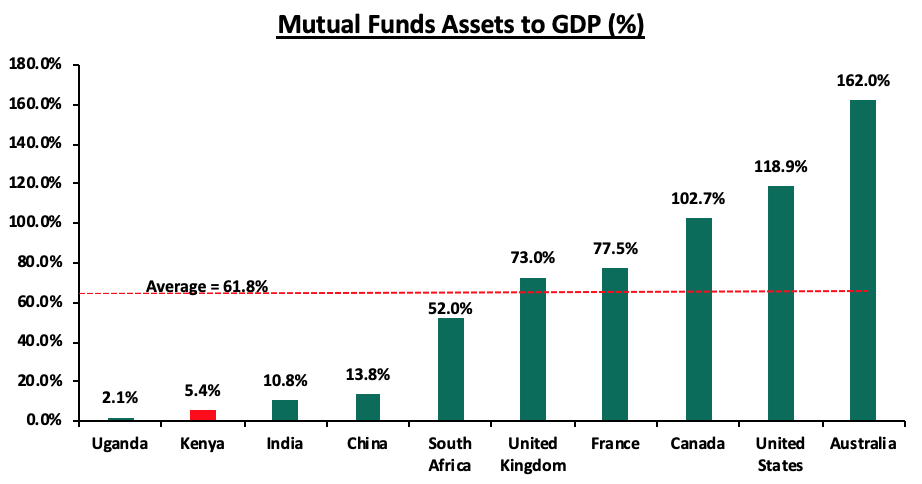
Source: World Bank Data
We recommend the following actions to improve Unit Trust Funds formation and growth:
- Expand eligibility of Trustees of Unit Trust Funds to include non-bank Trustees such as Corporate Trustees- The current situation where all Trustees are banks severely constrains capital market growth because of (1), the inherent conflict of interest where banks are Trustees in a market where they are also competing for funds, (2) banks are not best suited to be Trustees in complex financial products, hence this restrains the market to plain vanilla investments such as bank deposits and government debt,
- Allow Funds to have as many Custodians as it suits the Unit Holders- The current arrangement where UTFs are only allowed to have one Custodian makes it very expensive for Unit Holders to invest. For example, say an investor has Kshs. 1,000 at Equity Bank and wants to invest in a Unit Trust Fund held in Custody say at KCB bank the investor will have to transfer the Kshs 1,000 from Equity to KCB and may incur up-to Kshs 100 in charges, which is already a 10.0% transaction cost before investment. So even if they invest in a money market fund returning 10.0%, it would take a whole year just to recoup back their inward transaction cost. The solution to this would be to allow Fund Managers to open as many Custody accounts as it suits unitholders, in this example, a Custody account at Equity would save the investor the Kshs 100 transaction cost. Other than for an agency’s administrative convenience, it is not clear why in this day and age, Unit Holders would be limited to just one fund account,
- Intense Conflicts of Interest Retards Market Development: We should not have players in the market also part of a regulatory governance structure, as shown above, limiting Capital Markets Trustees to banks limits the development of capital markets,
- Allow for sector funds: The current capital markets regulations require that funds must diversify. Consequently, one has to seek special dispensation in form sector funds such as financial services funds, a technology fund, or a real estate UTF fund. Regulations allowing unitholders to invest in sector funds would expand the scope of unitholders interested in investing, and,
- Reduce the minimum investments to reasonable amounts: Sector funds, in addition to cumbersome incorporate as mentioned above, have high minimums of Kshs 1,000,000, which is way above the median wage of Kshs 50,000. Having sector funds minimum that is 20 times the national income seems unreasonably high.
Section IV: Conclusion
In conclusion, as Money Market Funds continue to lead among unit trust products with a market share of 88.2% in Q1’2020, there is a need to leverage more on innovation and digitization in order to further propel the growth of MMFs in Kenya. For instance, China’s first online money market fund known as Yu’eBao has explosively grown into one of the world’s largest MMF with an AUM of USD 180.6 bn as at 31st March 2020, despite being launched in 2013. Yu’eBao of Tianhong Asset Management was launched as a spare cash management platform, allowing users to transfer idle cash as low as USD 0.15 (Kshs 15.6) into the money market fund, with the use of the Alipay e-wallet. The use of technology as a distribution channel for mutual fund products opened up the fund manager to the retail segment, which is characterized by strong demand among retail clients for convenient and innovative products. The advent of digitization and automation within the industry has enhanced liquidity. Closer home, Cytonn Money Market Fund clients can issue withdrawal instructions and have funds remitted to their bank accounts within 2 – 4 working days while funds withdrawn through the USSD or digital platforms are remitted to their M-Pesa and Bank accounts within 5 minutes and 2 working days respectively; the Cytonn Money Market Fund is accessible through dialing *809#. As highlighted in our topical Potential Effects of COVID-19 on Money Market Funds, we believe that amidst the Coronavirus pandemic, returns for Money Market Funds will remain stable with a bias to a slight increase upwards should rates on government securities increase. They will also remain the most liquid of all mutual funds providing a short-term parking bay that earns higher income yields compared to deposits and savings accounts.
In terms of the top 3 key performance indicators:
- The largest Fund Manager was CIC Asset Managers with a 39.0% market share, followed by British American Asset Managers with a 13.1% market share,
- The fastest-growing Fund Manager was Co-op Trust Investments Services Limited, registering a 424.5% annualized growth, followed by Sanlam Investments with an 85.5% annualized growth, and, Commercial Bank of Africa with a 29.5% annualized growth, and,
- The highest yielding Money Market Fund was the Cytonn Money Market Fund with an average yield of 11.0%, followed by Zimele Money Market Fund and Nabo Africa, which both recorded an average yield of 9.9%.
Disclaimer: The views expressed in this publication are those of the writers where particulars are not warranted. This publication is meant for general information only and is not a warranty, representation, advice, or solicitation of any nature. Readers are advised in all circumstances to seek the advice of a registered investment advisor.

- Talk to us
- Kenya
- P.O Box 20695 - 00200, Nairobi, Kenya
- Cell +254709101200
- Tel +254709101200
- WhatsApp +254741676635
- United States
- +254709101200
- DOWNLOAD OUR APP
-


- Kenya
- 8th Floor, Pinetree Plaza, Kaburu Drive, Ngong Road, Nairobi, Kenya
- USA
- Suite 1150, 1775 Eye Street NW, USA, Washington DC 20006, USA
- Investments
- High Yield
- Private Equity
- Real Estate
- Real Estate
- RiverRun Estates
- Cytonn Towers
- The Ridge
- Taraji Heights
- The Alma