Unlocking New Listings on Nairobi Securities Exchange & Cytonn Weekly #02/2023
By Cytonn Research, Jan 15, 2023
Executive Summary
Fixed Income
During the week, T-bills remained oversubscribed, albeit at a lower rate, with the overall subscription rate coming in at 108.9%, down from 131.7% recorded the previous week. Investor’s preference for the shorter 91-day paper persisted as they sought to avoid duration risk, with the paper receiving bids worth Kshs 15.7 bn against the offered Kshs 4.0 bn, translating to a subscription rate of 392.3%, down from 482.9% recorded the previous week. The subscription rate for the 364-day paper increased to 46.7% from 44.8% recorded the previous week, while that of the 182-day paper declined to 57.7% from 78.0% recorded the previous week. The yields on the government papers were on an upward trajectory, with the yields on the 364-day, 182-day and 91-day papers increasing by 6.3 bps, 1.2 bps and 3.3 bps to 10.4%, 9.9% and 9.4%, respectively;
In the Primary Bond Market, the Central Bank of Kenya released the auction results for the recently re-opened bonds; FXD1/2020/005 and FXD1/2022/015 with effective tenors to maturity of 2.4 years and 14.3 years respectively. The bonds recorded an undersubscription of 83.3%, in line with our expectation, partly attributable to investors’ preference for the shorter dated papers as they sought to avoid duration risk. The government issued the bonds seeking to raise Kshs 50.0 bn for budgetary support, received bids worth Kshs 41.6 bn and accepted bids worth Kshs 31.5 bn, translating to a 75.7% acceptance rate. The weighted average yield for the bonds came in at 12.9% and 14.2% for FXD1/2020/005 and FXD1/2022/015, respectively, while the coupon rates came in at 11.7% and 13.9% for FXD1/2020/005 and FXD1/2022/015, respectively;
Additionally, the National Treasury gazetted the revenue and net expenditures for the sixth month of FY’2022/2023, ending 30th December 2022. Also, the Energy and Petroleum Regulatory Authority (EPRA) released their monthly statement on the maximum retail fuel prices in Kenya effective 15th January 2023 to 14th February 2023. Notably, fuel prices remained unchanged for the second consecutive month at Kshs 177.3, Kshs 162.0 and Kshs 145.9 per litres of Super Petrol, Diesel and Kerosene, respectively;
Equities
During the week, the equities market was on a downward trajectory, with NASI, NSE 20, and NSE 25 declining by 2.8%, 0.6% and 1.2%, respectively, taking the YTD performance to losses of 3.2% and 0.7% for NASI and NSE 25, respectively and a gain of 1.2% for NSE 20. The equities market performance was mainly driven by losses recorded by large cap stocks such as Bamburi, Safaricom, NCBA Group and BAT of 7.6%, 6.4%, 2.4% and 2.2%, respectively. The losses were however mitigated by gains recorded by large cap banking stocks such as Standard Chartered Bank Kenya (SCBK), Equity Group and Diamond Trust Bank (DTB-K) of 3.3%, 2.2% and 1.9%, respectively;
Additionally, during the week, Centum Investment Plc announced that it had terminated the Share Purchase Agreement (SPA) to sell its 83.4% stake in Sidian Bank Limited to Access Bank Plc. The termination was due to the lapse of time arising from expiry of the Long Stop Date, amidst other set conditions between the two parties that were not met;
Real Estate
During the week, Mwalimu National Sacco, a teachers-owned Sacco signed a partnership deal with state-owned financier, Kenya Mortgage Refinancing Company (KMRC) to provide low-cost mortgages capped at an interest rate of 9.0% to its members, 2.3% points lower than the market average of 11.3% in 2021. Additionally, Tatu City, a mixed-use satellite city development, launched a luxurious lakeside-living project dubbed ‘Kofinaf Tatu Residences’, sitting on a 200-acre piece of land within Kofinaf Estate, located in Tatu City, Kiambu County. In the Industrial sector, logistics firm Mitchell Cotts Freights Kenya Limited, in partnership with two other logistics firms; Perishable Movements Kenya Limited and Fresh Handing Kenya Limited, unveiled a dry cargo and cold storage facility worth Kshs 30.0 mn, within Jomo Kenyatta International Airport (JKIA). In the Real Estate Investment Trusts (REITs) segment, Fahari I-REIT closed the week trading at an average price of Kshs 6.4 per share on the Nairobi Securities Exchange, a 4.5% decline from Kshs 6.7 per share recorded the previous week. On the Unquoted Securities Platform as at 13th December 2022, Acorn D-REIT and I-REIT closed the week trading at Kshs 23.9 and Kshs 20.9 per unit, respectively, a 19.4% and 4.4% gain for the D-REIT and I-REIT, respectively, from the Kshs 20.0 inception price;
Focus of the Week
The Nairobi Securities Exchange (NSE) last recorded an Initial Public Offer (IPO) in 2015, when Stanlib Investments issued an IPO of the first Real Estate Investment Trust (Fahari-Ireit) at the bourse, managing to raise Kshs 3.6 bn against the target of Kshs 12.5 bn. This translates to an eight year IPO drought, with the most recent activity at the bourse being the listing by introduction (meaning no money was raised) of the Local Authority Pension Trust (LAPTRUST) Imara Income Real Estate Investment Trust (I-REIT)) under the Restricted Sub-Segment in 2022. Currently the bourse has 66 listed securities with a total market capitalization of Kshs 1.9 tn as at 13th January 2023. The bourse continues to be Safaricom dominated, with Safaricom’s market capitalization of Kshs 881.4 bn equivalent to 46.3% of the entire market capitalization. The market remains volatile given that a few large cap stocks control almost 75.0% of the total market capitalization, which presents a risk of a market collapse due to concentration risk. Additionally, between Safaricom (46.3%), Banks (35.5%) and Foreign Corporates (11.3%) make up 93.1% of listing, leaving all other local sectors to share 6.9% of the bourse. To remedy the listing drought, President Ruto in September set a target of 10 listings in one year. The regulator has also been on a journey of reviewing a number of regulatory provisions to align them to current and the ever-evolving capital raising and listing realm. In this week’s focus, we take a view on the reasons behind the low number of new listings, as well as recommendations on what should be done in order to attract IPOs;
Investment Updates:
- Weekly Rates:
- Cytonn Money Market Fund closed the week at a yield of 10.86%. To invest, dial *809# or download the Cytonn App from Google Playstore here or from the Appstore here;
- Cytonn High Yield Fund closed the week at a yield of 13.90% p.a. To invest, email us at sales@cytonn.com and to withdraw the interest, dial *809# or download the Cytonn App from Google Playstore here or from the Appstore here;
- We continue to offer Wealth Management Training every Wednesday, from 9:00 am to 11:00 am, through our Cytonn Foundation. The training aims to grow financial literacy among the general public. To register for any of our Wealth Management Trainings, click here;
- If interested in our Private Wealth Management Training for your employees or investment group, please get in touch with us through wmt@cytonn.com;
- Any CHYS and CPN investors still looking to convert are welcome to consider one of the five projects currently available for assignment, click here for the latest term sheet;
- Cytonn Insurance Agency acts as an intermediary for those looking to secure their assets and loved ones’ future through insurance namely; Motor, Medical, Life, Property, WIBA, Credit and Fire and Burglary insurance covers. For assistance, get in touch with us through insuranceagency@cytonn.com;
- Cytonnaire Savings and Credit Co-operative Society Limited (SACCO) provides a savings and investments avenue to help you in your financial planning journey. To enjoy competitive investment returns, kindly get in touch with us through clientservices@cytonn.com;
Real Estate Updates:
- For an exclusive tour of Cytonn’s real estate developments, visit: Sharp Investor's Tour, and for more information, email us at sales@cytonn.com;
- Phase 3 of The Alma is now ready for occupation and the show house is open daily. To rent please email properties@cytonn.com;
- We have 8 investment-ready projects, offering attractive development and buyer targeted returns; See further details here: Summary of Investment-ready Projects;
- For Third Party Real Estate Consultancy Services, email us at rdo@cytonn.com;
- For recent news about the group, see our news section here;
Hospitality Updates:
- We currently have promotions for Staycations. Visit cysuites.com/offers for details or email us at sales@cysuites.com;
Money Markets, T-Bills Primary Auction:
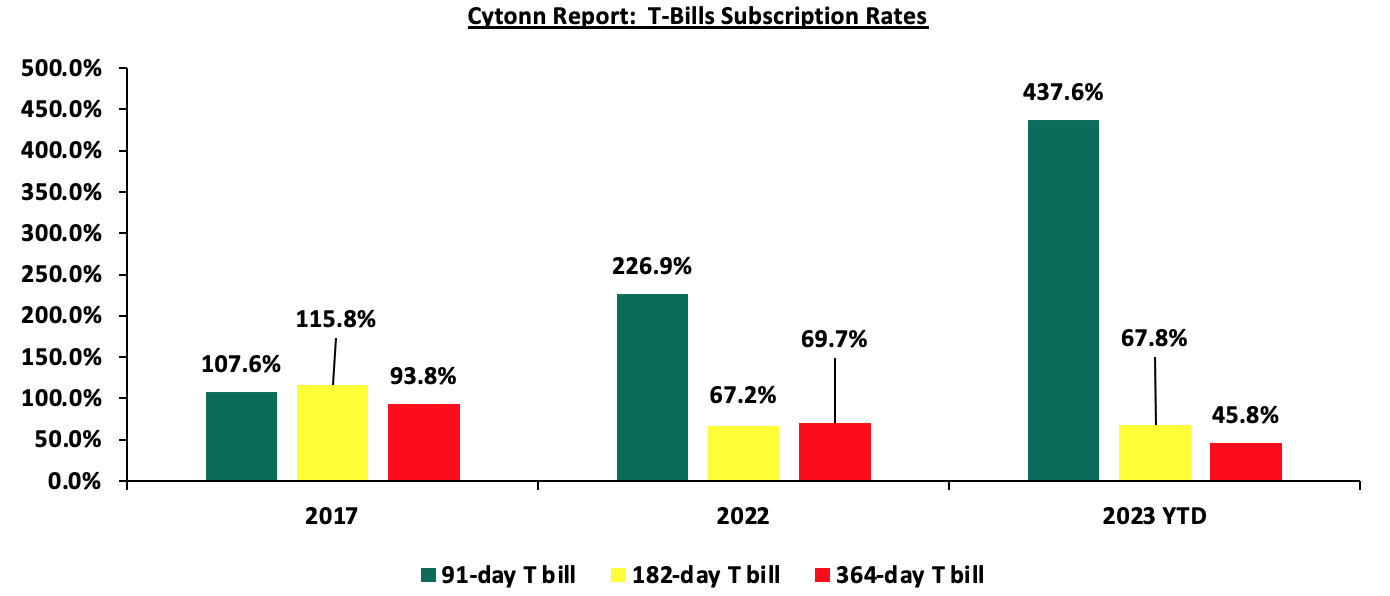
During the week, T-bills remained oversubscribed, albeit at a lower rate, with the overall subscription rate coming in at 108.9%, down from 131.7% recorded the previous week. Investor’s preference for the shorter 91-day paper persisted as they sought to avoid duration risk, with the paper receiving bids worth Kshs 15.7 bn against the offered Kshs 4.0 bn, translating to a subscription rate of 392.3%, down from 482.9% recorded the previous week. The subscription rate for the 364-day paper increased to 46.7% from 44.8% recorded the previous week, while that of the 182-day paper declined to 57.7% from 78.0% recorded the previous week. The yields on the government papers were on an upward trajectory, with the yields on the 364-day, 182-day and 91-day papers increasing by 6.3 bps, 1.2 bps and 3.3 bps to 10.4%, 9.9% and 9.4%, respectively. The Government accepted a total of Kshs 26.11 bn worth of bids out of the Kshs 26.13 bn worth of bids received, translating to an acceptance rate of 99.9%. The graph below shows the overall T- bills subscription rates from 2017, 2022 and 2023 Year to Date (YTD):
In the Primary Bond Market, the Central Bank of Kenya released the auction results for the recently re-opened bonds; FXD1/2020/005 and FXD1/2022/015 with effective tenors to maturity of 2.4 years and 14.3 years respectively. The bonds recorded an undersubscription of 83.3%, in line with our expectation, partly attributable to investors’ preference for the shorter dated papers as they sought to avoid duration risk. The government issued the bonds seeking to raise Kshs 50.0 bn for budgetary support, received bids worth Kshs 41.6 bn and accepted bids worth Kshs 31.5 bn, translating to a 75.7% acceptance rate. The weighted average yields for the bonds came in at 12.9% and 14.2% for FXD1/2020/005 and FXD1/2022/015, respectively, while the coupon rates came in at 11.7% and 13.9% for FXD1/2020/005 and FXD1/2022/015, respectively.
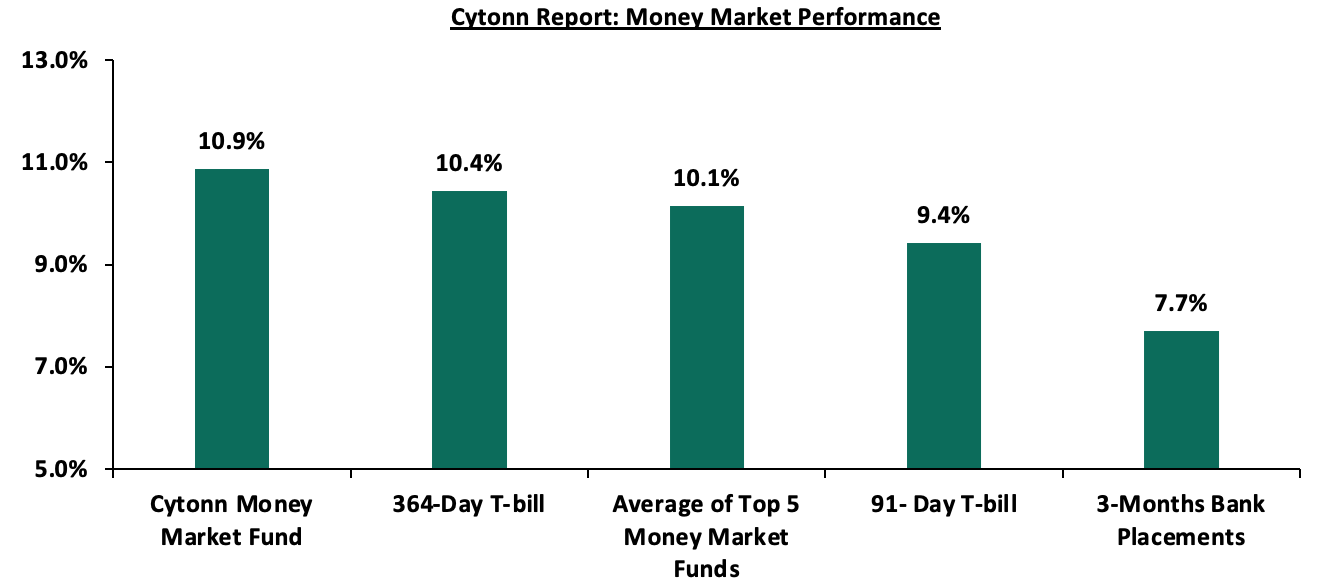
In the money markets, 3-month bank placements ended the week at 7.7% (based on what we have been offered by various banks), while the yield on the 364-day T-bill and 91-day T-bill increased by 6.3 bps and 3.3 bps to 10.4% and 9.4%, respectively. The average yield of the Top 5 Money Market Funds and Cytonn Money Market Fund remained relatively unchanged at 10.1% and 10.9%, respectively, as recorded the previous week.
The table below shows the Money Market Fund Yields for Kenyan Fund Managers as published on 13th January 2023:
|
Cytonn Report: Money Market Fund Yield for Fund Managers as published on 13th January 2023 |
||
|
Rank |
Fund Manager |
Effective Annual Rate |
|
1 |
Cytonn Money Market Fund (dial *809# or download Cytonn App) |
10.9% |
|
2 |
Kuza Money Market fund |
10.1% |
|
3 |
Apollo Money Market Fund |
10.0% |
|
4 |
Zimele Money Market Fund |
9.9% |
|
5 |
GenCap Hela Imara Money Market Fund |
9.9% |
|
6 |
NCBA Money Market Fund |
9.7% |
|
7 |
Nabo Africa Money Market Fund |
9.7% |
|
8 |
Sanlam Money Market Fund |
9.6% |
|
9 |
Madison Money Market Fund |
9.5% |
|
10 |
Dry Associates Money Market Fund |
9.5% |
|
11 |
Old Mutual Money Market Fund |
9.3% |
|
12 |
Co-op Money Market Fund |
9.2% |
|
13 |
CIC Money Market Fund |
9.2% |
|
14 |
British-American Money Market Fund |
9.0% |
|
15 |
AA Kenya Shillings Fund |
9.0% |
|
16 |
ICEA Lion Money Market Fund |
8.7% |
|
17 |
Orient Kasha Money Market Fund |
8.6% |
|
18 |
Absa Shilling Money Market Fund |
7.9% |
|
19 |
Equity Money Market Fund |
7.8% |
Source: Business Daily
Liquidity:
During the week, liquidity in the money markets eased, with the average interbank rate declining to 5.4% from 6.4% recorded the previous week, partly attributable to government payments that offset tax remittances. The average interbank volumes traded increased by 63.4% to Kshs 22.5 bn from Kshs 13.8 bn recorded the previous week.
Kenya Eurobonds:
During the week, the yields on Eurobonds were on a downward trajectory with the yield on the 10-year Eurobond issued in 2014 recording the largest decline having declined by 0.7% points to 12.1% from 12.8%, recorded the previous week. The table below shows the summary of the performance of the Kenyan Eurobonds as of 12th January 2023;
|
Cytonn Report: Kenya Eurobonds Performance |
||||||
|
|
2014 |
2018 |
2019 |
2021 |
||
|
Date |
10-year issue |
10-year issue |
30-year issue |
7-year issue |
12-year issue |
12-year issue |
|
Years to Maturity |
1.4 |
5.1 |
25.1 |
4.3 |
9.3 |
11.4 |
|
30-Dec-22 |
12.9% |
10.5% |
10.9% |
10.9% |
10.8% |
9.9% |
|
2-Jan-23 |
12.9% |
10.5% |
10.9% |
10.9% |
10.8% |
9.9% |
|
5-Jan-23 |
12.8% |
10.4% |
10.8% |
10.6% |
10.7% |
9.8% |
|
6-Jan-23 |
12.8% |
10.5% |
10.8% |
10.8% |
10.7% |
9.8% |
|
9-Jan-23 |
12.9% |
10.2% |
10.7% |
10.6% |
10.5% |
9.7% |
|
10-Jan-23 |
12.7% |
10.2% |
10.7% |
10.6% |
10.5% |
9.8% |
|
11-Jan-23 |
12.9% |
10.3% |
10.7% |
10.6% |
10.4% |
9.8% |
|
12-Jan-23 |
12.1% |
10.1% |
10.6% |
10.4% |
10.3% |
9.6% |
|
Weekly Change |
(0.7%) |
(0.3%) |
(0.2%) |
(0.2%) |
(0.4%) |
(0.2%) |
|
MTD Change |
(0.8%) |
(0.4%) |
(0.3%) |
(0.5%) |
(0.5%) |
(0.3%) |
|
YTD Change |
(0.8%) |
(0.4%) |
(0.3%) |
(0.5%) |
(0.5%) |
(0.3%) |
Source: Central Bank of Kenya (CBK)
Kenya Shilling:
During the week, the Kenyan shilling depreciated by 0.2% against the US dollar to close the week at Kshs 123.8, from Kshs 123.5 recorded the previous week, partly attributable to increased dollar demand from importers, especially oil and energy sectors against a slower supply of hard currency. On a year to date basis, the shilling has depreciated by 0.3% against the dollar, adding to the 9.0% depreciation recorded in 2022. We expect the shilling to remain under pressure in 2023 as a result of:
- High global crude oil prices on the back of persistent supply chain bottlenecks coupled with high demand,
- An ever-present current account deficit estimated at 5.5% of GDP in the 12 months to October 2022, same as what was recorded in a similar period in 2021,
- The need for Government debt servicing which continues to put pressure on forex reserves given that 69.3% of Kenya’s External debt was US Dollar denominated as of October 2022, and,
- A continued hike in the USA Fed interest rates in 2022 to a range of 4.25% - 4.50% in December 2022 has strengthened the dollar against other currencies by causing capital outflows from other global emerging markets.
The shilling is however expected to be supported by:
- Improved diaspora remittances standing at a cumulative USD 4.0 bn for the year 2022, representing an 8.3% y/y increase from a cumulative USD 3.7 bn recorded in 2021. Notably on a m/m basis, the remittance for the month of December 2022 increased by 3.4% to USD 0.4 bn, from USD 0.3 bn recorded in November 2022, and,
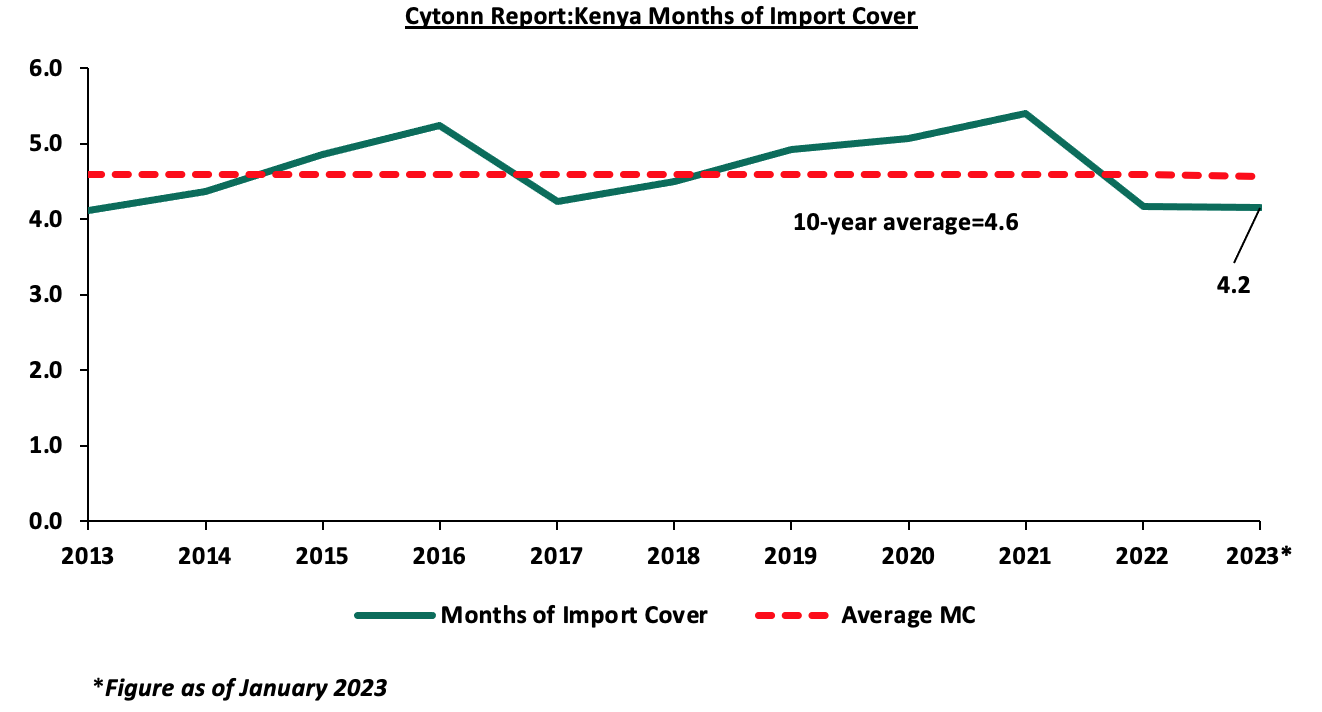
- Sufficient Forex reserves currently at USD 7.4 bn (equivalent to 4.2 months of import cover) as at 12th January 2023, which is above the statutory requirement of maintaining at least 4.0-months of import cover. The chart below summarizes the evolution of Kenya months of import cover over the last 10 years;
Weekly Highlight:
- Revenue and Net Exchequer for FY’2022/2023
The National Treasury gazetted the revenue and net expenditures for the first half of FY’2022/2023, ending 30th December 2022. Below is a summary of the performance:
|
Cytonn Report: FY'2022/2023 Budget Outturn - As at 31st December 2022 |
|||||
|
Amounts in Kshs billions unless stated otherwise |
|||||
|
Item |
12-months Original Estimates |
Actual Receipts/Release |
Percentage Achieved |
Prorated |
% achieved of prorated |
|
Opening Balance |
|
0.6 |
|
|
|
|
Tax Revenue |
2,071.9 |
952.6 |
46.0% |
1,036.0 |
92.0% |
|
Non-Tax Revenue |
69.7 |
34.7 |
49.8% |
34.8 |
99.5% |
|
Total Revenue |
2,141.6 |
987.9 |
46.1% |
1,070.8 |
92.3% |
|
External Loans & Grants |
349.3 |
177.9 |
50.9% |
174.7 |
101.8% |
|
Domestic Borrowings |
1,040.5 |
254.0 |
24.4% |
520.2 |
48.8% |
|
Other Domestic Financing |
13.2 |
15.3 |
115.8% |
6.6 |
231.7% |
|
Total Financing |
1,403.0 |
447.2 |
31.9% |
701.5 |
63.7% |
|
Recurrent Exchequer issues |
1,178.4 |
550.6 |
46.7% |
589.2 |
93.4% |
|
CFS Exchequer Issues |
1,571.8 |
555.8 |
35.4% |
785.9 |
70.7% |
|
Development Expenditure & Net Lending |
424.4 |
121.7 |
28.7% |
212.2 |
57.4% |
|
County Governments + Contingencies |
370.0 |
141.1 |
38.1% |
185.0 |
76.3% |
|
Total Expenditure |
3,544.6 |
1,369.2 |
38.6% |
1,772.3 |
77.3% |
|
Fiscal Deficit excluding Grants |
1,403.0 |
381.3 |
27.2% |
701.5 |
54.4% |
|
Total Borrowing |
1,389.8 |
431.8 |
31.1% |
694.9 |
62.1% |
All values in Kshs bn
The key take-outs from the release include;
- Total revenue collected as at the end of December 2022 amounted to Kshs 987.9 bn, equivalent to 46.1% of the original estimates of Kshs 2,141.6 bn for FY’2022/2023 and is 92.3% of the prorated estimates of Kshs 1,070.8 bn. The government has not been able to meet its prorated revenue targets six months into the FY’2022/2023 partly attributable to the tough macroeconomic environment evidenced by the deteriorated business environment with the Purchasing Managers Index (PMI) for the six months of the FY’2022/2023 averaging at 49.2. However, we note that the total revenue collected in the month of December achieved 92.3% of the prorated target, up from 88.5% recorded in the month of November with inflation slightly easing to 9.1% in December 2022, from 9.5% recorded in November 2022. Cumulatively, tax revenues amounted to Kshs 952.6 bn, equivalent to 46.0% of the original estimates of Kshs 2,071.9 bn and 92.0% of the prorated estimates of Kshs 1,036.0 bn. On a m/m basis, December tax revenues came in at Kshs 194.1 bn, 28.8% increase from Kshs 150.6 bn recorded in November 2022 and notably the highest monthly collection in H1’2023,
- Total financing amounted to Kshs 447.2 bn, equivalent to 31.9% of the original estimates of Kshs 1,403.0 bn and is equivalent to 63.7% of the prorated estimates of Kshs 701.5 bn. Additionally, domestic borrowing amounted to Kshs 254.0 bn, equivalent to 24.4% of the original estimates of Kshs 1,040.5 bn and is 48.8% of the prorated estimates of Kshs 520.2 bn,
- The total expenditure amounted to Kshs 1,369.2 bn, equivalent to 38.6% of the original estimates of Kshs 3,544.6 bn, and is 77.3% of the prorated target expenditure estimates of Kshs 1,772.3 bn. Additionally, the net disbursements to recurrent expenditures came in at Kshs 550.6 bn, equivalent to 46.7% of the original estimates of Kshs 1,178.4 bn and 93.4% of the prorated estimates of Kshs 589.2 bn,
- Consolidated Fund Services (CFS) Exchequer issues (refers to the Consolidated Fund established in the Kenya’s constitution into which development partners deposit funds before disbursing to the Exchequer accounts for projects such as servicing of public debt, payment of pensions and gratuities, salaries and allowances and subscription to International Organizations) came in at Kshs 555.8 bn, equivalent to 35.4% of the original estimates of Kshs 1,571.8 bn, and are 70.7% of the prorated amount of Kshs 785.9 bn. The cumulative public debt servicing cost amounted to Kshs 503.8 bn which is 36.2% of the original estimates of Kshs 1,393.1 bn, and is 72.3% of the prorated estimates of Kshs 696.6 bn. Notably, the Kshs 503.8 bn debt servicing cost is equivalent to 51.0% of the actual revenues collected as at the end of December 2022, further emphasizing on how much public debt weighs on the country’s expenditure. However, this is an improvement from the 57.0% recorded as at end of November 2022, indicating that the current administration’s efforts on fiscal consolidation are reducing debt-servicing costs, and,
- Total Borrowings as at the end of December 2022 amounted to Kshs 431.8 bn, equivalent to 31.1% of the original estimates of Kshs 1,389.8 bn for FY’2022/2023 and are 62.1% of the prorated estimates of Kshs 694.9 bn. The cumulative domestic borrowing target of Kshs 1,040.5 bn comprises of adjusted Net domestic borrowings of Kshs 579.1 bn and Internal Debt Redemptions (Roll-overs) of Kshs 461.4 bn.
The revenue performance for the six months of the FY’2022/2023 continues to reflect the economic uncertainties in the country emanating from the adverse macroeconomic conditions and slow down of economic growth. The performance of revenue collection in the coming months will depend on how soon Kenya Revenue Authority implements measures to scale up revenue collection, in line with the current administration’s target of Kshs 2.7 tn by June 2023, equivalent to an additional Kshs 500.0 bn tax revenue and a further target of Kshs 1.1 tn by June 2027. The increased tax target is aimed at Income Tax, Value-Added Tax (VAT) and Exercise Duty, and comes at a time when the business environment is still subdued. We expect the subdued economic performance to persist in the short term as consumers continue to cut back on spending, given the high global commodity prices coupled with the persistent supply bottlenecks, and this will negatively weigh down on revenue collection.
- Fuel Prices
During the week, the Energy and Petroleum Regulatory Authority (EPRA) released their monthly statement on the maximum retail fuel prices in Kenya effective 15th January 2023 to 14th February 2023. Notably, fuel prices remained unchanged for the second consecutive month at Kshs 177.3, Kshs 162.0 and Kshs 145.9 per litres of Super Petrol, Diesel and Kerosene, respectively. The performance was attributable to:
- The cross subsidization of the price of Diesel with that of Super Petrol and maintaining of Kshs 25.1 subsidy per litre of Kerosene under the Petroleum Development Levy, and,
- The decline in the average landed costs of Super Petrol, Diesel and Kerosene by 6.2%, 11.1% and 4.0% to USD 660.6 per cubic metre, USD 818.5 per cubic metre and USD 816.6 per cubic metre in December 2022, from USD 704.2 per cubic metre, USD 920.4 per cubic metre and USD 851.3 per cubic metre in November 2022, respectively.
The performance was despite:
- The 1.2% increase in the Free On Board (FOB) price in Murban crude oil to USD 93.5 per barrel in December 2022 from USD 92.5 per barrel recorded in November 2022, and,
- The continued depreciation of the Kenyan Shilling, having declined by 3.5% to Kshs 128.6 in December 2022 from 124.2 in November 2022.
Key to note, EPRA restored a Kshs 12.4 per litre margin to Oil Marketing Companies for Super Petrol while Diesel and Kerosene margins remained withheld. This is attributable to Super Petrol recording a Price Stabilization surplus of Kshs 11.5 per litre, while Diesel and Kerosene continue to record deficits, of Kshs 3.6 and 10.9 per litre, respectively.
Despite the decline in average landed costs of imported fuel, fuel prices remain relatively high in Kenya in comparison to global fuel prices that have been on a downward trajectory since June 2022, with the current prices closing at USD 80.7 per barrel as of 12th January 2023, a significant 31.4% decline from USD 117.7 per barrel recorded as at 1st June 2022. The high fuel prices in the country is majorly attributable to the partial removal of fuel subsidies under the Petroleum Development Levy program by the current administration in September 2022. We continue to maintain that the subsidy program is unsustainable since it is a burden to the country’s expenditure. As such, we expect the current administration to completely do away with the fuel subsidies and adjust the domestic fuel prices to ease the pressure on expenditure, and consequently reduce the need for excessive borrowing. Additionally, since fuel is a major contributor to Kenya’s inflation, we also expect the cost of living to remain high amidst subdued business environment exacerbated by decline in consumer spending.
Rates in the Fixed Income market have remained relatively stable due to the relatively ample liquidity in the money market. The government is 7.2% ahead of its prorated borrowing target of Kshs 313.2 bn having borrowed Kshs 335.9 bn of the Kshs 581.7 bn borrowing target for the FY’2022/2023. We expect sustained gradual economic recovery as evidenced by the revenue collections of Kshs 987.9 bn in the FY’2022/2023 as at the end of December, equivalent to a 46.1% of its target of Kshs 2.1 tn. Despite the performance, we believe that the projected budget deficit of 6.2% is relatively ambitious given the downside risks and deteriorating business environment occasioned by high inflationary pressures. We however expect the support from the IMF and World Bank to ease the need for elevated borrowing and thus help maintain a stable interest rate environment since the government is not desperate for cash. Owing to this, our view is that investors should be biased towards short-term fixed-income securities to reduce duration risk.
Market Performance:
During the week, the equities market was on a downward trajectory, with NASI, NSE 20, and NSE 25 declining by 2.8%, 0.6% and 1.2%, respectively, taking the YTD performance to losses of 3.2% and 0.7% for NASI and NSE 25, respectively and a gain of 1.2% for NSE 20. The equities market performance was mainly driven by losses recorded by large cap stocks such as Bamburi, Safaricom, NCBA Group and BAT of 7.6%, 6.4%, 2.4% and 2.2%, respectively. The losses were however mitigated by gains recorded by large cap banking stocks such as Standard Chartered Bank Kenya (SCBK), Equity Group and Diamond Trust Bank (DTB-K) of 3.3%, 2.2% and 1.9%, respectively.
During the week, equities turnover increased by 50.5% to USD 9.4 mn from USD 6.2 mn recorded the previous week, taking the YTD turnover to USD 15.6 mn. Additionally, foreign investors remained net sellers, with a net selling position of USD 1.2 mn, from a net selling position of USD 2.4 mn recorded the previous week, taking the YTD net selling position to USD 3.5 mn.
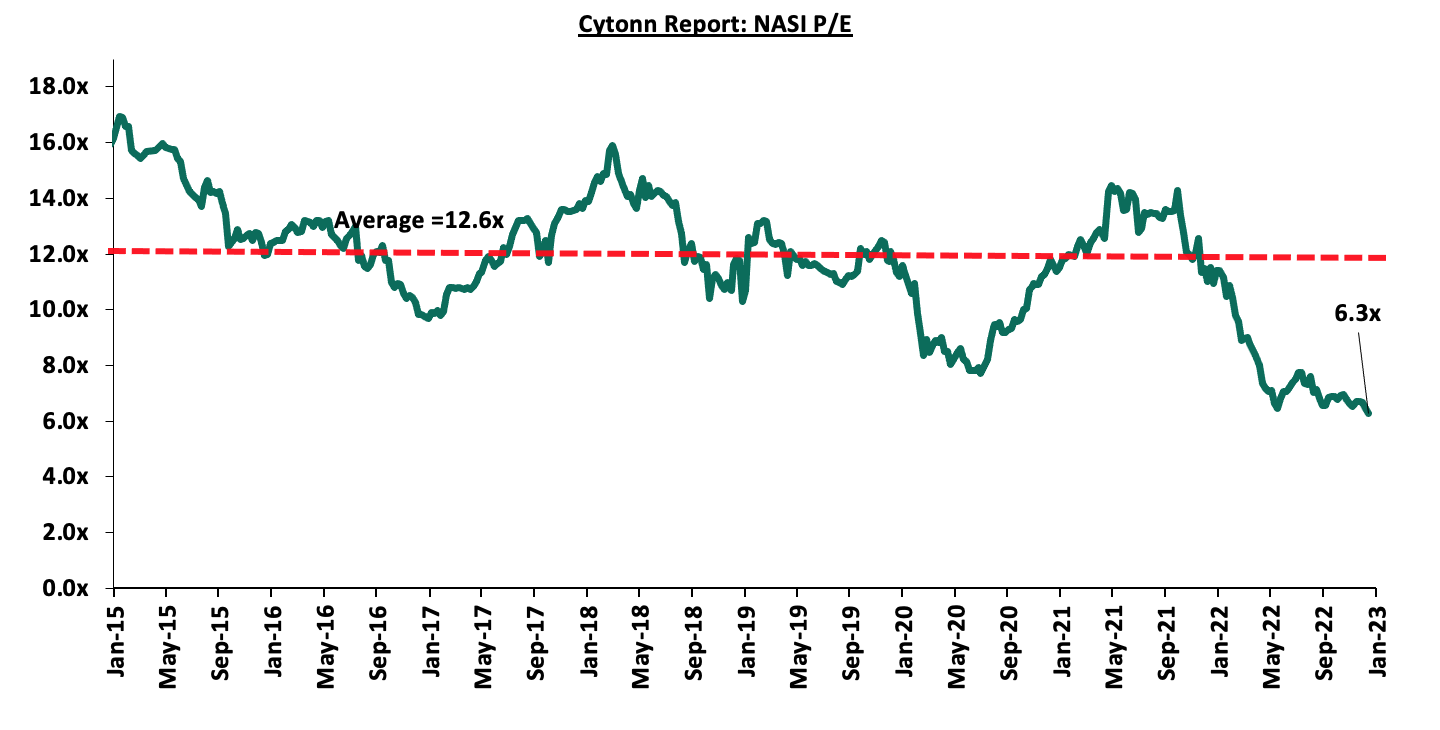
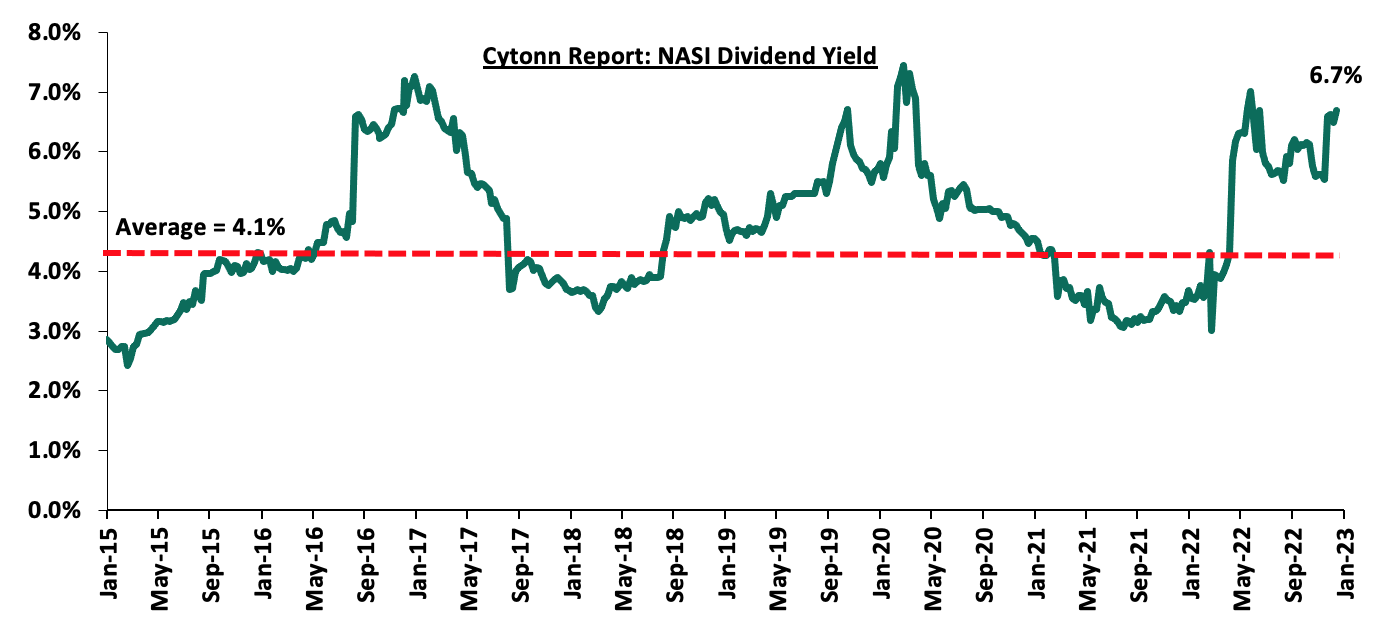
The market is currently trading at a price to earnings ratio (P/E) of 6.3x, 50.2% below the historical average of 12.6x, and a dividend yield of 6.7%, 2.6% points above the historical average of 4.1%. Key to note, NASI’s PEG ratio currently stands at 0.8x, an indication that the market is undervalued relative to its future growth. A PEG ratio greater than 1.0x indicates the market may be overvalued while a PEG ratio less than 1.0x indicates that the market is undervalued. The charts below indicate the historical P/E and dividend yields of the market;
Weekly Highlight:
Centum Investments Terminates Sale of its 83.4% stake in Sidian Bank to Access Bank PLC
During the week, Centum Investment Plc announced that it had terminated the Share Purchase Agreement (SPA) to sell its 83.4% stake in Sidian Bank Limited to Access Bank Plc. The initial agreement was announced in June 2022, subject to the approval from the Central Bank of Kenya (CBK) and the Communications Authority of Kenya (CAK), as highlighted in our Cytonn Weekly #23/2022. Centum Investments announced termination of the agreement as a result of the lapse of time arising from expiry of the Long Stop Date and the two parties could not agree to extend the duration, as well as the set conditions between the two parties having not been met.
Centum Investments further cited that the high inflationary pressures coupled with local currency depreciation witnessed for the last 2 years increased the country’s exchange and credit risks, making the deal economically unviable, since part of the Kshs 4.3 bn payment was to be done through a 2-year deferred consideration, in the Kenyan shilling. The two firms had agreed on the terms of the purchase agreement in early 2021, and would have seen Access Bank Plc. increase its access to Kenya’s banking market by increasing its number of branches to 71, from 28 that are owned by its subsidiary, Access Bank Kenya.
Due to the termination of the agreement, Centum Investments will continue to be the largest shareholder at Sidian Bank, controlling 83.4% stake directly and through its fully owned subsidiary Bakki Holdco Limited, after it bought additional 0.3 mn shares in July 2021 through a rights issue. The table below shows Sidian Bank’s largest shareholders as of 31st December 2021;
|
Cytonn Report: Sidian Bank’s Shareholders |
|||
|
No. |
Name of Shareholder |
No of Shares |
% shareholding |
|
1. |
Bakki Holdco Limited (Centum Investments) |
3,564,388 |
81.2% |
|
2. |
K-Rep Group Ltd |
501,430 |
11.4% |
|
3. |
Kwa Multi-Purpose Co-operative Ltd |
143,376 |
3.3% |
|
4. |
Centum Investment Company Plc. |
98,899 |
2.3% |
|
5. |
Others |
83,819 |
1.9% |
|
|
Total |
4,391,912 |
100.0% |
Source: Sidian Bank’s 2021 annual Report
The termination of the Share Purchase Agreement comes after Centum Investments’ announced in November 2022 an intention to carry out an on market share buyback, pending shareholders’ approval. The share buyback, will involve the purchase of a maximum of 66.5 mn shares at a maximum price of Kshs 9.0 per share, representing an 8.3% premium from the current share price of 8.3 as at 13th January 2023. Additionally, as covered in our Centum Investments Share Buyback Note, we expect the program to boost Centum investors’ liquidity, as well as supporting its share price. However, the termination of the sale agreement will undermine the firm’s regional expansion efforts since the proceeds from the transaction would enable Centum to continue investing across strategic sectors in Kenya and in the East African region. As such, we expect the investment firm to consider other avenues to sell off its stake at the Tier III local band, especially within the local market.
Below is a summary of the deals in the last 9 years that have either happened, been announced or expected to be concluded in the Kenyan Banking sector:
|
Acquirer |
Bank Acquired |
Book Value at Acquisition (Kshs bn) |
Transaction Stake |
Transaction Value (Kshs bn) |
P/Bv Multiple |
Date |
|
Equity Group |
Spire Bank |
Unknown |
Undisclosed |
Undisclosed |
N/A |
Sep-22* |
|
KCB Group PLC |
Trust Merchant Bank (TMB) |
12.4 |
85.0% |
15.7 |
1.5x |
August-22 |
|
Access Bank PLC (Nigeria)** |
Sidian Bank |
4.9 |
83.4% |
4.3 |
1.1x |
June-22* |
|
KCB Group |
Banque Populaire du Rwanda |
5.3 |
100.0% |
5.6 |
1.1x |
August-21 |
|
I&M Holdings PLC |
Orient Bank Limited Uganda |
3.3 |
90.0% |
3.6 |
1.1x |
April-21 |
|
KCB Group** |
ABC Tanzania |
Unknown |
100% |
0.8 |
0.4x |
Nov-20* |
|
Co-operative Bank |
Jamii Bora Bank |
3.4 |
90.0% |
1 |
0.3x |
Aug-20 |
|
Commercial International Bank |
Mayfair Bank Limited |
1.0 |
51.0% |
Undisclosed |
N/D |
May-20* |
|
Access Bank PLC (Nigeria) |
Transnational Bank PLC. |
1.9 |
100.0% |
1.4 |
0.7x |
Feb-20* |
|
Equity Group ** |
Banque Commerciale Du Congo |
8.9 |
66.5% |
10.3 |
1.2x |
Nov-19* |
|
KCB Group |
National Bank of Kenya |
7.0 |
100.0% |
6.6 |
0.9x |
Sep-19 |
|
CBA Group |
NIC Group |
33.5 |
53%:47% |
23.0 |
0.7x |
Sep-19 |
|
Oiko Credit |
Credit Bank |
3.0 |
22.8% |
1 |
1.5x |
Aug-19 |
|
CBA Group** |
Jamii Bora Bank |
3.4 |
100.0% |
1.4 |
0.4x |
Jan-19 |
|
AfricInvest Azure |
Prime Bank |
21.2 |
24.2% |
5.1 |
1.0x |
Jan-18 |
|
KCB Group |
Imperial Bank |
Unknown |
Undisclosed |
Undisclosed |
N/A |
Dec-18 |
|
SBM Bank Kenya |
Chase Bank Ltd |
Unknown |
75.0% |
Undisclosed |
N/A |
Aug-18 |
|
DTBK |
Habib Bank Kenya |
2.4 |
100.0% |
1.8 |
0.8x |
Mar-17 |
|
SBM Holdings |
Fidelity Commercial Bank |
1.8 |
100.0% |
2.8 |
1.6x |
Nov-16 |
|
M Bank |
Oriental Commercial Bank |
1.8 |
51.0% |
1.3 |
1.4x |
Jun-16 |
|
I&M Holdings |
Giro Commercial Bank |
3.0 |
100.0% |
5.0 |
1.7x |
Jun-16 |
|
Mwalimu SACCO |
Equatorial Commercial Bank |
1.2 |
75.0% |
2.6 |
2.3x |
Mar-15 |
|
Centum |
K-Rep Bank |
2.1 |
66.0% |
2.5 |
1.8x |
Jul-14 |
|
GT Bank |
Fina Bank Group |
3.9 |
70.0% |
8.6 |
3.2x |
Nov-13 |
|
Average |
74.5% |
1.3x |
||||
|
* Announcement Date ** Deals that were dropped |
||||||
Universe of coverage:
|
Company |
Price as at 06/01/2023 |
Price as at 13/01/2023 |
w/w change |
YTD Change |
Target Price* |
Dividend Yield |
Upside/ Downside** |
P/TBv Multiple |
Recommendation |
|
Jubilee Holdings |
200.0 |
195.0 |
(2.5%) |
(1.9%) |
305.9 |
0.5% |
57.4% |
0.4x |
Buy |
|
KCB Group*** |
39.2 |
38.7 |
(1.3%) |
0.9% |
52.5 |
7.8% |
43.4% |
0.6x |
Buy |
|
Kenya Reinsurance |
1.9 |
1.9 |
(1.6%) |
(0.5%) |
2.5 |
5.4% |
40.3% |
0.1x |
Buy |
|
ABSA Bank*** |
12.1 |
12.3 |
1.7% |
0.4% |
15.5 |
12.2% |
38.4% |
1.0x |
Buy |
|
Equity Group*** |
45.6 |
46.6 |
2.2% |
3.3% |
58.4 |
6.4% |
31.8% |
1.1x |
Buy |
|
Sanlam |
7.9 |
9.0 |
13.9% |
(5.6%) |
11.9 |
0.0% |
31.7% |
1.0x |
Buy |
|
I&M Group*** |
17.4 |
17.0 |
(2.3%) |
(0.3%) |
20.8 |
8.8% |
31.3% |
0.4x |
Buy |
|
Co-op Bank*** |
12.4 |
12.6 |
1.6% |
4.1% |
15.5 |
7.9% |
30.7% |
0.7x |
Buy |
|
Britam |
5.4 |
5.6 |
3.0% |
6.9% |
7.1 |
0.0% |
28.1% |
0.9x |
Buy |
|
NCBA*** |
39.7 |
38.7 |
(2.4%) |
(0.6%) |
43.4 |
11.0% |
23.1% |
0.9x |
Buy |
|
Liberty Holdings |
4.7 |
5.5 |
18.5% |
9.5% |
6.8 |
0.0% |
22.3% |
0.4x |
Buy |
|
CIC Group |
2.0 |
2.0 |
0.0% |
2.1% |
2.3 |
0.0% |
19.0% |
0.7x |
Accumulate |
|
Diamond Trust Bank*** |
52.0 |
53.0 |
1.9% |
6.3% |
57.1 |
5.7% |
13.5% |
0.2x |
Accumulate |
|
Stanbic Holdings |
102.3 |
108.8 |
6.4% |
6.6% |
112.0 |
8.3% |
11.3% |
1.0x |
Accumulate |
|
Standard Chartered*** |
150.5 |
155.5 |
3.3% |
7.2% |
166.3 |
3.9% |
10.8% |
1.1x |
Accumulate |
|
HF Group |
3.1 |
3.1 |
1.3% |
(0.3%) |
3.4 |
0.0% |
9.2% |
0.2x |
Hold |
|
*Target Price as per Cytonn Analyst estimates **Upside/ (Downside) is adjusted for Dividend Yield ***For Disclosure, these are stocks in which Cytonn and/or its affiliates are invested in |
|||||||||
We are “Neutral” on the Equities markets in the short term due to the current adverse operating environment and huge foreign investor outflows, and, “Bullish” in the long term due to current cheap valuations and expected global and local economic recovery.
With the market currently trading at a discount to its future growth (PEG Ratio at 0.8x), we believe that investors should reposition towards value stocks with strong earnings growth and that are trading at discounts to their intrinsic value. We expect the current high foreign investors sell-offs to continue weighing down the economic outlook in the short term.
- Residential Sector
- Mwalimu National Sacco and KMRC partner to offer low-cost mortgages
During the week, Mwalimu National Sacco, a teachers-owned Sacco signed a partnership deal with state-owned financier, Kenya Mortgage Refinancing Company (KMRC) to provide low-cost mortgages capped at an interest rate of 9.0%, 2.3% points lower than the market average of 11.3% in 2021. The 120,000 Sacco members will have access to a minimum mortgage of Kshs 0.5 mn and a maximum limit of Kshs 8.0 mn to finance construction of their houses. The loan facility will be repayable within 26 years, 14 years more than the average loan duration of 12 years in 2021. Additionally, Mwalimu Sacco launched an asset-financing loan facility alongside insurance premium-financing which will cater for insurance covers for its members, making the deal more lucrative to its members and attract more clients. The three deals interconnected will provide a one-stop solution where members will access affordable housing mortgages, buy personal assets, open up commercial businesses and be in capacity of protecting these assets from risks through premium insurance cover.
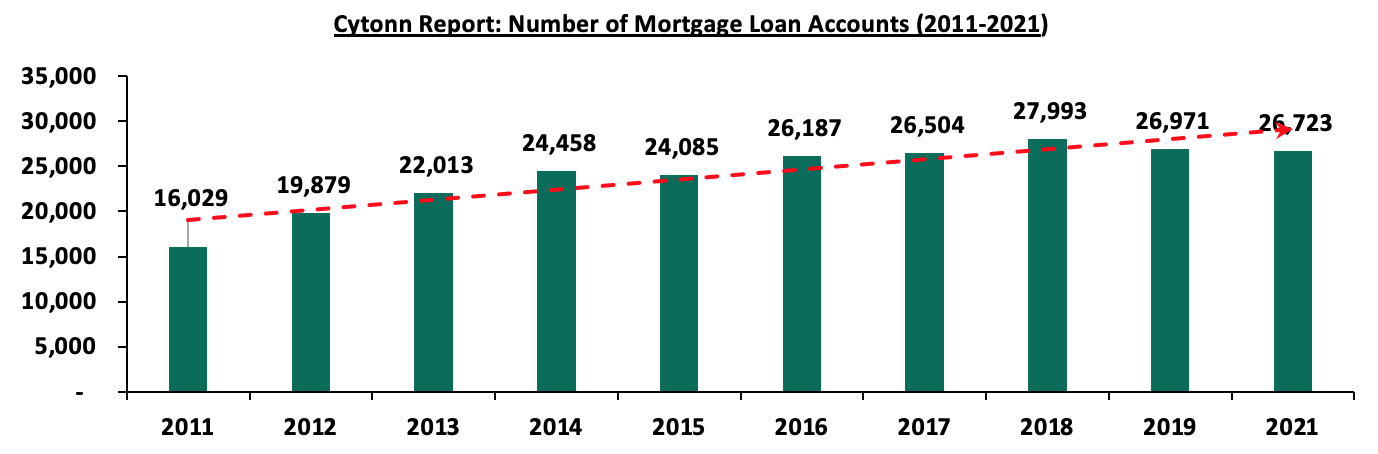
We expect the partnership to spark growth of mortgage uptake and boost homeownership for more Kenyans especially in urban centres. The interest rate of 9.0% is comparatively lower than the market average of 11.3% offered by other financial institutions coupled with a relatively higher loan maturity of 26 years hence providing an opportunity for more members to access mortgage products in the housing finance market. Further, we expect that this partnership will help overcome the challenges that have hindered mortgage uptake in the country such as; i) increasing property prices making it difficult for low-income buyers to access mortgages, ii) high interest rates and high deposit requirements, iii) low-income earning levels that cannot sustain servicing of loans, and, iv) lack of credit information for those in the informal sector hence facing exclusion from mortgage programs offered by financial institutions. In support of this, Central Bank of Kenya’s Bank Supervision Annual Report 2021 highlights that mortgage loans accounts recorded a 0.9% decline to 26,723 in 2021 from 26,971 recorded in 2020 with an adult population of more than 24.0 mn in Kenya, as shown below;
Source: Central Bank of Kenya
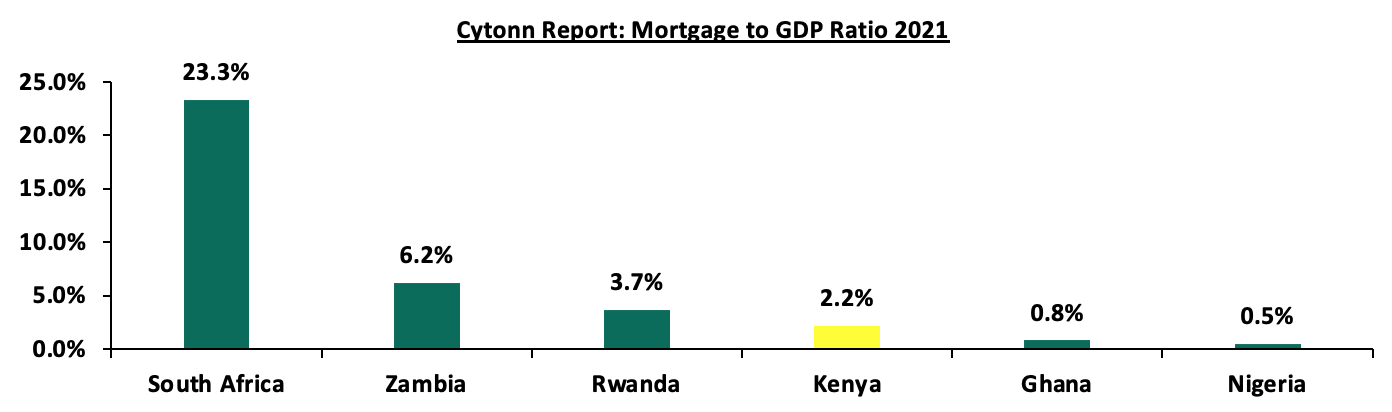
Consequently, Kenya’s mortgage to GDP continues to underperform at approximately 2.2% compared to countries such as South Africa, which is at approximately 23.3% as of 2021, as shown below;
Source: Centre for Affordable Housing Africa
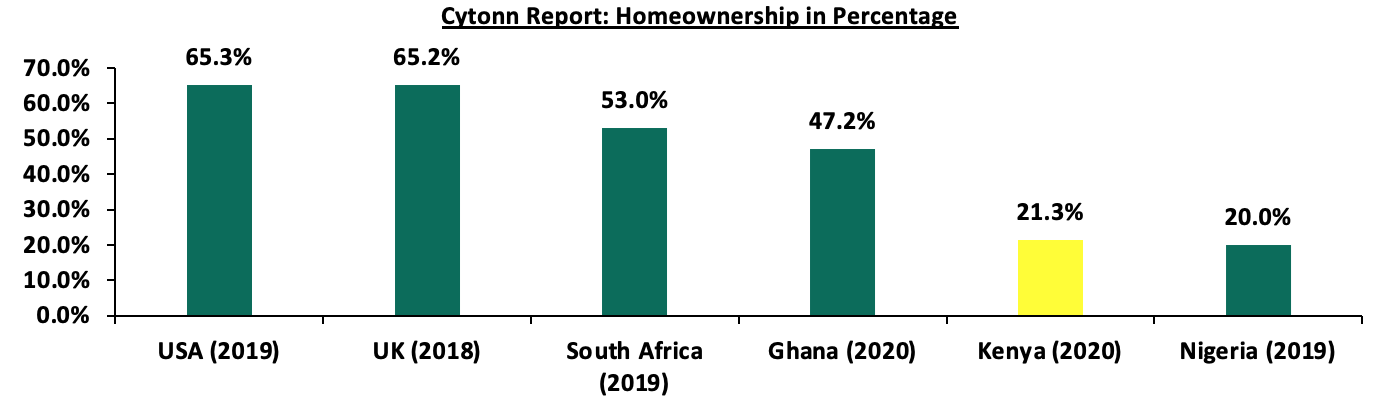
In addition, the percentage of Kenyan urban residents who own homes is relatively low at 21.3%, with the majority of the population, 78.7%, being property renters. This is in contrast to other countries such as South Africa and Ghana, where home-ownership rates are much higher at 53.0% and 47.2%, respectively. The low home ownership rate in Kenya is mainly due to the high cost of housing and a lack of accessible and affordable financing options for potential homeowners. The graph below shows homeownership percentages for different countries in comparison to Kenya;
Source: Cytonn Research
Notwithstanding the above, we have the following two concerns:
- it is not clear to the public how KMRC will sustain the lower borrowing rates once it exhausts the funding that was contributed by the original shareholders. A 20-year government bond currently costs about 14.0% whereas KMRC’s last corporate bond raised in the market cost 12.5% in 2022, hence deeming clarity on how KMRC can sustainably fund mortgages at 9.0% with its cost of capital at 12.5%.
- the low qualifying amounts of upto Kshs 8.0 mn are below the average mortgage size of Kshs 9.2 mn in 2021 offered by other financial institutions, which means that absorption rate for KMRC backed mortgages will continue to be low.
- Tatu City launches Kofinaf Tatu Residences development project
During the week, Tatu City, a mixed-use satellite city development, launched a luxurious lakeside-living project dubbed ‘Kofinaf Tatu Residences’, sitting on a 200-acre piece of land within Kofinaf Estate located in Tatu City, Kiambu County. The project will comprise of serviced plots starting from 1-acre and above, with a selling price of Ksh 135.0 mn per acre. Kofinaf Tatu Residences will provide an opportunity for investors to develop their own houses with three proposed architectural designs which include; i) Traditional Farmhouse design entailing simple and traditional materials with slate roofing thus depicting an agrarian lifestyle, ii) Country House design which will embody a modern outlook with farmhouse aesthetics, and, iii) Contemporary House design which will appreciate the modern lifestyle with regards to its expansive windows facilitating seamless indoor and outdoor engagement, and incorporate smart housing technology. These designs will ensure adherence to sustainability and conservation of the green spaces allocated in the city. Owners of the residences will also have exclusive access to an ever-present water reservoir dubbed, ‘Comte de Beaumont Dam,’ nourished by Mukuyu and Gaia Rivers. The shores of the 32-acre lake will provide private nature reserve with diverse flora and fauna.
Tatu City has previously incorporated residential developments such as Kijani Ridge and projects done by other property developers which include; i) Silver Hill, Unity One, Unity East and Unity West by Unity Homes Developers and, ii) Lifestyle Heights Apartments by Homebridge Developers Limited. Residents in Kofinaf Tatu Residences will enjoy a wide range of amenities offered by Tatu City such as Grade A offices, shopping complexes, Kenyan and international schools, and commercial centres.
With the completion of Kofinaf Tatu Residences in Tatu City in Kiambu County and the increasing presence of other luxurious master-planned projects such as Lukenya Conservancy Living in Machakos County by Superior Homes Developers, the Kenyan Real Estate is expected to be more vibrant and attractive not only locally but to also international markets. Investors and buyers will benefit from the increased diversification in the sector thus discerning appetite for luxurious amenities and conservation-minded and eco-friendly developments cropping up in satellite towns. The availability of affordable development land in these areas, coupled by limited supply within Nairobi City and in other major urban centres countrywide, will draw more high-end buyers and investors in the regions and promote further development. In addition, conservation of natural environment and encouraging of the community-based conservancies will not only draw more people to invest in the areas, but also make these places even more attractive. Such developments are set to raise standards and encourage high-end lifestyle developers and conservationists to work together. As a result of the projects, developers will be expected to be more mindful of the environment when seeking to develop the residential and commercial Real Estate projects and increase environmental sustainability. On the other hand, conservationists will be expected to be more involved in development projects to promote a healthier natural environment surrounding and within these developments. Furthermore, improved infrastructure that is set to be rolled out in the coming years will make these areas more accessible and desirable, thereby increasing the appeal of Real Estate investments in the satellite towns and opening up more opportunities in other regions that were traditionally regarded inhabitable.
- Industrial Sector
During the week, logistics firm Mitchell Cotts Freights Kenya Limited, in partnership with two other logistics firms; Perishable Movements Kenya Limited and Fresh Handing Kenya Limited, unveiled a dry cargo and cold storage facilities worth Kshs 30.0 mn, within Jomo Kenyatta International Airport (JKIA). The cold storage occupies 1,943 SQM whereas the dry cargo storage will take up 4,174 SQM summing up to 7,609 SQM of total space occupied by the facilities in JKIA at the landslide of the air-cargo terminal. Both facilities are designed to provide more space for preservation of horticultural products as a mitigation measure on losses incurred by exporters. The cold storage facility will make use of vacuum cooling technology to extend the shelf-life of export products, while reducing the amount of waste generated by air cargo storage operations. Consequently, the exporters will enjoy lower costs associated with cooling cargo as the technology is cheaper compared to other cooling methods and agents such as dry ice, while keeping in terms with the stringent quality requirements of international markets.
We expect the new facility to boost activities in the industrial Real Estate sector coupled with the government's accelerated focus on exporting agricultural and horticultural products to the international market, with aim to improve the quantity, quality, efficiency, and reliability of Kenya-farmed produce thereby increasing the country’s competitiveness. Other factors that will improve the industrial Real Estate sector in Kenya include;
- Increased demand for data centres by both the government and private-sector firms. This is driven by continued increase in demand for data protection services with the Data Protection Act 2019 requiring personal data to be stored in a server or data centre located within Kenya’s borders,
- Increased demand for cold storage facilities. The Universal Health Coverage program by the government and the drive to provide better health services, drugs and vaccines will continue to increase demand for dedicated-cooling go-downs in the industrial sector, and,
- Increased demand for e-commerce warehouses in the retail sector. This is driven by rising demand for space to store goods meant for delivery to clients across the country, as more people shift towards home delivery as a convenient and efficient way to purchase goods.
- Real Estate Investment Trusts (REITs)
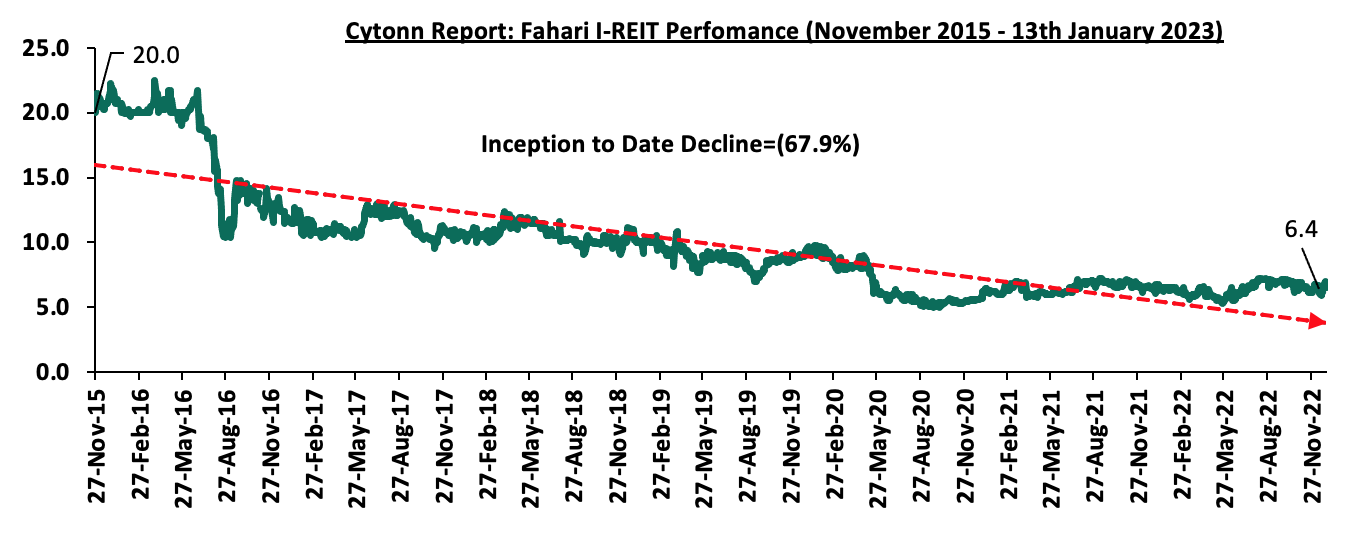
In the Nairobi Securities Exchange, ILAM Fahari I-REIT closed the week trading at an average price of Kshs 6.4 per share. The performance represented a 4.5% decline from Kshs 6.7 per share recorded the previous week, taking it to a 5.3% Year-to-Date (YTD) decline from Kshs 6.8 per share recorded at the beginning of the year. In addition, the performance represented a 67.9% Inception-to-Date (ITD) loss from the Kshs 20.0 price. The dividend yield currently stands at 7.8%. The graph below shows Fahari I-REIT’s performance from November 2015 to 13th January 2023;
In the Unquoted Securities Platform, Acorn D-REIT and I-REIT traded at Kshs 23.9 and Kshs 20.9 per unit, respectively, as at 13th January 2023. The performance represented a 19.4% and 4.4% gain for the D-REIT and I-REIT, respectively, from the Kshs 20.0 inception price. The volumes traded for the D-REIT and I-REIT came in at 12.3 mn and 28.7 mn shares, respectively, with a turnover of Kshs 257.5 mn and Kshs 591.8 mn, respectively, since inception in February 2021.
We expect the performance of Kenya’s Real Estate sector to experienced improved activities in 2023 spearheaded by factors such as; i) increased diversification of investment in residential sector, ii) anticipated growth in industrial sector through increased demand for data centres, warehouses and go-downs, iii) increased construction activities driven by accelerated efforts by the government to complete the stalled Affordable Housing Programs and new projects across the country, iv) continuous recovery of hospitality sector to pre-COVID-19 levels, v) increased occupancy rates in existing supply of commercial office spaces, and, v) aggressive expansion campaign by both local and international retailers. However, the reduced appetite for REITs is anticipated to continue constraining the optimum performance of the sector.
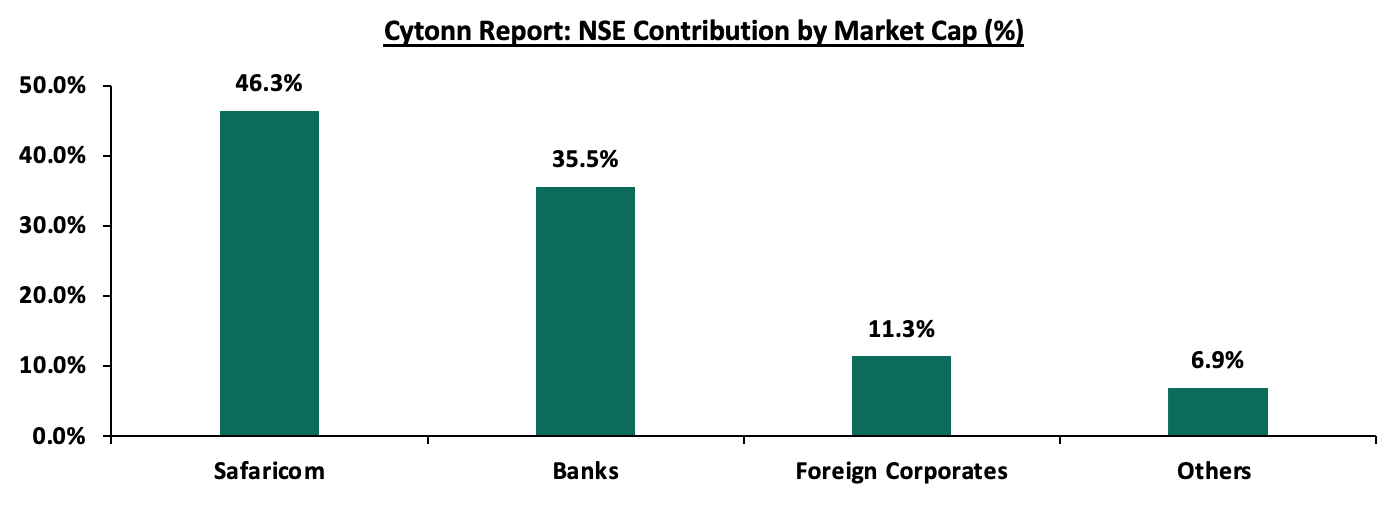
The Nairobi Securities Exchange (NSE) last recorded an Initial Public Offers (IPOs) in 2015, when Stanlib Investments issued an IPO of the first Real Estate Investment Trust (Fahari-Ireit) at the bourse, managing to raise Kshs 3.6 bn against the target of Kshs 12.5 bn, 28.8% success rate. This translates to an eight year IPO drought, with the most recent activity at the bourse being the listing by introduction (meaning no money was raise) of the Local Authority Pension Trust (LAPTRUST) Imara Income Real Estate Investment Trust (I-REIT)) under the Restricted Sub-Segment in 2022. LAPTRUST will hold 100.0% of the Imara I-REIT shares with no initial offer to the public. Currently the bourse has 66 listed securities with a total market capitalization of Kshs 1.9 tn as at 13th January 2023. The bourse continues to be Safaricom dominated, with Safaricom’s market capitalization of Kshs 881.4 bn equivalent to 46.3% of the entire market capitalization. Additionally, between Safaricom (46.3%), Banks (35.5%) and Foreign Corporates (11.3%) make up a total 93.1% of the bourse, leaving all other local sectors to share 6.9% of the bourse. The President in September 2022 also set a target of 10 listings in one year. The Capital Markets Authority (CMA) has also raised concerns that Kenya has been unable to achieve its projected listings targets as articulated in its Capital Markets Master Plan released in 30th April, 2016 which envisions at least four listings on the NSE every year; by its own masterplan CMA is now behind by 28 listings. The chart below highlights the composition of stocks at the Nairobi Securities Exchange;
Given that a few large cap stocks, namely Safaricom PLC, Equity Group Holdings, KCB Group Ltd and East African Breweries Ltd hold almost 75.0% of the total market capitalization, the market remains volatile, which presents a risk of a market collapse due to concentration risk. To remedy the listing drought, the regulator has been on a journey of reviewing a number of regulatory provisions to align them to current and the ever-evolving capital raising and listing realm. In this week’s focus, we take a view on the reasons behind the low number of new listings, as well as recommendations on what should be done in order to attract IPO’s. To cover this topic, we shall address the following;
- The structure of the Nairobi Securities Exchange,
- Types of Listings,
- Requirements for listing,
- Reasons for the low number of new listings in the Nairobi Securities Exchange,
- Case study of the Johannesburg Securities Exchange,
- Recommendation and Conclusion.
- The structure of the Nairobi Securities Exchange (NSE)
The Nairobi Securities Exchange is one of the leading securities exchange in Africa, based in Kenya. It was founded in 1954 in order to facilitate the trading of financial product through provision of trading platform for listed securities. NSE was demutualized and listed in 2014 and it operates under the jurisdiction of the Capital Markets Authority of Kenya and charged with the responsibility of developing the securities market and regulating trading activities, with the most recent key developments being:
- In July 2019, NSE launched NEXT derivatives markets, which made it the second African exchange to launch a derivative market after Johannesburg Stock Exchange. The derivative market was to enhance investors’ portfolio performance through availing risk management tools,
- In May 2021, NSE officially launched its Unquoted Securities Platform (USP) which facilitated the trading, clearing and settlement of securities of unquoted companies in Kenya. The platform provided access to capital and introduced capital market transactions easing the possible transition of the issuers into the primary quoted market. The USP also helped to reduce settlement delays as well as allowing surveillance by the bourse and the regulator, thereby protecting investors in the market. Acorn Holdings Limited became the first company to tap into the market infrastructure to trade shares by quoting its Income and Development Real Estate Investments Trusts on the USP,
- In June 2021, the NSE launched the mini NSE 25 share index futures contracts which was meant to appeal to retail investors due to its low initial margin cost. The segment was to help increase liquidity as well as promote exposure of the Kenya equities market through the equity index future contracts,
- Launch of Environmental, Social and Governance (ESG) disclosure governance manual. In November 2021, the NSE published ESG manual for Kenya listed companies meant to provide detailed guidelines on implementation of ESG metrics in organizational strategy, as well as collection, analysis and reporting of ESG performance. The move was to raise standards on ESG practices by companies thereby enhancing competiveness of Kenya capital markets in the global market space,
- The launch of day trading. The NSE launched day trading in December 2021 as part of its strategy to enhance market liquidity following the approval by the Capital Markets Authority (CMA) of Kenya. The move made Kenya the first frontier market to implement day trading. Day trading which refers to the practice of purchasing or selling a security within a single day or trading session or multiple times over the course of the day. To complement the initiative, NSE approved an incentive structure whereby investors who participates in day trading received a 5.0% discount on subsequent trades,
- NSE announced in 2022, the introduction of fractional investing which allowed investors to purchase less than a whole share of a security. The move was to help to increase market activity by opening up access to stocks that would be out of reach due to high price,
The NSE equities market segment is the premium listing location for companies seeking to raise equity capital to support their growth needs by offering issuers a deep and liquid market that enables them to access a wide range of domestic and international retail and institutional investors. The NSE equities market is comprised of four listing segments, each specifically designed to meet capital, liquidity as well as regulatory requirements for issuers of all sizes. Namely; Main Investment Segment, Alternative Investment segment, Growth Enterprise Segment and Fixed Income Securities Segment. Below is a list of market segments and the requirements to list on each of the segments.
- Main Investment Market Segment: This is the premium platform for large and well established companies in Kenya and the region. The segment currently has 50 listed stocks with a total market capitalization of Kshs 1.9 tn, as at 13th January 2023, equivalent to 99.6% of the total NSE market capitalization. It is suitable for bigger companies that have been around for a longer period of time. For a company to be listed in this segment, it must submit at least 5-years of audited financials, 3 of which should be profitable years, and must have at least Kshs 50.0 mn worth of fully paid ordinary share capital and at least, at least Kshs 100.0 mn in assets. At least 25.0% of share to be held by not less than 1000 shareholders excluding employees of the issuer,
- Alternative Investment Market Segment: This market segment is better suited for medium-sized companies that have at least Kshs 20.0 mn in assets and Kshs 20.0 mn of fully paid up share capital at the time of listing. The company must also have been in existence in the same line of business for a minimum of two-years and demonstrate good growth potential. This segment currently has 9 listed companies with a market cap of Kshs 6.6 bn as at 13th January 2023, equivalent to 0.4% of the total NSE market cap. Listing fees for this segment are 0.06% of securities value to be listed, subject to a minimum of Kshs 100,000 and a maximum of Kshs 1.0 mn,
- Growth Enterprise Market Segments: It is a market segment introduced to facilitate trading of securities of start-ups, small and medium sized companies. The requirements of listing in this segment are designed to be less stringent in order to enable firms in their growth phase to raise substantial capital and accelerate their growth within a regulatory environment. In this segment there is no minimum firm asset value and profitability record requirement, a minimum of Kshs 10.0 mn in paid up share capital. This segment currently has 5 listed stocks, with a total market capitalization of Kshs 0.9 bn as at 13th January 2023 equivalent to 0.05% of the total NSE market capitalization, and,
- Fixed Income Securities Market Segment: This segment was designed to incorporate listing and secondary market trading of fixed income securities, mainly corporate and government bonds.
Other companies listed in the bourse are under the Exchange Traded Funds and the Unquoted Securities Platform namely; the New Gold Kenya ETF and the Acorn Holdings LTD respectively.
- Types of Listings
Securities may be admitted to listing at the exchange through the following methods;
- Initial Public Offer (IPO): This is the most common type of listing. It involves a company issuing new shares while listing on the selected stock exchange that will result in a new set of shareholders from the public buying the shares at a specified share price, and hence the company raising capital from the exercise,
- Listing by Introduction: This type of listing occurs when a company takes its existing shares and lists them on an exchange. Since only existing shares are listed by introduction, it follows that no new shares will be issued and no additional funds will be raised. This type of listing only provides the company with a regulated environment within which to operate and a platform to trade shares with the public investors in the capital markets. The recent listing by introductions at the bourse, was the listing of the Local Authority Pension Trust (LAPTRUST) Imara Income Real Estate Investment Trust (I-REIT)) under the Restricted Sub-Segment in 2022. LAPTRUST held 100.0% of the Imara I-REIT shares with no initial offer to the public,
- Cross Listing: This occurs when a company that is already listed on one stock exchange decides to list on another stock exchange other than its primary or original exchange. Cross listing is advantageous in that it gives the listed company a larger scope of access to capital from different jurisdictions and different investors. No new shares are issued. Atlas managed the first cross listing between the London Stock Exchange and the NSE raising Kshs 450.0 mn, by offering 10% of its 393.9 mn total issued shares for cross-listing on the NSE with price per share set at Kshs 11.5 with a minimum subscription of Kshs 1.0 mn per investor, and,
- Reverse Listing: This is a rare kind of listing strategy also referred to as back door listing where a company that is not listed on any exchange purchases a listed company and becomes automatically listed by virtue of this transaction. It is common when a company that wants to have access to the capital markets also wants to avoid the time and cost spent in a regular listing. The listing of I&M bank for instance, was through reverse acquisition of City Trust Limited (CTL) in 2013.
- Requirements for Listings
As previously mentioned, the NSE is categorized into different market segments approved by CMA. The segments as stipulated have different eligibility, trading restrictions and disclosure requirements, prescribed by CMA that companies planning to publicly offer shares through listing have to abide to. Below is a summary of those requirements:
|
Cytonn Report: Requirements for Public offering of shares and listing |
|||
|
Requirement |
Criteria for the Main Investment Market Segment(MIMS) |
Criteria for The Alternative Investment Market Segment (AIMS) |
Criteria for the Growth Enterprise Market Segment(GEMS) |
|
Incorporation status |
It should be a public company limited by shares and registered under the Companies Act |
||
|
Share Capital |
he issuer should have a minimum of Kshs 50.0 mn of authorized issued and fully paid up ordinary share capital |
The issuer should have a minimum of Kshs 20.0 mn of authorized issued and fully paid up ordinary share capital |
The issuer should have a minimum authorized and fully paid up ordinary share capital of Kshs 10.0 mn and must have not less than 100,000 shares in issue |
|
Net Assets |
Net assets immediately before the public offering or listing of shares should not be less than Kshs 100.0 mn. |
Net assets immediately before the public offering or listing of shares should not be less than Kshs 20.0 mn |
N/A |
|
Free Transferability of Shares |
Shares to be listed should be freely transferable and not subject to any restrictions on marketability or any pre-emptive rights |
||
|
Availability and Reliability of Financial records |
The issuer should have audited financial statements complying with IFRS for an accounting period ending on a date not more than 4-months prior to the proposed date of the offer or listing for issuers whose securities are not listed at the securities exchange, and 6-months for issuers whose securities are listed at the securities exchange. The Issuer must have prepared financial statements for the latest accounting period on a going concern basis and the audit report must not contain any emphasis of matter or qualification in this regard |
N/A |
|
|
Solvency and adequacy of working capital |
The issuer should not be insolvent and should have adequate working capital |
The issuer should not be insolvent and should have adequate Working capital. The Directors of the Issuer shall also give an opinion on the adequacy of working capital for at least 12 months immediately following the share offering, and the auditors of the issuer shall confirm in writing the adequacy of that capital. |
|
|
Share Ownership Structure |
Following the public share offering or immediately prior to listing in the case of an introduction at least 25.0% of the shares must be held by not less than 1,000 shareholders excluding employees of the issuer. In the case of a listing by introduction, the issuer shall ensure that the existing shareholders, associated persons or such other group of controlling shareholders who have influence over management shall give an undertaking not to sell their shareholding before the expiry of a period of 24 months following listing and such undertaking shall be disclosed in the Information Memorandum |
Following the public share offering or immediately prior to listing in the case of an introduction, at least 20.0% of the shares must be held by not less than 100 shareholders excluding employees of the issuer or family members of the controlling shareholders. No investor shall also hold more than 3.0% of the 20.0% shareholding. The issuer must ensure that the existing shareholders, associated persons or such other group of controlling shareholders who have influence over management shall give an undertaking to the Authority not to sell their shareholding before the expiry of a period of 24 months following listing and such undertaking shall be disclosed in the Information Memorandum. |
The Issuer must ensure at least 15.0% of the issued shares, (excluding those held by a controlling shareholder or people associated or acting in concert with him; or the Company's Senior Managers) are available for trade by the public. An issuer shall cease to be eligible for listing upon the expiry of 3 months of the listing date, if the securities available for trade by the public are held by less than 25 shareholders (excluding those held by a controlling shareholder or people associated or acting in concert with him, or the Company's Senior Managers) The issuer must ensure that the existing shareholders, associated persons or such other group of controlling shareholders, who have influence over management, shall give an undertaking in terms agreeable to the Authority, and the Securities Exchange restricting the sale of part or the whole of their shareholding before the expiry of a period of twenty-four months following listing. |
|
Track record, profitability and future prospects |
The issuer must have declared profits after tax attributable to shareholders in at least three of the last five completed accounting periods to the date of the offer |
The issuer must have been in existence in the same line of business for a minimum of two years one of which should reflect a profit with good growth Potential. |
N/A |
|
Dividend policy |
The issuer must have a clear future dividend policy. |
N/A |
|
Source: NSE
- Reasons for the low number of new listings at the Nairobi Securities Exchange
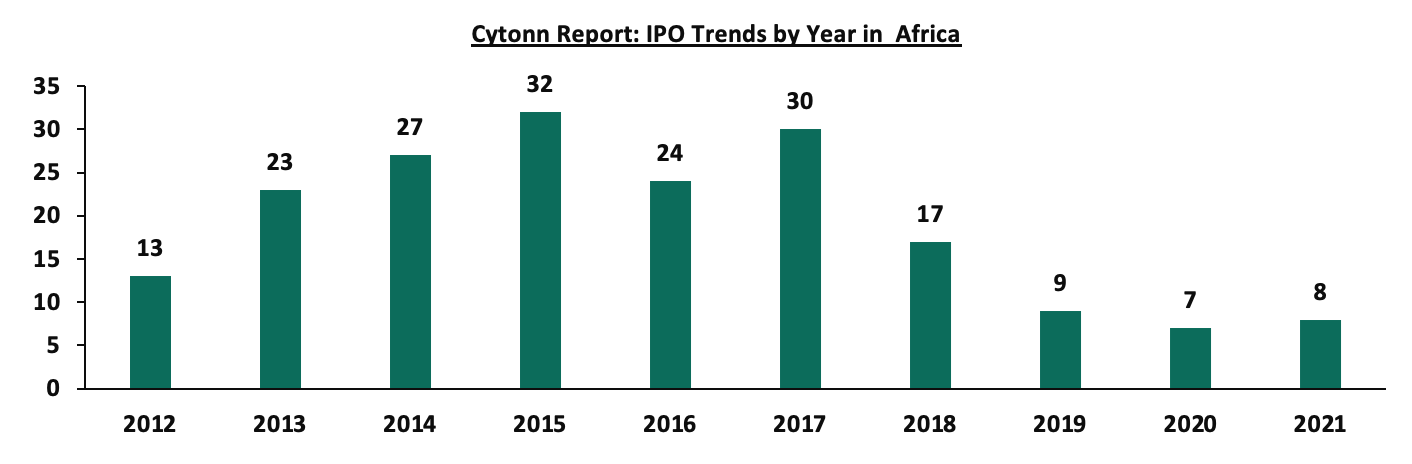
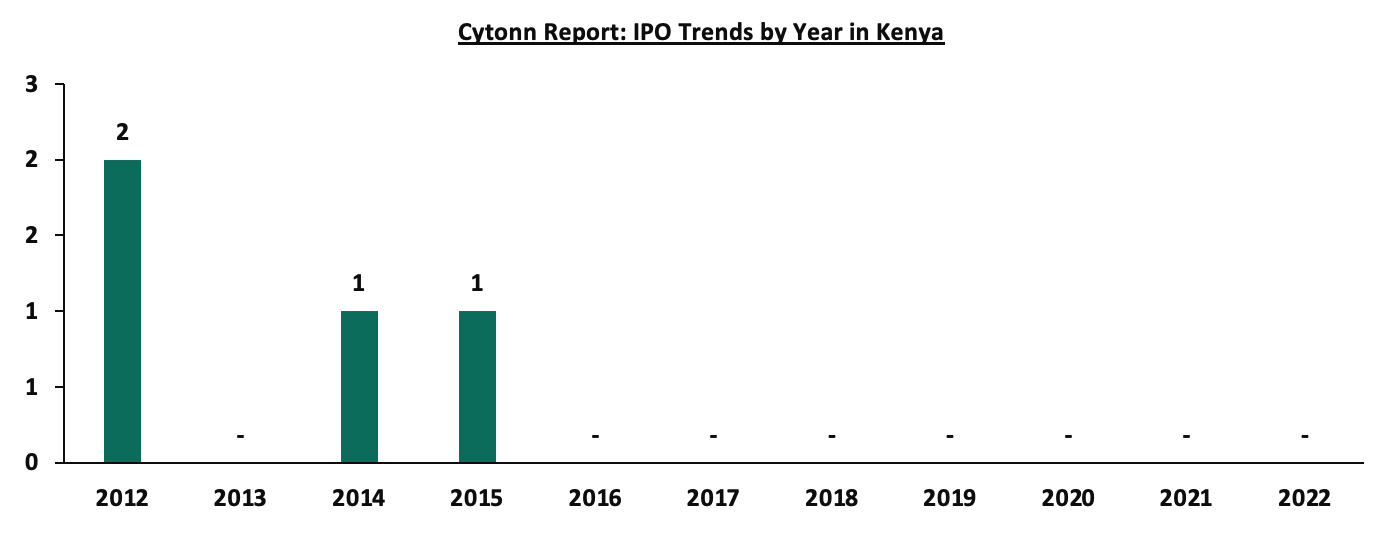
According to PwC’s, 2021 Africa Capital Markets watch, Africa recorded 67 Initial Public Offerings (IPOs) between 2017 and 2021. The continent recorded the highest number of IPOs in 2017, a total of 30 IPOs with value worth USD 3.1 bn. The number of IPO’s has been on a downward trend since 2017 with 2020 recording the lowest number at 7 IPOs, however, 2021 saw a slight increase in value and volume to 8 IPOs with value worth USD 0.9 bn. The charts below highlights IPOs trend in Africa and Kenya respectively, from 2012;
Source: PWC African Capital Watch 2021
Source: PWC African Capital Watch 2021
IPO’s activity in the African region has mainly been dominated by the South African Capital Market, having raised USD 4.1 bn through 16 IPO’s from 2017 to 2021, representing 52.7% of the total capital raised through IPO’s in the region. The Egypt and Tunisia bourses have also been performing well having had 14 and 5 IPOs respectively, raising USD 1.2 bn and USD 67.0 mn USD, respectively. The table below outline the number of IPOs by African exchanges from 2017-2021;
|
Cytonn Report: IPOs by African Exchanges (2017-2021) |
||
|
Country |
Number of IPOs |
Capital raised (USD mn) |
|
South Africa |
16 |
4,139.0 |
|
Egypt |
14 |
1,220.0 |
|
Tunisia |
5 |
67.0 |
|
Namibia |
4 |
232.0 |
|
Morocco |
4 |
216.0 |
|
Botswana |
3 |
72.0 |
|
Mauritius |
3 |
167.0 |
|
BRVM* |
3 |
242.0 |
|
Malawi |
3 |
67.0 |
|
Nigeria |
2 |
690.0 |
|
Ghana |
2 |
240.0 |
|
Uganda |
2 |
195.0 |
|
Tanzania |
1 |
212.0 |
|
Rwanda |
1 |
11.0 |
|
Mozambique |
1 |
53.0 |
|
Zambia |
1 |
23.0 |
|
Egypt-NILEX |
1 |
4.0 |
|
Algeria |
1 |
1.0 |
|
BVMAC |
- |
- |
|
Kenya |
- |
- |
|
Zimbabwe |
- |
- |
|
Total |
67 |
7,851.0 |
BRVM* - regional stock exchange serving the following West African countries: Benin, Burkina Faso, Guinea Bissau, Côte d'Ivoire, Mali, Niger, Senegal and Togo
Source: PwC 2021 Africa Capital Markets Watch
Since 2017, Kenya has failed to attract any IPO’s and the last time it recorded an IPO was in 2015 when Stanlib investments issued an IPO of the first Real Estate Investment Trust (Fahari-Ireit) at the bourse, which raised Kshs 3.6 bn against the target of Kshs 12.5 bn. The most recent activity at the bourse was the listing by introduction, where no money is raised, of the Local Authority Pension Trust (LAPTRUST) Imara Income Real Estate Investment Trust (I-REIT)) under the Restricted Sub-Segment in 2022. LAPTRUST held 100.0% of the Imara I-REIT shares with no initial offer to the public. We believe the reason behind its failure to attract IPO’s is because the measures undertaken have not been able to address the real impediment to listings, focusing mainly on tax exemptions whilst there are a number of deep underlying issues that still need to be remedied, in order to make the country’s capital market robust. Some of the key issues we believe the authority need to undertake in order to attract more IPO’s are as follows;
- Shallow market: The Nairobi Securities Market is regarded as a shallow market since it only offers few instruments and limited liquidity, leaving firms with minimal financing options. The strength of securities markets that make them crucial in growth of an economy, is their capacity to mobilize long term savings for financing long term projects and encourage broader ownership of firms. The intermittent trading of only few stocks held by a small number of investors makes the NSE less efficient. In comparison to other nations like South Africa, which has a total of 350 listed companies, NSE still lags behind having only 66 listed companies. Moreover, the market still lags behind in terms of liquidity due to overreliance on a few stocks thus discouraging listing as companies with the potential to list stay away out of fear of having failed IPOs,
- Rigid regulatory framework: The regulatory structure in Kenya’s capital market has been a key impediment to the penetration of capital market products as well as introduction of new IPO’s. The current regulations governing the capital markets securities, public offers, listing and disclosure is the Capital Markets Regulations Act 2002 and do not meet the needs of the ever evolving market. However, the authority announced that is fast-tracking reforms to update the regulations and have issued the Draft Public Offers, Listing and Disclosures seeking to address emerging issues and market dynamics in order to provide a more enabling environment in Kenya’s Capital Markets that will spur more listings in the Nairobi Securities Exchange. Moreover, costs associated with compliance to the regulatory and corporate governance framework requirements have been a barrier to potential companies going public. Additionally, most potential companies are reluctant to list since compliance with some of the regulations exposes the company to the public realm which they regard as a loss of competitive advantage,
- The rise of Private Equity firms providing easily accessible capital: Kenya’s private equity sector has been thriving, with raising capital through private equity companies is on the upswing, making companies shy from listing due to the readily available capital. According to African Private Equity and Venture Capital Association (APEVCA), Kenya recorded 54 deals with a value of USD 330.0 mn in H1’2022, coming behind only Egypt which recorded 63 deals with a value of USD 352.0 mn in H1’2022. Private equity funding is more appealing than public floatation for many companies primarily because it allows companies to stay private as they continue to finance their businesses for expansion thus preserving the kind of decision making power of its shareholders that is typically lost when business seek public listing,
- Perceived high cost for listing: Most small and medium sized companies shy from listing shares due to the perceived high direct cost in particular the annual listing fees of 0.06% of the market capitalization subject to a minimum of Kshs 200,000.0 and a maximum of Kshs. 1,500,000.0. Additionally, due to lack of awareness, the small and medium sized enterprises which are the dominant in the Kenyan economy, depend mainly on bank loans despite raising capital through the capital markets being cheaper. According to a study by the CMA, the percentage cost of floating securities in the capitals market is comparatively lower than bank lending rates. Moreover, IPO costs have ranged from 1.9% to 10.6% from 2012-2016, with the floatation of Eveready at 10.6% being the highest while Deacons in 2016 at 1.9% being the lowest, compared to bank lending rates averaging at 12.4% as of October 2022 according to CBK monthly economic indicators. Additionally, compared to bank loans, which are annual costs over the tenure of the relevant loans, the cost of floatation is a one-off cost,
- Size of companies: The Kenya economy being dominated by the small and medium sized companies, the perception that mature companies are the ones that are in good position of issuing IPOs make the small and medium sized companies reluctant to list for fear of having unsuccessful IPO’s. This is an indication that startup companies are not growing big enough to the capacity that would make them attractive to investors during IPO’s which is the main reason the informal sector still dominates the economy,
- Loss of control: Many companies particularly that are family owned or closely held are reluctant to list due to fear of dilution of ownership as well as losing their voting control. The companies typically rely on bank finance to raise additional capital when required. Additionally, most companies avoid going public due to constant pressure from public shareholders. Unlike the original owners, public shareholders usually take a short-term position and they are more concerned with seeing constant rises in the stock's price so they can sell their shares for a profit, and,
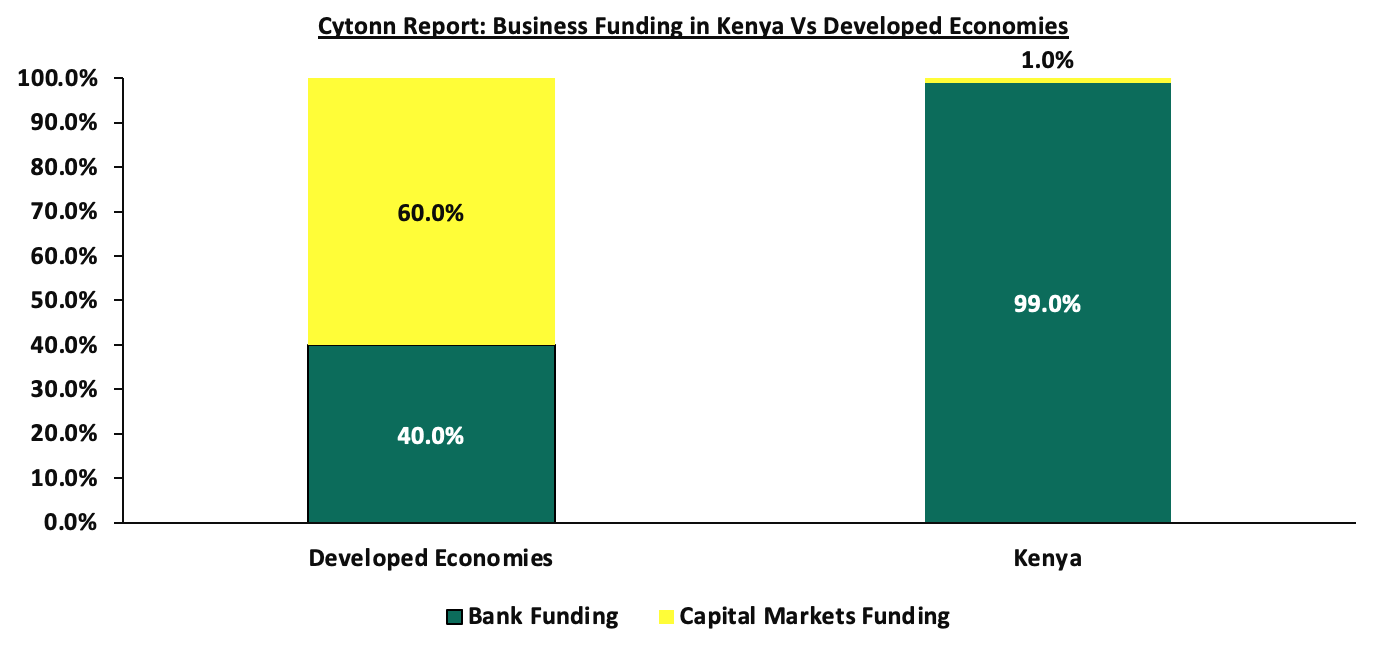
- Overreliance in Banks for funding over capital markets: In developed economies, most businesses are funded through capital markets with capital markets funding accounting for 60.0% compared to funding through banks at 40.0%. However, in Kenya it is the opposite, with capital markets contributing 1.0% while banks accounting for 99.0%. Aside from the statistics, there is a notion that banks rather than the capital markets control the economic agenda, instead of both having equal weights towards the growth of an economy. The chart below shows the comparison of business funding in Kenya against developed economies;
- Improve the Ease of Doing Business: For companies to go public, they need to go through the cycle from formation, to becoming SMEs to being large enough to go public. To get more firms to go public, we have to encourage and support venture formation, growth and ultimately going public. We need a focus on removing obstacles to doing business.
- Case study of Johannesburg Securities Exchange
The Johannesburg Securities Exchange is the principal stock exchange in South Africa founded in 1887 during the first South Africa gold rush, and is currently the largest stock in Africa having a total of 350 listed companies. It is regarded as the engine room for the South Africa economy by facilitating listing of securities as well as provide an orderly market through which investors can increase the value of their capital. The JSE is comprised of three market segments defined by market capitalization; the main Board, Alternative exchange (Altx) and the Debt market.
Main Board: The main board is the JSE primary listing segment designed for well established companies seeking to grow their business exponentially, Altx is the secondary equity market place designed for small and medium sized high growth companies while the Debt market is the largest segment of the JSE and offers a wide range of bond products. The JSE is a vast market offering a wide range of products, in addition to stocks, the market also offers a variety of exchange traded funds (ETFs), Exchange Traded Notes (ETNs) and also Asset Backed Securities which are readily available for trade.
JSE has been keen on revising its regulations as part of key measures undertaken to create an enabling environment for listing on the platform, and in 2022 the bourse announced revised regulations as follows;
- It brought down the free float - trade sharable requirement for a company from 20% to 10%,
- the bourse also amended the special purpose acquisition companies (SPAC) rule to align with international leading markets to ensure the attractiveness and competitiveness of SPACs, and,
- It also eased rules for financial reporting disclosure and debt instrument listing rules.
The bourse has also launched a training academy that is meant to sensitize the public by offering courses that outlines process of listing debt instruments as well as investing in the stock exchange.
JSE also tapped into the capital market tech in order to automate and streamline capital raising process. This follows the launch of the JSE Private Placemats Platform (JPP) meant to connect private companies and issuers directly to investors. This has simplified the hectic process of having to knock different doors for companies looking for capital from private equity firms.
Additionally, given the huge number of listings it has attracted over the years, it is often referred to as one of the most efficient market. Some of the reasons behind the huge number of listings include;
- Liquidity: Due its huge number of participants, meaning there is always a buyer or a seller for every security, the market is more liquid and typically efficient and therefore making it more attractive to investors as well as to potential companies for listing,
- Diversification: The JSE has a wide range of listed companies from different sectors and industries, providing investors with great choice in creating a well-balanced and diversified portfolio, and,
- Transparency: JSE is one of the efficiently regulated securities exchange in the world and provides a high degree of transparency and protection to investors. This makes it more reliable in terms of information available to the public.
- Recommendations to remedy the low number of listings
From the issues identified, we are of the view that the following should be done to facilitate growth in the number of new listings as well as development of the Nairobi Securities Exchange:
- Making changes to regulations that do not meet objectives: The current regulations governing the capital markets securities, public offers, listing and disclosure is the Capital Markets Regulations Act 2002, however, the authority is keen in fast-tracking reforms that will make listing attractive, in order to break the 8 year IPO drought. Therefore, CMA should continuously review, identify and amend restrictive provisions in the capital markets and related Laws that are unattractive to capital raising and listing to ensure the rules in place facilitate rather than deter active participation in the markets. This include rules such as the restrictive regulation inhibiting participation of investors. For example, the minimum amount an investor can put in a DREIT at Kshs 5.0 mn,
- Fast track Privatization of State Owned Enterprises: In October 2022, the new administration announced plans to privatize of 6 to 10 of State Owned Enterprises (SOEs) in the agricultural, energy and financial sectors, within 12 months. However, it is four months down the line, yet there are no actionable results. This also comes on the back of the previous regime’s plans to privatize up to 26 SOEs, yet none was achieved. As such, there is a need by the government to fast-track the process in order to revitalize the capital markets and increase trading activities at the bourse,
- Promote investment in Small and Medium Sized companies with growth potential: Following the increasing number of Small and Medium Sized companies, financing them through the securities exchange is key towards the growth of an economy. However, the challenge usually arises on onboarding investors who are willing to take the risk in these types of companies given some of them have low profit history while others are less liquid. However, some of the ways that can be used to promote and expand the small and medium sized enterprises, include; Introduction of tax incentives for investors willing to invest in small and medium sized companies to facilitate financing and boost liquidity and growth,
- Market Transparency: The degree of to which markets are transparent affects investors decision making. Transparency of trading allows efficient price setting and thus increases confidence in the market. Therefore, it is key for the regulator to enforce measures that raises the level of transparency in the market in order to make it more attractive to investors. This will help to boost its liquidity and consequently attract potential companies who are reluctant from going public due to the inefficiency in the market,
- Creating a culture of participation in the stock market: It is essential to disseminate knowledge of having a candid stock market through listing of more companies in order to broaden the financial markets. This can be implemented through having a specific day in a calendar for financial education where the general public are educated on importance of investment and financial culture,
- Improving tax incentives for new listings: The authority need to develop measures that are favorable to go public that will enable to attract more companies and have a powerful and more developed securities market. In order attract more listings the authority needs to improve its tax treatments for dividends as well as capital gains,
- Training and offer independent and free assessment to companies: In order to attract more listings, the authority need to offer trainings on matters of financial transparency, sustainability and corporate governance to potential companies as well as offering free assessment in order to help them position themselves for transitioning to the public markets, and,
- Simplify regulations and make it easier to access listing at the securities exchange market: The simplification of obtaining listing can encourage companies to go for listing at the stock market and take the advantage of public finance in the market to gain size and boost growth than private financing through risk or venture capital. The general cost of listing should also be reduced in order to make it more favorable and appealing for IPO’s.
We are of the opinion that reforming capital markets will attract IPO’s from mature companies that are in good position to comply with the public market regulations, as well as apply pressure on them to perform well financially. This will help to increase the number of listed companies at the bourse and thus break the dominancy of the few big firms. Additionally, it will help increase the market efficiency and consequently boost investors’ confidence. A vibrant Capital Markets is also key to attract SMEs to the capital markets structure, given that they form the bulk of businesses in Kenya.
Disclaimer: The views expressed in this publication are those of the writers where particulars are not warranted. This publication, which is in compliance with Section 2 of the Capital Markets Authority Act Cap 485A, is meant for general information only and is not a warranty, representation, advice or solicitation of any nature. Readers are advised in all circumstances to seek the advice of a registered investment advisor

- Talk to us
- Kenya
- P.O Box 20695 - 00200, Nairobi, Kenya
- Cell +254709101200
- Tel +254709101200
- WhatsApp +254741676635
- United States
- +254709101200
- DOWNLOAD OUR APP
-


- Kenya
- 8th Floor, Pinetree Plaza, Kaburu Drive, Ngong Road, Nairobi, Kenya
- USA
- Suite 1150, 1775 Eye Street NW, USA, Washington DC 20006, USA
- Investments
- High Yield
- Private Equity
- Real Estate
- Real Estate
- RiverRun Estates
- Cytonn Towers
- The Ridge
- Taraji Heights
- The Alma