Jun 19, 2022
Following the release of the Q1’2022 results by Kenyan listed banks, the Cytonn Financial Services Research Team undertook an analysis on the financial performance of the listed banks and identified the key factors that shaped the performance of the sector. For the various earnings notes of the various companies, click these links:
- Equity Group Q1’2021 Earnings Note;
- KCB Group Q1’2022 Earnings Note;
- ABSA Bank Kenya Q1’2022 Earnings Note;
- Standard Chartered Bank Kenya Q1’2022 Earnings Note;
- NCBA Group Q1’2022 Earnings Note;
- Cooperative Bank Q1’2022 Earnings Note;
- Diamond Trust Bank Kenya (DTB-K) Q1’2022 Earnings Note;
- I&M Holdings Q1’2022 Earnings Note;
- Stanbic Holdings Q1’2022 Earnings Note;
- HF Group Q1’2022 Earnings Note;
The Core Earnings per Share (EPS) for the listed banks recorded a weighted growth of 37.9% in Q1’2022, from a weighted growth of 28.4% recorded in Q1’2021, mainly attributable to a 21.4% growth in non-funded income coupled with a 17.7% growth in net interest income. Additionally, the Asset Quality for the listed banks improved in Q1’2022, with the gross NPL ratio declining by 1.0% point to 12.5%, from 13.5% in Q1’2021. We however note that despite this improvement in the asset quality, the NPL ratio remains higher than the 10-year average of 8.1%. The listed banks’ management quality also improved, with the Cost to Income ratio improving by 10.4% points to 53.1%, from 63.5% recorded in Q1’2021, as banks continued to reduce their provisioning levels following the improved business environment during the period. Consequently.
The report is themed “Improved Earnings in an Uncertain Business Environment” where we assess the key factors that influenced the performance of the banking sector in Q1’2022, the key trends, the challenges banks faced, and areas that will be crucial for growth and stability of the banking sector going forward. As such, we shall address the following:
- Key Themes that Shaped the Banking Sector Performance in Q1’2022,
- Summary of the Performance of the Listed Banking Sector in Q1’2022,
- The Focus Areas of the Banking Sector Players Going Forward, and,
- Brief Summary and Ranking of the Listed Banks based on the Outcome of Our Analysis.
Section I: Key Themes That Shaped the Banking Sector Performance in Q1’2022
Below, we highlight the key themes that shaped the banking sector in Q1’2022 which include; regulations, regional expansion through mergers and acquisitions, asset quality and capital raising for onward lending:
- Regulation:
- Regulation of Digital Lenders: The Central Bank of Kenya (CBK) enacted the law to regulate digital lenders, granting the bank the authority to license and oversee previously unregulated digital credit providers. The regulations were published on 18th March 2022, and allowed digital lenders a period of six months to acquire licences from CBK. The regulations are aimed at protecting borrowers against the predatory practices of unregulated digital credit providers, particularly their high costs, unethical debt collection practices, and misuse of personal information. We expect the move to streamline the digital lending services sector and weed out unscrupulous digital lenders who have taken advantage of the unregulated space to violate various consumer rights and privacy. Additionally, lenders will be able to acquire licenses to increase their market share and operate in a more favourable environment. For more information see our Cytonn Weekly #49/2021.
- Regional Expansion through Mergers and Acquisitions: Kenyan banks are looking at having an extensive regional reach. In Q1’2022, there were no mergers or acquisitions announced but the following was announced after Q1’2022:
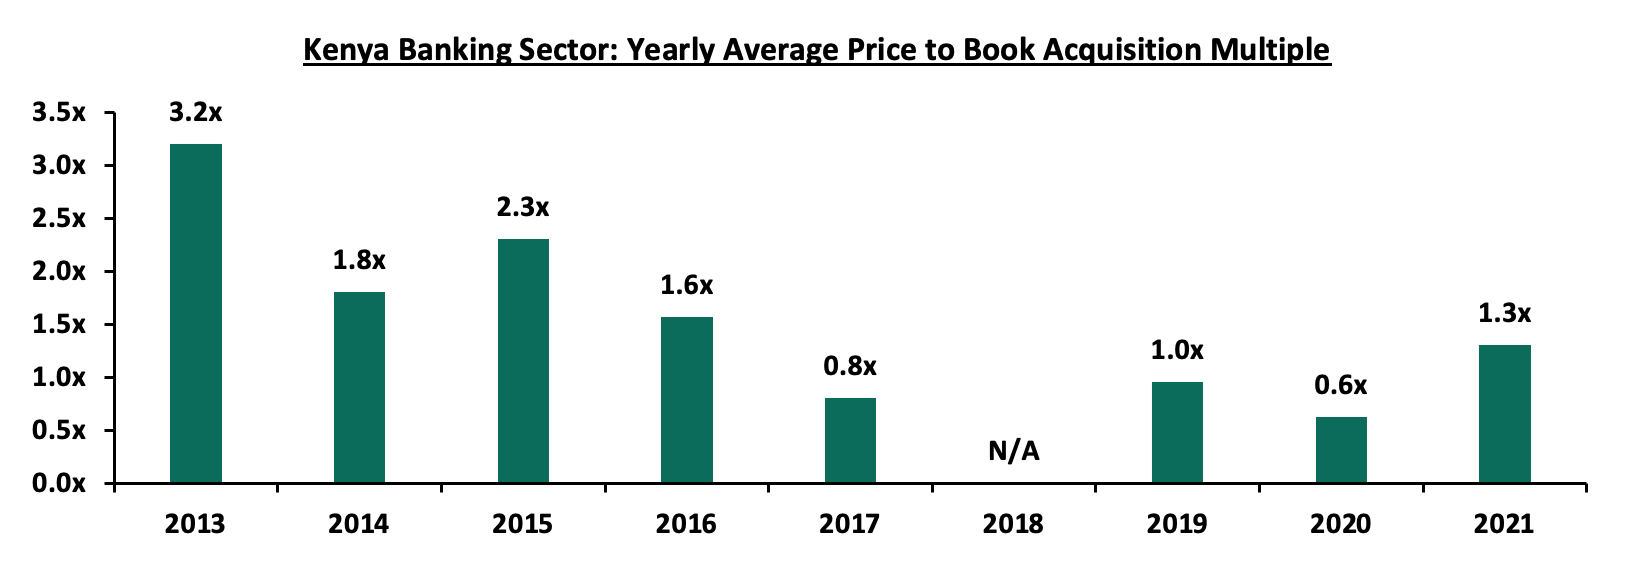
- On 8th June 2022, Centum Investment Company PLC, announced that it had entered into a binding agreement to sell its 83.4% shareholding in Sidian Bank to Access Bank PLC, for a consideration of Kshs 4.3 bn subject to relevant approval from the Central bank of Kenya and the Competition Authority of Kenya. The price consideration from Access Bank translates to a Price to Book Value (P/B) of 1.1x, which is lower than the 8-year acquisitions average P/B of 1.3x, but higher than the current average P/B of the listed banking stocks of 0.9x. For more information, please see our Cytonn Weekly #23/2022. Below is a summary of the deals in the last 9years that have either happened, been announced or expected to be concluded:
|
Acquirer |
Bank Acquired |
Book Value at Acquisition (Kshs bn) |
Transaction Stake |
Transaction Value (Kshs bn) |
P/Bv Multiple |
Date |
|
Access Bank PLC (Nigeria) |
Sidian Bank |
4.9 |
83.4% |
4.3 |
1.1x |
June-22* |
|
KCB Group |
Banque Populaire du Rwanda |
5.3 |
100.0% |
5.6 |
1.1x |
August-21 |
|
I&M Holdings PLC |
Orient Bank Limited Uganda |
3.3 |
90.0% |
3.6 |
1.1x |
April-21 |
|
KCB Group** |
ABC Tanzania |
Unknown |
100% |
0.8 |
0.4x |
Nov-20* |
|
Co-operative Bank |
Jamii Bora Bank |
3.4 |
90.0% |
1 |
0.3x |
Aug-20 |
|
Commercial International Bank |
Mayfair Bank Limited |
1 |
51.0% |
Undisclosed |
N/D |
May-20* |
|
Access Bank PLC (Nigeria) |
Transnational Bank PLC. |
1.9 |
100.0% |
1.4 |
0.7x |
Feb-20* |
|
Equity Group ** |
Banque Commerciale Du Congo |
8.9 |
66.5% |
10.3 |
1.2x |
Nov-19* |
|
KCB Group |
National Bank of Kenya |
7 |
100.0% |
6.6 |
0.9x |
Sep-19 |
|
CBA Group |
NIC Group |
33.5 |
53%:47% |
23 |
0.7x |
Sep-19 |
|
Oiko Credit |
Credit Bank |
3 |
22.8% |
1 |
1.5x |
Aug-19 |
|
CBA Group** |
Jamii Bora Bank |
3.4 |
100.0% |
1.4 |
0.4x |
Jan-19 |
|
AfricInvest Azure |
Prime Bank |
21.2 |
24.2% |
5.1 |
1.0x |
Jan-18 |
|
KCB Group |
Imperial Bank |
Unknown |
Undisclosed |
Undisclosed |
N/A |
Dec-18 |
|
SBM Bank Kenya |
Chase Bank Ltd |
Unknown |
75.0% |
Undisclosed |
N/A |
Aug-18 |
|
DTBK |
Habib Bank Kenya |
2.4 |
100.0% |
1.8 |
0.8x |
Mar-17 |
|
SBM Holdings |
Fidelity Commercial Bank |
1.8 |
100.0% |
2.8 |
1.6x |
Nov-16 |
|
M Bank |
Oriental Commercial Bank |
1.8 |
51.0% |
1.3 |
1.4x |
Jun-16 |
|
I&M Holdings |
Giro Commercial Bank |
3 |
100.0% |
5 |
1.7x |
Jun-16 |
|
Mwalimu SACCO |
Equatorial Commercial Bank |
1.2 |
75.0% |
2.6 |
2.3x |
Mar-15 |
|
Centum |
K-Rep Bank |
2.1 |
66.0% |
2.5 |
1.8x |
Jul-14 |
|
GT Bank |
Fina Bank Group |
3.9 |
70.0% |
8.6 |
3.2x |
Nov-13 |
|
Average |
74.5% |
1.3x |
||||
|
* Announcement Date ** Deals that were dropped |
||||||
The acquisition valuations for banks have been recovering, with the valuations increasing from the average of 0.6x in 2020 to 1.3x in 2021. This however still remains low compared to historical prices paid as highlighted in the chart below;
The number of commercial banks in Kenya currently stands at 38, same as in Q1’2022 but lower than the 43 licensed banks in FY’2015. The ratio of the number of banks per 10 million population in Kenya now stands at 7.1x, which is a reduction from 9.0x in FY’2015 demonstrating continued consolidation of the banking sector. However, despite the ratio improving, Kenya still remains overbanked as the number of banks remains relatively high compared to the population. To bring the ratio to 5.5x, we need to reduce the number of banks from the current 38 banks to 30 banks. For more on this see our topical.
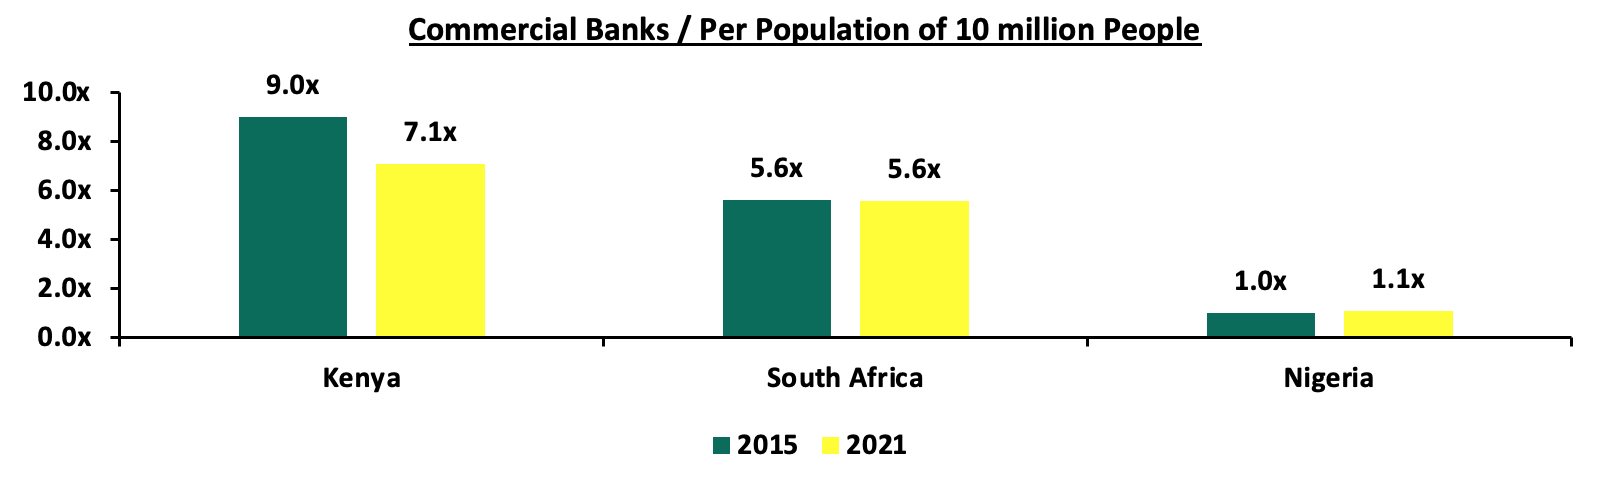
Source: World Bank, Central Bank of Kenya, South Africa Reserve Bank, Central Bank of Nigeria,
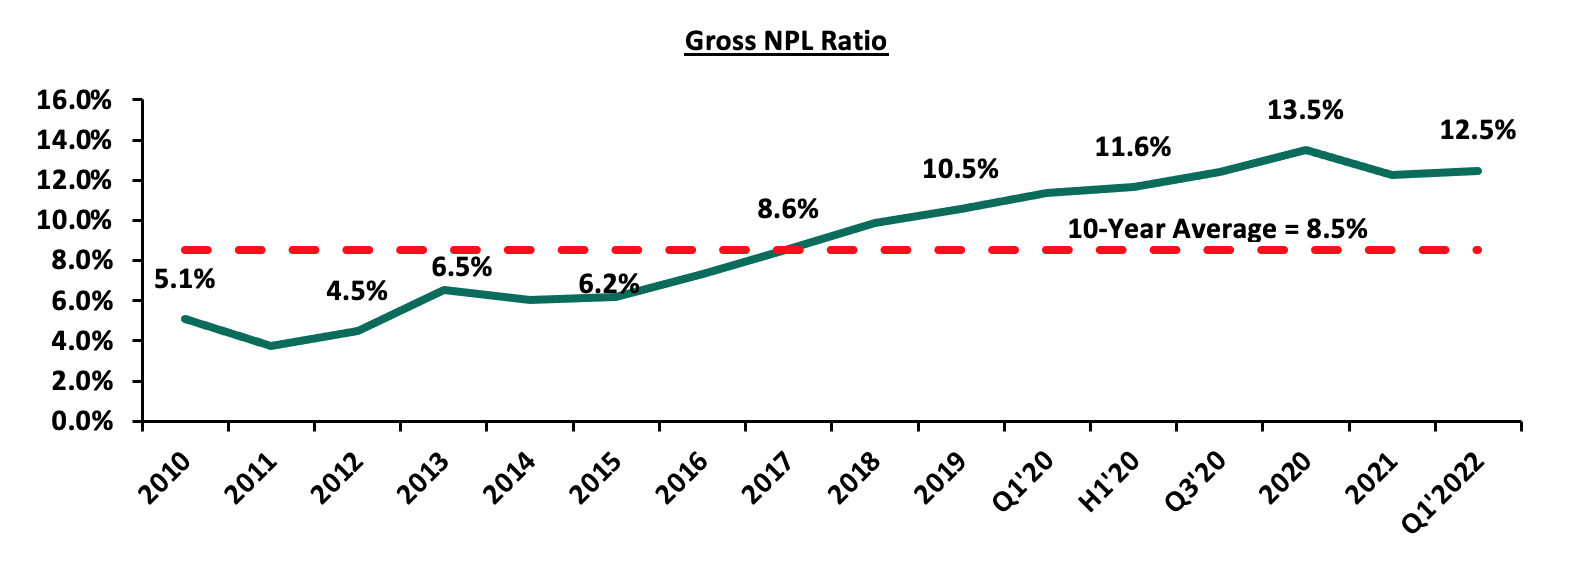
- Asset Quality: Asset quality for listed banks improved in Q1’2022, with the Gross NPL ratio declining by 1.0% points to 12.5%, from 13.5% in Q1’2021. According to the May 2022 MPC Press Release, the NPL ratio for the entire banking sector stood at 14.1% as at April 2022, relatively unchanged from April 2021, with majority of the non-performing loans stemming from sectors like the building and construction sector, manufacturing as well as the transport and communication sectors. Notably, the NPL ratio increased from the 13.1% recorded in December 2022 signalling a deteriorating business environment occasioned by the increased cost of living. We expect credit risk to remain elevated in the short term given the resurgence of COVID-19 infections as well as persistent supply constraints which are expected to continue to weigh on the business environment. The chart below highlights the asset quality trend for the listed banks:
The table below highlights the asset quality for the listed banking sector:
|
|
Q1’2021 NPL Ratio** |
Q1’2022 NPL Ratio* |
% point change in NPL Ratio |
Q1’2021 NPL Coverage** |
Q1’2022 NPL Coverage* |
% point change in NPL Coverage |
|
Absa Bank |
7.5% |
7.6% |
0.1% |
73.4% |
76.2% |
2.8% |
|
Equity Bank |
12.1% |
9.0% |
(3.1%) |
55.5% |
66.0% |
10.5% |
|
I&M Holdings |
11.9% |
10.0% |
(1.9%) |
61.1% |
72.1% |
11.0% |
|
Stanbic Bank |
15.1% |
11.1% |
(4.0%) |
63.9% |
59.1% |
(4.8%) |
|
DTBK |
10.6% |
12.6% |
2.0% |
46.5% |
42.2% |
(4.3%) |
|
Coop Bank |
16.9% |
13.9% |
(3.0%) |
58.4% |
65.3% |
6.9% |
|
SCBK |
16.4% |
15.4% |
(1.0%) |
81.1% |
81.8% |
0.7% |
|
NCBA Group |
14.7% |
16.3% |
1.6% |
65.0% |
72.6% |
7.6% |
|
KCB Group |
14.9% |
16.9% |
2.0% |
61.6% |
52.7% |
(8.9%) |
|
HF Group |
24.7% |
20.5% |
(4.2%) |
64.7% |
76.1% |
11.4% |
|
Mkt Weighted Average |
13.5% |
12.5% |
(1.0%) |
62.0% |
65.1% |
3.1% |
|
*Market cap weighted as at 17/06/2022 |
||||||
|
**Market cap weighted as at 08/06/2021 |
||||||
Key take-outs from the table include;
- Asset quality for the listed banks improved during the period, with the weighted average NPL ratio declining by 1.0% point to a market cap weighted average of 12.5%, from an average of 13.5% for the listed banking sector in Q1’2021. The improvement in asset quality is attributable to the 17.2% growth in loans in Q1’2022, in comparison to the 11.6% growth in Q1’2021, and,
- The NPL coverage rose to 65.1% in Q1’2022, from 62.0% recorded in Q1’2021, in accordance with IFRS 9, where banks are expected to provide both for the incurred and expected credit losses, as the banks increased their provisioning levels to proactively manage risks brought about by the emergence of new COVID-19 variants coupled with the slow recovery of some sectors such as tourism and hospitality, as well as the agriculture and manufacturing sectors. However, it is key to note that KCB Group’s NPL coverage came in at 52.7%, a decline from the 61.6% Q1’2021, despite the increase in the Gross NPL’s by 33.6% y/y to 16.6% from 14.8%, an indication of reduced provisioning.
- Capital Raising: In Q1’2022, listed banks continued to borrow from international institutions to not only strengthen their capital position but also boost their ability to lend to the perceived riskier Micro Small and Medium Sized Enterprises (MSMEs) segment in order to support the small businesses in the tough operating environment occasioned by the COVID-19 pandemic. In the period under review, Equity Group received USD 165.0 mn (Kshs 18.6 bn) facility from the International Finance Corporation (IFC) to Equity Bank Kenya in January 2022 in a bid to raise capital and for onward lending to climate smart projects and Small and Medium Enterprises (SMEs) in Kenya. For more information see our Cytonn Weekly #19/2022.
Section II: Summary of the Performance of the Listed Banking Sector in Q1’2022:
The table below highlights the performance of the banking sector, showing the performance using several metrics, and the key take-outs of the performance;
|
Bank |
Core EPS Growth |
Interest Income Growth |
Interest Expense Growth |
Net Interest Income Growth |
Net Interest Margin |
Non-Funded Income Growth |
NFI to Total Operating Income |
Growth in Total Fees & Commissions |
Deposit Growth |
Growth in Government Securities |
Loan to Deposit Ratio |
Loan Growth |
Return on Average Equity |
|
HF |
117.8% |
1.1% |
(6.5%) |
9.7% |
4.4% |
87.2% |
32.7% |
44.1% |
3.1% |
26.5% |
90.8% |
(2.7%) |
(4.5%) |
|
Coop |
68.9% |
4.1% |
0.3% |
5.5% |
8.3% |
41.7% |
38.2% |
45.2% |
4.3% |
10.4% |
79.0% |
8.8% |
21.6% |
|
KCB |
54.6% |
21.2% |
31.4% |
18.0% |
8.6% |
47.2% |
32.0% |
49.1% |
12.9% |
29.4% |
83.3% |
18.0% |
14.0% |
|
I&M |
43.6% |
20.6% |
20.6% |
20.7% |
6.4% |
20.3% |
29.7% |
28.4% |
17.6% |
21.0% |
70.6% |
13.1% |
19.3% |
|
Equity |
36.0% |
31.1% |
32.6% |
30.6% |
7.2% |
9.7% |
38.1% |
21.7% |
14.0% |
27.9% |
69.2% |
27.8% |
28.7% |
|
Absa |
22.1% |
15.6% |
16.2% |
15.4% |
7.1% |
5.8% |
30.5% |
(10.0%) |
4.8% |
7.9% |
90.0% |
11.2% |
21.2% |
|
NCBA |
20.3% |
10.5% |
14.9% |
7.6% |
5.8% |
15.5% |
46.1% |
0.0% |
7.2% |
22.6% |
52.4% |
0.3% |
22.9% |
|
DTBK |
16.3% |
10.7% |
9.5% |
5.1% |
5.3% |
14.1% |
24.3% |
23.3% |
13.7% |
12.1% |
65.5% |
9.2% |
7.1% |
|
SCBK |
15.6% |
1.8% |
(23.6%) |
7.2% |
6.3% |
0.1% |
33.6% |
(11.0%) |
0.0% |
(1.0%) |
48.3% |
8.7% |
17.4% |
|
Stanbic |
12.0% |
9.5% |
(5.2%) |
16.9% |
6.3% |
9.6% |
44.7% |
1.1% |
3.7% |
(14.6%) |
87.8% |
30.7% |
13.5% |
|
Q1'22 Mkt Weighted Average* |
37.9% |
17.8% |
17.1% |
17.7% |
7.3% |
21.4% |
35.9% |
21.7% |
9.5% |
17.6% |
73.9% |
17.2% |
21.9% |
|
Q1'21 Mkt Weighted Average** |
28.4% |
14.7% |
12.7% |
17.5% |
7.4% |
2.9% |
35.3% |
(2.4%) |
21.8% |
20.3% |
69.2% |
11.0% |
13.8% |
|
*Market cap weighted as at 17/06/2022 |
|||||||||||||
|
**Market cap weighted as at 08/06/2021 |
|||||||||||||
Key takeaways from the table above include:
- The listed banks recorded a 37.9% weighted average growth in core Earnings per Share (EPS), compared to a weighted average increase of 28.4% in Q1’2021 for the listed banking sector,
- The Banks have recorded a weighted average deposit growth of 9.5%, slower than the 21.8% growth recorded in Q1’2021, an indication of reduced investment risk in the business environment,
- Interest income grew by 17.8%, compared to a growth of 14.7% recorded in Q1’2021 while the weighted average Yield on Interest Earning Assets (YIEA) increased to 10.0%, from the 9.5% recorded in Q1’2021 for the listed banking sector. On the other hand, the Net Interest Margin (NIM) now stands at 7.3%, 0.1% points lower than the 7.4% recorded in Q1’2021 for the whole listed banking sector, and,
- Non-Funded Income grew by 21.4%, compared to the 2.9% growth recorded in Q1’2022. This can be attributable to the faster growth in the fees and commission which grew by 21.7% compared to a decline of 2.4% in Q1’2021, following the expiry of the waiver on bank charges.
Section III: Outlook of the banking sector:
The banking sector continued to recover in Q1’2022, as evidenced by the increase in their profitability, with the Core Earnings Per Share (EPS) growing by 37.9%. The increase in EPS is mainly attributable to the reduced provisioning levels by the sector, as the Loan Loss Provisions declined by 13.8% in Q1’2022, in comparison to the 3.9% growth recorded in Q1’2021, coupled with a 21.4% increase in Non-Funded Income as compared to the 2.9% growth in Q1’2021. However, despite the decline in Loan Loss Provisions, we believe that the uncertainty surrounding the August 2022 elections coupled with the resurgence of COVID-19 infections, will see banks continue overprovisioning in the medium term, albeit lower than in 2020. Based on the current operating environment, we believe the future performance of the banking sector will be shaped by the following key factors:
- Growth in Interest income: Going forward, we expect interest income growth to remain a key driver in the industry, evidenced by the 17.8% growth recorded in Q1’2022, higher than the 14.7% growth recorded in Q1’2021. As such, we believe the continued allocation to government securities which are witnessing increases in yields will lead to an increase in overall interest income. The disclosure by banks that most customers that had restructured their loans are now servicing them as normal means that banks are now earning interest on loans restructured at the height of the pandemic. Additionally, we believe that as more banks continue to get approvals for their risk-based lending models, the banks’ loan books will continue to increasing and consequently increase the interest income,
- Revenue Diversification: In Q1’2022, Non-Funded Income recorded a 21.4% weighted average growth, a significant increase from the 2.9% growth recorded in Q1’2021, as more banks sought revenue diversification strategies. The banking sector’s Non-Funded Income to Operating Income slightly increased, coming in at 35.9% in Q1’2022, compared to 35.3% in Q1’2021. There exists an opportunity for the sector to further increase NFI contribution to revenue going forward. The expiry of the waiver on bank charges on 2nd March 2021 is also expected to continue spurring NFI growth in the medium-long term due to the increased adoption of digital channels, which present an avenue for an increase in fees on transactions. According to Central Bank Annual Report 2019/2020, 67.0% of banking transactions were conducted on mobile phones after the onset of the pandemic, compared to 55.0% of transactions before the pandemic. The increase in mobile-banking transactions therefore provides an opportunity for banks to increase their Non-Funded income going forward,
- Provisioning: Loan Loss Provisions recorded a weighted average decline of 13.8% in Q1’2022, compared to a growth of 5.5% in Q1’2021. However, given the resurgence of COVID-19 infections in the country as well as the uncertainties surrounding the upcoming elections which are likely to disrupt the economic environment, we believe that a cautious approach is still required to manage credit risk in the banking sector,
- Cost Rationalization: Most banks have continued to pursue their cost-cutting strategy by riding on the digital revolution wave to improve operational efficiency and the reliability of out-of-branch transactions. Increased adoption of alternative transaction channels such as mobile, internet, and agency banking has resulted in an increase in transactions carried out through alternative channels, limiting branch transactions to high-value transactions and other services such as advisory. This has seen banks reduce front-office operations, thereby cutting the number of staff required and by extension, reducing operating expenses and hence, improving operational efficiency. Increased efficiency has been witnessed across the listed banks with the cost to income ratio having declined by 3.3% points to 53.1% in Q1’2022, from 56.4% in Q1’2021. However, some of the banks such as NCBA and DTB-K have announced plans to open more branches with an aim of increasing their physical presence,
- Regional Expansion and Further Consolidation: With consolidation remaining a key theme going forward, the current environment may provide opportunities for larger banks with a sufficient capital base to expand and take advantage of the market's low valuations, as well as further consolidate out smaller and weaker banks. Notably, majority of the bigger banks have continued to cushion over unsystematic risks specific to the local market by expanding their operations into other African nations. Going forward, we expect banks like NCBA to boost their revenues through regional expansion following the announcement that the Group would venture into the Ghanaian market. Other banks like KCB and Equity Group have been leveraging on expansion and consolidation which has largely contributed to their increased asset base as well as earnings growth, and,
- Integration of Climate-Related Risk Management: Following the release of Guidance on Climate-Related Risk Management by the Central Bank of Kenya (CBK), we expect to see banks channel their long term financing into environmental-friendly assets that are more sustainable and have lower risk of damage loss as a result of climate change. Additionally, banks will focus on lending to companies whose activities do not pose an environmental risk and will ultimately lead to improvement of collateral quality consequently reducing their exposure to unexpected loss and obsolesce. This will lead to reduced non-performing loans and provisioning in the sector.
Section IV: Brief Summary and Ranking of the Listed Banks:
As per our analysis on the banking sector from a franchise value and a future growth opportunity perspective, we carried out a comprehensive ranking of the listed banks. For the franchise value ranking, we included the earnings and growth metrics as well as the operating metrics shown in the table below in order to carry out a comprehensive review of the banks:
|
Bank |
Loan to Deposit Ratio |
Cost to Income (With LLP) |
Return on Average Capital Employed |
Deposits/ Branch (bn) |
Gross NPL Ratio |
NPL Coverage |
Tangible Common Ratio |
Non Funded Income/Revenue |
|
ABSA Bank |
90.0% |
56.6% |
8.0% |
3.2 |
7.6% |
76.2% |
13.4% |
30.5% |
|
NCBA Group |
52.4% |
61.7% |
6.3% |
4.5 |
16.3% |
72.6% |
12.8% |
46.1% |
|
Equity Bank |
69.2% |
51.1% |
10.2% |
2.7 |
9.0% |
66.0% |
12.3% |
38.1% |
|
KCB Group |
83.3% |
51.7% |
8.5% |
1.7 |
16.9% |
52.7% |
15.0% |
32.0% |
|
SCBK |
48.3% |
47.0% |
7.2% |
12.1 |
15.4% |
81.8% |
15.4% |
33.6% |
|
Coop Bank |
79.0% |
53.8% |
7.9% |
2.3 |
13.9% |
65.3% |
16.2% |
38.2% |
|
Stanbic Bank |
87.8% |
56.8% |
6.4% |
9.4 |
11.1% |
59.1% |
14.4% |
44.7% |
|
DTBK |
65.5% |
53.2% |
5.1% |
2.7 |
12.6% |
42.2% |
14.5% |
24.3% |
|
I&M Holdings |
70.6% |
52.0% |
5.4% |
3.6 |
10.0% |
72.1% |
15.1% |
29.7% |
|
HF Group |
90.8% |
94.9% |
0.5% |
1.7 |
20.5% |
76.1% |
13.7% |
32.7% |
|
Weighted Average Q1’2022 |
73.9% |
53.1% |
8.2% |
3.9 |
12.5% |
65.1% |
14.1% |
35.9% |
|
Market cap weighted as at 08/06/2021 |
||||||||
The overall ranking was based on a weighted average ranking of Franchise value (accounting for 60.0%) and intrinsic value (accounting for 40.0%). The Intrinsic Valuation is computed through a combination of valuation techniques, with a weighting of 40.0% on Discounted Cash-flow Methods, 35.0% on Residual Income and 25.0% on Relative Valuation, while the Franchise ranking is based on banks operating metrics, meant to assess efficiency, asset quality, diversification, and profitability, among other metrics. The overall Q1’2022 ranking is as shown in the table below:
|
Bank |
Franchise Value Rank |
Intrinsic Value Rank |
Weighted Rank |
FY'2021 |
Q1’2022 |
|
Equity Group |
1 |
2 |
1.6 |
4 |
1 |
|
KCB Group |
4 |
1 |
2.2 |
3 |
2 |
|
I&M Holdings |
2 |
3 |
2.6 |
1 |
3 |
|
Co-operative Bank |
2 |
6 |
4.4 |
2 |
4 |
|
ABSA |
5 |
4 |
4.4 |
4 |
5 |
|
NCBA Group |
8 |
5 |
6.2 |
8 |
6 |
|
SCBK |
6 |
7 |
6.6 |
6 |
7 |
|
Stanbic Holdings |
7 |
8 |
7.6 |
7 |
8 |
|
Diamond Trust Bank |
10 |
9 |
9.4 |
9 |
9 |
|
HF Group |
9 |
10 |
9.6 |
10 |
10 |
Major Changes from the FY’2021 Ranking are:
- Equity Group’s rank improved to position 1 in Q1’2022 from position 4 in FY’2021 attributable to the improvement in its Net Interest Margin to 7.2%, from the 6.8% recorded in FY’2021, leading to an increase in the bank’s franchise value score, coupled with an improvement in the bank’s Loan to Deposits ratio, which recorded 7.9% points increase to 69.2% from 61.3% recorded in FY’2021,
- I&M Holdings’ rank declined to position 3 in Q1’2022 from position 1 in FY’2021 attributable to a decline in the bank‘s Gross NPL ratio to 10.0%, from the 9.5% recorded in FY’2021, leading to a decline in the bank’s franchise value score, and,
- Co-operative Bank’s rank declined to position 4 in Q1’2022 from position 2 in FY’2021, attributable to a decrease in the bank’s Net Interest Margin to 8.3%, from 8.6% in FY’2021. However, the bank’s Return on Average Equity increased to 19.3%, from 17.3% recorded in FY’2021.
For more information, see our Cytonn Q1’2022 Listed Banking Sector Review
Disclaimer: The views expressed in this publication are those of the writers where particulars are not warranted. This publication, which is in compliance with Section 2 of the Capital Markets Authority Act Cap 485A, is meant for general information only and is not a warranty, representation, advice or solicitation of any nature. Readers are advised in all circumstances to seek the advice of a registered investment advisor.

- Talk to us
- Kenya
- P.O Box 20695 - 00200, Nairobi, Kenya
- Cell +254709101200
- Tel +254709101200
- WhatsApp +254741676635
- United States
- +254709101200
- DOWNLOAD OUR APP
-


- Kenya
- 8th Floor, Pinetree Plaza, Kaburu Drive, Ngong Road, Nairobi, Kenya
- USA
- Suite 1150, 1775 Eye Street NW, USA, Washington DC 20006, USA
- Investments
- High Yield
- Private Equity
- Real Estate
- Real Estate
- RiverRun Estates
- Cytonn Towers
- The Ridge
- Taraji Heights
- The Alma