Currency Outlook, & Cytonn Weekly #19/2022
By Research Team, May 15, 2022
Executive Summary
Fixed Income
During the week, T-bills were oversubscribed, with the overall subscription rate coming in at 102.3%, down from the 70.2% recorded the previous week, on the back of increasing yields. The 91-day paper recorded the highest subscription rate, receiving bids worth Kshs 5.3 bn against the offered Kshs 4.0 bn, translating to a subscription rate of 132.0%, a marginal increase from the 131.3% recorded the previous week. The continued investor preference for the 91-day paper is partly attributable to the higher return on a risk-adjusted basis. The subscription rate for the 364-day and 182-day papers increased to 113.4% and 79.3%, from 78.8% and 37.2%, respectively, recorded the previous week. The yields on the government papers were on an upward trajectory, with the yields on the 364-day, 182-day and the 91-day papers increasing by 2.0 bps, 18.0 bps and 10.3 bps to 9.9%, 8.7% and 7.7%, respectively. In the Primary Bond Market, the government released the auction results for the recently issued ten-year and twenty-five year bonds, FXD1/2022/10 and FXD1/2021/25, which recorded an undersubscription of 71.9%, receiving bids worth Kshs 43.1 bn out of the Kshs 60.0 bn on offer. The weighted average Interest rate of the accepted bids was 14.0% and 13.5% for FXD1/2021/25 and FXD1/2022/10, respectively;
Also during the week, the National Treasury gazetted the revenue and net expenditures for the first ten months of FY’2021/2022, ending 28th April 2022. Total revenue collected as at the end of April 2022 amounted to Kshs 1,536.8 bn, equivalent to 85.0% of the revised estimates of Kshs 1,808.3 bn and is 102.0% of the prorated estimates of Kshs 1,506.9 bn. Additionally, the Energy and Petroleum Regulatory Authority (EPRA) released their monthly statement on the maximum fuel price in Kenya effective 15th May 2022 to 14th June 2022. Notably, super petrol, diesel and kerosene prices increased by 3.8%, 4.4% and 4.9% to Kshs 150.1 per litre, Kshs 131.0 per litre and Kshs 118.9 per litre, from Kshs 144.6 per litre, Kshs 125.5 per litre and Kshs 113.4, respectively;
Equities
During the week, the equities market was on a downward trajectory, with NASI, NSE 20 and NSE 25 declining by 3.5%, 0.5% and 2.5%, respectively, taking their YTD performance to losses of 16.4%, 8.7% and 14.8% for NASI, NSE 20 and NSE 25, respectively. The equities market performance was driven by losses recorded by large cap stocks such as Safaricom, Equity Group, ABSA, and DTB-K of 5.6%, 3.5%, 2.4% and 2.3%, respectively. The losses were however mitigated by gains recorded by other large cap stocks such as NCBA, EABL and BAT of 6.2%, 1.8% and 1.3% respectively;
During the week, Equity Group and the International Finance Corporation (IFC) signed a partnership agreement in support of the sustainable development of Africa strategic plan by the Group which saw IFC and its partners commit USD 165.0 mn (Kshs 19.2 bn) towards Equity’s `Africa Recovery and Resilience Plan’. Also during the week, Safaricom Limited released their results for the year ended 31st March 2022, highlighting a core earnings per share increase of 1.8% to Kshs 1.74, from Kshs 1.71 in FY’2021 partly attributable to the 30.3% increase in M-PESA revenue to Kshs 107.7 bn, from Kshs 82.6 bn in FY’2021. Lastly, Equity Group, Stanbic Group, and HF Group released their Q1’2022 financial results, indicating an increase in Earnings per Share of 36.0%, 12.0% and 117.8%, respectively;
Real Estate
During the week, Hass Consult, a Real Estate Development and Consulting firm, released their House Price Index Q1’2022, highlighting that the average q/q selling prices for houses increased by 2.8% in Q1’2022 compared to a 3.0% increase in FY’2021, while on a y/y basis, the average selling prices appreciated by 6.8% compared to a (0.7%) price correction that was recorded in Q1’2021. Hass also released the Land Price Index Q1’2022, highlighting that the average q/q and y/y selling prices for land in the Nairobi suburbs appreciated by 0.1% and 1.1%, respectively, whereas the average q/q and y/y selling prices for land in the satellite towns of Nairobi increased by 2.2% and 7.4%, respectively. In the commercial office sector, CCI Group, an international contact centre operator in Africa, announced plans to develop a purpose-built state of the art office facility in Ruiru’s Tatu City. In the retail sector, ChicKing, an international fast food chain, in partnership with M/s Crispy Limited, a local franchise, announced plans to open 30 new outlets in Kenya, over the next five years. In the hospitality sector Radisson Blu, an international hotel chain, resumed its operations in Nairobi’s Upperhill, after been shut down for 16 months. In the infrastructure sector, China Road and Bridge Corporation (CRBC) was awarded a Kshs 9.0 bn tender to rehabilitate the lower section of the 27.1 Km Nairobi Expressway. For the listed Real Estate, ILAM Fahari I-REIT closed the week trading at an average price of Kshs 5.7 per share;
Focus of the Week
In 2022, the Kenyan shilling has continued with the depreciation trend experienced in 2021 and 2020, with the Kenyan shilling depreciating by 2.6% against the US Dollar (USD) to an all-time low of Kshs 116.1 as of 13th May 2022, from Kshs 113.1 recorded on 3rd January 2022. The poor performance of the shilling is mainly attributable to the increased dollar demand by energy and general importers, with Kenya largely being a net importer. Global oil prices have also increased during the year, attributable to the persisting supply chain constraints following the COVID-19 pandemic, worsened by the current global geopolitical tensions following the Russia-Ukraine conflict, coupled with the opening of economies globally, which has seen demand outpace fuel supply, further inflating the country’s import bill and consequently weakening the shilling. Additionally, Kenya has seen affirmation of its Long-Term Foreign-Currency Issuer Default Rating (IDR) at 'B+' with a Negative Outlook by Fitch Ratings, unchanged from the last review in 2021 as a result of the currency depreciation, increasing inflation and the risks arising from the upcoming August 2022 general elections. As a result, this week we shall be focusing in detail on the factors that are expected to drive the performance of the Kenya shilling and thereafter give our outlook for 2022;
Investment Updates:
- Weekly Rates:
- Cytonn Money Market Fund closed the week at a yield of 10.50%. To invest, dial *809#;
- Cytonn High Yield Fund closed the week at a yield of 14.13% p.a. To invest, email us at sales@cytonn.com and to withdraw the interest, dial *809#;
- On our weekly Twitter Spaces session, we had a discussion on “Getting the best out of Money Market Funds” which was moderated by Rose Ellah Ngari, CEO Vasili Africa. The panel included Steve G Kahome, a Market Analyst and, Brian Kipkemboi, Financial Advisor at Cytonn Investments. Listen to the conversation here,
- We continue to offer Wealth Management Training every Thursday and every third Saturday of the month, from 9:00 am to 11:00 am, through our Cytonn Foundation. The training aims to grow financial literacy among the general public. To register for any of our Wealth Management Trainings, click here;
- If interested in our Private Wealth Management Training for your employees or investment group, please get in touch with us through wmt@cytonn.com;
- Any CHYS and CPN investors still looking to convert through assignment of debt are welcome to consider one of the five projects currently available for assignment, click here for the latest term sheet;
- Cytonn Insurance Agency acts as an intermediary for those looking to secure their assets and loved ones’ future through insurance namely; Motor, Medical, Life, Property, WIBA, Credit and Fire and Burglary insurance covers. For assistance, get in touch with us through insuranceagency@cytonn.com;
- Cytonnaire Savings and Credit Co-operative Society Limited (SACCO) provides a savings and investments avenue to help you in your financial planning journey. To enjoy competitive investment returns, kindly get in touch with us through clientservices@cytonn.com;
Real Estate Updates:
- For an exclusive tour of Cytonn’s Real Estate developments, visit: Sharp Investor's Tour, and for more information, email us at sales@cytonn.com;
- Phase 3 of The Alma is now ready for occupation. To rent please email properties@cytonn.com;
- We have 8 investment-ready projects, offering attractive development and buyer targeted returns; See further details here: Summary of Investment-ready Projects;
- For recent news about the group, see our news section here;
Hospitality Updates:
- We currently have promotions for Staycations. Visit com/offers for details or email us at sales@cysuites.com;
Money Markets, T-Bills & T-Bonds Primary Auction:
During the week, T-bills were oversubscribed, with the overall subscription rate coming in at 102.3%, up from 70.2% recorded the previous week, on the back of increasing yields and eased liquidity in the money market with the average interbank rates declining to 4.6%, from the 4.8% recorded the previous week. The 91-day paper recorded the highest subscription rate, receiving bids worth Kshs 5.3 bn against the offered Kshs 4.0 bn, translating to a subscription rate of 132.0%, a marginal increase from the 131.3% recorded the previous week. The continued investor preference for the 91-day paper is partly attributable to the higher return on a risk-adjusted basis. The subscription rate for the 364-day and 182-day papers increased to 113.4% and 79.3%, from 78.8% and 37.2%, respectively, recorded the previous week. The yields on the government papers were on an upward trajectory, with the yields on the 364-day, 182-day and the 91-day papers increasing by 2.0 bps, 18.0 bps and 10.3 bps to 9.9%, 8.7% and 7.7%, respectively. The government accepted Kshs 23.1 bn worth of bids out of Kshs 24.5 bn received, translating to an acceptance rate of 94.1%.
In the Primary Bond Market, the government released the auction results for the recently issued ten-year and twenty-five year bonds, FXD1/2022/10 and FXD1/2021/25, which recorded an undersubscription of 71.9%, partly attributable to the relatively tight but recovering money market liquidity. The government sought to raise Kshs 60.0 bn for budgetary support, received bids worth Kshs 43.1 bn and accepted bids worth Kshs 31.7 bn, translating to a 73.6% acceptance rate. The longer dated paper, FXD1/2021/25 had a coupon rate of 13.9% and a market weighted average rate of 14.0% while FXD1/2022/10 had a coupon and weighted average rate of 13.5%.
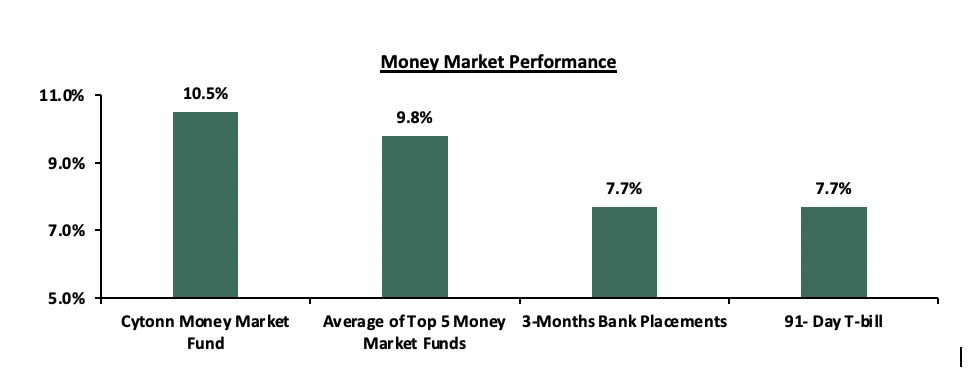
In the money markets, 3-month bank placements ended the week at 7.7% (based on what we have been offered by various banks), while the yield on the 91-day T-bill increased by 10.3 bps to 7.7%. The average yield of the Top 5 Money Market Funds and the yield on the Cytonn Money Market Fund remained relatively unchanged at 9.8% and 10.5%, respectively as recorded the previous week.
The table below shows the Money Market Fund Yields for Kenyan Fund Managers as published on 13th May 2022:
|
Money Market Fund Yield for Fund Managers as published on 13th May 2022 |
||
|
Rank |
Fund Manager |
Effective Annual Rate |
|
1 |
Cytonn Money Market Fund |
10.5% |
|
2 |
Zimele Money Market Fund |
9.9% |
|
3 |
Nabo Africa Money Market Fund |
9.8% |
|
4 |
Madison Money Market Fund |
9.5% |
|
5 |
Sanlam Money Market Fund |
9.2% |
|
6 |
Apollo Money Market Fund |
9.2% |
|
7 |
CIC Money Market Fund |
9.1% |
|
8 |
Dry Associates Money Market Fund |
9.0% |
|
9 |
Co-op Money Market Fund |
8.7% |
|
10 |
GenCap Hela Imara Money Market Fund |
8.7% |
|
11 |
ICEA Lion Money Market Fund |
8.6% |
|
12 |
Orient Kasha Money Market Fund |
8.6% |
|
13 |
NCBA Money Market Fund |
8.4% |
|
14 |
Old Mutual Money Market Fund |
7.8% |
|
15 |
AA Kenya Shillings Fund |
7.8% |
|
16 |
British-American Money Market Fund |
7.1% |
Source: Business Daily
Liquidity:
During the week, liquidity in the money markets eased, with the average interbank rate declining to 4.6% from 4.8% recorded the previous week, partly attributable to government payments inclusive of Kshs 10.0 bn Term Auction deposits (TADs) maturities, which offset tax remittances. The average interbank volumes traded declined by 36.2% to Kshs 12.5 bn from Kshs 19.6 bn recorded the previous week.
Kenya Eurobonds:
During the week, the yields on Eurobonds were on an upward trajectory, partly attributable to the heightened perceived risks by investors on the back of the rising inflation and the upcoming August 2022 elections. The yields on the 10-year Eurobonds issued in 2014 and 2018 increased by 1.8% and 0.7% to 11.5% and 11.2%, from 9.7% and 10.5%, respectively, recorded the previous week. The 30-year Eurobond issued in 2018, and the 12-year Eurobond issued in 2019 both increased by 0.5% points to 12.0% and 11.5%, from 11.5% and 11.0%, respectively, recorded last week. Similarly, the 7-year bond issued in 2019 and the 12-year Eurobond issued in 2021 increased by 0.8% points and 0.4% points to 12.2% and 11.1%, from 11.3% and 10.7%, respectively.
|
Kenya Eurobond Performance |
||||||
|
|
2014 |
2018 |
2019 |
2021 |
||
|
Date |
10-year issue |
10-year issue |
30-year issue |
7-year issue |
12-year issue |
12-year issue |
|
3-Jan-22 |
4.4% |
8.1% |
8.1% |
5.6% |
6.7% |
6.6% |
|
29-April-22 |
8.7% |
10.0% |
11.0% |
10.5% |
10.4% |
10.0% |
|
06-May-22 |
9.7% |
10.5% |
11.5% |
11.3% |
11.0% |
10.7% |
|
09-May-22 |
10.9% |
10.8% |
11.7% |
11.6% |
11.3% |
10.0% |
|
10-May-22 |
10.9% |
11.0% |
11.9% |
11.9% |
11.3% |
11.1% |
|
11-May-22 |
11.2% |
11.1% |
12.0% |
11.9% |
11.5% |
11.1% |
|
12-May-22 |
11.5% |
11.2% |
12.0% |
12.2% |
11.5% |
11.1% |
|
Weekly Change |
1.8% |
0.7% |
0.5% |
0.8% |
0.5% |
0.4% |
|
M/m Change |
2.8% |
1.2% |
1.0% |
1.6% |
1.1% |
1.1% |
|
YTD Change |
7.1% |
3.1% |
3.9% |
6.6% |
4.8% |
4.5% |
Source: CBK
Kenya Shilling:
During the week, the Kenyan shilling depreciated by 0.2% against the US dollar to close the week at Kshs 116.1, from Kshs 115.9 recorded the previous week, partly attributable to increased dollar demand from the oil and energy sectors. Key to note, this is the lowest the Kenyan shilling has ever depreciated against the dollar. On a year to date basis, the shilling has depreciated by 2.6% against the dollar, in comparison to the 3.6% depreciation recorded in 2021. We expect the shilling to remain under pressure in 2022 as a result of:
- Rising global crude oil prices on the back of supply constraints and geopolitical pressures at a time when demand is picking up with the easing of COVID-19 restrictions and as economies reopen. Key to note, risks abound the recovery following the emergence of the new COVID-19 variants,
- Increased demand from merchandise traders as they beef up their hard currency positions in anticipation for more trading partners reopening their economies globally,
- An ever-present current account deficit due to an imbalance between imports and exports, with Kenya’s current account deficit estimated to come in at 5.6% of GDP in the 12 months to February 2022 compared to the 4.3% for a similar period in 2021. The wider deficit reflects a higher import bill, particularly for oil, which more than offset increased receipts from agricultural and services exports, and remittances, and,
- The aggressively growing government debt, with Kenya’s public debt having increased at a 10-year CAGR of 18.6% to Kshs 8.2 tn in December 2021, from Kshs 1.5 tn in December 2011 thus putting pressure on forex reserves to service some of the public debt. It is worth noting that the average GDP growth over the same period has been 3.9%, an indicator that the increase in debt is not translating into GDP growth.
The shilling is however expected to be supported by:
- High Forex reserves currently at USD 8.4 bn (equivalent to 5.0-months of import cover), which is above the statutory requirement of maintaining at least 4.0-months of import cover, and the EAC region’s convergence criteria of 4.5-months of import cover. In addition, the reserves were boosted by the USD 750.0 mn World Bank loan facility received in March 2022 and are expected to be boosted further by the expected USD 244.0 mn from the International Monetary Fund (IMF), and,
- Improving diaspora remittances evidenced by a 25.0% y/y increase to USD 363.6 mn as of March 2022, from USD 290.8 mn recorded over the same period in 2021, the highest figure ever which has continued to cushion the shilling against further depreciation.
Weekly Highlight:
I. Revenue and Net Exchequer for FY’2021/2022
The National Treasury gazetted the revenue and net expenditures for the first ten months of FY’2021/2022, ending 28th April 2022. Below is a summary of the performance:
|
FY'2021/2022 Budget Outturn - As at 28th April 2022 |
||||||
|
Amounts in Kshs billions unless stated otherwise |
||||||
|
Item |
12-months Original Estimates |
Revised Estimates |
Actual Receipts/Release |
Percentage Achieved |
Prorated |
% achieved of prorated |
|
Opening Balance |
21.3 |
|||||
|
Tax Revenue |
1,707.4 |
1,741.1 |
1,456.2 |
83.6% |
1,450.9 |
100.4% |
|
Non-Tax Revenue |
68.2 |
67.1 |
59.3 |
88.4% |
55.9 |
106.1% |
|
Total Revenue |
1,775.6 |
1,808.3 |
1,536.8 |
85.0% |
1,506.9 |
102.0% |
|
External Loans & Grants |
379.7 |
433.2 |
162.5 |
37.5% |
361.0 |
45.0% |
|
Domestic Borrowings |
1,008.4 |
1,008.0 |
735.0 |
72.9% |
840.0 |
87.5% |
|
Other Domestic Financing |
29.3 |
30.4 |
8.0 |
26.5% |
25.3 |
31.7% |
|
Total Financing |
1,417.4 |
1,471.5 |
905.6 |
61.5% |
1,226.3 |
73.9% |
|
Recurrent Exchequer issues |
1,106.6 |
1,179.4 |
927.2 |
78.6% |
982.9 |
94.3% |
|
CFS Exchequer Issues |
1,327.2 |
1,309.5 |
957.1 |
73.1% |
1,091.2 |
87.7% |
|
Development Expenditure & Net Lending |
389.2 |
420.9 |
267.3 |
63.5% |
350.7 |
76.2% |
|
County Governments + Contingencies |
370.0 |
370.0 |
261.0 |
70.5% |
308.3 |
84.6% |
|
Total Expenditure |
3,193.0 |
3,279.8 |
2,412.6 |
73.6% |
2,733.1 |
88.3% |
|
Fiscal Deficit excluding Grants |
(1,417.4) |
(1,471.5) |
(875.8) |
59.5% |
(1,226.3) |
71.4% |
|
Fiscal Deficit(excluding grants) as % of GDP |
8.1%* |
8.1%* |
7.2% |
|||
|
Total Borrowing |
1,388.1 |
1,441.1 |
897.6 |
62.3% |
1,200.9 |
74.7% |
|
*National Treasury estimates |
||||||
The key take-outs from the report include:
- Total revenue collected as at the end of April 2022 amounted to Kshs 1,536.8 bn, equivalent to 85.0% of the revised estimates of Kshs 1,808.3 bn and is 102.0% of the prorated estimates of Kshs 1,506.9 bn. Notably, the performance is an improvement from the 100.8% performance recorded in the first eight months to February 2022, which was despite the deterioration of the business environment seen during the month of April as evidenced by the decline in the purchasing managers index (PMI) to 49.5, from 50.5 that was recorded in March 2022. Cumulatively, tax revenues amounted to Kshs 1,456.2 bn, equivalent to 83.6% of the revised estimates of Kshs 1,741.1 bn and 100.4% of the prorated estimates of Kshs 1,450.9 bn,
- Total financing amounted to Kshs 905.6 bn, equivalent to 61.5% of the revised estimates of Kshs 1,471.5 bn and is equivalent to 73.9% of the prorated estimates of Kshs 1,226.3 bn. Additionally, domestic borrowing amounted to Kshs 735.0 bn, equivalent to 72.9% of the original estimates of Kshs 1,008.0 bn and is 87.5% of the prorated estimates of Kshs 840.0 bn,
- The total expenditure amounted to Kshs 2,412.6 bn, equivalent to 73.6% of the revised estimates of Kshs 3,279.8 bn, and is 88.3% of the prorated expenditure estimates of Kshs 2,733.1 bn. Additionally, the net disbursements to recurrent expenditures came in at Kshs 927.2 bn, equivalent to 78.6% of the revised estimates and 94.3% of the prorated estimates of Kshs 982.9 bn, and development expenditure amounted to Kshs 267.3 bn, equivalent to 63.5% of the revised estimates of Kshs 420.9 bn and is 76.2% of the prorated estimates of Kshs 350.7 bn,
- Consolidated Fund Services (CFS) Exchequer issues lagged behind their targets of Kshs 1,091.2 bn after amounting to Kshs 957.1 bn, equivalent to 73.1% of the revised estimates, and are 87.7% of the prorated amount of Kshs 1,091.2 bn. The cumulative public debt servicing cost amounted to Kshs 840.8 bn which is 73.0% of the original estimates of Kshs 1,151.3 bn, and is 86.3% of the prorated estimates of Kshs 974.3 bn. Additionally, the Kshs 840.8 bn debt servicing cost is equivalent to 54.7% of the actual revenues collected as at the end of April 2022 , and,
- Total Borrowings as at the end of April 2022 amounted to Kshs 897.6 bn, equivalent to 62.3% of the revised estimates of Kshs 1,441.1 bn and are 74.7% of the prorated estimates of Kshs 1,200.9 bn. The cumulative domestic borrowing target of Kshs 1,008.0 bn comprises of adjusted Net domestic borrowings of Kshs 664.0 bn and Internal Debt Redemptions (Roll-overs) of Kshs 343.9 bn.
Despite the historical trend of the government not meeting its revenue targets, revenue performance in the first ten months of the current fiscal year is commendable. The improvement is partly due to the economy's sustained recovery following the ease of COVID-19 containment measures and the effectiveness of the KRA in revenue collection. Additionally, the recent tax initiatives such as the adoption of the Finance Act 2021 which led to the upward readjustment of the Excise Duty Tax, Income Tax as well as the Value Added Tax have played a big role in expanding the tax base and consequently enhancing revenue collection. With less than two months left in the current fiscal year, we expect the government to step up its revenue collection efforts and rely more on the domestic market to close the deficit. As a result, the government's borrowing appetite is expected to remain high as the fiscal year draws to a close. Consequently, we expect sustained gradual increase in government securities’ yields in the short term. However, the key concerns remain the emergence of new COVID-19 variants both locally and with trading partners globally as well as the rising cost of living which is likely to have a negative effect on consumer spending.
II. Fuel Prices
During the week, the Energy and Petroleum Regulatory Authority (EPRA) released their monthly statement on the maximum fuel price in Kenya effective 15th May 2022 to 14th June 2022. Notably, super petrol, diesel and kerosene prices increased by 3.8%, 4.4% and 4.9% to Kshs 150.1 per litre, Kshs 131.0 per litre and Kshs 118.9 per litre, from Kshs 144.6 per litre, Kshs 125.5 per litre and Kshs 113.4, respectively. Key to note, the current prices are the highest ever recorded in the country. Below are the key take-outs from the statement:
The performance in fuel prices was attributable to:
- An increase in the average landed costs of Super Petrol by 1.5% to USD 826.8 per cubic meter in April 2022, from USD 814.9 per cubic meter in March 2022,
- An increase in the average landed costs of Diesel by 6.5% to USD 899.4 per cubic meter in March2022, from USD 844.6 per cubic meter in 2022,
- An increase in the average landed costs of Kerosene by 31.1% to USD 908.7 per cubic meter in April 2022, from USD 693.0 per cubic meter in March 2022,
- An increase in the Free on Board (FOB) price of Murban crude oil in April 2022 by 10.4% to USD 94.0 per barrel, from USD 85.1 per barrel in March 2022, and,
- The depreciation of the Kenyan shilling during the period by 1.0% to Kshs 115.7 in April 2022, from Kshs 114.6 in March 2022.
However, the fuel prices were supported from further increase by:
- The fuel subsidy program under the Petroleum Development Fund which resulted in subsidies of Kshs 26.4 on Super Petrol per litre, Kshs 43.9 on Diesel per litre and Kshs 50.3 per litreon Kerosene during the month, and,
- The removal of suppliers margins since October 2021.
Global fuel prices have recorded a 40.4% increase since the beginning of the year to USD 109.3 per barrel as of 12th May 2022, from USD 77.9 per barrel recorded on 3rd January 2022, driven by persistent supply chain constraints worsened by the geopolitical pressures occasioned by the Russian invasion of Ukraine. The fuel subsidy program under the National Treasury has largely cushioned Kenyans from the high fuel prices. However, we believe that the program is unsustainable and will be depleted should the average landed costs of fuel continue to rise. Further, the program has come under increasing pressure from the Oil Marketing Companies (OMCs) due to delayed payment of compensation amounts. Key to note, the compensation amounts for Diesel and kerosene in May 2022 increased by 9.2% and 89.8% to Kshs 43.9 per litre and Kshs 50.3 per litre from Kshs 40.2 per litre and Kshs 26.5 per litre, respectively in April 2022. Despite the additional Kshs 24.9 bn for stabilization of oil market prices and the rationalization of Capital expenditure, allocated in the recently assented Supplementary Budget, the National Treasury would have to disburse an estimated Kshs 15.0 bn monthly to meet the full subsidy in the period of review. As such, the additional amount to the program would be depleted in two months. Going forward, we expect the cost of living to remain high given that fuel is a major contributor to Kenya’s headline inflation and fuel prices are a major input cost in majority of Kenya’s sectors such as manufacturing, transport and energy. Consequently, the business environment is expected to deteriorate even further as consumers are likely to cut on spending.
Rates in the Fixed Income market have remained stable due to the relatively ample liquidity in the money market. The government is 3.5% ahead of its prorated borrowing target of Kshs 587.4 bn having borrowed Kshs 608.1 bn of the Kshs 664.0 bn borrowing target for the FY’2021/2022. We expect a gradual economic recovery as evidenced by the revenue collections of Kshs 1.5 tn during the first eight months of the current fiscal year, which was equivalent to 102.0% of the prorated revenue collection target. However, despite the projected high budget deficit of 8.1% and the affirmation of the `B+’ rating with negative outlook by Fitch Ratings, we believe that the support from the IMF and World Bank will mean that the interest rate environment will remain stable since the government is not desperate for cash. Owing to this, our view is that investors should be biased towards short-term fixed-income securities to reduce duration risk.
Markets Performance
During the week, the equities market was on a downward trajectory, with NASI, NSE 20 and NSE 25 declining by 3.5%, 0.5% and 2.5%, respectively, taking their YTD performance to losses of 16.4%, 8.7% and 14.8% for NASI, NSE 20 and NSE 25, respectively. The equities market performance was driven by losses recorded by large cap stocks such as Safaricom, Equity Group, ABSA, and DTB-K of 5.6%, 3.5%, 2.4% and 2.3%, respectively. The losses were however mitigated by gains recorded by other large cap stocks such as NCBA, EABL and BAT of 6.2%, 1.8% and 1.3% respectively.
During the week, equities turnover increased by 77.9% to USD 21.3 mn, from USD 12.0 mn recorded the previous week, taking the YTD turnover to USD 327.9 mn. Foreign investors remained net sellers, with a net selling position of USD 10.4 mn, from a net selling position of USD 4.7 mn recorded the previous week, taking the YTD net selling position to USD 44.2 mn.
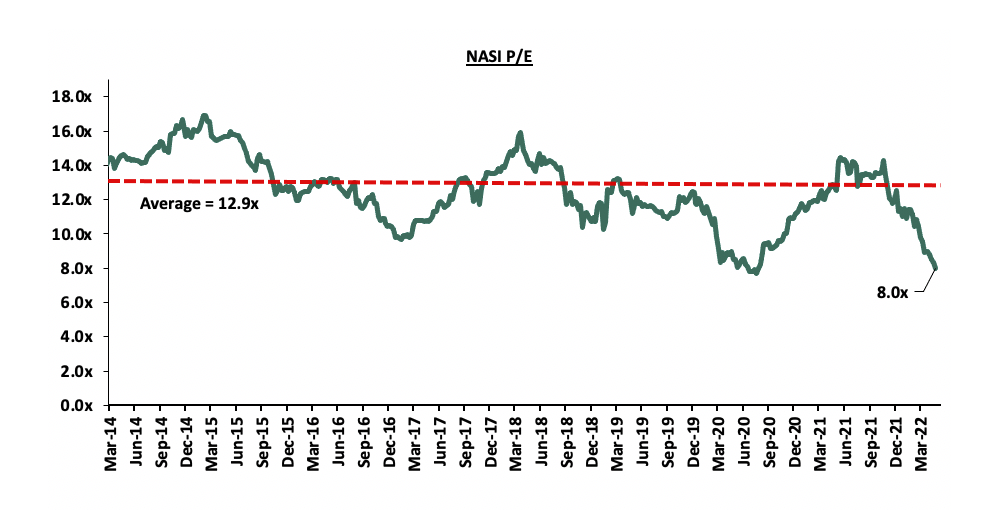
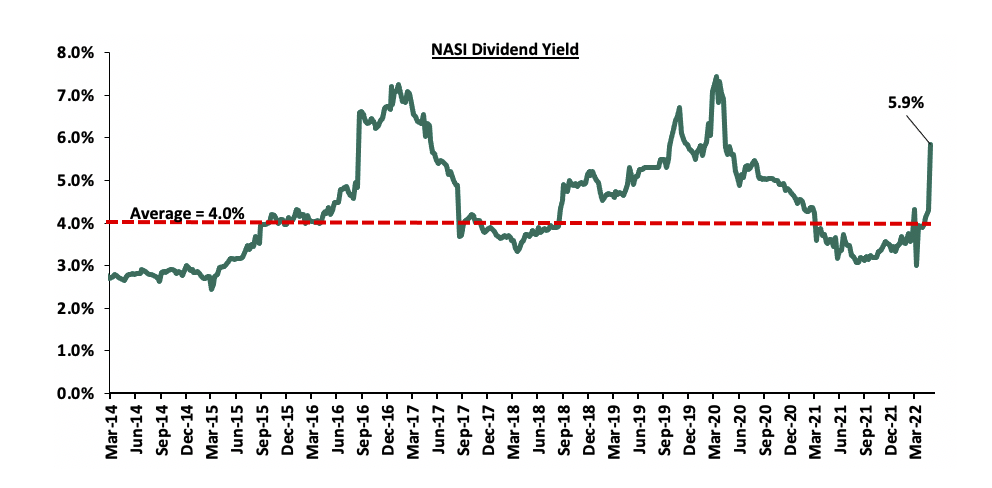
The market is currently trading at a price to earnings ratio (P/E) of 8.0x, 37.8% below the historical average of 12.9x, and a dividend yield of 5.9%, 1.9% points above the historical average of 4.0%. Key to note, NASI’s PEG ratio currently stands at 1.0x, an indication that the market is trading at a fair value to its future growth. A PEG ratio greater than 1.0x indicates the market may be overvalued while a PEG ratio less than 1.0x indicates that the market is undervalued. The current P/E valuation of 8.0x is 3.8% above the most recent trough valuation of 7.7x experienced in the first week of August 2020. The charts below indicate the historical P/E and dividend yields of the market:
Weekly Highlights:
A. Equity Group’s IFC Loan Facility
During the week, Equity Group and the International Finance Corporation (IFC) signed a partnership agreement in support of the sustainable development of Africa strategic plan by the Group. The partnership has seen IFC and its partners including the Dutch Development Bank (FMO), British International Investment (BII) and Symbiotics, ResponsAbIility from Switzerland commit USD 165.0 mn (Kshs 19.2 bn) towards Equity’s `Africa Recovery and Resilience Plan’. The USD 165.0 mn credit facility includes USD 50.0 mn (Kshs 5.8 bn) from IFC, USD 50.0 mn (Kshs 5.8 bn) from BII and USD 65.0 mn (Kshs 7.5 bn) from Symbiotic, Responsibility and FMO, the Dutch entrepreneurial development bank. Notably, this is the second facility from IFC following a USD 50.0 mn (Kshs 5.8 bn) loan that was extended to Equity Group in July 2020 for onward lending, bringing the total amount by IFC to USD 100.0 mn (Kshs 11.6 bn). The funds are expected to support development through supporting micro, small and medium sized businesses (MSMEs) from all sectors of the economy including climate-smart businesses. Further to the agreement, IFC and the IFC Financial Institutions Growth Fund completed the 6.7% stake acquisition in Equity Group, making it the second largest shareholder after Arise B.V.
In a bid to achieve the Group’s strategic recovery and resilience objective for Africa, Equity Group is expected to leverage on its regional footprint, strong financial capability, and brand trust to accelerate growth in MSMEs. Further, the Group is expected to drive their inclusion into formal value chains, championing access to trade and investment opportunities, while maximizing the region’s productive capacities to accelerate the growth of manufacturing and logistics and promoting investment in the informal sector. In turn, we believe that Equity Group will continue to register growth in earnings in form of interest income as it expands its customer base through the lending business as well as improve the business environment in Africa, especially Kenya where the group runs most of its business.
B. Safaricom Full Year Results – Financial Year Ending 31 March 2022
Safaricom Limited released their results for the year ended 31st March 2022, highlighting a core earnings per share increase of 1.8% to Kshs 1.74, from Kshs 1.71 in FY’2021. The increase in the earnings growth was attributable to the 30.3% increase in M-PESA revenue to Kshs 107.7 bn, from Kshs 82.6 bn in FY’2021, following the lifting of the waiver by the Central Bank of Kenya on all charges for transactions. Key take-outs from the financial results include:
- Safaricom’s Group’s Profit After Tax declined by 1.7% to Kshs 67.5 bn, from Kshs 68.7 bn recorded in FY’2021 mainly attributable to the 19.9% faster growth in operating expenses to Kshs 55.2 bn, from Kshs 46.0 bn coupled with the 14.3% increase in direct costs to Kshs 91.5 bn, from Kshs 80.0 bn, as compared to the 12.9% growth in revenues to Kshs 298.1 bn, from Kshs 264.0 bn,
- Out of all the expenses, capital expenditure for the year ended 31st March 2022 stood at Kshs 49.8 bn growing by 42.4% from Kshs 35.0 bn. Kshs 10.4 bn of this was spent in setting up the Ethiopian network in readiness to launch operations within 2022,
- Mobile service revenue continues to be the largest contributor to the Group’s revenues with M-Pesa revenue recording a 30.3% growth to Kshs 107.7 bn, from Kshs 82.6 bn in FY'2021 largely supported by the reinstatement of previously zero rated transactions beginning January 2021. Mobile data on the other hand grew by 8.1% to Kshs 48.4 bn, from Kshs 44.8 bn in FY’2021 supported by the Group’s Customer Value Management (CVM) initiatives which have continued to provide personalized offers to clients, and,
- Despite the decline, Safaricom announced an interim dividend of Kshs 0.64 per share, which in addition to the proposed final dividend of Kshs 0.75 per share brings the total dividends to Kshs 1.39 per share for the year ended 31st March 2022. This translates to a dividend payout ratio of 0.8 which remains unchanged from the FY’2021 ratio.
Going forward, we expect Safaricom’s earnings to continue being supported by revenues from M-pesa, continued upgrade to improved cellular service and the Ethiopian venture. Safaricom’s rollout to the 5G network has continued to decongest the cellular service and provide higher upload speeds which has played a big role is supporting fixed data revenue. We also expect Safaricom to capitalize on the mobile money business, which has been driving the company's profitability in recent years. For the year ended 31st March 2022, M-Pesa contributed 36.1% of the total revenues and 39.9% of the mobile service revenue. Notably, M-Pesa commands the highest market share of 98.9% in terms of mobile money transactions and subscription according to the latest statistics from Communication Authority and as such we expect the Group to leverage on the mobile money business in other African companies and especially its new venture in Ethiopia.
C. Earnings Releases
During the week, Equity Group and Housing Finance (HF) released their Q1’2022 financial results. Below is a summary of their performance;
i. Equity Group
|
Equity Group Q1’2022 Key Highlights |
|||||
|
Balance Sheet |
|||||
|
Balance Sheet Items |
Q1'2021 (Kshs bn) |
Q1'2022 (Kshs bn) |
y/y change |
||
|
Net Loans and Advances |
183.0 |
233.9 |
27.9% |
||
|
Government Securities |
487.7 |
623.6 |
27.8% |
||
|
Total Assets |
1,066.4 |
1,269.5 |
19.0% |
||
|
Deposits Per Branch |
2.4 |
2.8 |
14.0% |
||
|
Customer Deposits |
789.9 |
900.9 |
14.0% |
||
|
Total Liabilities |
926.0 |
1,095.3 |
18.3% |
||
|
Shareholders’ Funds |
133.9 |
167.2 |
24.9% |
||
|
Income Statement |
|||||
|
Income Statement Items |
Q1'2021 (Kshs bn) |
Q1'2022 (Kshs bn) |
y/y change |
||
|
Net Interest Income |
14.8 |
19.4 |
30.6% |
||
|
Net non-Interest Income |
10.9 |
11.9 |
9.7% |
||
|
Total Operating income |
25.7 |
31.3 |
21.7% |
||
|
Loan Loss provision |
(1.3) |
(1.8) |
42.4% |
||
|
Total Operating expenses |
(14.0) |
(16.0) |
14.3% |
||
|
Profit before tax |
11.7 |
15.3 |
30.6% |
||
|
Profit after tax |
8.7 |
11.9 |
36.0% |
||
|
Core EPS |
2.3 |
3.1 |
36.0% |
||
|
Key Ratios |
|||||
|
Income Statement Ratios |
Q1’2021 |
Q1’2022 |
% points y/y change |
||
|
Yield from interest-earning assets |
10.3% |
9.9% |
(0.4%) |
||
|
Cost of funding |
2.8% |
2.8% |
- |
||
|
Cost of risk |
4.9% |
5.8% |
0.9% |
||
|
Net Interest Margin |
7.6% |
7.2% |
(0.4%) |
||
|
Net Interest Income as % of operating income |
57.7% |
61.9% |
4.2% |
||
|
Non-Funded Income as a % of operating income |
42.3% |
38.1% |
(4.2%) |
||
|
Cost to Income Ratio |
54.4% |
51.1% |
(3.3%) |
||
|
Cost to Income Ratio without LLP |
49.5% |
45.3% |
(4.2%) |
||
|
Cost to Assets |
1.4% |
1.2% |
(0.2%) |
||
|
|
Capital Adequacy Ratios |
||||
|
Ratios |
Q1'2021 |
Q1'2022 |
% Points Change |
||
|
Core Capital/Total Liabilities |
15.8% |
16.3% |
0.5% |
||
|
Minimum Statutory ratio |
8.0% |
8.0% |
0.0% |
||
|
Excess |
7.8% |
8.3% |
0.5% |
||
|
Core Capital/Total Risk Weighted Assets |
14.2% |
13.9% |
(0.3%) |
||
|
Minimum Statutory ratio |
10.5% |
10.5% |
0.0% |
||
|
Excess |
3.7% |
3.4% |
(0.3%) |
||
|
Total Capital/Total Risk Weighted Assets |
18.0% |
18.7% |
0.7% |
||
|
Minimum Statutory ratio |
14.5% |
14.5% |
0.0% |
||
|
Excess |
3.5% |
4.2% |
0.7% |
||
Key take-outs from the earnings release include;
- Core earnings per share increased by 36.0% to Kshs 3.1 in Q1’2022, from Kshs 2.3 recorded in Q1’2021, higher than our projections of a 25.3% increase to Kshs 2.9. The performance was driven by a 21.7% growth in total operating income to Kshs 31.3 bn, from Kshs 25.7 bn in Q1’2021, faster than the 14.3% growth in total operating expenses to Kshs 16.0 bn, from Kshs 14.0 bn in Q1’2021,
- Interest income increased by 31.1% to Kshs 26.7 bn, from Kshs 20.3 bn in Q1’2021 driven by a 20.9% increase in interest income on loans and advances to Kshs 17.1 bn, from Kshs 14.2 bn recorded in Q1’2021, coupled with a 58.7% increase in interest income from government securities to Kshs 9.3 bn, from Kshs 5.9 bn in Q1’2021,
- he Yield on Interest-Earning Assets, however, declined by 0.4% points to 9.9%, from 10.3% in Q1’2021, as the average interest-earning assets grew faster by 32.8% to Kshs 1,018.7 bn, from Kshs 767.2 bn in Q1’2021 compared to the 28.0% increase in trailing interest income,
- Interest expense rose by 32.6% to Kshs 7.3 bn, from Kshs 5.5 bn in Q1’2021, following a 19.2% increase in interest expense on customer deposits to Kshs 5.0 bn, from Kshs 4.2 bn in Q1’2021, coupled with a 67.6% increase in other interest expenses to Kshs 1.8 bn, from Kshs 1.1 bn in Q1’2021. Cost of funds remained relatively unchanged at 2.8%, as recorded in Q1’2021, owing to the 34.9% growth in trailing interest expense, and a 34.4% growth in the average interest-bearing liabilities,
- Net Interest Margin (NIM) however declined to 7.2%, from 7.6% in Q1’2021, attributable to the 32.8% growth in average interest-earning assets, which outpaced the 25.5% growth of trailing Net Interest Income (NII),
- Total operating expenses increased by 14.3% to Kshs 16.0 bn in Q1’2022, from Kshs 14.0 bn recorded in Q1’2021, mainly due to a 42.4% increase in Loans Loss Provision to Kshs 1.8 bn in Q1’2022, from Kshs 1.3 bn recorded in Q1’2021 coupled with a 23.8% increase in staff cost to Kshs 5.0 bn, from Kshs 4.0 bn in Q1’2021. The increased provisioning level points towards more risk aversion as Equity Group’s NPL ratio rose to 9.0% in Q1’2022 from 8.6% in FY’2021 and increased credit risk on the back of the increasing cost of living,
- The balance sheet recorded an expansion as total assets increased by 19.0% to Kshs 1,269.5 bn in Q1’2022, from Kshs 1,066.4 bn recorded in Q1’2021. This growth was largely driven by the 8% growth of the loan book to Kshs 623.6 bn, from Kshs 487.7 bn recorded in Q1’2021, coupled with a 24.9% growth in Government securities to Kshs 233.9 bn in Q1’2022, from Kshs 183.0 bn in Q1’2021,
- Total liabilities rose by 18.3% to Kshs 1,095.3 bn, from Kshs 926.0 bn in Q1’2021, driven by a 14.0% increase in customer deposits to Kshs 900.9 bn, from Kshs 789.9 bn in Q1’2021,
- Deposits per branch increased by 13.7% to Kshs 2.7 bn, from Kshs 2.4 bn in Q1’2021, with the number of branches increasing by 1 to 337 branches in Q1’2022, from 336 in Q1’2021, with Equity Bank Rwanda contributing 1 additional branch,
- Gross Non-Performing Loans (NPLs) reduced by 6.5% to Kshs 59.4 bn in Q1’2022, from Kshs 63.5 bn recorded in Q1’2021. The group’s asset quality improved, with the NPL ratio declining to 9.0% in Q1’2022, from 12.1% recorded in Q1’2021, attributable to the 6.5% decline in Gross Non-Performing Loans (NPLs) coupled with a 26.7% growth in gross loans. The main sectors that contributed to the Non-Performing Loans were Micro-Small and Medium-sized Enterprises (MSMEs) and Agriculture, which contributed 9.1% and 7.6%, respectively. The group’s Tanzanian subsidiary recorded the highest NPL ratio, coming in at 24.7% in Q1’2022, with Equity Bank Kenya recording an NPL ratio of 8.4% in Q1’2022,
- The NPL coverage improved to 66.0%, from 55.5% in Q1’2021 on the back of a 3.0% increase in the general Loan Loss Provisions to Kshs 28.3 bn, from Kshs 27.5 bn in Q1’2021 coupled with the 6.5% decline in the Gross Non-Performing Loans, an indication of sufficient provisioning, and,
- Equity Group is currently sufficiently capitalized with a core capital to risk-weighted assets ratio of 13.9%, 3.4% points above the minimum statutory requirement of 10.5%. In addition, the total capital to risk-weighted assets ratio was 18.7%, exceeding the minimum statutory requirement of 14.5% by 4.2% points. Adjusting for IFRS 9, the core capital to risk-weighted assets stood at 13.9% while total capital to risk-weighted assets came in at 18.7%.
For a comprehensive analysis, please see our Equity Group Q1’2022 Earnings Note
II.Stanbic Group
|
Stanbic Group Q1’2022 Key Highlights |
|||||
|
Balance Sheet |
|||||
|
Balance Sheet Items |
Q1'2021 (Kshs bn) |
Q1'2022 (Kshs bn) |
y/y change |
||
|
Government Securities |
53.8 |
43.9 |
14.6% |
||
|
Total Assets |
317.0 |
331.0 |
4.4% |
||
|
Deposits Per Branch |
8.7 |
9.4 |
7.9% |
||
|
Customer Deposits |
226.6 |
235.1 |
3.7% |
||
|
Total Liabilities |
273.5 |
282.5 |
3.3% |
||
|
Shareholders’ Funds |
43.5 |
48.6 |
11.7% |
||
|
Income Statement |
|||||
|
Income Statement Items |
Q1'2021 (Kshs bn) |
Q1'2022 (Kshs bn) |
y/y change |
||
|
Net interest Income |
3.2 |
3.7 |
16.9% |
||
|
Net non-interest income |
2.8 |
3.0 |
9.6% |
||
|
Total Operating income |
6.0 |
6.8 |
13.5% |
||
|
Loan loss provision |
(0.6) |
(0.5) |
(19.4%) |
||
|
Total Operating expenses |
(3.4) |
(3.8) |
13.4% |
||
|
Profit before tax |
2.6 |
2.9 |
13.7% |
||
|
Profit after tax |
1.9 |
2.1 |
12.0% |
||
|
Key Ratios |
|||||
|
Income Statement Ratios |
Q1’2021 |
Q1’2022 |
% points y/y change |
||
|
Yield from interest-earning assets |
9.3% |
8.7% |
(0.6%) |
||
|
Cost of funding |
3.1% |
2.4% |
(0.7%) |
||
|
Net Interest Margin |
6.1% |
6.3% |
0.2% |
||
|
Net Interest Income as % of operating income |
53.7% |
55.3% |
1.4% |
||
|
Non-Funded Income as a % of operating income |
46.3% |
44.7% |
(1.6%) |
||
|
Cost to Income Ratio |
56.9% |
56.8% |
(0.1%) |
||
|
Cost to Income Ratio without LLP |
46.7% |
49.6% |
2.9% |
||
|
Yield from interest-earning assets |
9.3% |
8.7% |
(0.6%) |
||
|
Cost of funding |
3.1% |
2.4% |
(0.7%) |
||
|
|
Capital Adequacy Ratios |
||||
|
Ratios |
Q1'2021 |
Q1'2022 |
% Points Change |
||
|
Core Capital/Total Liabilities |
18.3% |
18.2% |
(0.1%) |
||
|
Minimum Statutory ratio |
8.0% |
8.0% |
0.0% |
||
|
Excess |
10.3% |
10.2% |
(0.1%) |
||
|
Core Capital/Total Risk Weighted Assets |
15.8% |
14.4% |
(1.4%) |
||
|
Minimum Statutory ratio |
10.5% |
10.5% |
0.0% |
||
|
Excess |
5.3% |
3.9% |
(1.4%) |
||
|
Total Capital/Total Risk Weighted Assets |
17.8% |
16.3% |
(1.5%) |
||
|
Minimum Statutory ratio |
14.5% |
14.5% |
0.0% |
||
|
Excess |
3.3% |
1.8% |
(1.5%) |
||
Key take-outs from the earnings release include;
- Profit after tax increased by 12.0% to Kshs 2.1 bn in Q1’2022, from Kshs 1.9 bn in Q1’2021. The performance was driven by a 13.5% increase in total operating income to Kshs 6.8 bn in Q1’2022, from Kshs 6.0 bn in Q1’2021. The increase was however weighed down by the 13.4% increase in total operating expenses to Kshs 3.8 bn, from Kshs 3.4 bn in Q1’2021,
- The bank’s interest income grew by 9.5% to Kshs 5.3 bn, from Kshs 4.8 bn in Q1’2021 mainly attributable to a 16.0% increase on interest income from loans and advances to Kshs 4.1 bn, from Kshs 3.6 bn in Q1’2021, coupled with a 242.2% growth in interest income from deposits with banking institutions to Kshs 105.4 mn, from Kshs 28.9 mn in Q1’2021. The growth in interest income was however weighed down by a 15.1% decline in interest income from government securities to Kshs 1.0 bn, from Kshs 1.2 bn in Q1’2021,
- The Yield on Interest-Earning Assets (YIEA) decreased to 8.7%, from 9.3% in Q1’2021 following the 11.8% growth in the average interest earning assets, which outpaced the 4.3% increase in trailing interest income,
- Stanbic Bank’s interest expense declined by 5.2% to Kshs 1.5 bn, from Kshs 1.6 bn in Q1’2021, attributable to the bank’s ability to mobilise cheaper deposits with interest expense from customer deposits declining by 0% to Kshs 1.3 bn, from Kshs 1.4 bn in Q1’2021, coupled with a 18.9% decline in interest expenses on Deposits and placements from banking institutions to Kshs 109.3 mn, from Kshs 134.7 mn in Q1’2021. Cost of funds, on the other hand, declined to 2.4%, from 3.1% in Q1’2021, owing to the 16.8% decline in trailing interest expense, coupled with the 4.9% increase in average interest bearing liabilities,
- Net Interest Margin increased to 6.3%, from 6.1% in Q1’2021 on the back of the 15.2% increase in the trailing Net Interest Income to Kshs 14.9 bn from Kshs 12.9 bn in Q1’2021, which outpaced the 11.8% increase in average interest earning assets to Kshs 8 bn in Q1’2022 from Kshs 212.6 bn in Q1’2021,
- Total Operating Expenses increased by 13.4% to Kshs 3.8 bn in Q1’2022, from Kshs 3.4 bn in Q1’2021, attributable to an 27.9% increase in the bank’s staff costs to Kshs 1.7 bn in Q1’2022, from Kshs 1.3 bn recorded in Q3’2020 coupled with a 14.0% increase in other expenses to Kshs 1.7 bn, from Kshs 1.5 bn in Q1’2021. The increase in total operating expenses was however mitigated by a 19.4% decline in Loan Loss Provisions (LLP) to Kshs 0.5 bn in Q1’2022, from Kshs 0.6 bn in Q1’2021,
- Cost to income ratio with LLP improved slightly to 56.8%, from 56.9% in Q1’2021, attributable to the 13.5% increase in in total operating income, which outpaced the 13.4% increase in total operating expenses. On the other hand, without LLP, the Cost to income ratio deteriorated to 49.6% in Q1’2022, from 46.7% in Q1’2021, pointing towards deteriorating efficiency in the bank,
- The balance sheet recorded an expansion as total assets grew by 4.4% to Kshs 331.0 bn, from Kshs 317.0 bn in Q1’2021. The increase was largely driven by a 30.7% increase in net loans to Kshs 206.5 bn, from Kshs 158.0 bn in Q1’2021, as Stanbic focused more on lending in Q1’2022 due to an improvement in the business environment as evidenced by the 19.4% reduction in the group’s Loan Loss Provisions (LLPs). The increase was however weighed down by a 14.6% decline in investment securities to Kshs 45.9 bn, from Kshs 53.8 bn in Q1’2021,
- Total liabilities increased by 3.3% to Kshs 282.5 bn, from Kshs 273.5 bn in Q1’2021, largely driven by a 3.7% increase in the bank’s deposits to Kshs 235.1 bn, from Kshs 226.6 bn in Q1’2021 coupled with a 23.1% increase in borrowings to Kshs 12.2 bn from Kshs 9.9 bn in Q1’2021,
- Deposits per branch increased by 7.9% to Kshs 9.4 bn, from Kshs 8.7 bn in Q1’2021, as the number of branches decreased to 25,from 26 in Q1’2021,
- The bank’s Gross Non-Performing Loans (NPLs) declined by 7.1% to Kshs 24.6 bn, from Kshs 26.4bn in Q1’2021, taking the NPL ratio to 11.1% in Q1’2022, from 15.1% in Q1’2021. The improvement in the group’s asset quality is attributable to the 7.1% decline in Gross Non-Performing Loans (NPLs) coupled with the 26.4% increase in Gross Loans,
- General Loan Loss Provisions declined by 11.0% to Kshs 9.8 bn, from Kshs 11.0 bn in Q1’2021. Consequently, the NPL coverage ratio declined to 59.1% in Q1’2022, from 63.9% in Q1’2021, an indication of reduced provisioning levels by the bank partly attributable to the lower NPL levels, and,
- Stanbic Bank is currently sufficiently capitalized with a core capital to risk weighted assets ratio of 14.4%, 3.9% points above the statutory requirement of 10.5%. In addition, the total capital to risk weighted assets ratio stood at 16.3%, exceeding the statutory requirement of 14.5% by 1.8% points. Adjusting for IFRS 9, core capital to risk weighted assets ratio was at 14.4% while total capital to risk weighted assets came in at 16.3%.
For a comprehensive analysis, please see our Stanbic Group Q1’2022 Earnings Note
III.Housing Finance (HF Group)
|
HF Group Q1’2022 Key Highlights |
|||||
|
Balance Sheet |
|||||
|
Balance Sheet Items |
Q1'2021 (Kshs bn) |
Q1'2022 (Kshs bn) |
y/y change |
||
|
Net Loans and Advances |
35.8 |
34.8 |
(2.7%) |
||
|
Total Assets |
53.9 |
54.3 |
0.7% |
||
|
Customer Deposits |
37.2 |
38.4 |
3.1% |
||
|
Deposits per Branch |
37.2 |
38.4 |
3.1% |
||
|
Total Liabilities |
45.7 |
46.4 |
1.7% |
||
|
Shareholders’ Funds |
8.3 |
7.9 |
(5.0%) |
||
|
Income Statement |
|||||
|
Income Statement Items |
Q1'2021 (Kshs bn) |
Q1'2022 (Kshs bn) |
y/y change |
||
|
Net Interest Income |
0.5 |
0.5 |
9.7% |
||
|
Net non-Interest Income |
0.1 |
0.3 |
87.2% |
||
|
Total Operating income |
0.6 |
0.8 |
26.8% |
||
|
Loan Loss provision |
(0.1) |
(0.1) |
(24.3%) |
||
|
Total Operating expenses |
(0.8) |
(0.7) |
(6.8%) |
||
|
Profit before tax |
(0.2) |
0.04 |
(121.9%) |
||
|
Profit after tax |
(0.2) |
0.03 |
117.8% |
||
|
Core EPS |
(0.5) |
0.1 |
117.8% |
||
|
Key Ratios |
|||||
|
Income Statement Ratios |
Q1’2021 |
Q1’2022 |
% points y/y change |
||
|
Yield from interest-earning assets |
9.3% |
9.2% |
(0.1%) |
||
|
Cost of funding |
5.1% |
4.7% |
(0.4%) |
||
|
Net Interest Spread |
4.4% |
4.5% |
0.1% |
||
|
Net Interest Margin |
4.3% |
4.4% |
0.1% |
||
|
Cost of Risk |
12.2% |
7.3% |
(4.9%) |
||
|
Net Interest Income as % of operating income |
77.8% |
67.3% |
(10.5%) |
||
|
Non-Funded Income as a % of operating income |
22.2% |
32.7% |
10.5% |
||
|
Cost to Income Ratio |
129.3% |
94.9% |
(34.3%) |
||
|
|
Capital Adequacy Ratios |
||||
|
Ratios |
Q1'2021 |
Q1'2022 |
% Points Change |
||
|
Core Capital/Total Liabilities |
9.2% |
8.0% |
(1.2%) |
||
|
Minimum Statutory ratio |
8.0% |
8.0% |
0.0% |
||
|
Excess |
1.2% |
0.0% |
(1.2%) |
||
|
Core Capital/Total Risk Weighted Assets |
8.1% |
8.2% |
0.1% |
||
|
Minimum Statutory ratio |
10.5% |
10.5% |
0.0% |
||
|
Excess |
(2.4%) |
(2.3%) |
0.1% |
||
|
Total Capital/Total Risk Weighted Assets |
11.6% |
12.1% |
0.5% |
||
|
Minimum Statutory ratio |
14.5% |
14.5% |
0.0% |
||
|
Excess |
(2.9%) |
(2.4%) |
0.5% |
||
Key take-outs from the earnings release include;
- HF Group recorded a profit per share of Kshs 0.1 in Q1’2022, up from the loss per share of Kshs 0.5 recorded in Q1’2021, not in-line with our expectations of a Kshs 0.4 loss per share. The performance of the group can be attributed to a 26.8% increase in total operating income to Kshs 0.8 bn, from Kshs 0.6 bn in Q1’2021, coupled with a 6.8% decline in total operating expenses to Kshs 0.7 bn, from Kshs 0.8 bn in Q1’2021,
- Interest income increased by 1.1% to Kshs 1.02 bn, from Kshs 1.01 bn in Q1’2021, driven by a 22.6% increase in interest income from Government securities to Kshs 197.7 mn, from Kshs 161.3 mn in Q1’2021, coupled with a 14.6% increase in interest income from placements with other banks to Kshs 4.9 mn from Kshs 4.3 mn in Q1’2021. The growth was however weighed down by a 3.1% decline in interest income on loans and advances to Kshs 820.7 mn, from Kshs 846.8 mn in Q1’2021,
- The Yield on Interest-Earning Assets declined marginally to 9.2%, from 9.3% in Q1’2021, due to faster 6.5% decline in trailing interest income compared to the 1.4% decline in the average interest-earning assets (IEA). Interest expense declined by 6.5% to Kshs 520.1 mn, from Kshs 538.1 mn in Q1’2021, attributable to the bank’s ability to mobilise cheaper deposits with interest expense from customer deposits declining by 5.3% to Kshs 367.1 mn, from Kshs 387.7 mn in Q1’2021 coupled with a 38.3% decline in interest expenses from placements from banking institutions to Kshs 36.8 mn, from Kshs 59.7 mn recorded in Q1’2021. Cost of funds declined to 4.7%, from 5.1% as recorded in Q1’2021 attributable to the faster 31.8% decline in interest expense, as compared to the 0.6% decline in average interest bearing liabilities,
- Net Interest Margin (NIM) increased to 4.4%, from 4.1% recorded in Q1’2021,
- Total Operating Expenses declined by 6.8% to Kshs 772.8 mn in Q1’2022, from Kshs 609.3 mn in Q1’2021, partly attributable to a 24.4% decline in Loans Loss Provisions (LLPs) to Kshs 56.4 mn in Q1’2022, from Kshs 74.6 mn recorded in Q1’2021, attributable to the reduced credit risk on the back of increased business activity in Q1’2022. Other operating expenses declined by 17.5% to Kshs 368.5 mn in Q1’2022, from Kshs 446.9 mn in Q1’2021. On the other hand, staff costs increased by 16.0% to Kshs 308.8 mn in Q1’2022, from Kshs 266.2 mn in Q1’2021,
- The balance sheet recorded an expansion as Total Assets increased by 0.7% to Kshs 54.3 bn in Q1’2022, from Kshs 53.9 bn recorded in Q1’2021. This is attributable to a 26.5% increase in Government securities to Kshs 7.2 bn, from Kshs 7.7 bn in Q1’2021, coupled with a 47.6% increase in placements with other banking institutions to Kshs 1.2 bn, from Kshs 0.8 bn. The increases were however weighed down by a 2.7% decline in the loan book to Kshs 34.8 bn, from Kshs 35.8 bn recorded in Q1’2021,
- Total liabilities increased by 1.7% to Kshs 46.4 bn in Q1’2022, from Kshs 45.7 bn in Q1’2021, driven by a 3.1% increase in customer deposits to Kshs 38.4 bn in Q1’2022, from Kshs 37.2 bn in Q1’2021.
- Deposits per branch increased by 1.7% to Kshs 1.74 bn, from Kshs 1.69 bn in Q1’2021, with the number of branches remaining unchanged at 22,
- Deposits increased by 3.1%, compared to the 2.7% decrease in loans leading to a decline in the loan to deposit ratio to 90.8%, from 96.2% in Q1’2021,
- Gross non-performing loans (NPLs) declined by 19.8% to Kshs 8.4 bn, from Kshs 10.5 bn recorded in Q1’2021. Consequently, the NPL ratio improved to 20.5% from the 24.7% recorded in Q1’2021, following the faster 19.8% decline in NPLs that outpaced the 3.2% decline in gross loans which came in at Kshs 41.2 bn in Q1’2022, from Kshs 42.6 bn recorded in Q1’2021,
- General loan loss provisions increased by 1.4% to Kshs 3.7 bn in Q1’2022, from Kshs 3.6 bn recorded in Q1’2021. The NPL coverage thus improved to 76.1% in Q1’2022, from 64.7% in Q1’2021 owing to the 19.7% increase in gross NPLs coupled with the slight 0.1% increase in general loan loss provisions, and,
- HF Group remains undercapitalized with a core capital to risk-weighted assets ratio of 8.2%, 2.3% points below the statutory requirement of 10.5%. In addition, the total capital to risk-weighted assets ratio came in at 12.1%, below the statutory requirement by 2.4% points. Adjusting for IFRS 9, the core capital to risk-weighted assets stood at 8.4%, while total capital to risk-weighted assets came in at 12.3%.
For a comprehensive analysis, please see our HF Group Q1’2022 Earnings Note
Asset Quality
The table below is a summary of the asset quality for the banks that have released
|
|
Q1'2021 NPL Ratio** |
Q1'2022 NPL Ratio* |
Q1'2021 NPL Coverage** |
Q1'2022 NPL Coverage* |
% point change in NPL Ratio |
% point change in NPL Coverage |
|
Equity Group |
12.1% |
9.0% |
55.0% |
66.0% |
(3.1%) |
11.0% |
|
NCBA Group |
14.7% |
16.3% |
65.0% |
72.6% |
1.6% |
7.6% |
|
Stanbic Bank |
15.1% |
11.1% |
63.9% |
59.1% |
(4.0%) |
(4.8%) |
|
HF Group |
24.7% |
20.5% |
64.7% |
76.1% |
(4.2%) |
11.4% |
|
Mkt Weighted Average |
13.1% |
10.6% |
58.2% |
66.1% |
(2.5%) |
7.9% |
|
*Market cap weighted as at 13/05/2022 |
||||||
|
**Market cap weighted as at 08/06/2021 |
||||||
Key take-outs from the table include;
- Asset quality for the listed banks that have released their Q1’2022 results improved during the period, with the weighted average NPL ratio declining by 2.5% points to a market cap weighted average of 10.6%, from an average of 13.1% for the listed banking sector in Q1’2021. The improvement in asset quality is attributable to declining credit risk on the back of increased business activities in the period driven by the gradual economic recovery, and,
- NPL Coverage for the listed banks increased to a market cap weighted average of 66.1% in Q1’2022, from 58.2% recorded in Q1’2021, as the banks increased their provisioning levels to proactively manage risks brought about by the emergence of new COVID-19 variants coupled with the slow recovery of some sectors such as tourism, agriculture and manufacturing.
Summary Performance
The table below highlights the performance of the banks that have released so far, showing the performance using several metrics, and the key take-outs of the performance;
|
Bank |
Core EPS Growth |
Interest Income Growth |
Interest Expense Growth |
Net Interest Income Growth |
Net Interest Margin |
Non-Funded Income Growth |
NFI to Total Operating Income |
Growth in Total Fees & Commissions |
Deposit Growth |
Growth in Government Securities |
Loan to Deposit Ratio |
Loan Growth |
Return on Average Equity |
|
Equity Group |
36.0% |
31.1% |
32.6% |
30.6% |
7.2% |
9.7% |
21.7% |
21.7% |
14.0% |
24.9% |
69.2% |
27.8% |
28.7% |
|
NCBA Group |
20.3% |
10.4% |
14.9% |
7.6% |
5.8% |
15.5% |
11.1% |
0.0% |
7.2% |
22.6% |
52.4% |
0.3% |
14.0% |
|
Stanbic Holdings |
12.0% |
9.5% |
(5.2%) |
16.9% |
6.3% |
9.6% |
13.5% |
21.8% |
3.7% |
(14.6%) |
87.8% |
30.7% |
21.6% |
|
HF Group |
117.8% |
1.1% |
(6.5%) |
9.7% |
4.4% |
87.2% |
26.8% |
44.1% |
3.1% |
26.5% |
90.8% |
(2.7%) |
(4.5%) |
|
Q1'22 Mkt Weighted Average* |
29.9% |
24.0% |
23.4% |
24.4% |
6.8% |
11.0% |
18.6% |
18.1% |
11.2% |
18.3% |
69.4% |
23.5% |
24.9% |
|
Q1'21 Mkt Weighted Average** |
28.4% |
14.7% |
12.7% |
17.5% |
7.4% |
2.9% |
35.3% |
(2.4%) |
21.8% |
20.3% |
69.2% |
11.0% |
13.8% |
|
*Market cap weighted as at 13/05/2022 |
|||||||||||||
|
**Market cap weighted as at 08/06/2021 |
|||||||||||||
Key takeaways from the table above include:
- The listed banks that have released recorded a 29.9% weighted average growth in core Earnings per Share (EPS), compared to a weighted average increase of 28.4% in Q1’2021 for the listed banking sector,
- The Banks have recorded a weighted average deposit growth of 11.2%, slower than the 21.8% growth recorded in Q1’2021, an indication of reduced investment risk in the business environment,
- Interest income grew by 24.0%, compared to a growth of 14.7% recorded in Q1’2021 while the weighted average Yield on Interest Earning Assets (YIEA) decreased to 8.5%, from the 9.5% recorded in Q1’2021 for the listed banking sector. Consequently, the Net Interest Margin (NIM) now stands at 6.8%, 0.6% points lower than the 7.4% recorded in Q1’2021 for the whole listed banking sector, and,
- Non-Funded Income grew by 11.0%, compared to the 2.9% growth recorded in Q1’2022. This can be attributable to the faster growth in the fees and commission which grew by 18.1% compared to a decline of 2.4% in Q1’2021, following the expiry of the waiver on fees on mobile transactions.
Cytonn coverage:
|
Company |
Price as at 06/05/2022 |
Price as at 13/05/2022 |
w/w change |
YTD Change |
Year Open 2022 |
Target Price* |
Dividend Yield |
Upside/ Downside** |
P/TBv Multiple |
Recommendation |
|
I&M Group*** |
18.0 |
18.0 |
(0.3%) |
(16.1%) |
21.4 |
25.4 |
8.4% |
49.7% |
0.5x |
Buy |
|
ABSA Bank*** |
9.9 |
9.7 |
(2.4%) |
(17.4%) |
11.8 |
13.4 |
11.3% |
49.7% |
1.0x |
Buy |
|
KCB Group*** |
36.3 |
35.8 |
(1.4%) |
(21.5%) |
45.6 |
50.5 |
8.4% |
49.7% |
0.7x |
Buy |
|
Jubilee Holdings |
265.0 |
265.0 |
0.0% |
(16.3%) |
316.8 |
381.7 |
5.3% |
49.3% |
0.5x |
Buy |
|
Kenya Reinsurance |
2.2 |
2.2 |
1.8% |
(3.1%) |
2.3 |
3.2 |
4.5% |
47.7% |
0.2x |
Buy |
|
Liberty Holdings |
5.8 |
5.7 |
(1.7%) |
(19.3%) |
7.1 |
7.7 |
0.0% |
34.4% |
0.4x |
Buy |
|
Equity Group*** |
47.2 |
45.5 |
(3.5%) |
(13.7%) |
52.8 |
56.2 |
6.6% |
30.0% |
1.2x |
Buy |
|
Standard Chartered*** |
124.8 |
124.8 |
0.0% |
(4.0%) |
130.0 |
147.1 |
11.2% |
29.1% |
1.0x |
Buy |
|
Diamond Trust Bank*** |
55.0 |
53.8 |
(2.3%) |
(9.7%) |
59.5 |
65.6 |
5.6% |
27.6% |
0.2x |
Buy |
|
Co-op Bank*** |
12.4 |
12.3 |
(0.8%) |
(5.8%) |
13.0 |
14.6 |
8.2% |
27.3% |
0.9x |
Buy |
|
NCBA*** |
25.0 |
26.5 |
6.2% |
4.1% |
25.5 |
28.2 |
11.3% |
17.7% |
0.6x |
Accumulate |
|
Britam |
6.7 |
6.7 |
0.3% |
(11.1%) |
7.6 |
7.9 |
0.0% |
17.2% |
1.1x |
Accumulate |
|
Stanbic Holdings |
105.5 |
103.3 |
(2.1%) |
18.7% |
87.0 |
107.2 |
8.7% |
12.5% |
0.9x |
Accumulate |
|
CIC Group |
2.2 |
2.1 |
(3.7%) |
(3.2%) |
2.2 |
1.9 |
0.0% |
(10.3%) |
0.7x |
Sell |
|
HF Group |
3.0 |
3.0 |
(1.3%) |
(21.3%) |
3.8 |
2.5 |
0.0% |
(17.4%) |
0.2x |
Sell |
|
Sanlam |
12.9 |
14.9 |
15.1% |
28.6% |
11.6 |
12.1 |
0.0% |
(18.8%) |
1.6x |
Sell |
|
*Target Price as per Cytonn Analyst estimates **Upside/ (Downside) is adjusted for Dividend Yield ***For Disclosure, these are stocks in which Cytonn and/or its affiliates are invested in |
||||||||||
We are “Neutral” on the Equities markets in the short term. With the market currently trading at a fair value to its future growth (PEG Ratio at 1.0x), we believe that investors should reposition towards value stocks with strong earnings growth and that are trading at discounts to their intrinsic value. We expect the discovery of new COVID-19 variants, the upcoming Kenyan general elections and the slow vaccine rollout to continue weighing down the economic outlook. On the upside, we believe that the relaxation of COVID-19 containment measures in the country will lead to improved investor sentiments.
I. Industry Report
During the week, Hass Consult, a Real Estate Development and Consulting firm, released their House Price Index Q1’2022, a report highlighting the performance of Nairobi Metropolitan Area’s (NMA) Real Estate residential sector. The following were the key take outs;
- The average q/q selling prices for houses increased by 2.8% in Q1’2022 compared to a 3.0% increase in FY’2021, while on a y/y basis, the average selling prices appreciated by 6.8% compared to a (0.7%) price correction that was recorded in Q1’2021. The increase in performance was mainly driven by an increase in the selling prices for detached units which came in at 4.3% q/q and 11.8% y/y,
- In the Nairobi Suburbs, Spring Valley was the best performing node having recorded a capital appreciation of 4.2% q/q, due to the presence of adequate infrastructure coupled with its serene environment driving demand for housing units. On the other hand, apartments in Kileleshwa recorded the highest price correction of 3.9%, following reduced uptake as clients preferred renting of apartments in the area rather than buying,
- In the satellite towns, houses in Ngong recorded the highest q/q price appreciation at 6.0% driven by increased demand resulting from a growing middle income population in the area. Apartments in Athi River realized the highest price correction of 3.0% resulting from tenants preference to renting of the units rather than buying,
- The overall asking rents in the NMA slightly increased by 1.0% q/q and 2.4% y/y, compared to a 0.2% q/q and 2.7% y/y growth recorded at the end of 2021, as a result of a gradual increase in the overall demand for units and rents. Apartments recorded the highest increase in asking rents of 2.2% q/q compared to detached units at 0.7% q/q, as majority of tenants prefer renting of apartments due to affordability,
- In the Nairobi suburbs, houses in both Muthaiga and Loresho realized the highest q/q rent appreciations of 2.1%. This was attributed to the presence of adequate infrastructure and amenities enhancing investments, coupled with Muthaiga’s close proximity to Nairobi’s Central Business District thus being attractive to tenants. On the other hand, houses in Westlands realized the highest rental rates decline by 2.7% as a result of declined demand for rental units, and,
- For the satellite towns, houses in Athi River realized the highest rental rate increase by 7.2% during the quarter due to increased demand resulting driven by increasing infrastructure developments such as the Nairobi Expressway promoting investments. Conversely, houses Kiambu town recorded the highest rental rates declines of 3.1% resulting from competition from apartments which were more preferred by tenants (who majority are the young generation), due to affordability.
The findings of the report are in line with our Cytonn Q1’2022 Markets Review, which highlighted that the average y/y price appreciation and rental yield for houses in the NMA increased by 0.4% and 0.1% points, to 0.9% and 4.8% in Q1’2022, respectively, from the 0.5% and 4.7% that was recorded in Q1’2021, respectively. The improvement in performance was as a result of improved rates amidst an improved economic environment.
Hass Consult also released the Land Price Index Q1’2022, a report highlighting the performance of Real Estate land sector in the Nairobi Metropolitan Area (NMA). The following were the key take outs from the report;
- The average q/q and y/y selling prices for land in the Nairobi suburbs appreciated by 0.1% and 1.1%, respectively, whereas the average q/q and y/y selling prices for land in the satellite towns of Nairobi increased by 2.2% and 7.4%, respectively,
- Muthaiga was the best performing node in the Nairobi suburbs with a q/q and y/y price appreciation of 3.1% and 6.5%, respectively, attributed to increased demand for land in the area that resulted from; close proximity to Nairobi CBD, adequate infrastructure such as the Thika Superhighway, serene environment as it is also surrounded by areas such as Ridgeways and Parklands, and, availability of amenities such as Muthaiga Shopping Mall. On the other hand, Upperhill recorded the highest price correction of 1.5% due to a declined demand resulting from land in the area being expensive, as an acre in Upper hill is currently averaging at Kshs 483.1 mn, 17.8% higher than the NMA commercial zones market average of Kshs 410.1 mn per acre, and,
- For satellite towns, Juja was the best performing node with a q/q and y/y capital appreciation of 4.6% and 17.0%, respectively, attributed to increased demand for development land particularly for student housing facilities as the area is largely inhabited by students from institutions such as the Jomo Kenyatta University of Agriculture and Technology. On the other hand, Limuru was the worst performing node with a price correction of 6.1% driven by low demand for land in the area, given that it is relatively far from Nairobi.
The findings of the report are also in line with our Cytonn Q1’2022 Markets Review, which highlighted that the average selling prices for land in the NMA appreciated by 2.4%. This was mainly attributed to; i) positive demographics driving demand for land, ii) improved development of infrastructure such as roads, railways, water and sewer lines, iii) proximity to amenities such as shopping malls, and, iv) increased construction activities particularly in the residential sector thus fueling demand for land.
Overall, we expect the Kenyan Real Estate sector to continue realizing improvements in its performance driven by; i) increased housing construction activities aimed at fulfilling the demand for housing, as Kenya’s housing deficit currently stands at 2.0 mn units and growing by 200,000 units p.a, and, ii) infrastructure development boosting property prices. However, challenges such as financial constraints, and, inadequate infrastructure in some parts of the country, continues to weigh down the performance of the sector.
ii. Commercial Office Sector
During the week, CCI Group, an international contact centre operator in Africa, announced plans to develop a purpose-built state of the art office facility in Ruiru’s Tatu City. The five-story facility which will be developed by Gateway Real Estate Africa (GREA), a private development company specializing in turnkey construction, is expected to be completed by December 2023, and will consist of training facilities and a career centre. This comes barely five months after CCI in collaboration with Max International Company took up approximately 60.0% of the 270,000 SQFT space at Garden City Business Park, signifying CCI’s expansion appetite in the Kenyan Real Estate market. CCI’s choice to maintain Thika Road as its location of establishment is mainly driven by the ecosystem in Tatu City which incorporates the live, work and play aspects, thus ideal for CCI operations, as the firm is also aiming at increasing its capacity to over 4,000 employees. Moreover, the investment decision is also driven by factors such as; adequate road network in the area which is serviced by roads like Thika Superhighway and Eastern Bypass, and, the presence of adequate amenities such as Malls.
In terms of performance, our Cytonn Q1’2022 Markets Review highlights that the Nairobi Metropolitan Area commercial office sector retained its average rental yields and asking rents at 7.3% and Kshs 94 per SQFT, respectively, in Q1’2022. The overall occupancy rates increased by 0.3% points to 77.9% in the period of focus due to an increased demand for office spaces, as various firms resume full operations at the beginning of the year as well. The table below highlights the performance of the Nairobi Metropolitan Area (NMA) Commercial Office sector over time:
(All values in Kshs unless stated otherwise)
|
Nairobi Metropolitan Area (NMA) Commercial Office Returns Over Time |
||||||
|
Year |
Q1'2021 |
H1'2021 |
Q3'2021 |
FY'2021 |
Q1'2022 |
∆ FY'2021/ Q1'2022 |
|
Occupancy % |
76.3% |
75.8% |
79.9% |
77.6% |
77.9% |
0.3% |
|
Asking Rents (Kshs) /SQFT |
92 |
93 |
94 |
94 |
94 |
0.0% |
|
Average Prices (Kshs) /SQFT |
12,228 |
12,224 |
12,479 |
12,106 |
12,113 |
0.2% |
|
Average Rental Yields (%) |
6.8% |
6.9% |
7.2% |
7.3% |
7.3% |
0.0% |
Source: Cytonn Research 2022
We expect the sector’s performance to continue recording gradual expansion activities and overall performance. However, the existing oversupply of office spaces in the Nairobi Metropolitan Area at 6.7 mn SQFT continues to weigh down the overall performance of the sector.
III. Retail Sector
During the week, ChicKing, an international fast food chain, in partnership with M/s Crispy Limited, a local franchise, announced plans to open 30 new outlets in Kenya, over the next five years. The Dubai-based restaurant chain that specializes in fried chicken, is expected to begin its expansion plans by opening two new outlets in Mombasa County, in June 2022. This will mark its official entry into the Kenyan Real Estate retail market, in addition to having plans to open two more outlets in Nairobi County by the end of the year. Currently, ChicKing operates 230 outlets across 27 countries globally including; Ireland, Indonesia, India, Hungary, the Maldives, Egypt, Oman, Saudi Arabia, and, United Kingdom, among others. The move to open the 30 new stores in Kenya is driven by:
- Recognition of Nairobi as a regional hub thus in turn attracting foreign investments in the country,
- Positive demographics evidenced by Kenya’s high urbanization and growth rates currently at 4.0% and 2.3%, respectively, compared to the world’s 1.8% and 1.0%, respectively, according to the World Bank,
- Rapid economic growth, evidenced by Kenya’s GDP growth of by 7.5% in 2021, according to the Economic Survey 2022 by the Kenya Bureau of Statistics, compared to Sub-Saharan African region growth of 4.0% in 2021 and,
- Need to step up resulting from increased competition from global fast food chains in Kenya such as Subway, Kentucky Fried Chicken (KFC), Burger King, and, Eat’N’Go, among other international players. Eat’N’Go Limited recently opened a new outlet in Westlands Square, Nairobi, bringing its total operating outlets in Nairobi to 9 and plan to open a total 100 new stores in Kenya.
In terms of performance, according to our Kenya Retail Report 2021, the Kenyan retail sector recorded 0.1% points increase in the average rental yield to 6.8%, from 6.7% in 2020. Average occupancy rates and rental rates also realized an increase of 1.8% points and 2.2%, respectively, to 78.4% and Kshs 118 per SQFT in 2021 from 76.6% and Kshs 115 per SQFT in 2020, respectively. This was mainly driven by an improved business environment, coupled with retailers’ aggressive expansion drive. The gradual improvement in the performance of the sector also affirms ChicKing’s decision to invest in Kenya. The performance of the key urban centers in Kenya is as summarized below:
|
Summary of Retail Performance in Key Urban Cities in Kenya 2021 |
||||||
|
Region |
Rent (Kshs) 2021 |
Occupancy Rate 2021 |
Rental yield 2021 |
Rent (Kshs) 2020 |
Occupancy Rate 2020 |
Rental yield 2020 |
|
Mount Kenya |
128 |
81.7% |
7.9% |
125 |
78.0% |
7.7% |
|
Nairobi |
168 |
75.8% |
7.5% |
169 |
74.5% |
7.5% |
|
Mombasa |
119 |
77.6% |
6.8% |
114 |
76.3% |
6.6% |
|
Kisumu |
101 |
74.6% |
6.4% |
97 |
74.0% |
6.3% |
|
Eldoret |
131 |
80.8% |
6.3% |
130 |
80.2% |
5.9% |
|
Nakuru |
59 |
80.0% |
6.1% |
58 |
76.6% |
5.9% |
|
Average |
118 |
78.4% |
6.8% |
115 |
76.6% |
6.7% |
Source: Cytonn Research
Retail sector performance in Kenya continues to be shaped by the aggressive expansion by both local and international retailers. We therefore expect the trend to continue being witnessed in the sector as a result of; i) positive demographics, ii) infrastructure developments driving investments in various parts of the country, iii) rapid foreign investments resulting from Kenya’s recognition as a regional hub globally, and, iv) favorable business environment as Kenya also currently ranks position 56 worldwide in terms of ease of doing business according to World Bank. Conversely, there exists challenges that hinder the optimum performance of the sector such as e-commerce, and, the current oversupply of retail spaces in Kenya at 1.7 mn SQFT, and NMA at 3.0 mn SQFT.
IV. Hospitality Sector
During the week, Radisson Blu, an international hotel chain, resumed its operations in Nairobi’s Upperhill, after having been shut down for 16 months. As per our Cytonn Weekly #12/2022, the global five-star hotel consisting of 271 rooms was shut down in December 2020 amidst the presence of the pandemic, which led to reduced bookings and an overall decline in the performance of the hotel. This therefore makes Radisson Blu the second five-star hotel to resume operations in the country, after Norfolk hotel which reopened in April 2022. Kenya’s hospitality sector continues to realize improvement in performance as a result of the ease of pandemic restrictions, and also after having been one of the worst hit economic sectors in the country by the pandemic. We therefore expect a similar trend to continue being witnessed in the sector attributed to various factors such as: i) increased tourism arrivals and activities, ii) roll out of COVID-19 vaccine thereby boosting confidence in the sector, and, iii) aggressive marketing of the tourism sector through the Magical Kenya Platform, and, Kenya Tourism Board platforms.
V. Infrastructure Sector
During the week, China Road and Bridge Corporation (CRBC) was awarded a Kshs 9.0 bn tender to rehabilitate the lower section of the 27.1 Km Nairobi Expressway. CRBC was also the contractor for construction of the recently completed Nairobi Expressway under a Public Private Partnership model with Kenyan National government. Currently, the construction of the lower section of the road linking Mlolongo to Westlands, and whose financing will be done by Kenyan government, has already commenced. Upon its completion it will further boost seamless transport services, enhance the beauty of the double deck road, and, promote Real Estate investments by boosting of property prices.
Kenya’s infrastructure sector continues to witness rapid developments aimed at improving the economy’s performance. This is evidenced by the numerous ongoing and completed projects in the country resulting from government’s continued focus on the same. We therefore expect a similar trend in the sector with some of the projects in pipeline being: Nairobi Commuter Rail project, the Nairobi Western Bypass, Athi River-Mlolongo-Mombasa exit, and, the Eastern Bypass project, among many others. Additionally, the government plans to increase budgetary allocation to the infrastructure sector by 16.4% to 212.5 bn in FY’2022/23 from Kshs 182.5 bn in FY’2021/2022 according to the proposed FY’2022/23 Budget Estimates, highlighting that infrastructure remains a priority area for the current government. The graph below shows the budget allocation to the transport sector over last five financial years;
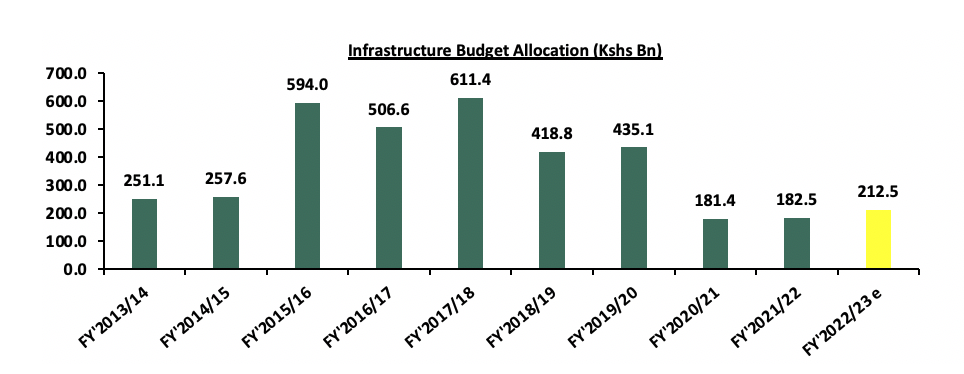
Source: National Treasury of Kenya
VI. Real Estate Investment Trusts (REITS)
In the Nairobi Stock Exchange, ILAM Fahari I-Reit closed the week trading at an average price of Kshs 5.7 per share. This represented a 1.8% and 10.9% Week-to-Date (WTD) and Year-to-Date (YTD) decline respectively, from Kshs 5.8 per share and Kshs 6.4 per share, respectively. Also, on Inception-to-Date (ITD) basis, the REIT’s performance continues to be weighed down having realized a 71.5% decline from Kshs 20.0. The graph below shows Fahari I-REIT’s performance from November 2015 to 13th May 2022:
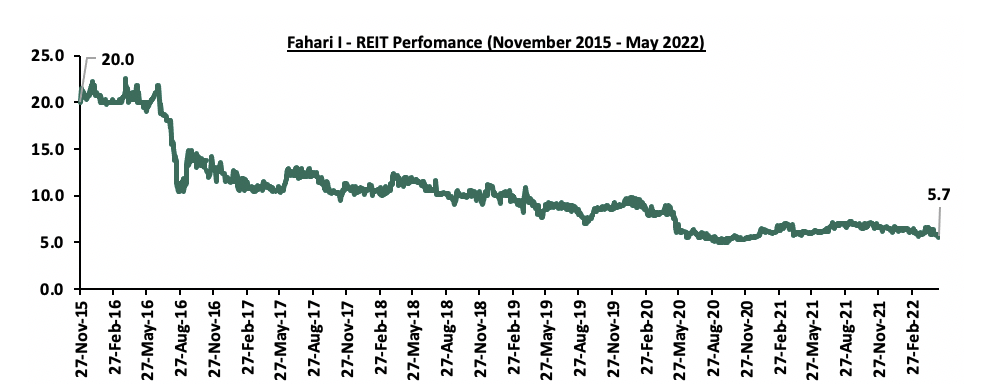
We expect Kenya’s property market to be on an upward trajectory driven by increased construction activities in the housing sector, increased expansion and development activities in the commercial office sector, aggressive expansion in the retail sector, improvement in the performance of the hospitality sector, rapid infrastructure developments, and, increasing demand for development land. However, setbacks such as financial constraints, and, investor’s minimal appetite for the REIT instrument is expected to continue weighing down the overall performance of the property sector.
In 2022, the Kenyan shilling has continued with the depreciation trend experienced in 2021 and 2020, with the Kenyan shilling depreciating by 2.6% against the US Dollar (USD) to Kshs 116.1 as of 13th May 2022, from Kshs 113.1 recorded on 3rd January 2022. Key to note, this the lowest the Kenyan shilling has ever traded against the USD. The poor performance of the shilling is mainly attributable to the increased dollar demand by energy and general importers, with Kenya largely being a net importer. Global oil prices have also increased during the year, attributable to the persisting supply chain constraints following the COVID-19 pandemic, worsened by the current global geopolitical tensions following the Russia-Ukraine conflict, coupled with the reopening of economies globally, which has seen demand outpace fuel supply, further inflating the country’s import bill and consequently weakening the shilling. Additionally, Kenya has seen affirmation of its Long-Term Foreign-Currency Issuer Default Rating (IDR) at 'B+' with a Negative Outlook by Fitch Ratings, unchanged from the last review in 2021 as a result of the currency depreciation, increasing inflation and the risks arising from the upcoming August 2022 general elections. As a result, this week we shall be focusing in detail the factors that are expected to drive the performance of the Kenya shilling and thereafter give our outlook for 2022.
We have previously released Currency outlook in 2020 and 2021 as summarized below;
- In May 2021, we released the Currency and Interest Rates Outlook – 2021 when Kenya had seen its sovereign rating downgraded by all the major rating agencies; Standard & Poor’s , Fitch Rating and Moody’s. The lowering of the credit rating was mainly on the back of Kenya’s high fiscal deficit coupled with the economic shocks occasioned by the challenges brought about from the impact of the COVID-19 pandemic. Our outlook was a 0.6% appreciation on account of gradual improvement in the export sector as Kenya’s trading partners continued to reopen their economies and stable forex reserves on the back of increasing diaspora remittance inflows, continued investor capital inflows and debt relief from other institutions.
- In our Currency and Interest Rates Outlook topical which was covered in May 2020, our outlook on the currency was a 5.5% depreciation by the end of 2020, driven by the reduced exports earning due to the lockdown measures put in place by Kenya’s trade partners coupled with the high fiscal deficit seen during the period.
With the shilling having depreciated by 2.6% on a YTD basis, we saw the need to revisit the topic on currency outlook, in order to shed some light on how the shilling is expected to behave in 2022. In this topical, we shall be focusing in detail the factors that are expected to drive the performance of the Kenya shilling and thereafter give our outlook for 2022 based on these factors. We shall cover the following:
- Historical Performance of the Kenyan Shilling,
- Factors behind current currency performance,
- Currency Performance Outlook, and,
- Conclusion and Our View Going Forward
Section I: Historical Performance of the Kenyan Shilling
In the period 2017-2019, the Kenyan shilling remained relatively stable against the USD trading within the range of Kshs 99.4 – Kshs 104.2. However, the economic shocks occasioned by the COVID-19 pandemic in 2020 caused volatility of the shilling leading to a depreciation of 7.7% in 2020 and a further 3.6% in 2021. On a YTD basis, the shilling has depreciated by 2.6% against the USD, to close at Kshs 116.1, from Kshs 113.1 recorded on 3rd January 2022. The depreciation in 2022 is attributable to the rising global crude oil prices on the back of supply constraints and geopolitical pressures at a time when demand is picking up with the easing of COVID-19 restrictions and as economies reopen. The chart below illustrates the performance of the Kshs against the USD over the last 5 years;
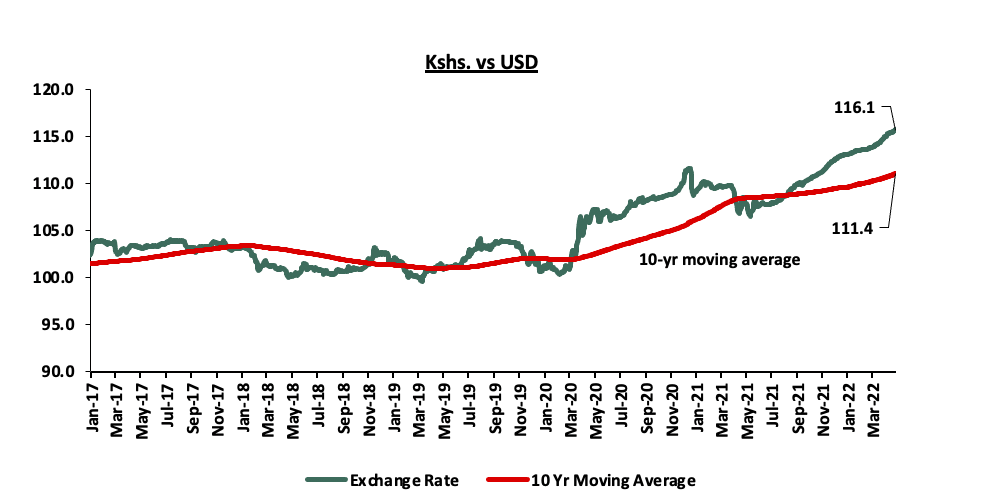
Source: Central Bank of Kenya
Below are some of the factors that have been supporting the shilling:
i. Forex reserves held by the Central bank which are above the statutory requirement of 4.0-months of import cover, having grown by a 10-Year CAGR of 6.6% to USD 8.4 bn, equivalent to 5.0 months of import cover in May 2022, from USD 3.9 bn, equivalent to 3.4 months of import cover in May 2012. The chart below shows the trend of the evolution of the forex reserves:
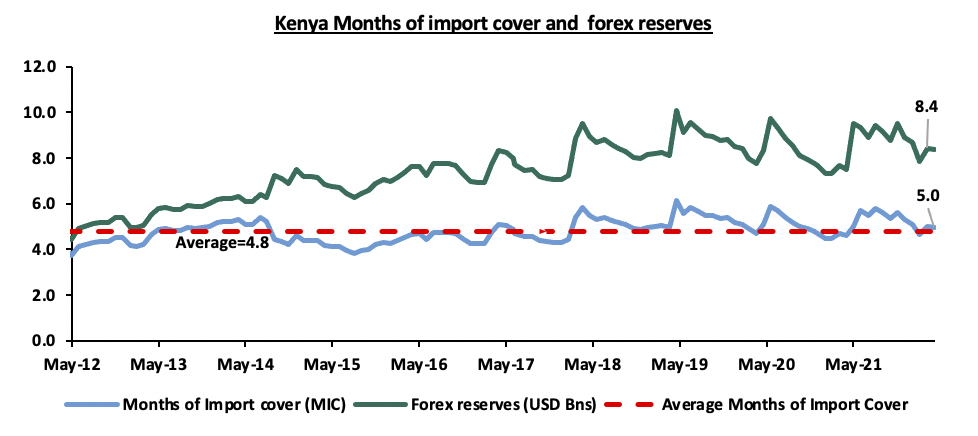
Source: Central Bank of Kenya
ii. Strong diaspora remittances, which have grown by a 10-year CAGR of 13.1% to USD 363.6 mn, in March 2022 from USD 106.2 mn recorded in March 2012 attributable to the increasing Kenyan population in the diaspora and advancing technology that makes transfer of money easier. Key to note, these are the highest diaspora remittances, ever recorded. The chart below shows the trend of the evolution of the Diaspora Remittances:

Source: Central Bank of Kenya
- Increase in value of some of the country’s principal exports such as horticulture exports which have grown by a 4-year CAGR of 7.1% to Kshs 165.7 bn in December 2021, from Kshs 83.3 bn recorded in December 2011. The Current account deficit as a percentage of the Gross Domestic product (GDP), has also continued to narrow, to a deficit of 5.5% in FY’2021, from a deficit of 7.0% in FY’2017,
- Improved investment into the country as measured by the Foreign Direct Investments (FDI) flows into the country, which had grown significantly by a 4-year CAGR of 16.4% to USD 1.1 bn in 2019, from USD 0.6 bn in 2015. However in 2020, FDI flows into the country declined by 34.7% to USD 0.7 bn mainly attributable to muted investor activity during the COVID-19 peak and tightened ownership rules that required companies such as those in the technology sector to have a 30.0% local ownership, and,
- Inflows from the Multilateral lenders for various loan facilities such as the recent USD 244.0 mn (Kshs 26.9 bn) from the IMF advanced to the country in April 2022 to boost COVID-19 recovery efforts, coupled with the USD 750.0 mn (Kshs 80.9 bn) received from the World Bank in March 2022.
Despite these factors, the shilling has been put under pressure mainly by increasing global oil prices leading to a high dollar demand from energy and oil suppliers, which outweighs supply, and a growing import bill, that has grown by a 10-year CAGR of 7.2% to Kshs 2.6 tn in December 2021, from Kshs 1.3 tn in December 2011.
Section II: Factors behind current currency performance
In 2022, the shilling has recorded an YTD depreciation of 2.6% against the USD, after a 3.6% and 7.7% depreciation in 2021 and 2020, respectively. The shilling has been recording all-time lows against the USD since 9th November 2021. In this section, we will analyze the key factors behind the performance of the Kenyan Shilling in 2022:
I. Increasing global oil prices
Kenya remains to be a net importer of crude oil, which accounted for the second largest share of imports, at 17.8% of total imports as of December 2021. The increasing global oil prices have increased the demand for dollars from oil and energy importers who have to increase the amounts they pay for oil imports and hence depleting dollar supply in the market. As a result, this has continued to exert downward pressure on the shilling. On a YTD basis, the Murban Oil that Kenya imports has increased by 34.5% to USD 105.5 per barrel, from USD 78.4 per barrel recorded on 3rd January 2022, mainly attributable to existing supply chain bottle necks, that were worsened by the Russia-Ukraine conflict that has seen demand of oil outweigh supply. Prices of crude oil are expected to remain relatively high in the near term and as such will continue to exert downward pressure on the shilling.
II. Shortage of the USD following continued reopening of economies
Following the peak of COVID-19 pandemic in 2020, most global economies went on a slowdown due to restrictions and lockdowns that curbed economic growth. However, in 2021, following the discovery of vaccines, vaccine accessibility and vaccine inoculation, most economies have continued to rebuild hence increasing the global demand for the USD for global trade. Further, interest rate hikes by the United States’ Federal Reserve during the Q1’2022 to curb inflation has seen redirection of dollar flows to the United States and away from emerging and developing markets.
iii. Balance of payments
According to the 2022 Economic Survey released by the Kenya National Bureau of Statistics (KNBS), Kenya’s current account deficit expanded by 30.1% in FY’2021, to Kshs 663.8 bn, from Kshs 510.1 bn recorded in FY’2020. This was attributed to a robust increase in merchandise imports by 30.9% to Kshs 2.6 tn in FY’2021, from Kshs 1.6 bn in FY’2020 as compared to a 15.5% increase in merchandise exports to Kshs 743.7 bn, from Kshs 643.9 bn in FY’2020. Though the exports gradually increased in FY’2021 on account of increase in value of exports of horticulture, coffee and tea, which recorded increase of 21.8%, 17.5% and 0.4%, respectively, the more aggressive growth in imports is still worrying and continues to put pressure on the shilling. Moreover, the high fuel prices currently witnessed in the country are likely to increase the import bill. We believe that this high import bill will continue weighing on the improving current account balance and as such, we expect the shilling to continue destabilizing against other currencies.
iv. Government debt
Kenya’s public debt has continued to grow aggressively, increasing at a 10-year CAGR of 18.6% to Kshs 8.2 tn in December 2021, from Kshs 1.5 tn in December 2011. Out of the current loan stock, external debt has grown at a faster 10-year CAGR of 19.7% to Kshs 4.2 tn in December 2021, from 0.7 tn in December 2021 as compared to domestic debt, which has grown at a 10-year CAGR of 17.5% to Kshs 4.0 tn in December 2021, from Kshs 0.8 tn in December 2011. The rising external debt, whose composition is currently 67.0% USD denominated, has continued to weigh down on the shilling as the government through the CBK has to continually dig into its forex reserves for external debt servicing. In addition, demand for hard dollars to meet debt-servicing requirements is bound to increase upon formal expiry of the Debt Servicing Suspension Initiative (DSSI) in December 2021. Currently, Kenya’s debt stands at Kshs 8.2 tn, of which Kshs 4.0 tn is external debt as highlighted in the chart below:
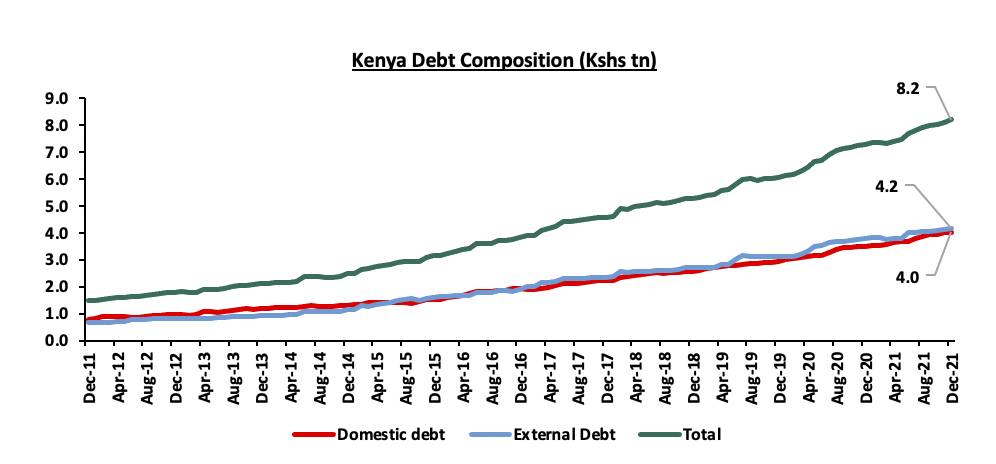
v. Forex Reserves
Kenya’s Forex Reserves have remained adequate and above the CBK’s statutory requirement of at least 4.0 months of import cover, with the forex reserves as at 13th May 2021 at USD 8.4 bn (5 months import cover), an increase of 6.4%, from USD 7.9 bn (4.8 months import cover) in May 2021. The improvement in the forex reserves can be attributed to increased inflows from key sectors such as tourism, coupled with inflows of USD 750.0 mn World Bank received in March 2022 and the USD 244.0 mn expected to be received from the International Monetary Fund as part of the Extended Fund Facility (EFF) and Extended Credit Facility (EFF). However, the reserves have come under increasing pressure partly due to debt service obligations and release of dollars into the market to act as buffers against volatility of the shilling..
Going forward, the elevated debt levels witnessed in the country are likely to put forex reserves under pressure as a significant amount will be used to repay the debts. As a consequence, the Kenyan shilling will be exposed to foreign exchange volatility causing it to weaken. However, we expect the reserves to be supported by increasing diaspora remittance inflows, continued investor capital inflows and increasing exports following increased activities with the key trading partners.
vi. Monetary Policy
The Central Bank Rate (CBR) was revised down to 7.00% from 8.25% in January 2020 to support the local economy. Despite this, the yields on government securities have remained high and attractive. Inflation rates have also remained relatively stable and within the government’s target of 2.5% - 7.5%. This is mainly attributable to the application of fuel subsidies under the Petroleum Development Fund that have shielded the fuel prices in Kenya against the full impact of rising global fuel prices. As such, we do not expect the CBK to increase the rates in the short term given the government’s commitment to sustain the fuel subsidy and protect citizenry against the rising cost of living.
Section III: Currency Performance Outlook
|
Driver |
Outlook |
Effect on the currency |
|
Balance of Payments |
· We expect gradual improvement in the export sector from perennial export products like Horticulture, tea and coffee as the increase due to the increase in their global prices. However, the high import bill is expected to weigh down on the Current Account balance due to an increase in merchandise trade deficit attributable to the increase in global fuel prices, persistent disruptions in supply chains and logistical bottlenecks. |
Neutral |
|
Government Debt |
· We expect the government to borrow aggressively to plug in the high fiscal deficit, which is projected at 7.5% of GDP for the FY’2021/22 budget. In addition, Kenya’s debt to GDP ratio came in at an estimated 66.2% as of December 2021, 16.2% points above the IMF recommended threshold of 50.0% for developing nations. Slow revenue growth coupled with weak fiscal consolidation places the country at risk of debt distress, and, · The high debt burden especially external debt will continue to expose the shilling to exchange rate shocks and will, in turn, emanate pressure on the shilling to weaken during the repayment period. |
Negative |
|
Forex Reserves |
· Elevated debt levels witnessed in the country are likely to put forex reserves under pressure as most of it will be used to finance the external debt. Further, the expiry of the Debt Service Suspension Initiative in December 2021 is set to increase amounts due and put the shilling under more pressure, and, · In our view, forex reserves will continue to be supported by; debt relief from institutions such as the IMF, increasing diaspora remittance inflows, continued investor capital inflows with hope for an economic recovery and increasing exports as the key trading partners continue to re-open their economies |
Neutral |
|
Monetary Policy |
· Inflation rates have remained within the government’s target of 2.5% - 7.5% despite the high fuel prices and as such, we do not expect the CBK to increase the rates as the Central Bank is mainly focused on reviving the economy, and, · Domestic investment activities have declined as Kenya’s financial and capital assets have become less appealing to investors on account of the lower real rate of return. |
Neutral |
From the above currency drivers, 1 is negative (Government Debt), while 3 are neutral (Balance of Payment, Monetary Policy, Forex reserves) indicating that currency remain uncertain with a bias towards further depreciation in the short term.
Section IV: Conclusion and Our View Going Forward
Based on the factors discussed above and factoring in the effects of the current geopolitical tensions arising from the Russia-Ukraine tensions, we expect the Kenyan shilling to remain within a range of Kshs 115.1 and Kshs 119.1 against the USD in the medium term based on the Purchasing Power Parity (PPP) and Interest Rate Parity (IRP) approach respectively, with a bias of a 4.7% depreciation on account of:
- High global oil prices which continue to lead to high costs of oil imports,
- Persisting supply chain bottle neck constraints that continue to increase the costs of imports, and,
- Ever present current account deficit due to an imbalance between imports and exports.
In our view, the current pressure on the shilling is unlikely to reduce in the near term, and is a cause of concern. Continuous depreciation of the shilling is set to have a negative effect on the economy as the import bill will continue to be inflated, with the additional costs likely to be passed on to consumers hence elevating the current inflation levels. In as much as most of the factors contributing to depreciation of the shilling during the year are external, we are of the opinion that there actionable steps that can be taken by the Government to mitigate further depreciation of the shilling. These include;
- Building an export driven economy - This can be achieved by formulating and implementing robust export oriented policies and manufacturing to increase exports, thus improving the current account while at the same time reducing overreliance on imports to preserve our foreign exchange reserves. Exports should also undergo value addition before leaving the country in order to increase purchase value and competitiveness. This will go a long way to stabilize the exchange rate,
- Reducing the mix of commercial loans which attract high interest rates - The Kenyan government should move towards reducing the share of commercial borrowing as compared to concessional borrowing so as to reduce amounts paid in debt service. Reduced debt service amounts would greatly help to bring down demand for the greenback and stabilize the exchange rate,
- Diversification of the economy to avoid over-reliance on agriculture and tourism - Kenya’s brand, location and skilled workforce uniquely positions the country to be a financial hub, but we will have to fundamentally rethink our capital markets infrastructure and regulatory frameworks. We have seen Mauritius, which is primarily a financial hub, benefit greatly from the diversification of their economy. Mauritius has a developed mixed economy hinged on different sectors such as manufacturing, financial services which have been increasing their share of GDP and has constantly been diversifying from agriculture and tourism unlike earlier years,
- Capital Markets Authority to encourage local capital formation rather than foreign capital, which has to be repatriated - The current Capital markets structure in Kenya is foreign investors and capital dominated and as such, companies have to repatriate profits and dividends in dollars continues to starve the market’s dollars and further weakens the shilling, and,
- Work with the private sector to maximize Kenyans living abroad investments in the country - Despite the fact that the remittances have reached historic highs, there is potential for much more to come into the country if we develop, promote and implement an active diaspora investment strategy and engagement.
Disclaimer: The views expressed in this publication are those of the writers where particulars are not warranted. This publication, which is in compliance with Section 2 of the Capital Markets Authority Act Cap 485A, is meant for general information only and is not a warranty, representation, advice or solicitation of any nature. Readers are advised in all circumstances to seek the advice of a registered investment advisor.

- Talk to us
- Kenya
- P.O Box 20695 - 00200, Nairobi, Kenya
- Cell +254709101200
- Tel +254709101200
- WhatsApp +254741676635
- United States
- +254709101200
- DOWNLOAD OUR APP
-


- Kenya
- 8th Floor, Pinetree Plaza, Kaburu Drive, Ngong Road, Nairobi, Kenya
- USA
- Suite 1150, 1775 Eye Street NW, USA, Washington DC 20006, USA
- Investments
- High Yield
- Private Equity
- Real Estate
- Real Estate
- RiverRun Estates
- Cytonn Towers
- The Ridge
- Taraji Heights
- The Alma