Dec 6, 2020
In 2019, we published the Nairobi Metropolitan Area Serviced Apartments Report 2019, which highlighted that serviced apartments within the NMA recorded an average rental yield of 7.6%, 0.2% points higher than the 7.4% recorded in 2018, and this was attributed to a 2.3% increase in monthly charges per SQM, from Kshs 2,742 in 2018 to Kshs 2,806 in 2019, fuelled by the continued demand for serviced apartments by both guests on business and leisure travels. The improved performance was overally supported by the stable political environment and improved security, thus making Nairobi an ideal destination for both business and holiday travellers. This year, we update our report findings on the same by focusing on:
- Overview of the Kenyan Hospitality Sector,
- Introduction to Serviced Apartments sector,
- Supply and Distribution of Serviced Apartments within the Nairobi Metropolitan Area,
- Performance of Serviced Apartments in the Nairobi Metropolitan Area,
- Serviced Apartments Performance by Node
- Comparative Analysis- 2019/2020 Market Performance
- Performance per Typology
- Recommendation and Outlook.
Section I: Overview of the Kenyan Hospitality Sector
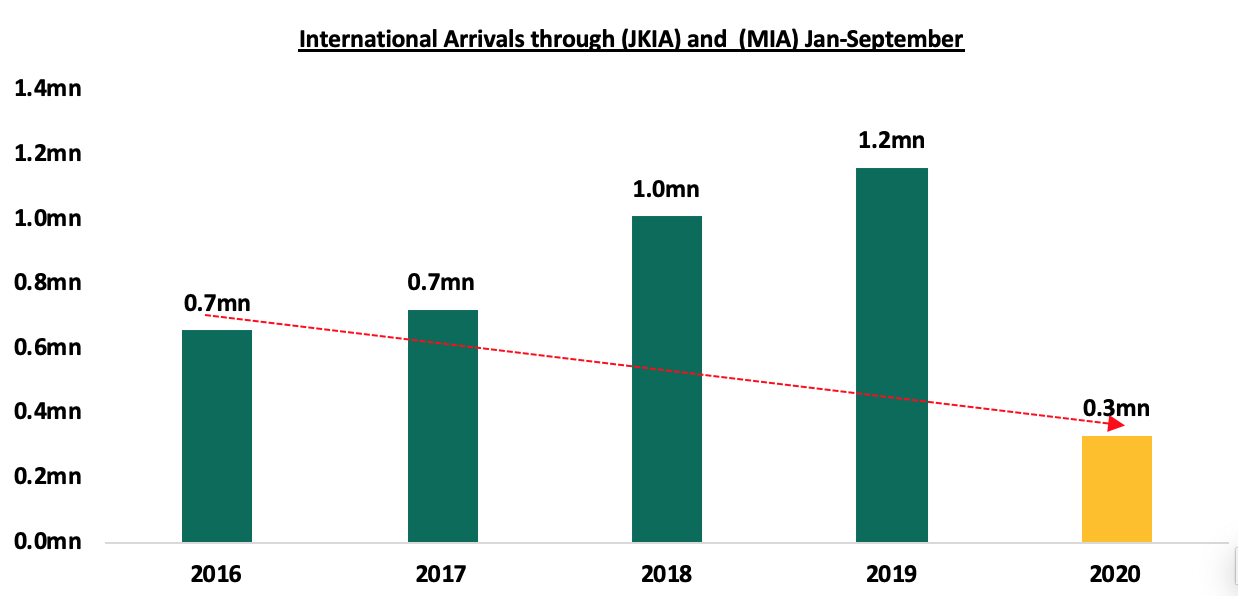
The hospitality sector was the worst hit by the COVID-19 pandemic as businesses either closed down completely or operated under minimal capacity. This was mainly due to the reduced number of tourist arrivals as the government issued a travel ban on international flights into and outside the country and the restriction of movement in select cities within the country. As a result of the fear of contracting the virus and adhering to social distancing measures enforced by the government, hotels and restaurants recorded significantly low occupancy rates especially in Q2’2020 and Q3’2020. The negative impact of the pandemic is evidenced by the decline in the hospitality sector’s contribution to GDP through accommodation and food services by 83.3% during the second quarter of 2020 compared to an expansion of 12.1% during the same period in 2019, according to the KNBS Quarterly Gross Domestic Product Report – Q2'2020. The total number of international arrivals through Jomo Kenyatta International Airport (JKIA) and Moi International Airport (MIA) recorded a 71.5% decline from 1.2 mn persons between January to September 2019 to 0.3 mn during the same period in 2020. This is however an increase from 13,919 persons in August 2020 to 20,164 persons in September 2020 according to the Kenya National Bureau of Statistics (KNBS), Leading Economic Indicators - September 2020, indicating the gradual recovery of the tourism sector. Despite this, the sector has remained resilient evidenced by investor focus, with Accor Hotels and Radisson Hotel Group announcing that they would continue with their expansion plans in Kenya and the African region as a whole despite the slump in the sector due to the COVID-19 pandemic. Additionally, Hyatt, a US-based hospitality chain announced plans to build a 225-room facility in Nairobi along Mombasa road, marking the brand’s entry into the Kenya hospitality market. The move by these brands shows investor confidence in the Kenya’s hospitality industry despite being one of the hardest hit by the COVID-19 pandemic.
Some of the factors that continue to cushion the hospitality sector include;
- Gradual Recovery of the Tourism Industry: The relaxation of travel advisories and reopening of Kenya’s key tourism markets is expected to enhance recovery of the tourism industry thus a resultant boost to the hospitality sector,
- Post-Corona Hospitality Sector Recovery Stimulus by the Ministry of Tourism: The Ministry of Tourism put in place the Post-Corona recovery funds aimed at offering financial aid to hotels and other establishments in the hospitality industry through the Tourism Finance Corporation (TFC),
- Repackaging of the Tourism Sector Products to Appeal to Domestic Tourists: The government and other industry players in the hospitality industry have been making efforts to repackage the tourism products targeting domestic tourists. This has been through; making domestic travel more attractive through campaigns, organized road transport to events and tourist attraction sites, and doing more research on domestic market preferences,
- Improved Security: The security of Kenya has improved evidenced by reduced terrorist attacks. This has boosted the confidence of tourists thus a preferred travel destination for both holiday and business travellers,
- Travel Tourism: Travel tourism is one of the key drivers of the Kenya’s hospitality sector evident by the number of international arrivals into the country through the main airports in Kenya; Jomo Kenyatta International Airport and Moi International Airport. The total number of international arrivals through Jomo Kenyatta International Airport (JKIA) and Moi International Airport (MIA) increased from 13,919 persons in August 2020 to 20,164 persons in September 2020. This signals the gradual recovery of the tourism industry thus enhancing the demand hospitality services and facilities. The graph below shows the number of international arrivals in Kenya in the last five years;
 Source: Kenya National Bureau of Statistics
- Recognition of Nairobi as a Regional Hub: Nairobi’s strategic geo-positioning and improving infrastructure sets it apart as a preferable regional hub for the East African Community and this has continued to enhance the growth of business travellers into the country, and,
- Positive Accolades: Kenya’s hospitality facilities have continued to receive global recognition despite the pandemic thus boosting the status of the country as a preferred travel destination globally. Kenya was recently voted as Africa’s leading tourist destination in the World Travel Awards, supported by the epic savannah landscapes, wildlife, beaches and lakes among other tourist attraction centres. Kenyatta International Conference Centre (KICC) was voted as Africa’s leading meeting and conference centre (MICE), while Fairmont Mount Kenya grabbed the title of Africa’s leading hotel, and the Aberdare Country Club was voted Africa’s leading Green Hotel. Additionally, Kenya Airways was ranked as Africa’s leading Airline-business classes and Africa’s leading Airline-economy class.
Nevertheless, the sector continues to face challenges among them;
- The COVID-19 Pandemic- The hospitality sector was significantly affected by the COVID-19 pandemic due to overreliance on tourism and Meetings Incentives Conferences and Events (MICE). This was occasioned by the government issuing a travel ban on all international flights and implementation of strict measures that led to the temporary closure of major hospitality facilities. The sector is however on the road to recovery following the easing of travel restrictions in the country in Q3’2020, lifting of the ban on domestic and international flights and the reopening of Kenya’s key tourism markets. However, the pandemic is yet to be mitigated with some countries experiencing a second wave and this continues to affect the hospitality sector,
- Travel Advisories: Despite political stability and elongated prevalence of peace within the country, Kenya still suffers from risk prone travel advisories. For instance, in October 2020, the government of the United States advised its citizens to exercise increased caution in Kenya due to crime, terrorism, health issues, and kidnapping, and,
- Reduced Private Sector Lending: Most of lenders have largely pulled back or ceased new lending to business on overall with the Kenyan hospitality industry not exempted. In addition, the market has slowed down as lenders exercise more a conservative underwriting approach as a strategy to cushion themselves against the pandemic which is marked by high loan default rates.
Section II: Introduction to Serviced Apartments
To reiterate our 2019 Topical, a serviced apartment is a type of furnished apartment available for short-term or long-term stays, which provides amenities for daily use and housekeeping services all included in the rental charges. The serviced apartments provides facilities much like the traditional hotels however, they have added space, convenience and privacy just like home so that the occupants gets to enjoy their stay. The concept of serviced apartments has been popularised over the years as travellers continue to find them more convenient, credible, easily available and cost effective. They are also convenient for families and people who opt for the longer stays.
The advantages of a serviced apartment include;
- Extra room services are offered as opposed to traditional hotels such as laundry services and general housekeeping,
- Substantially cheaper than a hotel room when staying for a longer period of time. For example, a standard 3-star hotel in Nairobi, Gigiri area charges on average Kshs 6,500 per night for a suite, while a studio serviced apartments charges on average Kshs 5,600 per night within the same location,
- Serviced apartments offers a “home far from home” feel compared to hotels. Has utilities available which makes them more comfortable and convenient,
- Offers the ease of integration, as the concept offers guests a chance to integrate with the larger community as they are located within or in close proximity to other residential developments,
- Some serviced apartments are designed to resemble the culture of some specific areas. This gives insight into what a real local apartment would look like, giving a more comprehensive immersion of the culture and values compared to hotel rooms, which usually all look alike, and,
- The easy conversion, as serviced apartments can easily be converted into furnished or normal apartments in the case where the former is not performing well.
Section III: Supply and Distribution of Serviced Apartments in the Nairobi Metropolitan Area
The number of serviced apartments within the Nairobi Metropolitan Area (NMA) increased by a 6-Year CAGR of 8.6% to 5,594 apartments in 2020, from 3,414 apartments in 2015, with one of the key facilities coming into the market this year being 106-room Emara Hotel Ole Sereni located along Mombasa Road.
In terms of distribution, Westlands and Kilimani has the largest market share of serviced apartments within the Nairobi Metropolitan Area, at 38.4% and 26.3%, respectively. This is attributed to the attractiveness of the areas due to; (i) proximity to the Nairobi CBD and other major business nodes such as UpperHill and Westlands, ii) relatively good infrastructure within the area, iii) high presence of international organizations such as International Committee of the Red Cross (ICRC), Oxfam and Save the Children International, and, iv) availability of social amenities such as shopping malls within the area.
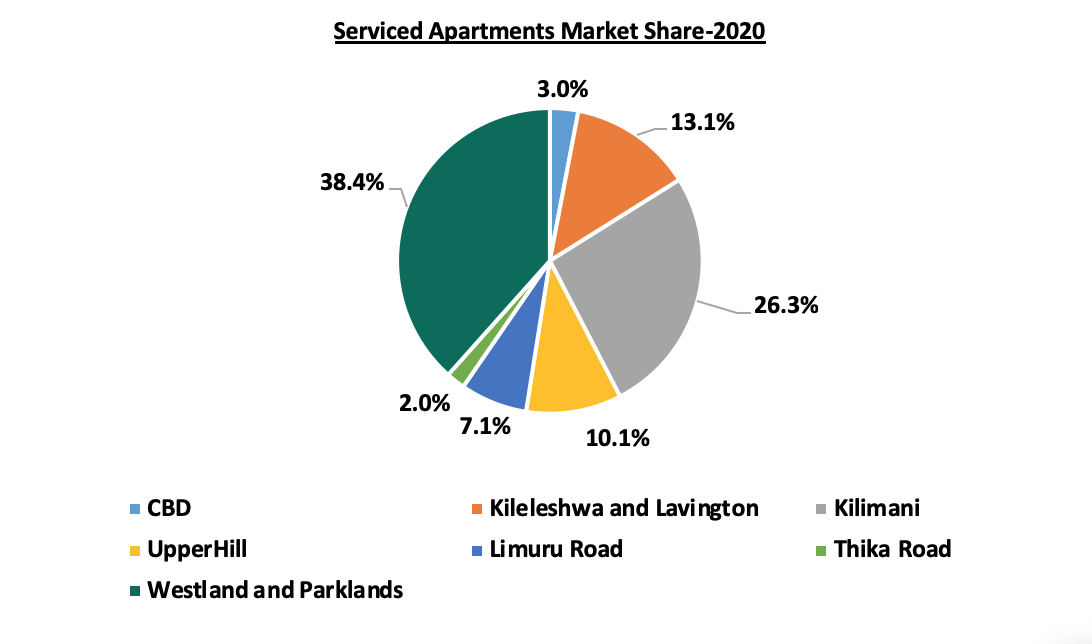
Source: Cytonn Research 2020
Currently, there are at least 804 apartment keys in the development pipeline set for completion by 2021. Some of the developments in the pipeline include:
|
Serviced Apartments Developments in the Pipeline within the NMA |
||||
|
Name |
Developer |
Location |
Number of Keys/Rooms |
Completion |
|
Skynest |
Elegant Properties |
Westlands |
250 |
2021 |
|
Britam |
Britam |
Kilimani |
163 |
2021 |
|
Sun Africa Luxury Apartments |
Sun Africa Hotels Group |
Kilimani |
20 |
2021 |
|
9 Oak |
Mifta Holdings |
Kilimani |
120 |
2021 |
|
Avic |
Avic |
Westlands |
51 |
2021 |
|
Elsie Ridge |
Intime Group |
Spring Valley |
40 |
2021 |
|
Habitat |
Ekco Investments |
Kilimani |
160 |
2021 |
|
Total |
804 |
|||
Source: Cytonn Research 2020
Section IV: Performance of Serviced Apartments in the Nairobi Metropolitan Area
For the purpose of this report, we tracked the performance of serviced apartments in 7 nodes within the Nairobi Metropolitan Area and compared this to the performance to 2019. The key metrics we looked at include:
- Charged Rates: This is the amount guests pay for an apartment in a specific market, on a daily basis, weekly and/or monthly. It informs potential investors on the rental income they are likely to gain from investing in serviced apartments,
- Occupancy Rates: This measures the number of apartments that are let out of the total available, in order to inform on the expected rental yield of the developments, and,
- Rental Yields: This refers to the measure of return on the real estate investment, from the rental income collected annually. The rental yield informs potential investors on the return they are likely to get from a property and hence the time it will take an investor to recoup the money invested. To calculate this, we have estimated annual income from monthly revenues having deducted operational costs assumed to be at 40.0% of revenues. To estimate the investment value, we have calculated development cost per SQM by factoring in land costs based on the location, construction costs, equipping costs, professional fees and other development-related costs. The formula to calculate rental yield is as follows;
Rental Yield= Monthly Rent per SQM x Occupancy Rate x (1-40.0% operational cost) x 12 months
Development Cost per SQM
*Important to note, however, is that depending on the actual incurred land cost, plot ratios, the level of finishing and equipping, investors will generally incur varying costs.
On performance, we will start by covering the performance by the node during the year, compare this with 2019 performance, then cover the performance by typology.
- Serviced Apartments Performance by Node
For our analysis, serviced apartments within the NMA recorded an average rental yield of 4.0% in 2020, 3.6% points lower than the 7.6% recorded in 2019. This is attributed to declines in monthly charges per SQM and occupancies from Kshs 2,806 to Kshs 2,445 and from 79.4% to 48.0%, respectively. The decline in performance is attributable to subdued demand for hospitality facilities and services due to the COVID-19 pandemic which saw the government ban all international flights and local flights into Mombasa and Nairobi, implement partial lockdown within the NMA among other restrictive measures aimed at curbing the spread of the virus. Some serviced apartments have also been issuing discounts to attract and maintain clients amid a tough economic environment occasioned by reduced disposable income.
The table below shows a summary of the performance of the various nodes within the NMA:
(All values in Kshs unless stated otherwise)
|
2020 NMA Serviced Apartments Performance per Node |
||||||||||||
|
Unit Sizes (SQM) |
Monthly Charges per Unit (Kshs) |
|||||||||||
|
Node |
Studio |
1 Bed |
2 Bed |
3 Bed |
Studio |
1 Bed |
2 Bed |
3 Bed |
Occupancy 2020 |
Monthly Charge per SQM(Kshs) 2020 |
Devt Cost per SQM(Kshs) |
Rental Yield |
|
Westlands& Parklands |
37 |
57 |
88 |
114 |
196,000 |
231,811 |
307,734 |
324,000 |
49.4% |
3,578 |
209,902 |
6.1% |
|
Kilimani |
47 |
75 |
114 |
193 |
147,375 |
203,333 |
335,000 |
407,500 |
48.4% |
2,783 |
202,662 |
4.8% |
|
Limuru Road |
44 |
52 |
79 |
116 |
122,000 |
174,093 |
207,143 |
270,000 |
51.4% |
2,839 |
231,715 |
4.5% |
|
Kileleshwa& Lavington |
38 |
91 |
128 |
166 |
112,000 |
198,510 |
296,773 |
433,200 |
48.1% |
2,553 |
206,132 |
4.3% |
|
UpperHill |
95 |
119 |
195 |
190,000 |
290,000 |
373,333 |
48.9% |
2,121 |
209,902 |
3.6% |
||
|
Nairobi CBD |
51 |
82 |
85 |
119 |
104,500 |
148,188 |
207,167 |
295,250 |
42.1% |
2,122 |
224,571 |
2.9% |
|
Thika Road |
70 |
101 |
145 |
100,000 |
190,000 |
275,000 |
48.1% |
1,138 |
200,757 |
2.0% |
||
|
Average |
43 |
75 |
102 |
150 |
136,375 |
177,991 |
261,974 |
339,755 |
48.0% |
2,448 |
212,234 |
4.0% |
|
High |
51 |
95 |
128 |
195 |
196,000 |
231,811 |
335,000 |
433,200 |
51.4% |
3,578 |
231,715 |
6.1% |
|
Low |
37 |
52 |
79 |
114 |
104,500 |
100,000 |
190,000 |
270,000 |
42.1% |
1,138 |
200,757 |
2.0% |
|
||||||||||||
Source: Cytonn Research 2020
- Comparative Analysis- 2019/2020 Market Performance
Overall, serviced apartments’ performance softened with the occupancy rates declining by 31.3% points to 48.0% from 79.4%; the monthly charges per SQM also declined by 14.9% from Kshs 2806 to Kshs 2,448 while the average rental yield declined by 3.6% points to 4.0% in 2020 from 7.6% in 2019. This is mainly attributable to a reduction in the number of tourist arrivals due to the COVID-19 pandemic, and the tough economic environment.
The table below shows the comparative analysis:
(All values in Kshs unless stated otherwise)
|
Comparative Analysis-2019/2020 Market Performance |
||||||||||
|
Node |
Occupancy 2019 |
Occupancy 2020 |
Occupancy rates ∆ |
Monthly Charge per SQM (Kshs) 2019 |
Monthly Charge per SQM (Kshs) 2020 |
∆ in Monthly Charge Per SQM (Kshs) |
% Change of Monthly Charges |
Rental Yield 2019 |
Rental Yield 2020 |
∆ in Rental Yield |
|
Westlands& Parklands |
80.8% |
49.4% |
(31.4%) |
3,884 |
3,578 |
(306) |
(8.6%) |
10.8% |
6.1% |
(4.7%) |
|
Kilimani |
80.0% |
48.4% |
(31.6%) |
3,353 |
2,783 |
(570) |
(20.5%) |
9.5% |
4.8% |
(4.7%) |
|
Limuru Road |
88.2% |
51.4% |
(36.8%) |
3,430 |
2,839 |
(591) |
(20.8%) |
9.4% |
4.5% |
(4.8%) |
|
Kileleshwa& Lavington |
82.4% |
48.1% |
(34.3%) |
2,845 |
2,553 |
(292) |
(11.4%) |
8.2% |
4.3% |
(3.9%) |
|
UpperHill |
67.8% |
48.9% |
(18.9%) |
2,577 |
2,121 |
(456) |
(21.5%) |
6.0% |
3.6% |
(2.4%) |
|
Nairobi CBD |
72.0% |
42.1% |
(29.9%) |
2,230 |
2,122 |
(108) |
(5.1%) |
5.1% |
2.9% |
(2.2%) |
|
Thika Road |
84.4% |
48.1% |
(36.3%) |
1,321 |
1,138 |
(183) |
(16.1%) |
4.0% |
2.0% |
(2.0%) |
|
Average |
79.4% |
48.0% |
(31.3%) |
2806 |
2448 |
(358) |
(14.9%) |
7.6% |
4.0% |
(3.6%) |
|
||||||||||
Source: Cytonn Research 2020
- Westlands and parklands was the best performing node with a rental yield of 6.1% compared to the market average of 4.0%. The submarket recorded a decline in rental charges by 8.6% compared to an overall decline of 14.9% attributed to a growing preference of the area given its the proximity to business nodes such as Kilimani, Westlands and the Nairobi CBD, availability of high quality serviced apartments, ease of accessibility, and proximity to most international organizations.
- Kilimani was the second best performing node with average rental yields of 4.8% compared to market average of 4.0%. This is however a decline of 4.7% points attributed to 31.6% decline in occupancy rates and 20.5% correction in the monthly charges per SQM.
- Performance by Typology
In terms of performance by typology, studio units recorded the highest average rental yield at 5.4%, mainly attributed to the relatively high occupancy rates at 49.6%, compared to 1, 2 and 3 bedroom units at 44.9%, 49.0% and 49.0%, respectively, and a 27.7% higher charge per SQM of Kshs 3,276 compared to the market average of Kshs 2,565, amid the relatively low supply of the typology in the market.
The table below shows the summary of performance by typology:
(All values in Kshs unless stated otherwise)
|
Summary per Typology 2020 |
||||
|
Typology |
Average Size (SQM) |
Monthly Charges per SQM |
Occupancy |
Rental Yield |
|
Studio |
43 |
3,276 |
49.6% |
5.4% |
|
One bedroom |
75 |
2,430 |
44.9% |
3.9% |
|
two bedroom |
102 |
2,378 |
49.0% |
4.2% |
|
Three bedroom |
150 |
2,177 |
49.0% |
3.6% |
|
Average |
92 |
2,565 |
48.1% |
4.3% |
|
||||
Source: Cytonn Research 2020
Section V: Recommendations and Outlook
Having looked at the factors driving the hospitality industry, and specifically the serviced apartments sector, challenges and the current performance, we now conclude with a recommendation of the investment opportunity and outlook.
|
Serviced Apartments Sector Outlook |
||
|
Measure |
Sentiment |
Outlook |
|
Serviced Apartments Performance |
In 2020, serviced apartments within the NMA recorded an average rental yield of 4.0%, 3.6% points lower than the 7.6% recorded in 2019, this is lower compared to the residential market performance which had an average rental yield of 4.9%, attributable to the adverse effects of the pandemic on the sector. The performance is expected to improve in the long term owing to the reopening of the economy and the post pandemic recovery strategies that have been put in place to cushion the hospitality industry. The sector recovery will be largely supported by government strategies such as the Ministry of Tourism post-corona recovery funds aimed at offering financial aid to hotel and other establishments in the hospitality industry through the Tourism Finance Corporation (TFC), repackaging of the tourism sector products to appeal to domestic tourists, relaxation of travel advisories and reopening of Kenya’s key tourism markets. |
Neutral |
|
International Tourism |
The total number of international arrivals through Jomo Kenyatta International Airport (JKIA) and Moi International Airport (MIA) increased from 13,919 persons in August 2020 to 20,164 persons in September 2020. This is an indication of gradual recovery of the tourism industry which will boost the hospitality sector. The second wave of the pandemic in some markets is however expected to slow down these numbers as people limit their travelling options to avoid the spread of the virus. |
Neutral |
|
MICE Tourism |
Kenya has continued to gain popularity as a MICE hub with, Kenyatta International Conference Centre (KICC) being recognized as Africa’s leading meeting and conference centre (MICE). The performance of the sector has been affected by people shifting towards e-conferencing thus minimizing the need for physical meetings. Some factors that are likely to cushion the performance of Kenya as a preferred MICE hub include calm political environment, aggressive marketing by the Kenyan government and the improving infrastructure. |
Neutral |
|
Supply |
Serviced apartments in the Nairobi Metropolitan Area (NMA) increased by a 6-Year CAGR of 8.6% to 5,594 in 2020, from 3,414 in 2015. We expect the current developments in pipeline to add to the current supply of the sector thus boosting performance through increasing competition especially in areas like Kilimani and Westlands which have majority of serviced apartments within the area. |
Neutral |
Based on the above, all metrics are neutral and thus the overall outlook for the hospitality sector is NEUTRAL. The investment opportunity lies in Westlands and Parklands, and Kilimani which have continued to be the best performing nodes with average rental yields of 6.1% and 4.8%, respectively against a market average of 4.0%.
Disclaimer: The views expressed in this publication are those of the writers where particulars are not warranted. This publication, which is in compliance with Section 2 of the Capital Markets Authority Act Cap 485A, is meant for general information only and is not a warranty, representation, advice or solicitation of any nature. Readers are advised in all circumstances to seek the advice of a registered investment advisor.

- Talk to us
- Kenya
- P.O Box 20695 - 00200, Nairobi, Kenya
- Cell +254709101200
- Tel +254709101200
- WhatsApp +254741676635
- United States
- +254709101200
- DOWNLOAD OUR APP
-


- Kenya
- 8th Floor, Pinetree Plaza, Kaburu Drive, Ngong Road, Nairobi, Kenya
- USA
- Suite 1150, 1775 Eye Street NW, USA, Washington DC 20006, USA
- Investments
- High Yield
- Private Equity
- Real Estate
- Real Estate
- RiverRun Estates
- Cytonn Towers
- The Ridge
- Taraji Heights
- The Alma