Cytonn Monthly - February 2019
By Cytonn Research Team, Mar 3, 2019
Executive Summary
Fixed Income
During the month of February, T-bill auctions recorded an oversubscription, with the overall subscription rate coming in at 152.6%, a decline from 187.7%, recorded in January. The subscription rates for the 91-day, 182-day and 364-day papers came in at 98.1%, 115.8% and 211.3%, lower than the 173.0%, 141.0% and 240.2% registered in the previous month, respectively. The yields on the 91-day declined by 0.1% points to 7.0% from 7.1% the previous week, while both the 182-day and 364-day papers declined by 0.4% points to 8.4% and 9.5% from 8.8% and 9.9% the previous week, respectively;
Equities
During the month of February, the equities market recorded mixed performances with NASI gaining by 1.5%, while NSE 20 and NSE 25 declined by 2.2% and 1.5%, respectively. During the month, the Central Bank of Kenya (CBK) published draft regulations for mortgage refinance companies (MRCs), setting the stage for creation of a State-backed firm that will advance cash to banks for onward lending to home buyers;
Private Equity
During the month of February, there was private equity activity in the Education sector, where the African Management Initiative (AMI), a Pan-African company focused on skills development and workplace learning announced the close of a USD 1.8 mn Series A funding round aimed at promoting in-person as well as on-the-job training for staff in African countries. In the Hospitality sector, Inside Capital Partners, a Mauritian independent private equity manager announced a commitment to invest USD 7.5 mn in Latitude Hotels Group, an African lifestyle hospitality Group based in Zambia, for an undisclosed stake. In the Telecommunications sector, Airtel Kenya and Telkom announced the signing of an agreement to merge their respective mobile, enterprise, and carrier services businesses in Kenya to operate under a joint venture company to be named Airtel-Telkom. In addition, there were four private equity related reports released during the month namely; (i) African Private Equity and Venture Capital Association’s (AVCA) Annual Limited Partner Survey, a study that analyses the plans, views, preferences, expectations and evolving attitudes of 60 Limited Partners regarding Private Equity (PE) in Africa, (ii) Africa’s Institutional Investors, which maps the different pools of capital for African private equity, also by AVCA, (iii) The 2018 Annual Report by Competition Authority of Kenya (CAK), which highlighted the number of mergers that the Authority handled in the period, and (iv) The Private Credit Strategies in Africa report by AVCA that provides an overview of some of the key opportunities and challenges facing the private credit industry in Africa;
Real Estate
We highlight reports that were released during the month, which analyzed the performance of the real estate sector in 2018, and the market outlook for 2019. In the residential sector, developers continued to undertake projects in various segments. Sprinter Real Estate Investment announced plans to construct a 300 unit development, comprising of 2 and 3-bedroom apartments selling at Kshs 5.2 mn and Kshs 5.9 mn, respectively, in Ndenderu, Kiambu County, while Cytonn Real Estate broke ground on the construction of a Kshs 2.5 bn gated community development dubbed “Applewood”, in Miotoni, Karen, comprising of luxury 5-bedroom units, each on ½ acre.
- Enjoy up to 10% discount on Cytonn’s real estate developments and kick-start your home ownership and investment today! Offer valid for all units reserved before 8th March 2019. To see progress images of the site, visit our Facebook page here
- For an exclusive tour of the developments, visit: www.cytonn.com/tour and for more information, email us at sales@cytonn.com
- Caleb Mugendi – Senior Investments Analyst was on CNBC to discuss on the impact of suspension of Kenol Kobil Shares and Kenya Market Movements. Watch Caleb here
- Natasha Gichuki – Legal Assistant was on KBC to discuss estate management and financial planning. Watch Natasha here
- Patricia Wachira – Research Associate was on KTN News to discuss on affordable housing in Kenya. Watch Patricia here
- Following the recent approval by Retirement Benefits Authority (RBA), for Cytonn Asset Managers to manage pension funds, we are looking for business development consultants and agents with networks in the pensions industry to build our pensions business at very attractive commissions. If interested in being an agent or know someone who can be an agent, kindly contact us at pensions@cytonn.com;
- Following the completion and handover of Amara Ridge in Karen, we have now launched our next Karen project, dubbed Applewood, a Kshs 2.5 bn residential development located in Miotoni, Karen. This signature development shall comprise luxury homes, each sitting on 1/2 acre. We invite you to the exhibition of Applewood which is ongoing at the Amara Ridge Clubhouse (Location pin: https://goo.gl/maps/B3GVnu8pHyn) from 9:00 am to 5:00 pm daily and will end on 28th Feb 2019. Call 0709 101 000 or email resales@cytonn.com to reserve a villa! See Video here;
- We continue to hold weekly workshops and site visits on how to build wealth through real estate investments. The weekly workshops and site visits target both investors looking to invest in real estate directly and those interested in high yield investment products to familiarize themselves with how we support our high yields. Watch progress videos and pictures of The Alma, Amara Ridge, and The Ridge. Key to note is that our cost of capital is priced off the loan markets, where all-in pricing ranges from 16.0% to 20.0%, and our returns on real estate developments ranges from 23.0% to 25.0%, hence our top-line gross spread is about 6.0%. If interested in attending the site visits, kindly register here;
- We continue to see very strong interest in our weekly Private Wealth Management Training (largely covering financial planning and structured products). The training is at no cost and is open only to pre-screened participants. We also continue to see institutions and investment groups interested in the training for their teams. Cytonn Foundation, under its financial literacy pillar, runs the Wealth Management Training. If interested in our Private Wealth Management Training for your employees or investment group, please get in touch with us through wmt@cytonn.com. To view the Wealth Management Training topics, click here;
- For recent news about the company, see our news section here;
- We have 10 investment-ready projects, offering attractive development and buyer targeted returns of around 23.0% to 25.0% p.a. See further details here: Summary of Investment-Ready Projects;
- We continue to beef up the team with ongoing hires for Financial and Real Estate Advisors for our offices in Nairobi, Nakuru, Kisumu, and Nyeri. Visit the Careers Section on our website to apply.
T-Bills & T-Bonds Primary Auction:
During the month of February, T-bill auctions recorded an oversubscription, with the overall subscription rate coming in at 152.6%, a decline from 187.7%, recorded in January. The subscription rates for the 91-day, 182-day and 364-day papers came in at 98.1%, 115.8% and 211.3%, lower than the 173.0%, 141.0% and 240.2% registered in the previous month, respectively. The yields on the 91-day declined by 0.1% points to 7.0% from 7.1% the previous week, while both the 182-day and 364-day papers declined by 0.4% points to 8.4% and 9.5% from 8.8% and 9.9% the previous week, respectively. The T-bills acceptance rate came in at 78.3% during the month, compared to 66.8% recorded in January, with the government accepting a total of Kshs 114.7 bn of the Kshs 146.5 bn worth of bids received. The Central Bank of Kenya (CBK) remained disciplined in rejecting expensive bids in order to ensure stability of interest rates.
During the week, T-bills recorded an under-subscription, at a subscription rate of 78.2%, down from 104.6%, the previous week. The decline in subscription is partly attributable to the waning liquidity in the money market during the week. The yields on the 91-day and 182-day papers both declined by 0.2% to 6.9% and 8.3% respectively, while the 364-day papers declined by 0.2% to 9.5%. The acceptance rate declined to 90.0% from 91.2%, recorded the previous week, with the government accepting Kshs 16.9 bn of the Kshs 18.8 bn worth of bids received.
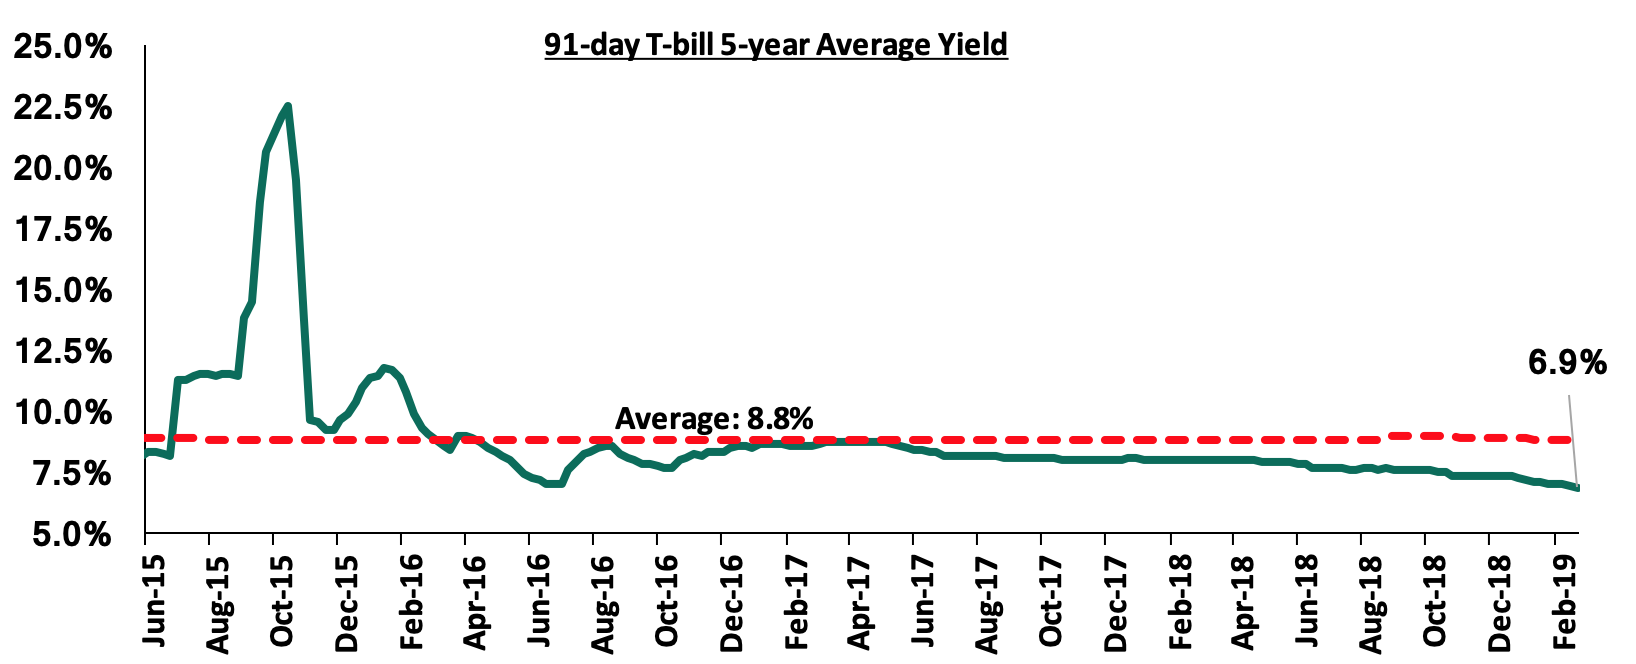
The 91-day T-bill is currently trading at a yield of 6.9%, which is below its 5-year average of 8.8%. The lower yield on the 91-day paper is mainly attributable to the low interest rate environment that has persisted since the passing of the law capping interest rates. We expect this to continue in the short-term, given:
- The discipline of the CBK in stabilizing interest rates in the auction market by rejecting aggressive bids that are priced above market, for both T-bills and T-bonds, and,
- The maintaining of the Central Bank Rate at 9.0% by the Monetary Policy Committee in their January meeting.
During the month, the government reopened two bonds issued in January; issue number FXD 1/2019/2 and FXD 1/2019/15, with tenors of 2.0-years and 15.0-years, both with market determined coupon rates. The government was seeking to raise an additional Kshs 12.0 bn from the Kshs 40.0 bn on offer in January for budgetary support. The 2.0-year and 15.0-year reopened bond issues were over-subscribed with an overall subscription rate of 555.0% with bids worth Kshs 66.6 bn received against the Kshs 12.0 bn on offer. The 2-year bond had a better performance with total bids of Kshs 50.2 bn compared to Kshs 16.4 bn worth of bids for the 15-year bond, an indication of the high demand in the shorter-end of the yield curve. The government accepted Kshs 23.4 bn out of the Kshs 66.6 bn worth of bids received, translating to an acceptance rate of 35.2%, indicating that bids were largely not within ranges the Central Bank of Kenya (CBK) deemed acceptable. The average accepted yield for the 2-year and 15-year issue came in at 10.7% and 12.9%, respectively. This was within target of our expectation of between 10.6% - 10.8% and 12.7% - 12.9% for the 2-year and 15-year bonds, respectively.
The Government also issued a 5-year tenor (FXD1/2019/5) and a 10-year tenor (FXD1/2019/10) bond, which recorded an over-subscription of 156.5%, mainly attributable to the relative favorable liquidity conditions. The yields came in at 11.3% and 12.4% for the 5-year and 10-year bonds, respectively, in line with our expectations, with the government accepting Kshs 53.4 bn out of the Kshs 78.3 bn worth of bids received against Kshs 50.0 bn on offer, translating to an acceptance rate of 68.2%.
For the month of March, the Government has issued a new bond; issue number IFB 1/2019/25 with a tenor of 25.0-years and a coupon rate of 12.2% in a bid to raise Kshs 50.0 bn for partial funding of infrastructure projects in the transport, water and energy sectors. We shall give our bidding range in next week’s report.
Secondary Bond Market:
The yields on government securities in the secondary market remained relatively stable during the month of February as the Central Bank of Kenya continued to reject expensive bids in the primary market. According to the FTSE NSE Bond Index, Treasury bonds listed at the Nairobi Securities Exchange (NSE) gained by 0.2% during the month, bringing the YTD performance to 0.3%.
Liquidity:
The average interbank rate declined to 2.6% during the month of February from 3.5% in January, pointing to improved liquidity during the month, supported by government payments and debt redemptions.
During the week, the average interbank rate rose to 4.1%, from 2.0% the previous week, while the average volumes traded in the interbank market increased by 93.5% to Kshs 5.1 bn from Kshs 2.6 bn the previous week. The rise in the interbank rate points to tightening liquidity conditions in the money market as banks were mobilizing funds to pay for tax remittances.
Kenya Eurobonds:
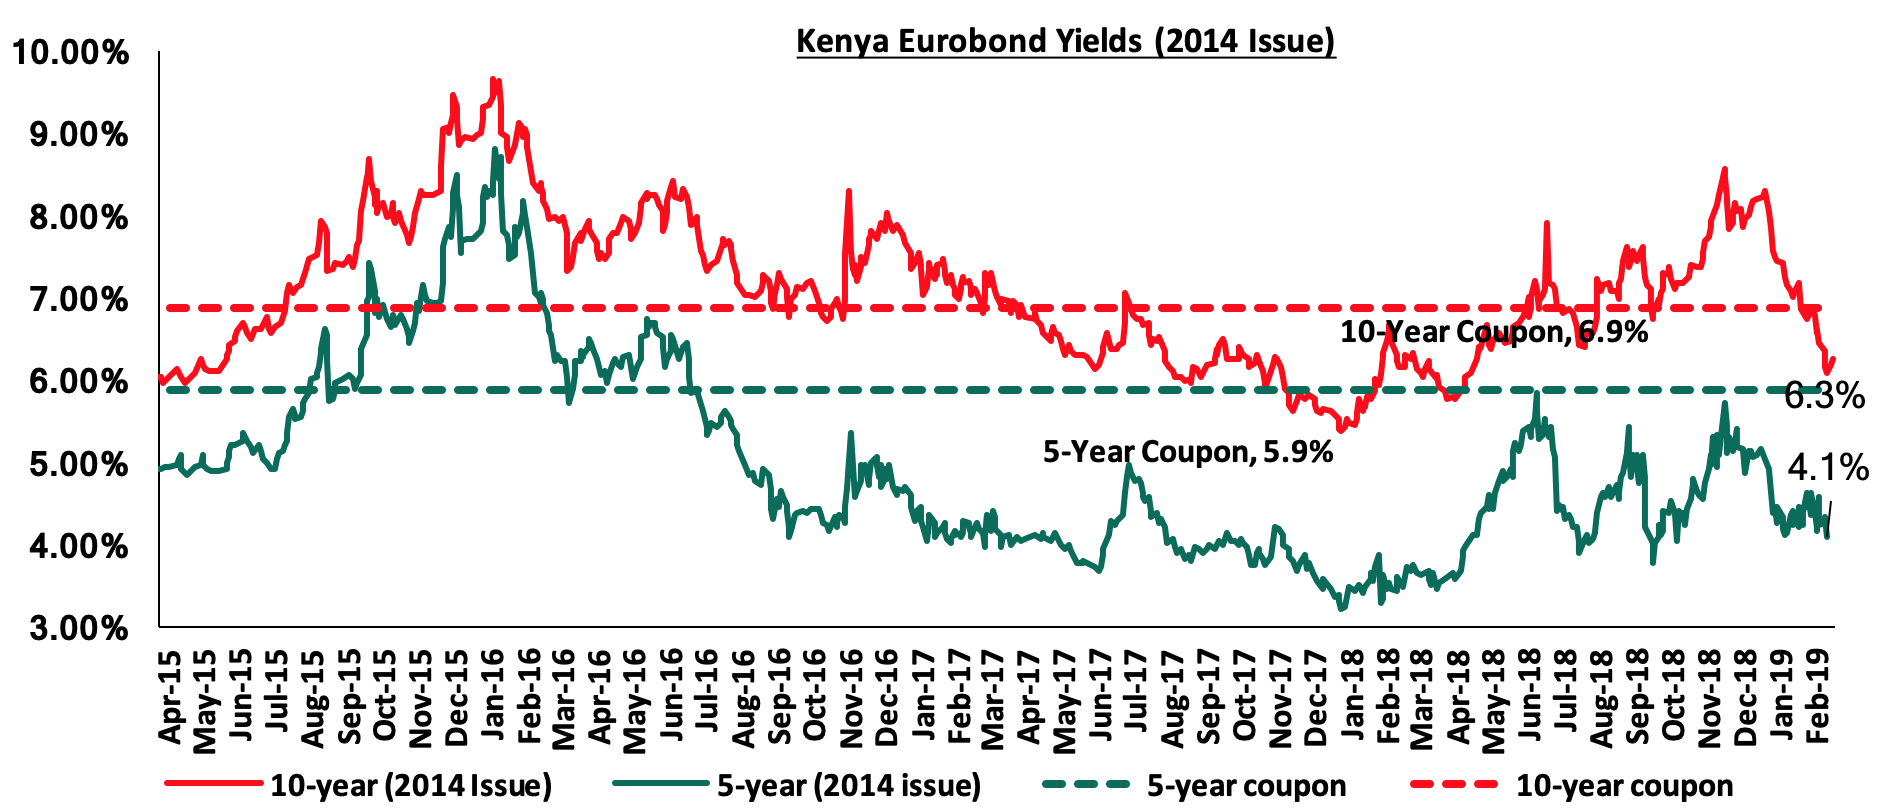
According to Bloomberg, the yield on the 5-year and 10-Year Eurobonds issued in June 2014 declined by 0.1% points and 0.6% points to 4.1% and 6.3% in February, from 4.2% and 6.9% in January, respectively. During the week, the yields on the 5-year Eurobond issued in 2014 declined by 0.2% points to 4.0% from 4.2% the previous week, while the 10-year Eurobond issued in the same year increased by 0.1% points to 6.3% from 6.2% the previous week. Since the mid-February 2016 peak, yields on the Kenya Eurobonds have declined by 4.8% points and 3.4% points for the 5-year and 10-year Eurobonds, respectively, an indication of the relatively stable macroeconomic conditions in the country.
During the month, the yields on the 10-year and 30-year Eurobond issued in February 2018 declined by 0.5% points and 0.4% points to 7.1% and 8.2% from 7.6% and 8.6% in January, respectively. During the week, the yields on the 10-year and 30-year Eurobonds both increased by 0.1% points to 7.1% and 8.2% from 7.0% and 8.1% recorded the previous week, respectively. Since the issue date, the yields on the 10-year Eurobond and 30-year Eurobond have increased by 0.2% points and 0.1% points respectively.
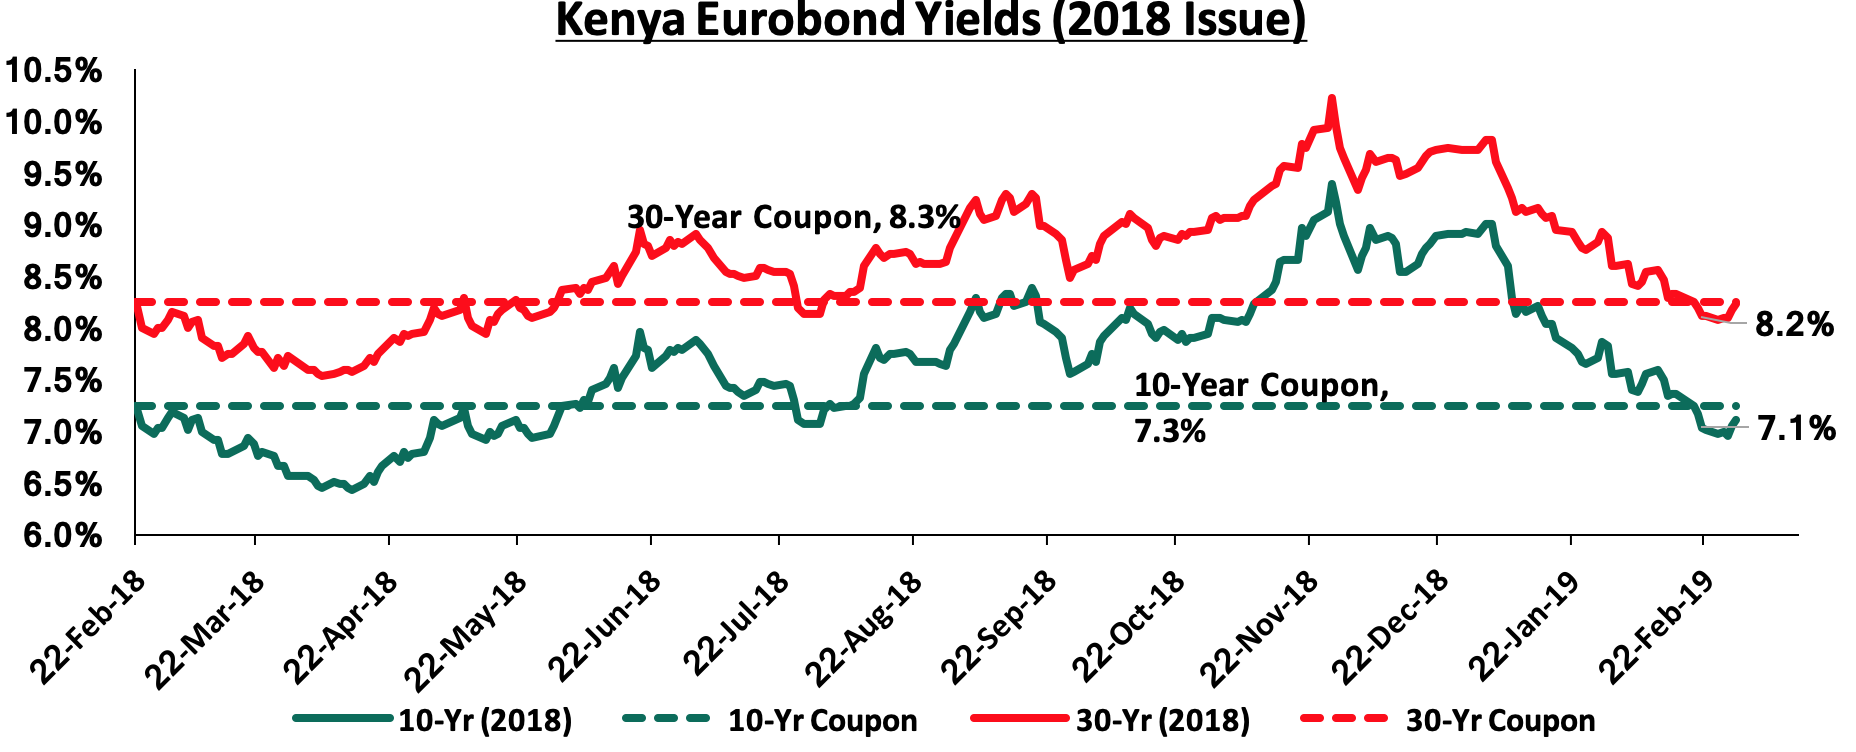
The declining yields on all the Eurobonds during the month signals improving country risk perception by investors, which was partly attributed to bullish expectations of improved economic growth in 2019 as well as increased Eurobond demand in emerging markets with a similar trend observed in other Sub-Saharan African Eurobonds, driving the prices up and effectively the yields down.
The Kenya Shilling:
The Kenya Shilling appreciated by 0.8% against the US Dollar during the month of February to Kshs 100.1 from Kshs 100.9 at the end of January. This was driven by hard currency inflows from diaspora remittances and offshore investors buying government debt, coupled with thin end month dollar-demand from oil importers. During the week, the Kenya Shilling appreciated by 0.2% against the US Dollar to close at Kshs 100.0 from Kshs 100.2 in the previous week, driven by inflows from offshore investors buying government debt subduing thin dollar demand from oil and goods importers. On an YTD basis, the shilling has appreciated by 1.2% against the US Dollar in addition to 1.4% in 2018. In our view, the shilling should remain relatively stable against the dollar in the short term, supported by:
- The narrowing of the current account deficit to 5.1% in the 12-months to November 2018, from 6.5% in November 2017, attributed to improved agriculture exports, increased diaspora remittances, strong receipts from tourism, and lower food and SGR-related equipment relative to 2017,
- Improving diaspora remittances, which increased by 38.6% in 2018 to USD 2.7 bn, from USD 1.9 bn recorded in 2017. The rise is due to;
- increased uptake of financial products by the diaspora due to financial services firms, particularly banks, targeting the diaspora, and
- new partnerships between international money remittance providers and local commercial banks making the process more convenient,
- CBK’s activities in the money market, such as repurchase agreements and selling of dollars, and,
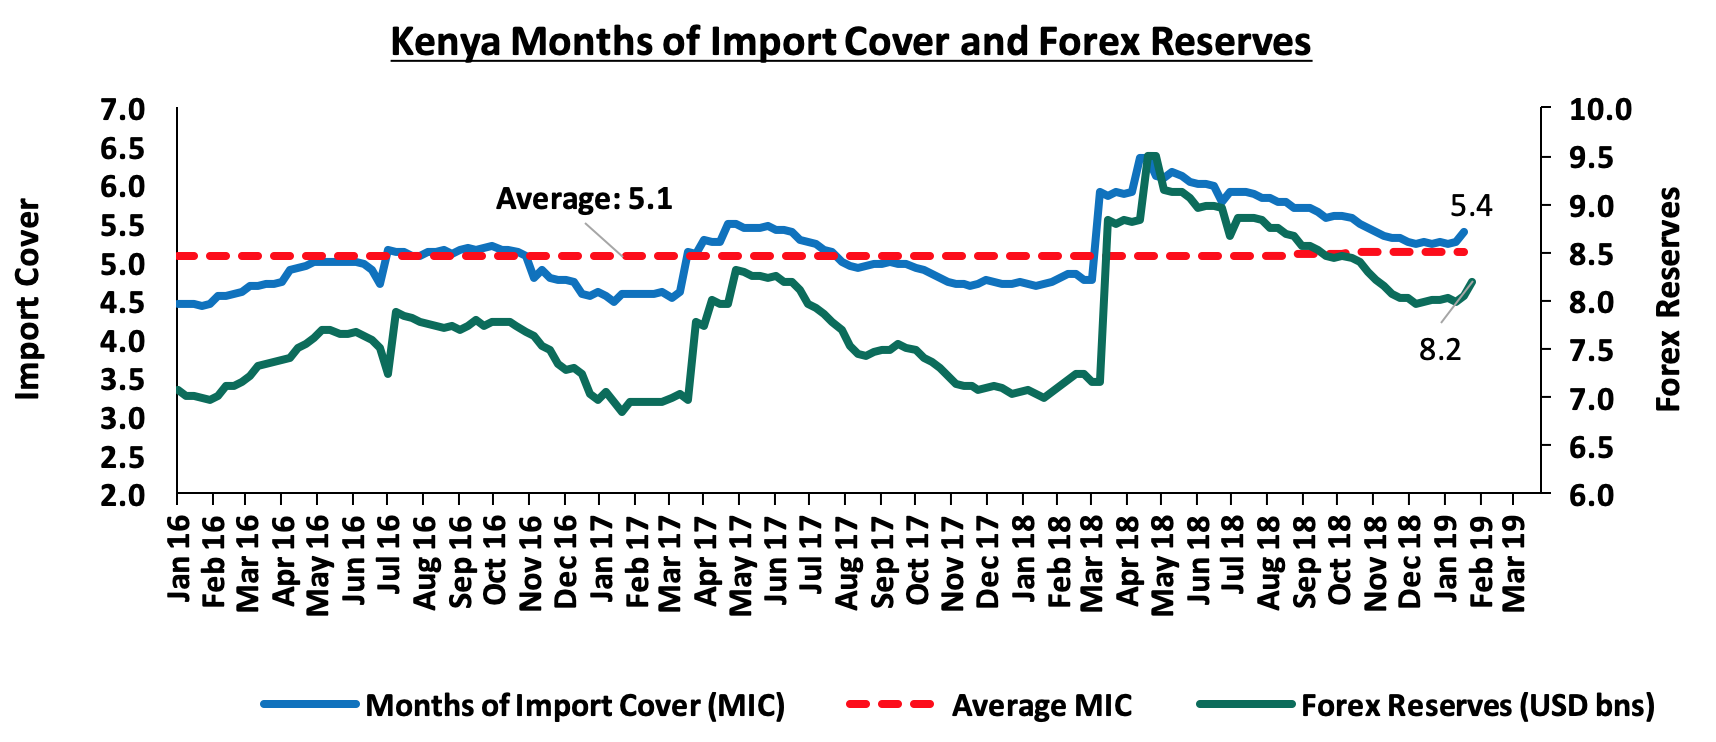
- High levels of forex reserves, currently at USD 8.2 bn, equivalent to 5.4-months of import cover, compared to the one-year average of 5.1 months, as highlighted below:
Inflation:
The Y/Y inflation rate for the month of February declined to a 6-month low of 4.1% from 4.7% recorded in January in line with our expectations of 4.1% - 4.5%, mainly attributed to the base effect. Month-on-month inflation came in at 0.8%, with the rise attributed to;
- 7% rise in the food and non-alcoholic drinks’ Index, due to a rise in some food items that outweighed declines in others, and,
- A 0.1% rise in the housing, water, electricity, gas and other fuels’ index due to higher cost of some house rents and some cooking fuels. Partly contributing to this, were prices of domestic consumption of electricity that increased by 2.5% and 1.7% for 50 Kwh and 200 KWh, respectively on account of an increase in fuel cost and inflation adjustment charges.
Inflation was however mitigated by the 0.5% decline in the transport index attributable to a decline in pump prices of petrol and diesel. Below is a summary of key changes in the Consumer Price Index (CPI) in November:
|
Major Inflation Changes in the Month of February 2019 |
|||
|
Broad Commodity Group |
Price change m/m (Feb-19/Jan-19) |
Price change y/y (Feb-19/Feb-18) |
Reason |
|
Food & Non-Alcoholic Beverages |
1.7% |
1.1% |
The m/m rise was on account of a rise in some food items that outweighed declines in others |
|
Transport Cost |
(0.5%) |
9.6% |
The m/m decline was on account of a decline in pump prices of petrol and diesel |
|
Housing, Water, Electricity, Gas and other Fuels |
0.1% |
12.4% |
The m/m rise was on account of higher cost of house rents and cooking fuels, coupled with increased prices of domestic electricity consumption due to increase in foreign and inflation adjustment charges |
|
Overall Inflation |
0.8% |
4.1% |
The m/m rise was due to a 1.7% and 0.1% increase in the food index and housing, water, electricity and other fuels index respectively, which have a CPI weight of 36.0% and 18.3% respectively |
Monthly Highlights:
During the month, the National Treasury announced its plan to re-open the sale of the mobile-based infrastructure bond M-Akiba in an effort to attract more takers after the low uptake in 2017, which saw the Government collect Kshs 247.0 mn against a target of Kshs. 1.0 bn. The sale of the mobile-based bond is scheduled to begin on 25th February 2019 and run up to 8th March 2019, with the Treasury targeting Kshs. 250.0 mn. In total, the government plans to raise Kshs 1.0 bn with the next sales scheduled for May, July and August, each targeting Kshs. 250 mn. For more information, see our Cytonn Weekly #08/2019.
The National Treasury released the budgetary review for the first half of the 2018/2019 financial year during the month. The total cumulative revenue in H1’ 2018/2019 amounted to Kshs 794.7 bn against a target of Kshs 855.7 bn (92.9% of the target) while the total expenditure for the period under review amounted to Kshs 1,075.5 bn, against a target of Kshs 1,130.7 bn (95.1% of the target). The cumulative overall fiscal balance (on a commitment basis and excluding grants), amounted to Kshs 280.8 bn (equivalent to 2.8% of GDP) against a targeted deficit of Kshs 275.0 bn (equivalent to 2.8% of GDP). For more information, see our Cytonn Weekly #08/2019.
The Kenya National Bureau of Statistics (KNBS) released the Gross County Product (GCP), which includes a geographic breakdown of Kenya’s Gross Domestic Product (GDP), giving an estimate of the size and structure of county economies. According to the report, the average contribution per county to gross value added over the period 2013-2017 was approximately 2.1%, with Nairobi having the highest contribution at 21.7%, followed by Nakuru and Kiambu at 6.1% and 5.5%, respectively. Isiolo had the lowest contribution coming in at 0.2%, for the same period under review. For more information, see our Cytonn Weekly #07/2019.
The National Treasury released the Draft Kenya Sovereign Wealth Fund Bill, 2019 aimed at providing institutional arrangements for effective administration and efficient management of minerals and petroleum revenues. The Bill is set to establish a clear framework to guide the usage of proceeds from natural resources on the backdrop of the discovery of mineral and petroleum deposits considering that natural resources are exhaustible. The proceeds will be held in an account known as the holding account, which shall be maintained by the Central Bank of Kenya (CBK). Deposits into the account are set to be transferred into the three components of the fund in the following proportions; (i) At least 15.0% to the stabilization component, (ii) At least 60.0% to the infrastructure development component, and, (iii) At least 10.0% to the Urithi component. For more information, see our Cytonn Weekly #07/2019.
The National Treasury released the draft 2019 Budget Policy Statement, which outlines the current performance of the Kenyan economy, as well as give the medium term outlook. The Budget Policy Statement (BPS) is a Government policy document that sets out the broad strategic priorities, policy goals, together with a summary of the Government’s spending plans, as a basis of preparing the FY 2019/20 budget. From the report, the 2019 BPS point to a 7.8% increase of the budget, to Kshs 2.7 tn from Kshs 2.5 tn in the FY’ 2018/19 revised budget, with the recurrent expenditure set to increase at a slower rate than the development expenditure; the recurrent increasing by 7.5% to Kshs 1.7 tn from Kshs 1.5 tn as per the revised budget. For more information, see our Cytonn Weekly #07/2019.
African Development Bank (AfDB) released their African Economic Outlook 2019, highlighting economic prospects and projections for the continent as a whole and for each of the 54 countries. According to the report, Kenya’s economy is expected to expand by 6.0% in 2019 and by 6.1% in 2020, supported by the continued macroeconomic stability, improved business confidence and growth in the tourism sector. AfDB recognized the government fiscal consolidation efforts aimed at reducing the fiscal deficit and reducing reliance on debt by enhancing revenue collection, rationalizing expenditure as well as diversifying funding sources. In summary, the report paints the picture that the country’s macro-economic fundamentals are still stable and the outlook going forward is positive with inflation expected to be within the government set target of 2.5%-7.5% and with the consensus GDP growth as per 16 firms expected to come in at 5.8%.
|
No. |
Kenya 2019 Annual GDP Growth Outlook |
||
|
1 |
Central Bank of Kenya |
6.3% |
|
|
2 |
International Monetary Fund (IMF) |
6.1% |
|
|
3 |
Citigroup Global Markets |
6.1% |
|
|
4 |
African Development Bank (AfDB) |
6.0% |
|
|
5 |
PNB Paribas |
6.0% |
|
|
6 |
UK HSBC |
6.0% |
|
|
7 |
Euromonitor International |
5.9% |
|
|
8 |
World Bank |
5.8% |
|
|
9 |
Cytonn Investments Management Plc |
5.8% |
|
|
10 |
Focus Economics |
5.8% |
|
|
11 |
JPMorgan |
5.7% |
|
|
12 |
Euler Hermes |
5.7% |
|
|
13 |
Oxford Economics |
5.6% |
|
|
14 |
Standard Chartered |
5.6% |
|
|
15 |
Capital Economics |
5.5% |
|
|
16 |
Fitch Solutions |
5.2% |
|
|
Average |
5.8% |
||
For more information on Kenya’s economic prospects in 2019 according to AfDB, see our Cytonn Weekly #06/2019.
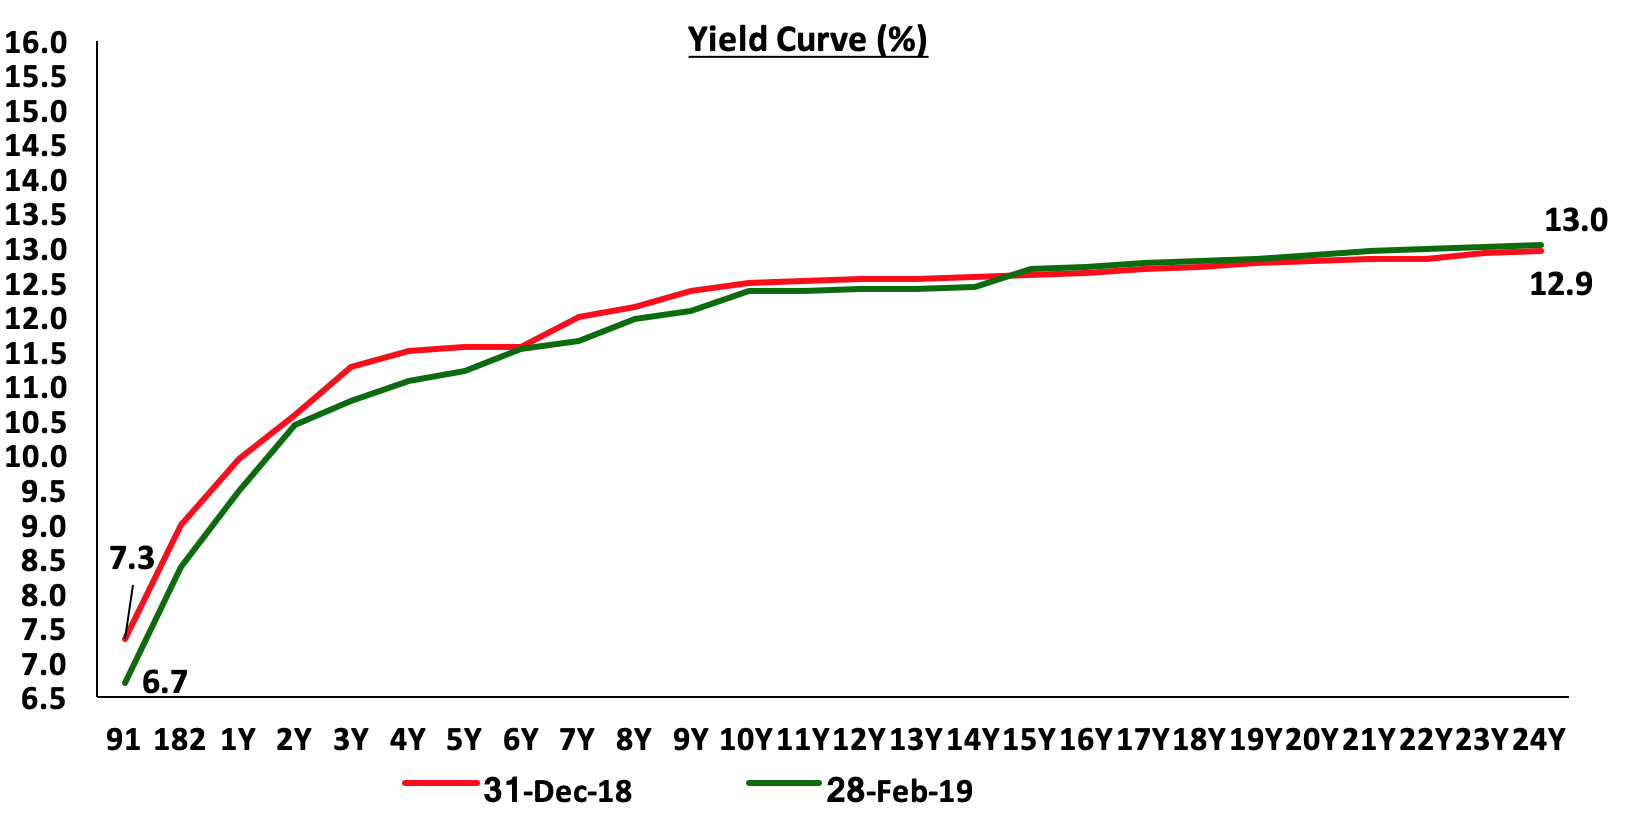
Rates in the fixed income market have remained stable as the government rejects expensive bids, as it is currently 13.3% ahead of its domestic borrowing target for the current financial year, having borrowed Kshs 243.2 bn against a pro-rated target of Kshs 214.7 bn. However, a budget deficit is likely to result from depressed revenue collection, creating uncertainty in the interest rate environment as additional borrowing from the domestic market goes to plug the deficit. Despite this, we do not expect upward pressure on interest rates due to increased demand for government securities, driven by improved liquidity in the market owing to the relatively high debt maturities. Our view is that investors should be biased towards medium-term fixed income instruments to reduce duration risk associated with long-term debt, coupled with the relatively flat yield curve on the long-end due to saturation of long-term bonds.
Market Performance
During the month of February, the equities market had mixed performances with NASI gaining by 1.5%, while NSE 20 and NSE 25 declined by 2.2% and 1.5%, respectively. The gain recorded in NASI during the month was driven by gains in large cap stocks such as Safaricom, NIC Group, Standard Chartered Bank Kenya (SCBK), and KCB Group, which gained by 9.0%, 6.7%, 2.2% and 2.0%, respectively. For this week, markets were on a downward trend, with NASI, NSE 20 and NSE 25 declining by 0.9%, 2.0% and 1.8%, respectively, largely due to declines in NIC Group, Barclays Bank of Kenya (BBK), Diamond Trust Bank Kenya (DTBK) and KCB Group, which declined by 9.8%, 2.2%, 2.0%, and 1.7%, respectively.
Equities turnover declined by 12.3% during the month to USD 137.7 mn, from USD 157.0 mn in January 2019. Foreign investors turned net buyers for the month, with a net buying position of USD 1.2 mn, from January’s net selling position of USD 13.4 mn.
During the week, equities turnover increased by 6.6% to USD 24.7 mn, from USD 23.1 mn the previous week, bringing the year to date (YTD) turnover to USD 294.3 mn. Foreign investors turned net sellers for the week, with a net selling position of USD 1.1 mn, from last week’s net buying position of USD 5.4 mn.
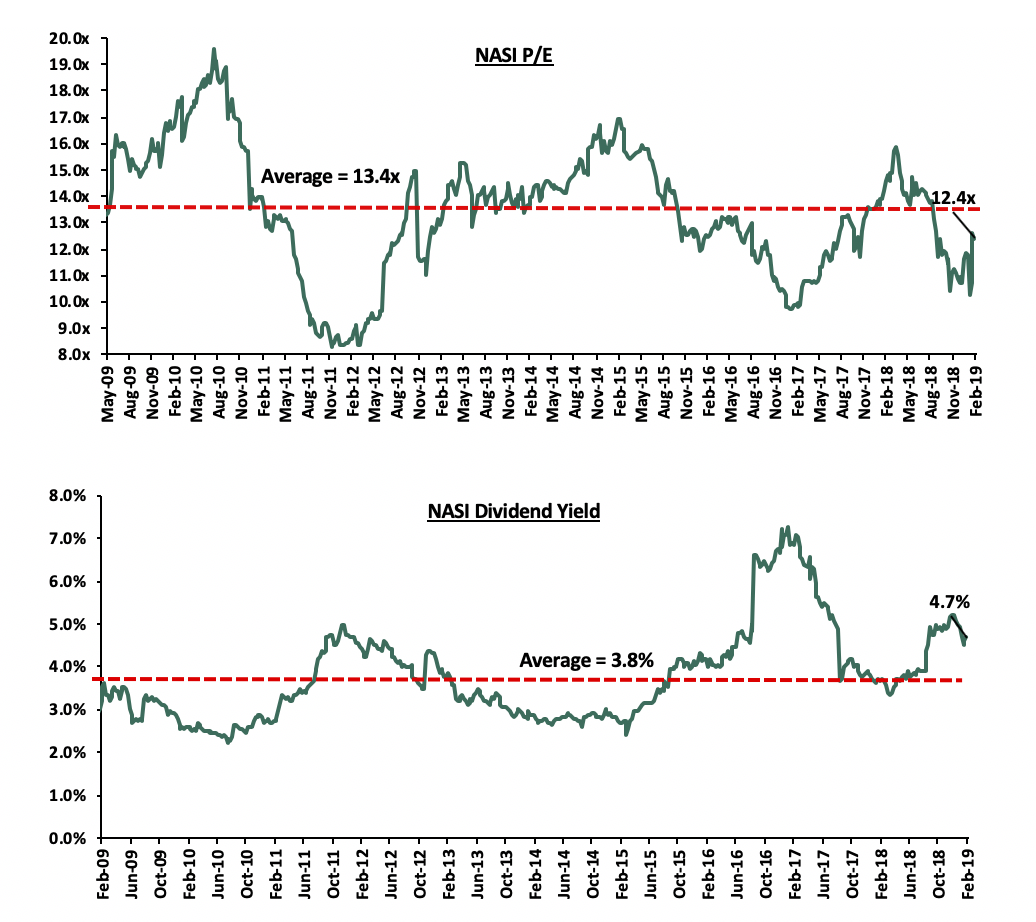
The market is currently trading at a price to earnings ratio (P/E) of 12.4x, 7.4% below the historical average of 13.4x, and a dividend yield of 4.7%, above the historical average of 3.8%. With the market trading at valuations below the historical average, we believe there is value in the market. The current P/E valuation of 12.4x is 26.4% above the most recent trough valuation of 9.8x experienced in the first week of February 2017, and 49.1% above the previous trough valuation of 8.3x experienced in December 2011. The charts below indicate the historical P/E and dividend yields of the market.
Earnings releases
Stanbic Holdings released their FY’2018 financial results with core earnings per share increasing by 45.7% to Kshs 15.9 from Kshs 10.9 in FY’2017, exceeding our expectations of a 12.8% increase to Kshs 12.3. The increase was driven by a 15.9% growth in total operating income, coupled with a 4.0% decline in total operating expenses.
Highlights of the performance from FY’2017 to FY’2018 include;
- Total operating income rose 15.9% to Kshs 22.1 bn from Kshs 19.1 bn in FY’2017, driven by the 18.3% growth in Non-Funded Income (NFI), coupled with the 14.0% growth in Net Interest Income (NII),
- Interest income from the banking unit rose 13.8% to Kshs 18.9 bn from Kshs 16.6 bn in FY’2017. The rise in interest income was largely due to a 17.7% increase in interest income on loans and advances to Kshs 14.2 bn from Kshs 12.1 bn in FY’2017. Interest income on Government Securities remained relatively flat at Kshs 4.3 bn. The yield on interest-earning assets declined marginally to 7.9% from 8.0% in FY’2017;
- Interest expense increased by 19.2% to Kshs 7.2 bn from Kshs 6.0 bn in FY’2017. The rise in interest expense was due to a 21.2% rise in interest expense on customer deposits to Kshs 4.5 bn from Kshs 3.7 bn in FY’2017, coupled with the 11.3% rise in interest expense on deposits and placements from banking institutions to Kshs 1.9 bn from Kshs 1.7 bn in FY’2017. Consequently, the costs of funds rose marginally to 3.5% from 3.4% in FY’2017. The Net Interest Margin declined marginally to 5.0% from 5.1% in FY'2017;
- Non-funded income (NFI) rose by 18.3% to Kshs 10.0 bn from Kshs 8.4 bn in FY’2017, mainly driven by a 15.5% increase in other fees and commissions to Kshs 3.7 bn from Kshs 3.2 bn in FY’2017, coupled with a 14.0% y/y rise in foreign exchange income to Kshs 3.1 bn from Kshs 2.7 bn. Other income rose 27.5% to Kshs 2.4 bn from Kshs 1.8 bn. The current revenue mix shifted to 55:45 NII to NFI from 56:44 in FY’2017, owing to the faster rise in NFI;
- Total operating expenses declined by 4.0% to Kshs 13.2 bn from Kshs 13.7 bn in FY’2017, following a 25.2% decline in Loan loss provision (LLP) to Kshs 2.1 bn from Kshs 2.8 bn in FY’2017. Staff costs however rose by 2.9% to Kshs 5.6 bn from Kshs 5.4 bn in FY’2017. Without LLP, operating expenses increased by 1.7% to Kshs 11.1 bn from the Kshs 10.9 bn registered in FY’2017;
- The cost to income ratio improved to 59.5% from 71.7% in FY’2017. Without LLP, the cost to Income ratio also improved to 50.2% from 57.2% in FY’2017;
- Profit before tax increased by 65.7% to Kshs 8.9 bn from Kshs 5.4 bn, while profit after tax (PAT) increased by 45.7% to Kshs 6.3 bn from Kshs 4.3 bn in FY’2017, owing to an increase in the effective tax rate to 29.8% from 20.2% in FY’2017;
- The bank recommends a final dividend of Kshs 3.55 per share, having already paid an interim dividend of Kshs 2.25 per share, translating to a total dividend payout of Kshs 5.8 per share in 2018, a 10.5% increase from the Kshs 5.25 paid in 2017, which translates to a dividend payout of 36.5%, and a dividend yield of 6.2%;
- The balance sheet recorded an expansion in FY’2018, with total assets increasing by 16.8% to Kshs 290.6 bn from Kshs 248.7 bn in FY’2017, driven by a 22.1% rise in the loan book to Kshs 175.0 bn from Kshs 143.3 bn in FY'2017. Investment securities declined by 5.2% to Kshs 72.3 bn from Kshs 76.2 bn in FY’2017;
- Total liabilities increased by 19.5% to Kshs 246.0 bn from Kshs 205.8 bn in FY’2017, driven by the 13.5% growth in customer deposits to Kshs 219.5 bn from Kshs 193.4 bn in FY’2017, and the 77.1% growth in borrowings to Kshs 7.1 bn from Kshs 4.0 bn in FY’2017;
- The faster growth in loans compared to deposits led to a rise in the loan to deposit ratio to 79.7% from 74.1% in FY’2017;
- Gross Non-Performing Loans (NPLs) grew by 60.7% to Kshs 16.6 bn from Kshs 10.4 bn in FY’2017, faster than the growth in loans, which saw the NPL ratio worsen to 9.1% from 7.0% in FY’2017. Loan loss provisions (LLP) increased by 88.1% to Kshs 6.1 bn from Kshs 3.2 bn, leading to an improvement in the NPL Coverage to 53.4% up from 47.4% in FY’2017;
- Shareholders’ funds increased by 3.9% to Kshs 44.6 bn from Kshs 43.0 bn, as the revenue and other reserves account rose by 6.6% to Kshs 25.7 bn from Kshs 24.1 bn in FY’2017;
- Stanbic Bank is currently sufficiently capitalized with a core capital to risk weighted assets ratio at 14.6%, 4.1% above the statutory requirement, with total capital to total risk weighted assets exceeding statutory requirement by 2.9% to close the period at 17.4%, and,
- Stanbic Holdings currently has a return on average assets of 2.3% and a return on average equity of 14.3%.
Key Take outs:
- Stanbic Holdings registered strong performance on NFI, which grew by 18.6%, underpinning the importance of revenue diversification, following the capping of interest rates. The bank has been aggressive in generating non-funded income, which now accounts for 45.1% of its operating income, given earnings from interest income is expected to remain depressed due to the interest rate cap,
- The bank’s efficiency significantly improved with the cost to income ratio coming in at 59.5%, from 71.7% as at FY’2017. We note that revenue expansion and cost containment have been key in improving the bank’s efficiency. However, the decline in costs was largely driven by the decline in LLPs, which remains unsustainable in the long term, and,
- The NPL ratio worsened to 9.1% with the gross non-performing loans growing by 60.7%, indicating a weakening in asset quality. We note that management’s focus should be on continuous risk assessment and management, mainly aimed at ensuring the bank’s asset quality improves.
For more analysis, see our Stanbic Holdings Earnings Update here.
Monthly Highlights
During the month, The Central Bank of Kenya (CBK) published draft regulations for mortgage refinance companies (MRCs), setting the stage for creation of a State-backed firm that will advance cash to banks for onward lending to home buyers. Through the CBK (Mortgage Refinance Companies) Regulations 2019, the regulator provides for establishment of non-deposit taking firms under the Companies Act, licensed by the CBK to conduct mortgage refinance business. The MRCs will be used to advance loans to primary mortgage lenders such as commercial banks, microfinance banks and Savings and Cooperative Societies (Sacco’s) using funds from the capital markets so as to provide affordable mortgages to eligible individuals. Refinance firms are being fashioned as implementation vehicles for meeting Kenya’s affordable housing plan that targets 500,000 decent, affordable housing units by the year 2022. According to the CBK, the regulations are intended to provide a clear framework for licensing, capital adequacy, liquidity management, corporate governance, risk management as well as reporting requirements of MRCs. The draft regulations for MRCs are almost similar to those of commercial banks. According to the draft, which was subjected to public comments up to the end of the month of February, the set-up of MRCs include:
- Minimum core capital of MRCs will be at least Kshs 1.0 bn, which is the same level as that of commercial banks,
- The MRCs will be required to have a master servicing and refinancing agreement governing the lending operations between the mortgage refinance company and the participating primary mortgage lenders, and,
- CBK proposes that no MRC shall grant direct finance to any primary mortgage lender of amounts exceeding 25.0% of core capital.
The draft regulations come at a time the Housing Fund Regulations (2018) are also still in draft form and deductions are yet to be made from formal employees towards funding the housing projects. For more information, please see our analysis in the Nyeri Real Estate Investment Opportunity 2019, & Cytonn Weekly #08/2019.
According to data released by The Kenya National Bureau of Statistics (KNBS), commercial banks in Kenya reduced their deposit rates to 5.7% in November 2018, the lowest in 15-months, from a high of 7.0% in February 2018. This comes after the removal of the 70.0% of the Central Bank Rate (CBR) floor, following the approval the Finance Bill 2018 by Parliament, and the Finance Act 2018 being signed into law in September 2018. The removal of the floor on deposit rates and retention of a ceiling on lending rate has failed to unlock credit to the private sector with the private sector credit growth coming in at 2.4% in the 12-months to December 2018, slower than the 3.0% recorded in the 12-months to November 2018. The reduction in deposit rates by banks is in a bid to increase their Net Interest Margins (NIM), by reducing the associated interest expenses.
The International Finance Corporation (IFC) entered into a technical advisory agreement with Equity Bank to offer technical advisory services with the aim of helping the lender to better its customer base of small and medium-sized (SME) customers. The project will see the development of new products and services tailored mainly for the SMEs. It will assist Equity Group design and deliver an efficient SME business model, improve SME credit related processes, and train staff to effectively serve the targeted SME segments. Equity Bank is already the country’s leading SME bank with the segment comprising close to 60% of the bank’s loan portfolio with the lender having 10.0 mn customers in Kenya. The bank is well placed to deliver additional products and services to its SME customers given its country-wide coverage through a network of 177 branches and over 32,000 agents, and its innovative digital channels. Equity bank becomes the latest local bank to benefit from IFC’s technical advisory services, after Co-op Bank, which is also getting IFC’s input in a Kshs 243.6 mn deal to help the lender expand its digital banking services. We note that various lenders in the local banking space such as KCB, Co-operative bank and I&M bank have been increasing focus on the SME banking segment, which was adversely affected by the implementation of the Banking (Amendment) Act 2015, as access to credit became difficult, with banks citing inability to price SME risks within the margins set under the law. Banks have been obtaining finance from international institutions mainly for onward lending to the private sector mainly comprise of SMEs, so as to plug a funding deficit occasioned by a mismatch in their assets and liabilities by tenor, as deposits tend to be relatively short term while loans are relatively long term. Please see our Fintech Impact on Kenya’s Financial Services Industry, & Cytonn Weekly #07/2019 for a more detailed analysis.
The Capital Markets Authority (CMA) released The Report on the State of Corporate Governance of Issuers of Securities to The Public in Kenya. The findings suggest a “Fair” status of 55.0% weighted overall score in the application of corporate governance practices by Kenyan issuers of securities to the public. The report analyzed 62 listed companies and 5 issuers of corporate bonds. The principles analyzed were; (i) Commitment to Good Corporate Governance, (ii) Board Operations and Control, (iii) Rights of Shareholders, (iv) Stakeholders Relations, (v) Ethics and Social Responsibility, (vi) Accountability, Risk Management and Internal Control, and (vii) Transparency and Disclosure. The report used four score ratings: (i) “Leadership” compliance of 75% and above, (ii) “Good” compliance of between 74% and 65%, (iii) “Fair” compliance of between 64% and 50%, and (iv) “Needs Improvement” compliance of below 50%. The report ranked 3 companies in “Leadership”, 5 companies in “Good” , 31 companies in “Fair” and 17 in “Needs Improvement”. The report did not disclose the specific company ranks but noted that 3 issuers in “Leadership” were from the banking sector, while the 5 issuers in “Good” rating comprised of 2 from banking, 2 from commercial and services and 1 from manufacturing and allied sectors. For a more detailed analysis, please see our Consolidation in Kenya’s Banking Sector to Continue, & Cytonn Weekly #06/2019
Universe of Coverage
Below is our universe of coverage table;
|
Banks |
Price as at 22/02/2019 |
Price as at 1/03/2019 |
w/w change |
YTD Change |
Target Price* |
Dividend Yield |
Upside/Downside** |
P/TBv Multiple |
P/E |
|
GCB Bank |
4.1 |
3.5 |
(14.4%) |
(23.7%) |
7.7 |
10.8% |
130.8% |
0.8x |
5.6x |
|
Diamond Trust Bank |
152.0 |
148.0 |
(2.6%) |
(5.4%) |
283.7 |
1.8% |
93.4% |
0.9x |
6.3x |
|
Access Bank |
6.4 |
5.7 |
(10.9%) |
(16.2%) |
9.5 |
7.0% |
73.7% |
0.4x |
2.7x |
|
KCB Group*** |
42.5 |
41.3 |
(2.7%) |
10.3% |
61.3 |
7.3% |
55.7% |
1.3x |
5.9x |
|
I&M Holdings |
93.8 |
92.0 |
(1.9%) |
8.2% |
138.6 |
3.8% |
54.5% |
0.9x |
5.1x |
|
CRDB |
135.0 |
135.0 |
0.0% |
(10.0%) |
207.7 |
0.0% |
53.9% |
0.5x |
5.1x |
|
UBA Bank |
8.0 |
7.6 |
(5.0%) |
(1.3%) |
10.7 |
11.2% |
52.0% |
0.5x |
3.4x |
|
Zenith Bank |
25.3 |
23.9 |
(5.5%) |
3.7% |
33.3 |
11.3% |
50.7% |
1.1x |
5.4x |
|
CAL Bank |
0.9 |
1.0 |
7.7% |
0.0% |
1.4 |
0.0% |
42.9% |
0.8x |
3.5x |
|
Co-operative Bank |
14.7 |
14.5 |
(1.0%) |
1.4% |
19.9 |
5.5% |
42.8% |
1.3x |
7.1x |
|
Equity Group |
41.4 |
40.8 |
(1.4%) |
17.1% |
56.2 |
4.9% |
42.6% |
2.0x |
7.5x |
|
Ecobank |
7.5 |
7.8 |
3.7% |
3.3% |
10.7 |
0.0% |
38.5% |
1.7x |
8.9x |
|
NIC Group |
39.9 |
36.0 |
(9.7%) |
29.5% |
48.8 |
2.8% |
38.3% |
0.9x |
6.2x |
|
Stanbic Bank Uganda |
28.8 |
29.0 |
0.9% |
(6.5%) |
36.3 |
4.0% |
29.1% |
2.1x |
7.7x |
|
Union Bank Plc |
7.0 |
6.7 |
(4.3%) |
19.6% |
8.2 |
0.0% |
21.6% |
0.7x |
8.6x |
|
Barclays Bank |
11.8 |
11.3 |
(4.7%) |
2.7% |
12.5 |
8.9% |
20.0% |
1.5x |
8.5x |
|
HF Group |
6.4 |
6.0 |
(6.3%) |
8.3% |
6.6 |
5.8% |
15.8% |
0.2x |
2.1x |
|
Bank of Kigali |
276.0 |
275.0 |
(0.4%) |
(8.3%) |
299.9 |
5.0% |
14.1% |
1.5x |
8.1x |
|
SBM Holdings |
6.0 |
6.0 |
0.3% |
1.0% |
6.6 |
5.0% |
14.0% |
0.9x |
6.0x |
|
Guaranty Trust Bank |
38.0 |
35.5 |
(6.6%) |
3.0% |
37.1 |
6.8% |
11.3% |
2.2x |
6.0x |
|
Standard Chartered |
201.8 |
199.0 |
(1.4%) |
2.3% |
196.3 |
6.3% |
4.9% |
1.6x |
8.6x |
|
Stanbic Holdings |
91.3 |
95.0 |
4.1% |
4.7% |
92.6 |
6.2% |
3.6% |
0.9x |
6.1x |
|
Bank of Baroda |
134.0 |
135.0 |
0.7% |
(3.6%) |
130.6 |
1.9% |
(1.4%) |
1.2x |
40.4x |
|
Standard Chartered |
21.0 |
21.0 |
0.0% |
0.0% |
19.5 |
0.0% |
(7.3%) |
2.6x |
8.6x |
|
FBN Holdings |
8.3 |
7.8 |
(6.6%) |
(2.5%) |
6.6 |
3.2% |
(11.2%) |
0.4x |
5.4x |
|
Stanbic IBTC Holdings |
48.5 |
46.5 |
(4.1%) |
(3.0%) |
37.0 |
1.3% |
(19.1%) |
2.4x |
10.1x |
|
National Bank |
6.0 |
6.1 |
1.7% |
14.7% |
4.9 |
0.0% |
(19.7%) |
0.5x |
3.8x |
|
Ecobank Transnational |
14.2 |
14.0 |
(1.1%) |
(17.6%) |
9.3 |
0.0% |
(33.7%) |
0.5x |
6.3x |
|
*Target Price as per Cytonn Analyst estimates ** Upside/ (Downside) is adjusted for Dividend Yield ***Banks in which Cytonn and/or its affiliates are invested in ****Stock prices indicated in respective country currencies
|
|||||||||
We are “Positive” on equities for investors as the sustained price declines has seen the market P/E decline to below its historical average. We expect increased market activity, and possibly increased inflows from foreign investors, as they take advantage of the attractive valuations, to support the positive performance.
During the month of February, there was private equity activity in the education, hospitality and telecommunications sectors.
Education Sector:
The African Management Initiative (AMI), a Pan-African company focused on skills development and workplace learning announced the close of a USD 1.8 mn (Kshs 180.2 mn) Series A funding round aimed at promoting in-person as well as on-the-job training for staff in African countries. Investisseurs & Partenaires (I&P), a French impact investing group dedicated to Sub-Saharan Africa, invested USD 1.0 mn in the funding round. The remaining USD 0.8 mn was contributed by Adolf H. Lundin (AHL) Ventures Partners, an impact investment firm based in Lichtenstein focused on high-growth businesses in Africa, and the Argidius Foundation, an organization that provides business support for small and medium sized enterprises in developing markets. For more information on the transaction, see our Cytonn Weekly #8/2019.
Hospitality Sector:
Inside Capital Partners, a Mauritian independent private equity manager announced a commitment to invest USD 7.5 mn (Kshs. 750 mn) in Latitude Hotels Group, an African lifestyle hospitality Group based in Zambia, for an undisclosed stake. The investment in Latitude Hotels becomes the second transaction of Inside Capital Partners after acquisition of a minority stake in Kalulushi Clay Brick, Zambia’s largest clay brick factory, following the close of its first fund, Inside Equity Fund, with a size of USD 34.0 mn (Kshs 3.4 bn) , in December 2017. The fund was backed by Triple Jump, a development finance institution focused on financial sectors in developing countries, and a mix of family offices and other regional industrial players. For more information see our Cytonn Weekly #8/2019. In a press release made during the week, Helios, the majority (60.0%) shareholder in Telkom announced its plan to reduce shareholding in Telkom by up to 20.0% while the government, which holds 40.0% plans to retain as little as 10.0%.
Telecommunication Sector:
Kenya’s second and third largest telecommunication companies, Airtel and Telkom, announced the signing of a binding agreement that will see the shareholders of the two companies merge their respective mobile, enterprise, and carrier services businesses in Kenya to operate under a joint venture company. The overall effect to the market is that we will now have a company that has scale to provide a credible market alternative to the currently dominant Safaricom. For a detailed analysis of the expected effect of the merger, see our Cytonn Weekly #8/2019.
Reports Released During the Month:
- African Private Equity and Venture Capital Association (AVCA) released two reports after completing two sets of surveys on institutional investors in Africa. The reports are:
- The 2018 Annual Limited Partner (LP) Survey, a study that analyses the plans, views, preferences, expectations and evolving attitudes of 60 Limited Partners (LPs) from Africa, Asia, Europe and North America regarding Private Equity (PE) in Africa.
- The 2019 Profile of Africa’s Institutional Investors that maps the different pools of capital for African private equity. It also gives an overview of the demographics of institutional investors with allocations to Africa. See the analysis of both reports in our Cytonn Weekly #8/2019.
- The Competition Authority of Kenya (CAK) released their 2018 Annual Report, which highlighted the number of mergers that the Authority handled. The Authority handled 150 merger notifications in 2018, a 15.4% increase from 130 merger notifications handled in 2017. The merger notifications were mainly from the following sectors; manufacturing, real estate, distribution, investment, services, advertising and agriculture, which accounted for 51.2% of all the mergers that were notified to the Authority while other sectors accounted for the balance of 48.8%. For more information see our Cytonn Weekly #7/2019
- During the week, African Private Equity and Venture Capital Association (AVCA) released the private credit strategies in Africa report. The report provides an overview of some of the key opportunities and challenges facing the private credit industry in Africa.
According to the report a major driver of the increasing interest in private credit in Africa relates to the difficulties that small and medium-sized enterprises (SMEs) in Africa often face in accessing financing through traditional avenues, such as banks. As noted by the African Development Bank (AfDB), 18.0% of small firms and nearly 14.0% of medium-sized firms in Africa cite lack of finance as their biggest business obstacle. In 2017, the International Finance Corporation (IFC) estimated the finance gap for the 44 mn micro, small and medium-sized enterprises in sub-Saharan Africa to be USD 331.0 bn, with over half of these enterprises being financially constrained. As indicated in the chart below, sub-Saharan Africa lags other regions around the world when it comes to a variety of access to credit indicators;
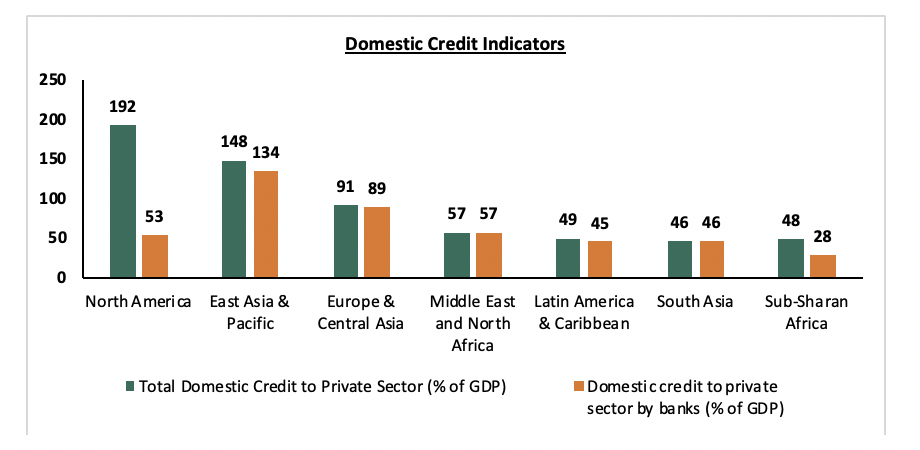
Source: World Bank World Development Indicators, 2017
The indicators above highlight some of the potential that the private credit asset class has in Africa over the coming years. The report, provided an overview of some of the key opportunities and challenges facing private credit in Africa. The results were in form of a series of interviews that were conducted with firms either currently or historically active in private credit investing in Africa. The conclusion of the report was as follows;
- A key theme that emerged was that the industry relating primarily to senior and mezzanine debt investing) faces a supply issue rather than one of demand. That is, there is insufficient backing from institutional investors to the credit managers on the continent, particularly when considered in the context of the extent of the demand that there is amongst small and medium-sized enterprises anxious for funding.
- The outlook appears more positive; most Limited Partners (LPs) expect African private credit to be more attractive compared to other emerging markets and to developed markets over a ten-year time horizon, while 50.0% of those interviewed plan to increase their allocation to the sector over the next three years. However, LPs cited currency risk, legal, regulatory, and tax issues as some of the key challenges that they have faced when seeking to invest in the asset class.
- Overall, private credit does offer another option for investors to consider in Africa. Ultimately, however, the challenge for credit managers in Africa will be to continue to show institutional investors evidence of the de-risked nature of the returns that they can provide.
Private capital is set to play a major role in providing funds for lending to micro, small and medium-sized enterprises in sub-Saharan Africa. We expect to see more capital injection in microfinance institutions, banks, and digital lending institutions.
We maintain a positive outlook on private equity investments in Africa as evidenced by the increasing investor interest, which is attributed to; (i) economic growth, which is projected to improve in Africa’s most developed PE markets, (ii) attractive valuations in Sub Saharan Africa’s private markets compared to its public markets, and (iii) attractive valuations in Sub Saharan Africa’s markets compared to global markets. Going forward, the increasing investor interest, stable macro-economic and political environment will continue to boost deal flow into African markets.
In this report, we have highlighted industry reports that were released during the month, after which we then delve into the review of the residential, commercial, hospitality and listed real estate sectors activities during the month.
- Industry Reports:
Various real estate research houses released reports during the month of February, highlighting the performance of the real estate sector:
|
Industry Reports Released in February 2019 |
||
|
Coverage |
Report |
Key Take Outs |
|
Real Estate Market Review 2018 by Knight Frank |
· High-end Residential prices declined by 4.5% in 2018, 3.6% points more compared to a decline of 0.9% in 2017, attributable to a general oversupply in the upper spectrum of the market, which have rendered the market a buyer’s market, thus driving prices down as a way of price correction, · In the Office Sector, asking rents in Nairobi stagnated during H2’2018 at Kshs 130 per SQFT, a result of the market’s oversupply. Absorption of Grade A office space, however, increased by 63.0% during H2’2018 compared to H1’2018, attributable to the attractive locations of the various Grade A offices delivered to the market, · In the Retail Sector, monthly rents in prime nodes remained flat during H2’2018 as the market adjusts to the surplus space supply in certain locations, making it a tenant’s market. However, occupancy for established malls remained relatively high at over 90.0%, with new malls registering lower occupancies of 45-75%. · For more information, please see Cytonn Weekly #08/2019 |
|
|
Real Estate Market Outlook 2019 by Vaal Real Estate |
· The Retail Sector recorded rental yields of 9.0% - 10.0% in 2018, with 6.0% points increase in occupancy to 84.0% in 2018, from 78.0% in 2017, attributed to attractive lease terms offered by property owners and increased demand for retail space from local and international retailers. The retail outlook for 2019 is generally Positive with consumer spending and online retailing expected to grow, · The Commercial Office Sector recorded yields of 7.0% to 8.0% in 2018, with average prices of Kshs 13,000 per SQFT to Kshs 15,000 per SQFT and average rental rates of Kshs 149.2 per SQFT. The outlook in the sector remains Positive with investment opportunities in smaller working spaces of less than 250 SQM, serviced shared spaces and long-term leases for larger spaces, · The Residential Sector recorded yields ranging from 4.0% to 6.0% in 2018 with Westlands, Parklands and Kilimani recording the highest occupancy rates at 92.0%, 89.0%, and 84.0%, respectively. The outlook for the sector is Positive as investors increasingly embrace the off-plan sales model in order to buy at discounted prices and realize capital gains upon completion, · In the Hospitality Sector, serviced apartments recorded yields of between 6.0% and 9.0% at an average occupancy rate of 74.0% in 2018, with the highest demand for the units coming from corporate and private residents recording 62.0% and 30.0%, respectively. The outlook is Positive with the investment opportunity being in lower grade serviced apartments that provide basic facilities at an affordable cost. · For more information, please see Cytonn Weekly #07/2019 |
|
|
Nyeri Real Estate Market Performance by Cytonn Real Estate |
· The Residential Sector in Nyeri recorded improved performance with an average rental yield of 5.1%, compared to the 4.1% recorded in 2017, attributed to an increase in demand, with average occupancy growing by 8.0% points from 82% in 2017 to 90% in 2019, · The Commercial Sector recorded a slight decline in average rental yield to 12.1% from 13.5% in 2017, attributed to the decline in occupancy rates from the 89.0% recorded in 2017 to 87.0% in 2019, resulting from the growing supply of space in the market, · The Land Sector recorded a relatively high capital appreciation of 19.1% compared to the 17.3% recorded in 2017, attributed to increased demand for plots in site and service schemes as prospective home-owners prefer to buy land and build their own houses, · The outlook for the real estate market in Nyeri is Positive, with the investment opportunity being mainly in site and service schemes, and in the commercial sector given the relatively high yields of 12.1% per annum and the existing market gap for quality commercial buildings. · For more information, please see Cytonn Weekly #08/2019 |
|
|
Residential Sector Performance by Kenya Bankers Association |
· Residential prices rose by 1.5% in Q4’2018, a 0.1% points q/q rise compared to 1.4% in Q3’2018 and this was attributed to reduced supply due to credit constraints on the developers’ side, while demand has continued to be boosted by buyers’ preference for new buildings, driving selling prices up for new stock, · Apartments accounted for 76.3% of the total transaction volumes during Q4’2018, followed by bungalows and maisonettes with 12.1% and 11.6%, respectively attributable to the affordability of apartments given that they have relatively lower construction costs per unit. · For more information, please see Cytonn Weekly #08/2019 |
|
|
Retail Sector Performance by Broll Kenya |
· The market recorded a 5.0% increase in supply of retail space to 5.7 mn SQFT in H2’2018, from 5.4 mn SQFT recorded in H1’2018, attributed to the opening of spaces such as The Well in Karen, which brought into the market 77,371 SQFT of space, · The sector recorded a 6.0% points y/y increase in occupancy rates in H2’2018, and this was mainly attributed to the uptake of space that was previously occupied by Nakumatt Supermarkets, in addition to the entry of new international retailers, across the fashion, sportswear and hypermarket categories, · On average, monthly rent for anchor tenants came in at between Kshs 55.0 per SQFT and Kshs 100.0 per SQFT, while that of line shops ranged between Kshs 120.0 and Kshs 340.0 per SQFT. · For more information, please see Cytonn Weekly #06/2019 |
|
- Residential Sector:
Developers continued to undertake projects across the low-income, mid-end and high-end segments as follows;
- Low Income Residential Segment- The Nairobi City County, through the County Assembly Committee on Housing, has awarded six companies tenders to construct 8,000 affordable houses in Nairobi. These companies include Technofin Kenya, Erdemann Property, Green Prestik, Jabavu Village, Stanlib Kenya and Directline Assurance Limited. The project is part of the Urban Renewal and Housing Regeneration Programme targeting Old and New Ngara, Jeevanjee, Suna Road, Ngong Road Phases One and Two, Bachelors’ Quarters, and Pangani,
- Lower Mid-end Residential Segment - Sprinter Real Estate Investment, an American investor, and Third Eye Management and Associates, a US-based firm, announced their plans to construct 300 houses in Ndenderu, Kiambu County. The 300-unit project, dubbed Fanisi Tigoni View, will sit on 8-acres of land and comprises of 2 and 3-bedroom apartments of 84 SQM and 115 SQM, selling at Kshs 5.2 mn and Kshs 5.9 mn, respectively, which translates to an average of Kshs 56,604 per SQM. For more information, please see Cytonn Weekly #06/2019, and,
- High-End Residential Segment - Cytonn Real Estate broke ground on the construction of a Kshs 2.5 bn gated community development dubbed “Applewood”, located in Miotoni, Karen. The signature development shall comprise 5-bedroom luxury homes, each sitting on 1/2 acre.
We expect to see continued focus on the lower spectrum of the market, as stakeholders aim to address the housing shortage, with the government of Kenya at the forefront. In the upper spectrum, investors will continue targeting niche markets, which are still exhibiting positive performance. For our review on the investment opportunity in the residential market, see Cytonn 2019 Real Estate Markets Outlook
- Commercial Sector:
During the month, the retail sector recorded mixed activities with the continued entry of international retailers into the Kenyan market, while some local retailers continue to experience constrained performance. The sector was characterized by the following activities;
- Ebrahim Supermarkets, a local retailer, closed its outlet situated at Wazir House, at the Junction of Moi Avenue and Kenyatta Avenue, reasons undisclosed, remaining with only one electronics and computer distribution unit situated along Kimathi Street, in Nairobi, having previously closed other stores in Kisumu, Nakuru and Mombasa,
- Ukwala Supermarkets, applied for permanent closure of its business after revealing that it had been unable to pay off its debts, which included amongst others, creditors’ claims and the Kenya Revenue Authority (KRA) debt amounting to Kshs 930 mn and Kshs 840 mn, respectively. The retailer had already sold 75.0% of their stake to Botswana retailer Choppies in March 2016, in the form of 10 out of its 14 stores.
We attribute the closure and downsizing of local retailers to i) financial constraints, which have forced retailers to embark on restructuring e.g. Ukwala and Uchumi Supermarkets, ii) poor supply chain management and governance practices in the case of family-owned Nakumatt Holdings, and iii) limited in-store products owing to the small size of the outlets compared to competitors and failure to adapt to market trends mainly on product differentiation, in the case of Ebrahim Supermarkets, thus not able to meet clients’ ever-changing preferences.
- Grill Shack, a Dubai-based food chain, opened its first restaurant in Kenya at the Westgate Shopping Mall in Westlands, Nairobi. The Westlands retail sector continues to attract international vendors driven by its positioning as an affluent neighborhood hosting middle to high-income earners with relatively high purchasing power, the supply of high-quality retail spaces and growing demand for international brands from the expanding middle and wealthy classes. For more analysis, please see Cytonn Weekly #06/2019
We retain a Neutral outlook for the retail real estate sector propelled by continued expansion of international retailers, who are taking up retail spaces thus cushioning the market. According to our research, the retail sector recorded an average occupancy rate and rental yield of 79.8% and 9.0%, respectively in 2018 down from an average of 80.3% and 9.6%, respectively in 2017.
- Infrastructure
The government continues to undertake infrastructural development with the aim of improving the ease of doing business and transforming Kenya to middle-income status by 2030. In February, we noted the following activities;
- Kiambu County’s Senator Paul Wamatangi announced plans to revamp Kiambu Road to a dual carriageway from Muthaiga to Githunguri Town. The road, set to be complete by 2022, will also connect to the Uplands- Githunguri - Ruiru Road, which is currently under reconstruction and connects Thika Superhighway and Nairobi - Nakuru Highway. Kiambu Road serves various real estate investment hotspots such as Ridgeways, Runda, Runda Mumwe, and Thindigua. For more information, please see Cytonn Weekly #08/2019
- The Kenya National Highways Authority (KeNHA) announced the start of the construction of the Western Bypass starting from Gitaru linking to Southern Bypass and terminating at Ruaka, in Kiambu County. This road will include 17.4 km of service lanes, seven interchanges at the major junctions of Wangige, Kihara, Ndenderu, Ruminyi, Kabete, Banana and Ruaka, five underpasses and three-foot bridges. The project is financed by the Exim Bank of China and is being undertaken by the China Road and Bridge Corporation, at a cost of Kshs 17 bn.
The planned improvement and construction of new roads will lead to better accessibility and reduce traffic congestion that is usually rampant during peak hours. Consequently, we expect this to result in increased demand for property in the Kiambu county, mainly Ruiru, Githunguri, Thindigua and Ruaka thus driving prices upwards.
- Statutory Reviews
The Cabinet approved a bill on sectional property, which seeks to simplify the registration of sectional property titles in Kenya. Currently, the process is dictated by Sectional Properties Act No. 21 of 1987, which has been touted as cumbersome. Common practice among developers is setting up a corporation, which owns the freehold or the main lease to the property, and then sub-leases are offered to homebuyers together with a share in the corporation, which gives them rights to common areas. However, this method restricts the rights of the property owners to the terms of the sub-lease, which may also be unacceptable as collateral for bank loans. The new bill, if signed into law, will allow high-rise property owners to own sectional titles, which can be collateralized, thus, improving real estate transactions, as clients also tend to shy away from purchasing flats/apartments due to the unclear law around ownership in such shared projects.
- Listed Real Estate
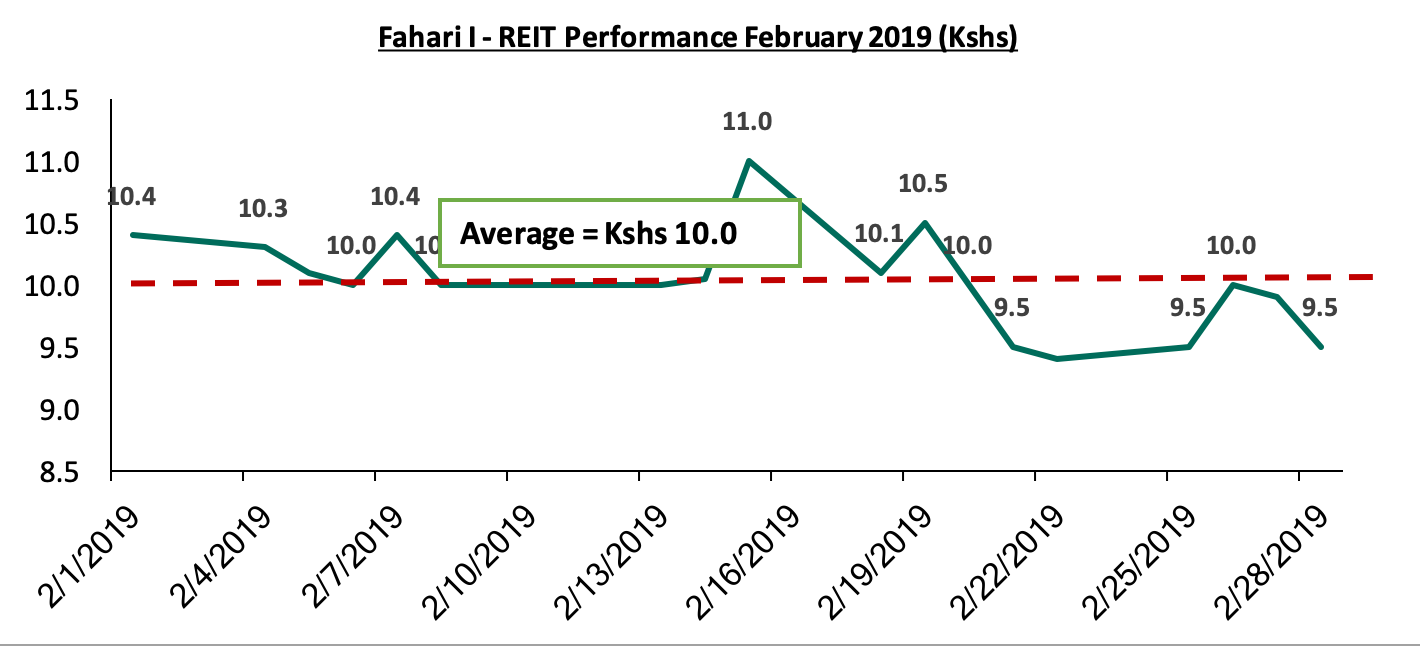
During the month, Stanlib’s Fahari I-REIT saw a decrease of 5.9%, closing at Kshs 9.5 per share from Kshs 10.1 per share at the end of January 2019. On average, the REIT traded at Kshs 10.0 per share, a 1.0% drop from an average of Kshs 10.1 per share in January 2019. The prices of the instrument have remained low largely due to: i) Fahari I – REIT performing poorly with a dividend yield of 5.7% as opposed to brick and mortar retail and office in Nairobi with 8.1% and 9.0%, respectively, ii) inadequate investor knowledge, and iii) lack of institutional support for REITs. We expect the REIT to continue trading at low prices and in low volumes.
We expect continued investment in real estate supported by; (i) the National Governments’ affordable housing initiative, (ii) investment in trunk infrastructure (iii) favorable statutory reviews, (iv) expansion by global retailers into the country, (v) the expanding middle-class, and hence growing disposable incomes, and (vi) positive demographics necessitating the need for adequate housing.
Disclaimer: The views expressed in this publication are those of the writers where particulars are not warranted. This publication, which is in compliance with Section 2 of the Capital Markets Authority Act Cap 485A, is meant for general information only and is not a warranty, representation, advice or solicitation of any nature. Readers are advised in all circumstances to seek the advice of a registered investment advisor.

- Talk to us
- Kenya
- P.O Box 20695 - 00200, Nairobi, Kenya
- Cell +254709101200
- Tel +254709101200
- WhatsApp +254741676635
- United States
- +254709101200
- DOWNLOAD OUR APP
-


- Kenya
- 8th Floor, Pinetree Plaza, Kaburu Drive, Ngong Road, Nairobi, Kenya
- USA
- Suite 1150, 1775 Eye Street NW, USA, Washington DC 20006, USA
- Investments
- High Yield
- Private Equity
- Real Estate
- Real Estate
- RiverRun Estates
- Cytonn Towers
- The Ridge
- Taraji Heights
- The Alma