Cytonn Monthly - April 2026
By research team, May 3, 2026
Executive Summary
Fixed Income
During the month of April 2026, T-bills were undersubscribed, with the overall average subscription rate coming in at 72.2%, lower than the subscription rate of 207.4% recorded in March 2026. The overall average subscription rates for the 91-day, 182-day and 364-day papers decreased to 131.2%, 71.25% and 49.7% from 181.6%, 73.9% and 351.2% recorded in March 2026 respectively. The average yields on the government papers showed a mixed performance during the month, with the average 364-day and 91-day papers yields decreasing by 23.5 bps and 4.3 bps to 8.3% and 7.5% respectively, from an average of 8.5% and 7.5% recorded the previous month, while the average 182-day paper increased by 1.7 bps to remain relatively unchanged from 7.8% recorded the previous month. For the month of April, the government accepted a total of Kshs 69.3 bn of the Kshs 69.2 bn worth of bids received in T-Bills, translating to an acceptance rate of 99.9%, compared to an acceptance rate of 62.5% in the month of March;
During the week, T-bills were undersubscribed for the third consecutive week, with the overall subscription rate coming in at 77.0%, higher than the subscription rate of 57.4%, recorded the previous week. Investors’ preference for the shorter 91-day paper persisted, with the paper receiving bids worth Kshs 8.0 bn against the offered Kshs 4.0 bn, translating to a subscription rate of 200.6%, lower than the subscription rate of 230.9%, recorded the previous week. The subscription rate for the 364-day and 182- day papers increased to 71.9% and 36.4% from 36.8% and 8.6% respectively recorded the previous week. The government accepted a total of Kshs 18.4 bn worth of bids out of Kshs 18.5 bn bids received, translating to an acceptance rate of 99.8%. The yields on the government papers were on an upward trajectory with the yields on the 364-day, 182-day and 91-day papers increasing by 24.2 bps, 32.5 bps and 26.0 bps respectively to 8.5%, 8.2% and 8.0% from the 8.3%, 7.9% and 7.8% recorded the previous week respectively;
Additionally, April 2026 bonds were oversubscribed, with the overall average subscription rate coming in at 188.7%, lower than the average subscription rate of 195.7% recorded in March 2026. The reopened bonds SDB1/2011/030, FXD1/2026/030, FXD1/2020/015 and FXD1/2018/025 with tenors to maturity of 14.9 years, 30.0 years, 8.9 years and 17.3 years respectively and fixed coupon rates of 12.0%, 12.5%, 12.8% and 13.4% respectively, received bids worth Kshs 113.2 bn against the offered Kshs 60.0 bn translating to an oversubscription rate of 188.7%. The government accepted bids worth Kshs 80.3 bn, translating to an acceptance rate of 70.9%. The weighted average yield for the accepted bids for the SDB1/2011/030, FXD1/2026/030, FXD1/2020/015 and FXD1/2018/025 came in at 13.0%, 13.8%, 12.2% and 13.0% respectively. Also, during the month, the government conducted a bond switch auction, involving a switch from FXD1/2016/010 to FXD1/2018/015 which was undersubscribed, receiving bids worth 2.6 bn against the offered 20.0 bn, translating to subscription rate of 12.8% having an average acceptance yield of 12.0% and a coupon rate of 12.7%;
The year-on-year inflation in April 2026 increased by 1.2% points to 5.6% from the 4.4% recorded in March 2026. The price increase was primarily driven by a rise in prices of items in the Food and Non-alcoholic Beverages at 8.8%; Transport 10.0%; and Housing, Water, Electricity, Gas and other fuels at 2.4%; over the one-year period;
The Kenya National Bureau of Statistics (KNBS) released the 2026 Economic Survey Report, highlighting that the Kenyan economy recorded a 4.6% growth in FY’2025, slower than the 4.7% growth recorded in FY’2024;
According to the FY’2025 Economic Survey released by the Kenya National Bureau of Statistics (KNBS), Kenya’s balance of payments position deteriorated by 78.4% in FY’2025, to a deficit of Kshs 315.1 bn, from a deficit of Kshs 176.7 bn in FY’2024;
During the week, I&M Bank Limited opened the inaugural issuance under its Kshs 20.0 bn Domestic Medium Term Note (MTN) Programme, marking a strategic move to broaden its funding base and strengthen its capital structure. The bank unveiled the first tranche of the programme, comprising a Kshs 10.0 bn offer, expandable by a Kshs 3.0 bn green shoe, signaling flexibility to accommodate investor demand;
Equities
During the month of April, the equities market was on an upward trajectory, with NASI gaining the most by 5.4% while NSE 10, NSE 25 and NSE 20 gained by 5.2%, 4.6% and 3.4% respectively. The equities market performance was mainly driven by gains recorded by large-cap stocks such as Cooperative Bank, Stanbic Bank and Safaricom of 15.9%, 11.3% and 8.0% respectively. However, the performance weighed down by losses recorded by large cap stocks such as EABL, NCBA and KCB of 3.0%, 1.9% and 1.1% respectively;
During the week, the equities market was on a downward trajectory, with NSE 10 losing the most by 1.5% while NSE 25, NSE 20, and NASI declined by 1.2%, 1.2% and 0.9% respectively, taking the YTD performance to gains of 12.9%, 10.7%, 9.6% and 8.1% for NSE 20, NSE 25, NASI and NSE 10 respectively. The week-on-week equities market performance was driven by losses recorded by large-cap stocks such as Cooperative Bank, KCB, and EABL of 2.8%, 2.2% and 2.0% respectively. The performance was however supported by gains recorded by large cap stocks such as SCB-K and NCBA of 1.2% and 0.3% respectively;
Real Estate
During the week, the Kenya National Bureau of Statistics (KNBS) released the Economic Survey 2026 Report that outlined the performance of various sectors to the GDP with the Real Estate sector posting growth of 3.9% in 2025, which is 1.4% points slower than the 5.3% growth registered in FY’2024;
During the week, Hass Consult, a Kenyan consulting and Real Estate development firm, released its Property Index Q1’2026 Report , focusing on the residential Real Estate sector's performance and Land Price Index Q1’2026 Report which highlighted the performance of the Real Estate land sector in the Nairobi Metropolitan Area (NMA);
The government has reduced its investment of housing levy collections in Treasury bills, signalling improved absorption of funds in the ongoing rollout of State-backed affordable housing projects valued at approximately Kshs 500.0 bn. This follows data from the Economic Survey 2026 indicating that absorption of housing levy funds rose significantly to 96.3% of the Kshs 79.0 bn budget in FY2024/25, compared to 32.6% of Kshs 78.2 bn in FY’2023/24, reflecting a notable improvement in execution capacity within the housing programme;
The Kenya Mortgage Refinance Company (KMRC) announced plans to raise Kshs 3.0 bn through a green bond issuance, marking the second tranche of its Kshs 10.5 bn Medium-Term Note programme approved in 2022. The eight-year sustainability-linked bond will have proceeds fully directed towards refinancing eligible green and social home loans, aimed at expanding access to affordable and climate-friendly housing finance. The offer period runs from 28th April to 12th May 2026, with a minimum subscription of Kshs 100,000 and listing expected on the Nairobi Securities Exchange thereafter;
During the week, ILAM Fahari Real Estate Investment Trust (REIT), the owner of Greenspan Mall in Donholm, Nairobi, announced plans to reposition the asset into a mixed-use development through the addition of residential units;
On the Unquoted Securities Platform Acorn D-REIT and I-REIT traded at Kshs 27.4 and Kshs 23.2 per unit, respectively, as per the last updated data on 10th April 2026. The performance represented a 33.4% and 14.5% gain for the D-REIT and I-REIT, respectively, from the Kshs 20.0 inception price. The volumes traded for the D-REIT and I-REIT came in at 13.4 mn and 42.2 mn shares, respectively. Additionally, ILAM Fahari I-REIT traded at Kshs 13.8 per share as of 10th April 2026, representing a 31.0% loss from the Kshs 20.0 inception price. The volume traded to date came in at 1.2 mn shares for the I-REIT;
Investment Updates:
-
Weekly Rates: Cytonn Money Market Fund closed the week at a yield of 12.0% p.a. To invest, dial *809# or download the Cytonn App from Google Play store here or from the Appstore here;
-
We continue to offer Wealth Management Training every Tuesday, from 7:00 pm to 8:00 pm. The training aims to grow financial literacy among the general public. To register for any of our Wealth Management Trainings, click here;
-
If interested in our Private Wealth Management Training for your employees or investment group, please get in touch with us through wmt@cytonn.com;
-
Cytonn Asset Managers Limited (CAML) continues to offer pension products to meet the needs of both individual clients who want to save for their retirement during their working years and Institutional clients that want to contribute on behalf of their employees to help them build their retirement pot. To more about our pension schemes, kindly get in touch with us through pensions@cytonn.com;
Hospitality Updates:
-
We currently have promotions for Staycations. Visit cysuites.com/offers for details or email us at sales@cysuites.com;
Money Markets, T-Bills Primary Auction:
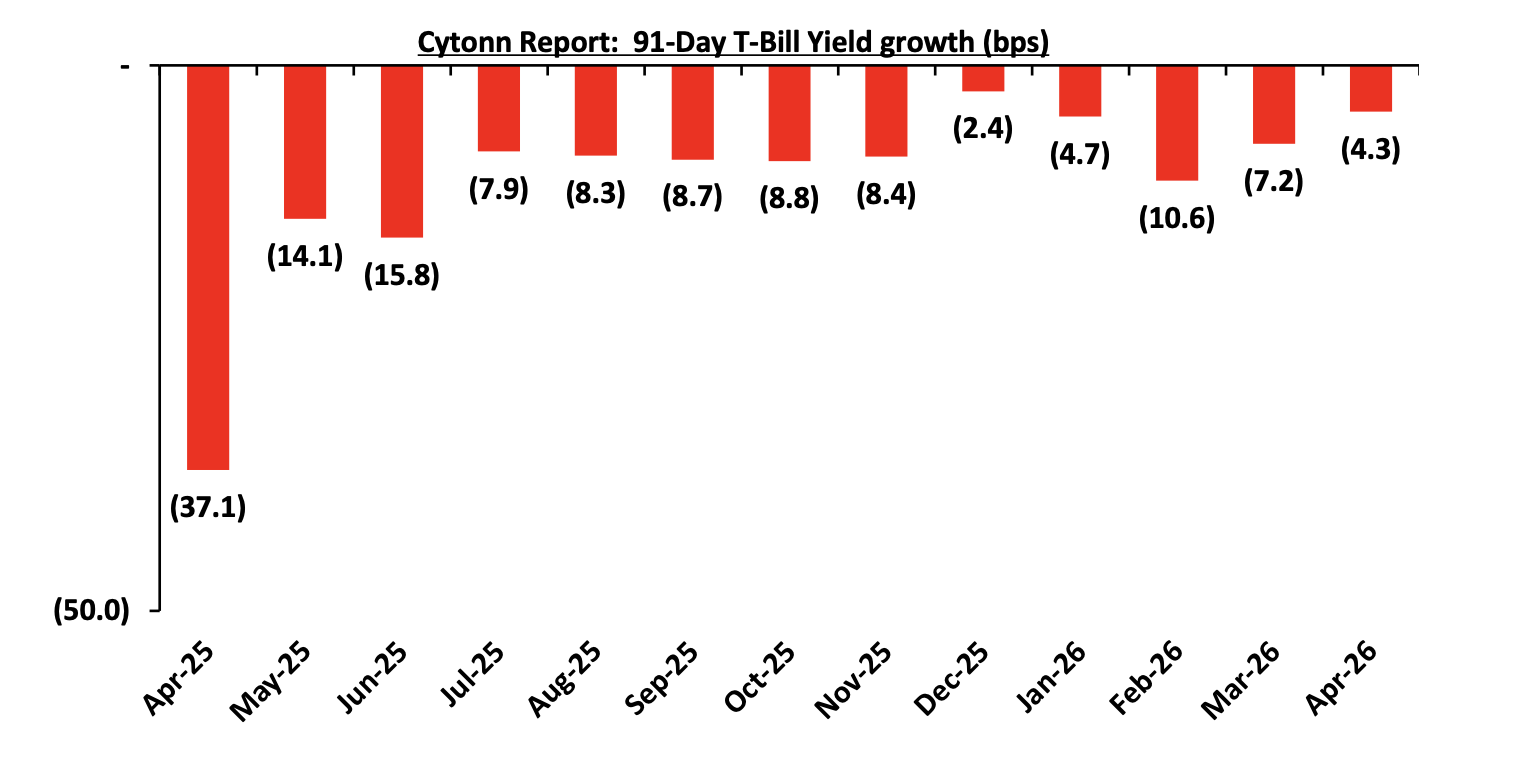
During the month of April 2026, T-bills were undersubscribed, with the overall average subscription rate coming in at 72.2%, lower than the subscription rate of 207.4% recorded in March 2026. The overall average subscription rates for the 91-day, 182-day and 364-day papers decreased to 131.2%, 71.25% and 49.7% from 181.6%, 73.9% and 351.2% recorded in March 2026 respectively. The average yields on the government papers showed a mixed performance during the month, with the average 364-day and 91-day papers yields decreasing by 23.5 bps and 4.3 bps to 8.3% and 7.5% respectively, from an average of 8.5% and 7.5% recorded the previous month, while the average 182-day paper increasing by 1.7 bps to remain relatively unchanged from 7.8% recorded the previous month. For the month of April, the government accepted a total of Kshs 69.3 bn of the Kshs 69.2 bn worth of bids received in T-Bills, translating to an acceptance rate of 99.9%, compared to an acceptance rate of 62.5% in the month of March. The chart below shows the yield growth rate for the 91-day paper for the past one year:
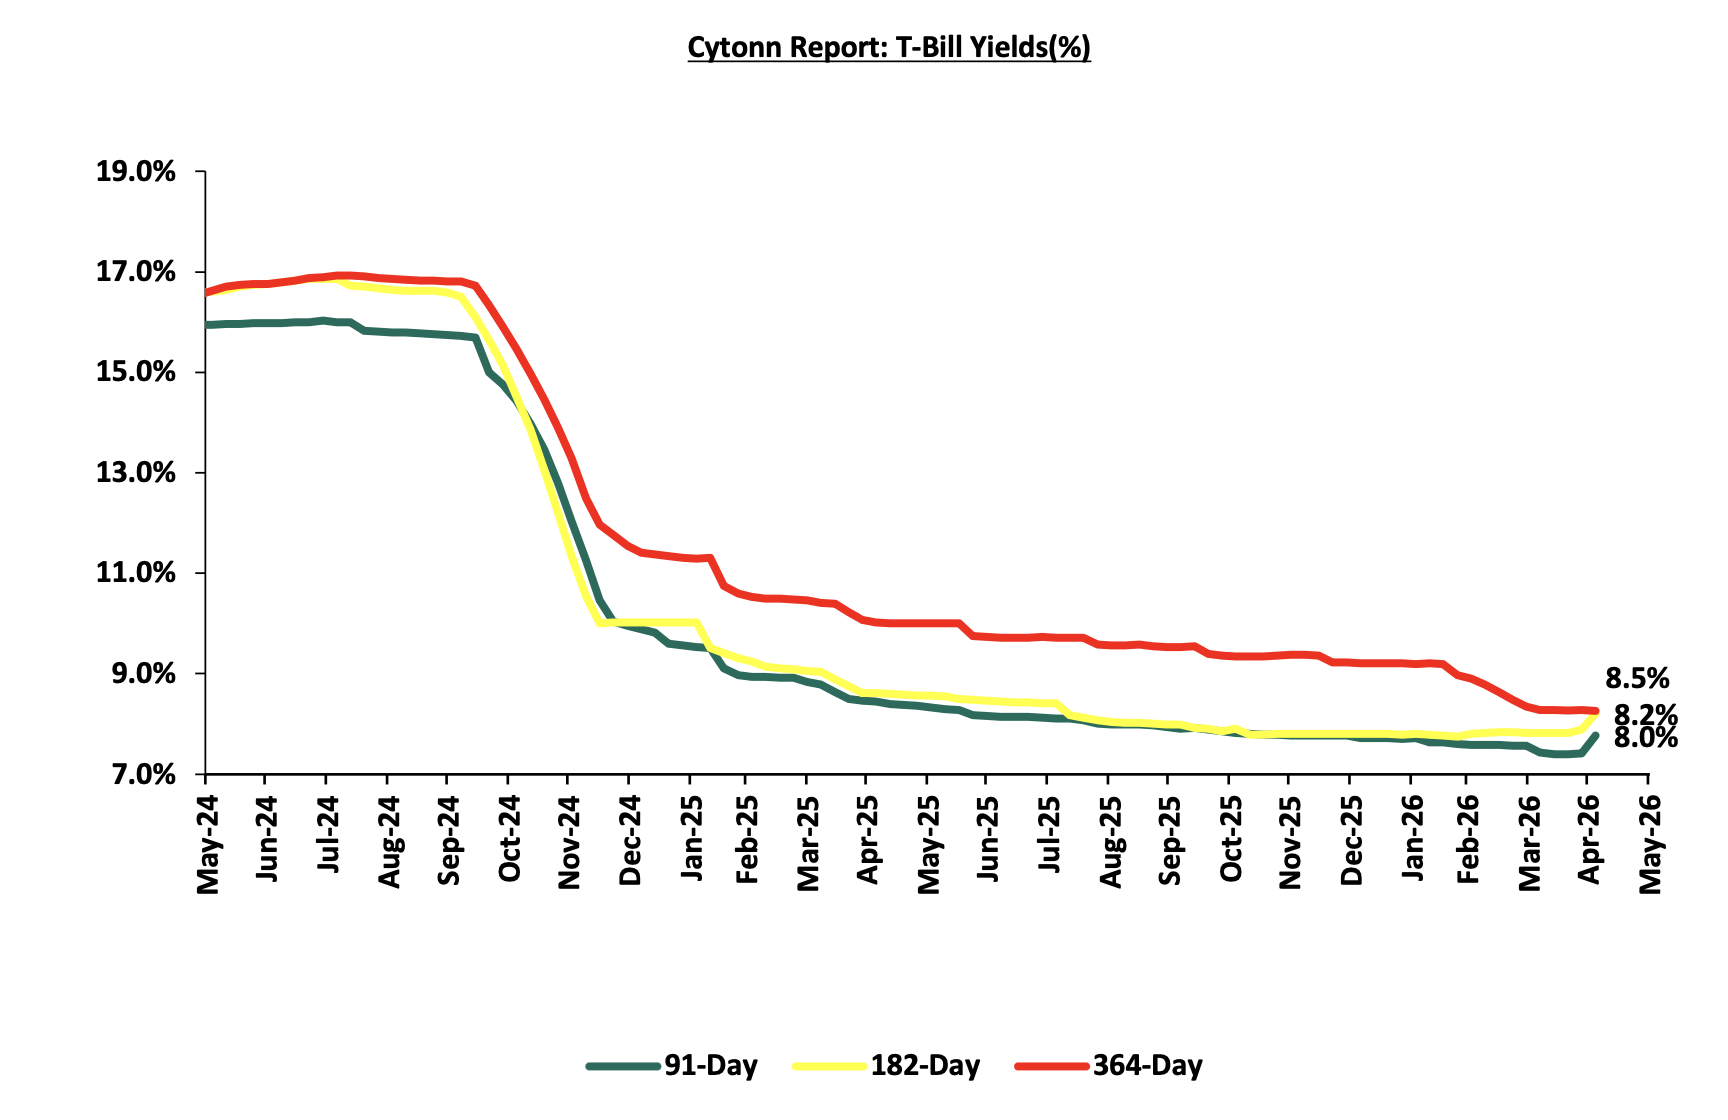
During the week, T-bills were undersubscribed for the third consecutive week, with the overall subscription rate coming in at 77.0%, higher than the subscription rate of 57.4%, recorded the previous week. Investors’ preference for the shorter 91-day paper persisted, with the paper receiving bids worth Kshs 8.0 bn against the offered Kshs 4.0 bn, translating to a subscription rate of 200.6%, lower than the subscription rate of 230.9%, recorded the previous week. The subscription rate for the 182-day paper increased to 32.6% from 8.6% recorded the previous week, while that of the 364-day paper increased to 71.9% from 36.8% recorded the previous week. The government accepted a total of Kshs 18.4 bn worth of bids out of Kshs 18.5 bn bids received, translating to an acceptance rate of 99.8%. The yields on the government papers were on an upward trajectory with the yields on the 364-day, 182-day and 91-day papers increasing by 24.2 bps, 32.5 bps and 26.0 bps respectively to 8.5%, 8.2% and 8.0% from the 8.3%, 7.9% and 7.8% recorded the previous week respectively.
The charts below show the performance of the 91-day, 182-day and 364-day papers from January 2024 to May 2026:
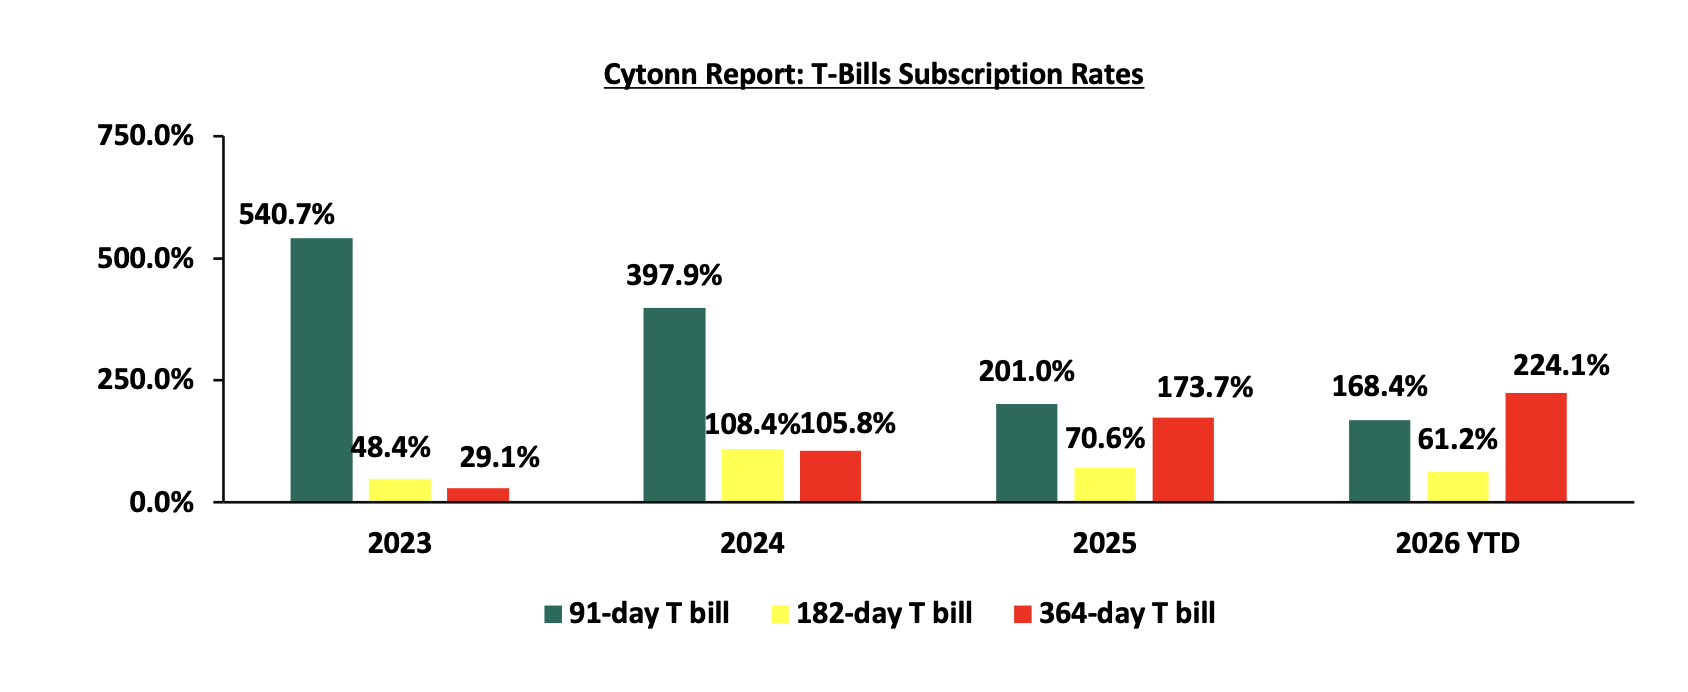
So far in the current FY’2025/26, government securities totaling Kshs 1,706.0 bn have been advertised. The government has accepted bids worth Kshs 2,159.2 bn, of which Kshs 1,211.6 bn and Kshs 947.6 bn were treasury bills and bonds, respectively. Total redemptions so far in FY’2025/26 equal to Kshs 1,148.0 bn, with treasury bills accounting for the entire amount. As a result, the government has a domestic borrowing surplus of Kshs 1,011.2 bn in FY’2025/26.
The chart below compares the overall average T-bill subscription rates obtained in 2023,2024, 2025 and 2026 Year-to-date (YTD):
T-Bonds Primary Auction:
April 2026 bonds were oversubscribed, with the overall average subscription rate coming in at 188.7%, lower than the average subscription rate of 195.7% recorded in March 2026. The reopened bonds SDB1/2011/030, FXD1/2026/030, FXD1/2020/015 and FXD1/2018/025 with tenors to maturity of 14.9 years, 30.0 years, 8.9 years and 17.3 years respectively and fixed coupon rates of 12.0%, 12.5%, 12.8% and 13.4% respectively, received bids worth Kshs 113.2 bn against the offered Kshs 60.0 bn translating to an oversubscription rate of 188.7%. The government accepted bids worth Kshs 80.3 bn, translating to an acceptance rate of 70.9%. The weighted average yield for the accepted bids for the SDB1/2011/030, FXD1/2026/030, FXD1/2020/015 and FXD1/2018/025 came in at 13.0%, 13.8%, 12.2% and 13.0% respectively. Also, during the month, the government conducted a bond switch auction, involving a switch from FXD1/2016/010 to FXD1/2018/015 which was undersubscribed, receiving bids worth 2.6 bn against the offered 20.0 bn, translating to subscription rate of 12.8% having an average acceptance yield of 12.0% and a coupon rate of 12.7%. The table below provides more details on the bonds issued in March 2026 and April 2026:
|
Cytonn Report: Bond Issuances for March 2026-April 2026 |
|||||||||||||||||
|
Issue Date |
Bond Auctioned |
Effective Tenor to Maturity (Years) |
Coupon |
Amount offered (Kshs bn) |
Actual Amount Raised/Accepted (Kshs bn) |
Total bids received (Subscription) |
Average Accepted Yield |
Subscription Rate |
Acceptance Rate |
||||||||
|
20-Apr |
SDB1/2011/030-Reopened |
14.9 |
12.0% |
20.0 |
6.6 |
7.1 |
13.0% |
191.7 |
93.2% |
||||||||
|
FXD1/2026/030-Reopened |
30.0 |
12.5% |
23.5 |
31.3 |
13.8% |
75.1% |
|||||||||||
|
15-Apr |
FXD1/2018/015-Switch |
7.1 |
12.7% |
20.0 |
1.8 |
2.6 |
12.0% |
12.8% |
68.5% |
||||||||
|
02-Apr |
FXD1/2020/015- Reopened |
8.9 |
12.8% |
40.0 |
36.5 |
41.4 |
12.2% |
187.2% |
88.1% |
||||||||
|
FXD1/2018/025-Reopened |
17.3 |
13.4% |
13.7 |
33.5 |
13.0% |
40.9% |
|||||||||||
|
18-Mar |
FXD3/2019/015-Switch |
0.6 |
11.3% |
15.0 |
18.4 |
22.2 |
11.6% |
148.0 |
82.9% |
||||||||
|
16-Mar |
FXD1/2019/015 - Reopened |
13.1 |
12.9% |
60.0 |
44.9 |
50.5 |
12.7% |
195.7% |
88.8% |
||||||||
|
FXD1/2021/025-Reopened |
20.1 |
13.9% |
16.1 |
66.9 |
12.9% |
24.1% |
|||||||||||
|
April 2026 Average |
17.8 |
12.7% |
60.0 |
80.3 |
113.2 |
13.0% |
188.7% |
70.9% |
|||||||||
|
March 2026 Average |
16.6 |
13.4% |
60.0 |
61.0 |
117.4 |
12.8% |
195.7% |
51.9% |
|||||||||
|
2025 Average |
13.6 |
13.3% |
41.8 |
35.8 |
53.8 |
13.8% |
128.9% |
66.5% |
|||||||||
Secondary Bond Market:
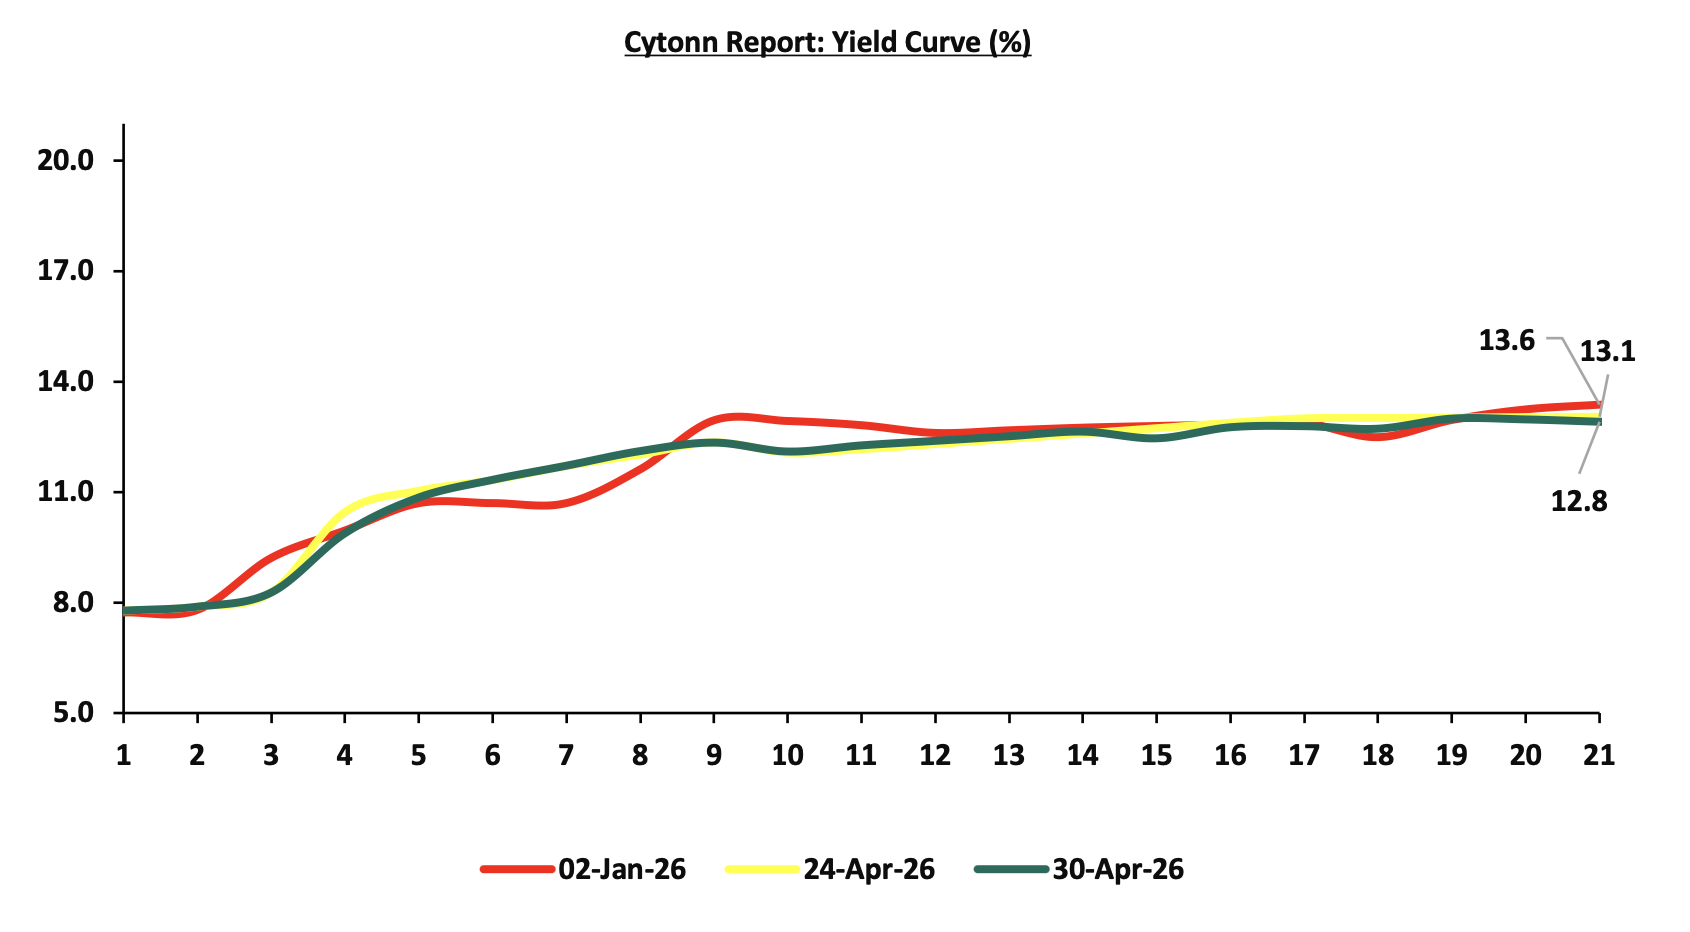
The yields on the government securities recorded a mixed performance during the month of April similar to March. This is attributable to a divergence between short-term monetary policy anchoring and rising medium to long-term risk premium. The Central Bank of Kenya’s decision to maintain the policy rate at 8.75% helped stabilize short-term rates by anchoring expectations on the near-term cost of funds, limiting significant movements in Treasury bill yields. However, upward pressure on inflation driven by elevated global oil prices linked to the Middle East conflict, eroded real returns and heightened uncertainty around the inflation outlook. This led investors to demand higher compensation on longer-dated securities, pushing yields upward at the belly and long end of the curve. At the same time, intermittent liquidity conditions and selective demand for specific maturities created pockets of downward movement in some tenors, ultimately resulting in a mixed yield curve performance for the month. The chart below shows the yield curve movement during the period:
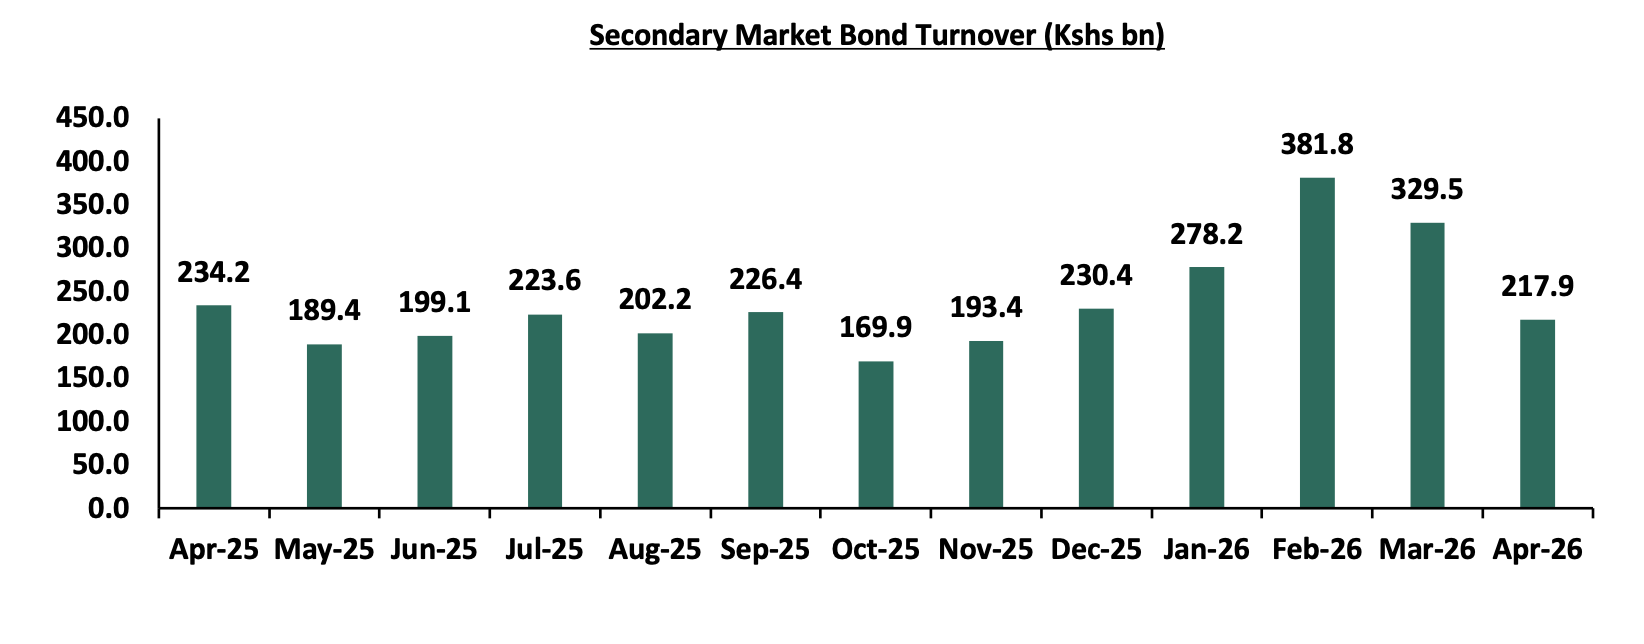
The secondary bond turnover decreased by 33.9% to Kshs 217.9 bn, from Kshs 329.5 bn recorded in March 2026, pointing towards decreased activities by commercial banks in the secondary bonds market for the month of April driven by tighter liquidity during the month hence banks preferring to hold on to cash. On a year-on-year basis, the bond turnover decreased by 7.0% from Kshs 234.2 bn worth of treasury bonds transacted over a similar period last year. The chart below shows the bond turnover over the past 12 months.
Money Market Performance:
In the money markets, 3-month bank placements ended the week at 9.0% (based on what we have been offered by various banks). The yields on the 364-day papers increased by 24.2 bps to 8.5% from the 8.3% recorded the previous week, while the 91-day paper increased by 26.0 bps to 8.0% from the 7.8% recorded the previous week and the yield on the Cytonn Money Market Fund increased by 7.0 bps to 12.1% from 12.0% recorded the previous week, while the average yields on the Top 5 Money Market Funds decreased by 0.6 bps to remain relatively unchanged from 11.6% recorded in the previous week.
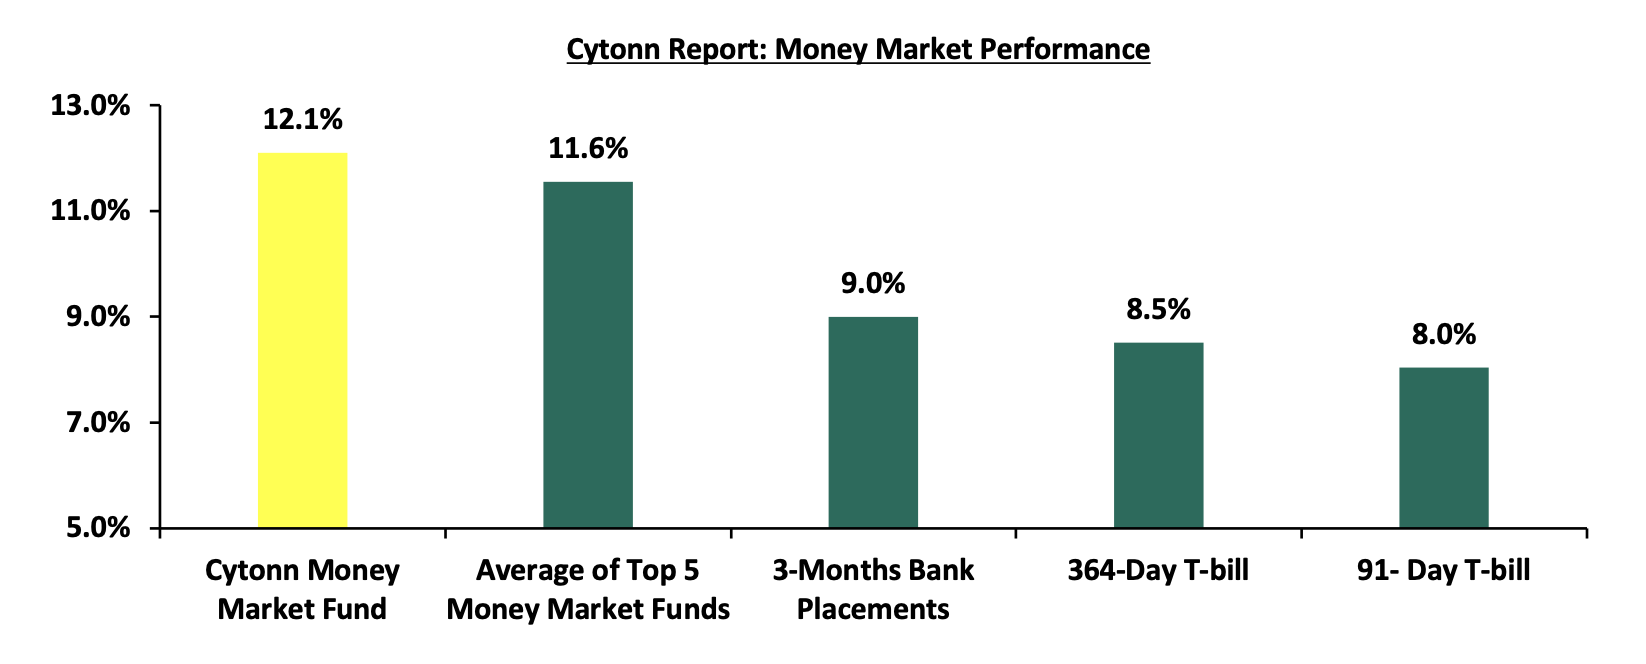
The table below shows the Money Market Fund Yields for Kenyan Fund Managers as published on 30th April 2026:
|
Money Market Fund Yield for Fund Managers as published on 30th April 2026 |
||
|
Rank |
Fund Manager |
Effective Annual Rate |
|
1 |
Cytonn Money Market Fund ( Dial *809# or download Cytonn App) |
12.1% |
|
2 |
Etica Money Market Fund |
12.0% |
|
3 |
Nabo Africa Money Market Fund |
11.8% |
|
4 |
Arvocap Money Market Fund |
11.1% |
|
5 |
Gulfcap Money Market Fund |
10.8% |
|
6 |
Lofty-Corban Money Market Fund |
10.7% |
|
7 |
Enwealth Money Market Fund |
10.6% |
|
8 |
Jubilee Money Market Fund |
10.5% |
|
9 |
Madison Money Market Fund |
10.5% |
|
10 |
Ndovu Money Market Fund |
10.5% |
|
11 |
Kuza Money Market fund |
10.4% |
|
12 |
Orient Kasha Money Market Fund |
10.3% |
|
13 |
Faulu Money Market Fund |
10.2% |
|
14 |
Old Mutual Money Market Fund |
10.1% |
|
15 |
GenAfrica Money Market Fund |
9.9% |
|
16 |
Dry Associates Money Market Fund |
9.4% |
|
17 |
SanlamAllianz Money Market Fund |
9.3% |
|
18 |
Apollo Money Market Fund |
9.3% |
|
19 |
British-American Money Market Fund |
9.1% |
|
20 |
KCB Money Market Fund |
9.0% |
|
21 |
Genghis Money Market Fund |
8.6% |
|
22 |
Mayfair Money Market Fund |
8.5% |
|
23 |
CIC Money Market Fund |
8.4% |
|
24 |
CPF Money Market Fund |
8.2% |
|
25 |
Co-op Money Market Fund |
8.2% |
|
26 |
ICEA Lion Money Market Fund |
8.1% |
|
27 |
Mali Money Market Fund |
8.0% |
|
28 |
Absa Shilling Money Market Fund |
7.3% |
|
29 |
Ziidi Money Market Fund |
6.0% |
|
30 |
Stanbic Money Market Fund |
5.4% |
|
31 |
AA Kenya Shillings Fund |
4.7% |
|
32 |
Equity Money Market Fund |
4.3% |
Source: Business Daily
Liquidity:
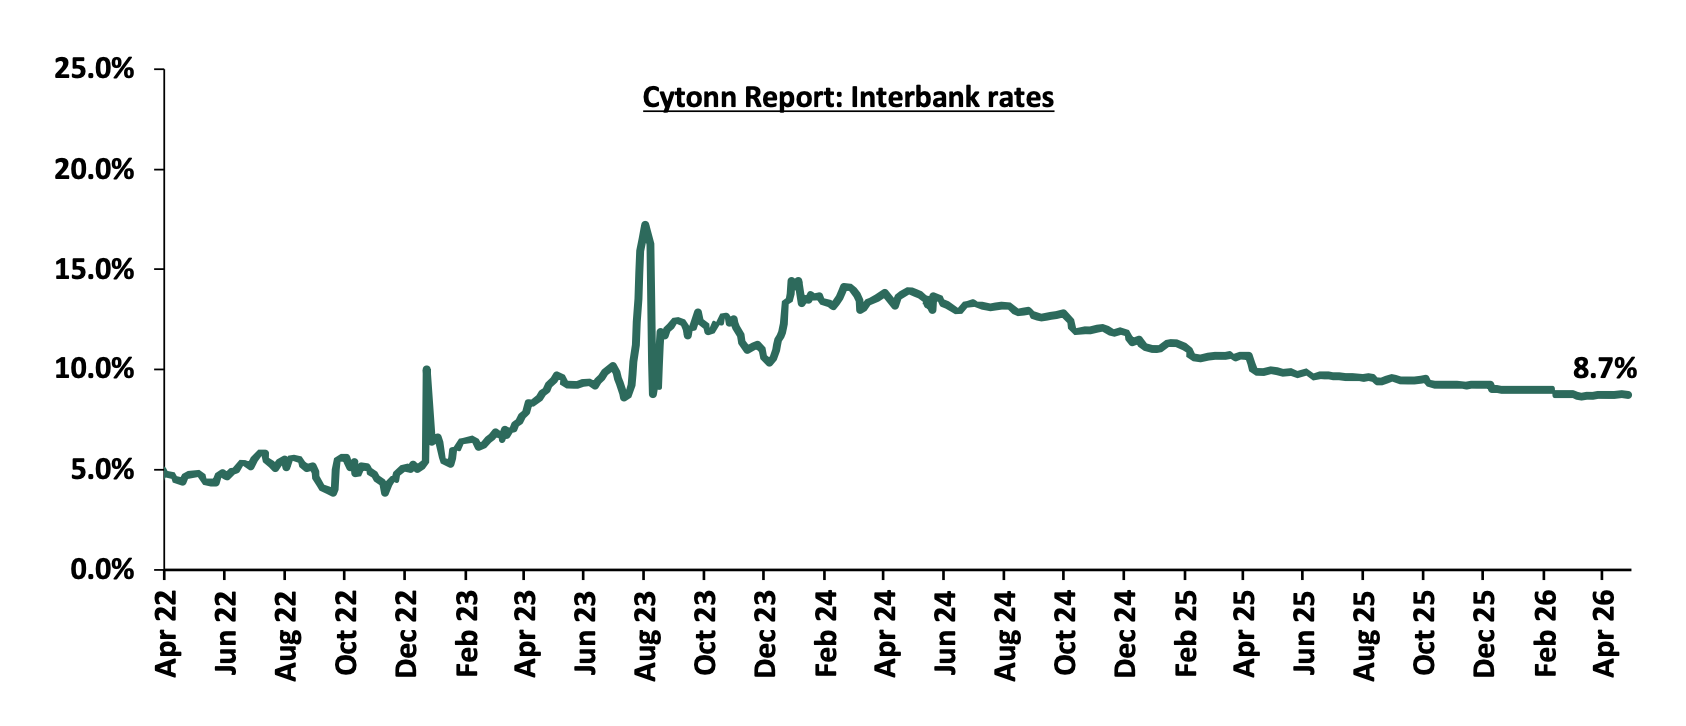
Liquidity in the money markets tightened in the month of April 2026, with the average interbank rate increasing by 0.1% points to 8.8% from 8.7% recorded the previous month. The average interbank volumes traded decreased by 15.1% to Kshs 11.0 bn, from Kshs 13.0 bn recorded in March 2026. Additionally, during the week, liquidity in the money markets eased, with the average interbank rate decreasing by 0.3 bps, to remain relatively unchanged from the 8.8% recorded the previous week, partly attributable to government payments that offset tax remittances. The average interbank volumes traded decreased by 31.9% to Kshs 6.6 bn from Kshs 9.6 bn recorded the previous week. The chart below shows the interbank rates in the market over the years:
Kenya Eurobonds:
During the month, the yields on the Eurobonds were on a downward trajectory, with the yield on the 7-year Eurobond issued in 2024 decreasing the most by 83.0 bps to 8.2% from 9.0% recorded at the end of March 2026. During the week, the yields on the Eurobonds were on an upward trajectory with the yield on the 12-year Eurobond issued in 2019 and the 13-year Eurobond issued in 2021 increasing the most by 29.0 bps each to 8.5% and 8.9% from 8.2% and 8.6% recorded the previous week respectively. The table below shows the summary performance of the Kenyan Eurobonds as of 30th April 2026;
|
|
2018 |
2019 |
2021 |
2024 |
||
|
Tenor |
10-year issue |
30-year issue |
12-year issue |
13-year issue |
7-year issue |
|
|
Amount Issued (USD) |
1.0 bn |
1.0 bn |
1.2 bn |
1.0 bn |
1.5 bn |
|
|
Years to Maturity |
2.5 |
22.5 |
6.7 |
8.8 |
5.5 |
|
|
Yields at Issue |
7.3% |
8.3% |
7.9% |
6.2% |
10.4% |
|
|
2-Jan-26 |
6.1% |
8.8% |
7.2% |
7.8% |
7.1% |
|
|
31-Mar-26 |
7.8% |
9.8% |
9.0% |
9.6% |
9.0% |
|
|
23-Apr-26 |
7.5% |
9.3% |
8.2% |
8.6% |
8.0% |
|
|
24-Apr-26 |
7.5% |
9.3% |
8.3% |
8.6% |
8.0% |
|
|
27-Apr-26 |
7.5% |
9.3% |
8.3% |
8.6% |
8.1% |
|
|
28-Apr-26 |
7.6% |
9.4% |
8.5% |
8.8% |
8.2% |
|
|
29-Apr-26 |
7.5% |
9.3% |
8.5% |
8.8% |
8.1% |
|
|
30-Apr-26 |
7.5% |
9.4% |
8.5% |
8.9% |
8.2% |
|
|
Weekly Change |
0.1% |
0.1% |
0.3% |
0.3% |
0.1% |
|
|
M/M Change |
(0.2%) |
(0.4%) |
(0.4%) |
(0.7%) |
(0.8%) |
|
|
YTD Change |
1.5% |
0.5% |
1.3% |
0.9% |
1.1% |
|
Source: Central Bank of Kenya (CBK) and National Treasury
Kenya Shilling:
During the month, the Kenya Shilling appreciated by 60.0 bps against the US Dollar, to Kshs 129.2 from the Kshs 129.9 recorded at the end of March. Additionally, during the week, the Kenya Shilling appreciated by 10.1 bps against the US Dollar, to Kshs 129.2 from the Kshs 129.3 recorded the previous week. On a year-to-date basis, the shilling has depreciated by 10.8 bps against the dollar, as compared to the 22.9 bps appreciation recorded in 2025.
We expect the shilling to be supported by:
-
Diaspora remittances standing at a cumulative USD 5,051.2 mn in the twelve months to February 2026, 1.9% higher than the USD 4,956.5 mn recorded over the same period in 2025. These have continued to cushion the shilling against further depreciation. In the February 2026 diaspora remittances figures, North America remained the largest source of remittances to Kenya accounting for 54.2% in the period, and,
-
Tourism inflows, which strengthened significantly. Tourism receipts reached Kshs 560.0 bn in 2025, up from Kshs 452.2 bn in 2024, representing a 23.9% increase, supported by improved international arrivals through the country’s major airports, and,
-
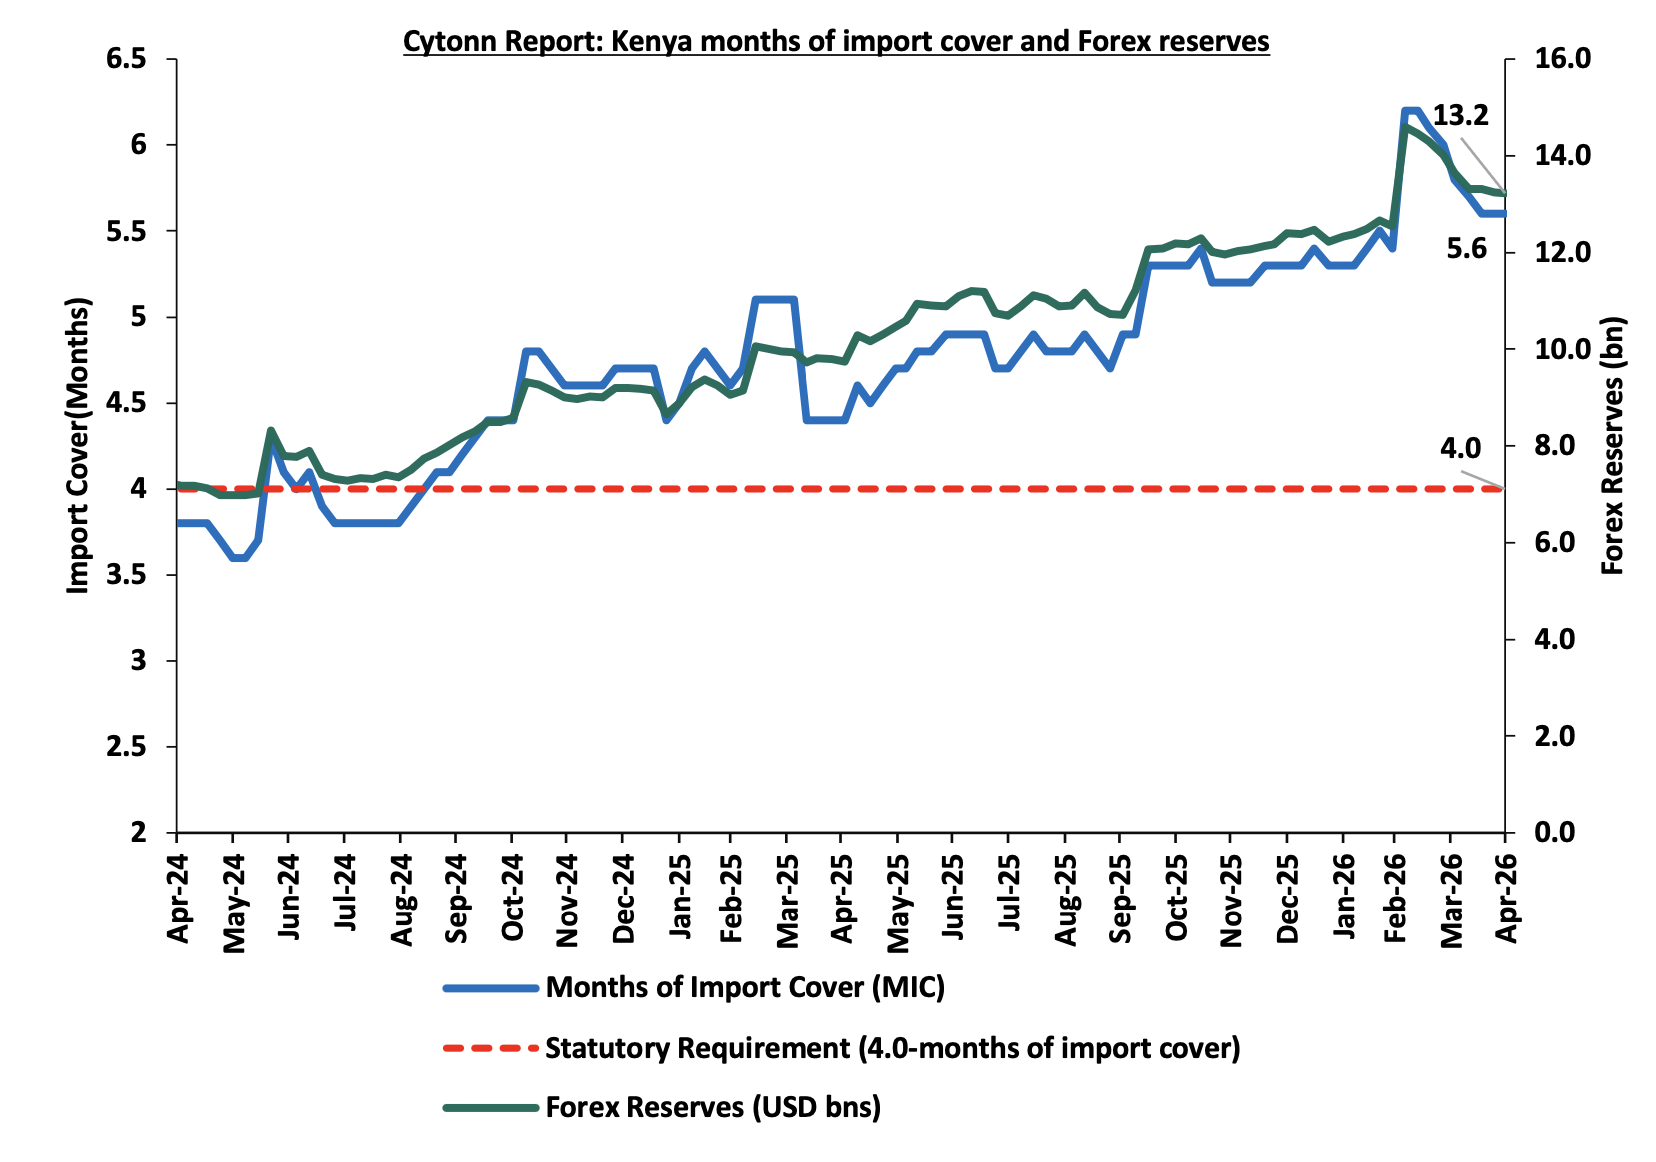
Improved forex reserves currently at USD 13.2 bn (equivalent to 5.6-months of import cover), which is above the statutory requirement of maintaining at least 4.0-months of import cover and above the EAC region’s convergence criteria of 4.5-months of import cover.
The shilling is however expected to remain under pressure in 2026 as a result of:
-
An ever-present current account deficit which came at 2.4% of GDP in the twelve months to February 2026, and,
-
The need for government debt servicing, continues to put pressure on forex reserves given that 52.0% of Kenya’s external debt is US Dollar-denominated as of September 2025.
-
Rising geopolitical tensions in the Middle East, which could exert pressure on the shilling through higher global oil prices and increased uncertainty in international markets. Given that Kenya is a net importer of petroleum products, any sustained increase in oil prices would widen the import bill, increase demand for US Dollars, and consequently put depreciation pressure on the shilling
Key to note, Kenya’s forex reserves decreased by 5.7% during the month of April 2026, to USD 13.2 bn, from the USD 14.0 bn recorded in the previous month, equivalent to 5.6 months of import cover and above the statutory requirement of maintaining at least 4.0-months of import cover. This is attributable to higher demand for foreign currency and lower inflows, driven by increased oil import costs linked to the Middle East conflict and ongoing external debt repayments, with additional pressure from Central Bank interventions to support the Shilling. Additionally, during the month, the import cover decreased to 5.6 months from 6.0 months recorded in the previous month. During the week, Kenya’s forex reserves decreased by 0.1% to remain relatively unchanged from the USD 13.2 bn recorded the previous week, equivalent to 5.6 months of import cover, and above the statutory requirement of maintaining at least 4.0-months of import cover. The chart below summarizes the evolution of Kenya's months of import cover over the years:
Weekly Highlights
-
Inflation Highlight April 2026
The year-on-year inflation in April 2026 increased by 1.2% points to 5.6% from the 4.4% recorded in March 2026. The price increase was primarily driven by a rise in prices of items in the Food and Non-alcoholic Beverages at 8.8%; Transport 10.0%; and Housing, Water, Electricity, Gas and other fuels at 2.4%; over the one-year period. The month-on-month inflation rate stood at 1.4% in April 2026. The table below summarizes the performance of commodity indices both on a year-on-year and month-on-month basis:
|
Cytonn Report: Major Inflation Changes –April 2026 |
|||
|
Broad Commodity Group |
Price change m/m (April-2026/ March-2026) |
Price change y/y April-2026/April-2025) |
Reason |
|
Food and Non- Alcoholic Beverages |
1.5% |
8.8% |
The m/m increase was mainly driven by the significant rise in prices of tomatoes of 9.0% and increase in prices for irish potatoes and salad cooking oil by 2.8% and 2.7%. However, the increase was weighed down by a decline in prices of cabbages and oranges by 3.3% and 1.9% respectively. |
|
Transport |
6.5% |
10.0% |
The m/m increase was driven by the 9.7% increase in country bus and matatu fares for travel between towns, while city matatu fares within towns and surrounding areas rose by 7.1%. Consequently, motorcycle fares went up by 6.1% coupled with the increase in prices for petrol and diesel by 17.9% and 10.8% respectively. |
|
Housing, Water, Electricity, Gas and Other fuels |
0.8% |
2.4% |
The m/m increase was mainly due to increase in price of gas/LPG and cement prices by 7.3% and 0.8% respectively. The increase was however weighed down due to decrease in the price of electricity with 200kWh by 0.6% |
|
Overall Inflation |
1.4% |
5.6% |
The m/m increase was mainly attributable to the 6.5% increase in transport. |
In April 2026, overall inflation increased by 1.2% points to 5.6% from the 4.4% recorded in March 2026 on a y/y basis, signaling a sharp uptick in price pressures across major categories. Additionally, the inflation rate remained within the Central Bank of Kenya’s preferred range of 2.5%–7.5% for the thirty fourth consecutive month, reflecting relatively sustained macroeconomic stability. Prices for Super Petrol and Diesel increased by Kshs 19.3, and Kshs 30.1 per litre to Kshs 197.6, and Kshs 196.6 per litre from Kshs 178.3, and Kshs 166.5 per litre respectively in March 2026, marking the first increase in 2026. On the other hand, Kerosene remain unchanged at Kshs 152.8 per litre respectively effective from 16th April 2026 to 14th May 2026. Electricity costs decreased during the month, with 200 kWh decreasing by 0.6%. Additionally, the recent maintenance in the Central Bank Rate at 8.75% remaining unchanged from February is expected to keep inflation expectations anchored amid geopolitical tensions in the Middle East. The Monetary Policy Committee is expected to adopt a more cautious approach to rate adjustments in the coming meetings while monitoring the effects of the Middle East Conflict. Even with a cautious stance, cheaper credit from past easing, external supply shocks and potential currency depreciation create an environment where inflationary pressures can outpace CBK’s stabilizing efforts.
The chart below shows the inflation rates for the past 5 years:
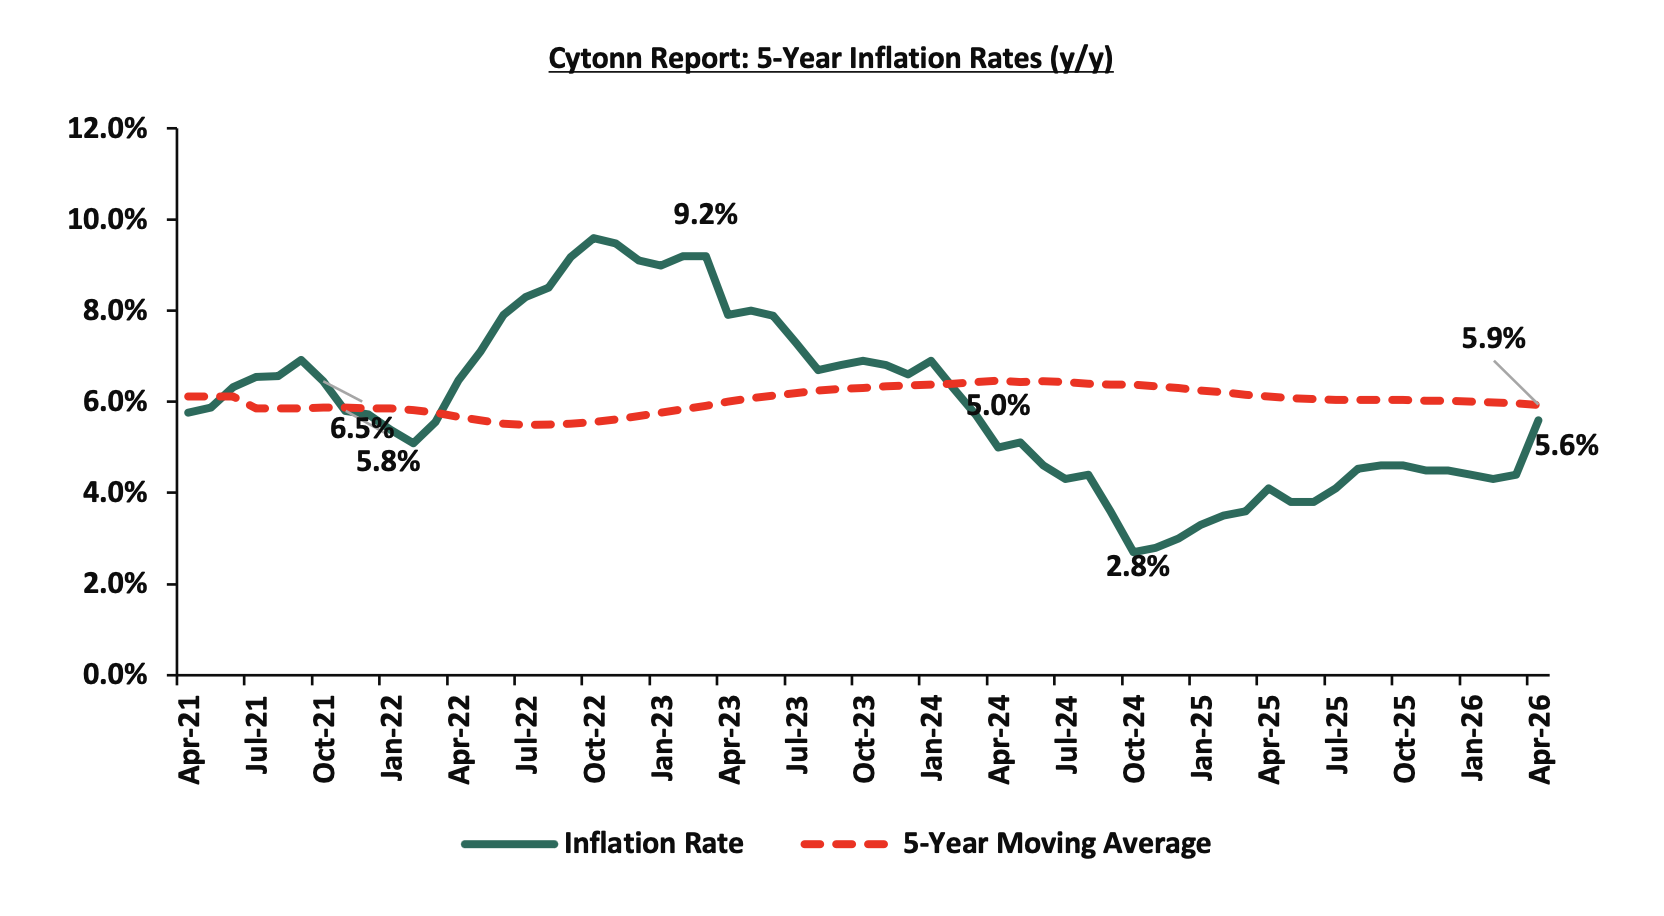
The ongoing US–Iran tensions continue to disrupt global oil logistics, particularly around the Strait of Hormuz, sustaining volatility and a persistent risk premium in crude oil prices. Although disruptions have shifted from acute shocks to more intermittent and structural supply frictions, Murban crude, Kenya’s key import grade, remains elevated and volatile, keeping upward pressure on future pump prices. Any pass through into fuel prices would have significant implications for inflation, given fuel’s central role in transport, logistics, and production costs. The conflict also affects electricity pricing through fuel cost adjustments and foreign exchange related generation costs, as global oil markets continue to price in heightened geopolitical uncertainty. Rising fuel and energy costs are expected to increase the cost of goods across the economy, particularly in manufacturing, agriculture, and distribution, as producers pass on higher input and transport expenses to consumers, thereby reinforcing cost push inflationary pressures. While the recent relative stability of the Kenya Shilling offers some temporary relief on imported inflation, this support remains vulnerable to renewed geopolitical risks and sustained oil price volatility. We however still expect inflationary pressures to remain anchored within the CBK’s target range of 2.5%-7.5%, but above the midpoint in the short to medium term.
-
Kenya FY’2025 GDP Highlight
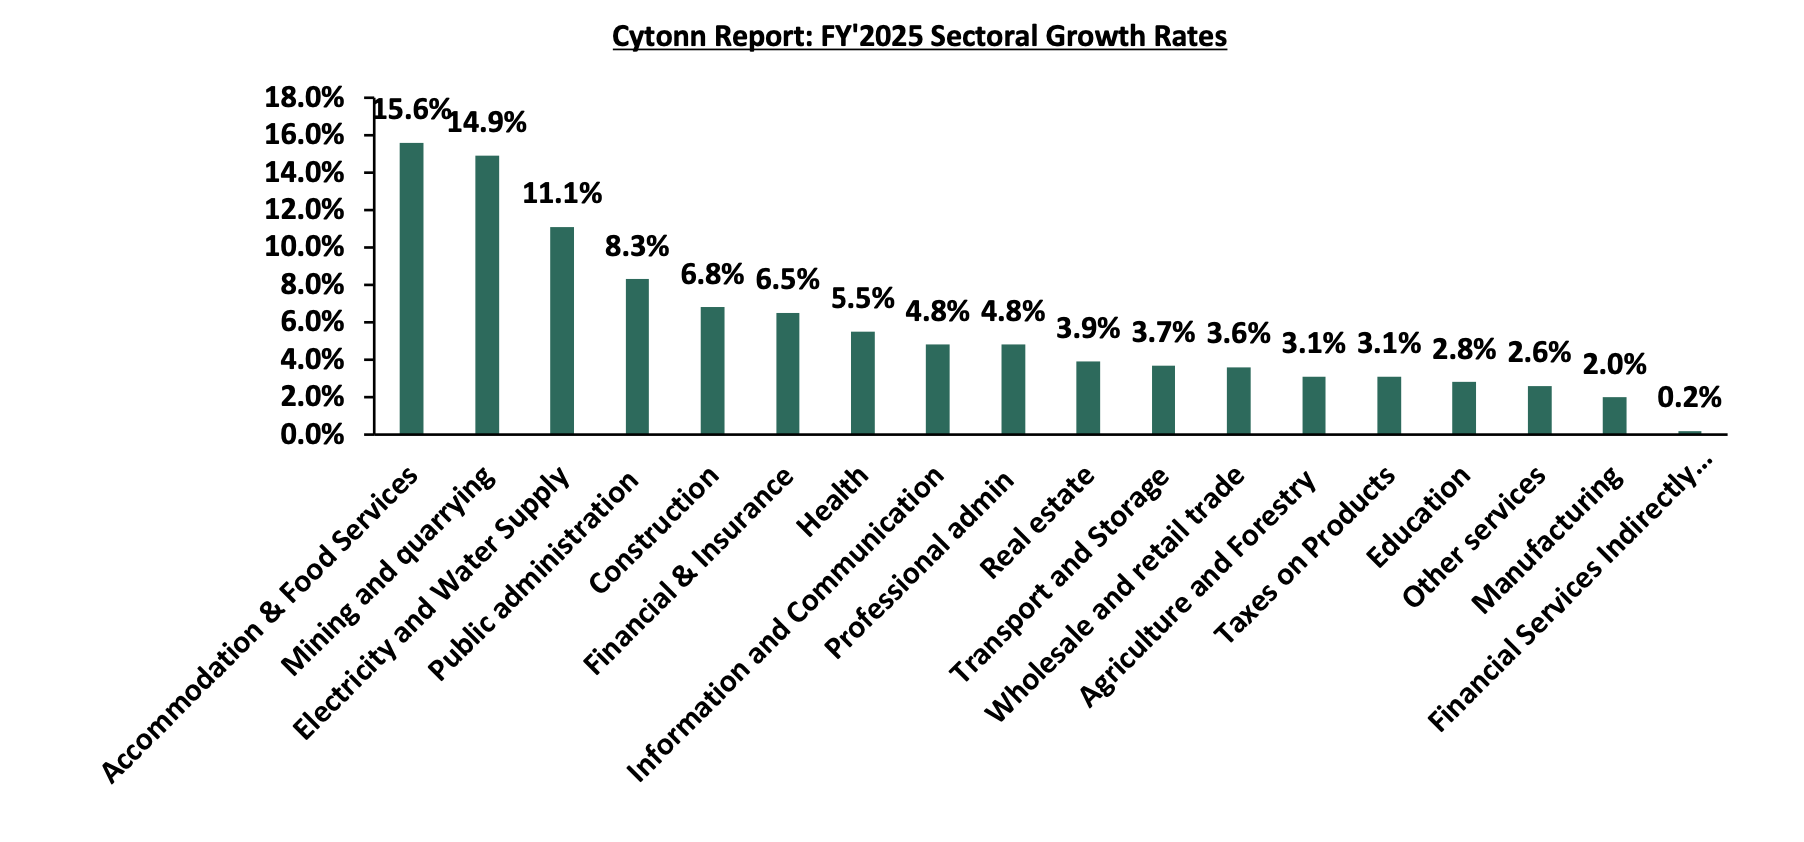
The Kenya National Bureau of Statistics (KNBS) released the 2026 Economic Survey Report, highlighting that the Kenyan economy recorded a 4.6% growth in FY’2025, slower than the 4.7% growth recorded in FY’2024. The main contributor to Kenyan GDP remains to be the Agriculture, Fishing and Forestry sector which grew by 3.1% in FY’2025, lower than the 4.4% expansion recorded in FY’2024. All sectors in 2025 recorded positive growths, with varying magnitudes across activities. However, most sectors recorded contraction in growth rates compared to 2024 with Agricultural and Forestry sector recording a growth decline of 1.3% point to 3.1% in 2025 from 4.4% in 2024. Other sectors recorded an expansion in growth rates, from what was recorded in 2024, with Mining and Quarrying, Construction and Electricity and Water Supply recording the highest growths in rates of 22.7%, 7.5% and 3.3% points, to 14.9%, 6.8% and 11.1% from (7.8%), (0.7%) and 7.8% respectively.
The key take-outs from the report are:
-
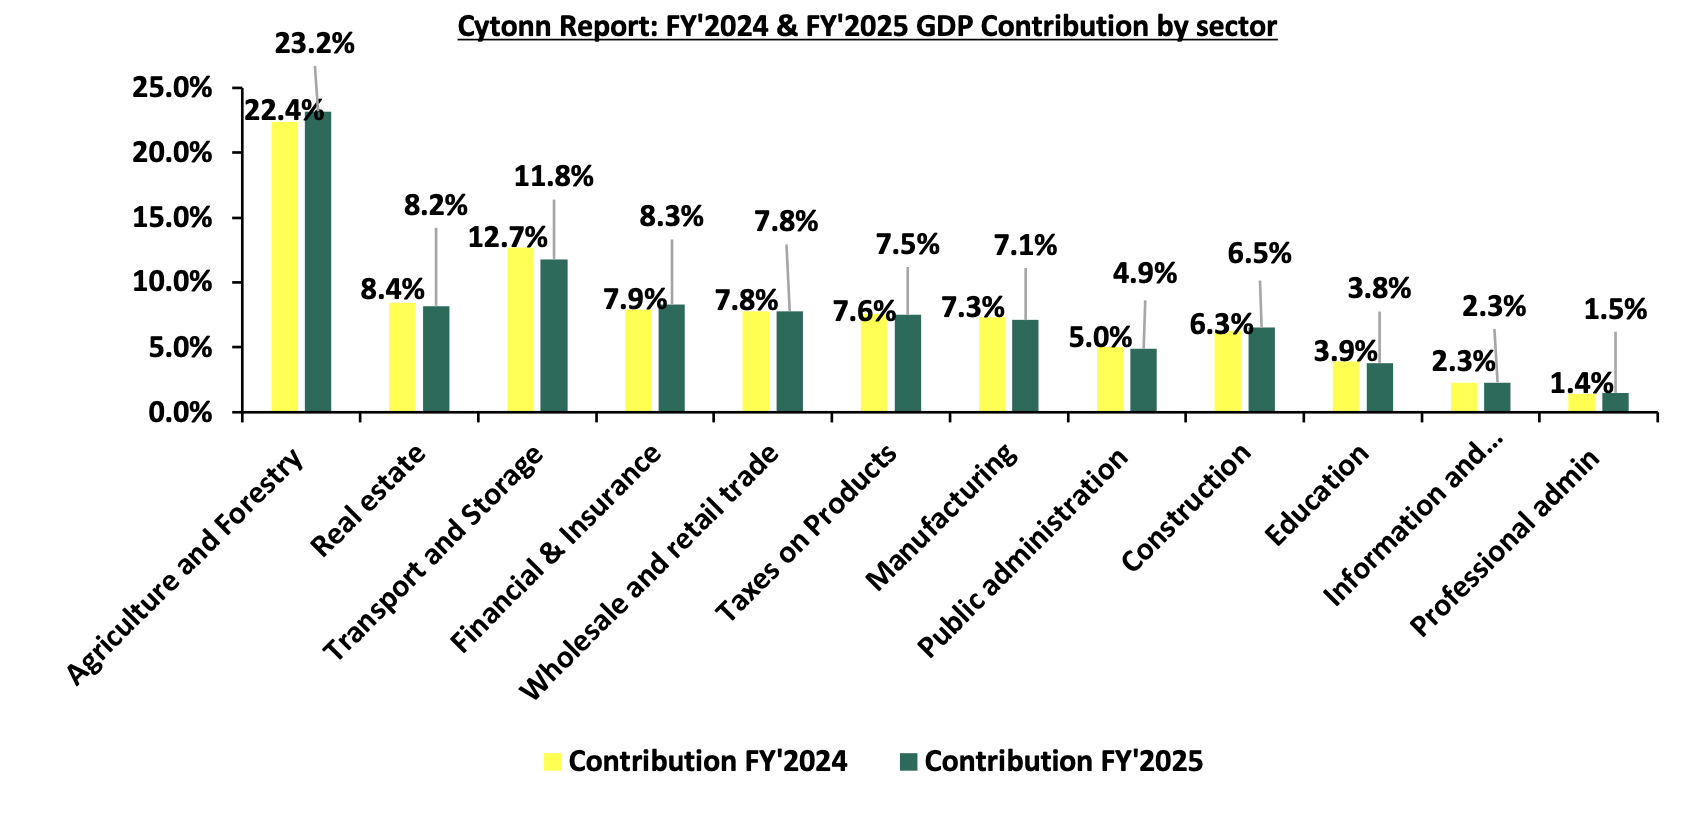
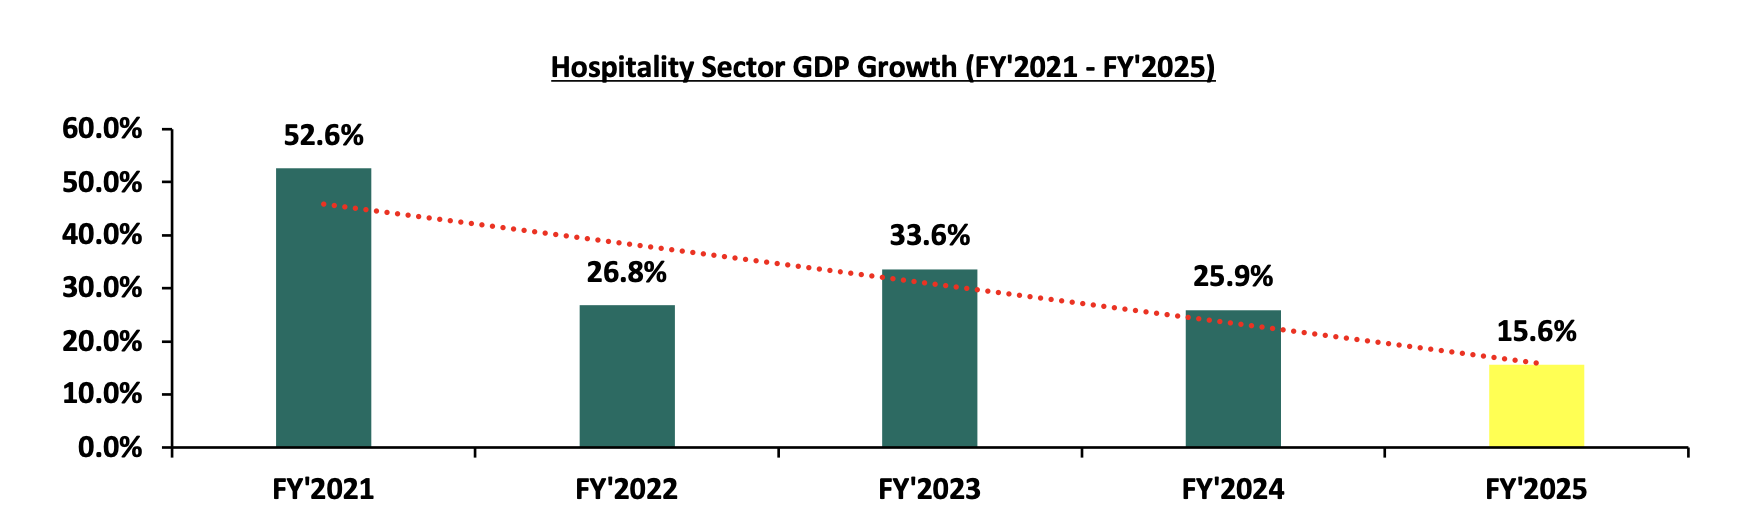
Sectoral contribution to growth: The biggest gainer in terms of sectoral contribution to GDP was the Agriculture and Forestry sector, increasing by 0.8% points to 23.2% in FY’2025 from 22.4% in FY’2024, while Transport and Storage was the biggest loser, declining by 0.9% points to 11.8% in FY’2025, from 12.7% in FY’2024. Real Estate recorded 8.2% contribution to GDP in FY’2025, down from 8.4% recorded in FY’2024, indicating relative stability despite a slight decline. The Accommodation and Food Services sector recorded the highest growth rate in FY’2025 growing by 15.6%, albeit slower than the 25.9% growth recorded in FY’2024.
The chart below shows the top contributors to GDP by sector in FY’2025:
-
Decelerated growth in the Agricultural Sector: Agriculture and Forestry recorded a growth of 3.1% in FY’2025. The performance was a decrease of 1.3% points, from the expansion of 4.4% recorded in FY’2024. Additionally, the sector remains the major contributor to GDP, with the sectoral contribution to GDP increasing by 0.8% points to 23.2% in FY’2025 from 22.4% in FY’2024. The sector’s growth was, however, supported by;
-
Increased production of maize, which rose to 45.8 mn bags in 2025 from 44.8 mn bags in 2024, alongside higher output of potatoes and millet, which grew by 13.6% to 2.5 mn metric tonnes and by 14.3% to 0.8 mn bags, respectively,
-
Improved output in select sub-sectors, including coffee, which rose by 1.6% to 49.5 thousand tonnes in 2025.
The sector’s growth was, however, slowed down by;
-
Uneven weather patterns experienced during the year, characterized by above-average long rains and below-average short rains, resulting in mixed crop performance,
-
A decline in beans production, which fell to 7.4 mn bags in 2025 from 8.4 mn bags in 2024,
-
Accelerated growth in the electricity and water supply sector - The Electricity and Water Supply sector recorded a growth of 11.1% in FY’2025 compared to a 7.8% growth in FY’2024, with the sectoral contribution to GDP marginally decreasing to 1.8% in FY’2025 from 2.0% in FY’2024. Notably, total electricity generation and import increased by 6.8% to 15,067.7 Gigawatt hour (GWh) in FY’2025, from 14,101.9 GWh in FY’2024. The sector’s performance was supported by increase in production from geothermal, wind and solar sources; growth was supported by an increase in hydroelectric power;
-
Electricity generated from geothermal sources increased by 8.0% in 2025 to 5,981.6 GWh compared to 5,551.0 GWh in 2024
-
Similarly, electricity generated from wind and solar rose by 8.4% and 2.8% to stand at 1,949.1 GWh and 473.4 GWh, respectively, in the period under review
However, the sector’s growth was slowed down by decrease in hydroelectric power;
-
Hydroelectric generation declined by 4.6% to 3,462.3 GWh in FY’2025 from 3,630.7 GWh recorded in FY’2024,
-
Significant growth in the Accommodation and Food Service sector: Accommodation and Food Services sector recorded growth in FY’2025, having expanded by 15.6%, albeit slower than the 25.9% recorded in FY’2024. Additionally, the contribution to GDP increased by 0.1% points, to 1.7% in FY’2025, from 1.6% recorded in FY’2024. Some of the notable improvements include:
-
International visitor arrivals through the two major airports, the Jomo Kenyatta International Airport (JKIA) and Mombasa International Airport (MIA) rose by 6.1% in FY’2025 to stand at 1,955,000 visitors compared to 1,842,100 visitors in FY’2024
The chart below shows the different sectoral GDP growth rates for FY’2025:
In 2026, Kenya's economy is projected to grow at a faster pace, estimated between 5.2%-5.4%, supported by improved business activity, relative stability of the Kenyan Shilling, and easing monetary policy, which has contributed to reduced borrowing costs. However, the growth trajectory faces challenges from a tough business environment characterized by increasing taxes and a high cost of living. Despite these headwinds, recent economic developments point to a relatively stable outlook, although inflationary pressures have picked up, with inflation rising from 4.4% in March 2026 to 5.6% in April 2026, largely driven by higher food prices, particularly in the food and non-alcoholic beverages category. External risks also remain elevated, particularly from the ongoing Iran war, which has driven up global oil prices, disrupted supply chains, and further intensified inflationary pressures. In April 2026, the CBK Monetary Policy Committee maintained the Central Bank Rate (CBR) at 8.75%, unchanged from February 2026, following a reduction from 9.00% in December 2025. This reflects an accommodative monetary policy stance aimed at stimulating private sector lending and supporting economic activity. Although inflation has been on an upward trend, it remains within the CBK’s target range of 2.5%–7.5%, providing some level of macroeconomic stability. The accommodative policy environment is expected to ease credit conditions, supporting increased investment by both households and businesses. The agricultural sector, Kenya’s largest contributor to GDP, is expected to remain a key driver of growth, supported by favorable rainfall. While risks from rising fuel prices persist due to global geopolitical tensions, inflation remains contained, supporting a cautiously optimistic economic outlook.
For a more detailed analysis, please see the Cytonn Gross Domestic Product (GDP) Note
-
Kenya FY’2025 Balance of Payments
According to the FY’2025 Economic Survey released by the Kenya National Bureau of Statistics (KNBS), Kenya’s balance of payments position deteriorated by 78.4% in FY’2025, to a deficit of Kshs 315.1 bn, from a deficit of Kshs 176.7 bn in FY’2024. In this note, we provide a detailed analysis of the current account and the balance of payment before giving an outlook on both.
Balance of Payments
Kenya’s balance of payment (BoP) position deteriorated by 78.4% in FY’2025, to a deficit of Kshs 315.1 bn, from a deficit of Kshs 176.7 bn in FY’2024. The y/y negative performance in BoP was mainly driven by a 30.8% widening of the current account deficit to Kshs 373.3 bn from Kshs 285.5 bn in FY’2024, coupled with a 25.2% decrease in the capital account balance to a surplus of Kshs 23.4 bn from Kshs 31.2 bn. The table below shows the breakdown of the various balance of payments components, comparing FY’2025 and FY’2024:
|
Item |
FY'2024 |
FY'2025 |
Y/Y % Change |
|
Current Account Balance |
(285.5) |
(373.3) |
30.8% |
|
Capital Account Balance |
31.2 |
23.4 |
(25.2%) |
|
Financial Account Balance |
(516.2) |
(524.8) |
1.7% |
|
Net Errors and Omissions |
(85.3) |
140.3 |
264.4% |
|
Balance of Payments |
(176.7) |
(315.1) |
78.4% |
All values in Kshs bns
Key take-outs from the table include;
-
The current account deficit (value of goods and services imported exceeds the value of those exported) widened by 30.8% to Kshs 373.3 bn from Kshs 285.5 bn in FY’2024. The y/y increase of the current account deficit was brought about by the 6.8% narrowing in the secondary Income balance surplus to Kshs 956.1 bn from a Kshs 1,025.7 bn in FY’2024,
-
The capital account balance (shows capital transfers receivable and payable between residents and non-residents, including the acquisition and disposal of non-produced non-financial items), which includes foreign direct investments (FDIs), narrowed by 25.2% to a surplus Kshs 23.4 bn in FY’2025, down from a surplus of Kshs 31.2 bn in fy’2024,
-
The financial account balance (the difference between the foreign assets purchased by domestic buyers and the domestic assets purchased by foreign buyers) recorded a 1.7% decrease in net inflow to a deficit Kshs 524.8 bn in FY’2025, from a deficit of Kshs 516.2 bn in fy’2024.
-
Consequently, the Balance of Payments (BoP) position deteriorated to a deficit of Kshs 315.1 bn in FY’2025, from a deficit of Kshs 176.7 bn recorded in FY’2024.
Current Account Balance
Kenya’s current account deficit widened by 30.8% to Kshs 373.3 bn in FY’2025 from the Kshs 285.5 bn deficit recorded in FY’2024. The y/y expansion of the deficit registered was driven by:
-
The widening of the merchandise trade account deficit (the value of import goods exceeds the value of export goods, resulting in a negative net foreign investment) by 2.7% to Kshs 1,377.3 bn in FY’2025, from Kshs 1,340.6 bn recorded in FY’2024, and,
-
A 6.8% decrease in the Secondary Income Balance to a surplus of Kshs 956.1 bn from a surplus of Kshs 1,025.7 bn in FY’2024,
The table below shows the breakdown of the various current account components on a year-on-year basis, comparing FY’2025 and FY’2024:
|
Item |
FY'2024 |
FY'2025 |
Y/Y % Change |
|
Merchandise Trade Balance |
(1,340.6) |
(1,377.3) |
2.7% |
|
Services Trade Balance |
318.5 |
323.9 |
1.7% |
|
Primary Income Balance |
(289.1) |
(276.0) |
(4.5%) |
|
Secondary Income (transfer) Balance |
1,025.7 |
956.1 |
(6.8%) |
|
Current Account Balance |
(285.5) |
(373.3) |
Kenya’s balance of payment (BoP) position deteriorated by 78.4% in FY’2025, to a deficit of Kshs 315.1 bn, from a deficit of Kshs 176.7 bn in FY’2024. The y/y negative performance in BoP was mainly driven by a 30.8% widening in current account deficit to Kshs 373.3 bn from a Kshs 285.5 bn in FY’2024, coupled with a 25.2% decrease in capital account balance to a surplus of Kshs 23.4 bn from a surplus of Kshs 31.2 bn in FY’2024. Looking ahead, Kenya’s external position will mainly rely on the sustainability of services exports and the direction of capital flows. While the strong performance in the services trade, likely supported by tourism, transport and ICT, offers a stabilizing buffer to the current account, the widening merchandise trade deficit continues to underscore structural import dependence and vulnerability to global commodity price movements. This vulnerability is likely to be exacerbated by ongoing geopolitical tensions in the Middle East, particularly the Iran conflict, which has disrupted key shipping routes and increased global freight and insurance costs. For a net importer like Kenya, higher shipping and energy costs are expected to raise the import bill, especially for fuel, machinery and intermediate goods, further widening the merchandise trade deficit. Additionally, elevated global uncertainty may dampen external demand in key export markets, potentially weighing on export growth and limiting the offsetting impact from the services sector. More critically, the sharp reversal in the financial account highlights growing sensitivity to global liquidity conditions, investor risk appetite and domestic policy credibility. Going forward, a recovery in foreign capital inflows, particularly long-term FDI, alongside prudent external debt management, will be key to strengthening the financial account and supporting overall Balance of Payments stability. As such, external pressures from rising import costs and subdued export performance could further deteriorate the current account position in the near term, and Kenya’s balance of payments position may remain under pressure despite gains in the services sector.
For a more detailed analysis, please see the Cytonn Balance of Payment (BOP) Note
-
I&M Bank Limited Launches Kshs 10.0 bn Medium Term Note
During the week, I&M Bank Limited opened the inaugural issuance under its Kshs 20.0 bn Domestic Medium Term Note (MTN) Programme, marking a strategic move to broaden its funding base and strengthen its capital structure. The bank unveiled the first tranche of the programme, comprising a Kshs 10.0 bn offer, expandable by a Kshs 3.0 bn green shoe, signaling flexibility to accommodate investor demand. The issuance consists of fixed -rate medium – term notes with a tenor of 5.6 years priced at 12.2% per annum and targeted for listing on the Nairobi Securities Exchange (NSE).
The structure of the issuance reflects a deliberate effort by I&M Bank to diversify its funding sources beyond traditional deposits and bank borrowings, while securing relatively stable, medium-term capital. By locking in funding at 12.20%, the bank positions itself to support long-term growth and manage its balance sheet more efficiently, particularly through Tier II capital enhancement. The proceeds are earmarked for onward lending, business expansion, and reinforcing the bank’s capital adequacy ratios, aligning funding strategy with growth objectives.
On governance and compliance, I&M obtained a CMA exemption allowing it to limit verification to annual reviews of the allocation reports until full allocation is achieved, rather than for the entire note tenor, lowering administrative costs but placing greater emphasis on timely and transparent reporting for investor assurance.
From an investor perspective, the paper offers a competitive real return relative to comparable medium-term corporate issuances, supported by I&M’s strong market position and robust cash-flow generation. However, the notes remain unsecured, ranking pari passu with other unsecured obligations, and therefore expose investors to the company’s overall leverage position, which includes sizeable secured facilities that rank ahead in claims. Market risk, particularly secondary-market volatility upon listing, also remains a consideration. The table below presents a comparison of tax-adjusted yields against bonds with comparable tenors.
|
Cytonn Report: Tax Adjusted Bond Yield Comparison |
||||||
|
|
Tenor |
Gross Yield to Maturity |
Tax rate |
Net Yield to Maturity |
Tax Equivalent YTM (15.0% basis) |
Tax Equivalent YTM (10.0% basis) |
|
I&M Medium Term Note |
5.6 Years |
12.2% |
10.0% |
10.98% |
12.9% |
12.2% |
|
Safaricom Medium Term Note |
5 Years |
10.4% |
0.0% |
10.4% |
12.2% |
11.6% |
|
EABL Medium Term Note |
5 Years |
11.8% |
15.0% |
10.0% |
11.8% |
11.1% |
|
Normal government bond (FXD1/2011/020) |
5 Years |
11.9% |
10.0% |
10.7% |
12.6% |
11.9% |
Overall, the transaction represents a strategically coherent move; it lowers I&M marginal cost of capital, aligns with global sustainability-linked financing trends, and provides domestic institutional investors with a high-quality corporate instrument in a market dominated by government securities. Its success will ultimately be judged by subscription levels, post-listing performance, and I&M’s discipline in delivering transparent, credible reporting consistent with the commitments in the framework.
Notable Monthly Highlights:
-
During the month, the Monetary Policy Committee met on April 8th, 2026, to review the outcome of its previous policy decisions and decided to maintain the CBR rate at 8.75% unchanged from February 2026. This was in line with our projection of MPC to maintain the CBR at 8.75%. For more information, please see our Cytonn Weekly #14/2026
-
During the month, Stanbic Bank released its monthly Purchasing Manager’s Index (PMI), Kenya’s Purchasing Managers’ Index (PMI) stood at 47.7 in March 2026, falling below the 50.0 expansion threshold for the first time in seven months, and lower than 50.4 in February 2026 and the 55.0 peak recorded in November 2025, indicating that business activity deteriorated. For more information, please see our Cytonn Weekly #14/2026
-
During the month, the Energy and Petroleum Regulatory Authority (EPRA) released their monthly statement on the maximum retail fuel prices in Kenya, effective from 16th April 2026 to 14th May 2026. For more information please check our Cytonn Weekly #15/2026
Rates in the Fixed Income market have been on a downward trend due to high liquidity in the money market which allowed the government to front load most of its borrowing. The government is 20.1% ahead of its prorated net domestic borrowing target of Kshs 842.2 bn, having a net borrowing position of Kshs 1011.2 bn (inclusive of T-bills). However, we expect a stabilization of the yield curve in the short and medium term, with the government looking to increase its external borrowing to maintain the fiscal surplus, hence alleviating pressure in the domestic market. As such, we expect the yield curve to stabilize in the short to medium-term and hence investors are expected to shift towards the long-term papers to lock in the high returns.
Market Performance:
During the month of April, the equities market was on an upward trajectory, with NASI gaining the most by 5.4% while NSE 10, NSE 25 and NSE 20 gained by 5.2%, 4.6% and 3.4% respectively. The equities market performance was mainly driven by gains recorded by large-cap stocks such as Cooperative Bank, Stanbic Bank and Safaricom of 15.9%, 11.3% and 8.0% respectively. However, the performance was weighed down by losses recorded by large cap stocks such as EABL, NCBA and KCB of 3.0%, 1.9% and 1.1% respectively;
During the week, the equities market was on a downward trajectory, with NSE 10 losing the most by 1.5% while NSE 25, NSE 20, and NASI declined by 1.2%, 1.2% and 0.9% respectively, taking the YTD performance to gains of 12.9%, 10.7%, 9.6% and 8.1% for NSE 20, NSE 25, NASI and NSE 10 respectively. The week-on-week equities market performance was driven by losses recorded by large-cap stocks such as Cooperative Bank, KCB, and EABL of 2.8%, 2.2% and 2.0% respectively. The performance was however supported by gains recorded by large cap stocks such as SCB-K and NCBA of 1.2% and 0.3% respectively;
Also, during the month, the banking sector index gained by 5.4% to close at 236.1 from the 224.0 recorded at the end of the March 2026. This was attributable to gains recorded by large-cap stocks such as Cooperative Bank, Stanbic Bank and Absa of 15.9%, 11.3% and 6.8% respectively. The performance was however weighed down by losses recorded by large cap stacks such as NCBA and KCB of 1.9% and 1.1% respectively;
During the week, the banking sector index declined by 1.1% to 236.1 from 238.8 recorded the previous week. This is attributable to losses recorded by large cap stocks such as Cooperative Bank, KCB, and Equity Bank of 2.8%, 2.2% and 2.0% respectively. However, the performance was supported by gains recorded by large cap stocks such as SCB-K and NCBA of 1.2% and 03% respectively;
During the month of April, equities turnover decreased by 20.1% to USD 117.8 mn from USD 147.4 mn recorded during the month of March 2026. Foreign investors remained net sellers, with a net selling position of USD 15.2 mn, from a net selling position of USD 33.1 mn recorded in March 2026.
During the week, equities turnover decreased by 23.6% to USD 17.7 mn from USD 23.1 mn recorded the previous week, taking the YTD total turnover to USD 557.9 mn. Foreign investors remained net sellers for the second consecutive week with a net selling position of USD 2.4 mn, from a net selling position of USD 2.41 mn recorded the previous week, taking the YTD foreign net selling position to USD 83.2 mn, compared to a net selling position of USD 92.9 mn recorded in 2025.
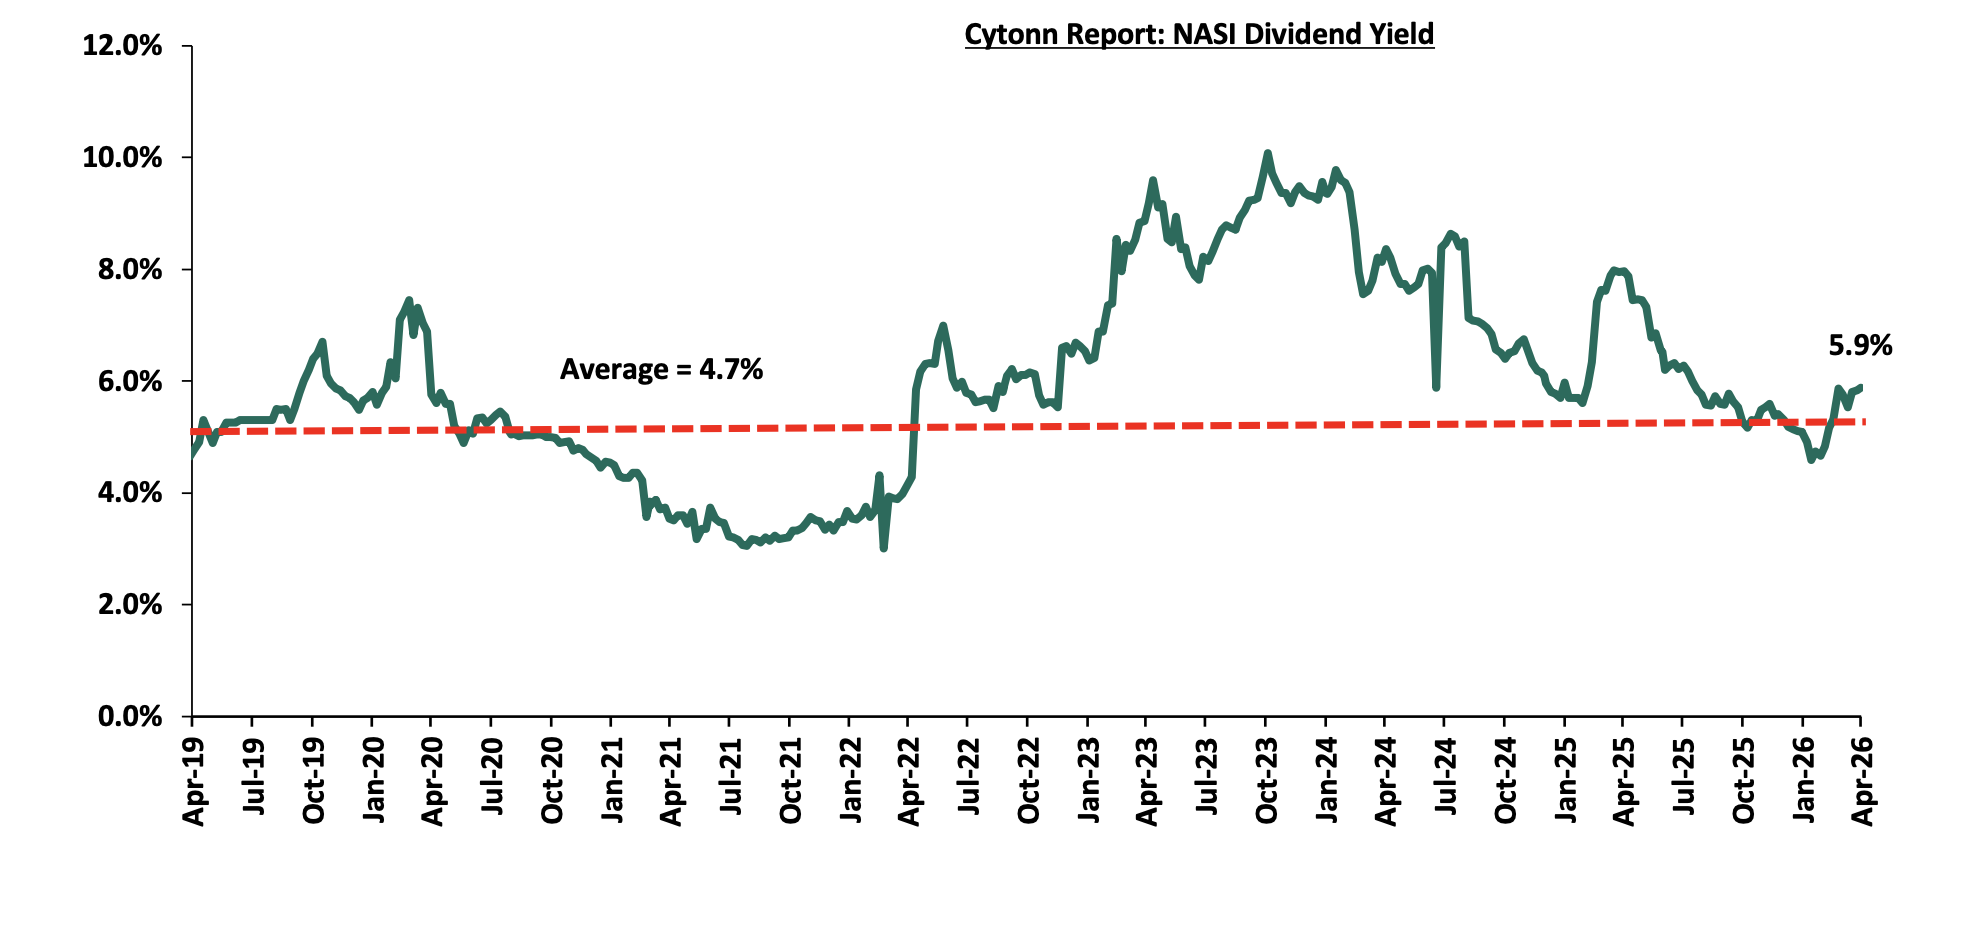
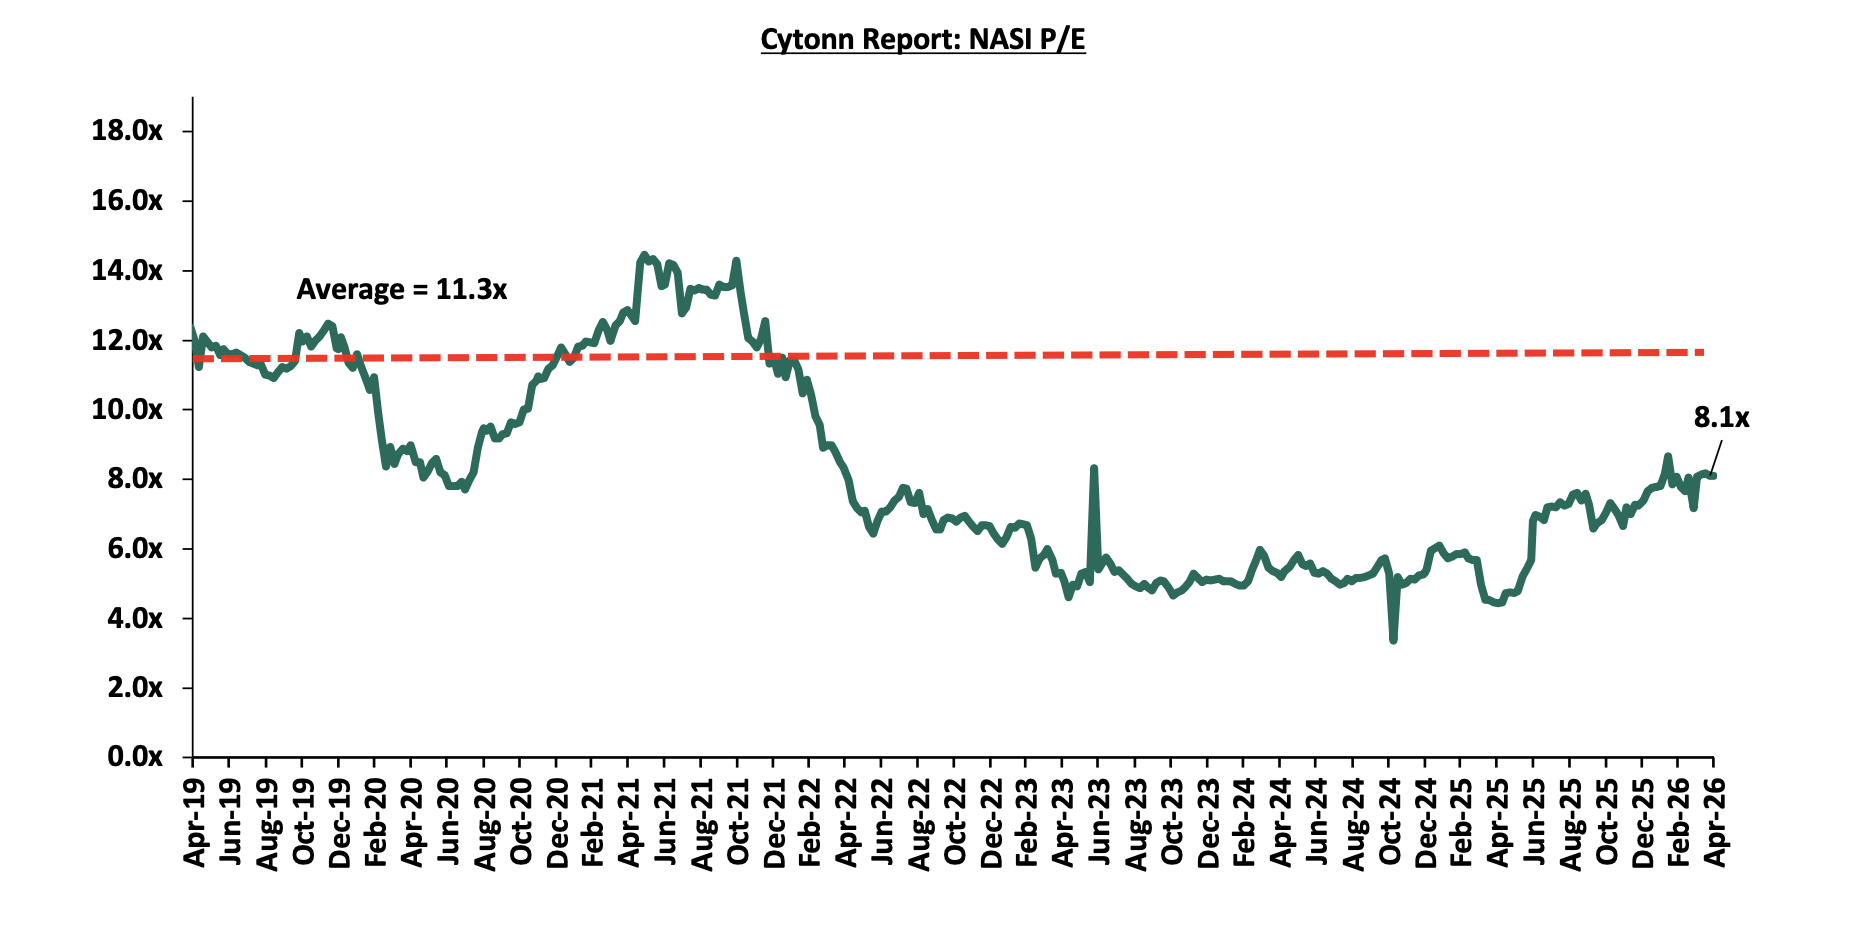
The market is currently trading at a price to earnings ratio (P/E) of 8.1x, 28.2% below the historical average of 11.3x, and a dividend yield of 5.9%, 1.2% points above the historical average of 4.7%. Key to note, NASI’s PEG ratio currently stands at 1.0x, suggesting that the market is fairly valued relative to its expected earnings growth. A PEG ratio greater than 1.0x indicates the market may be overvalued while a PEG ratio less than 1.0x indicates that the market is undervalued.
The charts below indicate the historical P/E and dividend yields of the market;
Universe of Coverage:
|
Cytonn Report: Equities Universe of Coverage |
|||||||||||
|
Company |
Price as at 24/04/2027 |
Price as at 30/04/2027 |
w/w change |
m/m change |
YTD Change |
Year Open 2026 |
Target Price* |
Dividend Yield |
Upside/ Downside** |
P/TBv Multiple |
Recommendation |
|
CIC Group |
4.5 |
4.3 |
(4.3%) |
(6.0%) |
(6.2%) |
4.5 |
5.5 |
3.1% |
32.2% |
1.1x |
Buy |
|
KCB Group |
68.5 |
67.0 |
(2.2%) |
(1.1%) |
1.9% |
65.8 |
81.1 |
10.4% |
31.5% |
0.7x |
Buy |
|
Equity Group |
75.0 |
73.5 |
(2.0%) |
6.5% |
9.7% |
67.0 |
87.8 |
7.8% |
27.3% |
1.0x |
Buy |
|
Co-op Bank |
32.2 |
31.3 |
(2.8%) |
15.9% |
31.0% |
23.9 |
37.2 |
8.0% |
26.7% |
1.2x |
Buy |
|
Diamond Trust Bank |
149.0 |
147.5 |
(1.0%) |
1.0% |
28.5% |
114.8 |
175.1 |
6.1% |
24.8% |
0.4x |
Buy |
|
NCBA |
88.8 |
89.0 |
0.3% |
(1.9%) |
4.7% |
85.0 |
103.3 |
8.0% |
24.0% |
1.2x |
Buy |
|
I&M Group |
49.7 |
49.5 |
(0.3%) |
1.9% |
15.7% |
42.8 |
56.7 |
7.6% |
22.0% |
0.8x |
Buy |
|
Jubilee Holdings |
380.0 |
380.3 |
0.1% |
3.0% |
17.9% |
322.5 |
407.5 |
3.9% |
11.1% |
0.5x |
Accumulate |
|
ABSA Bank |
30.5 |
30.5 |
0.0% |
6.8% |
22.7% |
24.9 |
31.7 |
6.7% |
10.7% |
1.7x |
Accumulate |
|
Britam |
12.4 |
12.3 |
(0.8%) |
0.8% |
35.8% |
9.1 |
13.5 |
0.0% |
9.8% |
0.9x |
Hold |
|
Standard Chartered Bank |
346.8 |
351.0 |
1.2% |
6.3% |
17.1% |
299.8 |
346.8 |
8.8% |
7.6% |
2.2x |
Hold |
|
Stanbic Holdings |
287.5 |
286.0 |
(0.5%) |
11.3% |
44.6% |
197.8 |
273.5 |
7.8% |
3.4% |
1.6x |
Lighten |
|
*Target Price as per Cytonn Analyst estimates **Upside/ (Downside) is adjusted for Dividend Yield ***Dividend Yield is calculated using FY’2025 Dividends |
|||||||||||
Notable Monthly Highlights
-
During the month, Jubilee Holdings Limited released their FY’2025 results. Jubilee’s Profit After Tax (PAT) increased by 17.6% to Kshs 5.6 bn, from Kshs 4.7 bn recorded in FY’2024. The performance was mainly driven by a 16.5% increase in Insurance Services Revenues to Kshs 29.9 bn, from Kshs 25.7 bn in FY’2024, but was however weighed down by the 11.0% increase in Insurance Services Expenses to Kshs 26.9 bn in FY’2025, from Kshs 24.2 bn in FY’2024. For more information, please see our Cytonn Weekly #14/2026
-
During the month, Zenith Bank completed the acquisition of 100% of Paramount Bank in a full takeover transaction aimed at expanding its footprint in East Africa’s mid-tier banking segment. The acquisition marks a significant consolidation move within Kenya’s banking sector as institutions continue to pursue scale, digital transformation, and balance sheet strength. For more information, please see our Cytonn Weekly #14/2026
-
During the month, Centum Investment Company PLC announced the results of its share buyback programme of up to 10.0% of its issued and paid-up share capital, conducted through the Nairobi Securities Exchange (NSE) in accordance with the Companies Act, 2015. The programme, which commenced on 6 February 2023 and was later extended to 30 September 2024, was followed by a second phase that ran from 1 October 2024 to 31 March 2026 after receiving the necessary regulatory and shareholder approvals. For more information, please see our Cytonn Weekly #14/2026;
-
During the month, the Board of Co-operative Bank of Kenya Limited issued a cautionary announcement on 22nd April 2026 regarding a proposed corporate reorganization that will see the Group transition into a Non-Operating Holding Company (NOHC) structure, subject to shareholder and regulatory approvals. A NOHC structure refers to a corporate arrangement where a parent entity does not undertake day-to-day operations, but instead holds and oversees a group of subsidiaries that carry out the actual business activities, allowing for clearer governance, risk segregation, and capital allocation. Under the proposed structure, Co-operative Bank of Kenya Limited, the current listed entity on the Nairobi Securities Exchange, will be converted into “Co-op Bank Group PLC,” which will serve as the non-operating holding company, while a new wholly owned subsidiary, “Co-op Bank Kenya Limited,” will be incorporated to undertake the core banking business in Kenya. For more information, please see our Cytonn Weekly #16/2026;
We maintain a “cautiously optimistic” short-term outlook supported primarily earnings-led attractive valuations, lower yields on short-term government papers and expected global and local economic recovery, and, “neutral” in the long term as persistent foreign investor outflows continue to constrain market liquidity and limit broad-based market re-rating. With the market currently trading at par to its future growth (PEG Ratio at 1.0x), where performance will be driven by company-specific fundamentals rather than general market direction, we believe that investors should reposition towards value stocks exhibiting strong earnings growth, attractive dividend yields, solid balance sheets, sustainable competitive advantages and trading at compelling discounts to their intrinsic value. While foreign investor sell-offs are expected to continue exerting pressure in the near term, we believe this will create selective entry opportunities for long-term investors.
-
Industry Reports
During the week, the Kenya National Bureau of Statistics (KNBS) released the Economic Survey 2026 Report that outlined the performance of various sectors to the GDP and below are the key take-outs related to the Real Estate sector:
-
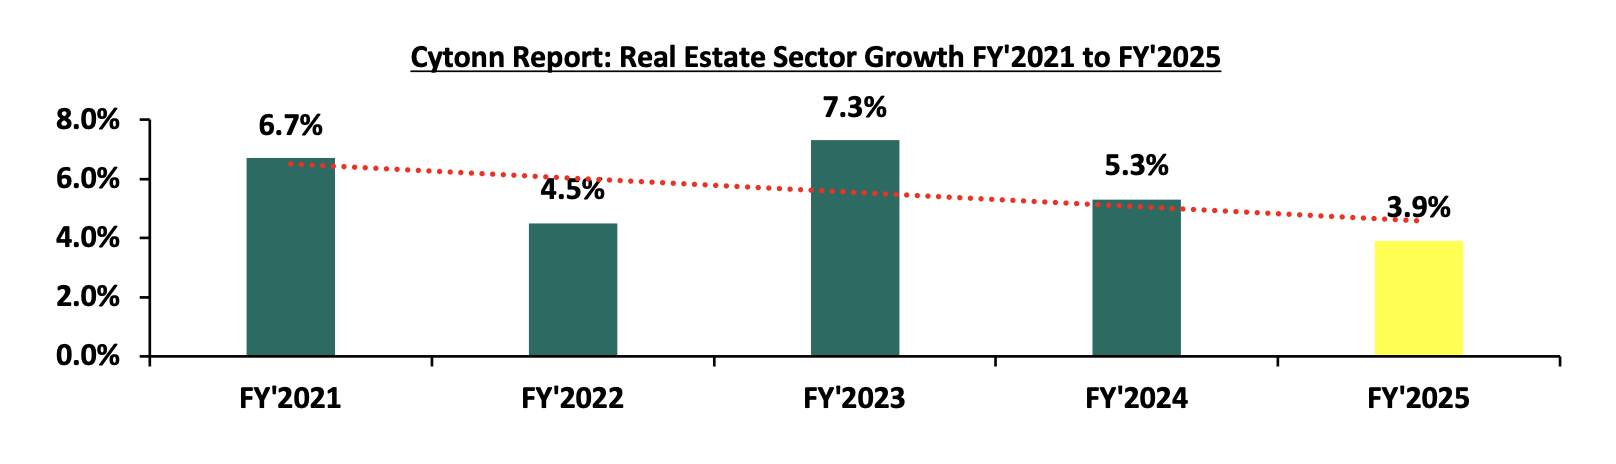
Slow growth in the Real Estate Sector - The Real Estate sector posted growth of 3.9% in FY’2025, which is 1.4% points slower than the 5.3% growth registered in FY’2024, The indicating a slowdown in expansion despite increasing demand for housing in the country. The relatively moderate growth was attributable to; i) Eased interest rates, following CBK’S decision to lower the CBR by 25.0 bps to 9.00% from 9.25% in December 2025. This has enabled increased access to credit and lower rates which has spurred demand in the property market, ii) Improved strength in the Kenyan Shilling, which improved against the US Dollar by 4.1% to Kshs 129.3 in 2025 from Kshs 134.8 in 2024. This helped in reducing the expected importation costs and construction costs for materials such as furniture, fixtures and fittings with Construction Input Price Index growth slowing to 0.5% as compared to 2.8% in Q4’2024, iii) Favourable government and policy interventions. Continued rollout of affordable housing projects under the current government (BETA) has fostered increased demand for residential units and construction related services.
The graph below shows the Real Estate sector contribution to GDP from FY’2021 to FY’2025.
Source: Kenya bureau of statistics (KNBS)
In 2025 the Real Estate contribution to GDP decreased by 0.2% points to 8.2% from 8.4% in FY’2024 driven by tough macroeconomic conditions, including increased taxation and high living costs, weakened the purchasing power of potential buyers, leading to slowed property transactions. The graph below shows the Real Estate Sector contribution to GDP from FY’2021 to FY2025
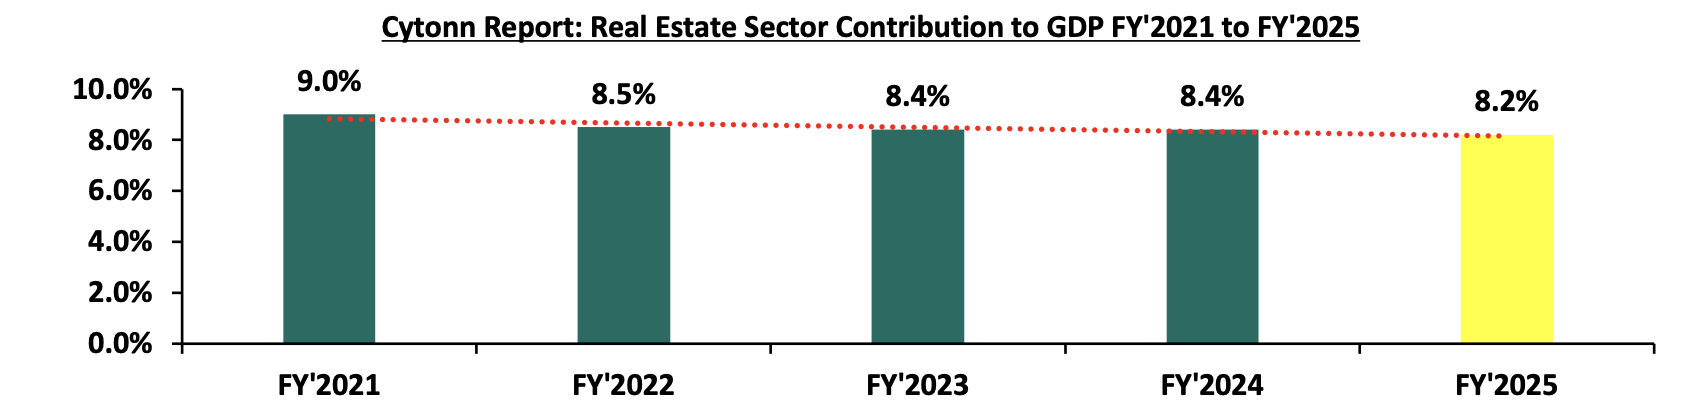
Source: Kenya bureau of statistics (KNBS)
-
Continued growth in the construction sector - The construction sector grew by 6.8% in FY’2025, which is 7.5% points higher than the 0.7% decline in FY’2024. The performance was largely driven by (i) Government’s continued Focus on Affordable Housing: the Kenyan government has sustained its strong commitment to the Affordable Housing Program (AHP), a key pillar under the Bottom-Up Economic Transformation Agenda (BETA). (ii) Infrastructural development: Kenya sustained momentum in infrastructure development, with focus shifting to ongoing government and public-private partnership (PPP) projects aimed at improving connectivity and supporting construction activity and, (iii)Provision of affordable mortgage financing: Kenya Mortgage Refinance Company (KMRC) has continued to play a critical role in expanding access to affordable housing finance by offering single-digit fixed-rate, long-term refinancing to Primary Mortgage Lenders (PMLs) such as banks, SACCOs, and microfinance institutions. The graph below shows the Construction sector growth rates from Q1’2021 to Q4’2025;
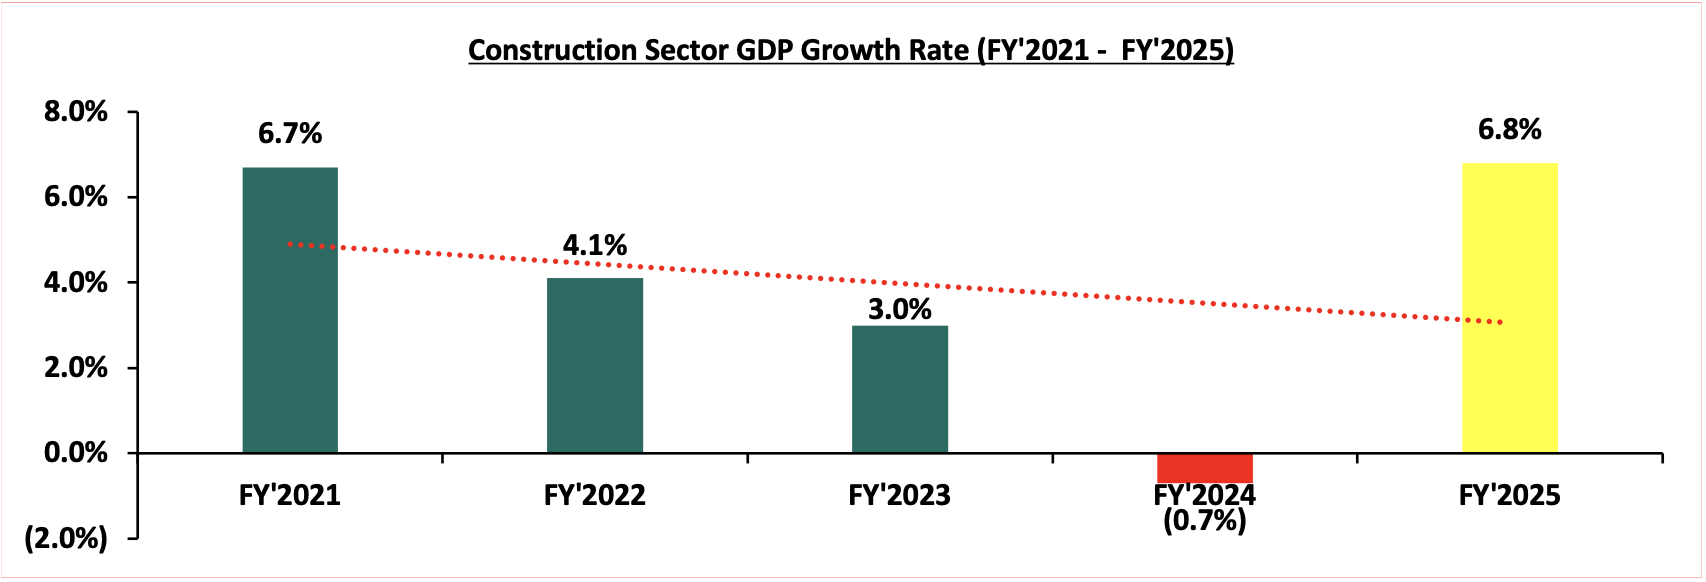
Source: Kenya bureau of statistics (KNBS)
-
Sustained recovery in accommodation and restaurant sector –The accommodation and restaurant services sector grew by 15.6% in FY’2025, representing a 10.3% points y/y decrease from the 25.9% growth recorded in FY’2024, attributable to sustained recovery in tourism which was driven by increased international arrivals and improved domestic travel. The slowed growth compared to FY’2024 is mainly attributable to economic deceleration, high operational costs and constrained consumer spending arising from increased taxation and elevated living costs. Nevertheless, the sector continues to recover steadily from the impacts of COVID-19, with the lifting of travel restrictions remaining a key driver of activity within the wider real estate and tourism industries. The graph below shows the accommodation and restaurant sector contribution to GDP growth rates from FY’2021 to FY’2025;
Source: Kenya bureau of statistics (KNBS)
-
Hass Consult Land and property price index
During the week, Hass Consult, a Kenyan consulting and Real Estate development firm, released its Property Index Q1’2026 Report , focusing on the residential Real Estate sector's performance in the Nairobi Metropolitan Area (NMA). The following are the key take outs from the report;
-
The average selling prices for properties in Nairobi suburbs posted a 1.1% increase on a quarter-on-quarter (q/q) basis in Q1’2026, 0.3% points increase from 0.8% recorded in Q4’2025, while prices in satellite towns fell by 0.9%, compared to a marginal growth of 0.1 percent in the fourth quarter of 2025. The performance was driven by a vibrant house segment that buoyed the market on sustained demand for standalone units with Lavington, Spring Valley and Kilimani recording a house price growth of 4.2%, 4.0% and 3.9% respectively, even as sluggish apartment sales continued to oversupply with suburban apartment markets , Muthangari and Riverside prices grew by 3.8% and 1.8% respectively, however, the performance was weighed down by price declines in Westlands and Upperhill of 2.8% and 2.5% respectively.
-
The average asking rents of housing units in the Nairobi suburbs during Q1’2026 increased by 1.3% quarter‑on‑quarter basis, a slightly lower than the 1.5% increase seen in Q4’2025. While in the satellite towns average rental prices increased by 1.4% compared to 1.2% increase in Q4’2025.
-
On an annual basis, houses in Tigoni had the highest rental price increase at 14.1%, followed by Kiambu at 13.1% and Ongata Rongai and Riverside at 12.1% each, reflecting strong demand in satellite towns. However, Upperhill registered the steepest annual rental price decrease of 5.1%. The overall rental trends reflect shifting demand, with increased tenant preference for apartments in affordable, high-density areas
-
In Nairobi’s suburbs, houses in Lavington posted the highest quarterly sales price increase at 4.2% compared to 1.1% decrease in apartment prices in the same area, driven by continued demand of houses supported by high-end developments and robust infrastructure. In contrast, apartments in Westlands and Upperhill recorded a quarterly price decline of 2.8% and 2.5%, and an annual decrease of 7.9% and 6.8%, making them the weakest-performing segments. While satellite towns apartments, Syokimau posted the highest year-on-year price appreciation at 9.0% in Q1’2026, and 1.9% on a quarter to quarter basis. These trends underscore a shift in tenant and buyer preferences toward satellite towns offering greater value and similar amenities at more competitive prices.
-
Among apartments in satellite towns, Rongai registered the steepest decline, with a 3.9% quarter-on-quarter drop and a 5.5% year-on-year price depreciation in Q1’2026, making it the worst-performing apartment node during the period. This subdued performance reflects elevated land prices, market saturation, and increasing competition from neighboring areas such as Kiambu and Gigiri, which offer superior amenities and better infrastructure access. In contrast, Syokimau apartments posted a 1.9% q/q price increase and a 9.0% y/y gain, supported by its affordability, continued infrastructure upgrades including expanded access via the Nairobi Expressway, Mombasa road and proximity to key social amenities such as schools, shopping malls, and hospitals. These trends highlight shifting buyer and tenant preferences toward affordable, accessible, and well-serviced nodes in Nairobi’s metropolitan periphery.
The findings of the report are in line with our Cytonn Q1’2026 Markets Review, which highlighted that residential property prices in the Nairobi Metropolitan Area (NMA) appreciated by 0.5% year-on-year in the Q1’2026. The uptick in pricing has been supported by stronger investor confidence, improved infrastructure in key nodes, and a shift in buyer preference towards more affordable and spacious developments, particularly in Nairobi’s satellite towns.
Hass Consult released Land Price Index Q1’2026 Report which highlighted the performance of the Real Estate land sector in the Nairobi Metropolitan Area (NMA). The following were the key take outs from the report;
-
In Q1’2026, the average quarter-on-quarter selling prices for land in Nairobi suburbs increased by 0.8%. On a year-on-year basis, land prices in the suburbs appreciated by 5.0%. Meanwhile, in Nairobi’s satellite towns, land prices grew by 0.5% q/q, and posted a 4.3% y/y increase in Q1’2026. This softening in satellite town growth suggests cooling momentum after the strong run in 2024. Despite this, the overall land market continues to demonstrate resilience, buoyed by improved infrastructure, expanding road networks, and steady demand from developers eyeing opportunities in residential, logistics, and mixed-use projects. Strategic corridors such as the Thika Superhighway, Eastern Bypass, and Nairobi Expressway remain key focal points for land acquisition as urban growth extends further into the Nairobi Metropolitan Area.
-
In the Nairobi suburbs, Nyari recorded the highest quarter-on-quarter price gain at 3.1%, followed by Langata at 2.4%. Apart from Kitisuru, Loresho, Muthaiga, Muthangari and Westlands all the other 18 suburbs tracked in the report recorded positive land price movement, albeit at varied rates. Growth in other suburbs remained more modest as buyers shifted focus to areas with better returns or lower entry prices. The performance of Karen and Runda reflects a broader market preference for low-density, amenity-rich neighborhoods where long-term capital appreciation is more likely.
-
In the satellite towns, land markets reflected continued cooling momentum compared to the rallies recorded previous quarters. Seven of the 14 satellite towns surveyed by HassConsult had negative price movement in the quarter, including previous growth hotpots Athi River, Ngong and Syokimau which decreased by 2.5%, 1,7% and 0.7%. With Ruiru , Juja, Ongata Rongai and Kitengela recording growth of 2.8%, 1.2%, 0.9% and 0.8% respectively. The general market trend pointed to softened growth amid economic constraints and shifting buyer sentiment.
These findings align with broader market trends observed in the Cytonn Q1’2026 Markets Review, which reported that the overall average selling prices for land in the Nairobi Metropolitan Area (NMA) appreciated by 1.9% in Q1’2026, reaching Kshs 136.7 mn, up from Kshs 134.1 mn in Q1’2025. This growth was supported by: i) sustained housing demand driven by favorable demographics, urbanization and population growth rates of 2.8% p.a and 2.0% p.a, respectively, both higher than global averages; ii) constrained land supply in key urban nodes, particularly for residential and commercial development; iii) rising land investment interest from a growing middle class with access to more structured financing and investment tools; iv) continued rollout of key infrastructure projects such as the Nairobi Expressway, Eastern Bypass, and water and sewerage extensions, which are opening up new development frontiers; v) land’s entrenched role as a preferred wealth preservation vehicle for Kenyan households; and vi) the Affordable Housing Program under BETA, which remains a critical driver of construction activity and has continued to support upward pressure on land prices in and around key housing project zones.
|
Cytonn Report: Other Notable Industry Reports during the month of April 2026 |
|||
|
# |
Theme |
Report |
Key Take-outs |
|
1 |
Hospitality, Building and Construction |
KNBS LEI report for February 2026 |
In February 2026, cement consumption reached 913,076 metric tonnes, representing a 21.9% y/y increase from the same month in 2025. Month-on-month, consumption decreased by 1.0%, to 913,076 from 922,369 in January 2026 reflecting a decline in momentum in the construction sector. The y/y performance was anchored by (i) continued private sector construction activity in urban hubs such as Nairobi, Mombasa, and Kisumu, (ii) government-led infrastructure investments under the Bottom-Up Economic Transformation Agenda (BETA), including roads, affordable housing, water, and sanitation projects, and (iii) public works initiatives in rural and semi-urban areas, which both support livelihoods and expand critical infrastructure.For more information, please see our Cytonn Weekly #16/2026 |
-
Residential Sector
-
State cuts housing levy investment in T-Bills as projects pick up
The government has reduced its investment of housing levy collections in Treasury bills, signalling improved absorption of funds in the ongoing rollout of State-backed affordable housing projects valued at approximately Kshs 500.0 bn. This follows data from the Economic Survey 2026 indicating that absorption of housing levy funds rose significantly to 96.3% of the Kshs 79.0 bn budget in FY2024/25, compared to 32.6% of Kshs 78.2 bn in FY2023/24, reflecting a notable improvement in execution capacity within the housing programme.
Actual expenditure on housing projects also increased sharply to Kshs 79.03 bn in FY2024/25, from Kshs 25.5 bn in FY2023/24 and Sh9.1 bn in FY2022/23, prior to the full implementation of the housing levy in July 2023. This ramp-up in spending is attributed to scaling up of affordable housing projects, with over 205,000 housing units under development nationwide, including 138,474 affordable housing units, 53,350 social housing units, and 12,709 institutional housing units, supported by strong inflows into the fund, which reached Kshs 73.2 bn in FY2024/25, above the government’s target of Kshs 63.2 bn.
We expect the continued improvement in fund absorption to support accelerated delivery of affordable housing units, driven by increased fiscal allocation efficiency and the scaling up of construction activity across the country. The Affordable Housing Programme is likely to remain a key driver of residential real estate expansion, particularly in urban and peri-urban areas, as government-led demand continues to anchor development activity. However, execution capacity, project pipeline sustainability, and absorption of units upon completion will remain key factors influencing overall sector performance.
-
KMRC seeks to raise Kshs 3.0 bn through second green bond issuance
The Kenya Mortgage Refinance Company (KMRC) has announced plans to raise Sh3.0 bn through a green bond issuance, marking the second tranche of its Kshs 10.5 bn Medium-Term Note programme approved in 2022. The eight-year sustainability-linked bond will have proceeds fully directed towards refinancing eligible green and social home loans, aimed at expanding access to affordable and climate-friendly housing finance, with a green bond being a fixed-income instrument whose proceeds are dedicated to financing environmentally sustainable projects, making it important in channeling capital toward climate-friendly investments while attracting ESG-focused investors and supporting sustainable economic development. The offer period runs from 28thApril to 12thMay 2026, with a minimum subscription of Kshs 100,000.0 and listing expected on the Nairobi Securities Exchange thereafter.
This issuance comes against a backdrop of improved capital markets conditions and stronger housing sector activity, with KMRC noting that proceeds will be deployed alongside other concessional funding to support mortgage liquidity in the market. Notably, the transaction follows heightened activity in Kenya’s sustainability-linked debt space, including recent corporate and quasi-sovereign issuances that have been well received by the market, reflecting sustained investor appetite for ESG-aligned instruments.
On performance, KMRC’s first green/sustainability-linked issuance under its MTN programme in 2022 raised approximately Kshs 1.4 bn and was significantly oversubscribed by 480.0% receiving bids worth Kshs 8.1 bn against the offered Kshs 1.4 bn, recording strong demand driven by institutional investors seeking exposure to housing-finance-linked fixed income instruments. The strong uptake highlighted investor confidence in KMRC’s credit profile, underpinned by its quasi-sovereign backing and mandate to support mortgage refinancing. However, subsequent financial performance showed some pressure on earnings, with net profit moderating in FY2025 on the back of lower net interest income, reflecting sensitivity to interest rate movements and funding costs.
We expect the new issuance to attract solid demand, though likely more calibrated compared to the first tranche, given a more normalised interest rate environment and competing government securities yields. The green bond is expected to further deepen Kenya’s sustainable finance market while supporting liquidity in the mortgage sector. However, pricing relative to Treasury securities, overall market liquidity, and investor risk appetite will remain key determinants of subscription levels and secondary market performance.
There were two notable residential highlights during the month;
-
During the week, Mi Vida Homes announced its entry into Kenya’s luxury Real Estate segment through a Kshs 5.6 bn residential development in Tatu City, signaling a strategic shift from its traditional focus on mid-market and affordable housing. The project, known as 156 Elara, represents the developer’s response to growing demand for high-end housing and reflects broader trends in Kenya’s evolving property landscape, where satellite towns are increasingly attracting premium investments. For more information, please see our Cytonn Weekly #16/2026
-
During the week, the High Court halted the construction of a disputed affordable housing project in Githunguri, Kiambu County, following a legal challenge over the development of 2,180 housing units on the site. The ruling stopped ongoing works as the matter awaits full determination by the court. For more information, please see our Cytonn Weekly #15/2026
-
Commercial Office Sector
There was one notable commercial office highlight during the month;
-
During the month, the National Treasury announced plans to buy Jubilee Insurance Centre in Nairobi for Kshs 2.5 bn. The proposal has been approved by the National Assembly’s Budget and Appropriations Committee (BAC) as part of the FY’2025/26 Supplementary Budget I. For more information, please see our Cytonn Weekly #14/2026,
-
Hospitality Sector
There was five notable hospitality highlights during the month;
-
During the week, Singapore-based lodging operator The Ascott Limited announced a partnership with Kenyan insurer Britam Holdings to develop a new 160-room hotel in Nairobi’s Kilimani area. The project, branded Citadines Westview Nairobi, will be located adjacent to the existing Somerset Westview Nairobi serviced apartments and is scheduled to open in early 2028. For more information, please see our Cytonn Weekly #15/2026
-
During the month, W Hospitality group released a 2025 Hotel Chain Development Pipelines in Africa report that indicated that the Hotel development in Nairobi has increased significantly, with international chains expanding their investment pipeline by 58.3% to reach 3,650 rooms currently under construction. This marks a strong rebound from last year, where only 2,306 rooms were in development, and reflects renewed investor interest in the city’s hospitality sector. For more information, please see our Cytonn Weekly #14/2026,
-
During the month, regional low-cost airline Jambojet announced plans to expand its network by launching flights to Entebbe and Dar es Salaam by March 2027, as part of a broader growth strategy. The airline, which currently operates an international route from Mombasa to Zanzibar, aims to rebuild and extend routes that were halted during Covid-19 disruptions. For more information, please see our Cytonn Weekly #14/2026
-
During the month, Air France announced plans to introduce a larger aircraft on the Paris–Nairobi route from May. It will replace the Airbus A350 plane with a Boeing 777-200, raising seat capacity by about 12.0%. This change responds to growing demand on Paris-Nairobi route. For more information, please see our Cytonn Weekly #14/2026
We expect the hospitality sector to record positive performance, supported by a combination of rising international and domestic tourism demand, stronger investment interest, and strategic positioning as a hub for both leisure and business travel. The launch of direct charter flights from Budapest, Hungary, to Mombasa, Kenya, reflect a growing interest in Kenya’s coastal tourism from Eastern Europe in January 2026. However, inconsistent infrastructure in rural areas and financial constraints in urban markets remain key challenges that could limit the sector’s optimal growth.
-
Infrastructure Sector
There were two notable highlights during the month
-
During the month, the World Bank approved Kshs 71.0 bn (USD 550.0 mn) in financing for the upgrade of the Nairobi-Mandera road corridor, marking a significant infrastructure investment under the Horn of Africa Gateway Development Project. The funding will be disbursed in two tranches, including USD 290.0 mn for the additional financing phase and USD 260.0 mn for the second phase of the program. The project targets the upgrade of approximately 508.0 km of the Isiolo–Mandera corridor, alongside the installation of about 1,270 km of high-capacity fibre optic infrastructure, aimed at enhancing both transport and digital connectivity in northern Kenya. For more information, please see our Cytonn Weekly #15/2026,
-
During the month, the Government, in partnership with UNEP and UN Habitat announced Nairobi as the focus of a new Kshs 672.0mn urban greening initiative aimed at transforming parts of the city into greener and more climate-resilient spaces. The programme is expected to target areas including Kamukunji as a pilot “green neighborhood,” with plans to improve urban environmental conditions and public spaces for residents. For more information, please see our Cytonn Weekly #15/2026
We expect the infrastructure sector to be supported by a combination of new road projects like the issuance of the Kshs 175.0 bn infrastructure bond in February 2026 which will help pay pending bills and facilitate resumption of works and completion of the funding agreements and compensation processes in preparation of extension of the Naivasha-Malaba SGR project will typically influence land values and development activity along the corridor. We also expect that the reopening of the Kijabe railway line will go beyond disaster recovery and signals progress in building a more resilient and efficient infrastructure system in Kenya. It strengthens freight logistics, supports regional trade, and reduces pressure on roads, all while aligning with sustainable transport objectives.
-
Mixed-Use Development Sector
-
Greenspan Mall to add residential units in mixed-use shift
During the week, ILAM Fahari Real Estate Investment Trust (REIT), the owner of Greenspan Mall in Donholm, Nairobi, announced plans to reposition the asset into a mixed-use development through the addition of residential units. The redevelopment will integrate residential apartments alongside the existing retail and commercial components of the mall, effectively transforming it into a live-work-play development. The REIT indicated that consultants have already been appointed to support the planned development, which is expected to proceed subject to the necessary approvals.
The planned shift is expected to enhance the long-term performance of the asset through diversified income streams and improved land utilisation, as the introduction of residential units will complement the existing retail offering. The move also aligns with the broader trend in Nairobi’s real estate market, where mall owners are increasingly adopting mixed-use models to optimise returns from underutilised land parcels. In addition, the integration of residential space is expected to support sustained footfall and tenant demand within the retail component of the development.
We expect the repositioning of Greenspan Mall to enhance rental income stability and growth prospects in the long term, supported by the continued structural shift towards mixed-use developments (MUDs) in urban areas, as developers increasingly prioritise land optimisation, diversified rental income streams, and enhanced asset resilience. The MUDs sector is expected to continue outperforming traditional single-use developments over the medium to long term, driven by urbanisation, growing demand for integrated live-work-play environments, and improved investor appetite for developments with multiple income streams and stronger occupancy stability.
-
Real Estate Investments Trusts
-
REITs Weekly Performance
On the Unquoted Securities Platform Acorn D-REIT and I-REIT traded at Kshs 27.4 and Kshs 23.2per unit, respectively, as per the last updated data on 10th April 2026. The performance represented a 33.4% and 14.5% gain for the D-REIT and I-REIT, respectively, from the Kshs 20.0 inception price. The volumes traded for the D-REIT and I-REIT came in at 13.4 mn and 42.2 mn shares, respectively. Additionally, ILAM Fahari I-REIT traded at Kshs 13.8 per share as of 10th April 2026, representing a 31.0% loss from the Kshs 20.0 inception price. The volume traded to date came in at 1.2 mn shares for the I-REIT,
REITs offer various benefits, such as tax exemptions, diversified portfolios, and stable long-term profits. However, the ongoing decline in the performance of Kenyan REITs and the restructuring of their business portfolios are hindering significant previous investments. Additional general challenges include:
-
Insufficient understanding of the investment instrument among investors leading to a slower uptake of REIT products,
-
Lengthy approval processes for REIT creation,
-
High minimum capital requirements of Kshs 100.0 mn for REIT trustees compared to Kshs 10.0 mn for pension funds Trustees, essentially limiting the licensed REIT Trustee to banks only
-
The rigidity of choice between either a D-REIT or and I-REIT forces managers to form two REITs, rather than having one Hybrid REIT that can allocate between development and income earning properties
-
Limiting the type of legal entity that can form a REIT to only a trust company, as opposed to allowing other entities such as partnerships, and companies,
-
We need to give time before REITS are required to list – they would be allowed to stay private for a few years before the requirement to list given that not all companies maybe comfortable with listing on day one, and,
-
Minimum subscription amounts or offer parcels set at Kshs 0.1 mn for D-REITs and Kshs 5.0 mn for restricted I-REITs. The significant capital requirements still make REITs relatively inaccessible to smaller retail investors compared to other investment vehicles like unit trusts or government bonds, all of which continue to limit the performance of Kenyan REITs.
There were one notable highlights during the month
-
During the month, Laptrust Imara I-REIT’s their FY’2025 financial results. For more information please see our Laptrust Imara I-REIT’s FY’2025 earnings note
We expect the performance of Kenya’s real estate sector to remain resilient, supported by several factors: i) ongoing rollout of State-backed affordable housing projects valued at approximately Sh500.0 bn. ii) The Kenya Mortgage Refinance Company (KMRC) has plans to raise Sh3.0 bn through a green bond issuance. iii) ILAM Fahari Real Estate Investment Trust (REIT), the owner of Greenspan Mall in Donholm, Nairobi, plans to reposition the asset into a mixed-use development through the addition of residential units However, challenges such as rising construction costs, infrastructure constraints, weak investor appetite in listed REITs such as ILAM Fahari I-REIT, oversupply in select real estate classes, and high capital demands will continue to impede the sector’s optimal performance

- Talk to us
- Kenya
- P.O Box 20695 - 00200, Nairobi, Kenya
- Cell +254709101200
- Tel +254709101200
- WhatsApp +254741676635
- United States
- +254709101200
- DOWNLOAD OUR APP
-


- Kenya
- 8th Floor, Pinetree Plaza, Kaburu Drive, Ngong Road, Nairobi, Kenya
- USA
- Suite 1150, 1775 Eye Street NW, USA, Washington DC 20006, USA
- Investments
- High Yield
- Private Equity
- Real Estate
- Real Estate
- RiverRun Estates
- Cytonn Towers
- The Ridge
- Taraji Heights
- The Alma