Cytonn Q1’2026 Markets Review
By Research Team, Apr 5, 2026
Executive Summary
Global Markets Review
According to the World Bank the global economy is projected to grow at 2.6% in 2026, higher than the 2.3% growth recorded in 2025. This forecast marks a significant upward revision from earlier projections, reflecting economic recovery, particularly for emerging markets. The World Bank’s growth projection of 2.6% is 0.7% points lower than the IMF’s 2026 forecast of 3.3%. Notably, advanced economies are expected to record a 1.6% growth in 2026, down from the 1.7% expansion recorded in 2025. Additionally, emerging markets and developing economies are projected to expand by 4.0% in 2026, down from the 4.2% expansion recorded in 2025;
Sub-Saharan Africa Region Review
According to the World Bank, the Sub-Saharan economy is projected to grow at a moderate rate of 4.3% in 2026, which is 0.3% points higher than the 4.0% growth recorded in 2025. The expected recovery is primarily driven by private consumption growth as declining inflation boosts the purchasing power of household incomes. Nevertheless, the risk of debt distress remains high with more than half of countries facing unsustainable debt burdens. The public debt is expected to remain high due to increased debt servicing costs as a result of continued currency depreciation and high interest rates in developed economies;
Kenya Macro Economic Review
According to the Kenya National Bureau of Statistics (KNBS) Q3’2025 Gross Domestic Product Report, the Kenyan economy recorded a 4.9% growth in Q3’2025, higher than the 4.2% growth recorded in Q3’2024. The improved performance was largely driven by accelerated growth in key sectors, with Mining and Quarrying rebounding to 16.6% in Q3’2025 from a 12.2% contraction in Q3’2024, Construction expanding by 6.7% in Q3’2025 from a 2.6% contraction in Q3’2024, and Electricity and Water Supply growing by 3.6% in Q3’2025 from 0.9% in Q3’2024. Consequently, the economy recorded an average growth of 4.9% in the first three quarters of 2025, an improvement from the 4.5% average growth recorded in a similar period in 2024. The average GDP growth rate for 2025 is expected to come in at an average of 5.0%, an improvement from the 4.7% expansion witnessed in 2024;
The year-on-year inflation in March 2026 increased by 0.1% points to 4.4% from the 4.3% recorded in February 2026 which is in line with our projection of an increase to a range of 4.4%-4.6%. The price increase was primarily driven by a by a rise in prices of items in the Food and Non-alcoholic Beverages at 7.7%; Transport 3.8%; and Housing, Water, Electricity, Gas and other fuels at 2.0%; over the one-year period;
Fixed Income
During Q1’2026, T-bills were oversubscribed, with the overall subscription rate coming in at 196.1%, up from 136.1% in Q1’2025. Investors’ preference for the 91-day paper persisted with the paper receiving bids worth Kshs 88.9 bn against the offered Kshs 52.0 bn, translating to an oversubscription rate of 170.9%, albeit lower than the oversubscription rate of 221.1% recorded in Q1’2025. Overall subscription rates for the 364-day papers came in at 334.3% which was higher than the 140.4% recorded in Q1’ 2025, while that for 182-day papers came in at 67.9% which was lower than the 97.8% recorded in Q1’2025. The average yields on the 364-day, 182-day and 91-day papers decreased by 1.9%, 1.7% and 1.6% points to 8.9%, 7.8% and 7.6% in Q1’2026, respectively, from 10.8%, 9.5% and 9.2%, respectively, in Q1’2025. The downward trajectory in yields is primarily driven by improved investor confidence, stemming from reduced credit risk in the country and relatively eased inflationary pressures. This has lowered the risk premium demanded by investors. During the period, the acceptance rate stood at 72.8%, down from 86.4% in Q1’2025, with the government accepting Kshs 445.3 bn out of the Kshs 611.8 bn worth of bids received;
During the week, T-bills were undersubscribed for the second consecutive week, with the overall subscription rate coming in at 70.8%, however, higher than the subscription rate of 45.5% recorded the previous week. Investors’ preference for the shorter 91-day paper waned, with the paper receiving bids worth Kshs 1.2 bn against the offered Kshs 4.0 bn, translating to a subscription rate of 30.1%, lower than the subscription rate of 64.9%, recorded the previous week. The subscription rate for the 182-day paper increased significantly to 90.9% from 28.3% recorded the previous week, while that of the 364-day paper increased to 67.1% from 54.9% recorded the previous week. The government accepted a total of Kshs 16.95 bn worth of bids out of Kshs 17.00 bn bids received, translating to an acceptance rate of 99.7%. The yields on the government papers showed a mixed performance with the yields on the 182-day papers increasing by 0.1 bps to remain relatively unchanged from the 7.8% recorded the previous week. The yields on the 91-day paper decreased by 2.6 bps to 7.40% from 7.43% recorded the previous week, while the yields on the 364-day paper decreased by 0.3 bps to remain relatively unchanged from the 8.3% recorded the previous week;
During the quarter, the government re-opened six bonds, seeking to raise Kshs 170.0 bn during the quarter. The bonds were generally oversubscribed, receiving bids worth Kshs 402.7 bn against the offered Kshs 170.0 bn, translating to a subscription rate of 236.9%. The government accepted Kshs 222.1 bn of the Kshs 402.7 bn worth of bids received, translating to an acceptance rate of 55.2%. Also, during the quarter, the government conducted two bond switch auctions, both involving switches from FXD1/2016/010 to FXD1/2022/015 in January and from FXD1/2021/005 to FXD3/2019/015 in March. FXDI/2022/015 was oversubscribed, receiving bids worth 26.5 bn against the offered 20.0 bn, translating to a subscription rate of 132.5% having an average acceptance yield of 13.2% while FXD3/2019/015 was oversubscribed, receiving bids worth 22.2 bn against the offered 15.0 bn, translating to subscription rate of 148.0% having an average acceptance yield of 11.6%;
During the week, the Central Bank of Kenya released the auction results for the re-opened treasury bonds FXD1/2020/015 and FXD1/2018/025 with tenors to maturities of 8.9 years and 17.3 years respectively and fixed coupon rates of 12.8% and 13.4% respectively. The bonds were oversubscribed, with the overall subscription rate coming in at 187.2%, receiving bids worth Kshs 74.9 bn against the offered Kshs 40.0 bn. The government accepted bids worth Kshs 50.2 bn, translating to an acceptance rate of 67.0%. The weighted average yield for the accepted bids for the FXD1/2020/015 and FXD1/2018/025 came in at 12.2% and 13.0% respectively. Notably, the 12.2% yield on FXD1/2020/015 was lower than the 13.7% recorded at its last reopening in April 2025. Similarly, the 13.0% yield on FXD1/2018/025 was lower than the 13.4% recorded at its last reopening in February 2026. With the Inflation rate at 4.4% as of March 2026, the real returns of the FXD1/2020/015 and FXD1/2018/025 are 7.8% and 8.6%. Given the 10.0% withholding tax on the bonds, the tax equivalent yields for shorter term bonds with 15.0% withholding tax are 12.9% and 13.8% for the FXD1/2020/015 and FXD1/2018/025 respectively;
We expect the MPC to maintain the Central Bank Rate (CBR) at 8.75%, with their decision mainly being supported by rate holds by giant economies;
Equities
During Q1’2026, the equities market was on an upward trajectory, with NSE 20, NSE 25, NASI, and NSE 10 gaining by 9.3%, 6.3%, 4.4%, and 3.3%, respectively. The equities market performance during the quarter was driven by gains recorded by large caps such as Stanbic, DTB-K and BAT of 30.0%, 27.5%, and 23.1% respectively. The gains were however weighed down by losses recorded by large cap stocks such as EABL and Safaricom of 4.6% and 3.0% respectively;
During the week, the equities market was on an upward trajectory, with NSE 10, NSE 25, NASI and NSE 20 gaining by 2.2%, 2.1%, 1.9%, and 1.8%, respectively, taking the YTD performance to gains of 10.8%, 7.9%, 6.4% and 4.9% for NSE 20, NSE 25, NASI, and NSE 10 respectively. The equities market performance was mainly driven by gains recorded by large-cap stocks such as Absa, Cooperative Bank and Stanbic Bank, of 8.8%, 6.3%, and 6.1%, respectively. The gains were however weighed down by losses recorded by large cap stocks such as EABL and DTB-K of 1.2% and 0.5% respectively;
During Q1’2026, the banking sector index gained by 10.0% to 224.0 from 203.7 recorded the previous quarter. This is attributable to gains recorded by stocks such as Stanbic Bank, DTB-K and Absa of 30.0%, 27.5%, and 15.6%, respectively;
Also, during the week, the banking sector index increased by 3.0% to 228.6 from 221.9 recorded the previous week. This is attributable to losses recorded by stocks such as Absa, Cooperative Bank and Stanbic Bank, of 8.8%, 6.3%, and 6.1%, respectively;
During the week HF Group released their FY’2025 results. HF Group’s Profit After Tax (PAT) increased significantly by 171.1% to Kshs 1.4 bn, from Kshs 0.5 bn in FY’2024. The performance was mainly driven by a 48.0% increase in total operating income to Kshs 6.2 bn, from Kshs 4.2 bn in FY’2024, which outpaced the 25.5% increase in operating expenses to Kshs 4.7 bn, from Kshs 3.7 bn in FY’2024. The 25.5% increase in Operating expenses was largely driven by the 22.0% increase in staff costs to Kshs 2.3 bn, from Kshs 1.9 bn in FY’2024;
During the week, CIC Group released their FY’2025 results. CIC’s Profit After Tax decreased by 68.7% to Kshs 1.3 bn in FY’2025, from Kshs 4.0 bn recorded in FY’2024. The performance was mainly driven by non-recurrence of a one-off fair value gain of approximately Kshs 1.0 bn arising from revaluation of its Kiambu land recognized in 2024 financials and elevated claims resulting in a significant 151.2% decrease in net insurance income to Kshs (0.2) bn in FY’2025, from Kshs 0.3 bn in FY’2024, coupled with the 58.2% decrease in the net investment result to Kshs 1.6 bn from Kshs 3.8 bn in FY’2024;
During the week, Britam Holdings released their FY’ 2025 results. Britam’s Profit After Tax (PAT) increased by 10.0% to Kshs 5.5 bn, from Kshs 5.0 bn recorded in FY’2024. The performance was mainly driven by the 4.2% increase in net investment income to Kshs 31.9 bn from Kshs 30.6 bn recorded in FY’2024 supported by a 10.9% increase in net insurance revenue to Kshs 41.7 bn from the Kshs 37.6 bn recorded in FY’2024;
Real Estate
In Q1’2026, the general Real Estate sector continued to witness considerable growth in activity in terms of property transactions and development activities. Consequently, the sector’s activity grew by 7.6 % to Kshs 368.7 bn in Q3’2025, from Kshs 342.6 bn recorded during the same period in 2024. In addition, the sector contributed 8.6% to the country’s GDP, 2.2% points decrease from 10.8% recorded in Q3’2024. Cumulatively, the Real Estate and construction sectors contributed 16.6% to GDP, 0.1% points increase from 16.5% in Q3’2024, attributable to increase in construction contribution to GDP by 1.0% points, to 6.7% in Q3’2025, from 5.7% recorded in Q3’2024. The graph below highlights the Real Estate and Construction sectors’ contribution to GDP from 2020 to Q3’2024;
During the week, restaurant chain Java House announced the opening of a new outlet at Trafford Park in Syokimau, Machakos County, as part of its expansion strategy targeting high-growth urban nodes within the Nairobi Metropolitan Area. The new branch brings the total number of Java House outlets in East Africa to 105, reflecting continued expansion across Kenya, Uganda, and Ethiopia;
During the week, Shengli Engineering Construction (Group) Company Limited, a Chinese firm affiliated with Sinopec Petroleum Engineering, was awarded a Kshs 4.1 bn contract to upgrade the 44 km Uplands-Githunguri-Ruiru (B116) road to bitumen standards. The project, which is set to start on March 18, 2026, and run until April 2030, will link the Nairobi-Nakuru Highway at Uplands with the Nairobi-Thika Superhighway at Ruiru, creating a strategic transport corridor within the Nairobi metropolitan region;
During the week, property developer Acorn announced plans to transfer three completed student accommodation assets valued at Kshs 4.5 bn from its Development REIT (D-REIT) to its Investment REIT (I-REIT) in 2026, as part of a strategy to deleverage amid elevated financing costs. The assets earmarked for transfer include Qwetu and Qejani Karen, located near the Catholic University of Eastern Africa, and Qwetu Chiromo, valued at Kshs 1.4 bn, Kshs 0.9 bn, and Kshs 2.2 bn respectively as at June 2025. The D-REIT, which focuses on developing purpose-built student accommodation using debt financing, typically exits completed assets to the I-REIT to recycle capital and fund new developments;
During the week, real estate stakeholders called on the government to reinstate stamp duty exemptions on Real Estate Investment Trust (REIT) asset transfers, citing increased transaction costs as a key impediment to the sector’s growth. The appeal, made during the 2026 African REITs Conference in Naivasha, follows the lapse of the exemption in December 2022, which has since subjected REIT asset transfers to stamp duty of 4.0% in urban areas and 2.0% in rural areas, significantly raising the cost of asset acquisition;
During the week on REITS Acorn I-REIT and D-REIT, ILAM Fahari I-REIT, released their FY’2025 results that showed their financial performance; For a more detailed analysis, please see the ILAM Fahari I-REIT’s FY’2025 Earnings Note, and Acorn I-REIT and D-REIT’s FY’2025 Earnings Note
On the Unquoted Securities Platform Acorn D-REIT and I-REIT traded at Kshs 27.4 and Kshs 23.2per unit, respectively, as per the last updated data on 2nd April 2026. The performance represented a 33.4% and 14.5% gain for the D-REIT and I-REIT, respectively, from the Kshs 20.0 inception price;
Investment Updates:
- Weekly Rates: Cytonn Money Market Fund closed the week at a yield of 11.1% p.a. To invest, dial *809# or download the Cytonn App from Google Play store here or from the Appstore here;
- We continue to offer Wealth Management Training every Tuesday, from 7:00 pm to 8:00 pm. The training aims to grow financial literacy among the general public. To register for any of our Wealth Management Trainings, click here;
- If interested in our Private Wealth Management Training for your employees or investment group, please get in touch with us through wmt@cytonn.com;
- Cytonn Insurance Agency acts as an intermediary for those looking to secure their assets and loved ones’ future through insurance namely; Motor, Medical, Life, Property, WIBA, Credit and Fire and Burglary insurance covers. For assistance, get in touch with us through insuranceagency@cytonn.com;
- Cytonn Asset Managers Limited (CAML) continues to offer pension products to meet the needs of both individual clients who want to save for their retirement during their working years and Institutional clients that want to contribute on behalf of their employees to help them build their retirement pot. To more about our pension schemes, kindly get in touch with us through pensions@cytonn.com;
Hospitality Updates:
- We currently have promotions for Staycations. Visit cysuites.com/offers for details or email us at sales@cysuites.com;
Global Economic Growth:
According to the World Bank the global economy is projected to grow at 2.6% in 2026, higher than the 2.3% growth recorded in 2025. This forecast marks a significant upward revision from earlier projections, reflecting economic recovery, particularly for emerging markets. The World Bank’s growth projection of 2.6% is 0.7% points lower than the IMF’s 2026 forecast of 3.3%. Notably, advanced economies are expected to record a 1.6% growth in 2026, down from the 1.7% expansion recorded in 2025. Additionally, emerging markets and developing economies are projected to expand by 4.0% in 2026, down from the 4.2% expansion expected in 2025.
The expected upturn in global economic growth in 2026 as compared to 2025 is majorly attributable to;
-
Fading tariff pressures & policy adaptation: While 2025 was characterized by significant trade tensions and high tariffs especially in the US, this is expected to decline as businesses are expected to have adapted their supply chains learning from the events in 2025. Moreover, countries such as the US are replacing tariffs with tax incentives and legislative support such as the One Big Beautiful Bill Act.
-
Lower inflation and Monetary policy easing: The global headline inflation is projected to stand at 2.6% which is 0.6% lower than the 3.2% in 2025. This will in turn help in boosting real household income and overall consumer spending. Additionally, most major central banks are expected to have completed their pivot toward lower interest rates by 2026, making it cheaper for businesses to borrow and expand.
Global Commodities Market Performance:
Global commodity prices registered mixed performance in Q1’2026, with prices of energy declining by 0.5%, lower than the 3.0% decrease recorded in Q1’2025, mainly as a result of the declining energy production and exports among oil-importing economies coupled with increased geopolitical tensions in the Middle East that caused disruption on the supply. Additionally, prices of non-energy and metals and minerals declined by 1.2% and 1.7% compared to the 10.7% and 9.6% increase recorded in Q1’2025 respectively due to persistent trade tensions and policy uncertainty which affect overall demand. Prices of Fertilizers, Agriculture and Precious metals increased by 6.5%, 2.1% and 1.7% respectively, on the back of geopolitical tensions (especially in the Middle East), extreme weather impacting crop yields, rising input costs for fertilizers, and strong demand from clean-energy sectors. Tariffs and supply disruptions have further fueled these increases. Below is a summary performance of various commodities;
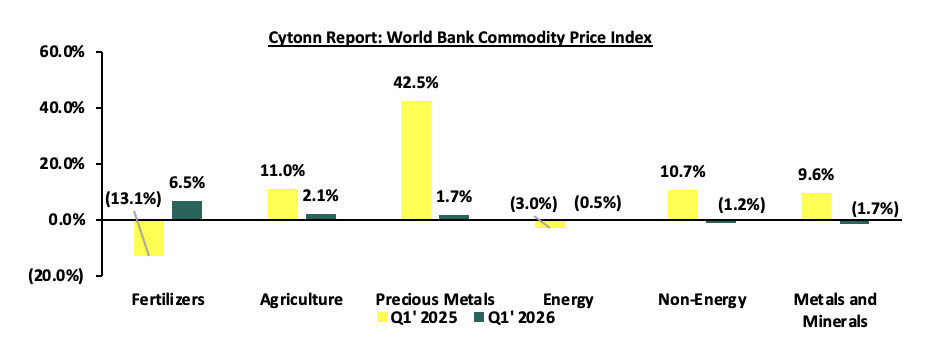
Source: World Bank
Q1’2026 data as of February 2026
Global Equities Market Performance:
The global stock market registered a mixed performance in Q1’2026, with most indices in the developing countries recording gains during the period, largely attributable to increased investor sentiments as a result of continued economic recovery following the full reopening of the economies coupled with investor preference for the stock markets in the developed countries. Notably, GGSECI was the best performer during the period, recording a gain at 48.0% in Q1’2026 largely driven by gains in the large-cap stocks such as Access Bank, EcoBank and MTN Ghana of 187.8%, 98.0% and 28.6% respectively, following improved earnings during the period, supported by easing inflation. SEMDEX was the largest decliner, recording losses of 9.1%, attributable to losses recorded by large cap stocks such as ER Group, MCB Group and CIEL of 9.3%, 7.8% and 7.6% respectively. Below is a summary of the performance of key indices as at the end of Q1’2026:
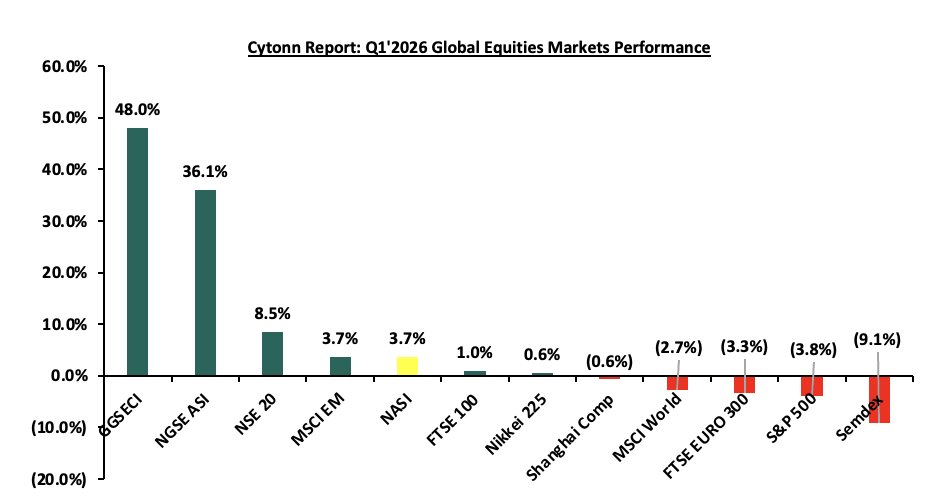
*Dollarized performance
According to the World Bank, the Sub-Saharan economy is projected to grow at a moderate rate of 4.3% in 2026, which is 0.3% points higher than the 4.0% growth expected in 2025. The expected recovery is primarily driven by private consumption growth as declining inflation boosts the purchasing power of household incomes. Nevertheless, the risk of debt distress remains high with more than half of countries facing unsustainable debt burdens. The public debt is expected to remain high due to increased debt servicing costs as a result of currency depreciation and high interest rates in developed economies.
Currency Performance:
In Q1’2026, most of the select Sub-Saharan currencies depreciated against the US Dollar, primarily due to elevated inflationary pressures in the region, high debt servicing costs that continued to deplete foreign exchange reserves, and monetary policy tightening by advanced economies. High interest rates in developed countries resulted in significant capital outflows as investors, both institutional and individual, sought higher returns offered in these economies. However, the Zambian Kwacha emerged as the best performer among the selected currencies, appreciating by 14.3% against the USD on a year-to-date basis, closing Q1'2026 at ZMW 19.0 from ZMW 22.2 at the beginning of the year. Below is a table showing the performance of select African currencies against the US Dollar:
|
Cytonn Report: Select Sub-Saharan Africa Currency Performance vs USD |
|||||
|
Currency |
Mar-25 |
Jan-26 |
Mar-26 |
Last 12 months |
YTD Change (%) |
|
Zambian kwacha |
28.2 |
22.1 |
19.0 |
32.7% |
14.3% |
|
Nigerian Naira |
1538.3 |
1430.3 |
1386.2 |
9.9% |
3.1% |
|
Malawian Kwacha |
1750.2 |
1731.9 |
1734.9 |
0.9% |
(0.2%) |
|
Kenyan Shilling |
129.3 |
129.1 |
129.9 |
(0.5%) |
(0.7%) |
|
Mauritius Rupee |
45.7 |
45.0 |
45.6 |
0.1% |
(1.4%) |
|
Botswana Pula |
13.7 |
13.1 |
13.4 |
2.0% |
(2.8%) |
|
Ugandan Shilling |
3662.6 |
3625.3 |
3762.6 |
(2.7%) |
(3.8%) |
|
Ghanaian Cedi |
15.5 |
10.5 |
11.0 |
29.1% |
(4.8%) |
|
Tanzanian Shilling |
2650 |
2450.2 |
2581.6 |
2.6% |
(5.4%) |
|
South African Rand |
18.3 |
15.9 |
17.1 |
6.6% |
(7.4%) |
Source: Yahoo Finance, Central Banks
The chart below shows the year-to-date performance of different sub-Saharan African countries in Q1’2026;
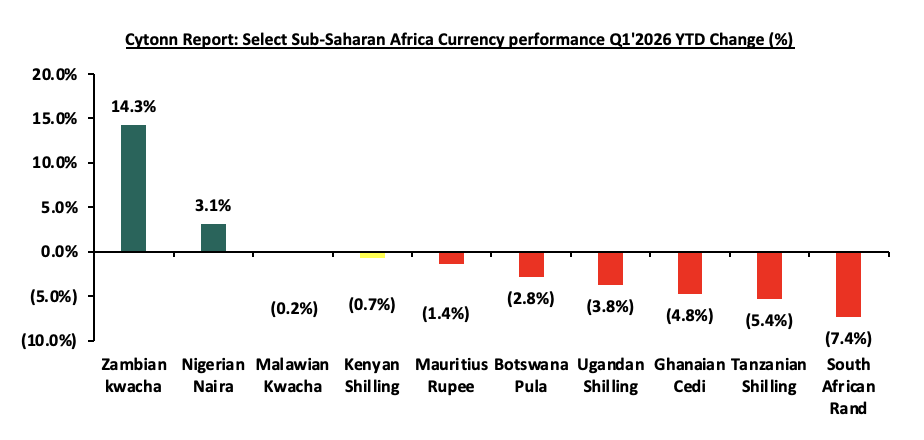
Source: Yahoo Finance
Key take outs from the above table and chart include:
-
The Zambian Kwacha was the largest gainer against the USD Dollar, gaining by 14.3% year to date to close at ZMW 19.0 from ZMW 22.1 beginning of the year. The Kwacha’s strength has been supported by several factors, including improved monetary policies, lower inflation, and economic recovery that attracted global investors. and,
-
The South African Rand was the worst performing currency in Q1’2026, depreciating by 7.4%, mainly as a result of the strength against the US dollar which is attributable to factors such as their government priorities of debt stabilization as outlined in their 2026 budget. While this is good for long-term credibility, it implies lower government spending, which can dampen short-term growth prospects.
African Eurobonds:
Africa’s appetite for foreign-denominated debt has increased in recent times with the latest issuers during the three months to end of Q1’2026 being Kenya, Ivory Coast and Benin raising a total of USD 2.3 bn, USD 1.3 bn and USD 1.0 bn respectively in February 2026 and January 2026 respectively. Additionally, 2025 issuers were Ivory Coast, Benin, Kenya and Angola raising a total of USD 1.8 bn, USD 0.5 bn, USD 3.0 bn and USD 1.8 bn respectively. Notably, all the bonds were oversubscribed with the high support being driven by the yield hungry investors and also the outlook of positive recovery in the regional economies. It is good to note that there was a general decline in the yields of the various bonds from most countries due to general improvement in investor sentiment as the economy recovers and the easing inflationary pressures in the region.
The Yields of the Kenya’s 10-year Eurobond maturing in 2028 decreased by 1.0% points to 7.0% as at the end of March 2026 from 8.0% in March 2026. Similarly, the yields for Nigeria’s 9-year and Ivory Coast’s 10-year Eurobonds maturing in 2033 decreased by 1.6% points and 2.5% points to 7.7% and 5.0% respectively at the end of March 2026, down from 9.3% and 7.7% respectively in March 2025. Below is a graph showing the Eurobond secondary market performance of select Eurobonds issued by the respective countries:
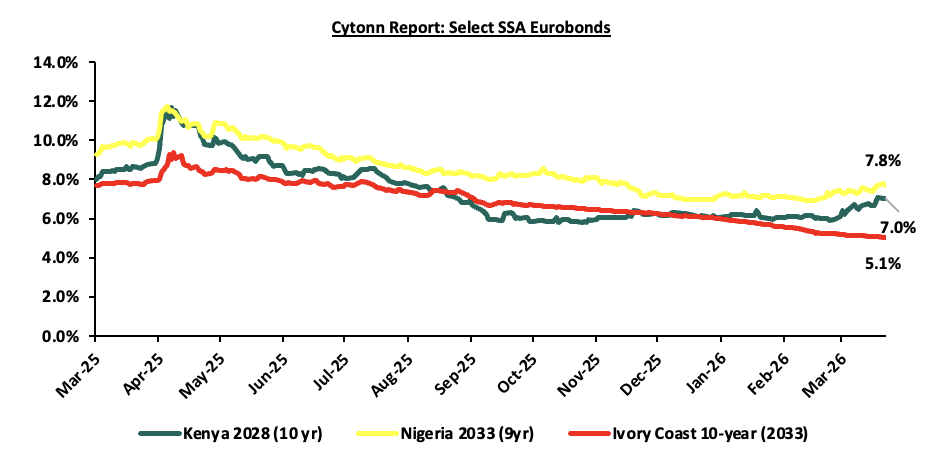
Source: Bloomberg, CBK
Equities Market Performance:
Sub-Saharan Africa (SSA) stock markets registered a mixed performance in Q1’2026, with Ghana’s stock market (GSECI) being the best performing market gaining by 48.0% YTD attributable to gains in the large-cap stocks such as Access Bank, EcoBank and MTN Ghana of 187.8%, 98.0% and 28.6% respectively. However, the performance was weighed down by the South Africa’s stock index negative performance of 5.0% attributable to YTD performance losses in large cap stocks such as Naspars, FirstRand and Capitec holdings of 21.7%, 5.0% and 4.4% respectively. Below is a summary of the performance of key indices:
|
Cytonn Report: Equities Market Performance Q1'2026 (Dollarized*) |
||||||
|
Country |
Index |
Mar-25 |
Jan-26 |
Mar-26 |
Last 12 months |
YTD Change |
|
Ghana |
GSECI |
402.5 |
804.6 |
1190.9 |
195.9% |
48.0% |
|
Nigeria |
NGEASI |
68.8 |
106.8 |
145.3 |
111.1% |
36.1% |
|
Tanzania |
DARSDEI |
0.9 |
1.1 |
1.5 |
73.1% |
31.3% |
|
Rwanda |
RSEASI |
0.1 |
0.1 |
0.1 |
22.1% |
27.4% |
|
Zambia |
LASILZ |
608.9 |
1169.9 |
1437.8 |
136.1% |
22.9% |
|
Uganda |
USEASI |
0.4 |
0.5 |
0.5 |
45.8% |
15.0% |
|
Kenya |
NASI |
1.0 |
1.4 |
1.5 |
48.2% |
3.7% |
|
South Africa |
JALSH |
4924.7 |
7021.0 |
6672.8 |
35.5% |
(5.0%) |
|
*The index values are dollarized for ease of comparison |
||||||
Source: Cytonn Research, Kwayisi, Yahoo Finance
The chart below shows the YTD Performance of the sub-Saharan Equities Market;
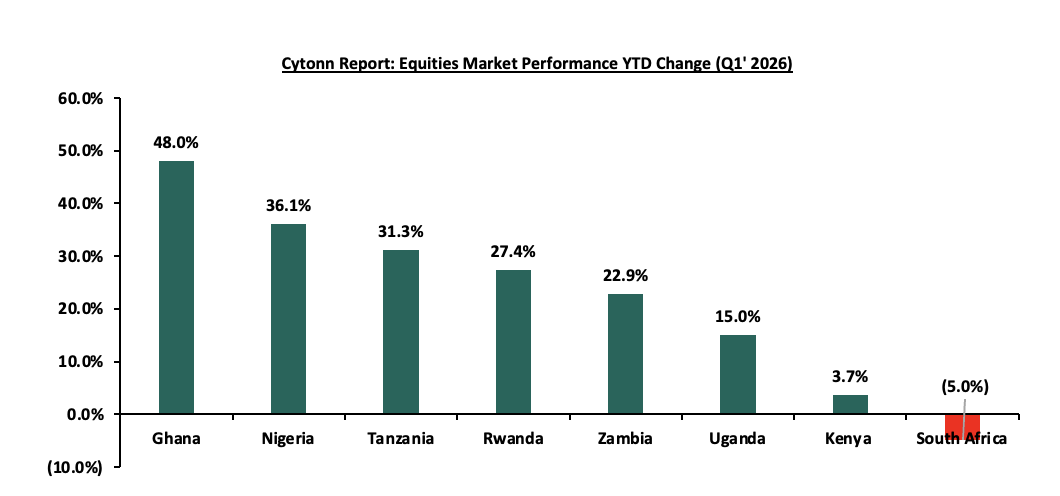
Dollarized performance
Global Markets and Sub-Saharan Africa Performance Summary and Outlook
|
Indicator |
Cytonn Report: Global and Sub-Saharan Africa Outlook Summary
|
Current View |
Outlook Q2’ 2026 |
|
Outlook for Q2’2026 |
|||
|
Global Markets |
· According to the World Bank, the global economy is projected to grow at 2.6% in 2026, higher than the 2.3% growth recorded in 2025. This forecast marks a significant upward revision from earlier projections, reflecting economic recovery. · Additionally, emerging markets and developing economies are projected to expand by 4.0% in 2026, down from the 4.2% expansion recorded in 2025.
|
Positive |
Neutral |
|
· We have NEUTRAL outlook on the global markets as the Middle east Conflict has triggered a shock that is undermining the 2026 projected economic growth as soaring energy prices and paralyzed shipping routes are acting as a global tax, effectively erasing consumer purchasing power and forcing central banks to abandon planned rate cuts. However, with improved development in the technology sector, especially AI sector, we see that the markets will maintain their projected growth. |
|||
|
Sub-Saharan Africa |
· According to the World Bank, the Sub-Saharan economy is projected to grow at a moderate rate of 4.3% in 2026, which is 0.3% points higher than the 4.0% growth expected in 2025. The expected recovery is primarily driven by private consumption growth as declining inflation boosts the purchasing power of household incomes. |
Positive |
Neutral |
|
· We maintain a NEUTRAL outlook mainly on the back of high debt distress risk where more than half of countries facing unsustainable debt burdens. The public debt is expected to remain high due to increased debt servicing costs as a result of currency depreciation and high interest rates in developed economies, which is further being supported by the continued weakening of local currencies which will make servicing costlier, making the region less attractive to foreign capital. |
|||
|
Take for investors |
· Going forward, investors must monitor the energy-inflation feedback loop and Middle Eastern conflict, as high oil prices threaten to stall global interest rate cuts. Success hinges on tracking the AI-driven infrastructure boom and the stability of emerging market debt amidst shifting capital flows. In this volatile climate, the priority is balancing commodity-based hedges against sudden geopolitical shocks. |
||
GDP growth in the Sub-Saharan Africa region is expected to improve, in contrast with the rest of the global economy. Additionally, public debt continues to be a major headwind, with high debt levels experienced in the region on the back of continued weakening of local currencies, which will make debt servicing costlier, making the region less attractive to foreign capital
According to the Kenya National Bureau of Statistics (KNBS) Q3’2025 Gross Domestic Product Report, the Kenyan economy recorded a 4.9% growth in Q3’2025, higher than the 4.2% growth recorded in Q3’2024. The improved performance was largely driven by accelerated growth in key sectors, with Mining and Quarrying rebounding to 16.6% in Q3’2025 from a 12.2% contraction in Q3’2024, Construction expanding by 6.7% in Q3’2025 from a 2.6% contraction in Q3’2024, and Electricity and Water Supply growing by 3.6% in Q3’2025 from 0.9% in Q3’2024. Consequently, the economy recorded an average growth of 4.9% in the first three quarters of 2025, an improvement from the 4.5% average growth recorded in a similar period in 2024. The average GDP growth rate for 2025 is expected to come in at an average of 5.0%, an improvement from the 4.7% expansion witnessed in 2024. In 2026, we expect the economy to continue its recovery trajectory with the projected GDP growth to come in at a range of 5.2% - 5.5% by various organizations as outlined below:
|
Cytonn Report: Kenya 2025 Growth Projections |
||||
|
No. |
Organization |
2025 GDP Projections |
2026 GDP Projections |
|
|
1 |
International Monetary Fund |
4.8% |
4.9% |
|
|
2 |
National Treasury |
5.0% |
5.3% |
|
|
3 |
World Bank |
4.5% |
4.9% |
|
|
4 |
Fitch Solutions |
5.1% |
5.2% |
|
|
5 |
Cytonn Investments Management PLC |
5.4% |
5.2% |
|
|
Average |
5.0% |
5.1% |
||
Source: Cytonn Research
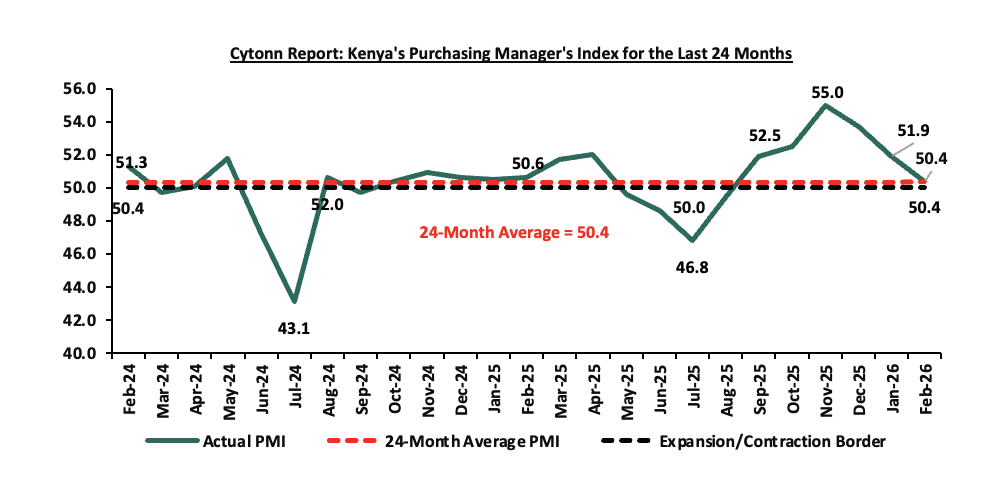
Key to note, Kenya’s general business environment slightly improved in Q1’2026, with the average Purchasing Manager’s Index coming at 51.2, compared to 50.6 recorded in a similar period in 2025. The improvement was mainly on the back of an ease in the monetary policy stance, reducing the cost of borrowing and increasing spending therefore supporting business activity. The chart below summarizes the evolution of PMI over the last 24 months to February 2026. (A reading above 50.0 signals an improvement in business conditions, while readings below 50.0 indicate a deterioration):
Inflation:
The average inflation rate increased to 4.4% in Q1’2026, compared to 3.5% in Q1’2025, mainly driven by rising food prices. However, the increase was moderated by a stronger Kenyan Shilling and stabilized fuel prices. Notably, the maximum allowed price for Super Petrol, Diesel and Kerosene remain unchanged at Kshs 178.3, Kshs 166.5 and Kshs 152.8 per litre respectively from the prices announced for the month of February 2026. Inflation for the month of March 2026 tightened to 4.4%, from 4.3% recorded in February 2026, mainly driven by a 7.7% increase in the Food & Non-Alcoholic Beverages category. Below is a chart showing the inflation trend for the last five years:
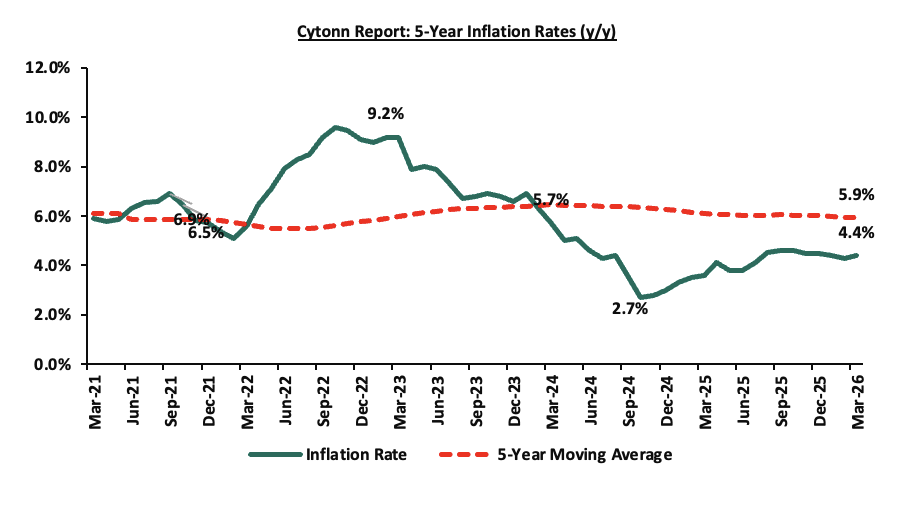
Over the last 33 months, Kenya’s inflation has persistently remained within the Central Bank of Kenya (CBK) target range of 2.5%–7.5%, supported by a stronger Shilling and relatively stable fuel prices. However, risks still persist, particularly due to elevated fuel prices and an increasingly accommodative monetary policy, with the MPC in February 2026 cutting the Central Bank Rate (CBR) by 25 bps to 8.75% from 9.0%. In their meeting this month, we expect the CBK to maintain the CBR at 8.75%, signaling a pause in the easing cycle, while continuing to support economic activity. Additionally, escalating geopolitical tensions, particularly the ongoing conflict involving Iran, pose upside risks to inflation, mainly through potential increases in global oil prices, which could translate to higher fuel and transport costs domestically, and subsequently exert upward pressure on overall inflation.
Going forward, we expect the inflationary pressures to remain within the CBK’s preferred target, mainly on the back of stable Shilling, and stable fuel prices. However, the loosening monetary policy, the still elevated, though stabilized fuel prices, and the increasing electricity prices remain a risk for the inflation rate.
March 2026 Inflation
The year-on-year inflation in March 2026 increased by 0.1% points to 4.4% from the 4.3% recorded in February 2026 which is in line with our projection of an increase to a range of 4.4%-4.6%. The price increase was primarily driven by a by a rise in prices of items in the Food and Non-alcoholic Beverages at 7.7%; Transport 3.8%; and Housing, Water, Electricity, Gas and other fuels at 2.0%; over the one-year period. The month-on-month inflation rate stood at 0.5% in March 2026. The table below summarizes the performance of commodity indices both on a year-on-year and month-on-month basis;
|
Cytonn Report: Major Inflation Changes – March 2026 |
|||
|
Broad Commodity Group |
Price change m/m (March-2026/ February-2026) |
Price change y/y March-2026/March-2025) |
Reason |
|
Food and Non- Alcoholic Beverages |
1.1% |
7.7% |
The m/m increase was mainly driven by the rise in prices of tomatoes and beef with bones by 13.3% and 1.8%. However, the increase was weighed down by a decline in prices of cabbages, maize grain of 3.8%, 2.4% and 1.3% respectively. |
|
Transport |
0.0% |
3.8% |
The m/m remained constant and as price of diesel and petrol remained the same in the review period |
|
Housing, Water, Electricity, Gas and Other fuels |
0.4% |
2.0% |
The m/m increase was mainly due to increase in electricity prices, with 50 kWh and 200 kWh increasing by 2.5% and 2.2% respectively. The increase was however weighed down due to decrease in the price of gas/LPG by 0.1% |
|
Overall Inflation |
0.5% |
4.4% |
The m/m increase was mainly attributable to the 1.1% increase in Food and non- alcoholic beverages. |
In March 2026, overall inflation increased by 0.1% points to 4.4% from the 4.3% recorded in February 2026 on a y/y basis, signaling a slight uptick in price pressures across major categories. Additionally, the inflation rate remained within the Central Bank of Kenya’s preferred range of 2.5%–7.5% for the thirty third consecutive month, reflecting sustained macroeconomic stability. Prices for Super Petrol, Diesel and Kerosene remain unchanged at Kshs 178.3, Kshs 166.5 and Kshs 152.8 per litre respectively effective from 15th March 2026 to 14th April 2026. Electricity costs increased during the month, with 50 kWh and 200 kWh increasing by 2.5% and 2.2%, respectively. Additionally, the recent reduction in the Central Bank Rate to 8.75% from 9.0% in February is expected to continue to stimulate credit uptake and increase money supply, which could gradually exert upward pressure on inflation in the coming months as monetary easing transmits through the broader economy.
Going forward, we expect inflation to remain within the CBK’s preferred range of 2.5%–7.5%, mainly on the back of a stable currency and stable fuel prices. Additionally, favorable weather conditions will also contribute to stabilizing food prices, further supporting stable inflation rates. The risk, however, lies in the fuel prices which, despite their stability, still remain elevated compared to historical levels. Additionally, the Monetary Policy Committee of the Central Bank of Kenya (CBK) cut the Central Bank Rate by 25.0 bps to 8.75% from 9.0% in its February 2026 meeting, with the aim of easing monetary policy while maintaining exchange rate stability. This continued accommodative monetary policy stance is likely to gradually elevate inflationary pressures as consumer spending rises due to increased money supply. The Committee is expected to adopt a more cautious approach to rate adjustments in the coming meetings in a bid to continue supporting the private sector, while also monitoring the impact on inflation and the exchange rate. Additionally, escalating geopolitical tensions, particularly the conflict involving Iran, pose upside risks to inflation in the short to medium term, mainly through potential increases in global oil prices, which could translate into higher domestic fuel and transport costs, and in turn exert broader upward pressure on inflation.
The Kenyan Shilling:
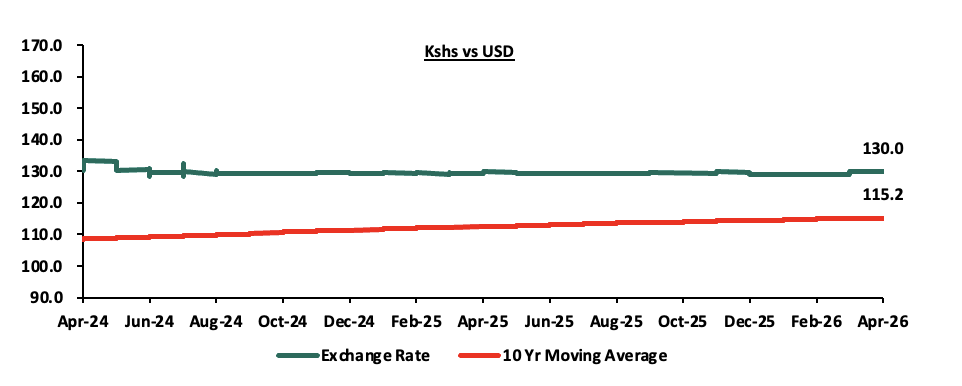
The Kenyan Shilling remained relatively stable during the quarter, however, depreciating against the US Dollar by 71.3 bps in Q1’2026, to close at Kshs 129.9, from Kshs 129.0 at the end of FY’2025, mainly attributable to increased global uncertainties following escalating geopolitical tensions, particularly the conflict involving Iran, which strengthened the US Dollar and exerted depreciation pressure on emerging market currencies, including the Kenyan Shilling particularly in March 2026. Additionally, the accommodative monetary policy stance by the Central Bank of Kenya (CBK), including the reduction in the Central Bank Rate (CBR) to 8.75%, alongside increased liquidity in the market, further contributed to the depreciation pressure. During the week, the Kenya Shilling depreciated against the US Dollar by 18.5 bps to Kshs 130.0, from Kshs 129.8 recorded the previous week.
We expect the shilling to be supported by:
-
Diaspora remittances standing at a cumulative USD 5,051.2 mn in the twelve months to February 2026, 1.9% higher than the USD 4,956.5 mn recorded over the same period in 2025. These have continued to cushion the shilling against further depreciation. In the February 2026 diaspora remittances figures, North America remained the largest source of remittances to Kenya accounting for 54.2% in the period,
-
Tourism inflows, which strengthened significantly. Tourism receipts reached Kshs 560.0 bn in 2025, up from Kshs 452.2 bn in 2024, representing a 23.9% increase, supported by improved international arrivals through the country’s major airports, and,
-
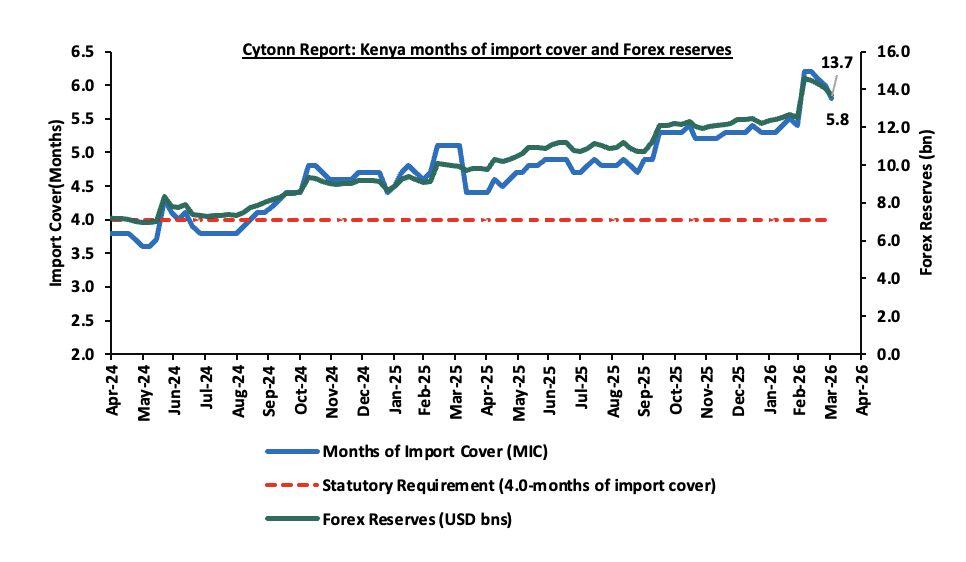
Improved forex reserves currently at USD 13.7 bn (equivalent to 5.8-months of import cover), which is above the statutory requirement of maintaining at least 4.0-months of import cover and above the EAC region’s convergence criteria of 4.5-months of import cover.
The shilling is however expected to remain under pressure in 2026 as a result of:
-
An ever-present current account deficit which came at 2.2% of GDP in the twelve months to October 2025, and,
-
The need for government debt servicing, continues to put pressure on forex reserves given that 53.0% of Kenya’s external debt is US Dollar-denominated as of December 2025
Key to note, during the quarter, Kenya’s forex reserves increased by 13.2% to close at USD 14.0 bn from the USD 12.4 recorded at the start of the quarter. The chart below summarizes the evolution of Kenya's months of import cover over the years:
Monetary Policy:
The Monetary Policy Committee (MPC) met once in Q1’2026, where the Central Bank Rate was cut by 25 bps to 8.75% from the 9.0% , noting that its previous interventions had successfully stabilized exchange rate pressures, and anchored inflation with inflation coming at 4.4%, 4.3% and 4.4% in January, February and March 2026 respectively, remaining within and below the mid-point of the CBK target range of 2.5%-7.5%. Below are some of the key highlights from the February 2026 meeting:
-
The overall inflation decreased by 0.1% points to 4.4% in January 2026, from 4.5% in December 2025, remaining below the mid-point of the preferred CBK range of 2.5%-7.5%. Core inflation increased to 2.2% in January 2026, from 2.0% in December driven by higher prices of some processed food items, particularly maize flour. Additionally, non-core inflation declined to 10.3% in January 2026, from 11.2% in December 2025, driven by lower prices of some vegetables, particularly tomatoes and onions. Overall inflation is expected to remain below the midpoint of the target range in the near term, supported by stable prices of processed food items and energy, and continued exchange rate stability.
-
The performance of the Kenyan economy remained resilient in the third quarter of 2025, with real GDP growth averaging 4.9%, supported by a rebound of the industrial sector, and resilience of the service sectors. Leading indicators of economic activity point to improved performance in the fourth quarter of 2025. The growth of the economy is projected to pick up to 5.0% compared to the previous projection of 5.2% mainly reflecting a slowdown in agriculture sector performance in the third quarter.The economy is expected to remain resilient, with real GDP growth projected to pick up to 5.5% in 2026 and 5.6% percent in 2027, supported by the resilience of the services sector, continued recovery of industrial sector, and stable growth of agriculture. This outlook is subject to risks, including adverse weather conditions, elevated trade policy uncertainties, and geopolitical tensions.
-
The current account deficit is estimated at 2.4% of GDP in 2025 compared to 1.3% of GDP in 2024,due to lower service receipts and secondary income transfers as a share of GDP. Goods exports increased by 6.1%, driven by horticulture, coffee, tea, manufactured goods, and apparel. Goods imports rose by 9.1%, reflecting increases in intermediate and capital goods imports. Services receipts increased by 1.1%, mainly supported by higher receipts from travel services, while diaspora remittances increased by 1.9%. The current account deficit is projected to remain stable at 2.2% of GDP in 2026 and 2027, and is expected to be more than fully financed by financial account inflows. Currently, the CBK foreign exchange reserves stand at USD 12.5 mn (5.4 months of import cover), and continue to provide adequate cover and a buffer against short-term domestic and external shocks.
-
The banking sector remains stable and resilient, with strong liquidity and capital adequacy ratios. The ratio of gross non-performing loans (NPLs) to gross loans stood at 15.5% in January 2026, down from 16.7% in October 2025 and 17.6% in August 2025. Decreases in NPLs were noted in the real estate, manufacturing, trade, building and construction, and personal and household sectors. Banks have continued to make adequate provisions for the NPLs.
-
The CEOs Survey and Market Perceptions Survey conducted in January 2026 revealed sustained optimism about business activity and economic growth prospects for the next 12 months. The optimism was attributed to the stable macroeconomic environment with low inflation and stable exchange rate, lower interest rates, expected favorable weather conditions, increased infrastructure spending and digital innovations, and improved private sector credit growth. Some respondents expressed concerns about low consumer demand, high cost of doing business, and increased global uncertainties attributed to heightened geopolitical tensions and higher tariffs.
-
Respondents to the January 2026 Agriculture Sector Survey expect stable pump prices, exchange rate stability, and favorable weather conditions with the expected onset of the long rains, to support a stable inflation rate in the near term. However, a majority of respondents expect seasonal factors associated with the dry weather conditions before the onset of the long rains to exert moderate upward pressure on prices of some food items, particularly vegetables, and overall inflation.
-
Global growth has remained resilient and is estimated at 3.3% in 2025, reflecting lower-than-expected tariff rates on imports into the United States, improved financial conditions, strong consumer spending, and a surge in investment in Artificial Intelligence-led technology, particularly in the United States. The outlook for global growth for 2026 has been revised upwards, and is expected to remain steady at 3.3%, mainly due to improved growth prospects in the United States, Euro area, and China. Nevertheless, weak global demand, elevated trade policy uncertainty, and heightened geopolitical tensions particularly in the Middle East, and the Russia-Ukraine conflict, remain key risks to growth.
-
Global inflation declined in 2025, and is projected to decline further in 2026 and 2027, mainly driven by lower energy prices and reduced global demand. Inflation in the major economies has eased modestly in recent months, but is still above target in some countries, reflecting the stickiness in core inflation. Central banks in the major economies have continued to ease monetary policy, but at a cautious and uneven pace depending on their inflation and growth outlooks. International oil prices have moderated owing to increased production and subdued global demand, but have been volatile due to elevated global uncertainties. Food inflation has declined, partly driven by lower inflation rates for cereals and sugar prices.
-
The MPC noted that the revised banking sector Risk-Based Credit Pricing Model (RBCPM), which will be fully operational by March 2026, will improve the transmission of monetary policy decisions to commercial banks’ lending interest rates, and enhance transparency in the pricing of loans by banks.
-
Growth in commercial banks’ lending to the private sector continued to improve and stood at 6.4% in January 2026 compared to 5.9% in December 2025 and (2.9%) in January 2025. Growth in credit to key sectors of the economy, particularly building and construction, trade, and consumer durables, remained strong in January 2026, reflecting improved demand for credit in line with the declining lending interest rates. Average commercial banks’ lending rates stood at 14.8% in January 2026, down from 15.0% in October 2025 and 17.2% in November 2024.
-
The Committee noted the ongoing implementation of the FY2025/26 Government Budget, and the planned fiscal consolidation strategy to reduce debt vulnerabilities over the medium term.
-
To further strengthen the effectiveness of the monetary policy implementation framework and enhance monetary policy transmission, the MPC approved a narrowing of the interest rate corridor around the Central Bank Rate (CBR) from the current ±75 bps to ±50 bps. This will further support the alignment of the Kenya Shilling Overnight Interbank Average (KESONIA) to the CBR. In line with this review, the Committee also approved the adjustment of the applicable interest rate on the Discount Window from the current 75 bps above CBR to 50 bps, which is the upper bound of the interest rate corridor.
The MPC noted that overall inflation was expected to remain below the midpoint of the 2.5%-5.0% target range in the near term, supported by stable prices of processed food items and energy, and stability in the exchange rate. Additionally, central banks in major economies had continued to lower interest rates at a cautious pace. The Committee also noted that the recent economic developments, created room for further easing of monetary policy to support economic activity while maintaining exchange rate stability. The MPC noted that it would continue to monitor the effects of these policy measures, as well as global and domestic economic developments, and will remain ready to take additional action if necessary.
Going forward, we expect the MPC to adopt a more cautious approach to rate adjustments in the coming meetings in a bid to continue supporting the private sector, while closely monitoring the impact on inflation and the exchange rate, as a result of the ongoing Middle East war. The next MPC meeting is scheduled for 8th April 2026, where we expect the Central Bank Rate (CBR) to be maintained at 8.75%.
Fiscal Policy:
On 4th March 2026, the National Treasury presented the Supplementary Budget for the Fiscal Year 2025/26 to the National Assembly revealing plans to increase the gross total supplementary budget by 7.4% to Kshs 4,6181.6 bn, from Kshs 4,301.9 bn in the June budget. Notably, this was the first supplementary budget for FY 2025/26. The table below summarizes the overall change in the FY’2025/26 budget estimates:
|
Cytonn Report: FY’2025/26 Supplementary Budget Estimates (Kshs bn) |
|||
|
Item |
Original Approved Estimates FY’2025/26 |
Supplementary Estimates FY’2025/26 |
% Change |
|
Recurrent Expenditure |
1,804.7 |
2,005.8 |
11.1% |
|
Development Expenditure |
744.8 |
831.1 |
11.6% |
|
Ministerial National Government Expenditure |
2,549.5 |
2,837.0 |
11.3% |
|
Consolidated Fund Services |
1,337.3 |
1,366.6 |
2.2% |
|
County Equitable Allocation |
415.0 |
415.0 |
0.0% |
|
Total Expenditure |
4,301.9 |
4,618.6 |
7.4% |
Source: The National Treasury
Key take outs from the table include;
-
The recurrent expenditure (Costs incurred to cover regular government expenses such as salaries, operational costs and maintenance costs) increased by 11.1% to Kshs 2,005.8 bn in the supplementary estimates from Kshs 1,804.7 bn in the original estimates, an indication of the government's continued efforts to boost public services, respond to economic growth and ensuring the well-being of its citizens through increased allocation which would see an increase in salaries and wages,
-
Development expenditure (Costs incurred in order to create assets that will provide long term public infrastructure such as roads, hospitals, and schools) declined by 11.6% to Kshs 831.1 bn in the supplementary estimates from Kshs 744.8 bn in the original estimates, a detriment to the sectors such as infrastructure, energy, water and health that require heavy development financing,
-
As such, the Ministerial National Government expenditure estimates for the FY’2025/26 Supplementary budget is set to increase by 11.3% to Kshs 2,837.0 bn from Kshs 2,549.5 bn in the original estimates, costing the government an extra Kshs 287.4 bn. This rise is mainly attributed to measures aimed at boosting various sectors and public services. These measures include increased allocations for critical sectors such as education, Agriculture and other priority areas, reflecting the government's commitment to enhancing public welfare and supporting economic growth,
-
Consolidated Fund Services (CFS) (refers to the Consolidated Fund established in the Kenya’s constitution into which development partners deposit funds before disbursing to the Exchequer accounts for projects such as servicing of public debt, and subscription to International Organizations) has increased by 2.2% to Kshs 1,366.6 bn from Kshs 1,337.3 bn in the original estimates.
-
The County Equitable Share (allocation on national government revenue to county governments) remained unchanged at Kshs 415.0 despite calls from the county governments to increase allocation to Kshs 450.0 bn or at least 15.0% of the total revenue collected by the national government.
Notably, for FY’2025/2026, from the figures released by the National Treasury for revenue and net expenditures collected as at the end of February 2026, total revenue collected amounted to Kshs 1,606.7 bn, equivalent to 58.4% of the revised estimates of Kshs 2.75 tn, and 87.5% of the prorated estimates of Kshs 1,836.5 bn. The total expenditure amounted to Kshs 2,747.5 bn, equivalent to 62.0% of the revised estimates, and 82.6% of the prorated target expenditure estimates
The table below summarizes the various macroeconomic factors and their possible impact on the business environment in Q2’2026. With two indicators assessed as negative, two as neutral, and three as positive, the general outlook for the macroeconomic environment in Q2’2026 is NEUTRAL.
|
Cytonn Report: Macro-Economic & Business Environment Outlook |
||||||
|
Macro-Economic Indicators |
Q2’2026 Outlook |
Q2’2026 Outlook |
Q1’2026 Outlook |
Implications |
||
|
Government Borrowing |
|
Negative |
Negative |
Borrowing pressures persist due to fiscal needs compounded by rising energy and commodity costs from the Middle East war. Domestic borrowing may rise above planned levels, increasing yields and crowding out private sector credit. External debt faces higher risk premiums and potential delays as global investors reassess exposure amid geopolitical uncertainty. Investors should monitor government bond yields for spikes due to fiscal pressures. Middle East war-driven higher energy import bills may force extra domestic borrowing, reducing liquidity and increasing interest rates. Consider short-term government bonds or risk-adjusted exposure. |
||
|
Exchange Rate |
|
|
Neutral |
Neutral |
Moderate depreciation expected (Kshs 129.0– Kshs. 132/USD) due to higher demand for foreign currency to pay for imported energy and commodities affected by the Middle East war. Volatility may spike during geopolitical or oil price shocks. Investors should hedge FX exposure for companies importing energy and commodities. Volatility in the shilling could affect costs, margins, and debt servicing. Exporters may benefit from a weaker shilling. Track global oil price movements closely. |
|
|
Interest Rates |
|
|
Neutral |
Positive |
Rates remain broadly accommodative, but imported inflation from the Middle East war may force minor adjustments in short-term yields. CBK likely to balance growth support with inflation control. Investors should watch for slight upward pressure on short-term yields, affecting money market instruments. Fixed-income portfolios may require adjustment if imported inflation triggers reactive tightening. Lending activity may continue to expand in sectors insulated from energy shocks. |
|
|
Inflation |
|
Neutral |
Neutral |
Inflation remains around 4.0% -5.0% but faces upward pressure from global energy price shocks, increased transport and production costs due to the Middle East war, and elevated commodity prices. Persistent domestic demand amplifies these pressures. Investors should anticipate cost-push inflation affecting manufacturing, logistics, and energy-intensive sectors. Inflation-linked instruments may hedge risk, while equity investments should account for margin compression in energy-reliant companies. |
||
|
GDP |
|
|
Positive
|
Neutral |
GDP projected at 5.2–5.5%, but growth is tempered by higher energy costs, supply chain disruptions, and volatility in global trade caused by the Middle East war. ICT and tourism provide domestic support, partially offsetting external pressures. Investors should target resilient domestic sectors, such as ICT and tourism, while monitoring energy-intensive industries for margin pressures. Opportunities may arise in export sectors benefiting from shilling depreciation, but global risk exposure must be considered |
|
|
Investor Sentiment |
|
|
Neutral |
Positive |
Sentiment cautiously positive, as the Middle East war introduces commodity and geopolitical risks, affecting capital flows and market valuations. Domestic low rates support investment, but volatility may spike in response to global events. Investors should adopt a defensive approach, favoring sectors less exposed to FX and energy price shocks. Geopolitical risk monitoring is essential to seize timing opportunities in undervalued equities. |
|
|
Security |
|
|
Negative |
Negative |
Heightened pre-election tensions, compounded by global geopolitical risk from the Middle East war, may influence trade, energy security, and policy decisions. Short-term market disruptions likely during sudden global shocks. Investors should monitor domestic political developments alongside global energy and geopolitical events, as these could disrupt markets and business confidence. Energy, infrastructure, and import-heavy sectors are particularly exposed. Hedging and diversification are recommended |
|
Money Markets, T-Bills Primary Auction:
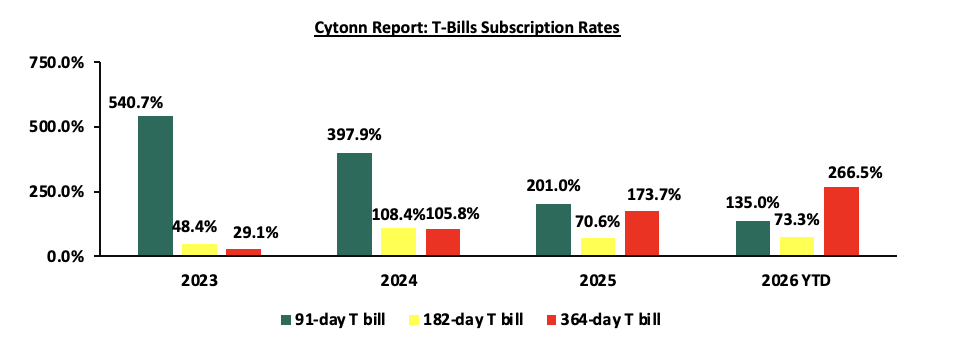
During Q1’2026, T-bills were oversubscribed, with the overall subscription rate coming in at 196.1%, up from 136.1% in Q1’2025. Investors’ preference for the 91-day paper persisted with the paper receiving bids worth Kshs 88.9 bn against the offered Kshs 52.0 bn, translating to an oversubscription rate of 170.9%, albeit lower than the oversubscription rate of 221.1% recorded in Q1’2025. Overall subscription rates for the 364-day papers came in at 334.3% which was higher than the 140.4% recorded in Q1’ 2025 while that for 182-day papers came in at 67.9% which was lower than the 97.8% recorded in Q1’2025. The average yields on the 364-day, 182-day and 91-day papers decreased by 1.9%, 1.7% and 1.6% points to 8.9%, 7.8% and 7.6% in Q1’2026, respectively, from 10.8%, 9.5% and 9.2%, respectively, in Q1’2025. The downward trajectory in yields is primarily driven by improved investor confidence, stemming from reduced credit risk in the country and relatively eased inflationary pressures. This has lowered the risk premium demanded by investors. During the period, the acceptance rate stood at 72.8%, down from 86.4% in Q1’2025, with the government accepting Kshs 445.3 billion out of the Kshs 611.8 billion worth of bids received.
This week, T-bills were undersubscribed for the second consecutive week, with the overall subscription rate coming in at 70.8%, however, higher than the subscription rate of 45.5% recorded the previous week. Investors’ preference for the shorter 91-day paper waned, with the paper receiving bids worth Kshs 1.2 bn against the offered Kshs 4.0 bn, translating to a subscription rate of 30.1%, lower than the subscription rate of 64.9%, recorded the previous week. The subscription rate for the 182-day paper increased significantly to 90.9% from 28.3% recorded the previous week, while that of the 364-day paper increased to 67.1% from 54.9% recorded the previous week. The government accepted a total of Kshs 16.95 bn worth of bids out of Kshs 17.00 bn bids received, translating to an acceptance rate of 99.7%. The yields on the government papers showed a mixed performance with the yields on the 182-day papers increasing by 0.1 bps to remain relatively unchanged from the 7.8% recorded the previous week. The yields on the 91-day paper decreased by 2.6 bps to 7.40% from 7.43% recorded the previous week, while the yields on the 364-day paper decreased by 0.3 bps to remain relatively unchanged from the 8.3% recorded the previous week.
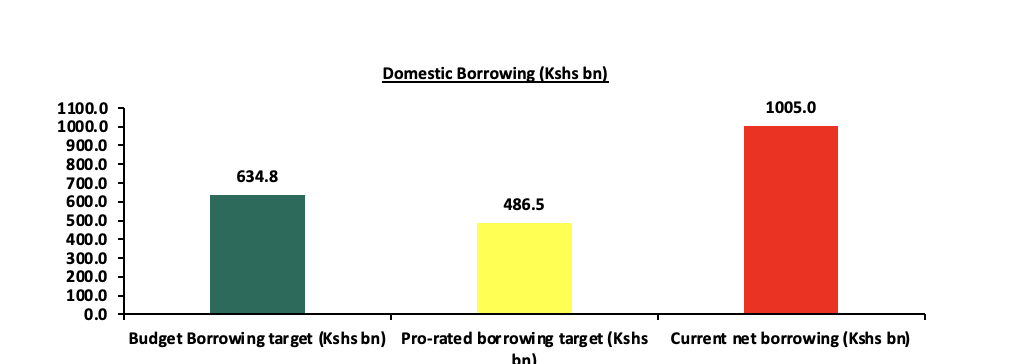
So far in the FY’2025/26, having advertised government securities totalling Kshs 1,590.0 bn. The government accepted bids worth Kshs 2,058.4 bn, of which Kshs 1,140.9 bn treasury bills and Kshs 917.6 bn were bonds. Total redemptions in FY’2025/26 amounted to Kshs 1,005.3 bn, with treasury bills accounting for Kshs 1,005.3 bn. As a result, currently, the government has a domestic borrowing surplus of Kshs 370.3 bn, which is 58.3% of the total net domestic borrowing target of Kshs 634.8 bn. The chart below shows the government’s current domestic borrowing:
The chart below compares the overall average T-bills subscription rates obtained in 2023, 2024, 2025 and 2026 Year to Date (YTD):
Primary T-Bond Auctions in Q1’2026
During the quarter, the government re-opened six bonds, seeking to raise Kshs 170.0 bn during the quarter. The bonds were generally oversubscribed, receiving bids worth Kshs 402.7 bn against the offered Kshs 170.0 bn, translating to a subscription rate of 236.9%. The government accepted Kshs 222.1 bn of the Kshs 402.7 bn worth of bids received, translating to an acceptance rate of 55.2%. Also, during the quarter, the government conducted two bond switch auctions, both involving switches from FXD1/2016/010 to FXD1/2022/015 in January and from FXD1/2021/005 to FXD3/2019/015 in March. FXDI/2022/015 was oversubscribed, receiving bids worth 26.5 bn against the offered 20.0 bn, translating to subscription rate of 132.5% having an average acceptance yield of 13.2% while FXD3/2019/015 was oversubscribed, receiving bids worth 22.2 bn against the offered 15.0 bn, translating to subscription rate of 148.0% having an average acceptance yield of 11.6%.
|
Cytonn Report: Bond Issuances in Q1’ 2026 |
|||||||||||
|
Issue Date |
Bond Auctioned |
Effective Tenor to Maturity (Years) |
Coupon |
Amount offered (Kshs bn) |
Actual Amount Raised/Accepted (Kshs bn) |
Total bids received (Subscription) |
Average Accepted Yield |
Subscription Rate |
Acceptance Rate |
||
|
3/16/2026 |
FXD1/2019/020-Reopened |
13.1 |
12.9% |
60.0 |
44.9 |
50.4 |
12.7% |
195.7% |
88.8% |
||
|
FXD1/2021/025-Reopened |
20.1 |
13.9% |
16.1 |
66.9 |
12.9% |
24.1% |
|||||
|
2/19/2026 |
FXD3/2019/015-Reopened |
8.4 |
12.3% |
50.0 |
54.8 |
133.8 |
12.2% |
427.5% |
41.0% |
||
|
FXDI/2018/025-Reopened |
17.3 |
13.4% |
45.7 |
79.9 |
13.4% |
57.2% |
|||||
|
1/12/2026 |
FXD1/2019/020-Reopened |
13.2 |
12.9% |
60.0 |
20.2 |
23.4 |
13.3% |
119.2% |
86.6% |
||
|
FXD1/2022/025-Reopened |
21.8 |
14.2% |
40.3 |
48.2 |
13.8% |
83.7% |
|||||
|
Q1’2026 Total |
170.0 |
222.1 |
402.7 |
||||||||
|
Q1’2025 Total |
125.0 |
214.5 |
299.9 |
||||||||
|
Q1’2026 Average |
15.7 |
13.3% |
13.0% |
236.9% |
55.2% |
||||||
|
Q1’2025 Average |
15.3 |
13.7% |
18.3% |
220.2% |
76.0% |
||||||
Source: Central Bank of Kenya (CBK) and National Treasury
The Central Bank of Kenya released the auction results for the re-opened treasury bonds FXD1/2020/015 and FXD1/2018/025 with tenors to maturities of 8.9 years and 17.3 years respectively and fixed coupon rates of 12.8% and 13.4% respectively. The bonds were oversubscribed, with the overall subscription rate coming in at 187.2%, receiving bids worth Kshs 74.9 bn against the offered Kshs 40.0 bn. The government accepted bids worth Kshs 50.2 bn, translating to an acceptance rate of 67.0%. The weighted average yield for the accepted bids for the FXD1/2020/015 and FXD1/2018/025 came in at 12.2% and 13.0% respectively. Notably, the 12.2% yield on FXD1/2020/015 was lower than the 13.7% recorded at its last reopening in April 2025. Similarly, the 13.0% yield on FXD1/2018/025 was lower than the 13.4% recorded at its last reopening in February 2026. With the Inflation rate at 4.4% as of March 2026, the real returns of the FXD1/2020/015 and FXD1/2018/025 are 7.8% and 8.6%. Given the 10.0% withholding tax on the bonds, the tax equivalent yields for shorter term bonds with 15.0% withholding tax are 12.9% and 13.8% for the FXD1/2020/015 and FXD1/2018/025 respectively.
Secondary Bond Market Activity:
-
Bond Turnover:
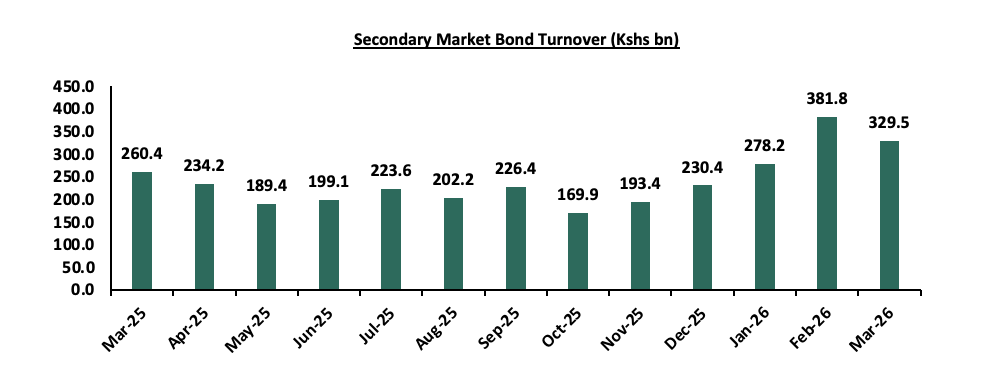
The secondary bond market recorded increased activity, with the total bond turnover increasing by 48.2% to Kshs 989.5 bn from Kshs 667.8 bn in Q1’2025, pointing towards increased activities by commercial banks in the secondary bond market. Similarly, on a year-on-year basis, the bond turnover increased by 26.5% to Kshs 329.5 in March 2026, from Kshs 260.4 bn worth of treasury bonds transacted over a similar period last year. The chart below shows the bond turnover over the past 12 months;
-
Yield Curve:
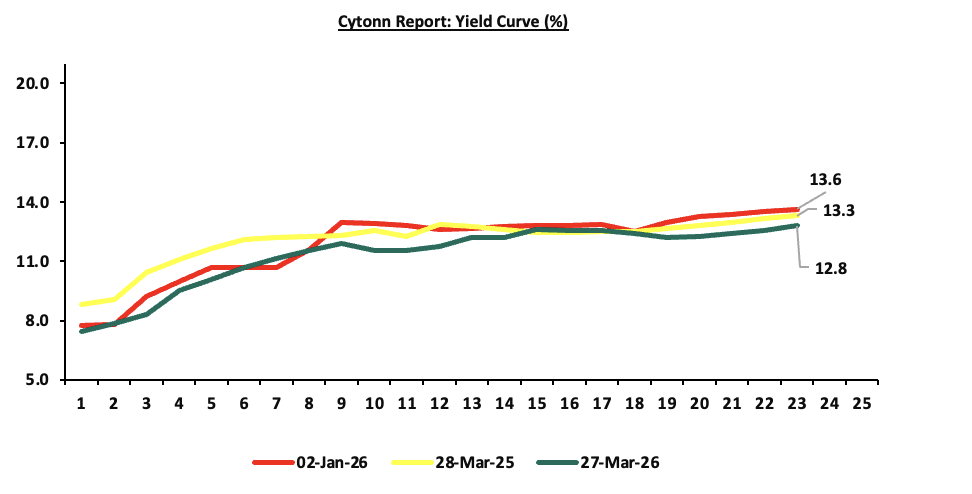
During Q1’2026, yields on the government securities were on a downward trajectory compared to the same period in 2025. This was primarily driven by continued effort by the government to reject highly priced bids, local currency stabilization, and relatively eased inflation. These factors reduced the need for investors to demand higher yields as compensation for inflation and currency depreciation risks, resulting in an overall decline across the yield curve. Notably, the yield curve has adjusted towards a normal upward sloping curve, with long-term bonds registering highest yields. The shift in sentiment indicates increased confidence in the economic landscape. The chart below shows the yield curve movement during the period:
Money Market Performance
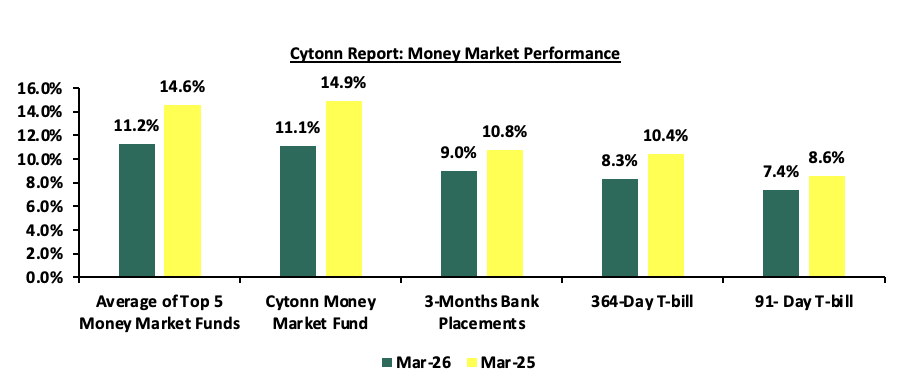
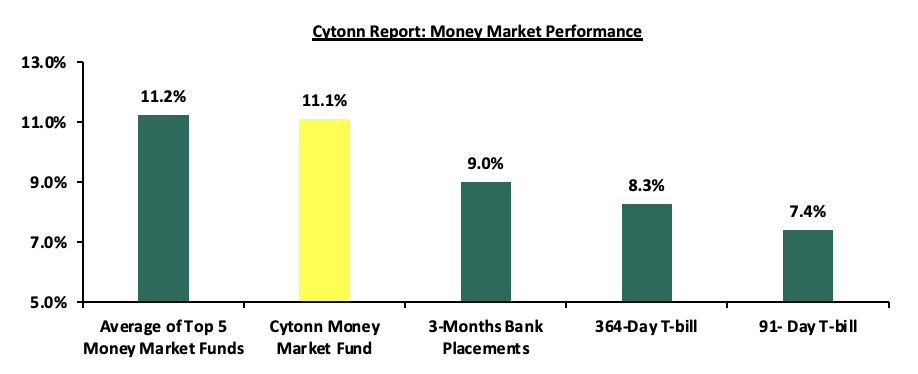
The 3-month bank placements recorded 9.0% at the end of Q1’2026, 1.8% points lower than the 10.8% recorded at the end of Q1’2025 (based on what we have been offered by various banks). The 364-day and 91-day T-bill rate decreased by 2.1% and 1.2% points to 8.3% and 7.4% at the end of Q1’2026 from 10.4% and 8.6% at the end of Q1’2025 respectively, and the average Top 5 Money Market Funds decreased by 3.3% points to 11.3%, from 14.6% at the end of Q1’2025. The yield on the Cytonn Money Market (CMMF) decreased by 3.7% points to 11.2% at the end of Q1’2026, from 14.9% recorded at the end of Q1’2025.
In the money markets, 3-month bank placements ended the week at 9.0% (based on rates offered by various banks). The yields on the 364-day paper decreased by 0.3 bps to remain relatively unchanged from the 8.3% recorded the previous week, while the yields on the 91-day paper also decreased by 2.6 bps to 7.40% from 7.43% recorded last week. The yield on the Cytonn Money Market Fund decreased by 19.0 bps to 11.1% from 11.3% recorded the previous week, while the average yields on the Top 5 Money Market Funds decreased by 8.8 bps to remain relatively unchanged at 11.2% recorded the previous week.
The table below shows the Money Market Fund Yields for Kenyan Fund Managers as published on 2nd April 2026:
|
Cytonn Report: Money Market Fund Yield for Fund Managers as published on 2nd April 2026 |
||
|
Rank |
Fund Manager |
Effective Annual Rate |
|
1. |
Nabo Africa Money Market Fund |
12.9% |
|
2. |
Cytonn Money Market Fund (Dial *809# or download Cytonn App) |
11.1% |
|
3. |
Gulfcap Money Market Fund |
10.8% |
|
4. |
Jubilee Money Market Fund |
10.7% |
|
5. |
Enwealth Money Market Fund |
10.7% |
|
6. |
Arvocap Money Market Fund |
10.7% |
|
7. |
Lofty-Corban Money Market Fund |
10.6% |
|
8. |
Orient Kasha Money Market Fund |
10.5% |
|
9 |
Ndovu Money Market Fund |
10.5% |
|
10. |
Madison Money Market Fund |
10.3% |
|
11. |
Etica Money Market Fund |
10.3% |
|
12. |
Faulu Money Market Fund |
10.3% |
|
13. |
Kuza Money Market fund |
10.2% |
|
14. |
Old Mutual Money Market Fund |
10.1% |
|
15. |
British-American Money Market Fund |
9.5% |
|
16. |
GenAfrica Money Market Fund |
9.4% |
|
17. |
Dry Associates Money Market Fund |
9.3% |
|
18. |
SanlamAllianz Money Market Fund |
9.3% |
|
19. |
KCB Money Market Fund |
9.0% |
|
20. |
Genghis Money Market Fund |
8.7% |
|
21. |
Apollo Money Market Fund |
8.5% |
|
22. |
CIC Money Market Fund |
8.4% |
|
23. |
CPF Money Market Fund |
8.4% |
|
24. |
ICEA Lion Money Market Fund |
8.3% |
|
25. |
Co-op Money Market Fund |
8.3% |
|
26. |
Mali Money Market Fund |
7.9% |
|
27. |
Absa Shilling Money Market Fund |
7.3% |
|
28. |
Mayfair Money Market Fund |
7.1% |
|
29. |
AA Kenya Shillings Fund |
5.9% |
|
30. |
Ziidi Money Market Fund |
5.8% |
|
31. |
Stanbic Money Market Fund |
5.5% |
|
32. |
Equity Money Market Fund |
4.6% |
Source: Business Daily
Liquidity:
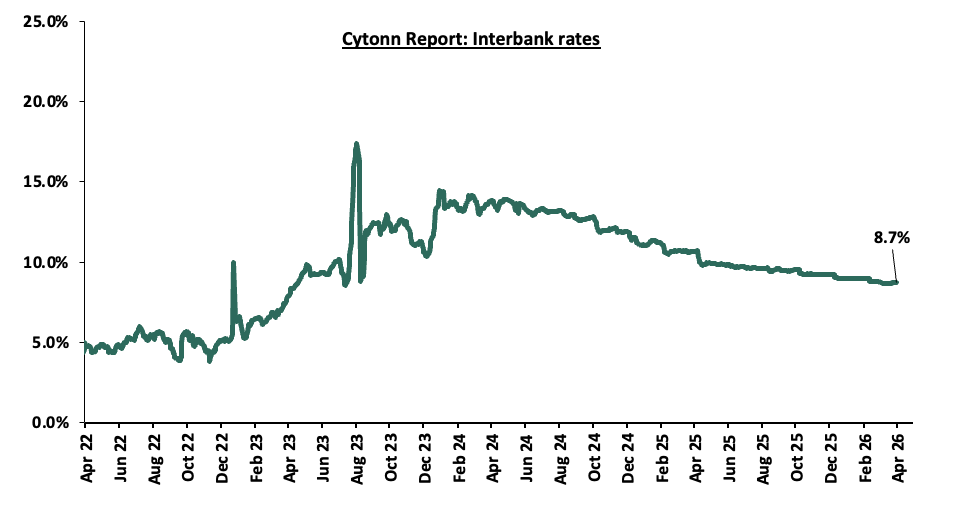
In Q1’2026, liquidity in the money markets eased, as evidenced by the decrease in the interbank rate by 2.1% points to 8.8%, from 10.9% in Q1’2025, partly attributable to government payments that offset tax remittances. Additionally, the average volumes traded in the interbank market decreased by 43.0% to Kshs 11.0 bn, from Kshs 19.2 bn recorded in Q1’2025.
During the week, liquidity in the money markets marginally tightened, with the average interbank rate increasing by 3.1 bps to remain relatively unchanged from the 8.7% recorded the previous week, partly attributable to tax remittances that offset government payments. The average interbank volumes traded increased by 24.2% to Kshs 17.8 bn from Kshs 14.3 bn recorded the previous week. The chart below shows the interbank rates in the market over the years
Kenya Eurobonds:
During Q1’2026, the yields on Eurobonds were on an upward trajectory, with the yield on the 7-Year Eurobond issued in 2024 increasing the most by 1.9% points to 9.0% from 7.1% recorded at the beginning of the quarter. During the week, the yields on Eurobonds were on an upward trajectory, with the yield on the 7-Year Eurobond issued in 2024 increasing the most by 75.0 bps to 9.0% from 8.2% recorded the previous week. The table below shows the summary of the performance of the Kenyan Eurobonds as of 2nd April 2026;
|
Cytonn Report: Kenya Eurobonds Performance |
||||||||
|
|
2018 |
2019 |
2021 |
2024 |
||||
|
Tenor |
10-year issue |
30-year issue |
12-year issue |
13-year issue |
7-year issue |
|||
|
Amount Issued (USD) |
1.0 bn |
1.0 bn |
1.0 bn |
1.5 bn |
1.5 bn |
|||
|
Years to Maturity |
2.5 |
22.5 |
8.8 |
5.5 |
10.5 |
|||
|
Yields at Issue |
7.3% |
8.3% |
6.2% |
10.4% |
9.9% |
|||
|
2-Jan-26 |
6.1% |
8.8% |
7.2% |
7.8% |
7.1% |
|||
|
26-Mar-26 |
7.32% |
9.37% |
8.5% |
9.0% |
8.2% |
|||
|
27-Mar-26 |
7.60% |
9.75% |
8.9% |
9.6% |
8.9% |
|||
|
30-Mar-26 |
7.82% |
9.83% |
9.0% |
9.7% |
9.0% |
|||
|
31-Mar-26 |
7.75% |
9.77% |
9.0% |
9.6% |
9.0% |
|||
|
1-Apr-26 |
7.60% |
9.48% |
8.7% |
9.2% |
8.8% |
|||
|
2-Apr-26 |
7.82% |
9.61% |
9.0% |
9.4% |
9.0% |
|||
|
Weekly Change |
0.5% |
0.2% |
0.5% |
0.4% |
0.7% |
|||
|
QTD Change |
1.7% |
0.9% |
1.8% |
1.6% |
1.9% |
|||
|
YTD Change |
1.8% |
0.8% |
1.8% |
1.8% |
1.9% |
|||
Source: Central Bank of Kenya (CBK)
Weekly Highlights.
-
April 2026 Monetary Policy Committee (MPC) Meeting Note
We expect the MPC to maintain the Central Bank Rate (CBR) at 8.75%, with their decision mainly being supported by:
-
Rate holds by global giant economies: Global monetary policy has generally remained accommodative or steady in recent months. At its March 19th, 2026 Federal Open Market Committee (FOMC) meeting, the US Federal Reserve maintained the federal funds rate at 3.5%-3.75% amid elevated uncertainty about the economic outlook from implications of developments in the Middle East war. Meanwhile, the European Central Bank (ECB), in its 19th March 2026 meeting, chose to hold its benchmark policy rate at 2.00% (deposit rate) for several consecutive meetings while continuing to monitor inflation dynamics in the Euro Area. In addition, other major central banks such as the Bank of England and the Bank of Japan have maintained steady rates or signaled conditional easing depending on inflation outcomes and growth prospects. The escalating Iran war has further reinforced this cautious stance by heightening global uncertainty and inflation risks particularly through potential oil price shocks thereby limiting the scope for immediate rate cuts.
-
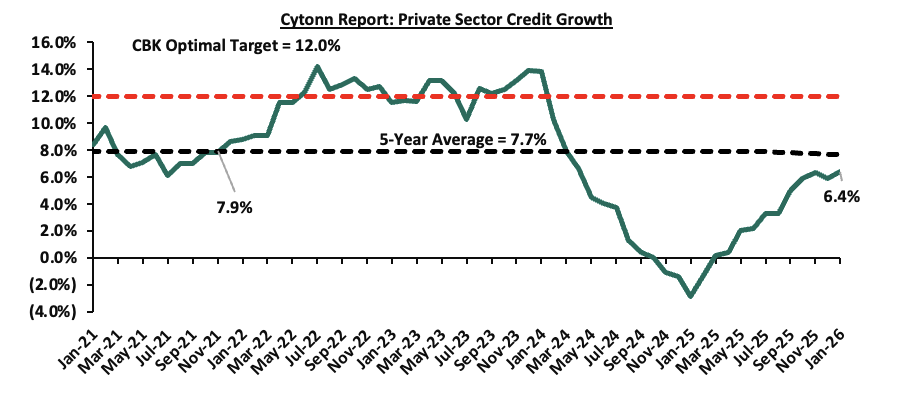
The need to support the economy: A supportive monetary policy remains crucial to enhance financing activities and support private sector lending, particularly in an environment where credit uptake has been moderate. In January 2026, private sector credit grew by 6.4%, up from 5.9% in December 2025, an encouraging sign of recovery. However, this growth remains well below the 5-year average of 7.7%, indicating that credit expansion is still relatively subdued. Given the still-muted business environment, a rate hold would allow the CBK time to observe the impact of the escalating Iran war on the macroeconomic environment particularly through potential pressures on inflation, exchange rate stability, and overall business confidence.
-
The continued stability of the Shilling against major currencies: Despite the February 2026 rate cut, the Kenyan Shilling has remained relatively stable despite depreciating marginally by 75.2 bps against the US Dollar to 130.0 as at 2nd April 2026 from the Kshs 129.0 recorded on 10th February 2026. This stability, supported by foreign exchange reserves currently at 5.8 months of import cover (above the 4.0 months statutory requirement), provides the MPC with flexibility to maintain the current rate without risking currency volatility or capital outflows. However, the escalating Iran war poses an emerging external risk, as potential increases in global oil prices and a stronger US dollar could exert renewed depreciation pressure on the shilling going forward.
For more details, please see our April 2026 MPC Note
Q1’2026 Notable Highlights:
-
The Kenya National Bureau of Statistics (KNBS) released the Q3’2025 Quarterly Gross Domestic Product Report, indicating that the Kenyan economy expanded by 4.9% in Q3’2025, higher than the 4.2% growth recorded in Q3’2024. The improved performance was largely driven by accelerated growth in key sectors, with Mining and Quarrying rebounding to 16.6% in Q3’2025 from a 12.2% contraction in Q3’2024, Construction expanding by 6.7% in Q3’2025 from a 2.6% contraction in Q3’2024, and Electricity and Water Supply growing by 3.6% in Q3’2025 from 0.9% in Q3’2024. For more information please check our Cytonn Weekly#01
-
According to the Q3’2025 Kenya Quarterly Balance of Payment Report released by the Kenya National Bureau of Statistics (KNBS), Kenya’s balance of payments position improved significantly by 458.9% in Q3’2025, to a surplus of Kshs 63.7 bn, from a deficit of Kshs 17.8 bn in Q3’2024. For more information, please check our Cytonn Weekly#01
-
The global ratings agency, Moody’s announced its upgrade of Kenya’s sovereign credit rating from Caa1 to B3, while revising the outlook to Stable from Positive, on the back of a reduction in near-term default risk and strengthened external liquidity; For more information please check our Cytonn Monthly-January 2026
-
The global ratings agency, Fitch Ratings affirmed Kenya’s credit rating at B-, maintaining the Stable outlook in a review dated 23rd January 2026. For more information please check our Cytonn Monthly- January 2026
-
The National Treasury released the 2026 Budget Policy Statement (BPS) in line with Section 25 of the Public Finance Management (PFM) Act, CAP 412A, highlighting that total revenue was projected to increase by 5.4% to Kshs 3,533.7 bn in FY’2026/27 from Kshs 3,352.1 bn in FY’2025/26. For more information, please see our Cytonn Report #07/2026 and our BPS Note 2026
-
The Monetary Policy Committee met on February 10th, 2026, to review the outcome of its previous policy decisions and decided to lower the CBR rate by 25.0 bps to 8.75%, from 9.00% in December 2026. For more information, please see our Cytonn Weekly #06/2025
-
The Government of Kenya released the results of the Eurobond buyback USD 1.0 bn notes due in 2028 and USD 1.2 bn due in 2032, at USD 1,035.0 and USD 1,055.0 per USD 1,000.0 respectively, plus the accrued interest payments on the notes, with the offer closing on 25th February 2026. The government had received tenders of USD 90.5 mn and USD 892.1 mn for the 2028 and 2032 notes respectively. As a result, Kenya was unable to fully retire the bond as planned, leaving USD 307.9 mn of the bond still outstanding, which will need to be repaid at maturity. For more information, please see our Cytonn Monthly- February 2026
-
The Capital Markets Authority (CMA) proposed licensing regulations which would significantly alter the regulatory cost structure for Fund Managers in Kenya. Under the proposal, the current flat annual licensing fee of Kshs 150,000 would be replaced with a variable fee of 0.05% of Assets Under Management (AUM), subject to a minimum fee of Kshs 100,000 and a cap of Kshs 15.0 mn; For more information, please see our Cytonn weekly #09/2026.
-
On 4th March 2026, the National Treasury presented the Supplementary Budget for the Fiscal Year 2025/26 to the National Assembly revealing plans to increase the gross total supplementary budget by 7.4% to Kshs 4,6181.6 bn, from Kshs 4,301.9 bn in the June budget; For more information, please see our Cytonn weekly #09/2026.
-
On 17th March 2026 The National Treasury officially released the Draft Virtual Asset Service Providers (VASP) Regulations, 2026, which outline how stablecoins will be issued and managed in Kenya through a framework built on licensing, disclosure, and reserve requirements. Three key takeaways are that stablecoin issuers must obtain approval and meet relatively high entry thresholds, including minimum capital requirements of about Kshs 500 million; stablecoins must be issued and redeemed at par and backed by reserve assets, although gaps remain around liquidity standards and insolvency protection; and issuers are prohibited from paying interest, which limits stablecoins to a payments role but may reduce their attractiveness compared to alternative products. For more please see our Stablecoin-Focused Note on the Draft Virtual Asset Service Providers Regulations, 2026;
Rates in the Fixed Income market have been on a downward trend due to high liquidity in the money market which allowed the government to front load most of its borrowing. The government is 106.6% ahead of its prorated net domestic borrowing target of Kshs 634.8 bn, having a net borrowing position of Kshs 1,005.0 bn (inclusive of T-bills). However, we expect a stabilization of the yield curve in the short and medium term, with the government looking to increase its external borrowing to maintain the fiscal surplus, hence alleviating pressure in the domestic market. As such, we expect the yield curve to stabilize in the short to medium-term and hence investors are expected to shift towards the long-term papers to lock in the high returns
Market Performance:
During Q1’2026, the equities market was on an upward trajectory, with NSE 20, NSE 25, NASI, and NSE 10 gaining by 9.3%, 6.3%, 4.4%, and 3.3%, respectively. The equities market performance during the quarter was driven by gains recorded by large caps such as Stanbic, DTB-K and BAT of 30.0%, 27.5%, and 23.1% respectively. The gains were however weighed down by losses recorded by large cap stocks such as EABL and Safaricom of 4.6% and 3.0% respectively.
During the Q1’2026, the banking sector index gained by 10.0% to 224.0 from 203.7 recorded the previous quarter. This is attributable to gains recorded by stocks such as Stanbic Bank, DTB-K and Absa of 30.0%, 27.5%, and 15.6%, respectively.
Equities turnover increased by 117.2% in Q1’2026 to USD 440.1 mn, from USD 202.7 mn in Q1’2025. Foreign investors remained net sellers in Q1’2026 with a net selling position of USD 68.0 mn, from a net selling position of USD 25.2 mn recorded in Q1’2025.
During the week, the equities market was on an upward trajectory, with NSE 10, NSE 25, NASI and NSE 20 gaining by 2.2%, 2.1%, 1.9%, and 1.8%, respectively, taking the YTD performance to gains of 10.8%, 7.9%, 6.4% and 4.9% for NSE 20, NSE 25, NASI, and NSE 10 respectively. The equities market performance was mainly driven by gains recorded by large-cap stocks such as Absa, Cooperative Bank and Stanbic Bank, of 8.8%, 6.3%, and 6.1%, respectively. The gains were however weighed down by losses recorded by large cap stocks such as EABL and DTB-K of 1.2% and 0.5% respectively.
Also, during the week, the banking sector index gained by 3.0% to 228.6 from 221.9 recorded the previous week. This is attributable to gains recorded by stocks such as Absa, Cooperative Bank and Stanbic Bank, of 8.8%, 6.3%, and 6.1%, respectively.
During the week, equities turnover declined by 43.0% to USD 21.0 mn from USD 36.8 mn recorded the previous week, taking the YTD turnover to USD 454.1 mn. Foreign investors remained net sellers for the ninth consecutive week with a net selling position of USD 5.8 mn, from a net selling position of USD 3.9 mn recorded the previous week, taking the YTD foreign net selling position to USD 71.8 mn, compared to a net selling position of USD 92.9 mn recorded in 2025.
The market is currently trading at a price to earnings ratio (P/E) of 8.1x, 3.2% points below the historical average of 11.3x, and a dividend yield of 5.8%, 1.0% points above the historical average of 4.7%. Key to note, NASI’s PEG ratio currently stands at 1.0x, an indication that the market is fairly valued relative to its expected future growth. A PEG ratio greater than 1.0x indicates the market may be overvalued while a PEG ratio less than 1.0x indicates that the market is undervalued.
The charts below indicate the historical P/E and dividend yields of the market;
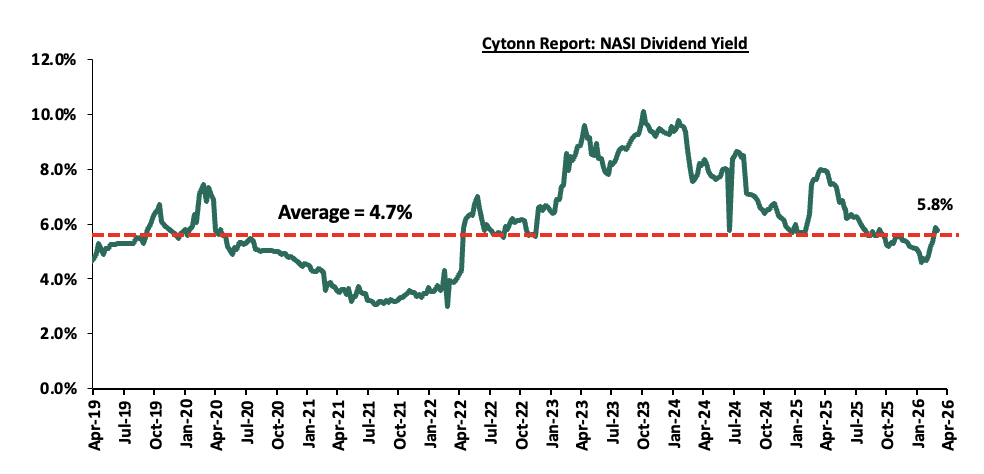
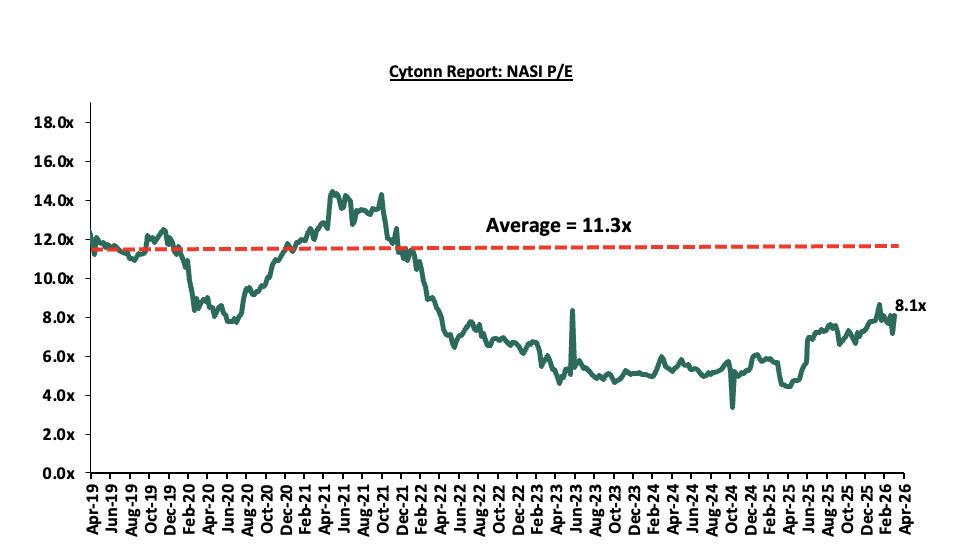
Universe of Coverage:
|
Company |
Price as at 27/03/2026 |
Price as at 02/04/2026 |
w/w change |
YTD Change |
Year Open 2026 |
Target Price* |
Dividend Yield |
Upside/ Downside** |
P/TBv Multiple |
Recommendation |
|
CIC Group |
4.5 |
4.5 |
0.7% |
(1.1%) |
4.5 |
5.5 |
2.9% |
25.4% |
1.1x |
Buy |
|
Diamond Trust Bank |
146.3 |
146.0 |
(0.5%) |
26.8% |
114.8 |
173.4 |
6.2% |
25.4% |
0.4x |
Buy |
|
Co-op Bank |
27.0 |
27.0 |
6.3% |
20.1% |
23.9 |
33.4 |
8.7% |
25.1% |
1.1x |
Buy |
|
KCB Group |
68.0 |
67.8 |
0.4% |
3.8% |
65.8 |
77.5 |
10.3% |
23.7% |
0.7x |
Buy |
|
Equity Group |
69.0 |
69.0 |
0.4% |
3.4% |
67.0 |
79.2 |
8.3% |
22.7% |
0.9x |
Buy |
|
I&M Group |
47.2 |
48.6 |
4.1% |
14.8% |
42.8 |
55.4 |
7.6% |
20.3% |
0.8x |
Buy |
|
NCBA |
88.3 |
90.8 |
2.3% |
6.2% |
85.0 |
101.3 |
7.9% |
20.1% |
1.2x |
Buy |
|
ABSA Bank |
27.2 |
28.6 |
8.8% |
19.1% |
24.9 |
33.0 |
6.9% |
18.4% |
1.6x |
Accumulate |
|
Jubilee Holdings*** |
393.8 |
369.3 |
(5.8%) |
15.0% |
322.5 |
407.5 |
3.6% |
13.5% |
0.6x |
Accumulate |
|
Britam |
12.5 |
12.2 |
(4.8%) |
31.3% |
9.1 |
13.5 |
0.0% |
13.4% |
0.9x |
Accumulate |
|
Stanbic Holdings |
258.8 |
257.0 |
6.1% |
38.8% |
197.8 |
279.1 |
8.1% |
9.8% |
1.6x |
Hold |
|
Standard Chartered Bank |
328.5 |
330.3 |
2.0% |
11.8% |
299.8 |
335.0 |
9.3% |
9.3% |
2.1x |
Hold |
|
*Target Price as per Cytonn Analyst estimates **Upside/ (Downside) is adjusted for Dividend Yield -FY’2025 ***Dividend Yield is calculated using FY’2024 Dividends |
||||||||||
Asset Quality:
The table below shows the asset quality of listed banks that have released their FY’2025 results using several metrics:
|
Cytonn Report: Listed Banks Asset Quality in FY’2025 |
||||||
|
Bank |
FY'2025 NPL Ratio* |
FY'2024 NPL Ratio** |
% point change in NPL Ratio |
FY'2025 NPL Coverage* |
FY'2024 NPL Coverage** |
% point change in NPL Coverage |
|
KCB Group |
16.2% |
19.8% |
(3.7%) |
74.0% |
65.1% |
9.0% |
|
HF Group |
22.2% |
25.3% |
(3.1%) |
78.2% |
70.3% |
8.0% |
|
Equity Group |
11.5% |
13.6% |
(2.1%) |
66.8% |
63.7% |
3.1% |
|
Standard Chartered Bank |
5.5% |
7.4% |
(2.0%) |
87.0% |
81.8% |
5.2% |
|
I&M Group |
9.6% |
11.5% |
(1.9%) |
71.6% |
62.3% |
9.3% |
|
Co-operative Bank |
15.7% |
17.0% |
(1.3%) |
66.0% |
63.9% |
2.1% |
|
Diamond Trust Bank |
11.3% |
12.6% |
(1.3%) |
52.8% |
39.9% |
13.0% |
|
Stanbic Holdings |
8.0% |
9.1% |
(1.1%) |
84.3% |
78.4% |
5.9% |
|
Absa Bank Kenya |
11.5% |
12.6% |
(1.1%) |
64.6% |
66.0% |
(1.4%) |
|
NCBA Group |
10.4% |
11.5% |
(1.0%) |
71.6% |
59.2% |
12.4% |
|
FY’2025 Mkt Weighted Average* |
11.8% |
13.4% |
(1.5%) |
71.5% |
66.7% |
4.9% |
|
FY’2024 Mkt Weighted Average** |
13.2% |
12.6% |
0.7% |
66.8% |
60.7% |
6.1% |
|
*Market cap weighted as at 02/04/2026 |
||||||
|
**Market cap weighted as at 13/03/2025 |
||||||
Key take-outs from the table include;
-
Asset quality for the listed banks improved during FY’2025, with market-weighted average NPL ratio decreasing by 1.5% points to 11.8% from 13.4% in FY’2024 largely due to KCB Group and HF Group numbers, and,
-
Market-weighted average NPL Coverage for the 10 listed banks increased by 4.9% points to 71.5% in FY’2025 from 66.7% recorded in FY’2024. The increase was attributable to DTBK NPL coverage ratio increasing by 13.0% points to 52.8% from 39.9% in FY’2024. However, the performance was weighed down by Absa Bank Kenya NPL coverage ratio decreasing by 1.4% points to 64.6% from 66.0% in FY’2024.
Summary Performance
The table below shows the performance of listed banks that have released their FY’2025 results using several metrics:
|
Cytonn Report: Listed Banks Performance in FY’2025 |
||||||||||||||
|
Bank |
Core EPS Growth |
Interest Income Growth |
Interest Expense Growth |
Net Interest Income Growth |
Net Interest Margin |
Non-Funded Income Growth |
NFI to Total Operating Income |
Growth in Total Fees & Commissions |
Deposit Growth |
Growth in Government Securities |
Loan to Deposit Ratio |
Loan Growth |
Return on Average Equity |
|
|
Equity Group |
54.7% |
2.0% |
(24.2%) |
16.8% |
7.8% |
6.7% |
41.7% |
7.9% |
4.0% |
11.4% |
60.6% |
7.7% |
27.8% |
|
|
Diamond Trust Bank |
23.1% |
2.8% |
(16.3%) |
24.1% |
6.7% |
(9.1%) |
25.3% |
10.4% |
13.8% |
17.7% |
63.7% |
13.6% |
11.7% |
|
|
I&M Group |
21.2% |
(1.4%) |
(23.9%) |
16.0% |
8.5% |
30.8% |
23.8% |
20.9% |
17.4% |
55.5% |
63.3% |
6.5% |
17.8% |
|
|
Co-operative Bank |
16.9% |
8.0% |
(12.8%) |
22.0% |
9.2% |
(0.3%) |
31.6% |
1.2% |
13.4% |
12.6% |
73.3% |
12.6% |
19.1% |
|
|
KCB Group |
11.2% |
(1.7%) |
(18.9%) |
7.8% |
8.6% |
(2.6%) |
30.8% |
0.7% |
15.2% |
10.2% |
72.3% |
16.3% |
22.5% |
|
|
Absa Bank Kenya |
9.7% |
(10.9%) |
(22.2%) |
(6.4%) |
9.1% |
12.2% |
29.4% |
18.8% |
1.4% |
20.7% |
83.8% |
1.0% |
24.7% |
|
|
NCBA Group |
7.0% |
(10.0%) |
(41.6%) |
27.7% |
7.5% |
3.8% |
39.9% |
4.0% |
5.9% |
4.6% |
59.6% |
5.0% |
19.7% |
|
|
Stanbic Group |
0.0% |
(17.2%) |
(41.4%) |
(1.0%) |
5.7% |
(6.4%) |
37.5% |
(10.0%) |
19.5% |
36.4% |
70.3% |
17.2% |
18.8% |
|
|
HF Group |
(16.7%) |
17.3% |
(15.8%) |
63.9% |
1.9% |
19.9% |
29.3% |
(3.5%) |
17.7% |
66.6% |
73.6% |
5.8% |
8.5% |
|
|
Standard Chartered Bank |
(38.0%) |
(15.4%) |
(29.1%) |
(13.1%) |
8.7% |
(23.0%) |
31.7% |
1.0% |
(4.1%) |
11.8% |
54.4% |
1.8% |
18.0% |
|
|
FY'2025 Mkt Weighted Average* |
14.8% |
(4.0%) |
(25.1%) |
10.9% |
8.1% |
1.9% |
33.9% |
5.4% |
8.7% |
17.4% |
67.5% |
8.9% |
21.5% |
|
|
FY'24 Mkt Weighted Average* |
26.2% |
20.5% |
42.6% |
12.0% |
7.6% |
13.9% |
36.1% |
9.2% |
(4.4%) |
18.9% |
66.5% |
(7.6%) |
22.8% |
|
|
*Market cap weighted as at 02/04/2026 |
||||||||||||||
|
**Market cap weighted as at 13/03/2025 |
||||||||||||||
Key take-outs from the table include:
-
The listed banks recorded a 14.8% growth in core Earnings per Share (EPS) in FY2025, compared to the weighted average growth of 26.2% in FY’2024, an indication of deteriorated performance attributable to the Standard Chartered and HF Group numbers.
-
Interest income recorded a weighted average decrease of 4.0% in FY’2025, compared to 20.5% in FY’2024. Similarly, interest expenses recorded a market-weighted average decline of 25.1% in FY’2025 compared to the weighted average growth of 42.6% in FY’2024.
-
The Banks’ net interest income recorded a weighted average growth of 10.9% in FY’2025, a decrease from the 12.0% recorded over a similar period in 2024, while the non-funded income increased by 1.9% in FY’2025 compared to the 13.9% growth recorded in FY’ 2024, and,
-
The Banks recorded a weighted average deposit growth of 8.7%, compared to the decrease in market-weighted average deposit of 4.4% in FY’2024.
Weekly Highlights
-
CIC Group Ltd FY’2025 Financial Results.
During the week, CIC Group released their FY’2025 results. CIC’s Profit After Tax decreased by 68.7% to Kshs 1.3 bn in FY’2025, from Kshs 4.0 bn recorded in FY’2024. The performance was mainly driven by non-recurrence of a one-off fair value gain of approximately Kshs 1.0 bn arising from revaluation of its Kiambu land recognized in 2024 financials and elevated claims resulting in a significant 151.2% decrease in net insurance income to Kshs (0.2) bn in FY’2025, from Kshs 0.3 bn in FY’2024, coupled with the 58.2% decrease in the net investment result to Kshs 1.6 bn from Kshs 3.8 bn in FY’2024. Below is a summary of CIC Group’s FY’2025 Results;
|
Cytonn Report: CIC Group Income Statement |
|||
|
Item (All figures in Bns) |
FY'2024 |
FY'2025 |
y/y change |
|
Insurance Revenue |
26.3 |
29.5 |
11.8% |
|
Insurance service expenses |
(24.2) |
(28.2) |
16.4% |
|
Net expenses from reinsurance contracts held |
(1.8) |
(1.4) |
(19.8%) |
|
Net Insurance income |
0.3 |
(0.2) |
(151.2%) |
|
Net Investment Income |
8.8 |
6.2 |
35.7% |
|
Net investment result |
3.8 |
1.6 |
(58.2%) |
|
Other Operating Expenses |
(1.7) |
(2.3) |
32.3% |
|
Operating Profit |
4.6 |
1.8 |
(61.6%) |
|
Profit Before Tax |
4.0 |
1.3 |
(68.7%) |
|
Profit After Tax |
2.9 |
0.5 |
(82.0%) |
|
Core EPS in Kshs |
1.1 |
0.2 |
(82.0%) |
|
Dividend Per Share (DPS) |
0.13 |
0.13 |
0.0% |
|
Dividend Payout Ratio |
11.9% |
66.2% |
54.3% |
|
Dividend Yield |
4.3% |
2.9% |
(1.5%) |
|
Cytonn Report: CIC Group Balance Sheet |
|||
|
Item (All figures in Bns) |
FY'2024 |
FY'2025 |
y/y change |
|
Investment assets |
3.7 |
3.3 |
(10.9%) |
|
Financial Investments |
43.3 |
54.3 |
25.5% |
|
Property & Equipment and Intangibles |
1.4 |
1.5 |
5.6% |
|
Total Assets |
61.9 |
73.7 |
19.1% |
|
Insurance Contract Liabilities |
41.8 |
52.7 |
25.9% |
|
Provisions & other payables |
3.7 |
4.1 |
10.7% |
|
Total liabilities |
50.9 |
61.9 |
21.6% |
|
Shareholder funds |
11.0 |
11.8 |
7.5% |
|
Minority Interest |
(0.1) |
(0.1) |
33.7% |
|
Total Equity |
11.0 |
11.8 |
7.4% |
Key take outs from the results:
-
Core earnings per share declined by 82.0% to Kshs 0.2 in FY’2025, from Kshs 1.1 in FY’2024, mainly attributable to an 151.2% decrease in net insurance income to Kshs (0.2) bn in FY’2025, from Kshs 0.3 bn in FY’2024, coupled with the net investment result decreasing by 58.2% to Kshs 1.6 bn in FY’2025, from Kshs 3.8 bn in FY’2024.
-
Net investment result decreased by 58.2% to Kshs 1.6 bn in FY’2025, from Kshs 3.8 bn in FY’2024 despite the 35.7% increase in investment income to Kshs 2.7 bn, from Kshs 1.8 bn.
-
Insurance service expenses rose by 16.4% to Kshs 28.2 bn in FY’2025, from Kshs 24.2 bn in FY’2024, outpacing the 11.8% growth in insurance revenue to Kshs 29.5 bn, from Kshs 26.3 bn. At the same time, net expenses from reinsurance contracts held decreased by 19.8% to Kshs 1.4 bn, from Kshs 1.8 bn in FY’2024. Consequently, net insurance income declined sharply by 151.2% to Kshs (0.20) bn, from Kshs 0.3 bn in FY’2024.
-
The balance sheet recorded an expansion as total assets increased by 19.1% to Kshs 73.7 bn in FY’2025, from Kshs 61.9 bn in FY’2024, mainly driven by a 25.5% increase in financial investments to Kshs 54.3 bn, from Kshs 43.3 bn in FY’2024, coupled with 5.6% increase in property and equipment to Kshs 1.5 bn in FY’2025 from Kshs 1.4 bn in FY’2025.The growth was however weighed down by a 10.6% decrease in investment assets to Kshs 3.3 bn, from Kshs 3.7 bn in FY’2024, and,
-
Total liabilities increased by 21.6% to Kshs 61.9 bn in FY’2025 from Kshs 50.9 bn in FY’2024, mainly attributable to the 25.9% increase in insurance contract liabilities to Kshs 52.7 bn from Kshs 41.8 bn in FY’2024, coupled with a 10.7% increase in provisions and other payables to Kshs 4.1 bn from Kshs 3.7 bn in FY’2024.
Other highlights from the release include:
-
Declaration of dividends – The Group’s Board of Directors recommended a first and final dividend of Kshs 0.13 per share translating to a dividend yield and dividend payout ratio of 2.9% and 66.2% respectively.
Going forward, the factors that would drive the company’s growth would be:
-
Digital Transformation: Continued investment in technology to improve efficiency and customer experience, with initiatives such as EasyBima enhancing accessibility, convenience and faster policy onboarding for clients.
-
Product and Business Diversification: The Group is broadening its revenue base through ventures such as CIC Micro Insurance Limited and CIC Pharmacy Limited, tapping into new segments like micro-insurance and healthcare services to reduce reliance on traditional insurance income.
-
Strengthened Balance Sheet and Capital Base: With total assets rising by 19.1% y/y to Kshs 73.7 bn and shareholder funds up 7.5% to Kshs 11.8 bn in FY’2025, the Group is better positioned to underwrite larger risks, attract strategic partnerships, and fund long-term growth initiatives.
-
Britam Holdings Plc FY’2025 Financial Results.
During the week, Britam Holdings released their FY’ 2025 results. Britam’s Profit After Tax (PAT) increased by 10.0% to Kshs 5.5 bn, from Kshs 5.0 bn recorded in FY’2024. The performance was mainly driven by the 4.2% increase in net investment income to Kshs 31.9 bn from Kshs 30.6 bn recorded in FY’2024 supported by a 10.9% increase in net insurance revenue to Kshs 41.7 bn from the Kshs 37.6 bn recorded in FY’2024. Below is a summary of Britam Holding Plc’s FY’2025 Results;
|
Cytonn Report: Britam Holdings Income Statement |
|||
|
Item (All figures in Bns) |
FY'2024 |
FY'2025 |
y/y change |
|
Insurance Revenue |
37.6 |
41.7 |
10.9% |
|
Insurance service expenses |
27.3 |
30.9 |
13.1% |
|
Net Insurance income |
5.1 |
3.5 |
(31.8%) |
|
Net Investment Income |
30.6 |
31.9 |
4.2% |
|
Net Insurance and Finance expenses |
26.4 |
26.5 |
0.4% |
|
Other Income |
1.3 |
0.6 |
(51.7%) |
|
Other operating expenses |
4.0 |
3.2 |
(20.2%) |
|
Profit Before Tax |
7.3 |
7.9 |
7.8% |
|
Profit After Tax |
5.0 |
5.5 |
10.0% |
|
Core EPS |
2.0 |
2.2 |
10.0% |
|
Cytonn Report: Britam Holdings Balance Sheet |
|||
|
Item (All figures in Bns) |
FY'2024 |
FY'2025 |
y/y change |
|
Investment assets |
186.1 |
220.7 |
18.6% |
|
Intangible Assets |
2.2 |
2.6 |
16.7% |
|
Total Assets |
208.5 |
243.8 |
16.9% |
|
Insurance Contract Liabilities |
163.4 |
192.7 |
17.9% |
|
Provisions & other payables |
13.9 |
15.1 |
8.3% |
|
Total liabilities |
179.1 |
208.7 |
16.6% |
|
Shareholder funds |
29.2 |
34.8 |
19.0% |
|
Minority Interest |
0.3 |
0.3 |
13.4% |
|
Total Equity |
29.5 |
35.1 |
19.0% |
Key take outs from the results:
-
Core Earnings Per share increased by 10.0% to Kshs 2.2 from Kshs 2.0 in FY’2024, driven by the 4.2% increase in net investment income to Kshs 31.9 bn from Kshs 30.6 bn recorded in FY’2024 coupled with a 10.9% increase in net insurance revenue to Kshs 41.7 bn from the Kshs 37.6 bn recorded in FY’2024
-
Net Investment Income (NII) increased by 4.2% to Kshs 31.9 bn in FY’2025, from Kshs 30.6 bn in FY’2024. This was majorly attributable to the 12.5% increase in interest and dividend income to 21.8 bn from Kshs 19.4 bn in FY’2024, coupled with a 10.1% increase in income from investment property to 0.9 bn from the Kshs 0.8 bn in FY’2024
-
Insurance revenue increased by 10.9% to Kshs 41.7 bn in FY’2025 from Kshs 37.6 bn in FY’2024, while insurance expenses increased by 13.1% to Kshs 30.9 bn from Kshs 27.3 bn in FY’2024, and net expenses from reinsurance contracts increased by 41.1% to Kshs 7.3 bn from Kshs 5.2 bn in FY’2024, translating to a Net insurance service result decrease of 31.8% to Kshs 3.5 bn from Kshs 5.1 bn in FY’2024,
-
The balance sheet recorded an expansion as total assets increased by 16.9% to Kshs 243.8 bn in FY’2025 from Kshs 208.5 bn in FY’2024, mainly driven by 18.6% increase in investment assets to Kshs 220.7 bn from Kshs 186.1 bn in FY’2024, coupled with 16.7% increase in intangible assets to Kshs 2.6 bn, from Kshs 2.2 bn in FY’2024.
-
Total liabilities increased by 16.6% to Kshs 208.7 bn from Kshs 179.1 bn in FY’2024, majorly on the back of Insurance contract liabilities 17.9% increase to Kshs 192.7 bn from Kshs 163.4 bn in FY’2024, coupled with the 8.3% increase in provisions and other payables to Kshs 15.1 bn from Kshs 13.9 bn in FY’2024
Other highlights from the release include:
-
Non-declaration of dividends – The Group’s board of directors declined to announce any dividends for the seventh consecutive year citing the group’s attempt to conserve capital.
Going forward, the factors that would drive the company’s growth would be:
-
Digitalization – Leveraging Britam Connect, its microinsurance subsidiary, alongside digital systems allows Britam to expand access to affordable insurance for underserved populations while improving efficiency. Through mobile platforms and simplified processes, the company can reach more customers, reduce distribution costs, and enhance service delivery. At the same time, the use of data analytics and automation supports better risk management, faster operations, and more tailored products, enabling sustainable growth and greater financial inclusion.
-
Diversified Products – On top of their mainstream insurance products, Britam has innovatively introduced a number of products into the market. These diversified products, such as school personal accidents, new born baby insurance products and their unit trust products, will contribute to a continued growth of the company’s growth.
Valuation Summary:
-
We are of the view that Britam Holdings Plc is an “Accumulate” with a target price of Kshs 13.5 representing a upside of 13.4%, from the current price of 11.9 as of 2nd April 2026.
-
Britam is currently trading at a P/TBV of 1.1x and a P/E of 6.0x vs an industry average of 0.8x and 5.6x respectively.
Kenyan Q2’2026 Equities Outlook
Below, we summarize the metrics used in coming up with our Q2’2026 Equities Outlook;
|
Cytonn Report: Equities Outlook Summary |
||||
|
Equities Market Indicators |
Outlook for Q2’2026 |
Current View |
Q2’2026 Outlook |
|
|
Macro- Economic Environment |
|
Positive |
Neutral |
|
|
Corporate Earnings Growth |
|
Positive |
Positive |
|
|
Valuations |
|
Positive |
Neutral |
|
|
Investor Sentiment and Security |
• |
We anticipate foreign and domestic investor sentiment to be mildly subdued in Q2’2026 if the ongoing geopolitical tensions persist. Potential rise in interest rates and market and currency volatility could trigger more foreign outflows and deter inflows, therefore tightening liquidity. However, selective opportunities remain, as the NASI, while fairly valued, is currently trading below its historical average, which could attract opportunistic capital once conditions stabilize. |
Neutral |
Neutral |
Out of the four metrics that we track, one has a “positive” and three have “neutral” outlook and therefore our outlook for Q2’2026 remains broadly neutral.
Q1’2026 Notable Highlights:
During Q1’2026;
-
East African Breweries Plc (EABL) released their HY’2026 financial results for the year ending 31st December 2025, recording a 37.7% increase in the Profits After Tax (PAT) to Kshs 11.2 bn in HY’2026, from Kshs 8.1 bn in HY’2025. Please see our Cytonn Monthly January 2026 for more info;
-
Kenya Pipeline Company Plc (KPC) launched an Initial Public Offer (IPO) through an Offer for Sale at the Nairobi Securities Exchange (NSE), offering 65% of its stake to the public. For more information, please see our Cytonn Weekly #03/2026 and KPC IPO Note
-
The Competition Authority of Kenya approved KCB Group’s acquisition of a 75.0% stake in fintech firm Riverbank Solutions, supporting the bank’s push to strengthen its digital payments and platform-based services. Please see our Cytonn Monthly January 2026 for more info;
-
Umeme Limited, through its Board, notified its shareholders and the general public that they are most likely to register a loss after assessing their financial performance for the year ended 31st December 2025. This is mainly attributable to the cessation of operating revenue generation at the end of Q1’ 2025 following the natural end of the 20-year electricity distribution concession in Uganda on 31st March 2025. Please see our Cytonn Monthly January 2026 for more info;
-
During the month, Liberty Insurance, through its Board, notified its shareholders that their consolidated earnings after tax for the year ended 31 December 2025 are likely to be atleast 25.0% lower than the audited earnings after tax for the year ended 31 December 2024. Please see our Cytonn Monthly January 2026 for more info;
-
Kenya Power & Lighting Company Plc (KPLC) released its HY’2026 financial results, recording an 4.3% increase in profitability to Kshs 10.4 bn, up from Kshs 10.0 bn in HY’2025. For more information, please see our Cytonn Weekly #05/2026
-
Kenya Electricity Generating Company (KenGen), released its H1'2026 financial results for the period ended 31st December 2025, recording a profit after tax of Kshs 4.2 bn, a 20.2% decrease from the Kshs 5.3 bn recorded in H1’2025. For more information, please see our Cytonn Weekly #06/2026.
-
Leapfrog Investments revealed plans to acquire 24.1% minority stake of ICEA Lion Insurance Holdings valued at Kshs 2.4 bn. For more information, please see our Cytonn Weekly #07/2026
-
Limuru Tea Plc issued its third consecutive profit warning on February 27, 2026, notifying shareholders that its net earnings for the year ended December 31, 2025, are expected to be at least 25.0% lower than the previous year.
-
CIC Insurance Group issued a profit warning on February 24, 2026, signaling that its 2025 full-year profit is projected to drop by at least 25.0% compared to the Kshs 2.85 billion reported in 2024. The group attributed the downturn to the non-recurrence of a one-off gain of Kshs 1.01 billion from their Kiambu land revaluation surplus recorded in 2024, alongside elevated insurance claims and higher finance costs.
-
The listed banks released their FY’2025 financial results, recording a 14.8% growth in core Earnings per Share (EPS) in FY2025, compared to the weighted average growth of 26.2% in FY’2024. For more information, please see our please see our Earnings Note reports;
-
Liberty Kenya Holdings released their FY’2025 results, highlighting that the Profit After Tax decreased by 51.9% to Kshs 0.7 bn, from the Kshs 1.4 bn recorded in FY’2024. For more information, please see our Cytonn Weekly #10/2026
We maintain a “cautiously optimistic” short-term outlook supported primarily earnings-led attractive valuations, lower yields on short-term government papers and expected global and local economic recovery, and, “neutral” in the long term as persistent foreign investor outflows continue to constrain market liquidity and limit broad-based market re-rating. With the market currently trading at par to its future growth (PEG Ratio at 1.0x), where performance will be driven by company-specific fundamentals rather than general market direction, we believe that investors should reposition towards value stocks exhibiting strong earnings growth, attractive dividend yields, solid balance sheets, sustainable competitive advantages and trading at compelling discounts to their intrinsic value. While foreign investor sell-offs are expected to continue exerting pressure in the near term, we believe this will create selective entry opportunities for long-term investors.
In Q1’2026, the general Real Estate sector continued to witness considerable growth in activity in terms of property transactions and development activities. Consequently, the sector’s activity grew by 7.6 % to Kshs 368.7 bn in Q3’2025, from Kshs 342.6 bn recorded during the same period in 2024. In addition, the sector contributed 8.6% to the country’s GDP, 2.2% points decrease from 10.8% recorded in Q3’2024. Cumulatively, the Real Estate and construction sectors contributed 16.6% to GDP, 0.1% points increase from 16.5% in Q3’2024, attributable to increase in construction contribution to GDP by 1.0% points, to 6.7% in Q3’2025, from 5.7% recorded in Q3’2024. The graph below highlights the Real Estate and Construction sectors’ contribution to GDP from 2021 to Q3’2025
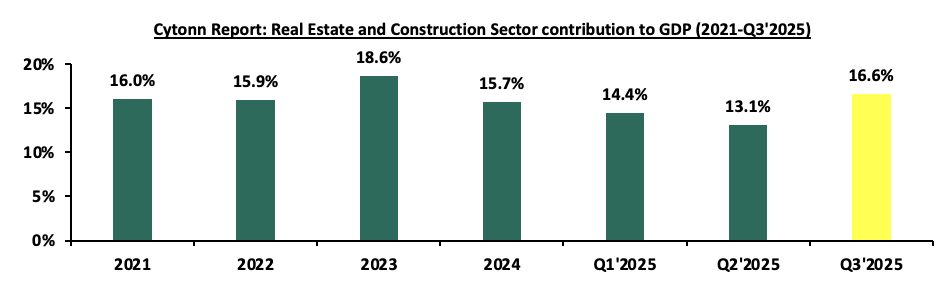
Source: Kenya National Bureau of Statistics (KNBS)
In Q1’2026, Real Estate was promoted by key initiatives as follows:
-
Government’s continued Focus on Affordable Housing: The Kenyan government has maintained its commitment towards the delivery of affordable housing under the Affordable Housing Programme (AHP), which remains a key pillar of the Bottom-Up Economic Transformation Agenda (BETA). As of 2025, the AHP pipeline comprises over 214,000 housing units under development across more than 300 projects, with a significant proportion being driven by public-private partnerships. Additionally, the operationalization of the Affordable Housing Act, 2024, supported by the housing levy, has enhanced resource mobilization, thereby improving project execution and supporting supply in the low- and middle-income housing segments.
-
Infrastructural Development: In general, Continuous improvements in infrastructure, such as new roads, bridges, and utilities, have opened up previously inaccessible areas for real estate development. This has led to increased property value and demand in urban and peri-urban areas. The government has continually prioritized infrastructural development in efforts aimed at positioning the country as a regional hub through the implementation of several key projects including, Makupa Bridge, Nairobi Expressway, Nairobi Western and Eastern Bypasses among others. Notable projects delivered in 2024 include phase two of the Dongo Kundu bypass project,
-
Provision of Affordable Mortgage Financing: Kenya Mortgage Refinance Company (KMRC) has continued to drive the availability and affordability of home loans to Kenyans by providing single-digit fixed rate, and long-term finance to Primary Mortgage Lenders (PMLs) such as banks and SACCOs. Recently, KMRC, broadened its refinancing services to include non-shareholders, such as SACCOs and microfinance institutions. This is a strategic move to improve access to affordable mortgages, particularly for low and middle-income earners, a key target of Kenya's affordable housing agenda.
-
Aggressive Expansion pursued by Retailers: The Kenyan retail sector is undergoing a massive transformation, characterized by the rapid growth of both local and global giants. Following the collapse of formerly dominant chains like Tuskys, Nakumatt, Uchumi, and Choppies, a market vacuum emerged. This gap is being aggressively filled by expanding retailers such as Naivas, QuickMart, Carrefour and China square. This momentum is further bolstered by the entry of premium international brands like Adidas, Puma, Aldo, and Michael Kors, signalling a new era of development for the industry.
-
Kenya’s Recognition as a Regional Business Hub: Kenya continues to enjoy recognition as a regional business hub. As a result, foreign entities have continued to open business operations in Kenya, boosting the demand for both commercial and residential Real Estate. Increased business activity has driven up demand for office space, apartments, and housing near business hubs, leading to the development of new projects, increased property values, and job creation in the construction sector,
-
Positive Demographics: With relatively high urbanization and population growth rates of 2.8% p.a and 2.0% p.a, respectively, against the global average of 1.4% p.a and 1.0% p.a, respectively, as at 2024, there is a sustained demand for more housing units in the country,
-
Increasing Investor Confidence: Increase in investor confidence has greatly influenced hospitality sector and this is evident through mergers, acquisitions and expansions of hotels. Furthermore, the number of international arrivals into the country by the end of 2025 registered a 12.5% year-to-year (y/y) increase to 2.7 mn persons in 2025 from 2.4 mn arrivals recorded in 2024. Notably, the Hotel Chain Development Pipelines in Africa 2026 Report ranked Nairobi at 4th position by planned number of hotels and rooms with 35 hotels and 6,190 rooms in the pipeline, and,
-
Special Built Developments: There has been an increased popularity of purpose-built properties to host Student housing, medical centers, Diplomatic residentials, data centers which offer potential for growth to the Real Estate sector through alternative markets. Due to these assets classes, the industry remains resilient despite the rapidly changing technological and economic environments.
Despite the above drivers, the sector’s optimal performance is expected to be hampered by the following factors in Q1’2026:
-
Existing oversupply of physical space in select sectors: With approximately 5.8 mn SQFT in the NMA commercial office market, approximately 3.0 mn SQFT in the Nairobi Metropolitan Area (NMA) retail market, with the rest of the Kenyan retail market having an oversupply of approximately 1.7 mn SQFT. This has led to prolonged vacancy rates in the respective Real Estate sectoral themes,
-
Subdued REITs Market: The REITs market in Kenya continues to be subdued owing to various challenges such as the large capital requirements of Kshs 100.0 mn for trustees compared to Kshs. 10 mn for pension fund Trustees, which limits the role to banks, prolonged approval process for REITs, only a few legal entities capable of incorporating REITs, high minimum subscription amounts or offer parcels set at Kshs 0.1 mn for D-REITs and 5.0 mn for restricted I-REITs and lack of adequate knowledge of the financial asset class by investors,
-
Constrained financing to developers: Constrained financing to developers as cost of borrowing remains elevated and lenders continue to demand more collateral from developers as a result of the high credit risk in the real estate sector with gross NPL ratio in at 16.9% Q3’2025, higher than the 16.5% in Q3’2024, and,
-
Underdeveloped capital markets: It is difficult to develop pools of capital focused on projects, particularly in the private markets, to supplement government efforts in providing housing. Banks in Kenya are the primary source of funding for real estate developers, providing nearly 95.0% of funding as opposed to 40.0% in developed countries. This means that capital markets contribute only 5.0% of Real Estate development funding, compared to 60.0% in developed countries as shown below;
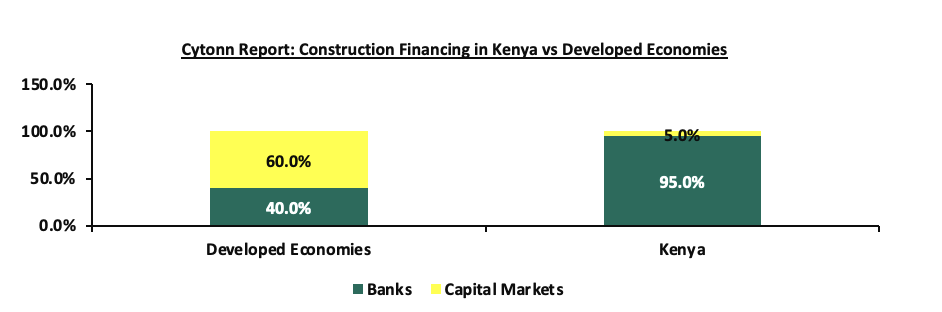
Source: World Bank, Capital Markets Authority
Sectoral Market Performance
-
Residential Sector
During Q1’2025, the NMA residential sector recorded a slight increase in performance, with the average total returns to investors coming in at 6.8%, 0.5% points increase from 6.3% recorded in Q1’2025. The performance was attributed to an increase in the residential average y/y price appreciation which came in at 0.9% in Q1’2026, 0.1%-points higher than the 0.8% appreciation recorded in Q1’2025, driven by increased property transactions during the year. On the other hand, the average rental yield came in at 5.9% in Q1’2026, recording a 0.4%-points increase from the 5.5% rental yield recorded in Q1’2025. The table below shows the NMA residential sector’s performance during Q1’2026 and Q1’2025;
|
(All values in Kshs unless stated otherwise) |
|||||||||||
|
Cytonn Report: Nairobi Metropolitan Area (NMA) Residential Sector Summary - Q1’2026/Q1’2025 |
|||||||||||
|
Segment |
Average of Price per SQM Q1'2026 |
Average of Rent per SQM Q1'2026 |
Average of Rental Yield Q1'2026 |
Average of Price Appreciation Q1'2026 |
Average of Total Returns Q1'2026 |
Average of Rental Yield Q1'2025 |
Average of Price Appreciation Q1'2025 |
Average of Total Returns Q1'2025 |
y/y change in Rental Yield (% Points) |
y/y change in Price Appreciation (% Points) |
y/y change in Total Returns (% Points) |
|
Detached Units |
|||||||||||
|
High End |
196,351 |
830 |
4.8% |
0.5% |
5.3% |
4.6% |
0.4% |
5.0% |
0.2% |
0.1% |
0.3% |
|
Upper Middle |
139,135 |
619 |
5.2% |
0.7% |
5.8% |
5.2% |
(1.1%) |
4.1% |
(0.0%) |
1.8% |
1.7% |
|
Lower Middle |
80,400 |
369 |
5.4% |
0.8% |
6.2% |
4.8% |
0.3% |
5.1% |
0.6% |
0.5% |
1.1% |
|
Detached Units Average |
138,629 |
606 |
5.1% |
0.7% |
5.8% |
4.9% |
(0.1%) |
4.7% |
0.2% |
0.8% |
1.0% |
|
Apartments |
|||||||||||
|
Upper Mid-End |
133,397 |
1292 |
7.3% |
0.2% |
7.5% |
6.4% |
1.4% |
7.8% |
0.9% |
(1.2%) |
(0.3%) |
|
Lower Mid-End Suburbs |
108,492 |
529 |
6.1% |
1.4% |
7.5% |
6.0% |
1.6% |
7.5% |
0.1% |
(0.2%) |
(0.0%) |
|
Lower Mid-End Satellite Towns |
83,481 |
490 |
6.9% |
1.5% |
8.5% |
6.2% |
2.3% |
8.5% |
0.7% |
(0.8%) |
(0.1%) |
|
Apartments Average |
108,457 |
771 |
6.7% |
1.1% |
7.8% |
6.2% |
1.8% |
7.9% |
0.5% |
(0.7%) |
(0.1%) |
|
Residential Market Average |
123,543 |
688 |
5.9% |
0.9% |
6.8% |
5.5% |
0.8% |
6.3% |
0.4% |
0.0% |
0.5% |
Source: Cytonn Research
-
Detached Units Performance
The table below shows the NMA residential sector detached units’ performance during Q1’2026;
|
All values are in Kshs unless stated otherwise |
||||||||
|
Cytonn Report: Detached Units Summary Q1'2026 |
||||||||
|
Area |
Average of Price per SQM Q1'2026 |
Average of Rent per SQM Q1'2026 |
Average of Occupancy Q1'2026 |
Average of Uptake Q1'2026 |
Average of Annual Uptake Q1'2026 |
Average of Rental Yield Q1'2026 |
Average of Price appreciation Q1'2026 |
Total Returns |
|
High End |
||||||||
|
Runda |
253,422 |
1,117 |
97.7% |
98.0% |
8.4% |
5.3% |
2.0% |
7.3% |
|
Rosslyn |
187,853 |
898 |
91.2% |
87.0% |
8.8% |
5.3% |
0.0% |
5.3% |
|
Lower Kabete |
145,508 |
613 |
92.0% |
89.1% |
8.9% |
5.0% |
0.0% |
5.0% |
|
Karen |
190,695 |
744 |
92.1% |
93.4% |
11.0% |
4.4% |
0.5% |
4.9% |
|
Kitisuru |
204,278 |
780 |
89.4% |
87.8% |
8.8% |
4.2% |
0.0% |
4.2% |
|
Average |
196,351 |
830 |
92.5% |
91.0% |
9.2% |
4.8% |
0.5% |
5.3% |
|
Upper Middle |
||||||||
|
South B/C |
121,700 |
794 |
90.9% |
89.2% |
9.6% |
7.3% |
2.8% |
10.1% |
|
Redhill & Sigona |
97,513 |
546 |
87.6% |
70.0% |
7.7% |
6.3% |
0.1% |
6.5% |
|
Loresho |
147,392 |
756 |
90.2% |
89.1% |
9.4% |
5.6% |
0.3% |
5.9% |
|
Lavington |
190,490 |
629 |
88.4% |
87.4% |
8.4% |
3.6% |
0.7% |
4.3% |
|
Langata |
121,873 |
470 |
89.3% |
85.5% |
7.2% |
4.3% |
0.0% |
4.3% |
|
Runda Mumwe |
155,844 |
519 |
95.0% |
90.0% |
15.0% |
3.8% |
0.0% |
3.8% |
|
Average |
139,135 |
619 |
90.2% |
85.2% |
9.6% |
5.2% |
0.7% |
5.8% |
|
Lower Middle |
||||||||
|
Thika |
66,907 |
365 |
90.1% |
87.1% |
10.1% |
6.4% |
1.0% |
7.5% |
|
Syokimau/Mlolongo |
78,235 |
431 |
92.5% |
89.5% |
9.6% |
6.2% |
1.2% |
7.4% |
|
Donholm & Komarock |
95,363 |
431 |
89.6% |
92.9% |
9.3% |
5.0% |
1.9% |
6.9% |
|
Ngong |
78,497 |
360 |
95.1% |
84.4% |
8.3% |
5.6% |
0.6% |
6.1% |
|
Kitengela |
65,942 |
306 |
94.3% |
93.3% |
9.9% |
5.3% |
0.6% |
5.9% |
|
Athi River |
87,726 |
395 |
91.4% |
96.3% |
9.5% |
5.1% |
0.3% |
5.4% |
|
Rongai |
90,133 |
296 |
88.6% |
82.3% |
8.8% |
4.0% |
0.0% |
4.0% |
|
Average |
80,400 |
369 |
91.6% |
89.4% |
9.3% |
5.4% |
0.8% |
6.2% |
|
Grand Average |
138,629 |
606 |
91.5% |
88.5% |
9.4% |
5.1% |
0.7% |
5.8% |
source: Cytonn Research
The key take-outs from the table include;
-
Average Total Returns – The average total returns to detached units’ investors came in at 5.8%, 1.1% higher than the 4.7% recorded in Q1’2025. The performance was driven by a 0.2%-points increase in the average rental yield to 5.1% in Q1’2025, from 4.9% recorded in Q1’2025 coupled with 0.7% average price appreciation in Q1’2026. The increase in performance was attributable to a 0.2% increase in the average rents per SQM to Kshs 606 in Q1’2026, from Kshs 605 recorded in Q1’2025,
-
Segment Performance – The best-performing segment was the Lower-middle segment offering an average total return of 5.4%, attributable to a relatively high average price appreciation of 0.8%, 0.1%-points higher than the detached market average depreciation of 0.7%. The impressive performance of the segment was driven by returns from well-performing nodes such as Thika, Syokimau and Donholm, which have continued to offer relatively high returns to investors, and,
-
Nodal Performance – Overall, South B/C was the best-performing node, offering the highest returns at 10.1%, 4.3% points higher than the detached market average of 5.8%, driven by a relatively high rental yield of 7.3%. The node has seen increased detached unit property investments owing to an inflow of residents brought about by the enhanced accessibility to the Nairobi CBD through various roads such as Mombasa road and the Nairobi Express way. Also, the area enjoys proximity to various amenities such as the SGR and JKIA. Thika and Syokimau followed with an average total return of 1.3%, 1.2% points higher than the detached market average of 6.2%.
-
Apartments Performance
The table below shows the NMA residential sector apartments’ performance during Q1’2026;
|
All values are in Kshs unless stated otherwise |
||||||||
|
Cytonn Report: Residential Apartments Summary Q1'2026 |
||||||||
|
Area |
Average of Price per SQM Q1'2026 |
Average of Rent per SQM Q1'2026 |
Average of Occupancy Q1'2026 |
Average of Uptake Q1'2026 |
Average of Annual Uptake Q1'2026 |
Average of Rental Yield Q1'2026 |
Average of Price Appreciation |
Total Returns |
|
Lower Mid-End Satellite Towns |
||||||||
|
Athi River |
62,448 |
524 |
95.3% |
92.2% |
9.6% |
9.7% |
3.5% |
13.2% |
|
Kikuyu |
90,475 |
531 |
97.5% |
97.1% |
15.3% |
6.8% |
4.1% |
10.9% |
|
Ngong |
76,190 |
485 |
98.3% |
93.7% |
10.9% |
7.9% |
0.0% |
7.9% |
|
Rongai |
57,690 |
331 |
94.8% |
94.5% |
12.8% |
6.9% |
0.9% |
7.8% |
|
Thindigua |
106,451 |
556 |
89.3% |
87.1% |
11.0% |
5.7% |
1.7% |
7.3% |
|
Ruiru |
90,554 |
527 |
92.0% |
89.6% |
11.3% |
6.4% |
0.7% |
7.1% |
|
Ruaka |
113,224 |
593 |
93.1% |
91.5% |
13.0% |
5.9% |
0.9% |
6.8% |
|
Syokimau |
70,813 |
376 |
92.3% |
91.5% |
9.0% |
6.0% |
0.6% |
6.6% |
|
Average |
83,481 |
490 |
94.1% |
92.2% |
11.6% |
6.9% |
1.5% |
8.5% |
|
Lower Mid-End Suburbs |
||||||||
|
Dagoretti |
98,624 |
732 |
94.8% |
90.0% |
11.4% |
9.3% |
3.2% |
12.5% |
|
Race Course/Lenana |
97,997 |
638 |
96.5% |
96.7% |
13.2% |
7.5% |
1.6% |
9.2% |
|
Kahawa West |
91,726 |
495 |
94.8% |
90.8% |
6.6% |
6.2% |
2.5% |
8.7% |
|
Imara Daima |
87,911 |
360 |
96.3% |
91.3% |
8.8% |
4.8% |
2.0% |
6.8% |
|
Waiyaki Way |
146,133 |
505 |
92.9% |
93.6% |
12.8% |
5.8% |
0.4% |
6.2% |
|
South B |
109,010 |
516 |
93.9% |
98.5% |
12.1% |
5.5% |
0.7% |
6.1% |
|
Langata |
113,515 |
500 |
96.1% |
91.5% |
9.1% |
5.3% |
0.0% |
5.3% |
|
South C |
123,021 |
489 |
87.5% |
96.7% |
12.2% |
4.2% |
1.0% |
5.2% |
|
Average |
108,492 |
529 |
94.1% |
93.6% |
10.8% |
6.1% |
1.4% |
7.5% |
|
Upper Mid-End |
||||||||
|
Parklands |
126,755 |
942 |
93.1% |
86.2% |
9.1% |
8.3% |
0.3% |
8.6% |
|
Westlands |
156,657 |
3156 |
93.3% |
93.3% |
13.4% |
7.2% |
0.9% |
8.1% |
|
Kilimani |
111,389 |
750 |
95.7% |
93.1% |
14.3% |
7.9% |
0.0% |
7.9% |
|
Kileleshwa |
135,089 |
797 |
96.4% |
93.5% |
10.3% |
6.9% |
0.3% |
7.2% |
|
Upperhill |
137,095 |
817 |
81.3% |
83.4% |
7.8% |
6.0% |
(0.4%) |
5.6% |
|
Average |
133,397 |
1,292 |
92.0% |
89.9% |
11.0% |
7.3% |
0.2% |
7.5% |
|
Grand Average |
108,457 |
771 |
93.4% |
91.9% |
11.1% |
6.7% |
1.1% |
7.8% |
Source: Cytonn Research
The key take-outs from the table include;
-
Average Total Returns – The average total returns to apartments’ investors came in at 7.8%, recording a 0.2%-points decrease from the 8.0% recorded during Q1’2025. However, the performance was supported by a 0.5%-points increase in the average rental yield to 6.7% in Q1’2026, from 6.2% recorded in Q1’2025. This was driven by slight increase in apartment property transactions during the period, attributable to 1.4% points increase in the average occupancy to 93.4% in Q1’2026 from 92.0% in Q1’2025,
-
Segment Performance – The best-performing segment was the lower mid-end satellite towns with average total returns of 8.5%, attributed to a relatively high average y/y price appreciation of 1.5% and rental yield of 6.9%. The impressive performance of the segment was driven by returns from well-performing nodes such as Athi River, Kikuyu, and Ngong that have continued to offer competitive returns to investors in comparison to other segments, and
-
Nodal Performance – Overall, the best-performing node was Athi River, offering investors average total returns of 13.2%, 5.4%-points higher than the apartment market average total return of 7.8%. Athi River has become a top investment hub, attracting significant apartment developments, due to improved infrastructure like the Nairobi-Mombasa highway and SGR. The area attracts a growing middle class, offering easy access to the Nairobi CBD, essential amenities, and high-quality international schools, solidifying its status as a high-demand residential area.
Notable developments during Q1’2026;
-
President William Ruto presided over the launch of an affordable housing project in Kimilili, Bungoma County, as part of his broader Western Kenya development tour, reinforcing the government’s ongoing efforts to scale up the Affordable Housing Programme across the country. The initiative reflects a continued shift towards expanding housing delivery into emerging urban centres, with the Kimilili project forming part of a growing pipeline of developments aimed at increasing access to decent and affordable housing while supporting local economic activity. For more information, please see our Cytonn weekly #11.2026
For notable highlights during the quarter; please see our Cytonn Monthly – February 2026 and Cytonn Monthly – January 2026.
We have a NEUTRAL outlook for the NMA residential sector, we expect continued vibrant performance in the residential sector within the country sustained by; i)ongoing residential developments under the Affordable Housing Agenda, aiming to reduce the housing deficit in the country currently estimated at 80.0%, ii) increased investment from local and international investors in the housing sector, iii) favorable demographics in the country, shown by high population and urbanization rates of 3.8% p.a and 2.0% p.a, respectively, leading to higher demand for housing units. However, challenges such as rising construction costs, strain on infrastructure development, and limited access to financing will continue to restrict the optimal performance of the residential sector.
-
Commercial Office Sector
The table below highlights the performance of the Nairobi Metropolitan Area (NMA) Commercial Office sector over time;
|
(All Values in Kshs Unless Stated Otherwise) |
|||||||||
|
Cytonn Report: Nairobi Metropolitan Area (NMA) Commercial Office Returns Over Time |
|||||||||
|
Year |
H1'2024 |
Q3'2024 |
FY'2024 |
Q1'2025 |
H1'2025 |
Q3'2025 |
FY'2025 |
Q1’2026 |
∆ Q1'2025/Q1'2026 |
|
Occupancy % |
80.1% |
79.6% |
80.7% |
80.3% |
80.9% |
82.4% |
83.1% |
84.7% |
4.4% |
|
Asking Rents (Kshs/SQFT) |
103 |
104 |
104.8 |
105 |
105 |
105 |
105.3 |
111 |
5.7% |
|
Average Prices (Kshs/SQFT) |
12,677 |
12,677 |
12,614 |
12,614 |
12,673 |
12,681 |
12,699 |
12,718 |
0.8% |
|
Average Rental Yields (%) |
7.7% |
7.7% |
7.8% |
7.6% |
7.7% |
7.8% |
7.8% |
8.9% |
1.3% |
Source: Cytonn Research
The key take-outs from the table include
-
Average Asking Rents – In Q1’2026, average asking rents per SQFT in the Nairobi Metropolitan Area (NMA) increased by 5.7% to Kshs 111 per SQFT from Kshs 105 per SQFT in Q1’2025. This performance can be attributable to addition of new Grade A offices to the pipeline; including Eneo at Tatu City, The Mandrake, Matrix One, thereby driving up the asking rents for commercial office spaces.
-
Average Occupancy Rate – In Q1’2026, commercial office occupancy showed an improvement in performance by 4.4%-points to 84.7% from 80.3% achieved in Q1’2025.
-
Average Rental Yield – The average rental yields showed resilience with 1.3%-points increase in average rental yields in Q1’2026 to 8.9%, from 7.6% recorded in Q1’2025 attributable to increased occupancy and rental rates.
For submarket performance, Westlands and Kilimani emerged as the top performers, achieving an average rental yield of 9.8% and 9.3% respectively in Q1’2026, surpassing the market average of 8.5%. This performance can be attributed to several factors: i) These locations feature a high concentration of top-tier office buildings that command premium rental rates and yields, ii) Landlords in these areas often prefer to collect rent in dollars, enhancing the investment appeal, iii) Well-developed infrastructure and abundant amenities add significant value to investments in these locations, iv) The presence of multinational corporations, and international organizations increases the demand for high-quality office spaces.
In contrast, Thika Rd was the least performing node with an average rental yield of 7.7% in Q1’2026, 0.8% points lower than the market average of 8.5%. This lower performance can be attributed to: i) The high prevalence of lower-quality office buildings in this area leads to lower average rental rates, typically around Kshs 96 per SQFT as compared to an average of Kshs 108 per SQF , ii) Thika Road is predominantly recognized as a residential zone, reducing its attractiveness to office-based businesses seeking commercial spaces, iii) Intense competition from other sub-markets further compounds the challenges Thika Road faces in attracting tenants and achieving higher rental yields. The table below displays the performance of sub-markets in the Nairobi Metropolitan Area (NMA).
|
All values in Kshs unless stated otherwise |
|||||||||||
|
Cytonn Report: Nairobi Metropolitan Area Commercial Office Market Performance Q1’2026 |
|||||||||||
|
Area |
Price/SQFT Q1’2025 |
Rent/SQFT Q1’2025 |
Occupancy Q1’2025 |
Rental Yields Q1’2025 |
Price Kshs/ SQFT Q1’2026 |
Rent Kshs/ SQFT Q1’2026 |
Occupancy Q1’2026 |
Rental Yield Q1’2026 |
∆ in Rent |
∆ in occupancy |
∆ in Rental Yields (% points) |
|
Westlands |
12,448 |
119 |
81.5% |
8.7% |
12,370 |
124 |
82.2% |
9.8% |
(0.6%) |
4.2% |
1.1% |
|
Kilimani |
12,873 |
101 |
82.7% |
8.2% |
13,565 |
120 |
87.1% |
9.3% |
5.4% |
18.8% |
1.1% |
|
Parklands |
11,922 |
94 |
83.0% |
7.8% |
12,066 |
106 |
86.9% |
9.2% |
1.2% |
12.8% |
1.4% |
|
Nairobi CBD |
12,206 |
92 |
86.6% |
7.9% |
12,441 |
100 |
88.4% |
8.5% |
1.9% |
8.7% |
0.6% |
|
Gigiri |
14,850 |
131 |
82.6% |
8.8% |
14,950 |
126 |
82.2% |
8.4% |
0.7% |
(3.8%) |
(0.4%) |
|
Karen |
14,077 |
115 |
80.3% |
8.1% |
14,225 |
115 |
84.3% |
8.1% |
1.1% |
0.0% |
0.0% |
|
Upperhill |
12,857 |
104 |
73.2% |
6.5% |
13,086 |
102 |
85.4% |
7.9% |
1.8% |
(1.9%) |
1.4% |
|
Mombasa Rd |
11,325 |
80 |
72.2% |
6.5% |
11,065 |
87 |
80.1% |
7.7% |
(2.3%) |
8.8% |
1.2% |
|
Thika Road |
12,643 |
90 |
71.7% |
6.1% |
12,650 |
96 |
84.5% |
7.7% |
0.1% |
6.7% |
1.6% |
|
Average |
12,614 |
105 |
80.3% |
7.6% |
12,935 |
108.4 |
84.6% |
8.5% |
2.5% |
3.2% |
0.9% |
Source: Cytonn Research
In Q1’2026, there was one notable highlight;
-
Co-working space provider Kofisi closed two of its Nairobi locations, Karen and Upper Hill, following a Kshs 416.7 mn (USD 3.2 mn) loss in 2024, reversing a profit of Kshs 2.3 bn (USD 16.3 mn) in 2023. The London-based company aims to focus on larger, higher-capacity sites to enhance client experience through community spaces, better services, and economies of scale. Despite the loss, Kofisi’s revenues rose 24.5% to Kshs. 1.4 bn (USD 10.3 mn) in 2024, supported by high occupancy rates averaging above 90% across its offices. Kenya remains Kofisi’s largest market in Africa, accounting for Kshs 1.0 bn (USD 7.6 mn) or 74.4% of its 2024 revenue. For more information please see our Cytonn Weekly #01/2026.
We maintain a NEUTRAL outlook on the Nairobi Metropolitan Area (NMA) commercial office sector, impacted by several key dynamics: i) the increasing presence of multinational companies in Kenya is likely to drive up occupancy levels, ii) the increasing trend of co-working spaces, iii) more start-ups are expected to drive demand for commercial spaces, and iv) a considerable take-up of prevailing commercial office spaces after developers adopted a 'wait-and-see' approach to avoid vacancies in newly built spaces, However, the sector continues to face challenges due to a significant oversupply of office space, currently standing at 3.4 mn SQFT. Despite these challenges, there are attractive investment opportunities in areas such as Westlands, Kilimani, and Parklands, which offer returns that exceed the market average.
-
Retail Sector
The table below shows the performance of the retail sector performance in Nairobi Metropolitan Area from Q1’2024 to Q1’2026;
|
(All values in Kshs unless stated otherwise) |
||||||||||
|
Item |
Q1'2024 |
Q3'2024 |
FY'2024 |
Q1'2025 |
Q2’2025 |
H1'2025 |
Q3’2025 |
FY'2025 |
Q1'2026 |
Y/Y 2026 ∆ |
|
Average Asking Rents (Kshs/SQFT) |
180.0 |
184.7 |
182.5 |
182.5 |
183.5 |
185.5 |
185.5 |
182.4 |
184.0 |
0.8% |
|
Average Occupancy (%) |
79.3% |
81.4% |
82.0% |
81.8% |
83.2% |
83.3% |
84.6% |
85.5% |
87.2% |
5.4% |
|
Average Rental Yields |
8.1% |
8.2% |
8.4% |
8.3% |
8.4% |
8.5% |
8.1% |
8.9% |
8.9% |
0.6% |
Source: Cytonn Research
The key take-outs from the table include;
-
Average Occupancy Rate - In Q1’2026, the retail sector witnessed a notable uptick in average occupancy rates, increasing by 5.4%-points to reach 87.2%, compared to the 81.8% recorded in the same period of 2025. This surge can be attributed to several key factors: i) vigorous expansion endeavors undertaken by both domestic and international retailers such as Naivas, QuickMart, Carrefour, and Magunas, ii) sustained demand for consumer goods and services, buoyed by favorable demographic trends, iii) adaptation to evolving market dynamics, exemplified by initiatives like Jaza Stores and Carrefour allowing purchases to be made online via platforms like Whatsapp, aligning with shifting consumer preferences, and, iv) ongoing improvements in infrastructure not only bolstering existing retail spaces but also unlocking new regions for retail growth opportunities, thus broadening the scope of the sector's expansion,
-
Asking Rents - In Q1’2026, there was a notable surge in average rental rates per SQFT, climbing by 0.8% to Kshs 184.0, up from Kshs 182.5 in Q1’2025. This increase was driven by several key factors: i) the continued demand for premium retail spaces in strategic areas within the Nairobi Metropolitan Area (NMA), such as Karen, Kilimani, Westlands, and along Kiambu and Limuru roads. These locations, known for their quality offerings, attracted both local and foreign businesses seeking proximity to multinational organizations and embassies, serving an international clientele, ii) a limited supply of new retail space in prime locations, tightening availability and boosting demand for existing space, iii) continued recovery in consumer footfall and retail activity following economic stabilization efforts, and iv) the entry of renowned global brands like Adidas, Puma, Michael Kors, and Aldo into the Kenyan market, competing for prime retail spaces and further driving up rental rates, and,
-
Average Rental Yield- The average rental yield for the NMA retail sector improved by 0.6%-points to 8.9% in Q1’2026, from 8.3% in Q1’2025, as a result of improved asking rents and occupancy rates.
In terms of sub-market performance Kilimani, Mombasa Road, and Karen demonstrated impressive average rental yields of 9.7%, 9.7%, and 9.4% respectively, outpacing the overall market average of 8.9%. This strong performance was largely driven by the increased demand for retail offerings in the above locations, as well as the presence of top-tier retail spaces commanding higher rents, coupled with the provision of quality infrastructure services enhancing the attractiveness for both tenants and customers. Conversely, retail spaces in Satellite towns reported the lowest average rental yield at 7.4%, influenced by several factors: i) rental rates significantly below the market average of Kshs 184 per SQFT, standing at Kshs 142 per SQFT resulting from the presence of lower quality spaces in the region, ii) inadequate infrastructure across most towns within the region, hindering accessibility and sustainability for retail spaces, and, iii) the prevalence of informal retail spaces and service stations, offering competitive rates and diverse amenities, intensifying market competition and impacting demand.
The following table illustrates the submarket performance of nodes within the Nairobi Metropolitan Area (NMA) in Q1’2025;
|
(All values in Kshs unless stated otherwise) |
||||||||||
|
Nairobi Metropolitan Area Retail Market Performance Q1'2026 |
||||||||||
|
Area |
Prices Kshs /SQFT Q1'2026 |
Rent Kshs /SQFT Q1'2026 |
Occupancy% Q1'2026 |
Rental Yield Q1'2026 |
Rent Kshs /SQFT Q1'2025 |
Occupancy% Q1’2025 |
Rental Yield Q1’2025 |
∆ in Rental Rates |
∆ in Occupancy (% points) |
∆ in Rental Yield (% points) |
|
Kilimani |
20,000 |
186 |
86.4% |
9.7% |
198 |
82.2% |
9.8% |
(5.9%) |
4.2% |
(0.1%) |
|
Mombasa road |
20,000 |
180 |
89.9% |
9.7% |
169 |
85.0% |
8.6% |
6.8% |
4.9% |
1.1% |
|
Karen |
24,800 |
212 |
92.2% |
9.4% |
218 |
90.9% |
9.9% |
(2.8%) |
1.3% |
(0.5%) |
|
Kiambu road & Limuru Road |
20,000 |
187 |
84.5% |
9.4% |
205 |
76.3% |
8.7% |
(8.9%) |
8.2% |
0.7% |
|
Ngong Road |
24,263 |
204 |
88.5% |
8.9% |
181 |
86.2% |
8.7% |
13.1% |
2.4% |
0.3% |
|
Westlands |
24,071 |
206 |
82.9% |
8.7% |
213 |
79.4% |
7.6% |
(3.0%) |
3.5% |
1.1% |
|
Thika Road |
22,291 |
181 |
87.5% |
8.3% |
155 |
77.7% |
7.4% |
16.4% |
9.8% |
0.9% |
|
Eastlands |
20,500 |
159 |
87.2% |
8.2% |
146 |
78.1% |
7.3% |
9.1% |
9.1% |
0.9% |
|
Satellite towns |
20,200 |
142 |
87.6% |
7.4% |
139 |
82.8% |
7.2% |
2.2% |
4.8% |
0.2% |
|
Average |
21,792 |
184 |
87.2% |
8.9% |
182 |
81.8% |
8.3% |
3.0% |
5.3% |
0.6% |
Source: Cytonn Research
For notable highlights during the quarter; please see our Cytonn Monthly – February 2026 and Cytonn Monthly – January 2026.
We maintain a NEUTRAL outlook on the retail sector’s performance, which is anticipated to be influenced by several key drivers: i) continued aggressive expansion efforts by both local and foreign retailers, as they seek to secure new and existing spaces to capitalize on evolving consumer preferences and market dynamics, ii) ongoing advancements in public infrastructure, including road and railway projects, are expected to enhance accessibility to new areas for retail investments, stimulating further growth opportunities, and, iii) positive demographic trends, characterized by a growing population, are anticipated to underpin increasing demand for retail goods and services. However, the sector's growth momentum may face headwinds from certain negative factors, including: i) escalating adoption of e-commerce by retailers, which continues to erode traditional occupier demand for physical retail spaces, necessitating innovative strategies to adapt to changing consumer shopping habits, and, ii) limited access to and expensive financing from financial institutions for retail developments, coupled with the imperative for small and medium-sized enterprises (SMEs) to invest in technological advancements to enhance operational efficiency and competitiveness in the market.
-
Hospitality Sector
Key highlights during the week include:
During the week, restaurant chain Java House announced the opening of a new outlet at Trafford Park in Syokimau, Machakos County, as part of its expansion strategy targeting high-growth urban nodes within the Nairobi Metropolitan Area. The new branch brings the total number of Java House outlets in East Africa to 105, reflecting continued expansion across Kenya, Uganda, and Ethiopia.
The move aligns with the firm’s strategy of positioning itself within rapidly urbanising residential and commercial hubs supported by infrastructure development, particularly along key transit corridors such as Syokimau, which has experienced significant growth driven by the Standard Gauge Railway (SGR) terminus and improved connectivity via the Nairobi Expressway. The area has also recorded strong real estate performance, with rental occupancy rising to over 90.0% in 2024 from 70.0% in 2020, indicating increasing demand supported by population growth and rising incomes.
We expect continued investment by hospitality operators in such nodes to boost real estate activity by increasing demand for retail and mixed-use developments, enhancing property values, and improving the attractiveness of satellite towns within the Nairobi Metropolitan Area.
Key highlights during Q1’2026 include:
-
Airlines began auditing the financial impacts of the strike by Kenya Aviation Workers Union (KAWU) which disrupted operations at Jomo Kenyatta International Airport, affecting seven carriers, leading to aircraft groundings, flight cancellations, and passenger refunds. Jambojet operated 23 return flights out of the scheduled 64 return flights between Monday and Tuesday, with approximately 5,000 passengers affected over the two days. For more information please see our Cytonn Weekly #07/2026, and,
-
Smartwings Airlines begun direct charter flights from Budapest, Hungary, to Mombasa, Kenya, reflecting growing interest in Kenya’s coastal tourism from Eastern Europe. The inaugural flight, carrying 183 passengers, was welcomed on 29th December 2025 highlighting Kenya’s effort to boost tourism. The Hungary-Mombasa route operates through a partnership with tour companies Private Safaris and iBUSZ, targeting travelers seeking beach holidays and wildlife experiences. While arrivals from Eastern Europe remain lower than from Western Europe, this new route indicates potential growth in regional tourism. For more information please see our Cytonn Weekly #01/2026.
We maintain a POSITIVE outlook for the hospitality sector, supported by several key drivers: i) aggressive marketing campaigns promoting Kenya’s tourism, expected to boost tourist arrivals and improve occupancy rates at hospitality venues, ii) international recognition of Kenya’s tourism industry, enhancing its status as a leading tourist destination and drawing more global visitors, iii) strategic partnerships within the tourism sector, fostering innovation and collaboration to capitalize on new opportunities, iv) events and initiatives aimed at increasing tourism activity and improving guest experiences. However, while the sector demonstrated resilience in its overall performance in 2025, the outlook remains cautiously optimistic. Kenya continues to face significant competition from neighboring markets, such as Rwanda, which employs aggressive promotional strategies, alongside Zanzibar, Tanzania, and South Africa. These regions actively position themselves as attractive alternatives, challenging Kenya's market share in the region. Additionally, Kenya’s hospitality sector remains vulnerable to the impacts of negative travel advisories issued during times of crisis, resulting in reduced international visitor numbers.
-
Land Sector
During the period under review, the land sector in Nairobi Metropolitan Area (NMA) recorded a price appreciation of 1.9% to Kshs 136.7 mn from 134.1 mn. This performance was supported by;
-
The increasing demand for land within the Nairobi Metropolitan Area (NMA) is largely fueled by population growth, as people from across the country relocate each year in pursuit of employment, education, and better opportunities,
-
The limited availability of land has heightened demand, especially for residential and commercial use, resulting in a steady rise in land prices,
-
The expanding middle-income population in the NMA, with higher disposable incomes, is increasingly viewing land as a viable investment and wealth preservation option,
-
Ongoing government investment in infrastructure, such as roads, sewer systems, railways, and water supply, has enhanced accessibility to satellite towns, thereby pushing land prices upward,
-
The strong perception among the middle class that land is a secure and appreciating asset has encouraged many households to deliberately save towards land ownership, and,
-
The government’s Affordable Housing Program under the Bottom-Up Economic Transformation Agenda (BETA) has spurred construction activity across Nairobi and other regions, contributing to increased land values.
Overall Performance:
Serviced land in Satellite Towns registered the highest capital appreciation during the period under review, with an annual capital appreciation of 4.8%, where the average selling price rose to Kshs 19.3 mn from Kshs 20.2 mn recorded in Q1’2025. The performance in this segment can be attributed to several factors: i) relatively lower prices, with the average selling prices at Kshs 20.2 mn compared to the market average of Kshs 136.7 mn in the Nairobi Metropolitan Area (NMA), ii) a growing middle class willing to invest in Satellite Towns as they settle their families, iii) the price increases once various services are introduced in the areas therefore high demand, and iv) the desire to settle in areas free from the city's hustle .On the other hand, land in Nairobi High End Suburbs under the Low and High Rise Areas recorded the least movement with an annual capital appreciation of 1.2%, below the market average of 1.9%. This was mainly due to the high selling prices, which averaged Kshs 138.9 mn, relatively higher than the market average of Kshs 136.7 mn. The table below shows the overall performance of the sector across all land sub-sectors during Q1’2026;
|
|
Q1'2025 |
Q1'2026 |
Annualized Capital Appreciation |
|
Serviced Land - Satelllite Towns |
19.3 mn |
20.2 mn |
4.8% |
|
Un-serviced land - Satellite Towns |
17.1 mn |
17.6 mn |
3.1% |
|
Nairobi Middle End Suburbs- High Rise Residential Areas |
80.4 mn |
82.6 mn |
2.7% |
|
Nairobi Suburbs- Commercial Areas |
416.5 mn |
424.4 mn |
1.9% |
|
Nairobi High End Suburbs (Low and High Rise Areas) |
137.3 mn |
138.9 mn |
1.2% |
|
Average |
134.1 mn |
136.7 mn |
1.9% |
Source: Cytonn Research
Sub-markets Performance – For the unserviced satellite towns Utawala, Limuru, and Juja emerged as the best-performing nodes with annualized capital appreciation of 4.6%, 4.5% and 3.2%, respectively. This performance can be attributed to: i) good transport network connecting these areas to Nairobi ii) a rising middle class looking to settle in these areas, iv) good proximity to retail centers such as malls, and v) relatively affordable prices compared to the market average. Additionally, land in unserviced towns presents a good opportunity for speculative investors, who invest in anticipation of price appreciation. On the other hand, high end suburbs (low and high rise ) in Nairobi’s Suburbs registered the least average price movement, with Kileleshwa recording a deppreciation of 0.4%. The commercial zones segment had the highest price per acre, with the average selling price coming in at Kshs 424.4 mn, significantly higher than the market average of Kshs 136.7 mn. Notably, some areas in this segment, such as Kilimani, are witnessing an influx of high-rise apartments, which has made them less attractive. The table below shows NMA’s land performance by submarkets in Q1’2026;
|
Price in Kshs per Acre |
|||
|
Cytonn Report: Nairobi Metropolitan Area Land Performance By Submarkets – Q1’2026 |
|||
|
Location |
Price Q1'2025 |
Price Q1'2026 |
Capital Appreciation |
|
Satellite Towns - Unserviced Land |
|||
|
Utawala |
17.4 mn |
18.2 mn |
4.6% |
|
Limuru |
25.4 mn |
26.5 mn |
4.5% |
|
Juja |
15.5 mn |
16.0 mn |
3.2% |
|
Rongai |
18.3 mn |
18.5 mn |
1.1% |
|
Athi River |
8.9 mn |
8.9 mn |
0.3% |
|
Average |
17.1 mn |
17.6 mn |
3.1% |
|
Satellite Towns - Serviced Land |
|||
|
Syokimau |
18.5 mn |
19.3 mn |
4.3% |
|
Ruiru & Juja |
29.0 mn |
30.1 mn |
4.0% |
|
Athi River |
17.4 mn |
18.1 mn |
3.6% |
|
Rongai |
20.6 mn |
21.2 mn |
3.0% |
|
Ruai |
12.4 mn |
12.5 mn |
0.3% |
|
Average |
19.3 mn |
20.2 mn |
4.8% |
|
Nairobi High End Suburbs (Low- and High-Rise Areas) |
|||
|
Kitisuru |
92.5 mn |
98.0 mn |
6.0% |
|
Karen |
63.6 mn |
67.8 mn |
6.6% |
|
Spring Valley |
168.3 mn |
172.4 mn |
2.5% |
|
Runda |
90.2 mn |
92.5 mn |
2.5% |
|
Ridgeways |
86.4 mn |
87.1 mn |
0.7% |
|
Kileleshwa |
316.8 mn |
315.4 mn |
(0.4%) |
|
Average |
137.3 mn |
138.9 mn |
1.2% |
|
Nairobi Middle End Suburbs – High Rise Residential Areas |
|||
|
Kasarani |
74.4 mn |
78.3 mn |
5.2% |
|
Dagoretti |
91.1 mn |
93.9 mn |
3.1% |
|
Embakasi |
75.8 mn |
75.5 mn |
(0.4%) |
|
Average |
80.4 mn |
82.6 mn |
2.7% |
|
Nairobi Suburbs - Commercial Zones |
|||
|
Westlands |
433.2 mn |
447.2 mn |
3.2% |
|
Upperhill |
471.4 mn |
486.1 mn |
3.1% |
|
Riverside |
347.1 mn |
349.7 mn |
0.7% |
|
Kilimani |
414.3 mn |
414.5 mn |
0.0% |
|
Average |
416.5 mn |
424.4 mn |
1.9% |
Source: Cytonn Research
We maintain a POSITIVE outlook for the land sector in the Nairobi Metropolitan Area (NMA), considering it a dependable investment opportunity that has shown improving performance year on year. Going forward, we expect the sector's performance to be driven by several factors: i) government efforts to streamline land transactions through innovative solutions such as Ardhi Sasa, ii) continued activities by players on both the demand and supply sides, iii) growing demand for land driven by positive demographics, iv) the launch of infrastructure development projects opening up satellite towns for investment opportunities, and v) the continued rollout of the Affordable Housing Program (AHP) by the government, driving further demand for land.
-
Infrastructure Sector
During the week, Shengli Engineering Construction (Group) Company Limited, a Chinese firm affiliated with Sinopec Petroleum Engineering, was awarded a Kshs 4.1 bn contract to upgrade the 44 km Uplands-Githunguri-Ruiru (B116) road to bitumen standards. The project, which is set to start on March 18, 2026, and run until April 2030, will link the Nairobi-Nakuru Highway at Uplands with the Nairobi-Thika Superhighway at Ruiru, creating a strategic transport corridor within the Nairobi metropolitan region.
The works include surfacing, drainage, and supporting infrastructure, aimed at improving the movement of people and goods, supporting agricultural activity, and unlocking real estate development along the corridor. The contract comes amid continued government investment in roads despite fiscal pressures, complementing other projects in the Mount Kenya region, such as the Rumuruti-Nanyuki road and the Thika-Magumu road, the latter being implemented by H Young & Company under a Sh3.4 bn tender.
Once completed, the upgraded B116 road is expected to ease congestion in Nairobi by offering an alternative route, while also presenting new traffic safety considerations for the corridor.
Key highlights during Q1’2026;
-
The government initiated a road infrastructure project following the award of a Kshs 2.5 bn contract by the Kenya National Highways Authority (KENHA) for the tarmacking of the Rumuruti-Nanyuki road. The project forms part of ongoing efforts to improve road connectivity across secondary urban corridors, focusing on enhancing accessibility within Laikipia County and strengthening linkages between towns such as Rumuruti and Nanyuki. Please see our Cytonn Weekly #12/2026,
-
The government announced that the expansion of Jomo Kenyatta International Airport (JKIA) will be the first project financed under the proposed National Infrastructure Fund. The fund, created under the National Infrastructure Fund Bill, aims to provide a new financing model for large national infrastructure projects. It comes after the cancellation of a previous public-private partnership proposal with Adani Group, which faced criticism over transparency and procurement concerns. Please see our Cytonn Weekly #10/2026,
-
The National Treasury and Kenya Railways Corporation (KRC) ramped up the expansion of the Standard Gauge Railway (SGR) from Naivasha to Malaba via Kisumu, with the Treasury allocating an additional Kshs 14.0 bn. This brings the total allocation for the current financial year to Kshs 30.0 bn, complementing a broader financing plan that includes a Kshs 390.0 bn securitized bond and foreign investment. Please see our Cytonn Weekly #09/2026,
-
The Kenya Urban Roads Authority (KURA) commenced implementation of the Kshs 7.6 bn Outer Ring Road Bus Rapid Transit (BRT) Line 5 project, with contract signing for the 10.5 kilometer corridor from Allsops to Taj Mall completed on 4th March 2026. The project, which will feature a two-lane dedicated bus corridor, 13 BRT stations, three river bridges, two overpasses, footbridge modifications, street lighting, landscaping, and drainage works, is expected to be completed within two year. Please see our Cytonn Weekly #09/2026,
For more notable highlights during the quarter please see our Cytonn Monthly - February 2026 and Cytonn Monthly - January 2026 reports.
We maintain a POSITIVE outlook for the infrastructure sector. We anticipate continued government efforts to advance infrastructure development across Kenya, particularly in the roads and transport sector, in line with the Bottom-Up Economic Transformation Agenda (BETA) and broader economic stimulus objectives. These enhancements are expected to facilitate the more efficient movement of people, goods, and services, thereby reducing logistics costs, stimulating economic activity, and increasing demand for real estate in previously underserved remote areas and satellite towns. Our optimistic stance is supported by several key developments: i) The launch of the National Infrastructure Fund and Sovereign Wealth Fund, designed to channel resources into priority projects with minimal additional public debt, primarily through privatization proceeds; such as the planned IPO of Kenya Pipeline Company; ii) The anticipated mid-2026 commencement of construction on the Nairobi–Mombasa Usahihi Expressway, a flagship PPP project; iii) The 2026 launch of the Naivasha–Narok–Kisumu–Malaba extension of the Standard Gauge Railway (SGR), establishing a modern logistics corridor across East and Central Africa; iv) Accelerated progress on PPPs for the Rironi–Mau Summit highway; v) The 2025 clearance of Kshs 123 bn in pending bills, which restored contractor confidence; vi) Anticipated construction of a new world-class terminal at Jomo Kenyatta International Airport (JKIA) to solidify Kenya’s position as East Africa’s premier aviation hub; vii) Ongoing modernization of Mombasa and Lamu ports under the LAPSSET corridor initiative; and, viii) Expected completion of the Talanta Sports Complex and Bomas International Convention Centre, enhancing sports and MICE tourism infrastructure. Nevertheless, the sector continues to face longstanding challenges that could temper progress if not effectively managed. These include the recent cancellation of the U.S. government’s Millennium Challenge Corporation (MCC) Threshold Program grant, persistent delays in project execution, land acquisition disputes, cost overruns, a weak culture of infrastructure maintenance, and lingering reliance on debt-financed models. Addressing these headwinds will be critical to fully realizing the sector’s transformative potential.
-
Real Estate Investments Trusts (REITS)
-
Acorn plans to transfer assets worth Kshs 4.5 bn to it’s affiliate
During the week, property developer Acorn announced plans to transfer three completed student accommodation assets valued at Kshs 4.5 bn from its Development REIT (D-REIT) to its Investment REIT (I-REIT) in 2026, as part of a strategy to deleverage amid elevated financing costs. The assets earmarked for transfer include Qwetu and Qejani Karen, located near the Catholic University of Eastern Africa, and Qwetu Chiromo, valued at Kshs 1.4 bn, Kshs 0.9 bn, and Kshs 2.2 bn respectively as at June 2025. The D-REIT, which focuses on developing purpose-built student accommodation using debt financing, typically exits completed assets to the I-REIT to recycle capital and fund new developments.
The I-REIT, which holds stabilised income-generating assets, is expected to increase its bed capacity to 6,656 from 4,500, following the acquisition, enhancing its rental income base. However, occupancy levels have softened, with portfolio occupancy declining to 81.0% in June 2025 from 88.0% in June 2024, attributable to weaker uptake in select locations such as Jogoo Road, Parklands, and Ruaraka.Despite this, Acorn’s combined REIT portfolio recorded a 9.4% growth in net earnings to Kshs 1.52 bn in FY’2025, supported by increased rental income from newly operational units. Notably, the D-REIT continues to face rising finance costs, which surged to Kshs 865.0 mn from Kshs 312.8 mn, underscoring the urgency of its debt reduction strategy, with management indicating a shift in 2026 focus from expansion to balance sheet consolidation.
-
Property Investors seek stamp duty relief for REITS
During the week, real estate stakeholders called on the government to reinstate stamp duty exemptions on Real Estate Investment Trust (REIT) asset transfers, citing increased transaction costs as a key impediment to the sector’s growth. The appeal, made during the 2026 African REITs Conference in Naivasha, follows the lapse of the exemption in December 2022, which has since subjected REIT asset transfers to stamp duty of 4.0% in urban areas and 2.0% in rural areas, significantly raising the cost of asset acquisition.
Industry players noted that reinstating the exemption would enhance the attractiveness of REITs as an alternative investment vehicle, lower barriers to entry, and improve liquidity in the property market. This comes as the Kenyan REIT market has demonstrated strong growth, with market capitalization nearly tripling to Kshs 24.6 bn from Kshs 9.8 bn in 2021, highlighting increasing investor appetite for structured real estate products. Additionally, stakeholders advocated for improved regulatory transparency and reduced minimum investment thresholds to make REITs more accessible to retail investors. Despite existing tax advantages such as exemptions from corporate income tax and VAT, REIT distributions remain subject to a 5.0% withholding tax, while high minimum investment requirements, typically around Kshs 5.0 mn, continue to limit participation to high-net-worth individuals.
We expect that reducing stamp duty on REIT asset transfers will enhance the sector’s attractiveness, lower transaction costs, and drive increased investor participation, ultimately supporting the growth and depth of Kenya’s REIT market.
-
ILAM Fahari I-REIT’s , Acorn’s I-REIT and D-REIT FY’2025 performance
During the week, Acorn Holdings released their FY’2025 financial results for the Acorn D-REIT and I-REIT. Also, during the week, ILAM Fahari I-REIT’s their FY’2025 financial results. Below is a summary of the ILAM Fahari I-REIT’s FY’2025 Performance;
The chart below shows the comparison of REITs yield performance versus other assets.
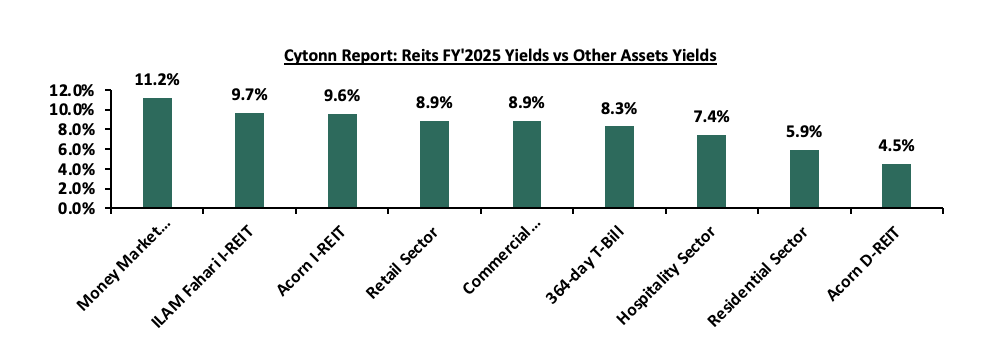
On the Unquoted Securities Platform Acorn D-REIT and I-REIT traded at Kshs 27.4 and Kshs 23.2per unit, respectively, as per the last updated data on 2nd April 2026. The performance represented a 33.4% and 14.5% gain for the D-REIT and I-REIT, respectively, from the Kshs 20.0 inception price. The volumes traded for the D-REIT and I-REIT came in at 13.4 mn and 42.2 mn shares, respectively. Additionally, ILAM Fahari I-REIT traded at Kshs 11.0 per share as of 13th March, representing a 45.0% loss from the Kshs 20.0 inception price. The volume traded to date came in at 1.2 mn shares for the I-REIT, REITs offer various benefits, such as tax exemptions, diversified portfolios, and stable long-term profits. However, the ongoing decline in the performance of Kenyan REITs and the restructuring of their business portfolios are hindering significant previous investments. Additional general challenges include:
-
Insufficient understanding of the investment instrument among investors leading to a slower uptake of REIT products,
-
Lengthy approval processes for REIT creation,
-
High minimum capital requirements of Kshs 100.0 mn for REIT trustees compared to Kshs 10.0 mn for pension funds Trustees, essentially limiting the licensed REIT Trustee to banks only
-
The rigidity of choice between either a D-REIT or and I-REIT forces managers to form two REITs, rather than having one Hybrid REIT that can allocate between development and income earning properties
-
Limiting the type of legal entity that can form a REIT to only a trust company, as opposed to allowing other entities such as partnerships, and companies,
-
We need to give time before REITS are required to list – they would be allowed to stay private for a few years before the requirement to list given that not all companies maybe comfortable with listing on day one, and,
-
Minimum subscription amounts or offer parcels set at Kshs 0.1 mn for D-REITs and Kshs 5.0 mn for restricted I-REITs. The significant capital requirements still make REITs relatively inaccessible to smaller retail investors compared to other investment vehicles like unit trusts or government bonds, all of which continue to limit the performance of Kenyan REITs.
For more notable highlights during the quarter please see our Cytonn Monthly - February 2026 and Cytonn Monthly - January 2026 reports.
We expect Kenya’s Real Estate sector to remain on a growth trend, supported by: i) demand for housing sustained by positive demographics, such as urbanization and population growth rates of 3.8% p.a and 2.0% p.a, respectively, against the global average of 1.7% p.a and 0.9% p.a, respectively, as at 2023,, ii) activities by the government under the Affordable Housing Program (AHP) iii) heightened activities by private players in the residential sector iv) increased investment by local and international investors in the hospitality and industrial sector,v) improved infrastructure throughout the country. However, challenges such as rising construction costs, strain on infrastructure development (including drainage systems), high capital requirements for REITs, and existing oversupply in select Real Estate sectors will continue to hinder the sector’s optimal performance by limiting developments and investments.
Real Estate Performance Summary and Outlook
Below is a summary of the sectorial performance in Q1’2026 and investment opportunities:
|
Theme |
Cytonn Report: Thematic Performance and Outlook Q1’ 2026 |
Outlook |
|
Residential |
· The average rental yield came in at 5.9% in Q1’2026, recording a 0.4%-points increase from the 5.5% rental yield recorded in Q1’2025. |
Neutral |
|
· We have a NEUTRAL outlook for the NMA residential sector, we expect continued vibrant performance in the residential sector within the country sustained by; i)ongoing residential developments under the Affordable Housing Agenda, aiming to reduce the housing deficit in the country currently estimated at 80.0%, ii) increased investment from local and international investors in the housing sector, iii) favorable demographics in the country, shown by high population and urbanization rates of 3.8% p.a and 2.0% p.a, respectively, leading to higher demand for housing units. However, challenges such as rising construction costs, strain on infrastructure development, and limited access to financing will continue to restrict the optimal performance of the residential sector.
|
||
|
Commercial Office |
· The average rental yields showed resilience with 1.3%-points increase in average rental yields in Q1’2026 to 8.9%, from 7.6% recorded in Q1’2025 |
Neutral |
|
· We maintain a NEUTRAL outlook on the Nairobi Metropolitan Area (NMA) commercial office sector, impacted by several key dynamics: i) the increasing presence of multinational companies in Kenya is likely to drive up occupancy levels, ii) the increasing trend of co-working spaces, iii) more start-ups are expected to drive demand for commercial spaces, and iv) a considerable take-up of prevailing commercial office spaces after developers adopted a 'wait-and-see' approach to avoid vacancies in newly built spaces, However, the sector continues to face challenges due to a significant oversupply of office space, currently standing at 3.4 mn SQFT. Despite these challenges, there are attractive investment opportunities in areas such as Westlands, Kilimani, and Parklands, which offer returns that exceed the market average.
|
||
|
Retail |
· The average rental yield for the NMA retail sector improved by 0.6%-points to 8.9% in Q1’2026, from 8.3% in Q1’2025, as a result of improved asking rents and occupancy rates. |
Neutral |
|
· We maintain a NEUTRAL outlook on the retail sector’s performance, which is anticipated to be influenced by several key drivers: i) continued aggressive expansion efforts by both local and foreign retailers, as they seek to secure new and existing spaces to capitalize on evolving consumer preferences and market dynamics, ii) ongoing advancements in public infrastructure, including road and railway projects, are expected to enhance accessibility to new areas for retail investments, stimulating further growth opportunities, and, iii) positive demographic trends, characterized by a growing population, are anticipated to underpin increasing demand for retail goods and services. However, the sector's growth momentum may face headwinds from certain negative factors, including: i) escalating adoption of e-commerce by retailers, which continues to erode traditional occupier demand for physical retail spaces, necessitating innovative strategies to adapt to changing consumer shopping habits, and, ii) limited access to and expensive financing from financial institutions for retail developments, coupled with the imperative for small and medium-sized enterprises (SMEs) to invest in technological advancements to enhance operational efficiency and competitiveness in the market. |
||
|
Hospitality |
· We maintain a POSITIVE outlook for the hospitality sector, supported by several key drivers: i) aggressive marketing campaigns promoting Kenya’s tourism, expected to boost tourist arrivals and improve occupancy rates at hospitality venues, ii) international recognition of Kenya’s tourism industry, enhancing its status as a leading tourist destination and drawing more global visitors, iii) strategic partnerships within the tourism sector, fostering innovation and collaboration to capitalize on new opportunities, iv) events and initiatives aimed at increasing tourism activity and improving guest experiences. However, while the sector demonstrated resilience in its overall performance in 2025, the outlook remains cautiously optimistic. Kenya continues to face significant competition from neighboring markets, such as Rwanda, which employs aggressive promotional strategies, alongside Zanzibar, Tanzania, and South Africa. These regions actively position themselves as attractive alternatives, challenging Kenya's market share in the region. Additionally, Kenya’s hospitality sector remains vulnerable to the impacts of negative travel advisories issued during times of crisis, resulting in reduced international visitor numbers.
|
Positive |
|
Land |
· The land sector in Nairobi Metropolitan Area (NMA) recorded a price appreciation of 1.9% to Kshs 136.7 mn from 134.1 mn. · We maintain a POSITIVE outlook for the land sector in the Nairobi Metropolitan Area (NMA), considering it a dependable investment opportunity that has shown improving performance year on year. Going forward, we expect the sector's performance to be driven by several factors: i) government efforts to streamline land transactions through innovative solutions such as Ardhi Sasa, ii) continued activities by players on both the demand and supply sides, iii) growing demand for land driven by positive demographics, iv) the launch of infrastructure development projects opening up satellite towns for investment opportunities, and v) the continued rollout of the Affordable Housing Program (AHP) by the government, driving further demand for land. |
Positive |
|
Infrastructure |
· We maintain a POSITIVE outlook for the infrastructure sector. We anticipate continued government efforts to advance infrastructure development across Kenya, particularly in the roads and transport sector, in line with the Bottom-Up Economic Transformation Agenda (BETA) and broader economic stimulus objectives. These enhancements are expected to facilitate the more efficient movement of people, goods, and services, thereby reducing logistics costs, stimulating economic activity, and increasing demand for real estate in previously underserved remote areas and satellite towns. Our optimistic stance is supported by several key developments: i) The launch of the National Infrastructure Fund and Sovereign Wealth Fund, designed to channel resources into priority projects with minimal additional public debt, primarily through privatization proceeds; such as the planned IPO of Kenya Pipeline Company; ii) The anticipated mid-2026 commencement of construction on the Nairobi–Mombasa Usahihi Expressway, a flagship PPP project; iii) The 2026 launch of the Naivasha–Narok–Kisumu–Malaba extension of the Standard Gauge Railway (SGR), establishing a modern logistics corridor across East and Central Africa; iv) Accelerated progress on PPPs for the Rironi–Mau Summit highway; v) The 2025 clearance of Kshs 123 bn in pending bills, which restored contractor confidence; vi) Anticipated construction of a new world-class terminal at Jomo Kenyatta International Airport (JKIA) to solidify Kenya’s position as East Africa’s premier aviation hub; vii) Ongoing modernization of Mombasa and Lamu ports under the LAPSSET corridor initiative; and, viii) Expected completion of the Talanta Sports Complex and Bomas International Convention Centre, enhancing sports and MICE tourism infrastructure. Nevertheless, the sector continues to face longstanding challenges that could temper progress if not effectively managed. These include the recent cancellation of the U.S. government’s Millennium Challenge Corporation (MCC) Threshold Program grant, persistent delays in project execution, land acquisition disputes, cost overruns, a weak culture of infrastructure maintenance, and lingering reliance on debt-financed models. Addressing these headwinds will be critical to fully realizing the sector’s transformative potential.
|
Positive |
Disclaimer: The views expressed in this publication are those of the writers where particulars are not warranted. This publication, which is in compliance with Section 2 of the Capital Markets Authority Act Cap 485A, is meant for general information only and is not a warranty, representation, advice or solicitation of any nature. Readers are advised in all circumstances to seek the advice of a registered investment advisor.

- Talk to us
- Kenya
- P.O Box 20695 - 00200, Nairobi, Kenya
- Cell +254709101200
- Tel +254709101200
- WhatsApp +254741676635
- United States
- +254709101200
- DOWNLOAD OUR APP
-


- Kenya
- 8th Floor, Pinetree Plaza, Kaburu Drive, Ngong Road, Nairobi, Kenya
- USA
- Suite 1150, 1775 Eye Street NW, USA, Washington DC 20006, USA
- Investments
- High Yield
- Private Equity
- Real Estate
- Real Estate
- RiverRun Estates
- Cytonn Towers
- The Ridge
- Taraji Heights
- The Alma