Kenya Private Sector Credit Growth, & Cytonn Weekly #16/2026
By Research Team, Apr 26, 2026
Executive Summary
Fixed Income
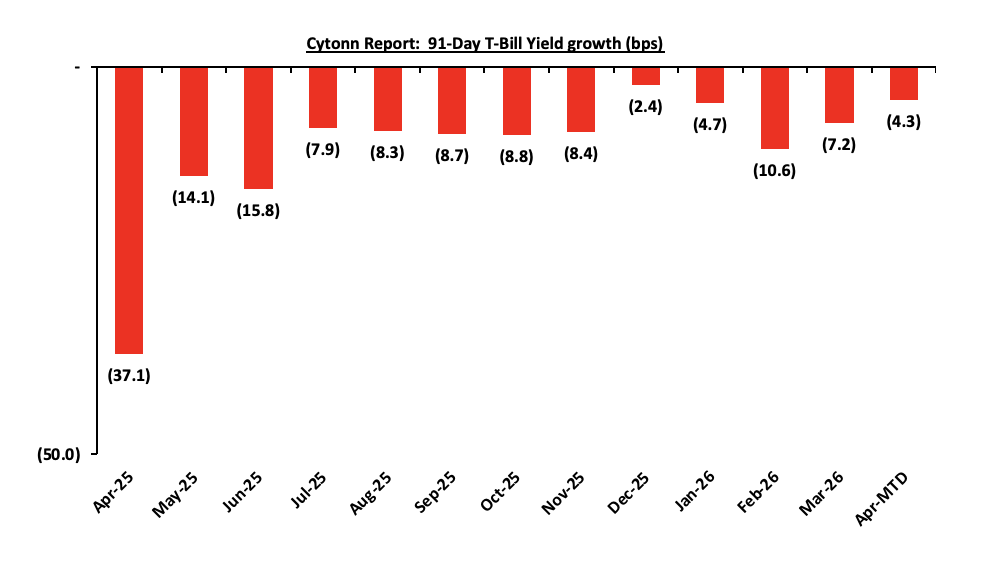
During the week, T-bills were undersubscribed for the second consecutive week, with the overall subscription rate coming in at 57.4%, lower than the subscription rate of 58.3% recorded the previous week. Investors’ preference for the shorter 91-day paper persisted, with the paper receiving bids worth Kshs 9.2 bn against the offered Kshs 4.0 bn, translating to a subscription rate of 230.9%, significantly higher than the subscription rate of 64.4%, recorded the previous week. The subscription rate for the 182-day paper decreased significantly to 8.6% from 76.7% recorded the previous week, while that of the 364-day paper decreased to 36.8% from 37.5% recorded the previous week. The government accepted a total of Kshs 13.8 bn worth of bids out of Kshs 13.8 bn bids received, translating to an acceptance rate of 100.0%. The yields on the government papers recorded a mixed performance with the yields on the 91-day and 182-day papers increasing by 35.5 bps and 5.7 bps to 7.8% and 7.9% from the 7.4% and 7.8% recorded the previous week respectively; the last time yields on 91-day increased was in the previous week, where they rose marginally by 2.4 bps to 7.4%, remaining relatively stable through to the current week. Yields on the 364-day paper decreased by 0.1 bps to remain relatively unchanged from the 8.3% recorded the previous week;
In the primary bond market, the government re-opened three bonds FXD1/2012/020, FXD1/2019/020 and FXD1/2021/025 seeking to raise Kshs 80.0 bn for budgetary support. The bonds, FXD1/2012/020, FXD1/2019/020 and FXD1/2021/025, have fixed coupon rates of 12.0% and 12.9% and 13.9% respectively and tenors to maturity of 6.6 years, 13.0 years and 20.1 years respectively. The period of sale for the three bonds opened on Thursday 23rd April 2026 and will close on Wednesday 6th May 2026. Our bidding ranges for the FXD1/2012/020, FXD1/2019/020 and FXD1/2021/025 is 11.75%-12.25%, 12.5%-13.0% and 13.5%-14.0% respectively;
The government is also looking to raise Kshs 10.0 bn through the switch auction from bond issue FXD1/2017/010 to FXD1/2021/020 with fixed coupon rates of 13.0% and 13.4% respectively and tenors to maturity of 1.2 years and 15.2 years respectively. The period of sale for the two bonds opened on Thursday 23rd April 2026 and will close on Monday 18th May 2026. Our bidding ranges for the switch to FXD1/2021/020 from FXD1/2017/010 is 12.50%-13.00%;
We project April 2026 inflation to increase to within a range of 4.6%–5.0% primarily driven by higher fuel prices, alongside increased electricity costs due to elevated fuel cost and forex adjustment charges linked to ongoing US–Iran tensions;
Equities
During the week, the equities markets were on a downward trajectory, with NASI declining the most by 0.5%, while NSE 20, NSE 25, and NSE 10 declined by 0.48%, 0.4% and 0.2% respectively, taking the YTD performance to gains of 14.3%, 12.0%, 10.5% and 9.7% for NSE 20, NSE 25, NASI and NSE 10 respectively. The equities market performance was mainly driven by losses recorded by large cap stocks such as Standard Chartered, ABSA and NCBA of 3.7%, 3.0% and 1.1% respectively. However, the performance was supported by gains recorded by large cap stocks such as Safaricom and BAT of 1.0% and 0.9% respectively;
Also, during the week, the banking sector index declined by 1.0% to 238.8 from 241.1 recorded the previous week. This is attributable to losses recorded by stocks such as Standard Chartered, ABSA and NCBA of 3.7%, 3.0% and 1.1% respectively;
During the week, Sanlam Kenya Holdings released their FY’2025 results, recording a 2.4% increase in Profit After Tax to Kshs 0.84 from Kshs 0.82 bn recorded in FY’2024. The performance was mainly driven by a 9.1% decrease in the insurance service expense to Kshs 3.2 bn in FY’2025 from Kshs 3.6 bn in FY’2024, but however weighed down by the 3.2% decline in insurance revenue to Kshs 4.4 bn from Kshs 4.6 bn in FY’2024;
During the week, the Board of Co-operative Bank of Kenya Limited issued a cautionary announcement on 22nd April 2026 regarding a proposed corporate reorganization that will see the Group transition into a Non-Operating Holding Company (NOHC) structure, subject to shareholder and regulatory approvals;
Real Estate
During the week, the Kenya National Bureau of Statistics (KNBS) released the Leading Economic Indicators (LEI) February 2026 Report, which highlighted the performance of major economic indicators;
During the week, Mi Vida Homes announced its entry into Kenya’s luxury Real Estate segment through a Kshs 5.6 bn residential development in Tatu City, signaling a strategic shift from its traditional focus on mid-market and affordable housing. The project, known as 156 Elara, represents the developer’s response to growing demand for high-end housing and reflects broader trends in Kenya’s evolving property landscape, where satellite towns are increasingly attracting premium investments;
On the Unquoted Securities Platform Acorn D-REIT and I-REIT traded at Kshs 27.4 and Kshs 23.2per unit, respectively, as per the last updated data on 10th April 2026. The performance represented a 33.4% and 14.5% gain for the D-REIT and I-REIT, respectively, from the Kshs 20.0 inception price. The volumes traded for the D-REIT and I-REIT came in at 13.4 mn and 42.2 mn shares, respectively. Additionally, ILAM Fahari I-REIT traded at Kshs 13.8 per share as of 10th April 2026, representing a 31.0% loss from the Kshs 20.0 inception price.
Focus of the Week
The private sector contributes significantly to Kenya's economic growth, with increased access to credit driving real GDP expansion. Credit availability is essential for businesses to expand, innovate, and stay competitive. Recent data from the Central Bank of Kenya (CBK) shows that credit to the private sector expanded by 8.1% as of March 2026, reflecting the impact of lowering of the Central Bank Rate by CBK which has in turn made the cost of borrowing cheaper. As the government aims to reduce its fiscal deficit, fostering a supportive environment for private sector growth, especially for micro, small, and medium enterprises (MSMEs), will be crucial for increasing revenue collection. Achieving this requires policy reforms to strengthen the credit market and the introduction of sector-specific funds to drive business growth in key industries like finance, agriculture, manufacturing, and transport. Compared to developed economies, Kenya's private sector faces limited credit access, relying heavily on commercial banks with minimal availability of alternative financing options such as venture capital, equity financing, or government-backed credit programs. According to Central Bank of Kenya, banks continue to be the primary source of business credit, supplying a total Kshs 4.1 tn extended to the private sector as of January 2026, 79.8% of the total extended to the sector (inclusive of microfinances and SACCOs), with the highest allocations directed towards Trade (17.8%), Private Households (14.5%) and Manufacturing (14.3%);
Investment Updates:
-
Weekly Rates: Cytonn Money Market Fund closed the week at a yield of 12.0% p.a. To invest, dial *809# or download the Cytonn App from Google Play store here or from the Appstore here;
-
We continue to offer Wealth Management Training every Tuesday, from 7:00 pm to 8:00 pm. The training aims to grow financial literacy among the general public. To register for any of our Wealth Management Trainings, click here;
-
If interested in our Private Wealth Management Training for your employees or investment group, please get in touch with us through wmt@cytonn.com;
-
Cytonn Insurance Agency acts as an intermediary for those looking to secure their assets and loved ones’ future through insurance namely; Motor, Medical, Life, Property, WIBA, Credit and Fire and Burglary insurance covers. For assistance, get in touch with us through insuranceagency@cytonn.com;
-
Cytonn Asset Managers Limited (CAML) continues to offer pension products to meet the needs of both individual clients who want to save for their retirement during their working years and Institutional clients that want to contribute on behalf of their employees to help them build their retirement pot. To more about our pension schemes, kindly get in touch with us through pensions@cytonn.com;
Hospitality Updates:
-
We currently have promotions for Staycations. Visit cysuites.com/offers for details or email us at sales@cysuites.com;
Money Markets, T-Bills Primary Auction:
This week, T-bills were undersubscribed for the second consecutive week, with the overall subscription rate coming in at 57.4%, lower than the subscription rate of 58.3% recorded the previous week. Investors’ preference for the shorter 91-day paper persisted, with the paper receiving bids worth Kshs 9.2 bn against the offered Kshs 4.0 bn, translating to a subscription rate of 230.9%, significantly higher than the subscription rate of 64.4%, recorded the previous week. The subscription rate for the 182-day paper decreased significantly to 8.6% from 76.7% recorded the previous week, while that of the 364-day paper decreased to 36.8% from 37.5% recorded the previous week. The government accepted a total of Kshs 13.8 bn worth of bids out of Kshs 13.8 bn bids received, translating to an acceptance rate of 100.0%. The yields on the government papers recorded a mixed performance with the yields on the 91-day and 182-day papers increasing by 35.5 bps and 5.7 bps to 7.8% and 7.9% from the 7.4% and 7.8% recorded the previous week respectively; ; the last time yields on 91-day increased was in the previous week, where they rose marginally by 2.4 bps to 7.4%, remaining relatively stable through to the current week Yields on the 364-day paper decreased by 0.1 bps to remain relatively unchanged from the 8.3% recorded the previous week. The chart below shows the yield growth rate for the 91-day paper from April 2025 to date:
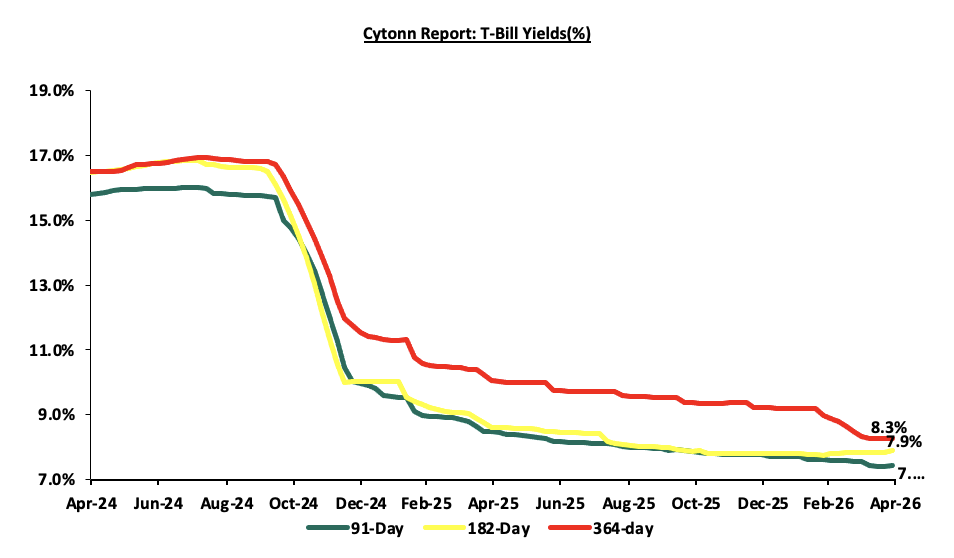
The chart below shows the performance of the 91-day, 182-day and 364-day papers from April 2024 to April 2026
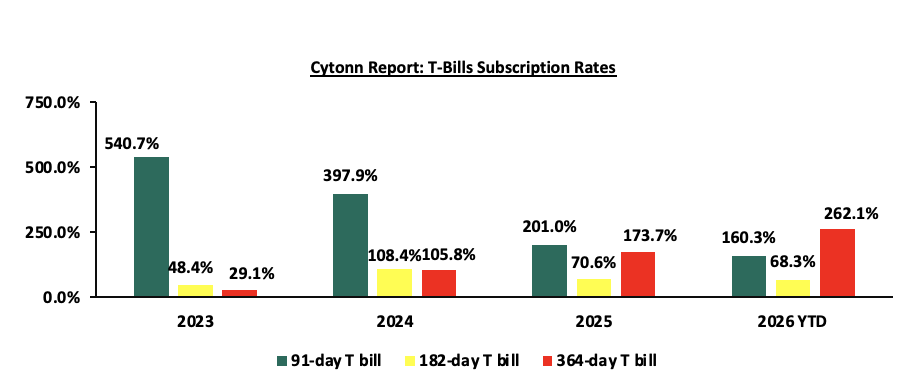
The chart below compares the overall average T-bill subscription rates obtained in 2023, 2024, 2025 and 2026 Year-to-date (YTD):
In the primary bond market, the government re-opened three bonds FXD1/2012/020, FXD1/2019/020 and FXD1/2021/025 seeking to raise Kshs 80.0 bn for budgetary support. The bonds, FXD1/2012/020, FXD1/2019/020 and FXD1/2021/025, have fixed coupon rates of 12.0% and 12.9% and 13.9% respectively and tenors to maturity of 6.6 years, 13.0 years and 20.1 years respectively. The period of sale for the three bonds opened on Thursday 23rd April 2026 and will close on Wednesday 6th May 2026. Our bidding ranges for the FXD1/2012/020, FXD1/2019/020 and FXD1/2021/025 is 11.75%-12.25%, 12.5%-13.0% and 13.5%-14.0% respectively.
The government is also looking to raise Kshs 10.0 bn through the switch auction from bond issue FXD1/2017/010 to FXD1/2021/020 with fixed coupon rates of 13.0% and 13.4% respectively and tenors to maturity of 1.2 years and 15.2 years respectively. The period of sale for the two bonds opened on Thursday 23rd April 2026 and will close on Monday 18th May 2026. Our bidding ranges for the switch to FXD1/2021/020 from FXD1/2017/010 is 12.50%-13.00%;
Money Market Performance:
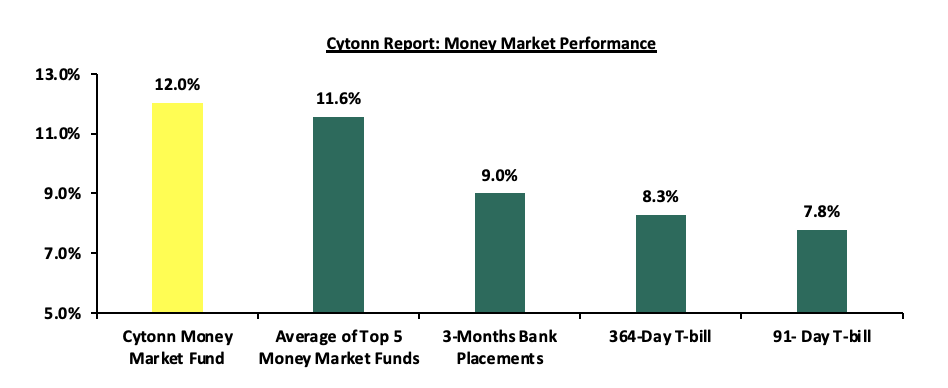
In the money markets, 3-month bank placements ended the week at 9.0% (based on rates offered by various banks. The yields on the government papers recorded a mixed performance with the yields on the 91-day paper increasing by 35.5 bps to 7.8% from the 7.5% recorded the previous week, while the yields on the 364-day paper decreased by 0.1 bps to remain relatively unchanged from the 8.3% recorded the previous week. The yield on the Cytonn Money Market Fund increased by 80.0 bps to 12.0% from 11.2% recorded the previous week, while the average yields on the Top 5 Money Market Funds increased by 25.6 bps to 11.6% from 11.3% recorded the previous week.
The table below shows the Money Market Fund Yields for Kenyan Fund Managers as published on 24th April 2026:
|
Money Market Fund Yield for Fund Managers as published on 24th April 2026 |
||
|
Rank |
Fund Manager |
Effective Annual Rate |
|
1 |
Cytonn Money Market Fund (Dial *809# or download Cytonn App) |
12.0% |
|
2 |
Nabo Africa Money Market Fund |
12.0% |
|
3 |
Etica Money Market Fund |
11.9% |
|
4 |
Arvocap Money Market Fund |
11.1% |
|
5 |
Gulfcap Money Market Fund |
10.8% |
|
6 |
Enwealth Money Market Fund |
10.7% |
|
7 |
Lofty-Corban Money Market Fund |
10.6% |
|
8 |
Ndovu Money Market Fund |
10.5% |
|
9 |
Jubilee Money Market Fund |
10.4% |
|
10 |
Madison Money Market Fund |
10.4% |
|
11 |
Kuza Money Market fund |
10.4% |
|
12 |
Orient Kasha Money Market Fund |
10.3% |
|
13 |
Faulu Money Market Fund |
10.1% |
|
14 |
Old Mutual Money Market Fund |
10.1% |
|
15 |
GenAfrica Money Market Fund |
9.7% |
|
16 |
British-American Money Market Fund |
9.5% |
|
17 |
Dry Associates Money Market Fund |
9.4% |
|
18 |
SanlamAllianz Money Market Fund |
9.3% |
|
20 |
Apollo Money Market Fund |
9.3% |
|
21 |
KCB Money Market Fund |
9.0% |
|
22 |
Genghis Money Market Fund |
8.6% |
|
23 |
Mayfair Money Market Fund |
8.6% |
|
24 |
CIC Money Market Fund |
8.4% |
|
25 |
Co-op Money Market Fund |
8.2% |
|
26 |
CPF Money Market Fund |
8.2% |
|
27 |
ICEA Lion Money Market Fund |
8.2% |
|
28 |
Mali Money Market Fund |
8.1% |
|
29 |
Absa Shilling Money Market Fund |
7.3% |
|
30 |
Ziidi Money Market Fund |
5.9% |
|
31 |
AA Kenya Shillings Fund |
5.8% |
|
32 |
Stanbic Money Market Fund |
5.4% |
|
33 |
Equity Money Market Fund |
2.6% |
Source: Business Daily
Liquidity:
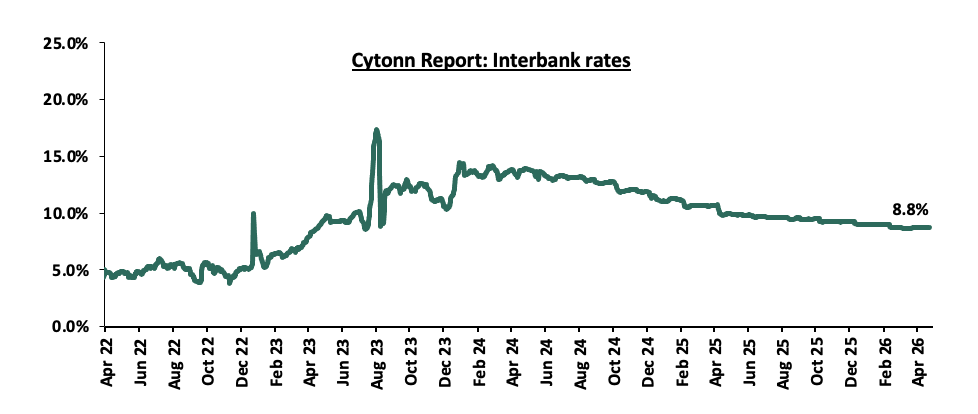
During the week, liquidity in the money markets tightened with the average interbank rate increasing by 0.1 bps to remain relatively unchanged at 8.8% recorded last week, partly attributable to tax remittances that offset government payments. The average interbank volumes traded decreased by 13.9% to Kshs 9.6 bn from Kshs 11.2 bn recorded the previous week. The chart below shows the interbank rates in the market over the years:
Kenya Eurobonds:
During the week, the yields on the Eurobonds recorded a mixed performance with the yield on the 30-year Eurobond issued in 2018, increasing the most by 20.0 bps to 9.3% from 9.1% recorded the previous week, while the yield on the 7-year Eurobond issued in 2024, decreased by 8.0 bps to 8.0% from 8.1% recorded the previous week. The table below shows the summary performance of the Kenyan Eurobonds as of 23rd April 2026;
|
Cytonn Report: Kenya Eurobonds Performance |
||||||
|
|
2018 |
2019 |
2021 |
2024 |
||
|
Tenor |
10-year issue |
30-year issue |
12-year issue |
13-year issue |
7-year issue |
|
|
Amount Issued (USD) |
1.0 bn |
1.0 bn |
1.0 bn |
1.5 bn |
1.5 bn |
|
|
Years to Maturity |
2.5 |
22.5 |
8.8 |
5.5 |
10.5 |
|
|
Yields at Issue |
7.3% |
8.3% |
6.2% |
10.4% |
9.9% |
|
|
02-Jan-26 |
6.1% |
8.8% |
7.2% |
7.8% |
7.1% |
|
|
01-Apr-26 |
7.6% |
9.5% |
8.7% |
9.2% |
8.8% |
|
|
16-Apr-26 |
7.3% |
9.1% |
8.1% |
8.5% |
8.1% |
|
|
17-Apr-26 |
7.4% |
8.9% |
8.0% |
8.2% |
7.9% |
|
|
20-Apr-26 |
7.4% |
9.0% |
8.0% |
8.3% |
8.0% |
|
|
21-Apr-26 |
7.5% |
9.1% |
8.1% |
8.4% |
7.9% |
|
|
22-Apr-26 |
7.5% |
9.1% |
8.1% |
8.4% |
7.9% |
|
|
23-Apr-26 |
7.5% |
9.3% |
8.2% |
8.6% |
8.0% |
|
|
Weekly Change |
0.1% |
0.2% |
0.1% |
0.1% |
(0.1%) |
|
|
MTD Change |
(0.1%) |
(0.2%) |
(0.5%) |
(0.7%) |
(0.7%) |
|
|
YTD Change |
1.4% |
0.4% |
0.9% |
0.6% |
0.8% |
|
Source: Central Bank of Kenya (CBK) and National Treasury
During the week, the Kenya Shilling depreciated by 16.2 bps against the US Dollar, to Kshs 129.3 from the Kshs 129.1 recorded the previous week. On a year-to-date basis, the shilling has depreciated by 20.9 bps against the dollar, as compared to the 22.9 bps appreciation recorded in 2025.
We expect the shilling to be supported by:
-
Diaspora remittances standing at a cumulative USD 5,051.2 mn in the twelve months to February 2026, 1.9% higher than the USD 4,956.5 mn recorded over the same period in 2025. These have continued to cushion the shilling against further depreciation. In the February 2026 diaspora remittances figures, North America remained the largest source of remittances to Kenya accounting for 54.2% in the period, and,
-
Tourism inflows, which strengthened significantly. Tourism receipts reached Kshs 560.0 bn in 2025, up from Kshs 452.2 bn in 2024, representing a 23.9% increase, supported by improved international arrivals through the country’s major airports, and,
-
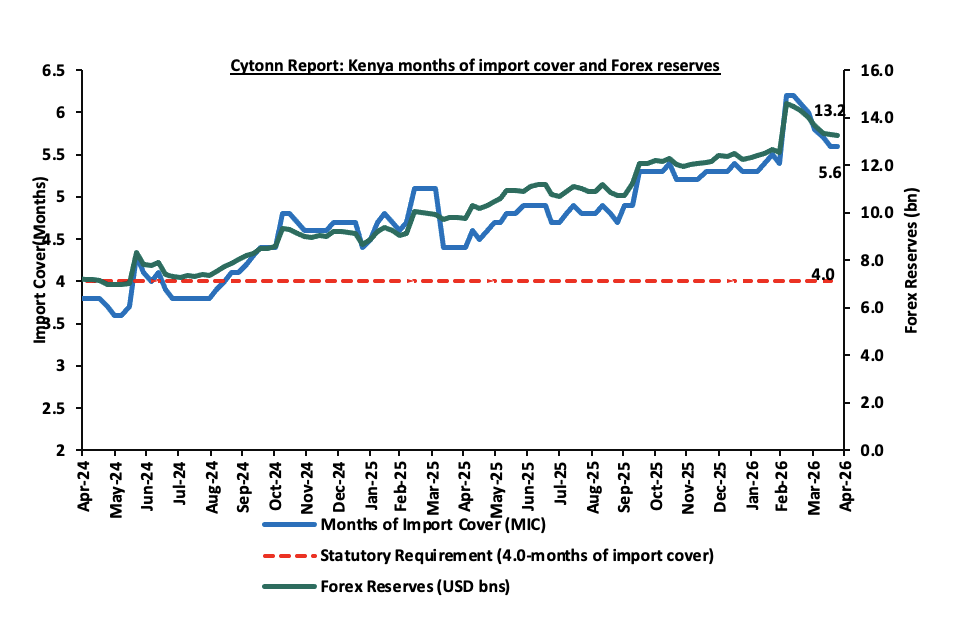
Improved forex reserves currently at USD 13.2 bn (equivalent to 5.6-months of import cover), which is above the statutory requirement of maintaining at least 4.0-months of import cover and above the EAC region’s convergence criteria of 4.5-months of import cover.
The shilling is however expected to remain under pressure in 2026 as a result of:
-
An ever-present current account deficit which came at 2.4% of GDP in the twelve months to February 2026, and,
-
The need for government debt servicing, continues to put pressure on forex reserves given that 52.0% of Kenya’s external debt is US Dollar-denominated as of September 2025.
-
Rising geopolitical tensions in the Middle East, which could exert pressure on the shilling through higher global oil prices and increased uncertainty in international markets. Given that Kenya is a net importer of petroleum products, any sustained increase in oil prices would widen the import bill, increase demand for US Dollars, and consequently put depreciation pressure on the shilling.
Kenya’s forex reserves decreased by 0.5% during the week to USD 13.2 bn from USD 13.3 bn recorded the previous week, equivalent to 5.6 months of import cover, and above the statutory requirement of maintaining at least 4.0-months of import cover.
The chart below summarizes the evolution of Kenya's months of import cover over the years:
Weekly Highlights
Weekly Highlights
-
April 2026 Inflation projection
We are projecting the y/y inflation rate for April 2026 will increase to within the range of 4.6% - 5.0%, mainly on the back of:
-
Increased fuel prices – The Energy and Petroleum Regulatory Authority (EPRA) released their monthly statement on the maximum retail fuel prices in Kenya, effective from 16th April 2026 to 14th May 2026. Notably, the maximum allowed prices for Super Petrol, and Diesel increased by Kshs 28.7 and Kshs 40.3 per litre to Kshs 197.6 and Kshs 196.6 per litre from Kshs 178.3, and Kshs 166.5 per litre respectively in March 2026, reflecting elevated global crude oil prices amid ongoing geopolitical tensions in the Middle East. On the other hand, Kerosene remain unchanged at Kshs 152.8 per litre. Despite the revision, fuel prices remain significantly higher compared to March levels, and this increase is expected to exert upward pressure on inflation through higher transport and production costs, which are likely to be passed on to consumers.
-
Increased electricity forex adjustment charges – In April 2026, electricity prices increased marginally on the back of a rise in fuel cost charges and forex adjustment charges. EPRA set the fuel cost charge at Kshs 4.5 up from Kshs 3.5 in March 2026, while the forex adjustment was raised to Kshs 1.3 from Kshs 1.2 in March 2026. With electricity being one of the major inputs of inflation, this increase is expected to raise production costs for businesses as well as electricity costs for households thereby increasing inflationary pressures.
-
The Central Bank Rate (CBR) - In April 2026, the CBK Monetary Policy Committee maintained the Central Bank Rate (CBR) at 8.75%, unchanged from February 2026, in a bid to keep inflation expectations anchored amid geopolitical tensions in the Middle East. However, overall, policy rates had eased in recent months, declining by a cumulative 2.0% points in the 12 months to February 2026 to 8.75% from 10.75% in February 2025. The Monetary Policy Committee is expected to adopt a more cautious approach to rate adjustments in the coming meetings while monitoring the effects of the Middle East Conflict. Even with a cautious stance, cheaper credit from past easing, external supply shocks and potential currency depreciation create an environment where inflationary pressures can outpace CBK’s stabilizing efforts.
We, however expect the inflation to be supported by:
-
Stability of the Kenya Shilling against the US Dollar – In addition to the 46.9 bps month-to-date appreciation of the Shilling as of 24th March to Kshs 129.3 from Kshs 129.9 at the beginning of the month, the currency has remained broadly stable. This stability is expected to cushion inflationary pressures by moderating the pass-through effects of global price shocks into the domestic economy, thereby supporting a more contained outlook for the month’s inflation.
The ongoing US–Iran tensions continue to disrupt global oil logistics, particularly around the Strait of Hormuz, sustaining volatility and a persistent risk premium in crude oil prices. Although disruptions have shifted from acute shocks to more intermittent and structural supply frictions, Murban crude, Kenya’s key import grade, remains elevated and volatile, keeping upward pressure on future pump prices despite current stability in domestic fuel adjustments. Any pass through into fuel prices would have significant implications for inflation, given fuel’s central role in transport, logistics, and production costs. The conflict also affects electricity pricing through fuel cost adjustments and foreign exchange related generation costs, as global oil markets continue to price in heightened geopolitical uncertainty. Rising fuel and energy costs are expected to increase the cost of goods across the economy, particularly in manufacturing, agriculture, and distribution, as producers pass on higher input and transport expenses to consumers, thereby reinforcing cost push inflationary pressures. While the recent relative stability of the Kenya Shilling offers some temporary relief on imported inflation, this support remains vulnerable to renewed geopolitical risks and sustained oil price volatility. We however still expect inflationary pressures to remain anchored within the CBK’s target range of 2.5%-7.5% in the short to medium term.
Rates in the Fixed Income market have been on a downward trend due to high liquidity in the money market which allowed the government to front load most of its borrowing. The government is 7.7% ahead of its prorated net domestic borrowing target of Kshs 927.6 bn, having a net borrowing position of Kshs 998.7 bn (inclusive of T-bills). However, we expect a stabilization of the yield curve in the short and medium term, with the government looking to increase its external borrowing to maintain the fiscal surplus, hence alleviating pressure in the domestic market. As such, we expect the yield curve to stabilize in the short to medium-term and hence investors are expected to shift towards the long-term papers to lock in the high returns.
Market Performance:
During the week, the equities markets were on a downward trajectory, with NASI declining the most by 0.5%, while NSE 20, NSE 25, and NSE 10 declined by 0.48%, 0.4% and 0.2% respectively, taking the YTD performance to gains of 14.3%, 12.0%, 10.5% and 9.7% for NSE 20, NSE 25, NASI and NSE 10 respectively. The equities market performance was mainly driven by losses recorded by large cap stocks such as Standard Chartered, ABSA and NCBA of 3.7%, 3.0% and 1.1% respectively. However, the performance was supported by gains recorded by large cap stocks such as Safaricom and BAT of 1.0% and 0.9% respectively.
Also, during the week, the banking sector index declined by 1.0% to 238.8 from 241.1 recorded the previous week. This is attributable to losses recorded by stocks such as Standard Chartered, ABSA and NCBA of 3.7%, 3.0% and 1.1% respectively.
During the week, equities turnover decreased by 44.5% to USD 23.1 mn from USD 41.7 mn recorded the previous week, taking the YTD total turnover to USD 540.2 mn. Foreign investors became net sellers for the first time in two weeks with a net selling position of USD 2.4 mn, from a net buying position of USD 0.6 mn recorded the previous week, taking the YTD foreign net selling position to USD 80.8 mn, compared to a net selling position of USD 92.9 mn recorded in 2025.
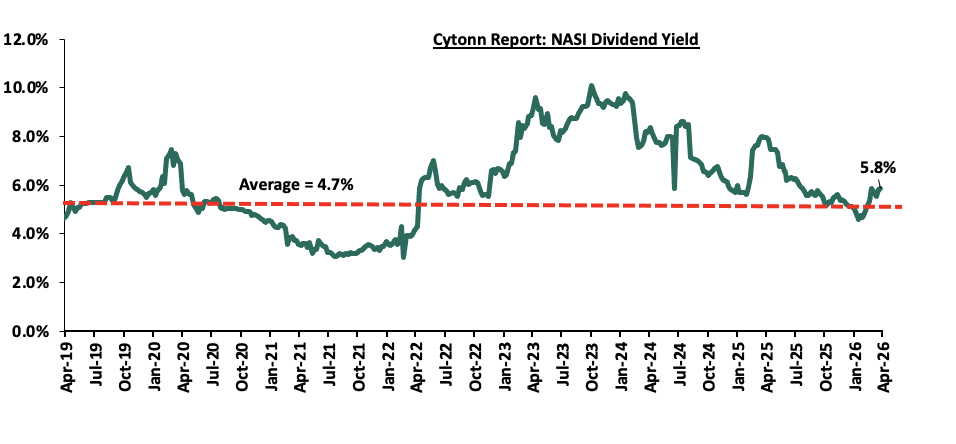
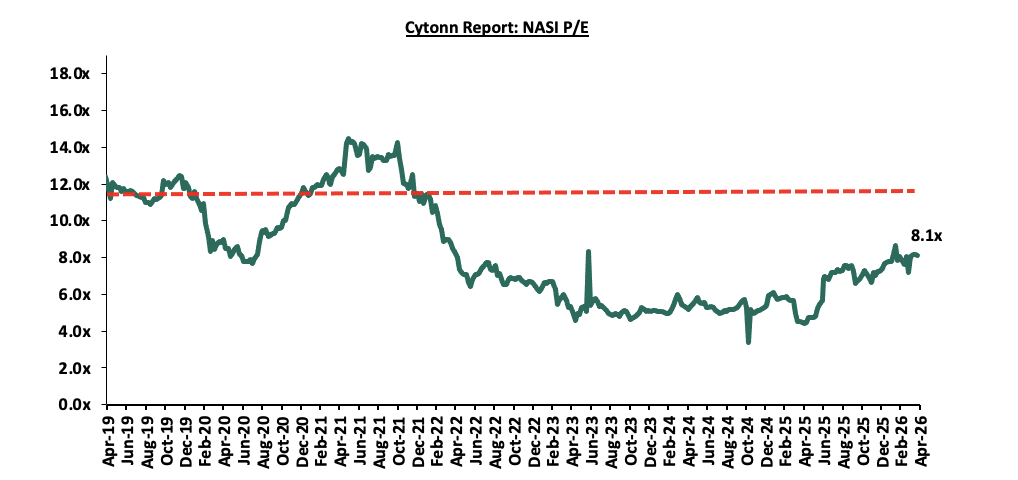
The market is currently trading at a price to earnings ratio (P/E) of 8.1x, which is 3.2x below the historical average of 11.3x. The dividend yield stands at 5.8%, 1.1% points above the historical average of 4.7%. Key to note, NASI’s PEG ratio currently stands at 1.0x, suggesting that the market is fairly valued relative to its expected earnings growth. A PEG ratio greater than 1.0x indicates the market may be overvalued while a PEG ratio less than 1.0x indicates that the market is undervalued.
The charts below indicate the historical P/E and dividend yields of the market.
Universe of Coverage:
|
Cytonn Report: Equities Universe of Coverage |
||||||||||
|
Company |
Price as at 17/04/2026 |
Price as at 24/04/2026 |
w/w change |
YTD Change |
Year Open 2026 |
Target Price* |
Dividend Yield |
Upside/ Downside** |
P/TBv Multiple |
Recommendation |
|
KCB Group |
69.3 |
68.5 |
(1.1%) |
4.2% |
65.8 |
81.1 |
10.2% |
28.6% |
0.7x |
Buy |
|
CIC Group |
4.7 |
4.5 |
(4.5%) |
(2.0%) |
4.5 |
5.5 |
2.9% |
26.5% |
1.1x |
Buy |
|
Equity Group |
75.0 |
75.0 |
0.0% |
11.9% |
67.0 |
87.8 |
7.7% |
24.7% |
1.0x |
Buy |
|
NCBA |
89.8 |
88.8 |
(1.1%) |
4.4% |
85.0 |
103.3 |
8.0% |
24.4% |
1.2x |
Buy |
|
Diamond Trust Bank |
149.8 |
149.0 |
(0.5%) |
29.8% |
114.8 |
175.1 |
6.0% |
23.5% |
0.4x |
Buy |
|
Co-op Bank |
32.5 |
32.2 |
(0.9%) |
34.7% |
23.9 |
37.2 |
7.8% |
23.2% |
1.2x |
Buy |
|
I&M Group |
48.5 |
49.7 |
2.5% |
16.0% |
42.8 |
56.7 |
7.6% |
21.7% |
0.8x |
Buy |
|
Jubilee Holdings |
385.8 |
380.0 |
(1.5%) |
17.8% |
322.5 |
407.5 |
3.9% |
11.2% |
0.5x |
Accumulate |
|
ABSA Bank |
31.5 |
30.5 |
(3.0%) |
22.7% |
24.9 |
31.7 |
6.7% |
10.7% |
1.7x |
Accumulate |
|
Standard Chartered Bank |
360.0 |
346.8 |
(3.7%) |
15.7% |
299.8 |
346.8 |
8.9% |
9.0% |
2.1x |
Hold |
|
Britam |
12.3 |
12.4 |
1.2% |
36.9% |
9.1 |
13.5 |
0.0% |
8.9% |
0.9x |
Hold |
|
Stanbic Holdings |
289.0 |
287.5 |
(0.5%) |
45.4% |
197.8 |
273.5 |
7.8% |
2.9% |
1.6x |
Lighten |
|
*Target Price as per Cytonn Analyst estimates **Upside/ (Downside) is adjusted for Dividend Yield *Dividend Yield is calculated using FY’2025 Dividends |
||||||||||
Weekly highlights
-
Sanlam Kenya Holdings Plc FY’2025 Financial Results.
During the week, Sanlam Kenya Holdings released their FY’2025 results, recording a 2.4% increase in Profit After Tax to Kshs 0.84 from Kshs 0.82 bn recorded in FY’2024. The performance was mainly driven by a 9.1% decrease in the insurance service expense to Kshs 3.2 bn in FY’2025 from Kshs 3.6 bn in FY’2024, but however weighed down by the 3.2% decline in insurance revenue to Kshs 4.4 bn from Kshs 4.6 bn in FY’2024.
|
Cytonn Report: Sanlam Kenya Plc's Income Statement |
|||
|
Income Statement (Kshs bn) |
FY'2024 |
FY'2025 |
y/y change |
|
Insurance Revenue |
4.6 |
4.4 |
(3.2%) |
|
Insurance Service Expense |
(3.6) |
(3.2) |
(9.1%) |
|
Net Expense from reinsurance contracts held |
(0.3) |
(0.2) |
(35.9%) |
|
Insurance Service Result |
0.7 |
1.0 |
45.7% |
|
interest revenue calculated using the effective interest method |
0.3 |
0.1 |
(60.8%) |
|
Other Interest Revenue |
2.3 |
2.4 |
2.0% |
|
Other Investment Revenue |
2.1 |
1.2 |
(44.8%) |
|
Insurance Investment Revenue |
4.7 |
3.7 |
(22.5%) |
|
Net Insurance Finance expenses |
(0.9) |
(0.4) |
(55.9%) |
|
Profit before tax |
1.4 |
1.32 |
(7.7%) |
|
Income tax expense |
(0.6) |
(0.48) |
(21.3%) |
|
Profit after tax |
0.82 |
0.84 |
2.4% |
|
Core EPS |
5.7 |
5.8 |
2.4% |
|
Cytonn Report: Sanlam Allianz Kenya Plc's Balance Sheet |
|||
|
Balance Sheet items |
FY'2024 |
FY'2025 |
y/y change |
|
Financial Investments |
31.7 |
34.1 |
7.3% |
|
Insurance and Reinsurance contract assets |
0.4 |
0.6 |
31.9% |
|
Other assets |
7.0 |
4.8 |
(32.1%) |
|
Total assets |
39.2 |
39.4 |
0.5% |
|
Insurance contract liabilities |
27.5 |
30.4 |
10.5% |
|
Payables and Other liabilities |
9.7 |
4.2 |
(56.7%) |
|
Total liabilities |
37.2 |
34.6 |
(7.0%) |
|
Shareholder funds |
1.8 |
4.6 |
161.6% |
Key take outs from the results:
-
Core Earnings Per share increased by 2.4% to Kshs 5.8 from Kshs 5.7 per share in FY’2024, mainly attributable to the 9.1% decrease in the insurance service expense to Kshs 3.2 bn in FY’2025 from Kshs 3.6 bn in FY’2024, but however weighed down by the 3.2% decline in insurance revenue to Kshs 4.4 bn from Kshs 4.6 bn in FY’2024;
-
Net Investment revenue decreased by 22.5% to Kshs 3.7 bn in FY’2025, from Kshs 4.7 bn in FY’2024. This was majorly attributable to a 60.8% decrease in interest revenue calculated using the effective interest method to Kshs. 0.1 bn from the Kshs 0.3 bn recorded in FY’2024 coupled with a 44.8% decrease in other investment revenue to Kshs. 1.2 bn from the Kshs 2.1 bn recorded in FY’2024.
-
Net expense from reinsurance contracts held decreased by 35.9% to Kshs 0.2 bn in FY’2025 from Kshs 0.3 bn in FY’2024, while insurance service expenses decreased by 9.1% to Kshs 3.2 bn from Kshs 3.6 bn in FY’2024. In addition, there was a 3.2% decrease in insurance revenue to Kshs 4.4 bn from Kshs 4.6 bn registered in FY’2024. This translated to a net insurance service result increase of 45.7% to Kshs 1.0 bn from Kshs 0.7 bn in FY’2024,
-
The balance sheet recorded an expansion as total assets increased by 0.5% to Kshs 39.4 bn in FY’2025 from Kshs 39.2 bn in FY’2024 mainly driven by 31.9% increase in insurance and reinsurance contracts to Kshs 0.6 bn from Kshs 0.4 bn in FY’2024, coupled with a 7.3% increase in financial investments to Kshs 34.1 bn from Kshs 31.7 bn in FY’2024.
-
Total liabilities decreased by 7.0% to Kshs 34.6 bn form Kshs 37.2 bn in FY’2024. The performance is mainly attributable to a 66.3% decrease in borrowings to Kshs 1.4 bn from Kshs 4.2 bn in FY’2024
Other highlights from the release include:
-
Non-declaration of dividends – The directors of Sanlam Kenya Plc have not recommended a dividend payment for FY’2025.
Going forward, the factors that would drive the company’s growth would be:
-
Regional Expansion and Integration Following Jubilee Non-Life Acquisition - Growth is expected to be supported by the completion of its acquisition of Jubilee’s remaining stakes in non-life insurance subsidiaries across Kenya, Tanzania, Uganda, Burundi, and Mauritius, finalising a transaction initiated in 2020. The deal consolidates majority control across the regional platform, strengthening its footprint and improving earnings diversification. With full operational control achieved, the group is expected to drive deeper integration, realise cost efficiencies, and standardise products across markets. The expanded distribution network also enhances penetration and cross-selling potential across retail and corporate segments. Backed by the capital strength and technical expertise of Sanlam and Allianz, the platform is positioned to improve underwriting discipline and optimise capital deployment across East Africa.
-
Digital Savings and Pension Penetration (Akiba Plus) - The Akiba Plus initiative is expected to support growth by expanding access to retirement savings through a digital, mobile-first platform designed to enhance penetration, improve contribution consistency, and deepen financial inclusion across both formal and informal segments.
Valuation Summary:
-
We are of the view that Sanlam Kenya Plc is “Accumulate” with a target price of Kshs 10.6 representing an upside of 15.0%, from the current price of 9.24 as of 24th April 2026.
During the week, the Board of Co-operative Bank of Kenya Limited issued a cautionary announcement on 22nd April 2026 regarding a proposed corporate reorganization that will see the Group transition into a Non-Operating Holding Company (NOHC) structure, subject to shareholder and regulatory approvals. A NOHC structure refers to a corporate arrangement where a parent entity does not undertake day-to-day operations, but instead holds and oversees a group of subsidiaries that carry out the actual business activities, allowing for clearer governance, risk segregation, and capital allocation. Under the proposed structure, Co-operative Bank of Kenya Limited, the current listed entity on the Nairobi Securities Exchange, will be converted into “Co-op Bank Group PLC,” which will serve as the non-operating holding company, while a new wholly owned subsidiary, “Co-op Bank Kenya Limited,” will be incorporated to undertake the core banking business in Kenya. The restructuring is aligned with the prudential guidelines of the Central Bank of Kenya and the Capital Markets Authority regulatory framework, and is expected to improve governance architecture, enhance capital allocation efficiency, and strengthen risk segregation between banking and non-banking activities. The Group is also expected to benefit from improved strategic flexibility, enabling more efficient incubation and scaling of diversified financial services businesses under a unified holding structure, including existing subsidiaries such as Kingdom Bank Limited, Co-op Consultancy & Insurance Agency Limited, Co-op Trust Investment Services Limited, and Co-op Bancassurance Intermediary Limited.
The proposed NOHC model mirrors structural shifts observed among large regional banking groups, where separation of the operating bank from the holding company enhances supervisory clarity, facilitates capital mobility across subsidiaries, and supports long-term diversification into insurance, asset management, and fintech-related verticals. For Co-operative Bank, the restructuring is also expected to position the Group more effectively to pursue future regional expansion opportunities over the medium to long term, as well as deepen non-interest income streams through subsidiary-led diversification. From a valuation perspective, the announcement is expected to slightly weigh on near-term sentiment, driven primarily by uncertainty surrounding approval timelines and execution risk, which may exert pressure on short-term trading multiples. However, over the medium to long term, the NOHC structure is mildly positive for valuation, as it enhances earnings visibility at the subsidiary level, improves capital allocation efficiency, and provides a clearer framework for group diversification and potential regional scaling. Any potential re-rating will largely depend on successful completion of the restructuring process, clarity on subsidiary-level capital structures and dividend policy frameworks, and evidence of sustained earnings diversification beyond traditional banking income streams.
This strategic repositioning is underpinned by a solid FY’2025 financial performance, with the Group reporting a 16.9% increase in profit after tax to Kshs 29.8 bn in FY’2025, from Kshs 25.5 bn in FY’2024. Total assets increased by 11.3% to Kshs 827.4 bn, from Kshs 743.2 bn in FY’2024, mainly driven by a 12.6% increase in net loans and advances and governments securities holdings to Kshs 421.0 bn and Kshs 244.9 bn, from Kshs 373.7 bn and 217.6 bn in FY’2024 respectively. The Group declared a total dividend of Kshs 2.5 per share for the FY’2025, maintaining a stable payout ratio of 49.3% and reaffirming its commitment to consistent shareholder returns.
Overall, the transaction is viewed as a structural rather than operational transformation, with limited immediate impact on fundamentals, but meaningful strategic implications for long-term Group positioning within Kenya’s evolving banking sector landscape.
We maintain a “cautiously optimistic” short-term outlook supported primarily earnings-led attractive valuations, lower yields on short-term government papers and expected global and local economic recovery, and, “neutral” in the long term as persistent foreign investor outflows continue to constrain market liquidity and limit broad-based market re-rating. With the market currently trading at par to its future growth (PEG Ratio at 1.0x), where performance will be driven by company-specific fundamentals rather than general market direction, we believe that investors should reposition towards value stocks exhibiting strong earnings growth, attractive dividend yields, solid balance sheets, sustainable competitive advantages and trading at compelling discounts to their intrinsic value. While foreign investor sell-offs are expected to continue exerting pressure in the near term, we believe this will create selective entry opportunities for long-term investors.
-
Industry Report
-
February Leading Economic Indicators (LEI)
During the week, the Kenya National Bureau of Statistics (KNBS) released the Leading Economic Indicators (LEI) February 2026 Report, which highlighted the performance of major economic indicators. The key highlights related to the Real Estate sector include:
-
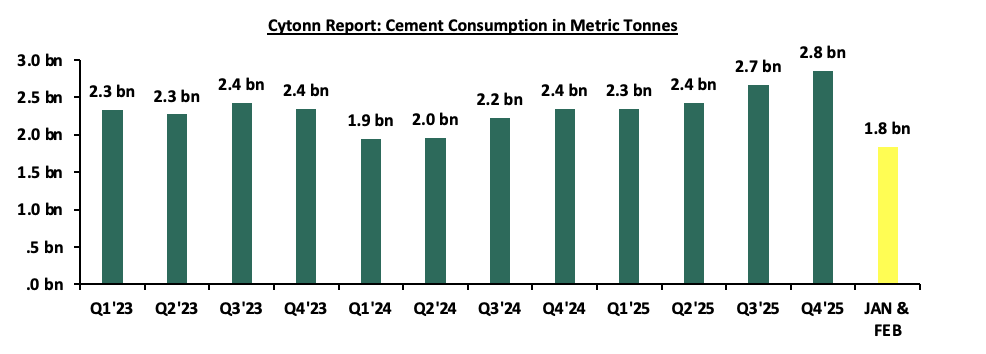
In February 2026, cement consumption reached 913,076 metric tonnes, representing a 21.9% y/y increase from the same month in 2025. Month-on-month, consumption decreased by 1.0%, to 913,076 from 922,369 in January 2026 reflecting a decline in momentum in the construction sector. The y/y performance was anchored by (i) continued private sector construction activity in urban hubs such as Nairobi, Mombasa, and Kisumu, (ii) government-led infrastructure investments under the Bottom-Up Economic Transformation Agenda (BETA), including roads, affordable housing, water, and sanitation projects, and (iii) public works initiatives in rural and semi-urban areas, which both support livelihoods and expand critical infrastructure.
The chart below shows cement consumption in metric tonnes in Kenya between Q1’2023 and Q1’2026
Source: Kenya National Bureau of Statistics (KNBS)
-
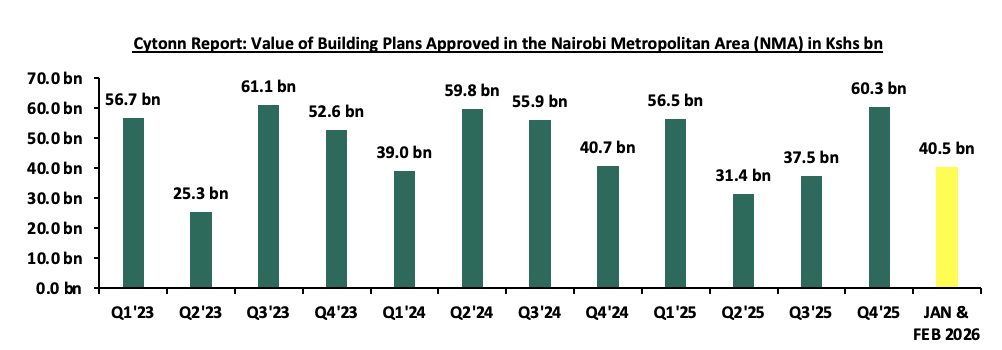
In February, the value of building plans approved in Nairobi City County increased by 10.5% on year-on-year basis to Ksh 14.7 bn from the same month in 2025 and a 42.7% decrease on month on month basis. The increase on year-on-year basis reflects a sustained recovery and growing confidence in the real estate and construction sector driven by (i) improved demand for residential and commercial developments, (ii) lower lending rates by financial institutions due to the consistent lowering of the CBR rate in 2025 by which currently stands at 8.75%. This has enabled more developers to initiate and submit construction projects for approval. (iii) the ongoing digitization and streamlining of the development approval process by the Nairobi City County Government, which has improved efficiency, reduced approval timelines, and encouraged more developers to formally submit building plans.
The chart below shows the building plans approved in billions in Kenya between Q1’2023 and Q1’2026
-
Residential Sector
During the week, Mi Vida Homes announced its entry into Kenya’s luxury Real Estate segment through a Kshs 5.6 bn residential development in Tatu City, signaling a strategic shift from its traditional focus on mid-market and affordable housing. The project, known as 156 Elara, represents the developer’s response to growing demand for high-end housing and reflects broader trends in Kenya’s evolving property landscape, where satellite towns are increasingly attracting premium investments.
The development will comprise 156 townhouses set on approximately 5 acres, offering a mix of 3 bedroom duplexes and 4 bedroom triplexes priced at Kshs 25.6 mn and Kshs 44.5 mn respectively designed for high-end buyers. At Kshs 167,048.8 per SQM on average, an 84.5% premium to the Kshs 90,554 per sqm average in Ruiru the development is positioned at the upper end of the market. Its location in Tatu City positions it within one of the country’s fastest-growing urban nodes, attracting both investors and homeowners seeking modern living environments outside congested city centers.
The project is expected to strengthen the appeal of satellite towns as viable alternatives to traditional urban areas. It may also encourage more developers to diversify into the luxury segment, increasing competition while driving improvements in housing quality, design, and overall urban development in regions like Kiambu County.
-
Real Estate Investments Trusts
-
REITs Weekly Performance
On the Unquoted Securities Platform Acorn D-REIT and I-REIT traded at Kshs 27.4 and Kshs 23.2per unit, respectively, as per the last updated data on 10th April 2026. The performance represented a 33.4% and 14.5% gain for the D-REIT and I-REIT, respectively, from the Kshs 20.0 inception price. The volumes traded for the D-REIT and I-REIT came in at 13.4 mn and 42.2 mn shares, respectively. Additionally, ILAM Fahari I-REIT traded at Kshs 13.8 per share as of 10th April 2026, representing a 31.0% loss from the Kshs 20.0 inception price. The volume traded to date came in at 1.2 mn shares for the I-REIT, REITs offer various benefits, such as tax exemptions, diversified portfolios, and stable long-term profits. However, the ongoing decline in the performance of Kenyan REITs and the restructuring of their business portfolios are hindering significant previous investments. Additional general challenges include:
-
Insufficient understanding of the investment instrument among investors leading to a slower uptake of REIT products,
-
Lengthy approval processes for REIT creation,
-
High minimum capital requirements of Kshs 100.0 mn for REIT trustees compared to Kshs 10.0 mn for pension funds Trustees, essentially limiting the licensed REIT Trustee to banks only
-
The rigidity of choice between either a D-REIT or and I-REIT forces managers to form two REITs, rather than having one Hybrid REIT that can allocate between development and income earning properties
-
Limiting the type of legal entity that can form a REIT to only a trust company, as opposed to allowing other entities such as partnerships, and companies,
-
We need to give time before REITS are required to list – they would be allowed to stay private for a few years before the requirement to list given that not all companies maybe comfortable with listing on day one, and,
-
Minimum subscription amounts or offer parcels set at Kshs 0.1 mn for D-REITs and Kshs 5.0 mn for restricted I-REITs. The significant capital requirements still make REITs relatively inaccessible to smaller retail investors compared to other investment vehicles like unit trusts or government bonds, all of which continue to limit the performance of Kenyan REITs.
We expect the performance of Kenya’s Real Estate sector to remain resilient, supported by several factors: i) Mi Vida Homes’ launch of a Kshs 5.6 bn luxury residential project in Tatu City, signaling growing private sector investment and expansion into high-end housing within satellite urban developments. However, challenges such as the weak investor appetite in listed REITs like ILAM Fahari I-REIT and high capital requirements will continue to constrain the sector’s optimal performance.
The private sector contributes significantly to Kenya's economic growth, with increased access to credit driving real GDP expansion. Credit availability is essential for businesses to expand, innovate, and stay competitive. Recent data from the Central Bank of Kenya (CBK) shows that credit to the private sector expanded by 8.1% as of March 2026, reflecting the impact of lowering of the Central Bank Rate by CBK which has in turn made the cost of borrowing cheaper. As the government aims to reduce its fiscal deficit, fostering a supportive environment for private sector growth, especially for micro, small, and medium enterprises (MSMEs), will be crucial for increasing revenue collection. Achieving this requires policy reforms to strengthen the credit market and the introduction of sector-specific funds to drive business growth in key industries like finance, agriculture, manufacturing, and transport. Compared to developed economies, Kenya's private sector faces limited credit access, relying heavily on commercial banks with minimal availability of alternative financing options such as venture capital, equity financing, or government-backed credit programs. According to Central Bank of Kenya, banks continue to be the primary source of business credit, supplying a total Kshs 4.1 tn extended to the private sector as of January 2026, 79.8% of the total extended to the sector (inclusive of microfinances and SACCOs), with the highest allocations directed towards Trade (17.8%), Private Households (14.5%) and Manufacturing (14.3%).
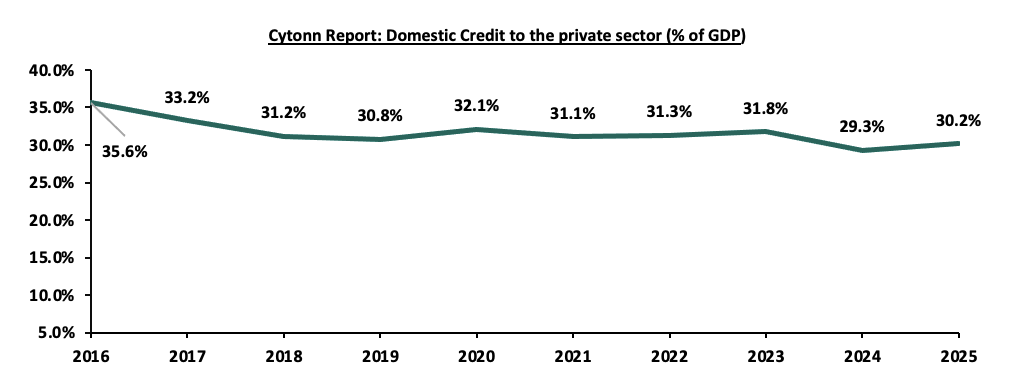
In 2025, Kenya’s domestic credit to the private sector by banks to GDP ratio stood at 30.2%, indicating Kenya must enhance credit access for the private sector while also broadening the range of available credit sources to reduce its heavy dependence on the banking sector. Diversifying credit options will strengthen the support for businesses and improve overall financial resilience.
We have been tracking the evolution of Kenya’s private sector credit growth and below are the most recent topicals we have done on the subject:
-
The Private Sector Credit growth in Kenya – In March 2025, we analysed the private sector credit growth trend in Kenya for 2024.
-
The State of Credit Availability in Kenya’s Private Sector - In September 2024, we highlighted Kenya’s state of lending to the private sector and gave our recommendations on what can be done to improve credit access to the private sector,
-
The Hustler Fund- In December 2022, we highlighted the Financial Inclusion Fund, dubbed the “Hustler Fund” launched on 30th November 2022, aimed at improving credit access to citizens at the bottom of the pyramid who have often struggled to obtain affordable credit,
-
Kenya’s Credit Reference Bureau Framework- Released in November 2022, this topical sheds more light on the Credit Reference Bureau (CRB) Framework in Kenya following the announcement by the Central Bank of Kenya that it had updated the Credit Information Sharing Framework in November 2022, which mandated the Credit Reference Bureaus (CRBs) not to use negative credit scores as the only reason to deny credit, and recommended the fast implementation of the risk based pricing model by commercial banks,
-
Kenya’s Cost of Credit- Released in January 2022, the topical shed more light on Kenya’s high cost of credit remains with the big banks charging a higher cost of credit in comparison to smaller banks owing to their strong pricing power based on a wide distribution network, multiple services and well- established brands.
In this week’s topical, we shall focus on the status of Kenya’s private sector credit growth, highlighting the evolution and current state of lending to the private sector. We will provide specific recommendations on measures that can be implemented to improve credit access to the private sector. We shall do this by looking into the following:
-
Introduction,
-
The evolution of Kenya’s Private sector credit,
-
Factors influencing private sector credit growth,
-
Role of Government and its Impact on Private Sector Credit Availability
-
Comparative analysis, and,
-
Conclusion and Key consideration to improving private sector credit performance in Kenya
Section I: Introduction
The private sector comprises the segment of the economy operated and owned by individuals, partnerships, and corporations, rather than the government. Private sector credit refers to financial resources extended to these businesses by institutions other than central banks. This includes loans, trade credits, and non-equity securities that come with repayment obligations. In Kenya, primary providers of private sector credit include commercial banks, capital markets, SACCOs, microfinance institutions, and insurance companies.
Kenya's private sector is a key contributor to economic growth and job creation and is mainly composed of small and medium-sized enterprises (SMEs), which account for over 90.0% of all private businesses and employ approximately 85.0% of the workforce. However, SMEs and informal enterprises often face significant difficulties in accessing credit due to banks' high-risk perceptions and the elevated costs of borrowing. These challenges have restricted business growth and reduced competitiveness. Unlike developed economies, where only 40.0% of business financing is sourced from banks and 60.0% from capital markets, Kenyan businesses are heavily reliant on banks, with 99.0% of their funding coming from this source and just 1.0% from capital markets, according to the World Bank. This reflects the limited availability of alternative financing options in the country.
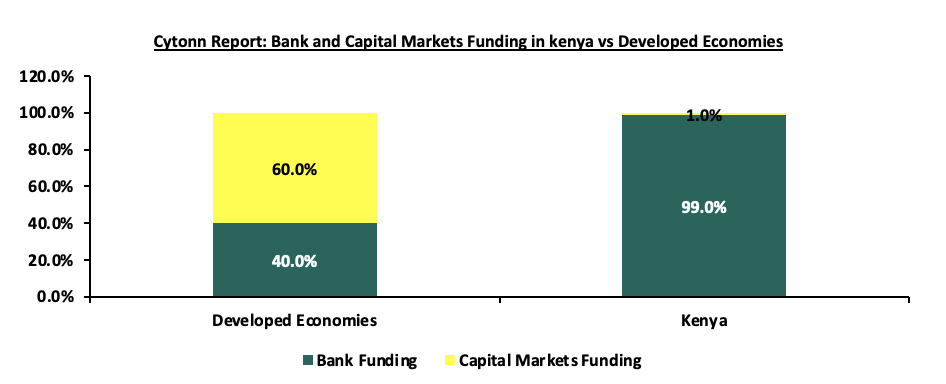
Source: World Bank
Section II: The Evolution of Kenya’s Private Sector Credit
-
Private Sector Credit Growth
According to CBK, over the last five years, there has been consistent growth in private sector lending, with the total credit extended to the private sector increasing at a 5-year CAGR of 6.3%, to Kshs 5.1 tn in January 2026 from Kshs 3.7 tn in January 2022, in line with the relative economic growth averaging at 5.0% for the last 5 years. This can be attributed to the increase in Banking sector credit to the private sector at a 5-year CAGR of 5.6% to Kshs 4.1 tn in January 2026 from Kshs 3.1 tn in January 2022 coupled with increase in credit from SACCOS and Microfinances at a 5-yr CAGR of 9.8% to Kshs 1.0 tn in January 2026 from Kshs 0.6 tn in January 2022. The graph below shows the cumulative private credit over the period under review:
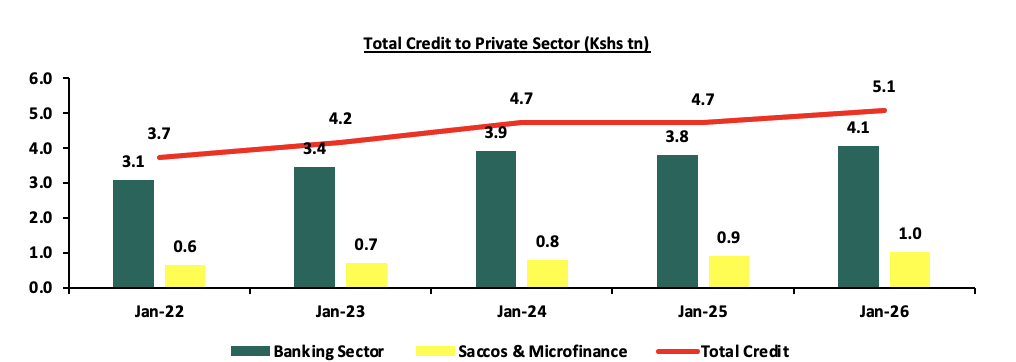
Source: Central Bank of Kenya
According to Central Bank of Kenya, the banking sector remains the dominant lender in Kenya's private sector, accounting for 79.8% of total private sector credit equivalent to Kshs 4.1 tn as of January 2026. SACCOs and microfinance institutions provided the remaining 20.2%, equivalent to Kshs 1.0 tn. Notably, the contribution from SACCOs and microfinance has been gradually increasing, rising by 0.8% points to 20.2% in January 2026 from 19.4% in January 2025. As of January 2026, private households received the largest share of private sector credit at Kshs 1,436.2 bn, representing 28.3% of the total Kshs 5,078.7 bn extended. Within the banking sector, the trade sector attracted the most credit, amounting to Kshs 722.7 bn or 17.8% of total bank lending. This was followed by the private households and manufacturing sector, which received 14.4% and 14.3% of total bank credit, respectively.
Year-on-year, the Mining and Quarrying sector saw the highest credit growth, expanding by 57.9% to Kshs 28.9 bn from Kshs 18.3 bn in January 2025. The Transport and Communication sector experienced notable decline, with credit decreasing by 9.2% to Kshs 329.8 bn from Kshs 363.3 bn over the same period.
Private sector credit growth from the banking sector was on an upward trajectory in 2025 and kept the same momentum in 2026, expanding by 6.4% to Kshs 4.1 tn in January 2026 from Kshs 3.8 tn in January 2025. This improvement is mainly due to the improved borrowing capacity of businesses and households, driven by lower interest rates seen in 2025 and early 2026. This can be attributed to CBK’s effort to ease its monetary policy by decreasing the Central Bank Rate (CBR) by 225 basis points to 9.00% in January 2026, from 11.25% in January 2026. As a result, borrowing costs declined, making loans cheaper and increasing demand. This reduction in the CBR rates helped in increasing additional liquidity to banks.
In February 2025, CBK reduced the Cash Reserve Ratio (CRR) by 100.0 basis points to 3.25% from 4.25% in order to compliment the lowering of CBR by releasing additional liquidity to the banks. This has helped increase liquidity available to commercial banks for lending to the private sector, and thus supporting growth of credit to the sector and led to an improvement in private sector lending since there is enough cash to act as credit to consumers. Credit expansion was primarily driven by sectors such as Mining and Quarrying, Other activities, Building and Construction and Agriculture, which recorded year-on-year expansion rates of 57.9%, 47.2%, 35.3%, and 28.3%, respectively. On the other hand, Transport and Communication, Business Activities and Real Estate sectors experienced decline in credit uptake, with year-on-year decline of 9.2%, 2.1% and 2.0%, respectively. Additionally, the continued rise in gross non-performing loans (NPLs) has led to increased caution among lenders in specific sectors. Reduced NPL levels have lowered the risk profile for banks, with total gross NPLs reaching Kshs 680.3 bn in January 2026, representing 0.5% marginal decrease from Kshs 683.4 bn in January 2025. As such, the notable decrease in the CBR, has forced banks to lower their lending rates to 14.8% from 16.6% in January 2025. The table below shows the sectoral credit uptake growth on y/y and year-to-date basis from the banking sector:
|
Cytonn Report: Sectoral Credit Uptake (Kshs bn) |
|||||
|
Sector |
Jan-25 |
Dec-25 |
Jan-26 |
Last 12 months change (%) |
YTD |
|
Mining and Quarrying |
18.3 |
28.4 |
28.9 |
57.9% |
1.8% |
|
Other activities |
98.8 |
158.4 |
145.4 |
47.2% |
(8.2%) |
|
Building and construction |
136.2 |
184.4 |
184.3 |
35.3% |
(0.1%) |
|
Agriculture |
149.3 |
192.0 |
191.5 |
28.3% |
(0.3%) |
|
Consumer durables |
433.1 |
479.6 |
479.2 |
10.6% |
(0.1%) |
|
Finance & Insurance |
144.1 |
158.8 |
159.0 |
10.3% |
0.1% |
|
Trade |
674.3 |
739.4 |
722.7 |
7.2% |
(2.3%) |
|
Private households |
554.1 |
584.1 |
586.0 |
5.8% |
0.3% |
|
Manufacturing |
575.1 |
584.2 |
578.8 |
0.6% |
(0.9%) |
|
Real Estate |
457.2 |
449.0 |
448.0 |
(2.0%) |
(0.2%) |
|
Business services |
204.8 |
197.2 |
200.4 |
(2.1%) |
1.6% |
|
Transport & Communication |
363.3 |
330.2 |
329.8 |
(9.2%) |
(0.1%) |
|
Total credit growth |
3,808.6 |
4,085.7 |
4,054.0 |
6.4% |
(0.8%) |
Source: Central Bank of Kenya
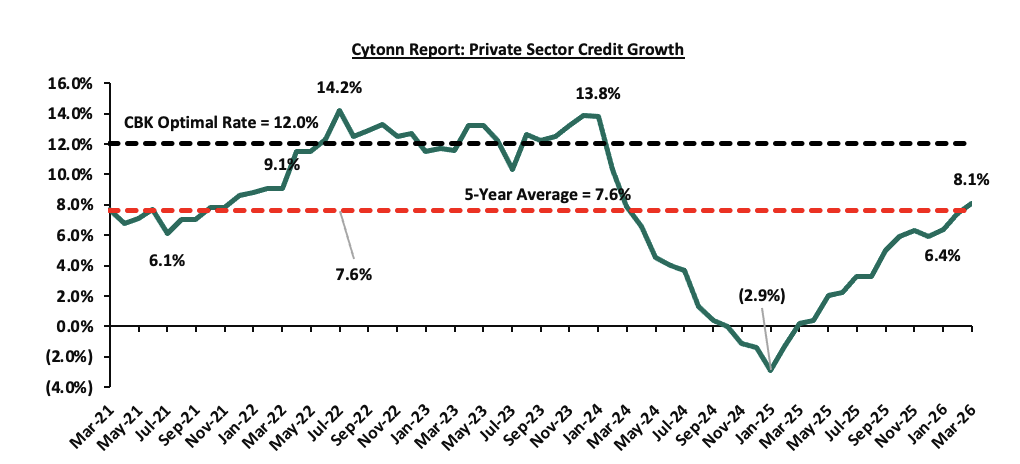
Kenya’s private sector credit growth has staged a notable recovery from its 2.9% contraction in January 2025, climbing steadily to reach 8.1% by March 2026 and finally surpassing the 5-year average of 7.6%. This upward trajectory has been primarily fuelled by the Central Bank of Kenya’s (CBK) decisive easing cycle, which saw the Central Bank Rate (CBR) lowered from 12.75% in August 2024 to 8.75% in April 2026. However, the path toward the 12.0% optimal growth target remains obscured by heightened geopolitical volatility; persistent global conflicts threaten to trigger supply chain disruptions and imported inflation, which may force the MPC to halt further easing to maintain currency stability. Consequently, while the domestic environment currently supports expansion, the outlook for 2026 remains cautiously optimistic as the market must navigate the dual pressures of maintaining momentum and hedging against geopolitical tensions between Iran and US could tighten credit conditions once again.
The chart below shows the movement of the private sector credit growth:
Source: Central Bank of Kenya
Section III: Factors Influencing Private Sector Credit Growth
Private sector credit uptake is influenced by a number of factors which include;
-
Interest rates – Interest rates set by central banks and financial institutions play a significant role influencing the credit market. On the demand side, higher interest rates increase both borrowing costs and debt servicing expenses, limiting the capacity of businesses and individuals to take on additional credit while lower interest rates reduces borrowing costs, expanding the capacity of businesses and individuals to take up more credit . By January 2026, the average lending rate stood at 14.8%, reflecting a decrease of 1.8% points from 16.6% in January 2025. The Central Bank of Kenya's (CBK) decision to lower the CBR by 225 basis points to 9.00% in January 2026 from 11.25% in January 2025 eased liquidity, prompting commercial banks to lower lending rates which improved borrowing conditions which in turn stimulated credit growth.
-
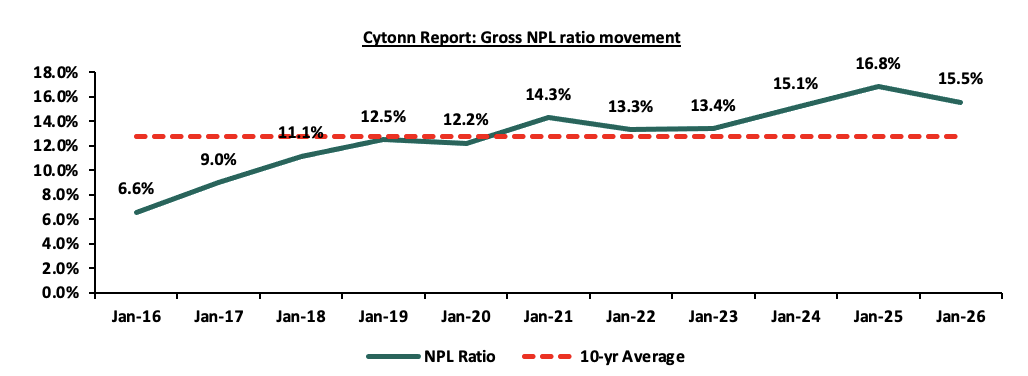
Elevated Credit Risk which contributes to high risk premiums – The high-risk perception prompts lenders to incorporate risk premiums into the interest rates they charge on loans resulting in higher borrowing costs for individuals and businesses seeking credit. The risk premium acts as a cushion for lenders against potential losses, reflecting the level of uncertainty and perceived risk associated with the borrower. Additionally, according to the Central Bank of Kenya (CBK), credit risk reduced with Gross Non-Performing Loans (NPLs) to Gross Loans Ratio standing at 15.5% at the end of January 2026, a 1.3% points decrease from 16.8% recorded at the end of January 2025, attributable to a decrease in gross NPLs of 0.5% compared to an increase in gross loans of 7.7%. The graph below shows the movement for the years under review;
- Government domestic borrowing - Commercial banks have continued to hold the highest proportion of Government domestic debt, coming at 47.8% as at December 2025. This is mainly attributable to banks preference to lend to the government, which is considered a risk-free investment, effectively crowding out the private sector, which is considered riskier. The table below shows the holders of domestic public debt for the last 8 years;
Domestic Public Debt by Holder (Percent)
Dec-18
Dec-19
Dec-20
Dec-21
Dec-22
Dec-23
Dec-24
Dec-25
Banking Institutions
54.5%
54.3%
52.8%
50.2%
46.8%
46.1%
45.1%
47.8%
Insurance companies
6.1%
6.4%
6.4%
6.8%
7.4%
7.2%
7.3%
13.5%
Parastatals
7.3%
6.5%
5.7%
5.6%
6.1%
5.5%
5.6%
7.4%
Pension Funds
27.6%
28.6%
30.3%
31.3%
33.3%
29.9%
28.9%
14.7%
Other Investors
4.8%
4.2%
4.7%
6.0%
6.4%
11.3%
13.2%
16.6%
- Technological Advancements – Technological innovations, including Fintech solutions and mobile banking systems, have significantly enhanced digital lending. Mobile money platforms, in particular, have made credit more accessible, especially for individuals without conventional banking relationships, fostering a more inclusive financial landscape. These advancements highlight the growing role of technology in shaping the future of credit accessibility in Kenya. As digital financial services continue to advance, an increasing number of businesses and individuals can secure the funding they need for growth, ultimately contributing to the country's overall economic development.
- Inflation rates – Easing inflation led the Central Bank of Kenya to loosen its monetary policy by decreasing CBR by 200.0 bps to 8.75% in April 2026 from 10.75% in March 2025, decreasing borrowing costs for both businesses and households. As lending rates decreased, access to credit became cheaper, encouraging many from taking on new loans. This resulted in an upturn in private sector credit growth, particularly in industries such as manufacturing and trade, which faced challenges in financing operations and investments due to higher debt servicing costs.
Despite the Central Bank of Kenya’s efforts to stabilize the economy, the transition into mid-2026 remains precarious as domestic gains face stiff resistance from global volatility. While the Monetary Policy Committee (MPC) has successfully steered inflation to within the target range of 2.5%–7.5% following the double-digit peaks of early 2025, this stability is under threat; the escalating geopolitical tensions between the US and Iran have introduced a significant "risk premium" on global oil prices, threatening to re-ignite imported inflation and halt the current easing cycle. The cooling business environment is already reflected in the March 2026 PMI of 47.7, which indicates a contraction in private sector activity compared to the 51.7 recorded in March 2025. Consequently, while the recent reduction of the CBR to 8.75% from 10.75% in March 2025 was intended to stimulate credit, this is being overshadowed by uncertainty. Going forward, businesses and households may remain hesitant to take on new debt as they weigh the benefits of lower domestic rates against the high operational costs driven by global instability, likely keeping credit growth below the 12.0% optimal target for the remainder of the year. - Over-reliance on the banking sector – Historically, banks have played a dominant role in providing credit to the private sector, accounting for 99.0% of total lending as of December 2025. This heavy reliance on banks has resulted in a lack of diversification in funding sources for businesses. To foster a more resilient and well-rounded credit ecosystem, it is crucial to explore alternative financing options such as capital markets and non-banking financial institutions. To mitigate the systemic risks associated with overdependence on the banking sector, the government should implement strategies to strengthen other financial sectors, including leasing, venture capital funds, development finance institutions, and bond and equity markets. Creating an enabling environment for these alternatives would promote a more balanced and inclusive approach to credit access, and,
- High cost of credit –Borrowing comes with additional overhead costs beyond interest charges, including bank fees, legal fees, government levies, valuation fees, and insurance, all of which are the borrower's responsibility. These extra expenses raise the overall cost of credit, making borrowing more expensive and ultimately reducing demand for credit within the private sector.
- Geopolitical Risks: The ongoing geopolitical conflict exerts significant pressure on Kenya's private sector credit growth by introducing a persistent war premium on global energy and commodity prices, which threatens to re-ignite imported inflation and halt the Central Bank’s interest rate easing cycle.
Section IV: Role of Government and its Impact on Private Sector Credit Availability
Impact of the Government on the Private Sector
The government of Kenya plays a crucial role in shaping the environment for private sector credit availability. The following are some of the ways in which the Kenyan Government impacts the flow of credit to the private sector;
-
Government's Fiscal Policy and Debt Management
The government’s fiscal policy, particularly its domestic borrowing practices, has a profound effect on private sector credit availability. Heavy government borrowing from the domestic market competes with private sector borrowers for available credit, leading to a crowding-out effect. This occurs when increased government borrowing reduces the funds available for businesses, thereby driving up interest rates and limiting access to affordable credit. As a result, private sector investments are constrained, and financial market stability may be threatened. According to the Central Bank of Kenya (CBK), gross government domestic debt has grown at a 10-year Compounded Annual Growth Rate (CAGR) of 13.5%, reaching Kshs 6.8 tn in 2025 from Kshs 1.9 tn in 2016. The chart below shows the steady growth of gross domestic debt over this period;
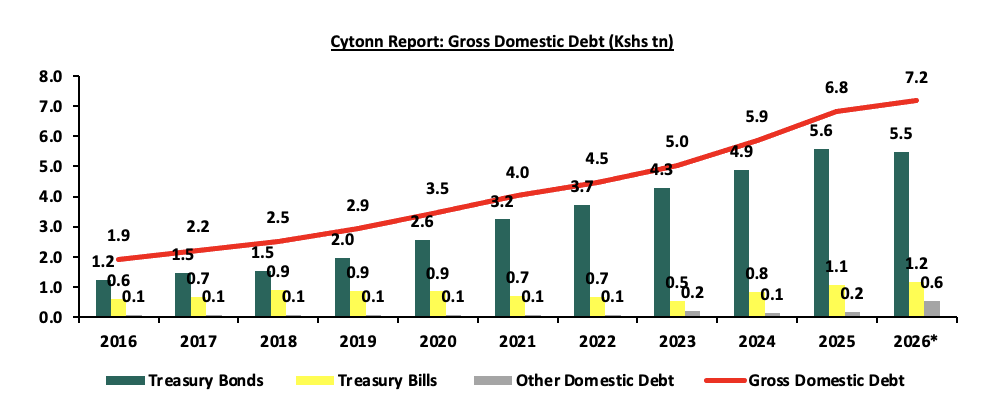
Source: Central Bank of Kenya (CBK)
*data as of 24 th April, 2026
Additionally, as of December 2025 commercial banks held an average of 47.8% of this domestic debt, lowering the risk of crowding out the private sector, as banks are now reducing their lending to the government and prioritizing private businesses. The chart below highlights the distribution of government debt holdings across various institutions;

Source: Central Bank of Kenya (CBK)
**Others include insurance companies, parastatals and retail holders
-
Regulatory Framework
The regulatory framework plays a crucial role in shaping credit availability. The CBK, through capital adequacy requirements and liquidity management rules, ensures that banks have enough funds to support private sector lending while maintaining stability. For instance, the requirement by the National Treasury to review the minimum core capital requirement for commercial banks to Kshs 10.0 bn by December 2029, up from the current Kshs 1.0 bn, is expected to strengthen the resilience of banks, enabling them to better absorb risks and extend more credit to the private sector. As of December 2026, banks are expected to have a core capital of Kshs 5.0 bn up from Kshs 3.0 bn required in December 2025. However, this could also reduce competition if smaller banks struggle to meet the new requirement, potentially limiting credit options for some businesses in the short term.
Additionally, the integration of Credit Reference Bureaus (CRBs) has allowed lenders to assess the creditworthiness of businesses and individuals, improving access to credit while managing risk exposure. By tailoring credit assessments to individual borrower profiles, the regulatory framework promotes a more informed lending environment, benefiting both banks and the private sector.
-
Monetary Policy
The Central Bank of Kenya’s monetary policy, particularly its Central Bank Rate (CBR), directly influences borrowing costs. The relationship between the Central Bank Rate (CBR) and the commercial bank's lending rates is crucial in understanding credit accessibility in Kenya's private sector. The CBR, set by the Central Bank of Kenya, acts as a benchmark for determining the cost of borrowing in the market, and fluctuations in this rate tend to influence the interest rates that commercial banks apply on loans.
The easing cycle that characterized the period between March 2025 and April 2026 marked a strategic pivot in Kenya’s monetary policy, aimed at reversing the stagnation in private sector borrowing. After the initial 75.0 bps cut to 10.00% in April 2025 from 10.75% in March 2025 set the stage, the Central Bank aggressively accelerated its accommodative stance throughout the year, bringing the CBR down to 8.75% by April 2026. This 400.0 bps total reduction effectively narrowed the spread between the policy rate and commercial lending rates, which dropped to 14.8% from 15.8% in March 2025. While this transmission of lower rates provided much-needed relief to the private sector, the analysis reveals a "lag effect" where lending rates did not fall as fast as the CBR, reflecting banks' cautious assessment of the deteriorating business environment shown in the contracting PMI. By April 2026, the focus has shifted from the availability of cheap credit to the appetite for it, as the positive impact of lower borrowing costs is currently being tested by external inflationary pressures that threaten to stall this downward trajectory. The chart below shows the trend in commercial banks weighted average lending rates between January 2025 and February 2026;
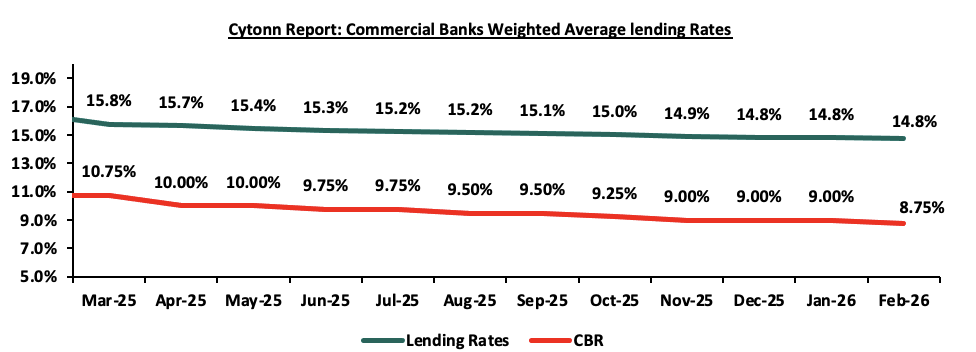
Source: Central Bank of Kenya (CBK)
The consistent easing of the CBR to 8.75% from 10.75% in March 2025 has played a crucial role in alleviating the challenges previously faced by the private sector. By reducing the CBR by 400.0 basis points between January 2025 and February 2026, the Central Bank of Kenya successfully influenced commercial lending rates to drop to 14.8% from 16.6%. This reduction in borrowing costs is expected to stimulate investment and expansion activities, particularly for interest-rate-sensitive small and medium-sized enterprises (SMEs). As lending rates continue to stabilize at these lower levels, the private sector is better positioned to access affordable credit, providing significant relief to businesses and supporting broader economic growth into 2026.
-
Initiatives placed by the government and CBK to promote private sector credit growth
Based on the importance on private sector contribution to GDP, the Central Bank of Kenya (CBK), in collaboration with other stakeholders, has implemented various measures ranging from licensing of new products, technological innovations and public education to promote credit growth in Kenya. Some of the initiatives include;
-
Licensing of Innovative Financial Products – By facilitating the introduction of innovative lending solutions, investment tools, and financial products, the central bank has played a key role in broadening credit access for businesses and individuals. Notably, in April 2026, the Central Bank of Kenya (CBK) approved licenses for 32 additional Digital Credit Providers (DCPs), increasing the total number to 227, following the licensing of 42 DCPs in December 2025. This initiative aligns with CBK’s strategic commitment to enhancing credit availability in the private sector by fostering and expanding digital lending options.
-
Diversifying Funding Strategies – Through incorporating alternative borrowing strategies, the government aims to reduce its reliance on domestic credit from commercial banks, and as a result, enhancing the ease of credit access to the private sector. Sourcing of alternative funding by the government mitigates the pressure on the local credit market, creating room for private sector entities to secure loans more easily. Notably, Eurobonds, as a form of commercial borrowing, have been a significant component of the government's debt strategy. However, by exploring concessional options, the government not only broadens its funding sources but also ensures a balance that is more conducive to a sustained economic growth,
-
Boosting Liquidity in the Banking sector- In February 2025 the CBK reviewed the Cash Reserve Ratio and set it at 3.25% as at February 2025, from the existing 4.25% to compliment lowering of the CBR rate. This adjustment released additional liquidity to banks and hence it’s expected to lower the cost of funds as well as the lending rates, and thus support growth of credit to the private sector.
-
Implementation of the Financial Inclusion Fund - The Financial Inclusion Fund, commonly known as the National Youth Opportunities Towards Advancement (NYOTA), is a government-sponsored initiative aimed at providing low-income Kenyan Youth with convenient access to credit through their phones. Launched in February 2026, the primary objective of the NYOTA is to make credit affordable to a significant portion of the population that has long been excluded from formal credit systems. The introduction of the NYOTA underscores the government's commitment to enhancing financial inclusion and expanding access to credit,
-
Other government special Funds – Under the Public Finance Management Regulations, the government introduced various loan programs aimed at empowering women, youth, and persons with disabilities (PWDs), including the Youth Development Fund, Uwezo Fund, and Women Enterprise Fund. These initiatives are designed to expand credit access for marginalized and underserved groups, aligning with broader efforts to promote private sector credit growth by addressing financial barriers faced by these special groups.
Additionally, the banking system has put in place measures to aid private sector credit growth such as;
-
Tailoring Credit with Risk-Based Pricing – The Central Bank of Kenya approved risk-pricing models for 38 out of the 38 commercial banks as a measure of tailoring loans to a customer’s financial profile while helping banks and other lenders to manage their risk exposure. The initiative has continued to increase credit accessibility to the private sector based on an individual financial profile in terms of borrowing and repayment history, and,
-
Digital Transformation – Most Kenyan banks have embraced digital technologies, streamlining and expediting the loan application and approval processes. The implementation of user-friendly mobile and online platforms facilitates quicker access to credit, enhancing the efficiency of transactions for businesses and individuals. Banks such as KCB and NCBA partnered with Safaricom to offer the overdraft credit facility of Fuliza in increasing credit lending to SMEs. Additionally, KCB has the VOOMA app specifically targeting lending to small and medium enterprises.
Section V: Comparative analysis
According to the latest data by World Bank, Kenya’s domestic credit extended to the private sector outperformed majority of the Sub-Saharan countries. The Kenya’s domestic credit extended to private sectors as a percentage of the GDP came in at 30.2%, 3.0% points higher than the average Sub-Saharan domestic credit to private sectors lending which stood at 33.4% in the same period. Although Kenya outperformed some of Sub-Saharan countries in credit extended to the private sector, the country still underperformed against developed economies. The graph below shows domestic credit extended to the private sector over the years and a comparison of Kenya’s performance against selected economies;
Source: World Bank
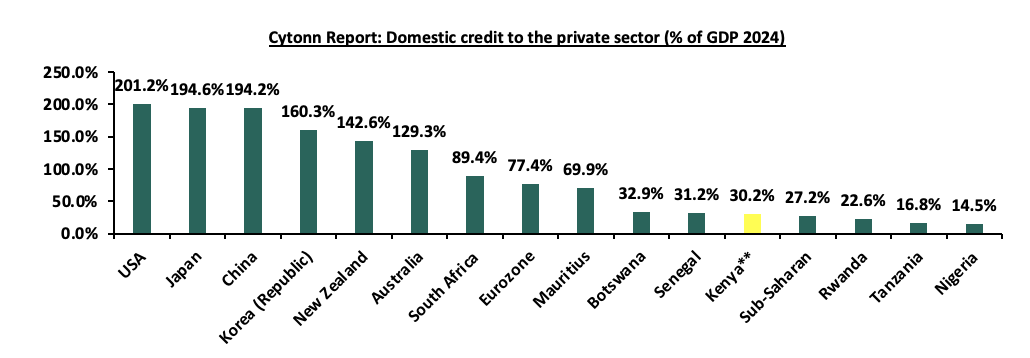
Source: World Bank 2024 data
Kenya** as of 2025
Different developed countries have adopted different measures in enhancing private sector credit growth. Some of the successful measures include:
-
Project Finance Structuring-This financing method leverages a project’s own operating cash flow and assets to mitigate investment risks and secure funding at a lower cost. A notable historical example is China’s 1997 initiative, where Plantation Timber Products (Hubei) Ltd launched a USD 57.0 mn greenfield project to install modern medium-density fibreboard plants in interior China. The International Finance Corporation (IFC) played a pivotal role by arranging USD 26.0 mn in syndicated loans, utilizing the limited-recourse nature of project finance. At the time, foreign commercial banks were hesitant to invest in China’s less-developed interior provinces, making this a pioneering effort.
-
Universal Supervisory Body to Monitor Fund Disbursements- The United Kingdom’s British Business Bank (BBB) exemplifies this measure by overseeing government-backed funding programs such as the Enterprise Finance Guarantee Scheme (EFGS), the British Growth Fund (BGF), the Funding for Lending Scheme (FLS), and the Start Up Loans Scheme (SLS). The BBB ensures accountability and transparency in fund allocation, fostering trust among private sector participants and encouraging credit uptake.
Section VI: Conclusion and Key Considerations
The private sector is a significant contributor to the Kenyan GDP. However, credit availability remains a major hindrance for the sector’s growth. To offset the downside, the government of Kenya needs to adopt or emulate the funding model used by the developed economies in creating an enabling environment for two or more players to compete within the Kenyan credit market. Additionally, the government needs to adopt a consumer-centred approach for borrowing to encourage private sector credit demand. We believe that additional measures need to be implemented in order to promote private sector credit growth. Below are some of the initiatives that the government can adopt;
-
Developing the capital markets to expand alternative financing options - The Kenyan credit market is largely dominated by commercial banks, leaving businesses with limited funding choices. Strengthening the bond and equity markets can offer long-term financing solutions for businesses. Regulatory improvements, tax incentives for investors, and awareness campaigns can encourage more companies to raise capital through these markets, reducing reliance on bank loans. Additionally, the government can promote fintech solutions and digital lending platforms to increase accessibility to credit.
-
Enhancing financial inclusion and credit awareness - Many small businesses struggle to access credit due to a lack of financial literacy and poor credit histories. Nationwide financial literacy programs can equip businesses with the knowledge to manage credit effectively and improve their creditworthiness. The government, in collaboration with financial institutions, can also develop tools to help businesses understand their credit scores and improve their financial planning.
-
Enhancing oversight on government-backed fund initiatives to promote transparency - Government-backed funds such as the Hustler Fund, Uwezo Fund and Youth Enterprise Development Fund play a crucial role in financing small businesses. However, their effectiveness depends on transparency and accountability. Establishing independent monitoring bodies to oversee fund distribution, regularly publishing reports on disbursements and setting clear eligibility criteria can enhance trust and efficiency in these programs.
-
Encouraging sector-specific credit policies - Some industries, such as agriculture and manufacturing, require specialized financial products tailored to their unique needs. The government can work with financial institutions to develop sector-specific loan products with favorable terms, such as lower interest rates and longer repayment periods, to support key industries that drive economic growth.
-
Strengthening credit guarantee schemes - Many businesses fail to secure loans due to a lack of collateral. Expanding credit guarantee schemes and partnering with financial institutions can help mitigate lender risk to provide loans to SMEs. The government can enhance existing guarantee programs that back a portion of the loans given to small businesses, reducing the perceived risk for lenders.
-
Diversify Funding Sources Beyond Banks: To reduce the overreliance on banks for credit, it is essential to develop and expand access to capital markets. Encouraging businesses and individuals to explore alternative financing options, such as corporate bonds, venture capital, and equity financing, will improve financial flexibility and foster economic resilience.
The outlook for Kenya’s private sector remains promising, though it is navigating external pressures from the ongoing conflict in the Middle East. While credit expanded by 8.1% as of March 2026 due to a stronger Shilling and lower interest rates, geopolitical tensions have introduced risks via supply chain disruptions and energy shocks. Consequently, the CBK has adopted a cautious stance, maintaining the CBR at 8.75% in April 2026 to manage imported inflation. Despite these headwinds, the sector benefits from a cumulative 225 basis point reduction in the CBR since its 2024 peak, lowering average lending rates to 14.8%. With a reduced 3.25% Cash Reserve Ratio boosting liquidity and risk-based pricing implemented across all 38 commercial banks, the environment remains supportive of growth. Strategic government initiatives are expected to sustain this momentum throughout 2026.
Disclaimer: The views expressed in this publication are those of the writers where particulars are not warranted. This publication, which is in compliance with Section 2 of the Capital Markets Authority Act Cap 485A, is meant for general information only and is not a warranty, representation, advice or solicitation of any nature. Readers are advised in all circumstances to seek the advice of a registered investment advisor

- Talk to us
- Kenya
- P.O Box 20695 - 00200, Nairobi, Kenya
- Cell +254709101200
- Tel +254709101200
- WhatsApp +254741676635
- United States
- +254709101200
- DOWNLOAD OUR APP
-


- Kenya
- 8th Floor, Pinetree Plaza, Kaburu Drive, Ngong Road, Nairobi, Kenya
- USA
- Suite 1150, 1775 Eye Street NW, USA, Washington DC 20006, USA
- Investments
- High Yield
- Private Equity
- Real Estate
- Real Estate
- RiverRun Estates
- Cytonn Towers
- The Ridge
- Taraji Heights
- The Alma