Cytonn Monthly - January 2025
By Research team, Feb 2, 2025
Executive Summary
Fixed Income
During the month of January 2025, T-bills were oversubscribed, with the overall average subscription rate coming in at 104.7%, albeit lower than the subscription rate of 106.3% recorded in December 2024. The overall average subscription rate for the 91-day and 364-day paper decreased to 259.3% and 84.9% respectively, from 260.8% and 103.3% respectively, while the overall average subscription rates for the 182-day paper increased to 62.6%, from 47.5% which was recorded in December 2024. The average yields on the government papers were on a downward trajectory during the month, with the 91-day, 182-day, and 364-day papers yields decreasing by 69.0 bps, 35.9 bps, and 50.8 bps to 9.6%, 10.0%, and 11.3% respectively, from 10.3%, 10.4%, and 11.8% recorded the previous month. For the month of January, the government accepted a total of Kshs 91.1 bn of the Kshs 100.5 bn worth of bids received in T-Bills, translating to an acceptance rate of 90.6% compared to an acceptance rate of 87.3% in the month of December;
During the week, T-bills were undersubscribed, with the overall subscription rate coming in at 56.1%, a reversal from the subscription rate of 136.7% recorded the previous week. Investors’ preference for the shorter 91-day paper waned, with the paper receiving bids worth Kshs 2.5 bn against the offered Kshs 4.0 bn, translating to an undersubscription rate of 61.6%, significantly lower than the oversubscription rate of 419.8%, recorded the previous week. The subscription rates for the 182-day and 364-day papers decreased to 28.6% and 81.3% respectively, from the 38.2% and 122.0% recorded the previous week. The government accepted a total of Kshs 13.1 bn worth of bids out of Kshs 13.5 bn bids received, translating to an acceptance rate of 97.2%. The yields on the government papers recorded a mixed performance, with the yields on the 364-day paper increasing by 1.9 bps to 11.31% from 11.29% recorded the previous week, while the yields on the 182-day paper decreased by 0.04 bps to remained relatively unchanged at 10.03%, while the yields on the 91- day paper decreased by 0.3 bps to 9.52% from 9.53% recorded the previous week;
Additionally, January 2025 bonds were oversubscribed, with the overall average subscription rate coming in at 196.7%, lower than the average subscription rate of 276.7% recorded in December 2024. The reopened bonds FXD1/2018/015 and FXD1/2022/025 with tenors to maturity of 8.3 years and 22.7 years respectively and fixed coupon rates of 12.7% and 14.2% respectively, received bids worth Kshs 59.0 bn against the offered Kshs 30.0 bn translating to an oversubscription rate of 196.7%. The government accepted bids worth Kshs 48.5 bn, translating to an acceptance rate of 82.2%, with the average accepted yields coming at 14.2% and 15.7% for the FXD1/2018/015 and FXD1/2022/025 respectively;
In the primary bond market, the government is looking to raise Kshs 70.0 bn through the reopened two infrastructure bonds; IFB1/2022/14 and IFB1/2023/17 with a tenor to maturity of 11.8 years and 15.1 years respectively. The bonds will be offered at fixed coupon rates of 13.9% and 14.4% respectively. The period of sale opened on Thursday, 23rd January 2025, and will close on 12th February 2025. Our bidding range for the reopened bonds are 12.85%-13.55% and 12.95%-13.65% for the IFB1/2022/14 and IFB1/2023/17 respectively;
During the week, KNBS released the y/y inflation for January 2025 noting that inflation increased slightly by 0.3% points to 3.3%, from the 3.0% recorded in December 2024. This was in line with our projected range of 3.1% to 3.4%, where our decision was mainly driven by rise in fuel prices in January, coupled with an ease in the Central Bank Rate (CBR) to 11.25% in December 2024, from 12.00%;
The Monetary Policy Committee (MPC) is set to meet on Wednesday, 5th February 2025, to review the outcome of its previous policy decisions and recent economic developments, and to decide on the direction of the Central Bank Rate (CBR). We expect the MPC to cut the Central Bank Rate (CBR) by 50 bps to 100 bps, bringing it to within a range of 10.25% - 10.75% with their decision mainly being supported by rate cuts by global economies, the need to further support the economy, anchored inflationary pressures and the continued stability of the Shilling against major currencies;
Equities
During the month of January 2025, the equities market was on an upward trajectory, with NSE 20 gaining the most by 7.6%, while NASI, NSE 25 and NSE 10 gained by 3.9%, 1.0% and 0.8% respectively. The equities market positive performance was driven by gains recorded by large-cap stocks such as Bamburi, EABL, and KCB Group of 7.7%, 2.8%, and 2.8% respectively. The monthly performance was however weighed down by losses recorded by large cap stocks such as BAT, Equity Group and Absa of 3.6%, 2.3% and 0.6% respectively;
During the week, the equities market was on a downward trajectory, with NSE 10 declining the most by 4.3%, while NSE 25, NASI and NSE 20 declined by 3.7%, 3.2% and 1.1% respectively, taking the YTD performance to gains of 5.0% and 2.3% for NSE 20 and NASI respectively, and YTD losses of 1.1% and 0.6%, for NSE 10 and NSE 25 respectively. The week on week equities market performance was driven by losses recorded by large-cap stocks such as Safaricom, KCB and EABL of 9.0%, 6.7%, and 6.6% respectively. The performance was, however, supported by gains recorded by large-cap stocks such as Bamburi, Coop and Stanbic Holdings of 7.7%, 2.2% and 0.7% respectively;
Also, during the week, Kenya Power & Lighting Company Plc (KPLC) released its H1’2025 financial results, for the period ending 31st December 2024, recording a significant 3025.4% improvement in profitability, with Profit After Tax (PAT) increasing to Kshs 10.0 bn, from Kshs 0.3 bn in H1’2024. The increase was mainly driven by, an 86.9% reduction in finance costs to Kshs 1.9 bn in H1’2025, from Kshs 15.0 bn in H1’2024, coupled with a 14.1% decline in the cost of sales to Kshs 71.3 bn, from Kshs 83.0 bn in H1’2024. The performance was however weighed down by a 5.4% decline in the total revenue to Kshs 107.4 bn, from 113.6 bn in H1’2024 attributed to lower pass-through costs and tariff adjustments;
During the week, East African Breweries Plc (EABL) released their H1’2025 financial results for the period ending 31stDecember 2024, recording a 19.6% increase in Profits After Tax (PAT) to Kshs 8.1 bn in H1’2025, from Kshs 6.8 bn in H1’2024. The increase was mainly attributable to the 14.4% decrease in finance costs to Kshs 3.4 bn from Kshs 4.0 bn in H1’2024, coupled with a 2.1% increase in net revenue to Kshs 67.9 bn from Kshs 66.5 bn in H1’2024. The performance was however weighed down by the 4.9% increase in the operating costs to Kshs 13.7 bn in H1’2025, from Kshs 13.1 bn in H1’2024;
Real Estate
During the week, Mi Vida Homes announced a strategic partnership with HF Group Kenya’s banking division, to enhance homeownership and real estate investment in the country. As part of the agreement, HFC will provide up to 95.0% mortgage financing at a fixed interest rate of 9.5% for a repayment period of up to 20 years;
On the Unquoted Securities Platform, Acorn D-REIT and I-REIT traded at Kshs 25.4 and Kshs 22.2 per unit, respectively, as per the last updated data on 17th January 2025. The performance represented a 27.0% and 11.0% gain for the D-REIT and I-REIT, respectively, from the Kshs 20.0 inception price. Additionally, ILAM Fahari I-REIT traded at Kshs 11.0 per share as of 17th January 2025, representing a 45.0% loss from the Kshs 20.0 inception price;
Investment Updates:
-
Weekly Rates: Cytonn Money Market Fund closed the week at a yield of 16.4% p.a. To invest, dial *809# or download the Cytonn App from Google Play store here or from the Appstore here;
-
We continue to offer Wealth Management Training every Tuesday, from 7:00pm to 8:00 pm. The training aims to grow financial literacy among the general public. To register for any of our Wealth Management Trainings, click here;
-
If interested in our Private Wealth Management Training for your employees or investment group, please get in touch with us through wmt@cytonn.com;
-
Cytonn Insurance Agency acts as an intermediary for those looking to secure their assets and loved ones’ future through insurance namely; Motor, Medical, Life, Property, WIBA, Credit and Fire and Burglary insurance covers. For assistance, get in touch with us through insuranceagency@cytonn.com;
-
Cytonn Asset Managers Limited (CAML) continues to offer pension products to meet the needs of both individual clients who want to save for their retirement during their working years and Institutional clients that want to contribute on behalf of their employees to help them build their retirement pot. To more about our pension schemes, kindly get in touch with us through pensions@cytonn.com;
Hospitality Updates:
- We currently have promotions for Staycations. Visit cysuites.com/offers for details or email us at sales@cysuites.com;
Money Markets, T-Bills Primary Auction:
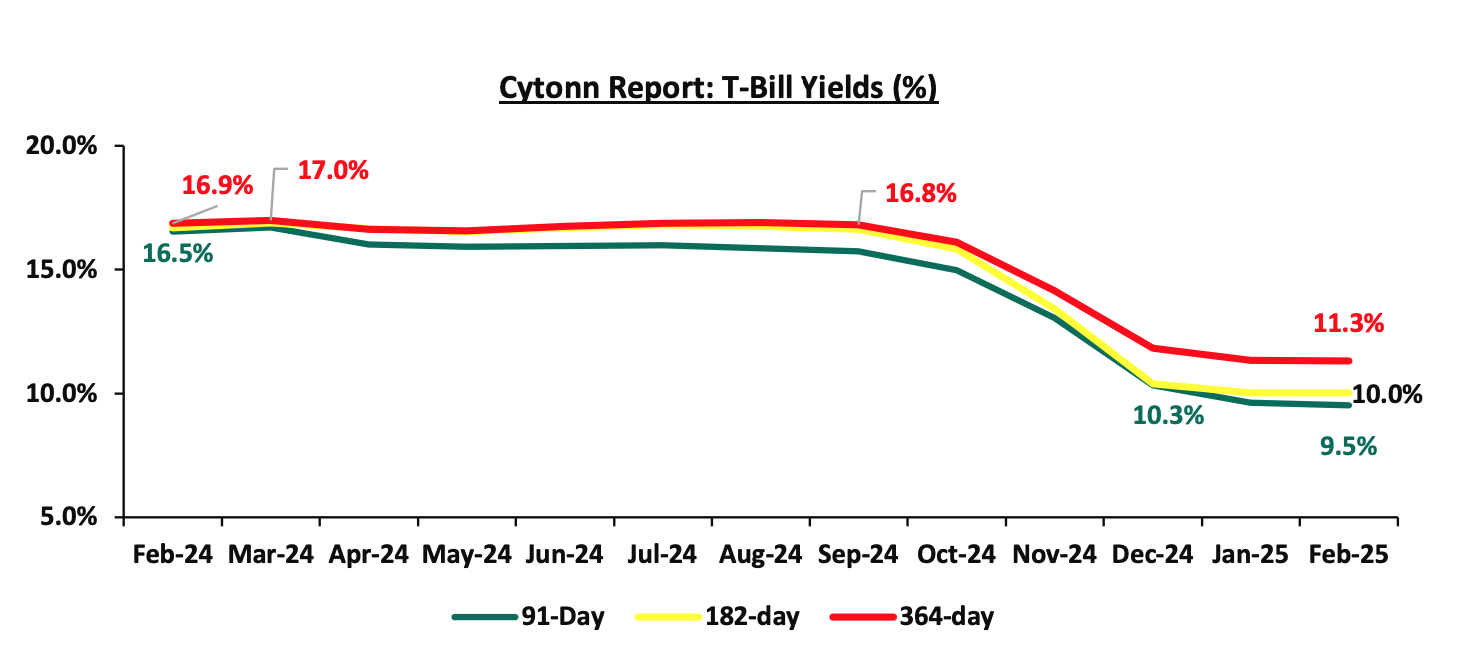
During the month of January 2025, T-bills were oversubscribed, with the overall average subscription rate coming in at 104.7%, albeit lower than the subscription rate of 106.3% recorded in December 2024. The overall average subscription rate for the 91-day and 364-day paper decreased to 259.3% and 84.9% respectively, from 260.8% and 103.3% respectively, while the overall average subscription rates for the 182-day paper increased to 62.6%, from 47.5% which was recorded in December 2024. The average yields on the government papers were on a downward trajectory during the month, with the 91-day, 182-day, and 364-day papers yields decreasing by 69.0 bps, 35.9 bps, and 50.8 bps to 9.6%, 10.0%, and 11.3% respectively, from 10.3%, 10.4%, and 11.8% recorded the previous month. For the month of January, the government accepted a total of Kshs 91.1 bn of the Kshs 100.5 bn worth of bids received in T-Bills, translating to an acceptance rate of 90.6% compared to an acceptance rate of 87.3% in the month of December.The chart below shows the yield growth rate for the 91-day paper from 2024 to date:

During the week, T-bills were undersubscribed, with the overall subscription rate coming in at 56.1%, a reversal from the subscription rate of 136.7% recorded the previous week. Investors’ preference for the shorter 91-day paper waned, with the paper receiving bids worth Kshs 2.5 bn against the offered Kshs 4.0 bn, translating to an undersubscription rate of 61.6%, significantly lower than the oversubscription rate of 419.8%, recorded the previous week. The subscription rates for the 182-day and 364-day papers decreased to 28.6% and 81.3% respectively, from the 38.2% and 122.0% recorded the previous week. The government accepted a total of Kshs 13.1 bn worth of bids out of Kshs 13.5 bn bids received, translating to an acceptance rate of 97.2%. The yields on the government papers recorded a mixed performance, with the yields on the 364-day paper increasing by 1.9 bps to 11.31% from 11.29% recorded the previous week, while the yields on the 182-day paper decreased by 0.04 bps to remained relatively unchanged at 10.03%, while the yields on the 91- day paper decreased by 0.3 bps to 9.52% from 9.53% recorded the previous week.
The charts below show the performance of the 91-day, 182-day and 364-day papers from January 2024 to January 2025:
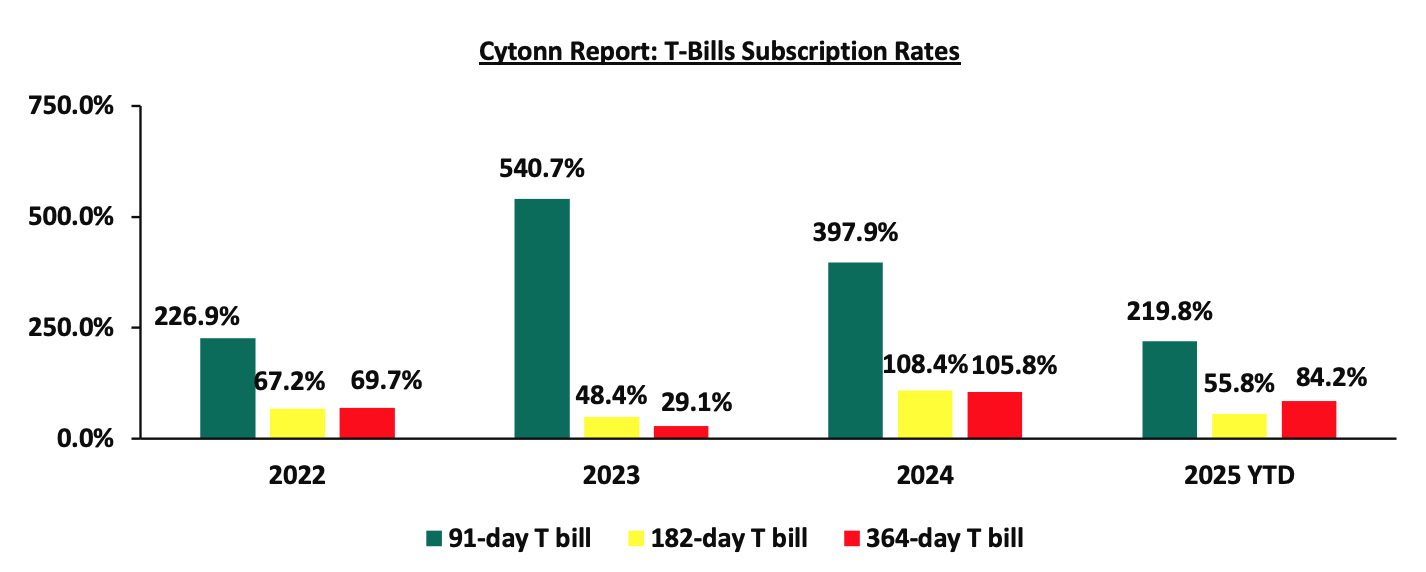
So far in the current FY’2024/25, government securities totaling Kshs 1,078.0 bn have been advertised. The government has accepted bids worth Kshs 1,246.1 bn, of which Kshs 848.0 bn and Kshs 398.1 bn were treasury bills and bonds, respectively. The government has a domestic borrowing surplus of Kshs 552.4 bn in FY’2024/25, 35.3% ahead of its net domestic borrowing target of Kshs 408.4 bn for FY’2024/25.
The chart below compares the overall average T-bill subscription rates obtained in 2022,2023, 2024 and 2025 Year-to-date (YTD):
Additionally, January 2025 bonds were oversubscribed, with the overall average subscription rate coming in at 196.7%, lower than the average subscription rate of 276.7% recorded in December 2024. The reopened bonds FXD1/2018/015 and FXD1/2022/025 with tenors to maturity of 8.3 years and 22.7 years respectively and fixed coupon rates of 12.7% and 14.2% respectively, received bids worth Kshs 59.0 bn against the offered Kshs 30.0 bn translating to an oversubscription rate of 196.7%. The government accepted bids worth Kshs 48.5 bn, translating to an acceptance rate of 82.2%, with the average accepted yields coming at 14.2% and 15.7% for the FXD1/2018/015 and FXD1/2022/025 respectively.
The table below provides more details on the bonds issued in December 2024 and January 2025:
|
Cytonn Report: Bond Issuances in December 2024 and January 2025 |
|||||||||
|
Issue Date |
Bond Auctioned |
Effective Tenor to Maturity (Years) |
Coupon |
Amount offered (Kshs bn) |
Actual Amount Raised (Kshs bn) |
Total bids received |
Average Accepted Yield |
Subscription Rate |
Acceptance Rate |
|
20/01/2025 |
FXD1/2022/025 -Reopened |
22.8 |
14.2% |
30.0 |
24.7 |
28.4 |
15.7% |
196.7% |
82.2% |
|
FXD1/2018/015-Reopened |
8.3 |
12.7% |
23.8 |
30.6 |
14.2% |
||||
|
09/12/2024 |
FXD1/2018/020 - Reopened |
14.2 |
13.2% |
25.0 |
53.4 |
71.3 |
14.7% |
285.3% |
74.9% |
|
FXD1/2023/010 - Reopened |
8.1 |
14.2% |
15.1% |
||||||
|
16/12/2024 |
FXD1/2024/010 -Reopened |
9.3 |
16.0% |
20.0 |
43.4 |
53.6 |
14.7% |
268.1% |
81.0% |
|
January 2025 Average |
15.6 |
13.4% |
30.0 |
48.5 |
59.0 |
14.9% |
196.7% |
82.2% |
|
|
December 2024 Average |
10.5 |
14.5% |
45.0 |
96.9 |
124.9 |
14.8% |
276.7% |
78.0% |
|
|
2024 Average |
6.7 |
15.6% |
27.7 |
28.9 |
37.9 |
16.7% |
116.8% |
74.9% |
|
In the primary bond market, the government is looking to raise Kshs 70.0 bn through the reopened two infrastructure bonds; IFB1/2022/14 and IFB1/2023/17 with a tenor to maturity of 11.8 years and 15.1 years respectively. The bonds will be offered at fixed coupon rates of 13.9% and 14.4% respectively. The period of sale opened on Thursday, 23rd January 2025, and will close on 12th February 2025. Our bidding range for the reopened bonds are 12.85%-13.55% and 12.95%-13.65% for the IFB1/2022/14 and IFB1/2023/17 respectively;
Secondary Bond Market:
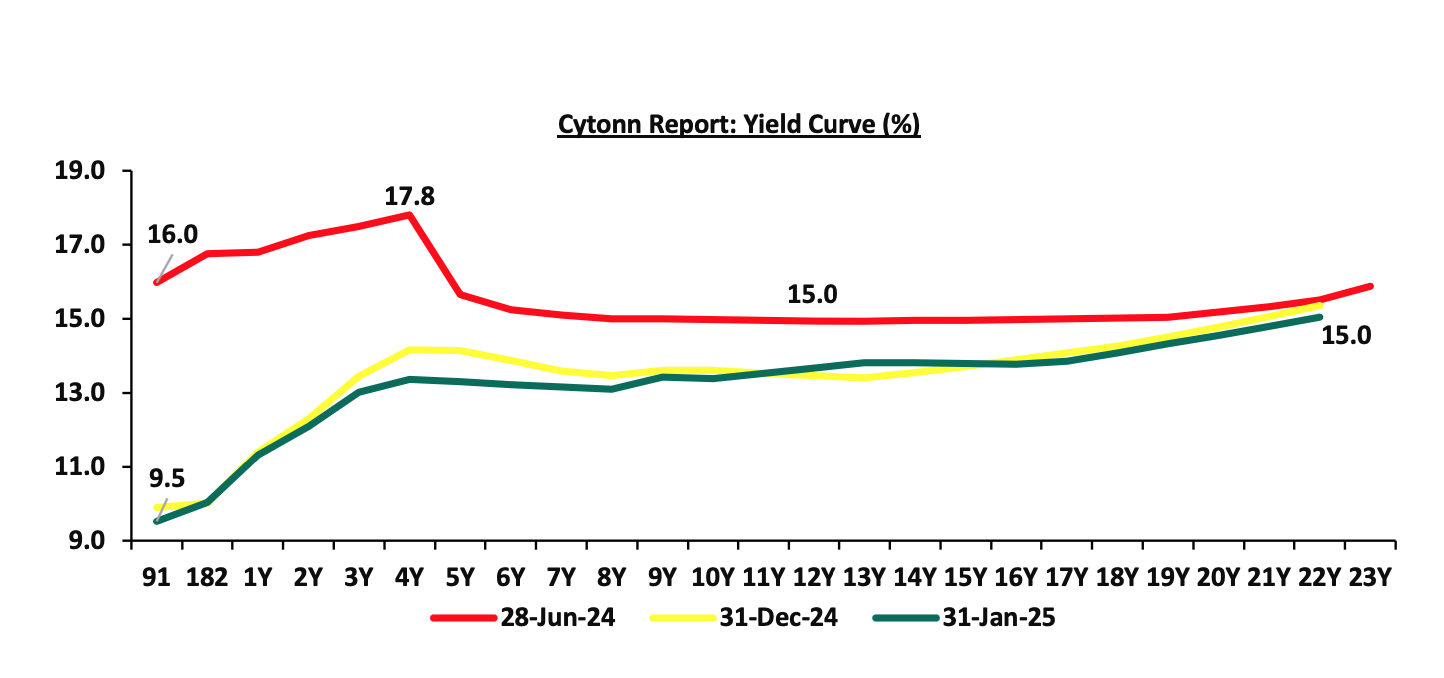
The yields on the government securities were on a downward trajectory during the month compared to December 2024, save for the 12yrs-15yrs tenors, primarily driven by continued effort by the government to reject highly priced bids, local currency stabilization, and eased inflation. These factors reduced the need for investors to demand higher yields as compensation for inflation and currency depreciation risks, resulting in an overall decline across the yield curve. Notably, the yield curve has adjusted from a humped yield curve observed in 2023 and most part of 2024, towards a normal upward sloping curve, with long-term bonds registering highest yields. The shift in sentiment indicates increased confidence in the economic landscape. The chart below shows the yield curve movement during the period:
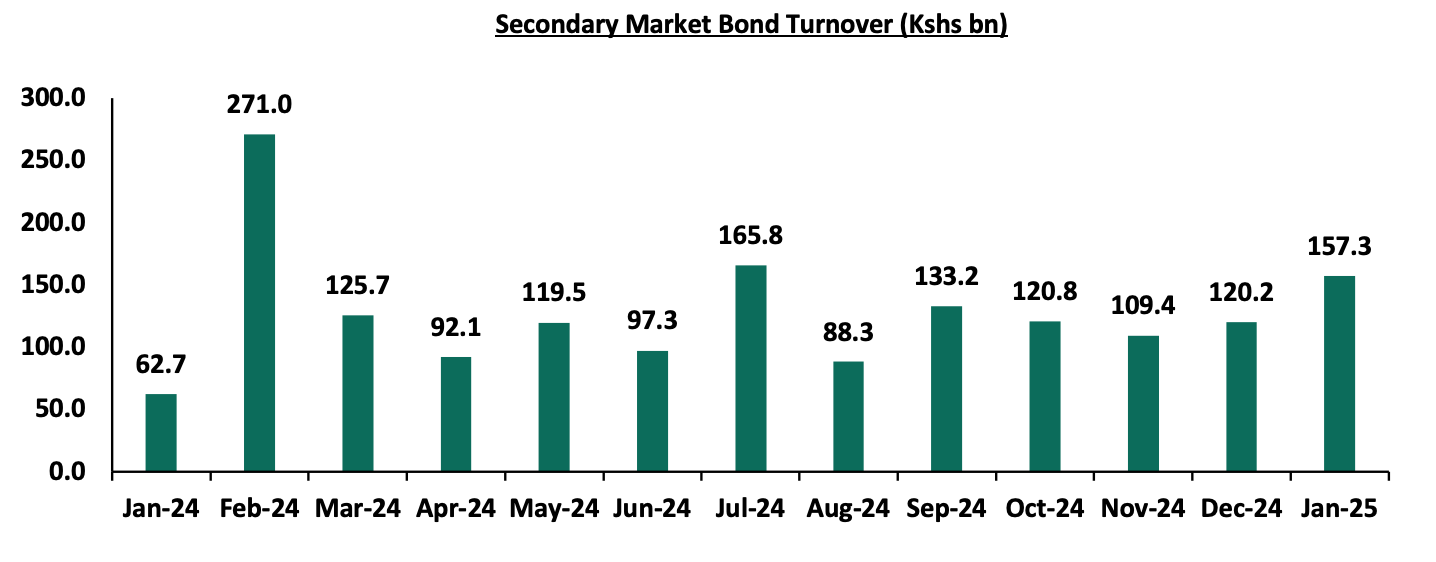
The secondary bond turnover increased by 30.9% to Kshs 157.3 bn, from Kshs 120.2 bn recorded in December 2024, pointing towards increased activities by commercial banks in the secondary bonds market for the month of January. Additionally, on a year-on-year basis, the bond turnover increased significantly by 151.0% from Kshs 62.7 bn worth of treasury bonds transacted over a similar period last year. The chart below shows the bond turnover over the past 12 months;
Money Market Performance:
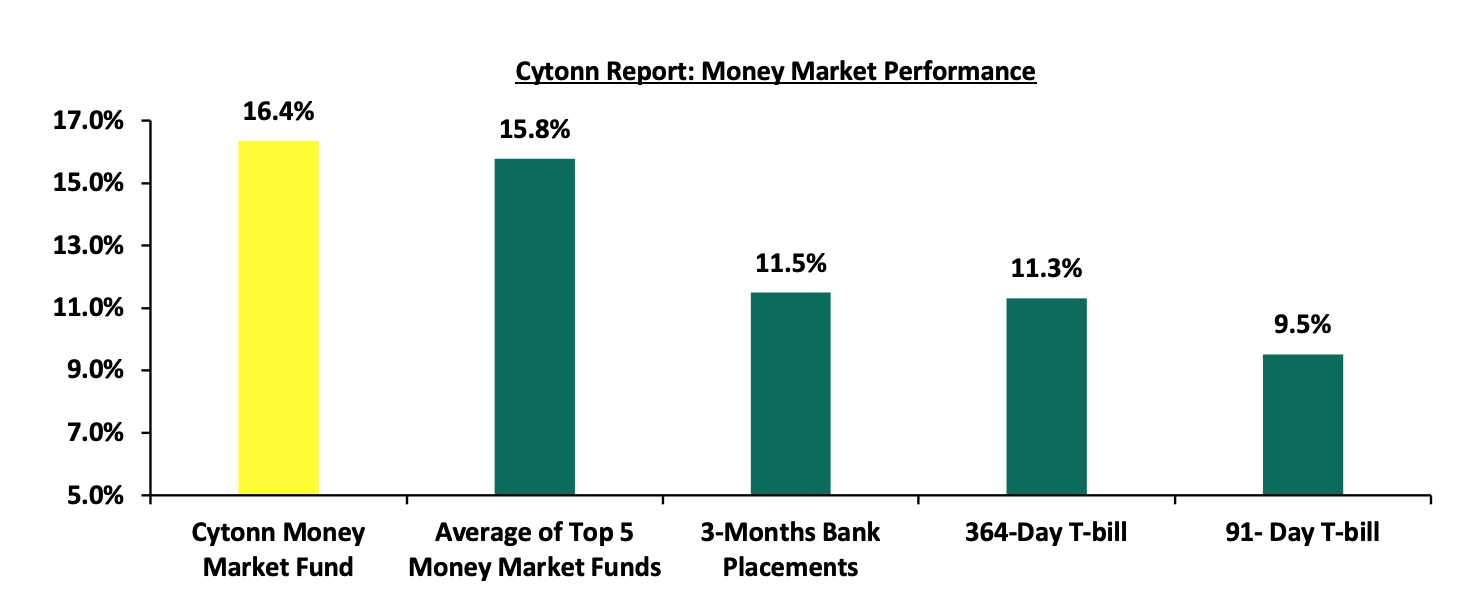
In the money markets, 3-month bank placements ended the week at 11.5% (based on what we have been offered by various banks), and yields on the government papers recorded a mixed performance, with the yields on the 364-day paper increasing by 1.9 bps to 11.31% from 11.29% recorded the previous week, while the yields on the 91- day paper decreased by 0.3 bps to 9.52% from 9.53% recorded the previous week. The yield on the Cytonn Money Market Fund decreased by 14.0 bps to close the week at 16.4%, from the 16.5% recorded the previous week, while the average yields on the Top 5 Money Market Funds decreased by 8.0 bps to close the week at 15.8% from the 15.9% recorded the previous week.
The table below shows the Money Market Fund Yields for Kenyan Fund Managers as published on 31st January 2025:
|
Cytonn Report: Money Market Fund Yield for Fund Managers as published on 31st January 2025 |
||
|
Rank |
Fund Manager |
Effective Annual Rate |
|
1 |
Cytonn Money Market Fund (Dial *809# or download the Cytonn app) |
16.4% |
|
2 |
Gulfcap Money Market Fund |
16.3% |
|
3 |
Ndovu Money Market Fund |
15.5% |
|
4 |
Etica Money Market Fund |
15.5% |
|
5 |
Lofty-Corban Money Market Fund |
15.3% |
|
6 |
Kuza Money Market fund |
15.3% |
|
7 |
Mali Money Market Fund |
15.2% |
|
8 |
Arvocap Money Market Fund |
14.4% |
|
9 |
Madison Money Market Fund |
14.0% |
|
10 |
Dry Associates Money Market Fund |
13.7% |
|
11 |
GenAfrica Money Market Fund |
13.3% |
|
12 |
Jubilee Money Market Fund |
13.2% |
|
13 |
Sanlam Money Market Fund |
12.9% |
|
14 |
Orient Kasha Money Market Fund |
12.9% |
|
15 |
British-American Money Market Fund |
12.8% |
|
16 |
Old Mutual Money Market Fund |
12.6% |
|
17 |
Enwealth Money Market Fund |
12.6% |
|
18 |
CIC Money Market Fund |
12.4% |
|
19 |
ICEA Lion Money Market Fund |
12.4% |
|
20 |
Genghis Money Market Fund |
12.3% |
|
21 |
Faulu Money Market Fund |
12.1% |
|
22 |
Co-op Money Market Fund |
12.0% |
|
23 |
Nabo Africa Money Market Fund |
11.9% |
|
24 |
Absa Shilling Money Market Fund |
11.9% |
|
25 |
KCB Money Market Fund |
11.6% |
|
26 |
Apollo Money Market Fund |
11.3% |
|
27 |
AA Kenya Shillings Fund |
11.0% |
|
28 |
Ziidi Money Market Fund |
10.5% |
|
29 |
Stanbic Money Market Fund |
9.5% |
|
30 |
Mayfair Money Market Fund |
9.4% |
|
31 |
Equity Money Market Fund |
6.9% |
Source: Business Daily
Liquidity:
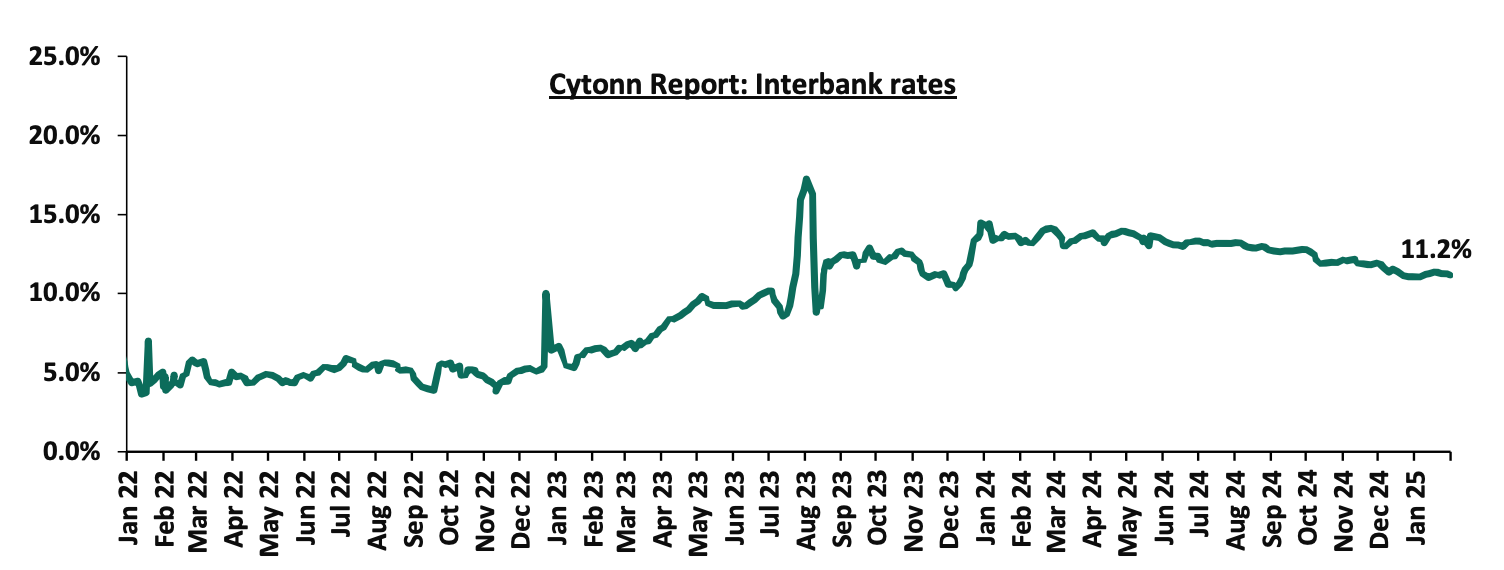
Liquidity in the money markets eased in the month of January 2025, with the average interbank rate decreasing by 19.8 bps to 11.2% from 11.4% recorded the previous month. However, during the month of January, the average interbank volumes traded decreased by 31.0% to Kshs 27.1 bn, from Kshs 39.3 bn recorded in December.
Additionally, during the week, liquidity in the money markets marginally eased, with the average interbank rate decreasing by 8.3 bps, to 11.2% from the 11.3% recorded the previous week, partly attributable to tax remittances that were offset by government payments. The average interbank volumes traded decreased by 3.9% to Kshs 22.3 bn from Kshs 23.1 bn recorded the previous week. The chart below shows the interbank rates in the market over the years:
Kenya Eurobonds:
During the month, the yields on the Eurobonds were on a downward trajectory, with the yield on the 12-year Eurobond issued in 2019 decreasing the most by 24.1 bps to 9.9% from 10.1% recorded at the end of December 2024.
During the week, the yields on Kenya’s Eurobonds recorded a mixed performance, with the yield on the 10-year Eurobond issued in 2018 decreasing the most by 8.8 bps to 8.9% from 9.0% recorded the previous week, while the yield on the 7-year Eurobond issued in 2019 increased the most by 1.6 bps to 8.4% from 8.3% recorded the previous week. The table below shows the summary performance of the Kenyan Eurobonds as of 30th January 2025;
|
Cytonn Report: Kenya Eurobond Performance |
||||||
|
|
2018 |
2019 |
2021 |
2024 |
||
|
Tenor |
10-year issue |
30-year issue |
7-year issue |
12-year issue |
13-year issue |
7-year issue |
|
Amount Issued (USD) |
1.0 bn |
1.0 bn |
0.9 bn |
1.2 bn |
1.0 bn |
1.5 bn |
|
Years to Maturity |
3.1 |
23.1 |
2.3 |
7.3 |
9.4 |
6.0 |
|
Yields at Issue |
7.3% |
8.3% |
7.0% |
7.9% |
6.2% |
10.4% |
|
31-Dec-24 |
9.1% |
10.3% |
8.5% |
10.1% |
10.1% |
10.1% |
|
02-Jan-25 |
9.1% |
10.3% |
8.5% |
10.1% |
10.1% |
10.1% |
|
23-Jan-25 |
9.0% |
10.2% |
8.3% |
10.0% |
10.0% |
10.0% |
|
24-Jan-25 |
8.9% |
10.2% |
8.3% |
9.9% |
9.9% |
9.9% |
|
27-Jan-25 |
9.0% |
10.3% |
8.5% |
10.0% |
10.0% |
10.1% |
|
28-Jan-25 |
9.0% |
10.2% |
8.5% |
9.9% |
10.0% |
10.0% |
|
29-Jan-25 |
8.9% |
10.2% |
8.3% |
9.9% |
9.9% |
9.9% |
|
30-Jan-25 |
8.9% |
10.2% |
8.4% |
9.9% |
9.9% |
10.0% |
|
Weekly Change |
(0.1%) |
(0.0%) |
0.0% |
(0.1%) |
(0.0%) |
0.0% |
|
M/M Change |
(0.1%) |
(0.1%) |
(0.1%) |
(0.2%) |
(0.2%) |
(0.2%) |
|
YTD Change |
(0.2%) |
(0.1%) |
(0.1%) |
(0.2%) |
(0.2%) |
(0.1%) |
Source: Central Bank of Kenya (CBK) and National Treasury
Kenya Shilling:
During the month, the Kenya Shilling appreciated by 4.9 bps against the US Dollar, to close the month at Kshs 129.2 from Kshs 129.3 recorded at the end of December 2024. Also, during the week, the Kenya Shilling appreciated against the US Dollar by 2.6 bps, to close the week at Kshs 129.2, from 129.3 recorded the previous week. On a year-to-date basis, the shilling has appreciated by 5.9 bps against the dollar, a contrast to the 17.4% appreciation recorded in 2024.
We expect the shilling to be supported by:
- Diaspora remittances standing at a cumulative USD 4,945.0 mn in 2024, 18.0% higher than the USD 4,190.0 mn recorded in 2023. The United States remained the largest source of remittances to Kenya accounting for 51.0% in the period, and,
- The tourism inflow receipts which came in at USD 352.5 bn in 2023, a 31.5% increase from USD 268.1 bn inflow receipts recorded in 2022, and owing to tourist arrivals that improved by 14.9% in the 12 months to October 2024, compared to a similar period in 2023.
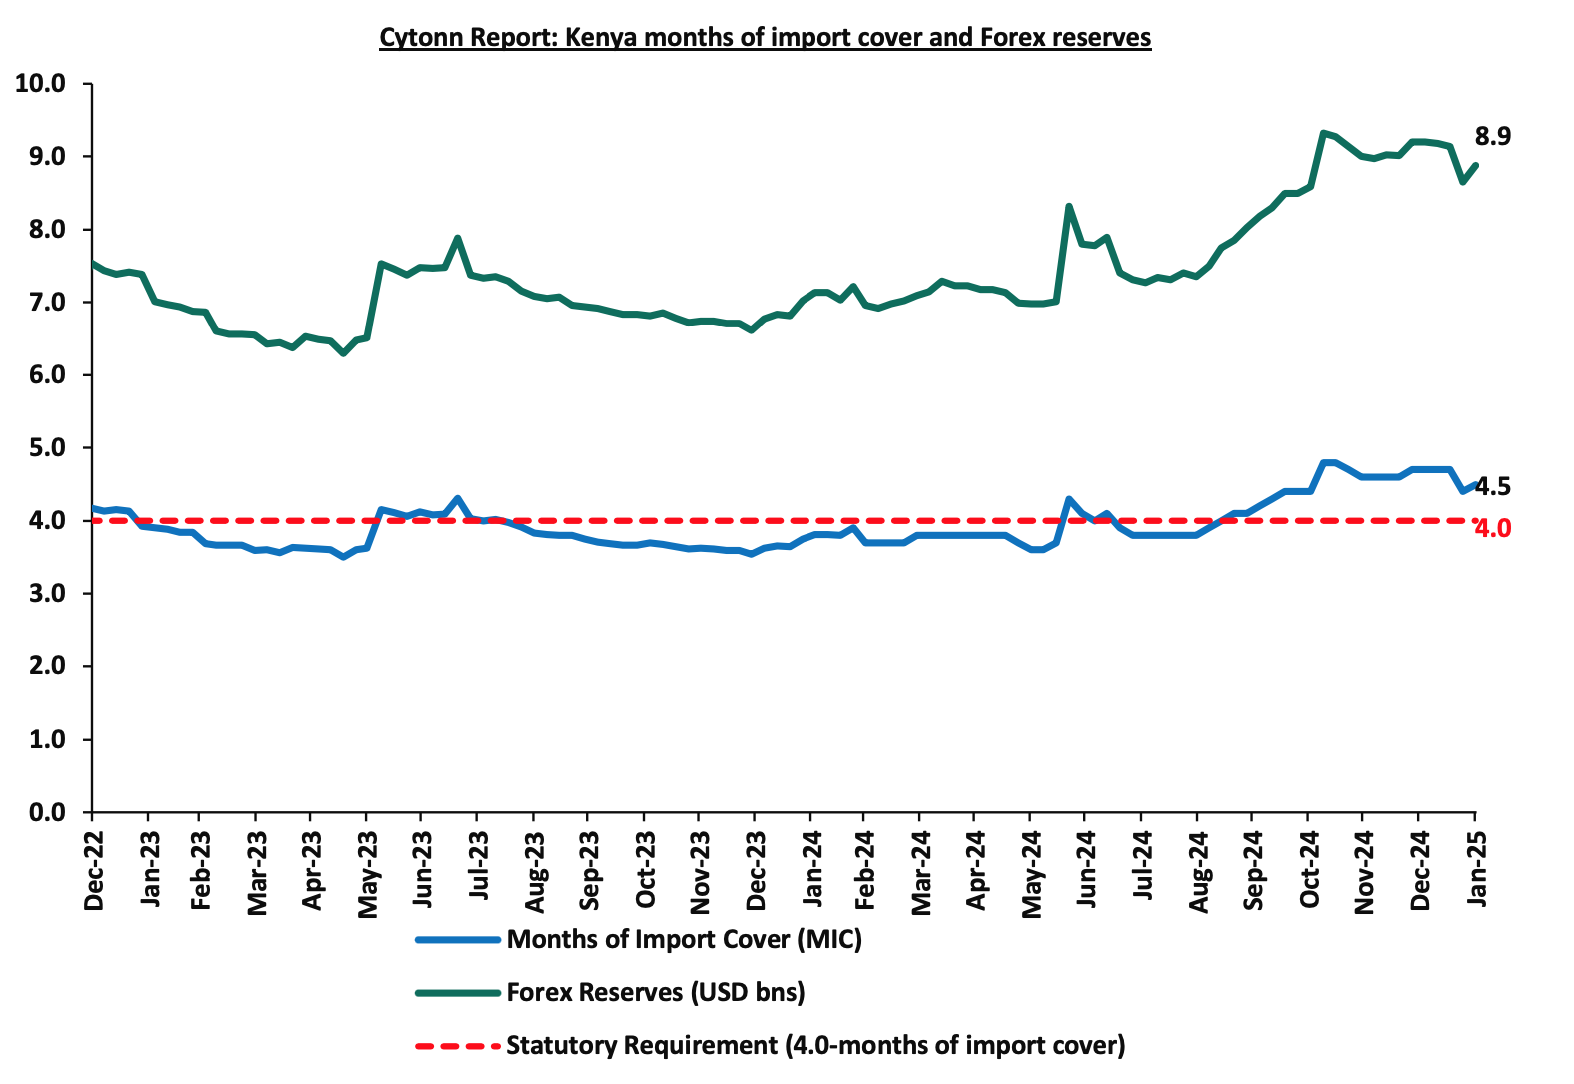
- Improved forex reserves currently at USD 8.9 bn (equivalent to 4.5-months of import cover), which is above the statutory requirement of maintaining at least 4.0-months of import cover and at par with the EAC region’s convergence criteria of 4.5-months of import cover.
The shilling is however expected to remain under pressure in 2025 as a result of:
- An ever-present current account deficit which came at 4.0% of GDP in Q3’2024 which remained relatively unchanged from Q3’2023 and,
- The need for government debt servicing, continues to put pressure on forex reserves given that 67.2% of Kenya’s external debt is US Dollar-denominated as of June 2024.
Key to note, Kenya’s forex reserves decreased by 3.5% during the month of January 2025, to USD 8.9 bn, from the USD 9.2 bn recorded in the previous month, equivalent to 4.5 months of import cover and above the statutory requirement of maintaining at least 4.0-months of import cover. Additionally, during the month, the months of import cover decreased by 4.3% to 4.5 months from 4.7 months recorded the previous month.
The chart below summarizes the evolution of Kenya's months of import cover over the years:
Weekly Highlights
- Inflation Highlight January 2025
The y/y inflation in January 2025 increased slightly by 0.3% points to 3.3%, from the 3.0% recorded in December 2024. This was in line with our projected range of 3.1% to 3.4%, where our decision was mainly driven by rise fuel prices in January, with maximum allowed price for Super Petrol, Diesel and Kerosene increasing by Kshs 0.3, Kshs 2.0 and Kshs 3.0 respectively, coupled with an ease in the Central Bank Rate (CBR) to 11.25% in December 2024, from 12.00%. The headline inflation in January 2025 was majorly driven by increase in prices of commodities in the following categories; Food & Non-Alcoholic Beverages, and Transport sector by 6.1% and 0.7% respectively. However, the commodity prices in Housing, Water, Electricity, Gas & other fuels declined by 1.6% during the period. The table below shows a summary of both the year-on-year and month-on-month commodity indices performance:
|
Cytonn Report: Major Inflation Changes – January 2025 |
|||
|
Broad Commodity Group |
Price change m/m (January-2025/ December -2024) |
Price change y/y (January-2025/January-2024) |
Reason |
|
Food and non-alcoholic beverages |
1.6% |
6.1% |
The m/m increase was mainly driven by the increase in prices of commodities such as tomatoes, onion leeks and bulbs and cabbages by 17.9%, 6.8% and 5.0% respectively. However, the increase was weighed down by decrease in prices of Mangoes and cooking oil by 3.9% and 0.4% respectively |
|
Transport |
(0.4%) |
0.7% |
The transport index recorded a slight m/m decrease with fare prices dropping during the month, despite prices of Super Petrol and Diesel increasing to sell at Kshs 176.6 and Kshs 167.1 respectively |
|
Housing, water, electricity, gas and other fuels |
0.1% |
(1.6%) |
The slight m/m decrease was mainly driven by a decrease in prices of 50 kWh of electricity and 200 kWh of electricity by 0.7% and 0.6% respectively. The decrease was however weighed down by increase in prices of Kerosene to sell at Kshs 151.4. |
|
Overall Inflation |
0.7% |
3.3% |
The m/m increase was mainly attributable to the 1.6% increase in Food and non-alcoholic beverages. |
Notably, January’s overall headline inflation increased slightly for the third consecutive month, remaining within the CBK’s preferred range of 2.5%-7.5% for the nineteenth consecutive month. The increase in headline inflation in January 2025 comes amid the maximum allowed price for Super Petrol and Diesel being Kshs 176.6 and Kshs 167.1 respectively. The Kenya Shilling also recorded a 4.9 bps month-to-date appreciation as of 31st January 2025 to Kshs 129.2 from Kshs 129.3, and a 5.9 bps year-to-date gain from the Kshs 129.3 recorded at the beginning of the year. This stabilization in the exchange rate is expected to continue anchoring inflationary pressures in the country. The chart below shows the inflation rates for the past 5 years:
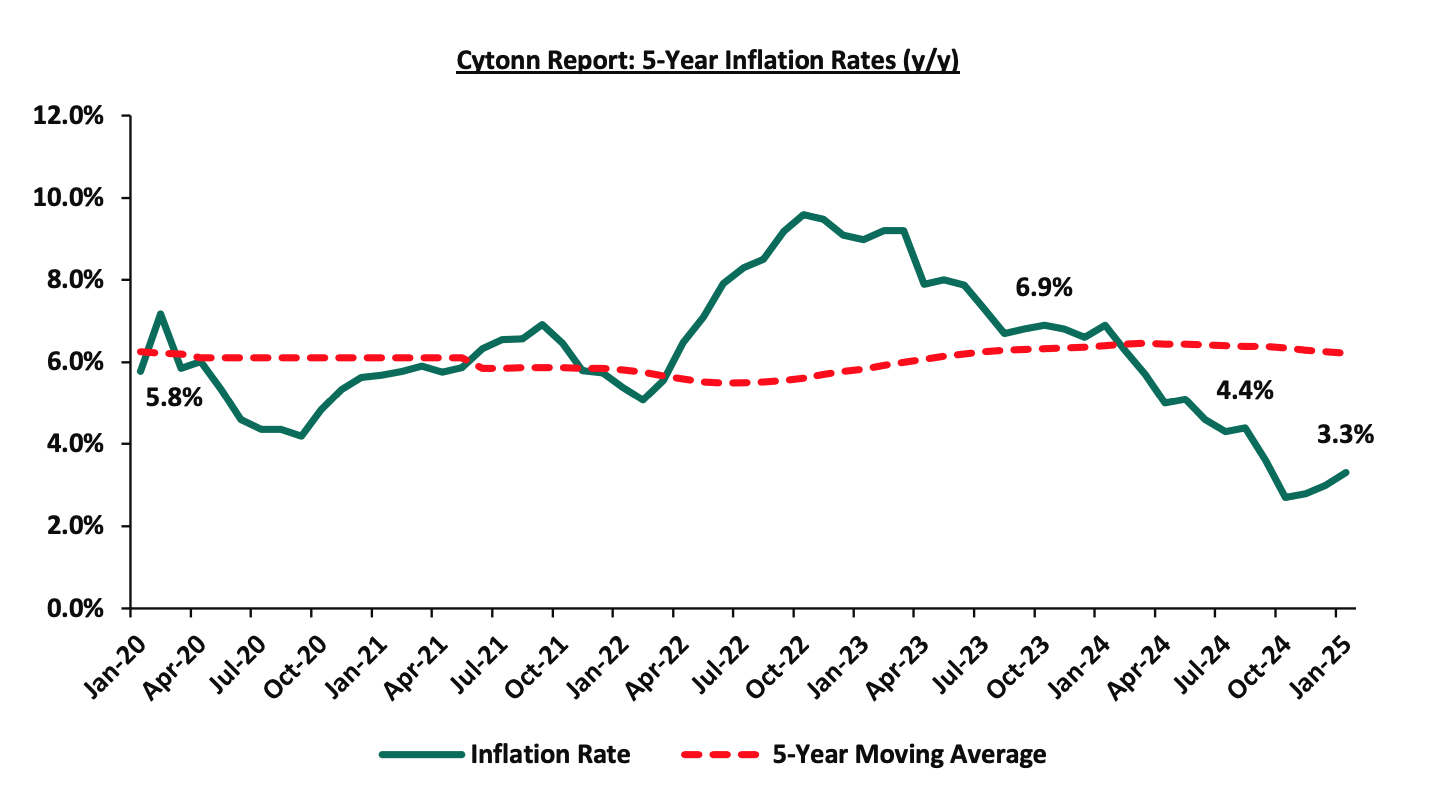
Going forward, we expect inflation to remain within the CBK’s preferred range of 2.5%-7.5%, mainly on the back of a stable currency and stable fuel prices. Additionally, favourable weather conditions will also contribute to stabilizing food prices, further supporting lower inflation rates. The risk, however, lies in the fuel prices which despite their decline over the last months, still remain elevated compared to historical levels. Key to note is that the Monetary Policy Committee cut the Central Bank Rate by 75.0 bps to 11.25% from 12.00% in its December 2024 meeting, with the aim of easing the monetary policy, while maintaining exchange rate stability, and will meet again in February 2025. This cut in the Central Bank Rate is likely to elevate inflationary pressures as consumer spending rises leading to demand- pull inflation. The committee is expected to lower rates further, though gradually, to provide further support for the economy.
- February 2025 Monetary Policy Committee (MPC) Meeting
The Monetary Policy Committee (MPC) is set to meet on Wednesday, 5th February 2025, to review the outcome of its previous policy decisions and recent economic developments, and to decide on the direction of the Central Bank Rate (CBR). In their previous meeting held on 5th December 2024, the committee noted that they would closely monitor the impact of the policy measures taken, as well as developments in the global and domestic economy, and stood ready to reconvene earlier if necessary. The main goal of monetary policy is to maintain price stability and support economic growth by controlling the money supply in the economy. We expect the MPC to cut the Central Bank Rate (CBR) by 50 bps to 100 bps to within a range of 10.25% - 10.75% with their decision mainly being supported by:
- The need to support the economy by adopting a more accommodative policy that will ease financing activities and support private sector financing. Private sector credit contracted by 1.1% in November 2024, a further decline from 0.0% growth in October 2024. A rate cut would help unlock the private sector's potential, enabling it to act as a key driver of economic recovery and sustained growth. Additionally, the business environment remains subdued, hence a cut in the CBR will help spur economic growth, increase money supply and improve business activities in the country,
- Rate cuts by global giant economies: The European Central Bank announced a rate cut by 25 bps to 2.75% on 30thJanuary 2025, from 3.00% earlier in December 2024. Meanwhile, the US Federal Reserve decided to maintain their benchmark interest rate in their recent sitting on 29th January 2025 at 4.25%-4.50%, following the rate cut by 25.0 bps to a range of 4.25%-4.50% in their December 2024 meeting from a range of 4.50%-4.75% in their November 2024 meeting. As such, we expect the MPC to follow through with this set precedence of loosening the monetary policy and cut the rate further, and,
- The continued stability of the Shilling against major currencies and anchored inflationary pressures: Despite the December rate cut in the CBR, this still gives room for a moderate cut without reversing the Shilling’s stability. Since the last meeting, the Kenyan Shilling has appreciated marginally by 7.8 bps against the US Dollar to Kshs 129.2 as at 31st January 2024, from Kshs 129.3 recorded on 5th December 2024. The stability of the Shilling is expected to be supported by the stable foreign reserves which are currently at 4.5 months of import cover, above the statutory requirement of 4.0 months cover. Additionally, inflation has remained stable and below the mid-point of CBK’s preferred range, coming in at 3.3% in January.
For more detailed analysis, please see our February 2025 MPC Note
Monthly Highlights:
- During the month, the Kenya National Bureau of Statistics (KNBS) released the Q3’2024 Quarterly Gross Domestic Product Report, highlighting that the Kenyan economy recorded a 4.0% growth in Q3’2024, slower than the 6.0% growth recorded in Q3’2023. The main contributor to Kenyan GDP remains to be the Agriculture, fishing and forestry sector which grew by 4.2% in Q3’2024, lower than the 5.1% expansion recorded in Q3’2023. All sectors in Q3’2024, except Mining and Quarrying and Construction recorded positive growths, with varying magnitudes across activities. Most sectors recorded declining growth rates compared to Q3’2023 with Accommodation and Food Services, Mining & Quarrying and Financial & Insurance Sectors recording the highest declines of 20.8%, 11.9% and 10.8% points, respectively. Other sectors that recorded a contraction in growth rate, from what was recorded in Q3’2023 were Construction, Electricity and Water Supply and Real Estate of 6.0%, 2.4% and 2.2% points respectively. For more information please see our Cytonn Weekly #02/2025,
- During the month, the Kenya National Bureau of Statistics (KNBS) released Kenya’s balance of payment (BoP) position improved significantly by 113.5% in Q3’2024, to a surplus of Kshs 17.8 bn, from a deficit of Kshs 131.5 bn in Q3’2023, and a 78.9% decline from the Kshs 84.1 bn surplus recorded in Q2’2024. The y/y positive performance in BoP was mainly driven by a significant 5,756.4% improvement in the financial account balance to a surplus of Kshs 62.9 bn in Q3’2024, from a deficit of Kshs 1.1 bn in Q3’2023. The performance was however weighed down by a 60.4% deterioration in the capital account balance to a surplus of Kshs 1.4 bn from a surplus of Kshs 3.4 bn in Q3’2023. For more information please see our Cytonn Weekly #02/2025,
- During the month ,Stanbic Bank released the Stanbic Bank Kenya PMI highlighting that December 2024 showed a marginal improvement in business conditions, with the index registering 50.6, slightly down from November's 50.9. This marked the third consecutive month of private sector growth, albeit at a slower pace. Increased output, new orders, and modest employment gains supported the marginal improvement, while inflationary pressures and muted business expectations posed challenges. For more information please see our Cytonn Weekly #02/2025,
- During the month, The Energy and Petroleum Regulatory Authority (EPRA) released their monthly statement on the maximum retail fuel prices in Kenya, effective from 15th January 2025 to 14th February 2025. Notably, the maximum allowed price for Super Petrol, Diesel and Kerosene increased by Kshs 0.3, Kshs 2.0 and Kshs 3.0 respectively. Consequently, Super Petrol, Diesel and Kerosene will now retail at Kshs 176.6, Kshs 167.1 and Kshs 151.4 per litre respectively, from Kshs 176.3, Kshs. 165.1 and Kshs 148.4 per litre respectively, representing increases of 0.2%,1.2% and 2.0% for Super Petrol, Diesel and Kerosene respectively. For more information please see our Cytonn Weekly #03/2025,
- During the month, the National Treasury released the Draft 2025 Budget Policy Statement, in line with section 25 of the Public Finance Management (PFM) Act, 2012 which mandates the Treasury to incorporate the views of stakeholders, including the public, during the preparation of the Budget Policy Statement (BPS). Following this consultative process, the Budget Policy Statement (BPS) is submitted to the Cabinet for approval and subsequently presented to Parliament for discussion and adoption. Revenue is projected to increase by 14.9% to Kshs 3.5 tn from Kshs 3.1 tn as per FY’2024/25 revised budget estimates, while total expenditure is projected to increase by 11.6% to Kshs 4.3 tn, from Kshs 3.9 tn FY’2024/25 revised budget estimates. For more information please see our Cytonn Weekly #03/2025,
- During the month, the National Treasury gazetted the revenue and net expenditures for the sixth month of FY’2024/2025, ending 31st December 2024, highlighting that the total revenue collected as at the end of December 2024 amounted to Kshs 1,161.3 bn, equivalent to 44.1% of the revised estimates of Kshs 2,631.4 bn for FY’2024/2025 and is 88.3% of the prorated estimates of Kshs 1,315.7 bn. For more information please see our Cytonn Weekly #03/2025,
- During the month, the global ratings agency, Moody’s announced its revision of Kenya’s credit outlook to positive from negative, while maintaining the credit rating at Caa1, on the back of a likelihood of an ease in liquidity risks and improved debt affordability. The improved debt affordability is largely attributable to the reduction in domestic borrowing costs, evidenced by the sharp decline of yields for short-dated papers. Given the low inflation rates in the country, the stability of the exchange rate, and the ease in the monetary policy stance, domestic borrowing costs are expected to continue decreasing over the short-medium term. For more information please see our Cytonn Weekly #04/2025,
Rates in the Fixed Income market have been on a downward trend due to high liquidity in the money market which allowed the government to front load most of its borrowing. The government is 126.9% ahead of its prorated net domestic borrowing target of Kshs 243.5 bn, and 35.3% ahead of the total FY’2024/25 net domestic borrowing target of Kshs 408.4 bn, having a net borrowing position of Kshs 552.4 bn. However, we expect a continued downward readjustment of the yield curve in the short and medium term, with the government looking to increase its external borrowing to maintain the fiscal surplus, hence alleviating pressure in the domestic market. As such, we expect the yield curve to normalize in the short to medium-term and hence investors are expected to shift towards the long-term papers to lock in the high returns.
Market Performance:
During the month of January 2025, the equities market was on an upward trajectory, with NSE 20 gaining the most by 7.6%, while NASI, NSE 25 and NSE 10 gained by 3.9%, 1.0% and 0.8% respectively. The equities market positive performance was driven by gains recorded by large-cap stocks such as Bamburi, EABL, and KCB Group of 7.7%, 2.8%, and 2.8% respectively. The monthly performance was however weighed down by losses recorded by large cap stocks such as BAT, Equity Group and Absa of 3.6%, 2.3% and 0.6% respectively.
During the week, the equities market was on a downward trajectory, with NSE 10 declining the most by 4.3%, while NSE 25, NASI and NSE 20 declined by 3.7%, 3.2% and 1.1% respectively, taking the YTD performance to gains of 5.0% and 2.3% for NSE 20 and NASI respectively and YTD losses of 1.1% and 0.6%, for NSE 10 and NSE 25 respectively. The week on week equities market performance was driven by losses recorded by large-cap stocks such as Safaricom, KCB and EABL of 9.0%, 6.7%, and 6.6% respectively. The performance was, however, supported by gains recorded by large-cap stocks such as Bamburi, Coop and Stanbic Holdings of 7.7%, 2.2% and 0.7% respectively.
Equities turnover decreased by 66.8% in the month of January 2025 to USD 74.0 mn, from USD 222.6 mn recorded in December 2024. Foreign investors remained net sellers, with a net selling position of USD 8.1 mn, a decrease from a net selling position of USD 9.9 mn recorded in December 2024.
During the week, equities turnover decreased by 6.2% to USD 17.3 mn from USD 18.5 mn recorded the previous week, taking the YTD total turnover to USD 74.0 mn. Foreign investors remained net sellers for the second consecutive week with a net selling position of USD 3.1 mn, from a net selling position of USD 0.2 mn recorded the previous week, taking the YTD foreign net selling position to USD 8.1 mn.
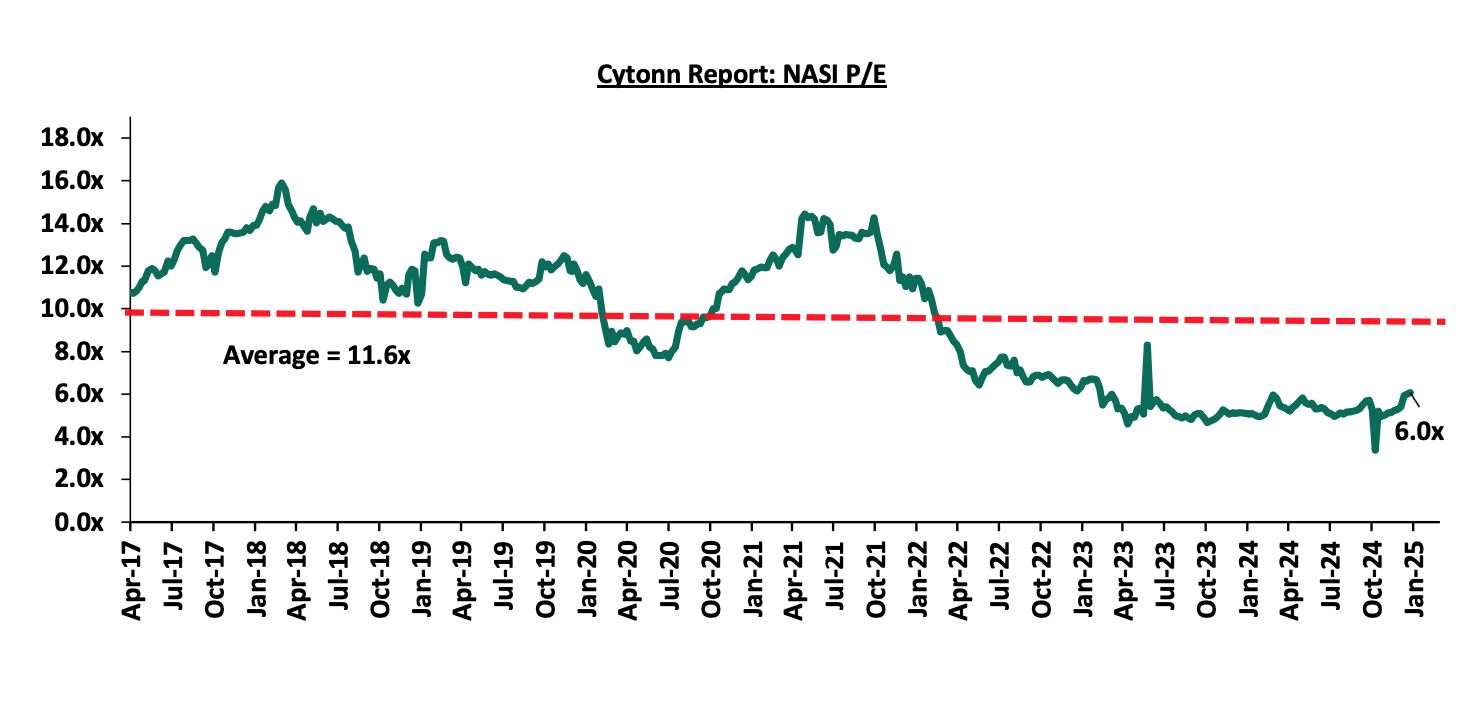
The market is currently trading at a price-to-earnings ratio (P/E) of 5.9x, 49.4% below the historical average of 11.6x. The dividend yield stands at 6.0%, 1.4% points above the historical average of 4.6%. Key to note, NASI’s PEG ratio currently stands at 0.7x, an indication that the market is undervalued relative to its future growth. A PEG ratio greater than 1.0x indicates the market is overvalued while a PEG ratio less than 1.0x indicates that the market is undervalued. The charts below indicate the historical P/E and dividend yields of the market;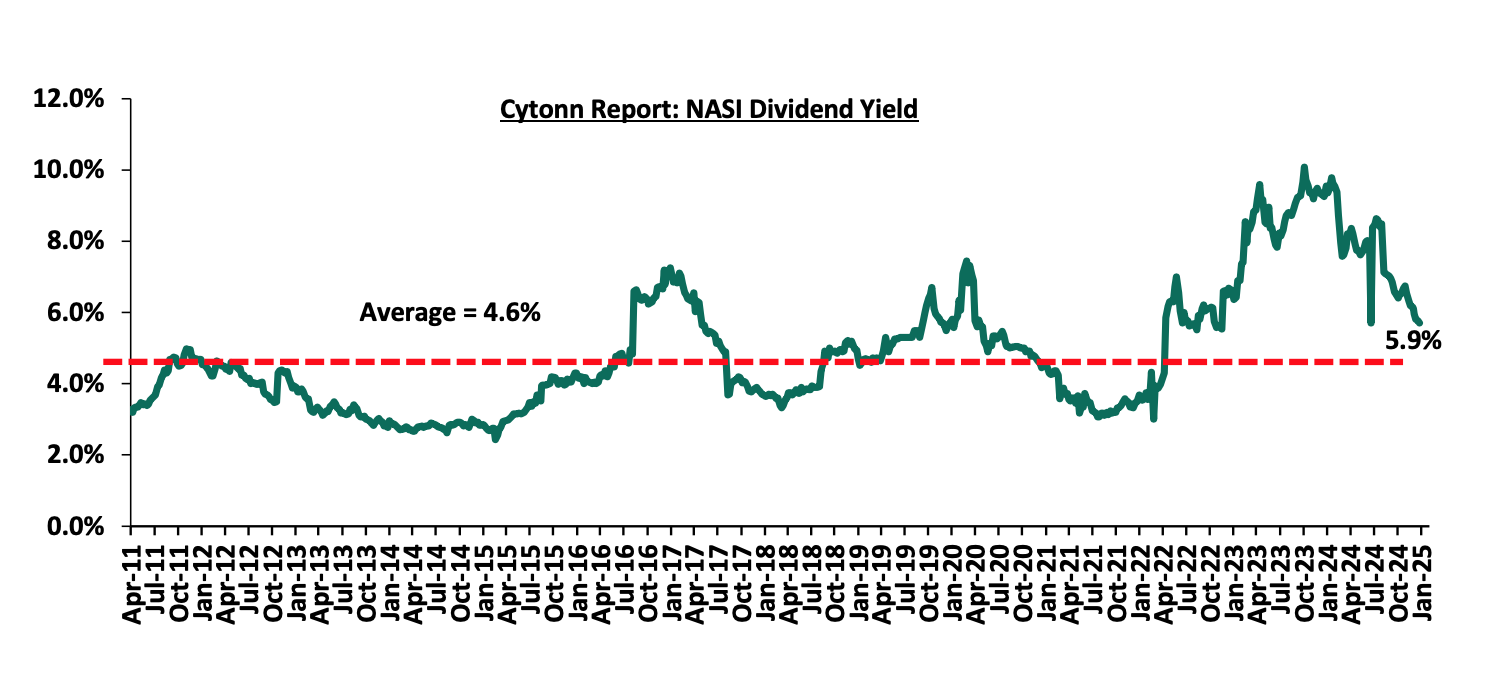
Universe of Coverage:
|
Cytonn Report: Equities Universe of Coverage |
|||||||||||
|
Company |
Price as at 24/01/2025 |
Price as at 31/01/2025 |
w/w change |
m/m change |
YTD Change |
Year Open 2025 |
Target Price* |
Dividend Yield*** |
Upside/ Downside** |
P/TBv Multiple |
Average |
|
Jubilee Holdings |
203.3 |
200.0 |
(1.6%) |
15.3% |
14.4% |
174.8 |
260.7 |
7.2% |
37.5% |
0.3x |
Buy |
|
Equity Group |
48.7 |
47.2 |
(3.1%) |
(2.3%) |
(1.7%) |
48.0 |
60.2 |
8.5% |
36.0% |
0.9x |
Buy |
|
Co-op Bank |
16.2 |
16.6 |
2.2% |
0.6% |
(5.2%) |
17.5 |
18.8 |
9.1% |
22.7% |
0.8x |
Buy |
|
NCBA |
49.1 |
48.5 |
(1.1%) |
0.6% |
(4.9%) |
51.0 |
53.2 |
9.8% |
19.5% |
0.9x |
Accumulate |
|
KCB Group |
45.8 |
42.8 |
(6.7%) |
2.8% |
0.8% |
42.4 |
50.3 |
0.0% |
17.7% |
0.7x |
Accumulate |
|
Stanbic Holdings |
138.0 |
139.0 |
0.7% |
1.3% |
(0.5%) |
139.8 |
145.3 |
11.0% |
15.6% |
0.9x |
Accumulate |
|
ABSA Bank |
17.9 |
18.0 |
0.3% |
(0.6%) |
(4.8%) |
18.9 |
19.1 |
8.6% |
15.0% |
1.4x |
Accumulate |
|
Standard Chartered Bank |
286.5 |
278.5 |
(2.8%) |
(0.4%) |
(2.4%) |
285.3 |
291.2 |
10.4% |
15.0% |
1.9x |
Accumulate |
|
Diamond Trust Bank |
69.8 |
70.0 |
0.4% |
1.4% |
4.9% |
66.8 |
71.1 |
7.1% |
8.7% |
0.3x |
Hold |
|
CIC Group |
2.6 |
2.7 |
4.6% |
26.5% |
27.1% |
2.1 |
2.8 |
4.8% |
7.7% |
0.9x |
Hold |
|
I&M Group |
34.9 |
33.7 |
(3.4%) |
(7.0%) |
(6.4%) |
36.0 |
32.3 |
7.6% |
3.4% |
0.7x |
Lighten |
|
Britam |
8.4 |
7.3 |
(14.0%) |
25.2% |
24.7% |
5.8 |
7.5 |
0.0% |
3.3% |
1.0x |
Lighten |
|
*Target Price as per Cytonn Analyst estimates **Upside/ (Downside) is adjusted for Dividend Yield ***Dividend Yield is calculated using FY’2023 Dividends |
|||||||||||
Weekly Highlights:
- Kenya Power & Lighting Company Plc (KPLC) H1’2025 Financial Performance
During the week, Kenya Power & Lighting Company Plc (KPLC) released its H1’2025 financial results, for the period ending 31st December 2024, recording a significant 3025.4% improvement in profitability. The company posted a profit after tax (PAT) of Kshs 10.0 bn, a major turnaround from Kshs 0.3 bn in H1’2024. The increase was mainly driven by, an 86.9% reduction in finance costs to Kshs 1.9 bn in H1’2025, from Kshs 15.0 bn in H1’2024, coupled with a 14.1% decline in the cost of sales to Kshs 71.3 bn, from Kshs 83.0 bn in H1’2024. The performance was however weighed down by a 5.4% decline in the total revenue to Kshs 107.4 bn, from 113.6 bn in H1’2024 attributed to lower pass-through costs and tariff adjustments. The tables below summarize the company’s financial performance:
|
Cytonn Report: Kenya Power and Lighting Company (KPLC) Summarized Income Statement |
|||
|
Item |
H1'2024 |
H1'2025 |
Y/Y Change |
|
Kshs (bn) |
Kshs (bn) |
||
|
Revenue from contracts with customers |
113.6 |
107.4 |
(5.4%) |
|
Cost of Sales |
(83.0) |
(71.4) |
(14.0%) |
|
Gross Profit |
30.5 |
36.0 |
18.1% |
|
Other Income |
3.7 |
3.4 |
(8.0%) |
|
Operating Costs |
(19.7) |
(23.7) |
20.3% |
|
Operating Profit |
14.5 |
15.7 |
8.5% |
|
Interest income |
1.1 |
0.4 |
(67.4%) |
|
Net Finance Costs |
(15.0) |
(2.0) |
(86.9%) |
|
Profit Before Income Tax |
0.5 |
14.1 |
2514.3% |
|
Income Tax Expenses |
(0.2) |
(4.1) |
1769.9% |
|
Profit After Tax |
0.3 |
10.0 |
3025.4% |
|
Earnings Per Share |
0.2 |
5.1 |
3093.8% |
|
Dividend Per share |
- |
0.2 |
|
|
Dividend Yield (Annualized) |
- |
5.3% |
|
|
Dividend Payout Ratio |
- |
3.9% |
|
Source: Kenya Power and Lighting Company (KPLC) H1’2025 financial statements
|
Cytonn Report: Kenya Power and Lighting Company (KPLC) Summarized Balance sheet |
|||
|
Item |
H1'2024 |
H1'2025 |
Y/Y Change |
|
Kshs (bn) |
Kshs (bn) |
||
|
Property and equipment |
267.2 |
276.3 |
3.4% |
|
Current Assets |
91.6 |
88.3 |
(3.7%) |
|
Non-Current Assets |
4.3 |
4.0 |
(8.0%) |
|
Total Assets |
363.2 |
368.6 |
1.5% |
|
Current Liabilities |
134.1 |
107.3 |
(20.0%) |
|
Other Non-Current Liabilities |
171.9 |
164.0 |
(4.6%) |
|
Total Liabilities |
306.1 |
271.3 |
(11.4%) |
|
Total Equity |
57.2 |
97.3 |
70.2% |
|
Total Equity and liabilities |
363.2 |
368.6 |
1.5% |
Source: Kenya Power and Lighting Company (KPLC) H1’2025 financial statements
Key take outs from the financial performance include;
- Total revenue fell by 5.4% to Kshs 107.4 bn in H1’2025 from Kshs 113.6 bn in H1’2024 due to lower pass-through costs and tariff adjustments. Cost of Sales decreased by 14.1% to Kshs 71.4 bn, from 83.0 bn in H1’2024 attributed to a stronger Kenya Shilling and an optimized power generation mix,
- Operating expenses rose by 20.3% to Kshs 23.7 bn in H1’2025 from Kshs 19.7 bn in H1’2024 mainly driven by higher staff costs, maintenance, and depreciation due to network expansion,
- Drastic Reduction in Finance Costs by 86.9% to Kshs 2.0 bn, from Kshs 15.0 bn recorded in H1’2024 reflecting loan repayments and forex stability, attributable to the gain of the Kenyan Shilling against other currencies,
- Earnings per share surged to Kshs 5.1, from Kshs 0.2 in H1’2024, marking a significant 3093.8% growth attributable to the increase in PAT to Kshs 10.0 bn from Kshs 0.3 bn, which was driven by lower costs and improved operational efficiency,
- The company’s balance sheet recorded an expansion as total assets grew by 1.5% to Kshs 368.6 bn from Kshs 363.2 bn recorded in H1’2024 t mainly attributable to the 3.4% increase in property and equipment to Kshs 276.3 bn in 2024 from Kshs 267.2 bn recorded in H1’2024,
- The company’s total liabilities reduced by 11.4% to Kshs 271.3 bn in H1’2025 from Kshs 306.1 bn recorded in H1’2024 this was attributable to a 20.0% reduction in current liabilities to Kshs 107.3 bn, from Kshs 134.1 bn in H1’2024 as well as a 4.6% reduction in non-current liabilities to Kshs 164.0 bn, from Kshs 171.9 bn in H1’2024, and,
- The Board of Directors declared an interim dividend of Kshs 0.20 per share, payable on 11th April 2025 to shareholders registered as of 28th February 2025, marking the first time since 2017 when the company last paid an interim dividend of Kshs 0.5 per share. This translates to a dividend yield of 5.3% as of 31st January 2025 and a dividend payout ratio of 3.9%.
KPLC has demonstrated a remarkable turnaround in financial performance, with a surge in profitability, lower debt costs, and improved operational efficiency. However, declining revenue, rising operational expenses, and reduced cash reserves present challenges. The company’s strategic initiatives and government-backed projects provide opportunities for long-term growth and financial stability. The company’s strong profitability rebound, improved financial health, and dividend payout signal a positive investment outlook, but investors should watch cost control and revenue trends in the coming periods Going forward Kenya power aims to sustain its improved financial performance by enhancing operational efficiency diversifying revenue streams and leveraging strategic projects such as the Digital superhighway and the green financing program. The anticipated lifting of the moratorium on new power generation contracts is expected to drive electricity sales growth while continued investments in infrastructure will support long-term financial stability
- EABL East African Breweries Plc (EABL) H1’2025 Financial Performance
During the week, East African Breweries Plc (EABL) released their H1’2025 financial results for the period ending 31stDecember 2024, recording a 19.6% increase in Profits After Tax (PAT) to Kshs 8.1 bn in H1’2025, from Kshs 6.8 bn in H1’2024. The increase was mainly attributable to the 14.4% decrease in finance costs to Kshs 3.4 bn from Kshs 4.0 bn in H1’2024, coupled with a 2.1% increase in net revenue to Kshs 67.9 bn from Kshs 66.5 bn in H1’2024. The performance was however weighed down by the 4.9% increase in the operating costs to Kshs 13.7 bn in H1’2025, from Kshs 13.1 bn in H1’2024. The tables below show the breakdown of the company’s financial performance;
|
Cytonn Report: East Africa Breweries Plc (EABL) Summarized Income Statement |
|||
|
Item |
H1'2024 |
H1'2025 |
Y/Y Change |
|
Kshs (bn) |
Kshs (bn) |
||
|
Net revenue |
66.5 |
67.9 |
2.1% |
|
Cost of Sales |
(37.0) |
(39.8) |
7.4% |
|
Gross Profit |
29.5 |
28.1 |
(4.6%) |
|
Operating Costs |
(13.1) |
(13.7) |
4.9% |
|
Operating Profit |
16.4 |
14.4 |
(12.2%) |
|
Forex losses/Gains |
(2.3) |
1.2 |
(151.0%) |
|
Net Finance Costs |
(4.0) |
(3.4) |
(14.4%) |
|
Profit Before Income Tax |
10.1 |
12.1 |
20.3% |
|
Income Tax Expenses |
(3.3) |
(4.0) |
21.9% |
|
Profit After Tax |
6.8 |
8.1 |
19.6% |
|
Earnings Per Share |
13.8 |
15.3 |
10.9% |
|
Dividend Per Share |
1.0 |
2.5 |
150.0% |
|
Dividend Yield-Annualized |
1.8% |
2.8% |
|
|
Dividend Payout Ratio |
11.7% |
24.4% |
|
Source: East African Breweries Plc (EABL) H1’2025 financial statements
>
|
Cytonn Report: East Africa Breweries Plc (EABL) Summarized Balanced Sheet |
|||
|
Item |
H1'2024 |
H1'2025 |
Y/Y Change |
|
Kshs (bn) |
Kshs (bn) |
||
|
Current Assets |
50.1 |
53.3 |
6.4% |
|
Non-Current Assets |
92.9 |
84.4 |
(9.2%) |
|
Total Assets |
143.1 |
137.7 |
(3.7%) |
|
Short term borrowings |
5.2 |
7.1 |
38.1% |
|
Other Current Liabilities |
42.0 |
42.7 |
1.5% |
|
Total Current Liabilities |
47.2 |
49.8 |
5.5% |
|
Long term Borrowings |
49.4 |
38.5 |
(22.0%) |
|
Other Non-Current Liabilities |
7.8 |
8.6 |
9.4% |
|
Total Non-Current Liabilities |
57.2 |
47.1 |
(17.7%) |
|
Total Liabilities |
104.4 |
96.9 |
(7.2%) |
|
Total Equity |
38.7 |
40.9 |
5.6% |
Source: East African Breweries Plc (EABL) H1’2025 financial report
Key take outs from the financial performance include;
- Net revenue increased by 2.1% to Kshs 67.9 bn in H1’2025, from Kshs 66.5 bn recorded in H1’2024, mainly attributable to strategic pricing, a strong portfolio and innovation launches. Further, EABL’s diversified geographical footprint helped mitigate volatility.
- Operating costs increased by 4.9% to Kshs 13.7 bn, from Kshs 13.1 bn attributable to significant increases in interest rates and social unrest which disrupted operations in Kenya during the period of review,
- Cost of sales increased by 7.4% to Kshs 39.8 bn, from Kshs 37.0 bn in H1’2024, mainly attributable to increased cost of inputs occasioned by attributable to factors such as rising raw material costs, supply chain disruptions, and fluctuations in the cost of imported goods due to changes in exchange rates.
- The Group’s balance sheet recorded a contraction, with the total assets decreasing by 3.7% to Kshs 137.7 bn in H1’2025 from Kshs 143.1 bn recorded in H1’2024 mainly attributable to a 9.2% decrease in non-current assets to Kshs 84.4. bn in H1’2025 from Kshs 92.9 bn in H1’2024. In addition, total liabilities recorded a 7.2% decline to Kshs 96.9 bn in H1’2025 from Kshs 104.4 bn in H1’2024, mainly driven by a 22.0% increase in long-term borrowings to Kshs 38.5 bn in H1’2025 from Kshs 49.4 bn in H1’2024
- The Group’s short-term borrowing increased by 38.1% to Kshs 7.1 bn in H1’2025 from Kshs 5.2 bn in H1’2024, while the long-term borrowings decreased by 22.0% to Kshs 38.5 bn, from the Kshs 49.4 bn in H1’2024 an indication of the group’s strategic shift in its debt financing.
- Earnings per share increased by 10.9% to Kshs 15.3, from Kshs 13.8 in H1’2024, largely driven by a 19.6% increase in profit after tax to Kshs 8.1 bn, from Kshs 6.8 bn in H1’2024. Additionally, the Board of Directors recommended an interim dividend of Kshs 2.50 per share with a book closure of 21st February 2025 and a payment date of 30th April 2025. This translates to an annualized dividend yield of 2.8% as of 31st January 2025, compared to a dividend yield of 1.8% in H1’2024 and a dividend pay-out ratio of 24.4% in H1’2025 compared to 11.7% in H1’2024.
Following the improvement in macroeconomic environment arising from an ease in inflationary pressures and a stable and stronger currency, EABL has experienced an improvement in financial performance as evidenced by the increase in profitability by 19.6% as well as the 10.9% growth in earnings per share in H1’2025. Key to note, EABL realized a significant 151.0% increase in foreign exchange gains owing to the appreciation of the local currencies in the Group’s region of operation. For instance, the Kenyan shilling and Uganda Shilling gained by 17.8 bps and 3.4 bps, respectively against the US Dollar for the period under review. In our view, the Group’s earnings will be supported by the group’s continued diversification efforts as well as the efforts from the government to mitigate the impact of unregulated alcohol trade as illicit trade continues to grow. Moreover, the Group’s announcement of an interim dividend of Kshs 2.50 per share for the period ending 31st December 2024 is expected to boost investors’ confidence in the Group’s stock.
Monthly Highlights
- During the month, Nairobi Securities Exchange (NSE) announced the lifting of the suspension in the trading of Kenya Airways Plc securities, effective January,5 2025. The suspension on trading Kenya Airways PLC shares was lifted following the company’s recent positive performance, which included posting a profit after tax and the withdrawal of the National Aviation Management Bill 2020.The trading of the group’s shares were suspended in July 2020 mainly due to implementation of the National Aviation Management Bill 2020. Please see our Cytonn Outlook 2025 for more info
We are “Bullish” on the Equities markets in the short term due to current attractive valuations, lower yields on short-term government papers and expected global and local economic recovery, and, “Neutral” in the long term due to the adverse operating environment and huge foreign investor outflows. With the market currently trading at a discount to its future growth (PEG Ratio at 0.7x), we believe that investors should reposition towards value stocks with strong earnings growth and that are trading at discounts to their intrinsic value. We expect the current high foreign investors sell-offs to continue weighing down the economic outlook in the short term.
- Industry Report
During the month of January, the following industry reports were released and the key take-outs were as follows;
|
Cytonn Report: Notable Industry Reports During the Month of January 2025 |
|||
|
# |
Theme |
Report |
Key Take-outs |
|
1. |
Housing accessibility and affordability survey |
The 2023/24 Kenya Housing Survey Basic Report by the Kenya National Bureau of Statistics |
· Only about 20.0%-25.0% of urban dwellers own homes with the primary challenges cited as high property prices, limited mortgage access, and lengthy loan approval processes. · Key trends undermining housing development with respect to access to finance include; about 33.4% of financiers offer savings products for land purchases, 20.9% for incremental building, and only 10% for mortgages. · The survey highlights that 78.8% of dwelling units in Kenya were classified as being of inadequate quality and the Crowding Index showed that 68.1% of dwelling units were fit for habitation based on the number of persons per room, with an average of two persons per room, pointing to overcrowding issues. · The report noted that counties achieved a housing building plan approval rate of 99.6% in 2023, a significant increase from 81.2% in 2022. Applications for changing land use from residential to other purposes rose by 13%, reaching 2,300. · For more information, please see our Cytonn Weekly #04/2025
|
|
2. |
Real Estate Survey Report |
· The market has grown by 33.7% from 2019 to 2023, driven by urbanization, infrastructure, and initiatives like the Affordable Housing Program. However, gaps in reliable housing data hinder effective decision-making. The report indicates that in 2023, about 34.4% of advertised office space remained unoccupied due to low demand. · The residential market is diverse, with three-bedroom flats being the most common. Nairobi City dominates, accounting for 66.7% of available properties. · Majority of real estate firms in Kenya (95.1%) are privately owned, with a small proportion being cooperatives (3.4%) and parastatals (1.5%). Approximately 40.7% of firms are registered with the Valuers Registration Board (VRB), while 33.9% are affiliated with the Kenya Valuers and Estate Agents. · For more information, please see our Cytonn Weekly #04/2025 |
|
|
3. |
Residential sector |
The Property Index Q4’2024 Report, by Hass Consult |
· The average asking rents of housing units in the NMA during period under review increased slightly by 0.2% on q/q basis, higher compared to a 0.6% decrease recorded in Q3’2024. On a y/y basis, the average asking rent decreased slightly by 0.02% compared to the 2.5% increase recorded in Q4’2023. · Apartments registered the highest y/y increase in asking rents of 2.5% in Q4’2024, a decrease from 10.2% increase in Q4’2023. In addition, detached units witnessed 0.6% increase in asking rents a decrease from 2.4% increase recorded in Q4’2024 and semi-detached units witnessed 4.8% decrease in asking rents, a further decrease from 1.4% decline recorded in Q4’2023. · In the Nairobi Suburbs apartments, Parklands was the best-performing region recording a y/y capital appreciation of 5.3% and in the satellite towns, properties in Juja posted the highest year-on-year price appreciation, coming at 12.9%. · In satellite towns’ apartments, Ongata Rongai recorded the highest y/y price appreciation of 9.9%. · For more information, please see our Cytonn Weekly #04/2025 |
|
4. |
Land sector |
The Land Price Index Q4’2024 Report by Hass Consult |
· The average q/q selling prices for land in the Nairobi suburbs grew by 1.7%, compared to a 3.3% increase recorded in Q3’2023. On a y/y basis, the performance represented 2.5 % points increase to 6.5% from the 4.0% increase recorded in Q3’2023. · Spring Valley was the best-performing node in the Nairobi suburbs with a y/y price appreciation of 15.0%. · For satellite towns, Kiserian was the best-performing node with a y/y capital appreciation of 18.1%, followed by Limuru which recorded a y/y capital appreciation of 17.2%. · For more information, please see our Cytonn Weekly #04/2025 |
|
5. |
Hospitality Sector, Real Estate, Building and construction Sector |
The Q3’2024 GDP Report by the Kenya National Bureau of Statistics (KNBS) |
· The Kenya National Bureau of Statistics (KNBS) released the Q3’2024 GDP Report, which highlighted that the Real Estate sector posted steady growth of 5.5% in Q3’2024, which is 2.2% points slower than the 7.7% growth registered in Q3’2023. · The construction sector contracted by 2.0% in Q3’2024, which is 6.0% points slower than the 4.0% growth in Q3’ 2023. On a quarter-on-quarter basis, this performance represented a 0.7%-point increase from the 2.7% growth recorded in Q2’2024. · The accommodation and restaurant services grew by 13.7% during Q3’ 2024, representing a 20.8% points y/y decline from the 34.5% growth recorded in Q3’ 2023. On a q/q basis, this performance represented 12.9% points decrease from the 26.6% in Q2’2024. · For more information, please see our Cytonn 2025 Markets Outlook. |
- Residential Sector
During the week, Mi Vida Homes announced a strategic partnership with HF Group Kenya’s banking division, to enhance homeownership and real estate investment in the country. As part of the agreement, HFC will provide up to 95.0% mortgage financing at a fixed interest rate of 9.5% for a repayment period of up to 20 years. This initiative is aimed at making homeownership more accessible and encouraging buyers to invest in property instead of renting. Additionally, the collaboration is highlighted to extend beyond conventional property sales and financing by incorporating investment prospects and long-term property value growth.
According to the Mi Vida team, the partnership is designed to create a well-rounded support system that includes financial solutions, homeownership advisory services, investment opportunities, and long-term value appreciation for homeowners. They also emphasized that HF Group’s strong market presence and industry experience would help expand accessibility to a broader customer base.
We expect this partnership will enhance access to homeownership in the country by addressing financing barriers, streamlining the home buying process and boosting the mortgage market in Kenya. While the HF Group will gain access to a larger pool of potential mortgage customers, Mi Vida will benefit from a client base that can secure financing more easily thus supporting real estate growth in the country.
There was one notable highlight during the month;
- GulfCap Real Estate broke ground for a Kshs 120.0 bn housing project in Kisumu marking a significant development in Kenya's real estate sector. Spanning 285 acres, the project aims to address the growing demand for housing in Kisumu, a city experiencing rapid urbanization and population growth. For more information, please see our Cytonn Weekly #04/2025.
We expect increased activities in the residential sector within the country sustained by; i)ongoing residential developments under the Affordable Housing Agenda, aiming to reduce the housing deficit in the country currently estimated at 80.0%, ii) increased investment from local and international investors in the housing sector, iii) favourable demographics in the country, shown by high population and urbanization rates of 3.7% p.a and 2.0% p.a, respectively, leading to higher demand for housing units. However, challenges such as rising construction costs, strain on infrastructure development, and limited access to financing will continue to restrict the optimal performance of the residential sector.
- Commercial Office Sector
There were two notable highlight during the month;
- The Local Authorities Pensions Trust (Laptrust) revised its plans for the Ugatuzi Tower project in Nairobi, reducing the proposed 50-storey office building to 34 floors. This adjustment comes in response to a surplus of office space in the market and escalating construction costs. Originally, Laptrust intended to construct a 50-storey tower at an estimated cost of Sh5 billion. However, legal challenges from some of its members delayed the project's commencement, leading to the current revision. The proposed building will occupy 1.3 acres at the intersection of Argwings Kodhek and Chaka Road in the Hurlingham area. Laptrust plans to complete the project within 24 months after obtaining the necessary licenses and beginning construction. For more information, please see our Cytonn Weekly #04/2025 ;and,
- Tele performance announced plans to expand its Kenyan operations with the launch of a new hub at the Two Rivers International Finance and Innovation Centre (TRIFIC) SEZ. The new location is expected to create an estimated 5,000 new jobs, offering services such as digital business services, customer experience management, and advanced analytics.For more information, please see our Cytonn 2025 Markets Outlook.
We expect that the Commercial office sector will continue to grow impacted by several key dynamics: i) the increasing presence of multinational companies in Kenya is likely to drive up occupancy levels, ii) co-working spaces are gaining in popularity in the region iii) the entry of more startups driving demand for commercial spaces. However, the sector continues to face challenges due to a significant oversupply of office space, currently standing at 5.8 mn SQFT.
- Retail Sector
There were Three notable highlights during the month;
- China Square expanded its presence in Kenya by launching its 7th store at Greenspan Mall in Donholm-Nairobi which follows the opening of a 6th store at Two Rivers Mall-Kiambu in the previous week. These additions bring the retailer’s total number of outlets in the country to seven since its entry at Kenyatta University’s Unicity Mall in 2022. For more information, please see our Cytonn Weekly #3/2025,
- ILAM Fahari I-REIT, which manages Greenspan Mall announced the inclusion of China Square in tenants portfolio, expressing enthusiasm for the growth and collaboration this partnership brings. Elsewhere, the Centum team, which co-owns Two Rivers Mall, highlighted that the addition of China Square is expected to raise the mall’s occupancy to around 95.0%, boosting foot traffic and benefiting other businesses. For more information, please see our Cytonn Weekly #3/2025,
- Majid Al Futtaim, the operator of Carrefour in Kenya, launched a new store at Rhapta Promenade Mall in Westland’s, marking its 27th store in the country. The new store aims to improve convenience and accessibility for customers around Westland’s area and has so far created 45 direct jobs contributing to its current workforce of over 2,800 employees the company has in Kenya. For more information, please see our Cytonn 2025 Markets Outlook. and,
We expect to witness more retail expansions activities for the year 2025, driven by increased investments from both local and international retailers, the availability of retail space, a growing consumer base, and evolving consumer preferences in the country.
- Industrial Sector
There were two notable highlights during the month;
- Kenya capped the period for SEZ investors to enjoy tax benefits and incentives at 10 years, reducing the time in which the government loses revenue in order to attract investors. Previously, there was no limit on the tax breaks offered to SEZs. Investors enjoyed a graduated corporate income tax (CIT) rate of 10.0% for the first 10 years, increasing to 15% for the next 15 years. Additionally, they were exempt from value-added tax (VAT), permit and advertisement fees and other duties. For more information, please see our Cytonn 2025 Markets Outlook.and,
- The Kenya Revenue Authority (KRA) granted the Tatu City special economic zone (SEZ) a customs area status. A move which designates Tatu City as a zone where imported or exported goods can be stored before clearance by customs authorities. The SEZ status, already enjoyed by Tatu City, allows for business and trade laws distinct from the rest of Kenya with the main aim being to boost trade, employment, and investment in the region. For more information, please see our Cytonn 2025 Markets Outlook.
We expect a slight increase in development activities in the industrial sector through government support in line with its Bottom Up Economic Transformation Agenda (BETA) which aims to tap into the manufacturing sector to create wealth, employment and reduce poverty levels among Kenyan citizens Going forward, we expect the sector performance to be driven by: i) the rising demand for data centers in the country, ii) an increasing demand for cold rooms, especially in the Nairobi Metropolitan Area, iii) demand for quality warehouses due to the growing e-commerce business in the country, iv) support from the government, as evidenced by the establishment of Special Economic Zones (SEZ) and Export Processing Zones (EPZ).
- Mixed Use Developments (MUDs)
There was one notable highlight during the month;
- The National Social Security Fund (NSSF) announced plans to build a Mixed-Use development on one of its prime pieces of land located in Nairobi's central business district at the corner of Uhuru Highway and Kenyatta Avenue which has remained vacant for decades. The project will be implemented using an Engineering, Procurement, Construction, and Finance (EPC+F) model, where contractors handle the entire project from design to financing. For more information, please see our Cytonn Weekly #3/2025
We expect MUDs to continue shaping the real estate land scape in Kenya supported by the remarkable returns compared to single-use themes, changing client preferences, and MUDs attractiveness driven by the diversity in amenities and social offerings they provide to clients.
- Real Estate Investments Trusts (REITs)
On the Unquoted Securities Platform, Acorn D-REIT and I-REIT traded at Kshs 25.4 and Kshs 22.2 per unit, respectively, as per the last updated data on 17th January 2025. The performance represented a 27.0% and 11.0% gain for the D-REIT and I-REIT, respectively, from the Kshs 20.0 inception price. The volumes traded for the D-REIT and I-REIT came in at Kshs 12.8 mn and Kshs 34.8 mn shares, respectively, with a turnover of Kshs 323.5 mn and Kshs 722.8 mn, respectively, since inception in February 2021. Additionally, ILAM Fahari I-REIT traded at Kshs 11.0 per share as of 17th January 2025, representing a 45.0% loss from the Kshs 20.0 inception price. The volume traded to date came in at 138,600 shares for the I-REIT, with a turnover of Kshs 1.5 mn since inception in November 2015.
REITs offer various benefits, such as tax exemptions, diversified portfolios, and stable long-term profits. However, the ongoing decline in the performance of Kenyan REITs and the restructuring of their business portfolios are hindering significant previous investments. Additional general challenges include:
- Insufficient understanding of the investment instrument among investors leading to a slower uptake of REIT products,
- Lengthy approval processes for REIT creation,
- High minimum capital requirements of Kshs 100.0 mn for REIT trustees compared to Kshs 10.0 mn for pension funds Trustees, essentially limiting the licensed REIT Trustee to banks only
- The rigidity of choice between either a D-REIT or and I-REIT forces managers to form two REITs, rather than having one Hybrid REIT that can allocate between development and income earning properties
- Limiting the type of legal entity that can form a REIT to only a trust company, as opposed to allowing other entities such as partnerships, and companies,
- We need to give time before REITS are required to list – they would be allowed to stay private for a few years before the requirement to list given that not all companies maybe comfortable with listing on day one, and,
- Minimum subscription amounts or offer parcels set at Kshs 0.1 mn for D-REITs and Kshs 5.0 mn for restricted I-REITs. The significant capital requirements still make REITs relatively inaccessible to smaller retail investors compared to other investment vehicles like unit trusts or government bonds, all of which continue to limit the performance of Kenyan REITs.
We expect the performance of Kenya’s Real Estate sector to remain resilient supported by several factors: i) heightened activities from both private and government sectors, ii) an expanding population driving the need for housing, iii) government efforts under the Affordable Housing Program and the incentives advanced to developers aligned with the program, iv) an increase in deals in the commercial office sector likely to boost occupancy, v) increased investment by international and local investors in the retail sector, and vi) increased international arrivals in the country boosting the hospitality and tourism sector. However, challenges such as rising construction costs, an oversupply in select Real Estate classes, strain on infrastructure development, and high capital demands in REITs sector will continue to impede the real estate sector’s optimal performance by restricting developments and investments.
Disclaimer: The views expressed in this publication are those of the writers where particulars are not warranted. This publication, which is in compliance with Section 2 of the Capital Markets Authority Act Cap 485A, is meant for general information only and is not a warranty, representation, advice, or solicitation of any nature. Readers are advised in all circumstances to seek the advice of a registered investment advisor.

- Talk to us
- Kenya
- P.O Box 20695 - 00200, Nairobi, Kenya
- Cell +254709101200
- Tel +254709101200
- WhatsApp +254741676635
- United States
- +254709101200
- DOWNLOAD OUR APP
-


- Kenya
- 8th Floor, Pinetree Plaza, Kaburu Drive, Ngong Road, Nairobi, Kenya
- USA
- Suite 1150, 1775 Eye Street NW, USA, Washington DC 20006, USA
- Investments
- High Yield
- Private Equity
- Real Estate
- Real Estate
- RiverRun Estates
- Cytonn Towers
- The Ridge
- Taraji Heights
- The Alma