Cytonn Monthly - July 2025
By Research Team, Aug 3, 2025
Executive Summary
Fixed Income
During the month of July 2025, T-bills were oversubscribed, with the overall average subscription rate coming in at 117.1%, albeit lower than the subscription rate of 179.5% recorded in June 2025. The overall average subscription rates for the 91-day and 364-day papers decreased to 156.5% and 141.1% respectively, from 234.6% and 283.6% respectively recorded in June 2025, while the average subscription rate for the 182-day paper increased to 77.4% from the 53.3% recorded in June 2025. The average yields on the government papers were on a downward trajectory during the month, with the average 91-day, 182-day, and 364-day papers yields decreasing by 7.9 bps, 7.3 bps, and 12.1 bps to 8.1%, 8.4% and 9.7% respectively, from an average of 8.2%, 8.5% and 9.8% recorded the previous month. For the month of July, the government accepted a total of Kshs 94.1 bn of the Kshs 112.4 bn worth of bids received in T-Bills, translating to an acceptance rate of 83.7%, compared to an acceptance rate of 72.8% in the month of June;
During the week, T-bills were undersubscribed for the first time in three weeks, with the overall subscription rate coming in at 67.1%, lower than the subscription rate of 166.7% recorded the previous week. Investors’ preference for the shorter 91-day paper waned, with the paper receiving bids worth Kshs 2.0 bn against the offered Kshs 4.0 bn, translating to a subscription rate of 49.3%, significantly lower than the subscription rate of 405.8%, recorded the previous week. The subscription rate for the 182-day paper decreased to 21.4% from the 32.0% recorded the previous week, while that of the 364-day paper decreased to 119.8%, from the 205.9% recorded the previous week. The government accepted a total of Kshs 16.0 bn worth of bids out of Kshs 16.1 bn bids received, translating to an acceptance rate of 99.6%. The yields on the government papers were on a downward trajectory with the yields on the 91-day, 182-day and 364-day papers decreasing by 0.6 bps, 0.9 bps and 0.2 bps to 8.11%, 8.41% and 9.72%, from the 8.12%, 8.42% and 9.72% recorded the previous week;
Additionally, July 2025 bonds were oversubscribed, with the overall average subscription rate coming in at 153.8%, lower than the average subscription rate of 202.7% recorded in June 2025. The reopened bonds FXD1/2018/020 and FXD1/2018/025 with tenors to maturity of 12.8 years and 18.0 years respectively and fixed coupon rates of 13.2% and 13.4% respectively, received bids worth Kshs 76.9 bn against the offered Kshs 50.0 bn translating to an oversubscription rate of 153.8%. The government accepted bids worth Kshs 66.7 bn, translating to an acceptance rate of 87.4%, with the average accepted yields coming at 13.9% and 14.3% for the FXD1/2018/020 and FXD1/2018/025 respectively;
During the month, the Central Bank of Kenya (CBK) initiated procurement for a new digital retail bond system. According to the tender document, the system will offer a fully integrated front-end and back-end platform, allowing individual investors to register, purchase, manage, rediscount, and receive interest payments on government securities primarily through mobile phones and the web. The CBK explicitly outlines the goal to “provide all services related to retail bonds”, including direct settlement via mobile money and banking systems, automation of interest/coupon payments, and a real-time, investor-facing dashboard for balances, transaction history, and reporting;
During the week, the global ratings agency, Fitch Ratings affirmed Kenya’s credit rating at B-, maintaining the Stable outlook in a review dated 25th July 2025. The affirmation follows a prior downgrade in January 2025 from a credit rating of B in August 2024, with the outlook then revised to stable from negative. The affirmation reflects the agency’s confidence in Kenya’s economic resilience, continued access to concessional funding, and ongoing efforts to manage its fiscal position despite persistent debt vulnerabilities and external financing pressures;
During the week, Kenya National Bureau of Statistics (KNBS) released the year-on-year inflation noting that inflation in July 2025 rose by 0.3% points to 4.1%, up from 3.8% recorded in June 2025. The headline inflation was primarily driven by price increases in the following categories: Food & Non-Alcoholic Beverages at 6.8%, Transport at 4.1%, and Housing, Water, Electricity, Gas and Other Fuels at 1.3%. The month-on-month inflation rate stood at 0.1% in July 2025;
The Monetary Policy Committee (MPC) is expected to meet on Tuesday, 12th August 2025 to review the outcome of its previous stance. We are projecting that the MPC will maintain the Central Bank Rate (CBR) at 9.75% to allow more time for recent policy measures to take effect.
Equities
During the month of July 2025, the equities market was on an upward trajectory, with NSE 25 gaining the most by 5.0%, while NSE 20, NASI and NSE 10 gained by 4.9%, 4.4% and 4.1% respectively. The equities market positive performance was driven by gains recorded by large-cap stocks such as EABL, NCBA Bank and BAT Kenya of 14.2%, 11.3%, and 10.9% respectively. The monthly performance was however weighed down by losses recorded by large cap stocks such as Co-operative Bank of 5.0%;
During the week, the equities market registered a mixed performance, with NASI losing by 1.0%, while NSE 10, NSE 25 and NSE 20 all gained by 0.1%, taking the YTD performance to gains of 26.8%, 23.3%, 18.8% and 18.3% for NASI, NSE 20, NSE 25 and NSE 10 respectively. The week on week equities market performance was driven by losses recorded by large-cap stocks such as Safaricom, NCBA Bank and DTB-K Bank of 3.3%, 3.1%, and 0.6% respectively. The performance was however supported by gains recorded by large-cap stocks such as EABL, Standard Chartered Bank and BAT-Kenya of 7.1%, 1.9% and 1.5% respectively;
Additionally, in the regional equities market, the East African Exchanges 20 (EAE 20) share index gained by 0.2%, attributable to gains recorded by large cap stocks such as CRDB Bank, Quality Chemicals Industry Limited and Tanga Cement Company Limited of 13.1%, 7.0% and 4.9% respectively. However, the performance was weighed down by the losses recorded by large cap stocks such as Safaricom, Tanzania Breweries Limited and MTN Uganda of 2.3%, 1.2% and 1.0% respectively;
During the week, East African Breweries Plc (EABL) released their FY’2025 financial results for the year ending 30th June 2025, recording a 12.2% increase in the Profits After Tax (PAT) to Kshs 12.2 bn in FY’2025, from Kshs 10.9 bn in FY’2024;
During the week, the Nairobi Securities Exchange (NSE) restructured its market segments, consolidating them into two; the Main Investment Market Segment (MIMS) for established issuers and the SME Market Segment for smaller firms, aiming to simplify listings, improve investor clarity, and align with global standards. MIMS now includes 57 equity and 4 bond issuers, while the SME segment remains small with 9 equity and 1 bond issuer;
During the week, Kalahari Cement Ltd announced plans to acquire a 29.2% stake in East African Portland Cement Plc (EAPC) for Kshs 27.30 per share, positioning the deal as a strategic, long-term investment to support EAPC’s recovery, pending regulatory approvals;
Real Estate
During the week, the Kenya National Bureau of Statistics (KNBS) released the Leading Economic Indicators (LEI) May 2025 Reports, which highlighted the performance of major economic indicators.
Additionally, during the week, on the Real Estate Investments Trusts Sector, Acorn I-REIT, D-REIT, Laptrust I-REIT and ILAM Fahari I-REIT released their H1’2025 results that showed performance of these REITs;
On the Unquoted Securities Platform, Acorn D-REIT and I-REIT traded at Kshs 26.7 and Kshs 22.9 per unit, respectively, as per the last updated data on 1st August 2025. The performance represented a 33.4% and 14.5% gain for the D-REIT and I-REIT, respectively, from the Kshs 20.0 inception price. Additionally, ILAM Fahari I-REIT traded at Kshs 11.0 per share as of 1st August 2025, representing a 45.0% loss from the Kshs 20.0 inception price. The volume traded to date came in at 1.2 mn shares for the I-REIT, with a turnover of Kshs 1.5 mn since inception in November 2015.
Investment Updates:
- Weekly Rates: Cytonn Money Market Fund closed the week at a yield of 13.34 % p.a. To invest, dial *809# or download the Cytonn App from Google Play store here or from the Appstore here;
- We continue to offer Wealth Management Training every Tuesday, from 7:00 pm to 8:00 pm. The training aims to grow financial literacy among the general public. To register for any of our Wealth Management Trainings, click here;
- If interested in our Private Wealth Management Training for your employees or investment group, please get in touch with us through wmt@cytonn.com;
- Cytonn Insurance Agency acts as an intermediary for those looking to secure their assets and loved ones’ future through insurance namely; Motor, Medical, Life, Property, WIBA, Credit and Fire and Burglary insurance covers. For assistance, get in touch with us through insuranceagency@cytonn.com;
- Cytonn Asset Managers Limited (CAML) continues to offer pension products to meet the needs of both individual clients who want to save for their retirement during their working years and Institutional clients that want to contribute on behalf of their employees to help them build their retirement pot. To more about our pension schemes, kindly get in touch with us through pensions@cytonn.com;
Hospitality Updates:
- We currently have promotions for Staycations. Visit cysuites.com/offers for details or email us at sales@cysuites.com;
Money Markets, T-Bills Primary Auction:
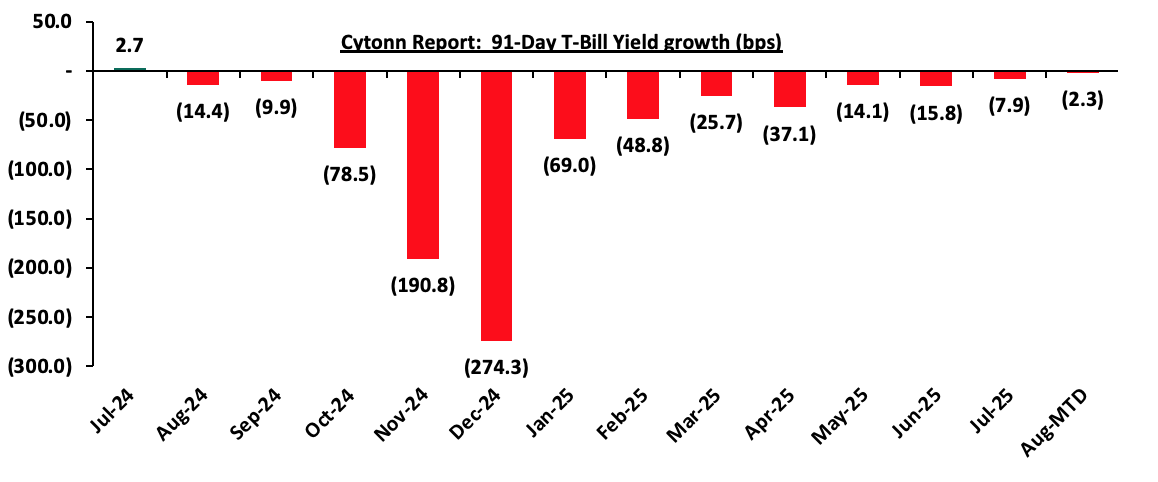
During the month of July 2025, T-bills were oversubscribed, with the overall average subscription rate coming in at 117.1%, albeit lower than the subscription rate of 179.5% recorded in June 2025. The overall average subscription rates for the 91-day and 364-day papers decreased to 156.5% and 141.1% respectively, from 234.6% and 283.6% respectively recorded in June 2025, while the average subscription rate for the 182-day paper increased to 77.4% from the 53.3% recorded in June 2025. The average yields on the government papers were on a downward trajectory during the month, with the average 91-day, 182-day, and 364-day papers yields decreasing by 7.9 bps, 7.3 bps, and 12.1 bps to 8.1%, 8.4% and 9.7% respectively, from an average of 8.2%, 8.5% and 9.8% recorded the previous month. For the month of July, the government accepted a total of Kshs 94.1 bn of the Kshs 112.4 bn worth of bids received in T-Bills, translating to an acceptance rate of 83.7%, compared to an acceptance rate of 72.8% in the month of June. The chart below shows the yield growth rate for the 91-day paper for the past one year:
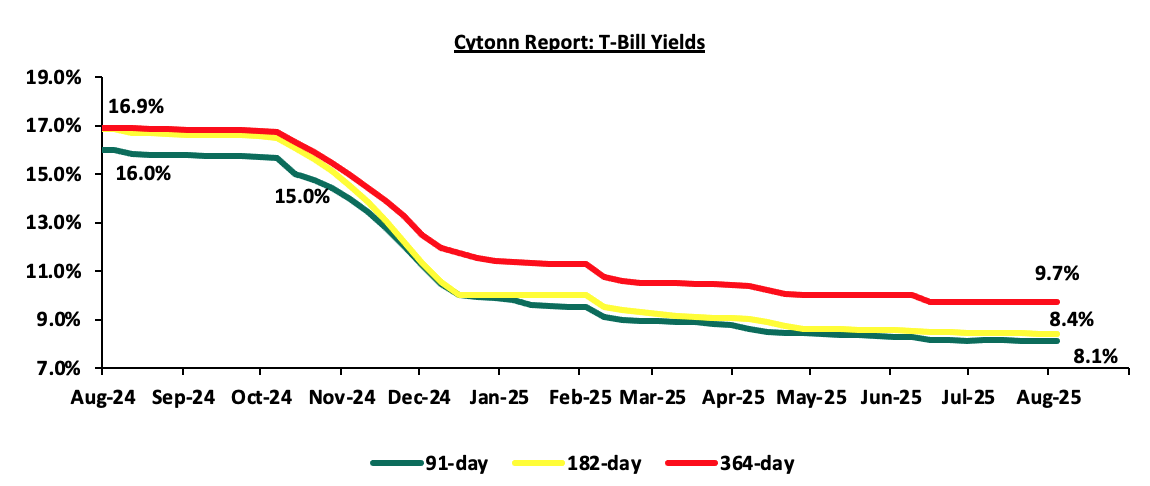
During the week, T-bills were undersubscribed for the first time in three weeks, with the overall subscription rate coming in at 67.1%, lower than the subscription rate of 166.7% recorded the previous week. Investors’ preference for the shorter 91-day paper waned, with the paper receiving bids worth Kshs 2.0 bn against the offered Kshs 4.0 bn, translating to a subscription rate of 49.3%, significantly lower than the subscription rate of 405.8%, recorded the previous week. The subscription rate for the 182-day paper decreased to 21.4% from the 32.0% recorded the previous week, while that of the 364-day paper decreased to 119.8%, from the 205.9% recorded the previous week. The government accepted a total of Kshs 16.0 bn worth of bids out of Kshs 16.1 bn bids received, translating to an acceptance rate of 99.6%. The yields on the government papers were on a downward trajectory with the yields on the 91-day, 182-day and 364-day papers decreasing by 0.6 bps, 0.9 bps and 0.2 bps to 8.11%, 8.41% and 9.72%, from the 8.12%, 8.42% and 9.72% recorded the previous week;
The chart below shows the performance of the 91-day, 182-day and 364-day papers from August 2024 to August 2025:
So far in the current FY’2025/26, government securities totaling Kshs 170.0 bn have been advertised. The government has accepted bids worth Kshs 176.8 bn, of which Kshs 110.2 bn and Kshs 66.7 bn were treasury bills and bonds, respectively. The amount of new borrowings for the current financial years stands at Kshs 69.7 bn which is 17.4% above the prorated borrowings of Kshs 59.4 bn
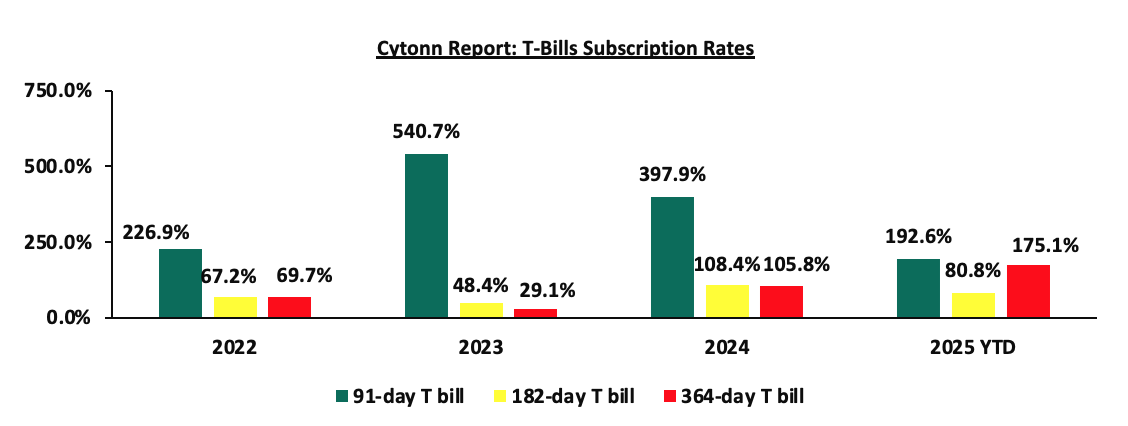
The chart below compares the overall average T-bill subscription rates obtained in 2022,2023, 2024 and 2025 Year-to-date (YTD):
Additionally, July 2025 bonds were oversubscribed, with the overall average subscription rate coming in at 153.8%, lower than the average subscription rate of 202.7% recorded in June 2025. The reopened bonds FXD1/2018/020 and FXD1/2018/025 with tenors to maturity of 12.8 years and 18.0 years respectively and fixed coupon rates of 13.2% and 13.4% respectively, received bids worth Kshs 76.9 bn against the offered Kshs 50.0 bn translating to an oversubscription rate of 153.8%. The government accepted bids worth Kshs 66.7 bn, translating to an acceptance rate of 87.4%, with the average accepted yields coming at 13.9% and 14.3% for the FXD1/2018/020 and FXD1/2018/025 respectively.
The table below provides more details on the bonds issued in July 2025:
|
Issue Date |
Bond Auctioned |
Effective Tenor to Maturity (Years) |
Coupon |
Amount offered (Kshs bn) |
Actual Amount Raised/Accepted (Kshs bn) |
Total bids received (Subscription) |
Average Accepted Yield |
Subscription Rate |
Acceptance Rate |
|
14/07/2025 |
FXD1/2018/020-Reopened |
12.8 |
13.2% |
50.0 |
30.6 |
33.1 |
13.9% |
153.8% |
92.4% |
|
FXD1/2018/025-Reopened |
18.0 |
13.4% |
36.1 |
43.8 |
14.3% |
82.3% |
|||
|
July 2025 Average |
15.4 |
13.3% |
50.0 |
66.7 |
76.9 |
14.1% |
153.8% |
87.4% |
|
|
June 2025 Average |
12.7 |
12.4% |
50.0 |
71.6 |
101.4 |
13.7% |
202.7% |
75.6% |
|
|
2024 Average
|
6.7 |
15.6% |
27.7 |
28.9 |
37.9 |
16.7% |
116.8% |
74.9% |
|
Secondary Bond Market:
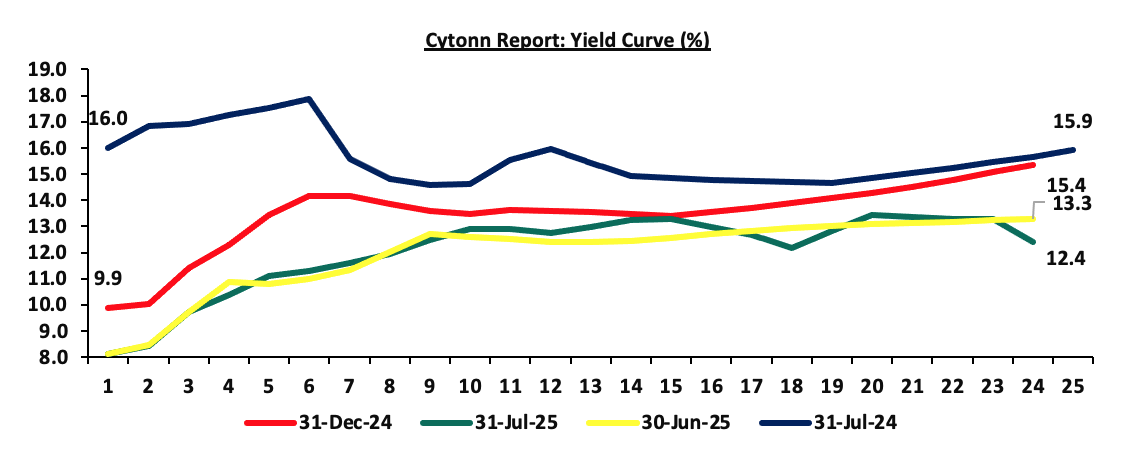
The yields on the government securities recorded a mixed performance during the month of July similar to June. Investors, apprehensive about the economic outlook in the long term, are demanding higher yields for bonds in the 11 to 21-year maturity range to compensate for the perceived risks as they anticipate potential fluctuations in economic conditions in the Kenyan market on the back of economic stability concerns.Notably, the yield curve has adjusted from a humped yield curve observed in 2023 and most part of 2024, towards a normal upward sloping curve, with long-term bonds registering highest yields. The shift in sentiment indicates increased confidence in the short-term economic landscape, in comparison to the last two years. The chart below shows the yield curve movement during the period:
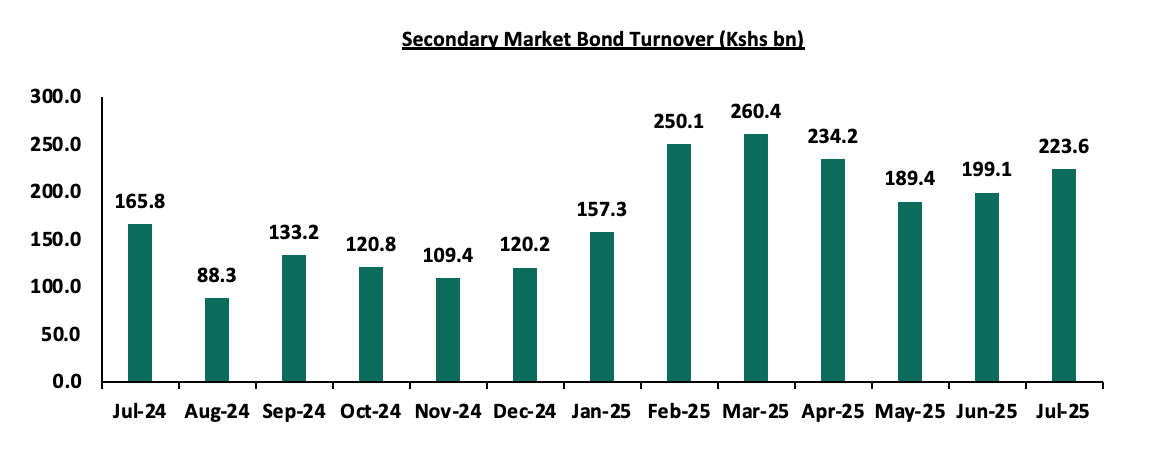
The secondary bond turnover increased by 12.3% to Kshs 223.6 bn, from Kshs 199.1 bn recorded in June 2025, pointing towards increased activities by commercial banks in the secondary bonds market for the month of July. On a year-on-year basis, the bond turnover increased by 34.8% from Kshs 165.8 bn worth of treasury bonds transacted over a similar period last year. The chart below shows the bond turnover over the past 12 months.
 Money Market Performance:
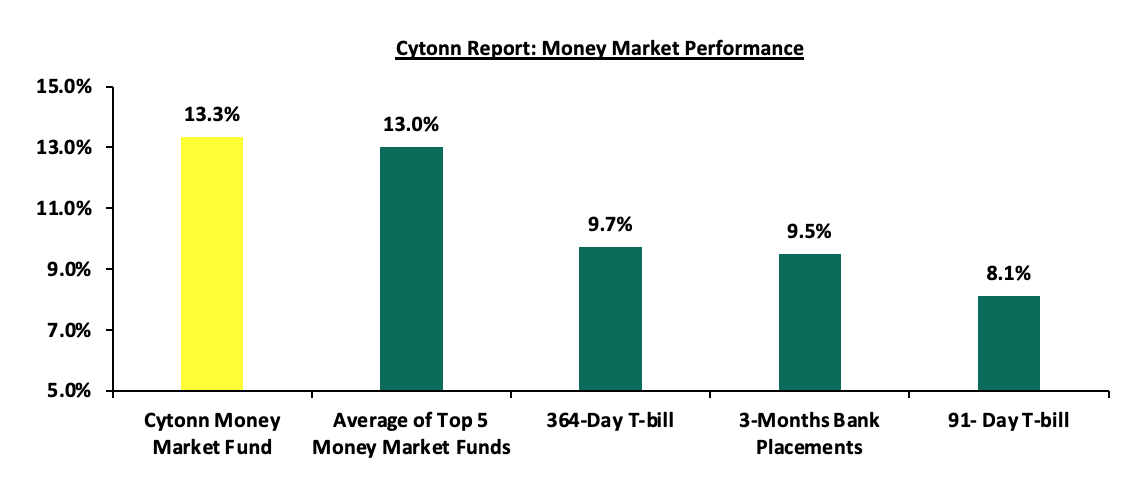
In the money markets, 3-month bank placements ended the week at 9.5% (based on what we have been offered by various banks), and yields on the government papers were on a downward trajectory with the yields on the 91-day paper and 364-day paper decreasing by 0.6 bps and 0.2 bps respectively to remain relatively unchanged from the 8.1% and 9.7% respectively recorded the previous week. The yield on the Cytonn Money Market Fund remained unchanged, from the 13.3% recorded the previous week, while the average yields on the Top 5 Money Market Funds increased by 5.2 bps to remain relatively unchanged from the 13.0% recorded the previous week.
The table below shows the Money Market Fund Yields for Kenyan Fund Managers as published on 1st August 2025:
|
Cytonn Report: Money Market Fund Yield for Fund Managers as published on 1st August 2025 |
||
|
Rank |
Fund Manager |
Effective Annual Rate |
|
1 |
Cytonn Money Market Fund (Dial *809# or download Cytonn App) |
13.3% |
|
2 |
Gulfcap Money Market Fund |
13.1% |
|
3 |
Ndovu Money Market Fund |
13.1% |
|
4 |
Nabo Africa Money Market Fund |
12.8% |
|
5 |
Lofty-Corban Money Market Fund |
12.7% |
|
6 |
Arvocap Money Market Fund |
12.5% |
|
7 |
Orient Kasha Money Market Fund |
12.5% |
|
8 |
Kuza Money Market fund |
12.3% |
|
9 |
Etica Money Market Fund |
12.2% |
|
10 |
GenAfrica Money Market Fund |
11.4% |
|
11 |
Jubilee Money Market Fund |
11.4% |
|
12 |
British-American Money Market Fund |
11.2% |
|
13 |
Old Mutual Money Market Fund |
11.1% |
|
14 |
Madison Money Market Fund |
11.1% |
|
15 |
Enwealth Money Market Fund |
11.0% |
|
16 |
Sanlam Money Market Fund |
10.3% |
|
17 |
Apollo Money Market Fund |
10.2% |
|
18 |
Faulu Money Market Fund |
10.2% |
|
19 |
Dry Associates Money Market Fund |
10.2% |
|
20 |
KCB Money Market Fund |
9.8% |
|
21 |
ICEA Lion Money Market Fund |
9.4% |
|
22 |
Co-op Money Market Fund |
9.3% |
|
23 |
Mali Money Market Fund |
9.2% |
|
24 |
Genghis Money Market Fund |
9.0% |
|
25 |
CIC Money Market Fund |
8.8% |
|
26 |
Absa Shilling Money Market Fund |
8.6% |
|
27 |
Mayfair Money Market Fund |
8.5% |
|
28 |
AA Kenya Shillings Fund |
7.9% |
|
29 |
Ziidi Money Market Fund |
7.0% |
|
30 |
CPF Money Market Fund |
6.9% |
|
31 |
Stanbic Money Market Fund |
6.4% |
|
32 |
Equity Money Market Fund |
5.1% |
Source: Business Daily
Liquidity:
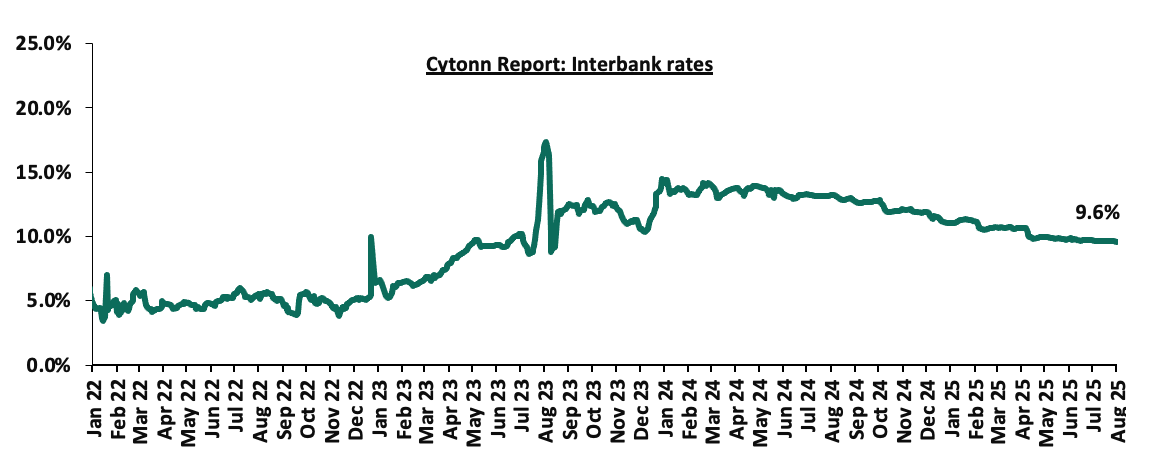
Liquidity in the money markets eased in the month of July 2025, with the average interbank rate decreasing by 0.1% points to 9.6% from 9.7% recorded the previous month. Additionally, during the month of July, the average interbank volumes traded decreased by 21.8% to Kshs 10.5 bn, from Kshs 13.4 bn recorded in June.
Additionally, during the week, liquidity in the money markets marginally eased, with the average interbank rate decreasing by 0.5 bps, to remain relatively unchanged from the 9.6% recorded the previous week, partly attributable to government payments that offset tax remittances. The average interbank volumes traded decreased by 8.7% to Kshs 11.9 bn from Kshs 13.0 bn recorded the previous week. The chart below shows the interbank rates in the market over the years:
Kenya Eurobonds:
During the month, the yields on the Eurobonds were on a downward trajectory, with the yield on the 7-year Eurobond issued in 2024 decreasing the most by 31.0 bps to 9.0% from 9.3% recorded at the beginning of the month.
Similarly, during the week, the yields on Kenya’s Eurobonds were on a downward trajectory with the yield on the 7-year Eurobond issued in 2024 decreasing the most by 20.5 bps to 9.0% from 9.2% recorded the previous week. The table below shows the summary performance of the Kenyan Eurobonds as of 31st July 2025;
|
Cytonn Report: Kenya Eurobond Performance |
|||||||
|
|
2018 |
2019 |
2021 |
2024 |
2025 |
||
|
Tenor |
10-year issue |
30-year issue |
7-year issue |
12-year issue |
13-year issue |
7-year issue |
11-year issue |
|
Amount Issued (USD) |
1.0 bn |
1.0 bn |
0.9 bn |
1.2 bn |
1.0 bn |
1.5 bn |
1.5 bn |
|
Years to Maturity |
3.0 |
23.0 |
2.2 |
7.2 |
9.3 |
6.0 |
11.0 |
|
Yields at Issue |
7.3% |
8.3% |
7.0% |
7.9% |
6.2% |
10.4% |
9.9% |
|
02-Jan-25 |
9.1% |
10.3% |
8.5% |
10.1% |
10.1% |
10.1% |
|
|
01-Jul-25 |
8.0% |
10.3% |
- |
9.4% |
9.7% |
9.3% |
|
|
24-Jul-25 |
8.0% |
10.3% |
- |
9.4% |
9.7% |
9.2% |
|
|
25-Jul-25 |
7.9% |
10.3% |
- |
9.2% |
9.6% |
9.1% |
|
|
28-Jul-25 |
7.8% |
10.1% |
- |
9.1% |
9.5% |
9.0% |
|
|
29-Jul-25 |
7.8% |
10.2% |
- |
9.2% |
9.6% |
9.0% |
|
|
30-Jul-25 |
7.8% |
10.2% |
- |
9.2% |
9.6% |
9.0% |
|
|
31-Jul-25 |
7.8% |
10.2% |
- |
9.2% |
9.5% |
9.0% |
|
|
Weekly Change |
(0.2%) |
(0.1%) |
- |
(0.2%) |
(0.2%) |
(0.2%) |
- |
|
MTD Change |
(0.2%) |
(0.1%) |
- |
(0.3%) |
(0.1%) |
(0.3%) |
- |
|
YTD Change |
(1.3%) |
(0.1%) |
- |
(0.9%) |
(0.6%) |
(1.1%) |
- |
Source: Central Bank of Kenya (CBK) and National Treasury
Kenya Shilling:
During the month, the Kenya Shilling depreciated marginally by 0.4 bps against the US Dollar, to remain relatively unchanged from the Kshs 129.2 recorded at the end of June.
During the week, the Kenya Shilling appreciated marginally against the US Dollar by 1.9 bps, to close the week at Kshs 129.2, from 129.3 recorded the previous week. On a year-to-date basis, the shilling has appreciated by 5.2 bps against the dollar, compared to the 17.4% appreciation recorded in 2024.
We expect the shilling to be supported by:
- Diaspora remittances standing at a cumulative USD 5,084.0 mn in the twelve months to June 2025, 12.1% higher than the USD 4,535.0 mn recorded over the same period in 2024. These has continued to cushion the shilling against further depreciation. In the June 2025 diaspora remittances figures, North America remained the largest source of remittances to Kenya accounting for 57.9% in the period,
- The tourism inflow receipts which came in at Kshs 452.2 bn in 2024, a 19.8% increase from Kshs 377.5 bn inflow receipts recorded in 2023, and owing to tourist arrivals that improved by 8.0% to 2,303,028 in the 12 months to February 2025 from 2,133,612 in the 12 months to February 2024, and,
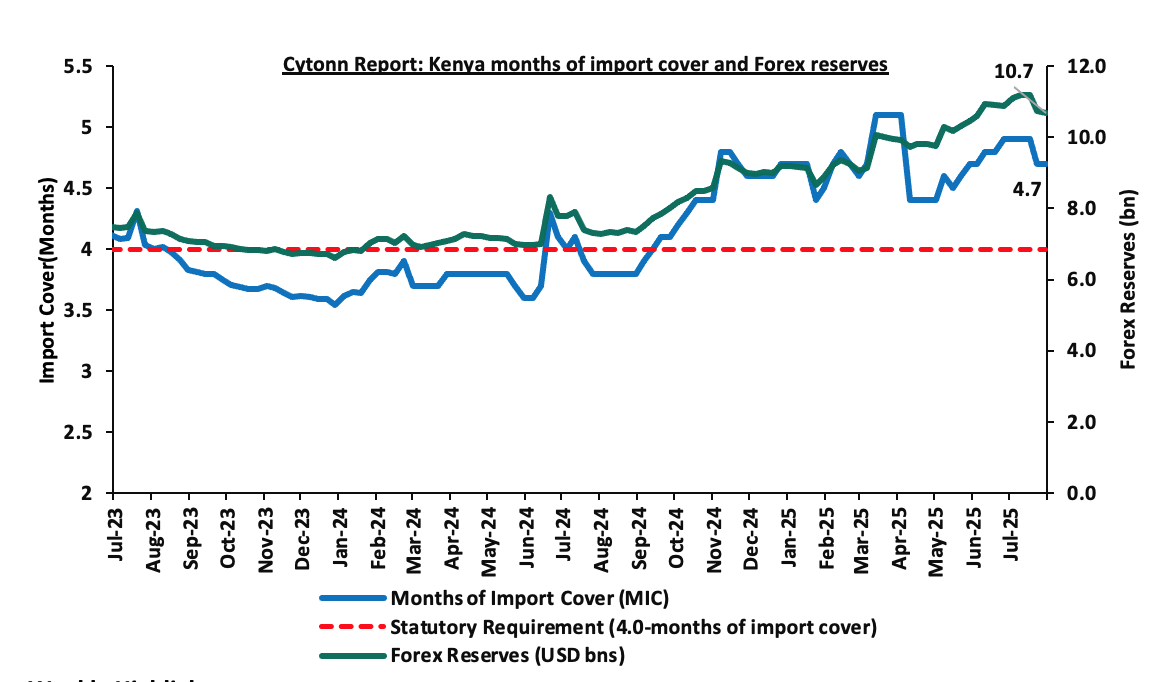
- Improved forex reserves currently at USD 10.7 bn (equivalent to 4.7-months of import cover), which is above the statutory requirement of maintaining at least 4.0-months of import cover and above the EAC region’s convergence criteria of 4.5-months of import cover.
The shilling is however expected to remain under pressure in 2025 as a result of:
- An ever-present current account deficit which came at 31.8% of GDP in the twelve months to April 2025, and,
- The need for government debt servicing, continues to put pressure on forex reserves given that 62.0% of Kenya’s external debt is US Dollar-denominated as of December2024.
Key to note, Kenya’s forex reserves decreased by 1.8% during the month of July 2025, to USD 10.7 bn, from the USD 10.9 bn recorded in the previous month, equivalent to 4.7 months of import cover and above the statutory requirement of maintaining at least 4.0-months of import cover. Additionally, during the month, the months of import cover decreased to 4.7 from 4.9 recorded in the previous month. Additionally, Kenya’s forex reserves decreased by 0.5% during the week to remain relatively unchanged from the USD 10.7 bn recorded the previous week, equivalent to 4.7 months of import cover, and above the statutory requirement of maintaining at least 4.0-months of import cover.
The chart below summarizes the evolution of Kenya's months of import cover over the years:
Weekly Highlights
- Central Bank of Kenya (CBK) New Retail Bond Platform
On 22nd July 2025, the Central Bank of Kenya (CBK) initiated procurement for a new digital retail bond system. According to the tender document, the system will offer a fully integrated front-end and back-end platform, allowing individual investors to register, purchase, manage, rediscount, and receive interest payments on government securities primarily through mobile phones and the web. The CBK explicitly outlines the goal to “provide all services related to retail bonds”, including direct settlement via mobile money and banking systems, automation of interest/coupon payments, and a real-time, investor-facing dashboard for balances, transaction history, and reporting.
This is a notable evolution from previous platforms, and it reflects a deeper strategic shift. Whereas M-Akiba suffered from limited functionality, confusing onboarding, and no exit mechanism, and DhowCSD was skewed toward digital-savvy investors with limited support for small savers, the new system is designed from the ground up with mass-market financial inclusion and user simplicity as central priorities.
The evolution of these systems is captured in the table below:
|
M-Akiba (2017) |
DhowCSD (2023) |
New CBK System (2025) |
|
|
Target Market |
Low-income retail investors |
Institutional and retail (digitally literate) |
Mass-market retail, micro-savers included |
|
Access Channel |
Limited hours, USSD via mobile |
24/7, Web-first with limited mobile functionality |
24/7 availability including secondary trading, USSD, mobile app and web platforms. |
|
Account Opening |
Manual, broker-assisted |
Direct via online portal |
Fully digital KYC and self-registration |
|
Functionality |
Buy only |
Account opening, bidding |
Buy, sell, rediscount, receive interest |
|
Integration with Payments |
M-Pesa and Airtel money only |
Bank-linked payments |
Bank + mobile money operators (real-time) |
|
Liquidity |
Guaranteed exit option but no rediscounting |
Has secondary market access |
Full rediscount and early exit options |
|
Interface |
Technical, USSD menus |
Formal, web-based |
Intuitive, simplified, mobile-optimized |
|
Scalability |
Limited, never scaled |
Proven, growing rapidly |
Built for national scale (supports 40+ mn concurrent transactions) |
Source: CBK
Beyond its expanded functionality, the platform’s architecture as outlined in the tender includes a modular, API-enabled system, allowing for integration with Mobile Network Operators (MNOs), payment gateways, and CBK’s internal systems. Key technical features include:
- Automated Interest Processing – System must auto-calculate and process coupon/interest payments.
- Retail Depository Management – Maintain a comprehensive, secure, and real-time register of securities ownership.
- Rediscount and Secondary Transfers – Support for early exits, resale, and portfolio rebalancing, particularly crucial for lower-income users.
- Multi-Channel Access – Full service availability via mobile app, USSD, and responsive web interface.
- Reporting & Analytics – Generation of both investor-facing and internal reports, including performance dashboards and audit logs.
From a policy perspective, the timing of the rollout coincides with a deliberate fiscal pivot toward the domestic market. With Treasury targeting Kshs 635.5 bn in local borrowing for FY2025/26 and international credit markets growing tighter, this platform offers a crucial distribution channel. Investor demand also appears robust bond turnover hit Kshs 1.5 tn in 2024, and individual accounts now comprise 79.0% of those on DhowCSD. The graph below shows the composition of DhowCSD investors by June 2024
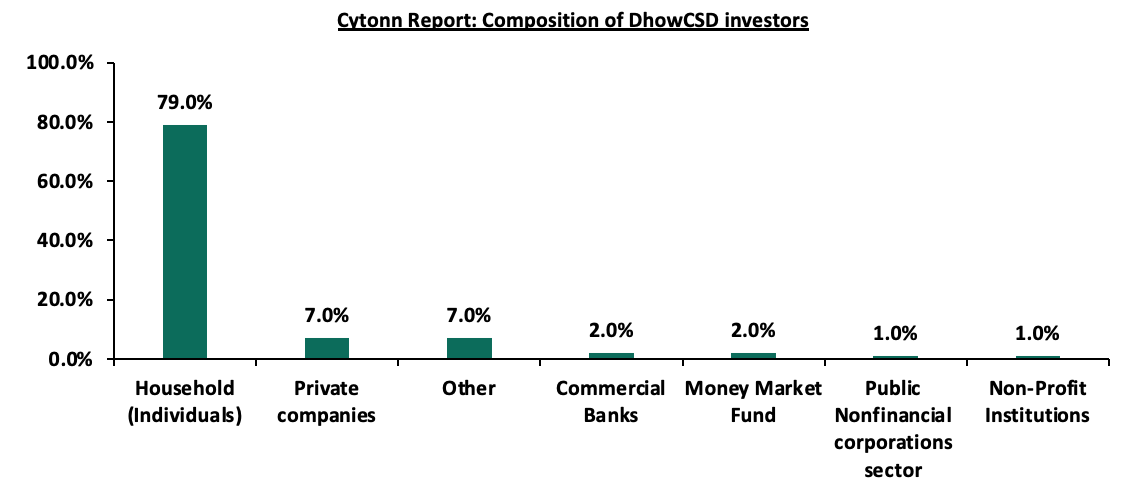
Source: CBK
The graph below shows secondary bond market turnover from Jan 2021 to Jun 2025, highlighting the impact of the DhowCSD platform.
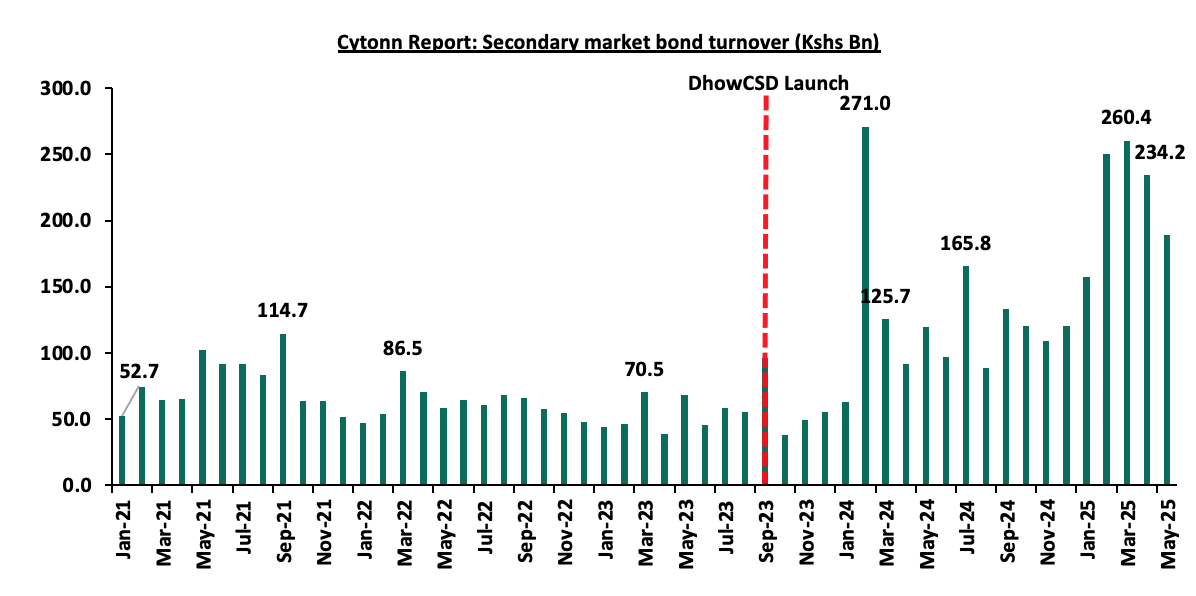
Source: NSE
M-Akiba reduced entry thresholds but failed to build trust. DhowCSD improved transparency but catered to a narrow segment. The new platform incorporates the learnings of both, while embedding features needed for scale, ease, and lifecycle engagement.
If well-executed, the platform could serve as a blueprint for other frontier markets seeking to mobilize domestic capital in an inclusive, technology-driven way. However, success will depend on robust public education, seamless user experience, and institutional commitment beyond deployment. A technically sound system that’s poorly adopted would replicate past mistakes. Still, with its design, timing, and fiscal backing, this is Kenya’s best shot yet at mass retail bond participation.
- Fitch Ratings Affirms Kenya’s Credit Rating at B- and Maintains Stable Outlook
On 25th July 2025, the global ratings agency, Fitch Ratings affirmed Kenya’s Long-Term Foreign-Currency Issuer Default Rating (IDR) at B-, while maintaining the Stable outlook. The affirmation reflects Fitch’s view that Kenya’s medium-term economic growth prospects remain robust, supported by a relatively diversified economy, sustained multilateral and bilateral creditor support, and moderate progress on fiscal consolidation.
Kenya’s economy has shown resilience despite tighter global financial conditions. Fitch projects real GDP growth at 4.9% in 2025, slightly up from 4.7% in 2024, supported by a rebound in private-sector activity. The fiscal deficit is expected to narrow to 5.4% of GDP in FY2024/25, down from an estimated 5.7% in FY2023/24, as improved revenue performance is largely offset by rising interest payments and public sector wages.
Public debt remains elevated, estimated at 67.4% of GDP at end-2024, well above the 55.0% IMF benchmark for countries at high risk of debt distress. However, Fitch noted improvements in debt management, including a successful Eurobond buyback and re-issuance in February 2025, which helped smooth the external debt maturity profile and reduce near-term refinancing risks. Additionally, Kenya’s external reserves, supported by multilateral disbursements, have stabilized, helping to mitigate short-term liquidity pressures.
The government’s fiscal deficit is projected at 4.9% of GDP in FY2024/25, slightly wider than earlier estimates but narrower than FY2023/24’s 5.7%. This reflects moderate success in domestic revenue mobilization and containment of recurrent expenditure. Fitch highlighted that the authorities remain committed to their fiscal consolidation agenda, although the path remains constrained by rising debt service costs, weak revenue performance, and socio-political pressures.
The Stable outlook is underpinned by expectations that Kenya will maintain macroeconomic stability, avoid major policy slippage, and continue receiving financial support from development partners. However, Fitch cautioned that persistent vulnerabilities such as high external debt service, reliance on concessional borrowing, and limited fiscal space continue to weigh on the sovereign rating.
Kenya’s rating places it in line with several other Sub-Saharan African (SSA) sovereigns, such as Angola, Nigeria, and Egypt. The affirmation by Fitch follows Moody’s latest periodic review published on 28th July 2025, which maintained Kenya’s Caa1 rating with a Positive outlook. Meanwhile, S&P affirmed Kenya’s B‑ rating with a Stable outlook on 24th February 2025.
To note, Kenya successfully tapped the international capital markets in early 2025, issuing a USD 1.5 bn Eurobond with a maturity of 11 years at a coupon rate of 9.5%, partly to buy back part of the 2024 Eurobond and ease short-term external obligations. This issue followed similar international market activity by other SSA economies earlier in 2024, including Ivory Coast, Benin, and Senegal, with coupon rates ranging from 7.7% to 8.4%.
Below is a table comparing Kenya, Ivory Coast, Senegal, Cameroon Benin’s Fitch’s credit rating and summary of the Eurobond issues:
|
Cytonn Report: Fitch’s Rating's Long-Term Foreign-Currency Issuer Default Rating (IDR) |
||||||||
|
Fitch’s Rating's Long-Term Foreign-Currency Issuer Default Rating (IDR) |
2024 Eurobond Issues |
|||||||
|
Country |
IDR Credit Rating |
IDR Credit Outlook |
Rating Date |
Value (USD mn) |
Tenor (Years) |
Coupon Rate |
Yield at issuance |
Issuance Date |
|
Ivory Coast |
BB- |
Stable |
June-2025 |
1,100.0 |
8.5 |
7.625% |
8.00% |
Jan-24 |
|
1,500.0 |
12.5 |
8.250% |
8.50% |
|||||
|
Benin |
B+ |
Stable |
Jul-2025 |
750.0 |
14.0 |
8.375% |
8.75% |
Feb-24 |
|
Kenya |
B- |
Stable |
Jul-2025 |
1,500.0 |
6.0 |
9.750% |
10.375% |
Feb-24 |
|
Senegal |
B- |
Stable |
June-2025 |
750.0 |
7.0 |
7.75% |
7.75% |
Jun-24 |
|
Cameroon |
B |
Negative |
May-2025 |
550.0 |
11.0 |
9.5% |
10.75 |
Jul-24 |
Going forward, Kenya's government faces the challenge of maintaining fiscal consolidation momentum amid rising expenditure pressures. Fitch notes that the fiscal deficit will remain elevated, projecting it at 5.8% of GDP in FY2024/25, 2.5% points above the government’s initial budget target. This slippage is attributed to expenditure growth outpacing revenue driven by rising interest payments and a growing public wage bill. Fitch further expects the fiscal deficit to remain high in FY2025/26, reaching 5.2% of GDP, 0.5% points above the government’s revised target, reflecting persistent spending pressures, limited fiscal consolidation progress, and increasing social and security demands. While revenue performance is projected to improve, the government’s ability to significantly reduce deficits is constrained by limited fiscal space and persistent socio-political pressures. Fitch highlights that gross external financing needs will remain high, averaging USD 4.3 bn (4.3% of GDP) over 2025–2026, with liquidity risks heightened by Kenya’s reliance on concessional funding and reduced access to commercial external borrowing. Sustained policy discipline, enhanced revenue mobilization and effective expenditure controls will be critical to bolstering investor confidence and achieving long-term fiscal sustainability
- Inflation Highlight July 2025
The year-on-year inflation in July 2025 rose slightly to 4.1%, up from 3.8% recorded in June 2025. The headline inflation was primarily driven by price increases in the following categories: Food & Non-Alcoholic Beverages at 6.8%, Transport at 4.1%, and Housing, Water, Electricity, Gas and Other Fuels at 1.3%. The month-on-month inflation rate stood at 0.1% in July 2025. The table below summarizes the performance of commodity indices both on a year-on-year and month-on-month basis:
|
Cytonn Report: Major Inflation Changes – July 2025 |
|||
|
Broad Commodity Group |
Price change m/m (July-2025/ June -2025) |
Price change y/y (July-2025/July-2024) |
Reason |
|
Food and non- alcoholic beverages |
(0.3%) |
6.8% |
The y/y increase was driven by higher prices of tomatoes, maize grain, carrots and sugar of 20.3%, 18.4%, 17.7% and 13.6% respectively. On an m/m basis, kales, tomatoes and onions rose by 1.3%, 1.2%, and 0.9% respectively, despite declines in cooking oil, carrots and cabbages of 0.6%, 0.7% and 1.3% respectively. |
|
Transport |
0.8% |
4.1% |
The y/y increase was attributed to the increase in the prices of diesel 0.2% and countrywide fare costs despite the 1.1% decline in petrol. On an m/m basis, diesel rose 5.4%, petrol by 5.2%, while bus and matatu fares also edged up slightly. |
|
Housing, water, electricity, gas and other fuels |
0.7% |
1.3% |
The y/y increase was supported by rising electricity (50kWh), and rents prices of 2.1% and 1.7% respectively. On an m/m basis, kerosene, electricity (50kWh), gas and rent prices rose by 6.7%, 0.6% and 0.1% respectively while electricity (200kWh) declined by 1.4%. |
|
Overall Inflation |
0.1% |
4.1% |
The marginal m/m increase was largely supported by the transport and food categories. Y/y, inflation rose slightly from 3.8% to 4.1%, reflecting continued cost pressures in essential consumption categories. |
In July 2025, overall inflation rose slightly to 4.1% on a y/y basis, up from 3.8% in June 2025, signaling mild upward price pressure in key sectors. Despite this, the inflation rate remained within the Central Bank of Kenya’s preferred range of 2.5%–7.5% for the twenty-fifth consecutive month, underscoring ongoing macroeconomic stability. The increase was primarily driven by a 6.8% y/y rise in food and non-alcoholic beverage prices, a 4.1% increase in transport costs and a 1.3% rise in housing, water, electricity, gas and other fuels. On a month-to-month basis, inflation was marginal at 0.1%, indicating relative price stability. Fuel prices saw modest m/m gains, with diesel prices rising by 5.4%, petrol by 5.2% and LPG by 0.4%, adding slight upward pressure to transport and household energy costs. Meanwhile, the Kenya Shilling maintained stability, recording a 0.3 bps month-to-date appreciation as of 31st July 2025 to Kshs 129.2 from the Kshs 129.2 recorded at the beginning of July and a 5.2 bps year-to-date gain to Kshs 129.2 as of 31st July, 2025, from the Kshs 129.3 recorded at the beginning of the year. This stabilization in the exchange rate, combined with manageable fuel price increases, continues to anchor inflation expectations within the CBK’s target range. However, the recent reduction in the Central Bank Rate to 9.75% from 10.00% is expected to stimulate credit uptake and increase money supply, which could gradually exert upward pressure on inflation in the coming months as monetary easing transmits through the broader economy.
The chart below shows the inflation rates for the past 5 years:
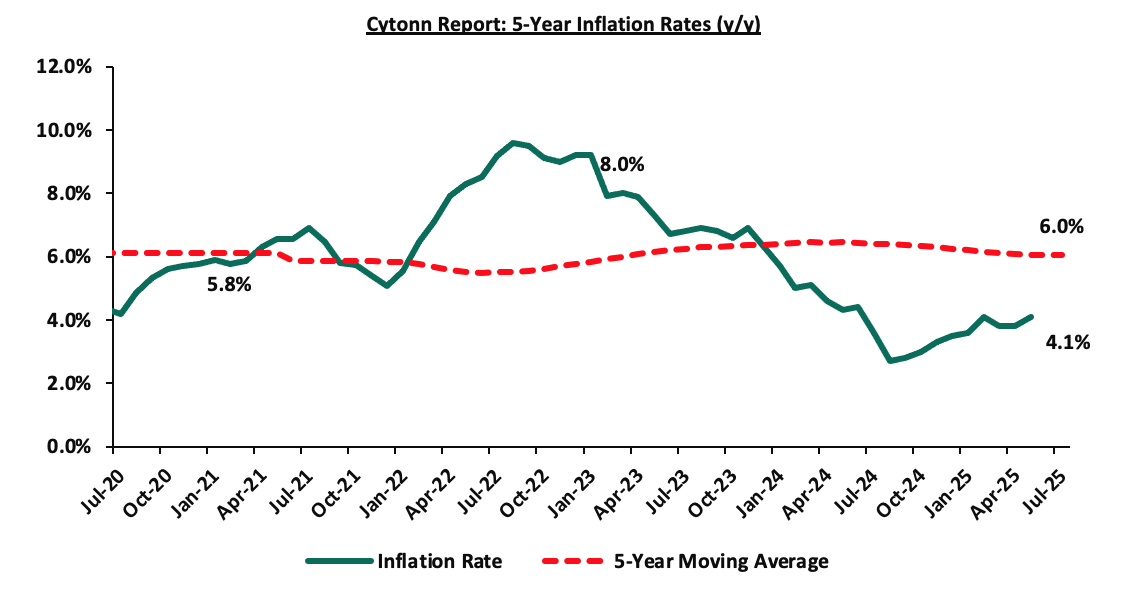
Going forward, we expect inflation to remain within the Central Bank of Kenya’s preferred range of 2.5%–7.5%, supported by a stable exchange rate and moderating fuel prices, despite slight monthly increases. Additionally, favourable weather conditions are expected to sustain agricultural output, helping to stabilize food prices, which have been a major driver of inflation, rising by 6.8% y/y in July 2025. However, risks remain. While fuel prices have been relatively stable, they continue to hover at elevated levels compared to historical averages, with diesel up by 0.2% on y/y. These sustained price levels may continue exerting pressure on transport and household energy costs. In its June 2025 meeting, the Monetary Policy Committee (MPC) cut the Central Bank Rate (CBR) by 25.0 bps to 9.75% from 10.00%, aiming to ease monetary conditions and support economic recovery. While this move is expected to stimulate borrowing and consumer spending, it may also lead to a gradual build-up in inflationary pressure as liquidity increases in the economy. The MPC is set to meet again in August 2025, and expectations point towards further, though cautious, rate cuts to provide continued support to the economy. However, the pace and scale of monetary easing will likely be measured to ensure inflation remains anchored within the target range.
- The Monetary Policy Committee (MPC) August 2025 Meeting
The Monetary Policy Committee (MPC) is expected to meet on Tuesday, 12th August 2025 to review the outcome of its previous stance. We are projecting that the MPC will maintain the Central Bank Rate (CBR) at 9.75%, with their decision mainly being supported by;
- The need to allow more time for the effects of previous monetary policy measures to take hold: In the recent past, the Central Bank has implemented a series of rate cuts totalling 325 basis points bringing the CBR down to 9.75% in June 2025 from 13.00% in August 2024. Maintaining the current rate will provide an opportunity to assess the full impact of these measures before taking further action. While private sector credit growth has slowed on a year on year basis, registering a marginal increase of 2.0% in May 2025 compared to 4.5% in May 2024, the effects of recent interventions may take time to manifest. Holding the rate steady will avoid premature easing and allow the MPC to make a more data-driven decision in the coming months, especially as the broader economy adjusts.
- Similar decisions by global giant economies: The European Central Bank decided to maintain their rate at 2.00% on 24th July 2025. Meanwhile, the US Federal Reserve decided to maintain their benchmark interest rate at 4.25%-4.50% in their most recent meeting on 30th July 2025, continuing the trend since January. Hence, the MPC may choose to take a more cautious approach, ensuring domestic factors are fully aligned before implementing further cuts, and,
- The continued stability of the Shilling against major currencies: Despite the June rate cut, the Kenyan Shilling has remained stable, depreciating marginally by 0.2 bps against the US Dollar to remain relatively unchanged from the Kshs 129.2 recorded on 10th June 2025. This stability, supported by foreign exchange reserves currently at 4.7 months of import cover (above the 4.0 months statutory requirement), provides the MPC with the flexibility to maintain the current rate without risking currency volatility or capital outflows.
To read more, please see our August 2025 Monetary Policy Committee (MPC) Note.
Monthly Highlights:
- During the month, Stanbic Bank released its monthly Purchasing Manager’s Index (PMI) highlighting that the index for the month of June 2025 deteriorated to negative territory, coming in at 48.6, down from 49.6 in May 2025, marking a second consecutive month the index fell below the 50.0 neutral mark, signaling worsening in business conditions, mainly attributable to decreased output and new orders. For more information, please see our Cytonn Weekly H1’2025 Markets Review
- During the month, the Kenya National Bureau of Statistics released the Q1’2025 Quarterly Balance of Payment Report, highlighting that Kenya’s balance of payments position deteriorated significantly by 313.8% in Q1’2025, with a deficit of Kshs 77.0 bn, from a surplus of Kshs 36.0 bn in Q1’2024. For more information, please see our Q1’2025 BoP Note
- During the month, the Kenya National Bureau of Statistics (KNBS) released the Q1’2025 Quarterly Gross Domestic Product Report, highlighting that the Kenyan economy recorded a 4.9% growth in Q1’2025, remaining unchanged from Q1’2024. The main contributor to Kenyan GDP remains to be the Agriculture, fishing and forestry sector which grew by 6.0% in Q1’2025, higher than the 5.6% expansion recorded in Q1’2024. For more information, please see our Q1’2025 GDP Note
- During the month, Linzi FinCo 003 Trust announced the successful full subscription of its Kshs. 44.8 bn Infrastructure Asset-Backed Securities (IABS) issuance, with bids totaling KSh. 44.9 billion translating to a subscription rate of 100.2%. The 15-year notes, offering a fixed annual return of 15.04%, will finance the Talanta Sports Complex through receivables from the Sports, Arts and Social Development Fund (SASDF). For more information, please see our Cytonn Weekly H1’2025 Markets Review
- During the month, the Kenya Revenue Authority (KRA) released the annual revenue performance for FY’2024/25, highlighting that revenue mobilization for the period grew by 6.8% down from 11.1 % growth in the previous financial year, after KRA collected Kshs 2.6 tn compared to Kshs 2.4 tn in the previous financial year. For more information, please see our Cytonn Weekly #28/2025
- During the month, The Energy and Petroleum Regulatory Authority (EPRA) released their monthly statement on the maximum retail fuel prices in Kenya, effective from 15th July 2025 to 14th August 2025. Notably, the maximum allowed price for Super Petrol, Diesel and Kerosene increased by 5.1%, 5.3% and 6.6% to retail at Kshs 186.3, Kshs 171.6 and Kshs 156.6 per litre respectively. For more information, please see our Cytonn Weekly #29/2025
- During the month, the National Treasury gazetted the revenue and net expenditures for the year FY’2024/2025, ending 30th June 2025, highlighting that the total revenue collected as at the end of June 2025 amounted to Kshs 2,430.1 bn, equivalent to 97.4% of the revised estimates III of Kshs 2,496.2 bn for FY’2024/2025. For more information, please see our Cytonn Weekly #30/2025
Rates in the Fixed Income market have been on a downward trend due to high liquidity in the money market which allowed the government to front load most of its borrowing. The government is 17.4% ahead of its prorated net domestic borrowing target of Kshs 59.4, having a net borrowing position of Kshs 69.7 bn (inclusive of T-bills). However, we expect a stabilization of the yield curve in the short and medium term, with the government looking to increase its external borrowing to maintain the fiscal surplus, hence alleviating pressure in the domestic market. As such, we expect the yield curve to stabilize in the short to medium-term and hence investors are expected to shift towards the long-term papers to lock in the high returns
Market Performance:
During the month of July 2025, the equities market was on an upward trajectory, with NSE 25 gaining the most by 5.0%, while NSE 20, NASI and NSE 10 gained by 4.9%, 4.4% and 4.1% respectively. The equities market positive performance was driven by gains recorded by large-cap stocks such as EABL, NCBA Bank and BAT Kenya of 14.2%, 11.3%, and 10.9% respectively. The monthly performance was however weighed down by losses recorded by large cap stocks such as Co-operative Bank of 5.0%.
During the week, the equities market registered a mixed performance, with NASI losing by 1.0%, while NSE 10, NSE 25 and NSE 20 all gained by 0.1%, taking the YTD performance to gains of 26.8%, 23.3%, 18.8% and 18.3% for NASI, NSE 20, NSE 25 and NSE 10 respectively. The week on week equities market performance was driven by losses recorded by large-cap stocks such as Safaricom, NCBA Bank and DTB-K Bank of 3.3%, 3.1%, and 0.6% respectively. The performance was however supported by gains recorded by large-cap stocks such as EABL, Standard Chartered Bank and BAT-Kenya of 7.1%, 1.9% and 1.5% respectively;
Additionally, in the regional equities market, the East African Exchanges 20 (EAE 20) share index gained by 0.2%, attributable to gains recorded by large cap stocks such as CRDB Bank, Quality Chemicals Industry Limited and Tanga Cement Company Limited of 13.1%, 7.0% and 4.9% respectively. However, the performance was weighed down by the losses recorded by large cap stocks such as Safaricom, Tanzania Breweries Limited and MTN Uganda of 2.3%, 1.2% and 1.0% respectively.
Equities turnover increased by 4.5% in the month of July 2025 to USD 96.8 mn, from USD 92.6 mn recorded in June 2025. Foreign investors became net sellers, with a net selling position of USD 4.1 mn, a shift from a net buying position of USD 4.9 mn recorded in June 2025.
During the week, equities turnover increased by 7.8% to USD 21.8 mn from USD 20.2 mn recorded the previous week, taking the YTD total turnover to USD 523.0 mn. Foreign investors became net buyers for the first time in three weeks with a net buying position of USD 3.0 mn, from a net selling position of USD 2.8 mn recorded the previous week, taking the YTD foreign net selling position to USD 29.0 mn, compared to a net selling position of USD 16.9 mn recorded in 2024.
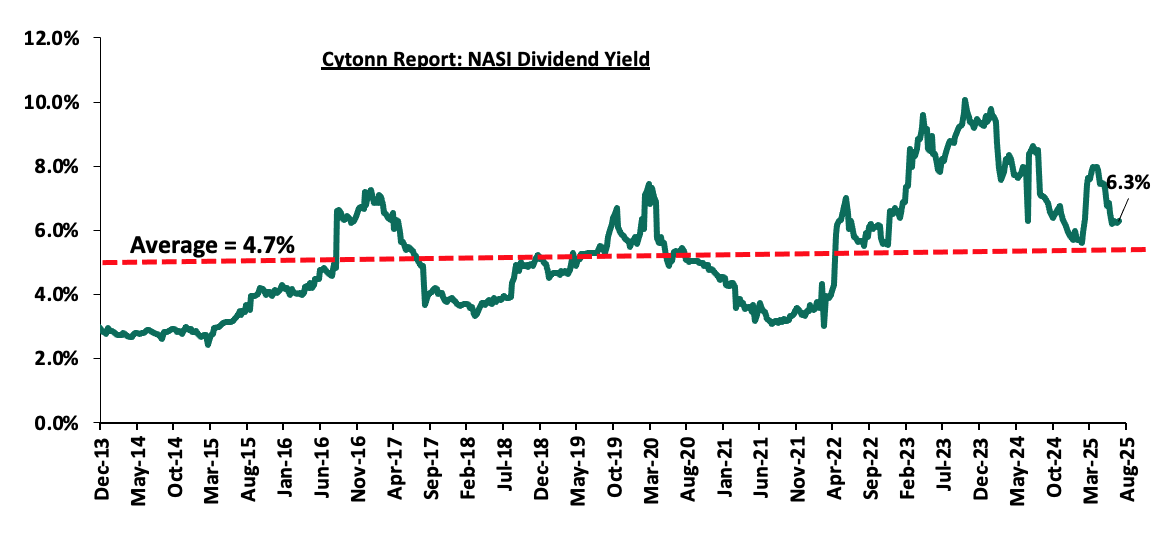
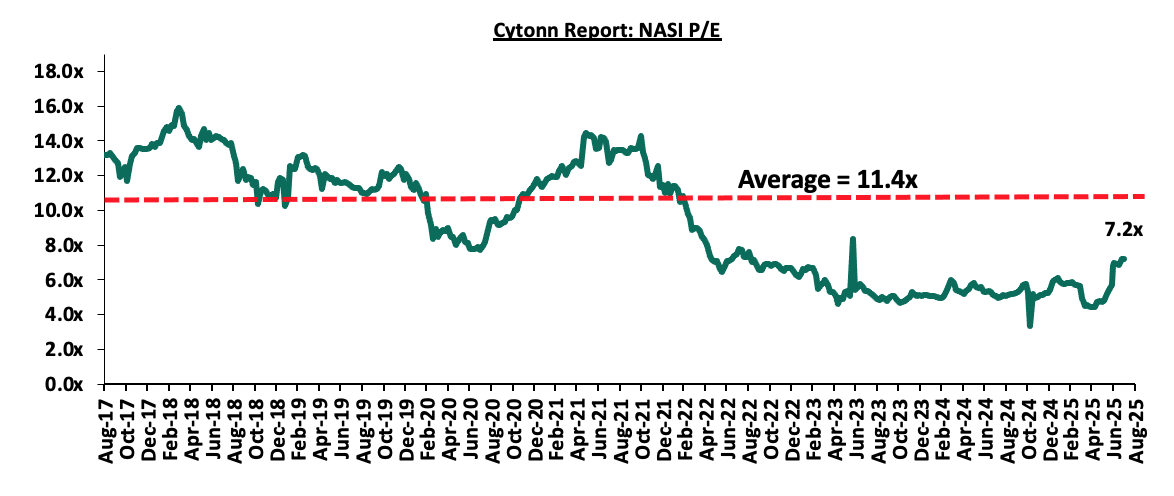
The market is currently trading at a price-to-earnings ratio (P/E) of 7.2x, 36.9% below the historical average of 11.4x but up 42.1% over the last 12 months. The dividend yield stands at 6.3%, 1.6% points above the historical average of 4.7%. Key to note, NASI’s PEG ratio currently stands at 0.9x, an indication that the market is undervalued relative to its future growth. A PEG ratio greater than 1.0x indicates the market is overvalued while a PEG ratio less than 1.0x indicates that the market is undervalued. The charts below indicate the historical P/E and dividend yields of the market;
Universe of Coverage:
|
|
|
Cytonn Report: Equities Universe of Coverage |
||||||||||||
|
Company |
Price as at 25/07/2025 |
Price as at 31/07/2025 |
Price as at 01/08/2025 |
w/w change |
m/m change |
YTD Change |
Year Open 2025 |
Target Price* |
Dividend Yield |
Upside/ Downside** |
P/TBv Multiple |
Recommendation |
||
|
Diamond Trust Bank |
77.0 |
79.5 |
76.5 |
(0.6%) |
(1.0%) |
14.6% |
66.8 |
90.4 |
9.2% |
27.3% |
0.3x |
Buy |
||
|
Equity Group |
50.5 |
50.5 |
50.5 |
0.0% |
3.3% |
5.2% |
48.0 |
58.0 |
8.4% |
23.3% |
0.9x |
Buy |
||
|
Co-op Bank |
16.7 |
17.0 |
16.7 |
0.3% |
(6.7%) |
(4.3%) |
17.5 |
18.9 |
9.0% |
22.3% |
0.6x |
Buy |
||
|
CIC Group |
3.4 |
3.4 |
3.4 |
1.5% |
14.4% |
59.3% |
2.1 |
4.0 |
3.8% |
22.0% |
0.9x |
Buy |
||
|
KCB Group |
47.5 |
47.4 |
47.3 |
(0.4%) |
1.5% |
11.6% |
42.4 |
53.7 |
6.3% |
19.9% |
0.6x |
Accumulate |
||
|
Standard Chartered Bank |
309.0 |
316.3 |
315.0 |
1.9% |
5.1% |
10.4% |
285.3 |
328.8 |
14.3% |
18.7% |
1.8x |
Accumulate |
||
|
ABSA Bank |
19.5 |
19.5 |
19.5 |
0.0% |
1.6% |
3.4% |
18.9 |
21.0 |
9.0% |
16.7% |
1.3x |
Accumulate |
||
|
Stanbic Holdings |
176.8 |
177.5 |
178.5 |
1.0% |
8.5% |
27.7% |
139.8 |
185.8 |
11.6% |
15.7% |
1.1x |
Accumulate |
||
|
I&M Group |
36.9 |
36.7 |
36.9 |
(0.1%) |
3.1% |
2.4% |
36.0 |
39.0 |
8.1% |
14.0% |
0.6x |
Accumulate |
||
|
Britam |
8.8 |
8.5 |
8.5 |
(3.9%) |
5.0% |
45.4% |
5.8 |
9.5 |
0.0% |
12.5% |
0.8x |
Accumulate |
||
|
NCBA |
64.8 |
66.3 |
62.8 |
(3.1%) |
5.5% |
23.0% |
51.0 |
60.2 |
8.8% |
4.6% |
1.0x |
Lighten |
||
|
Jubilee Holdings |
231.8 |
244.0 |
267.0 |
15.2% |
18.7% |
52.8% |
174.8 |
260.4 |
5.1% |
2.6% |
0.4x |
Lighten |
||
|
|
|
*Target Price as per Cytonn Analyst estimates **Upside/ (Downside) is adjusted for Dividend Yield ***Dividend Yield is calculated using FY’2024 Dividends |
||||||||||||
Weekly Highlights
- East African Breweries Plc (EABL) FY’2025 Financial Performance
During the week, East African Breweries Plc (EABL) released their FY’2025 financial results for the year ending 30th June 2025, recording a 12.2% increase in the Profits After Tax (PAT) to Kshs 12.2 bn in FY’2025, from Kshs 10.9 bn in FY’2024. The increase was mainly attributable to the 27.9% decrease in finance costs to Kshs 5.9 bn from Kshs 8.1 bn in FY’2024, coupled with a 3.8% increase in net revenue to Kshs 128.8 bn from Kshs 124.1 bn in FY’2024 and the 108.0% increase in Forex income to 0.3 bn in FY’2025 from a Forex loss of Kshs 3.9 bn in FY’ 2024.The growth in PAT was, however, weighed down by the 17.7% increase in the operating costs to Kshs 29.2 bn in FY’ 2025, from Kshs 24.8 bn in FY’ 2024. The tables below show the breakdown of the company’s financial performance;
|
Cytonn Report: East Africa Breweries Plc (EABL) Summarized Income Statement |
|||
|
Income Statement |
FY'2024 |
FY'2025 |
Y/Y Change |
|
Kshs (bn) |
Kshs (bn) |
||
|
Net revenue |
124.1 |
128.8 |
3.8% |
|
Cost of Sales |
(70.5) |
(74.7) |
6.0% |
|
Gross Profit |
53.6 |
54.1 |
0.8% |
|
Operating Costs |
(24.8) |
(29.2) |
17.7% |
|
Operating Profit |
28.8 |
24.9 |
(13.7%) |
|
Forex losses/Gains |
(3.9) |
0.3 |
108.0% |
|
Net Finance Costs |
(8.1) |
(5.9) |
(27.9%) |
|
Profit Before Income Tax |
16.8 |
19.3 |
15.2% |
|
Income Tax Expenses |
(5.9) |
(7.1) |
20.6% |
|
Profit After Tax |
10.9 |
12.2 |
12.2% |
|
Earnings Per Share |
10.3 |
12.0 |
16.2% |
|
Dividend Per Share |
7.0 |
8.0 |
14.3% |
|
Dividend Yield |
4.5% |
3.8% |
(0.7%) |
|
Dividend Payout Ratio |
50.9% |
51.9% |
0.9% |
Source: East African Breweries Plc (EABL) FY’2025 financial statements
|
Cytonn Report: East Africa Breweries Plc (EABL) Summarized Balance Sheet |
|||
|
Balance Sheet |
FY'2024 |
FY'2025 |
Y/Y Change |
|
Kshs (bn) |
Kshs (bn) |
||
|
Current Assets |
41.6 |
48.7 |
17.0% |
|
Non-Current Assets |
82.7 |
82.4 |
(0.3%) |
|
Total Assets |
124.2 |
131.1 |
5.5% |
|
Short term borrowings |
6.4 |
5.4 |
(15.2%) |
|
Other Current Liabilities |
29.8 |
38.4 |
29.0% |
|
Total Current Liabilities |
36.1 |
43.8 |
21.2% |
|
Long term Borrowings |
43.3 |
36.9 |
(14.8%) |
|
Other Non-Current Liabilities |
8.1 |
8.1 |
0.5% |
|
Total Non-Current Liabilities |
51.4 |
45.0 |
(12.4%) |
|
Total Liabilities |
87.5 |
88.8 |
1.5% |
|
Total Equity |
36.7 |
42.3 |
15.1% |
Source: East African Breweries Plc (EABL) FY’2025 financial report
Key take outs from the financial performance include;
- Net revenue increased by 3.8% to Kshs 128.8 bn in FY’2025, from Kshs 124.1 bn recorded in FY’2024, mainly attributable to the increase in volume sold by 2.0, improved digital transformation such as business to consumer framework which has helped in boosting revenue levels by expanding their consumer base.
- Operating costs increased by 17.7% to Kshs 29.2 bn, from Kshs 24.8 bn attributable to factors such as external shocks, for instance, the US tariffs that were imposed on under the Trump administration and a surge in illicit and counterfeit goods and consumers are under pressure due to the rising cost of living
- Cost of sales increased by 6.0% to Kshs 74.7 bn, from Kshs 70.5 bn in FY’2024, mainly attributable to increased cost of inputs occasioned by attributable to factors such as rising raw material costs and supply chain disruptions.
- The 108.0% increase in Forex income to 0.3 bn in FY’ 2025 from (3.9) bn in FY’ 2024 can be attributed to an appreciation of the regional currencies against the dollar. For instance, the Kenyan shilling and Uganda Shilling and gained by 0.2% and 3.0%, respectively against the US Dollar for the period under review.
- The Group’s balance sheet recorded an expansion, with the total assets increasing by 5.5% to Kshs 131.1 bn in FY’2025 from Kshs 124.2 bn recorded in FY’2024 mainly attributable to a 17.0% increase in current assets to Kshs 48.7 bn in FY’2025 from Kshs 41.6 bn in FY’2024.
- In addition, total liabilities recorded a 1.5% increase to Kshs 88.8 bn in FY’2025 from Kshs 87.5 bn in FY’2024, mainly driven by a 21.2% increase in total current liabilities to Kshs 43.8 bn in FY’2025 from Kshs 36.1 bn in FY’2024, but was, however, weighed down by decrease in short term borrowings and long-term borrowings by 15.2% and 14.8% respectively.
- The Group’s short-term borrowing decreased by 15.2% to Kshs 5.4 bn in FY’2025 from Kshs 6.4 bn in FY’2024, while the long-term borrowings decreased by 14.8% to Kshs 36.9 bn, from the Kshs 43.3 bn in FY’2024 an indication of the group’s strategic shift in its debt financing.
- Earnings per share increased by 16.2% to Kshs 12.0, from Kshs 10.3 in FY’2024, largely driven by a 12.2% increase in profit after tax to Kshs 12.2 bn, from Kshs 10.9 bn in FY’2024.
- Additionally, the Board of Directors recommends a final dividend of Kshs 5.5 per share with a book closure of 16th September 2025 and a payment date on or about 28th October 2025, adding on to the interim dividend of Kshs 2.5 per share in H1’2025, bringing the total dividend for FY’2025 to Kshs 8.00 per share This translates to a dividend yield of 3.8% as of 30th June 2025, compared to a dividend yield of 4.5% in FY’2024 and a dividend payout ratio of 51.9% in FY’2025 compared to 50.9% in FY’2024.
Following the improvement in macroeconomic environment arising from an ease in inflationary pressures and a stable and stronger currency, EABL has experienced an improvement in financial performance as evidenced by the increase in profitability by 12.2% as well as the 16.2% growth in earnings per share in FY’2025. Key to note, EABL realized a significant 108.0% increase in foreign exchange gains owing to the appreciation of the local currencies in the Group’s region of operation. For instance, the Kenyan shilling and Uganda Shilling gained by 0.2% and 3.0%, respectively against the US Dollar for the period under review. In our view, the Group’s earnings will be supported by the group’s continued diversification efforts as well as the efforts from the government to mitigate the impact of unregulated alcohol trade as illicit trade continues to grow. Moreover, the Group’s announcement of a final dividend of Kshs 5.50 per share for the period ending 30th June 2025 is expected to boost investors’ confidence in the Group’s stock
- NSE Highlights
- NSE Reclassifies Market Segments
Following the implementation of the Capital Markets (Public Offers, Listing and Disclosure) Regulations, 2023, the Nairobi Securities Exchange (NSE) has officially restructured its market segmentation framework after receiving formal approval from the Capital Markets Authority (CMA).
The reclassification marks a significant regulatory milestone aimed at simplifying issuer obligations, enhancing investor clarity, and aligning the Exchange with international standards for capital markets structure. The table below show the reorganization under the new structure.
|
Old Structure |
New structure |
|
Main Investment Market Segment (MIMS) |
Retained and expanded to cover both equities and bonds |
|
Growth Enterprise Market Segment (GEMS) |
Merged into SME Market Segment |
|
Alternative Investment Market Segment (AIMS) |
Merged into SME Market Segment |
|
Fixed Income Securities Market Segment (FISMS) |
Integrated into either MIMS or SME FISMS based on issuer profile |
The reclassified framework now comprises:
- Main Investment Market Segment (MIMS) – For established entities (both equity and fixed income)
- SME Market Segment – For small and medium-sized issuers, including equity and debt instruments
This restructuring is intended to:
- Streamline listing procedures by eliminating outdated or redundant market categories
- Improve issuer visibility through a simplified two-tier structure
- Enhance investor understanding of the risks and profiles associated with listed firms
- Encourage SME listings through a more inclusive and supportive regulatory framework
- Align Kenya’s capital markets with best practice standards, increasing regional and global competitiveness
The tables below show the market overview following the segment reclassification
Equities Market
|
Segment |
Number of Issuers |
Notable Constituents |
|
MIMS |
57 |
Safaricom, Equity Group, EABL, KCB, BAT, Bamburi, EAPC |
|
SME |
9 |
Homeboyz Entertainment, Nairobi Business Ventures, Kurwitu Ventures |
Fixed Income Market
|
Segment |
Number of Issuers |
Instruments |
|
MIMS (Bonds) |
4 |
Family Bank MTN, EABL MTN, KMRC MTN, Linzi 003 IABS |
|
SME FISMS |
1 |
Real People Kenya MTN |
Key Observations
- EAPC remains classified under MIMS – Construction & Allied, reinforcing its profile as a strategic industrial counter despite recent restructuring efforts.
- Safaricom Plc, Kenya’s largest listed firm by market cap, continues to anchor the MIMS under the Telecommunication sector.
- The SME segment remains relatively shallow, with only 9 equity issuers and 1 fixed income issuer, highlighting an opportunity for targeted market development initiatives.
The streamlined classification framework is expected to bolster capital formation, particularly for SMEs, by reducing listing friction and providing clearer pathways to market access. For investors, the reclassification enhances transparency, simplifies risk profiling, and improves comparability of listed entities.
- Kalahari Cement Limited to Acquire Strategic Stake in East African Portland Cement Plc
On 31st July 2025, Kalahari Cement Limited (Kalahari or the Offeror), a Kenyan investment vehicle backed by Pacific Cement Limited and Comercio Et Consiel Limited, issued a formal notice of intention to acquire a controlling stake in East African Portland Cement Plc (EAPC), a publicly listed cement manufacturer on the Nairobi Securities Exchange (NSE). The transaction is structured as a direct acquisition of shares from two existing foreign shareholders:
- 13.1 mn shares from Associated International Cement Limited (AIC)
- 13.2mn shares from Cementia Holding AG (Cementia)
The combined acquisition of 26.3 mn shares represents 29.2% of EAPC’s issued share capital, and will give Kalahari effective control of the company. The proposed consideration is Kshs 27.30 per share, to be settled in USD. Kalahari has applied for an exemption from making a mandatory take-over offer to the remaining shareholders, pursuant to Regulation 5 of the Capital Markets (Take-Overs & Mergers) Regulations, 2002. The exemption is sought on grounds that the deal constitutes a strategic investment intended to support EAPC’s turnaround and long-term sustainability. Notably, Kalahari has no intention to delist EAPC from the NSE post-transaction.
The acquisition of a controlling stake in East African Portland Cement Plc (EAPC) represents a strategic move by Kalahari Cement Limited, a non-operating holding company established to manage and consolidate investments in the regional cement and infrastructure sectors. Backed by Pacific Cement Limited and Comercio Et Consiel Limited, both linked to the broader Amsons Group, Kalahari’s entry into EAPC is intended to bring long-term capital, governance oversight, and strategic direction without direct operational involvement. The investment aligns with Kalahari’s broader mandate of acquiring and stewarding critical industrial assets in East and Southern Africa through a portfolio-driven approach.
For EAPC, the transaction signals the arrival of a committed institutional shareholder with the resources and strategic interest to support its turnaround and future growth. While day-to-day operations will remain with management, EAPC stands to benefit from Kalahari’s affiliations with operating entities such as Bamburi Cement Plc, enabling access to technical support, regional market insights, and supply chain efficiencies. The investment underscores confidence in Kenya’s cement industry and reflects a long-term vision of regional consolidation, value unlocking, and industrial resilience.
Key Conditions Precedent The transaction is subject to:
- Approval by the Competition Authority of Kenya
- Approval from the Capital Markets Authority (CMA) for exemption and block/private trade
- Approval by the Ministry of Mining for the change in control under the Mining Act
- A potential shareholder circular if required by the CMA
- Financing guarantees if any portion of the consideration is not paid upfront in cash
|
Cytonn Report: EAPC Shareholding (Post-Transaction Snapshot) |
|
|
Shareholder |
Approximate Stake |
|
Kalahari (Post Acquisition) |
29.2% |
|
Bamburi Cement Plc |
12.5% |
|
National Treasury |
25.3% |
|
NSSF |
27.0% |
|
Others |
6.0% |
If approved, the transaction would mark one of the most significant strategic investments into a listed manufacturing company in recent years, reinforcing confidence in Kenya’s capital markets and supporting ongoing reforms aimed at improving corporate governance and investor protection in publicly listed entities.
Monthly Highlights
- During the month, Centum Investments Company PLC released their FY’2025 financial results for the period ending 31st March 2025, recording a 68.8% decrease in the Profits After Tax (PAT) to Kshs 0.8 bn in FY’2025, from Kshs 2.6 bn in FY’2024. The decrease was mainly attributable to a 97.0% decrease in profit from their Two Rivers Special Economic Zone business to Kshs 0.1 bn, from Kshs 2.9 bn in FY’2024. For more information, please see our Cytonn Weekly #29/2025.
- During the month, British American Tobacco Kenya Plc released their H1’2025 financial results, recording a 39.7% increase in Profits after Tax (PAT) to Kshs 3.0 bn, from Kshs 2.1 bn recorded in H1’2024. The increase in PAT was mainly attributed to the 5.5% decrease in the cost of sales to Kshs 7.5 bn in H1’2025, from Kshs 7.9 bn recorded in H1’2024, as well as the 113.5% decrease in the finance cost to a finance income of Kshs 0.1 bn, from a finance cost of Kshs 0.7 bn in H1’2024, which outweighed the 5.9% decrease in the gross sales to Kshs 18.5 bn from Kshs 19.6 bn. For more information, please see our Cytonn Weekly #30/2025.
- During the month, Shri Krishana Overseas Limited (SKL), a packaging solutions provider, was officially listed on the Nairobi Securities Exchange (NSE) on 24th July 2025. This marked the first listing on the NSE in five years, with the last listing being Homeboyz Entertainment Plc in 2020. Earlier, on 16th July 2025, the Satrix MSCI World Feeder ETF was also listed on the NSE, bringing the total number of Exchange Traded Funds (ETFs) on the exchange to two. The Satrix ETF joins the previously listed Absa New Gold ETF, expanding the range of ETF investment options available to local investors. Also, during the week Linzi Finco LLP, a subsidiary of Liaison Group listed the Linzi 003 Infrastructure Asset-Backed Security (IABS) on the NSE, valued at Kshs. 44.9 bn. For more information, please see our Cytonn Weekly #30/2025.
We are “Bullish” on the Equities markets in the short term due to current cheap valuations, lower yields on short-term government papers and expected global and local economic recovery, and, “Neutral” in the long term due to persistent foreign investor outflows. With the market currently trading at a discount to its future growth (PEG Ratio at 0.9x), we believe that investors should reposition towards value stocks with strong earnings growth and that are trading at discounts to their intrinsic value. We expect the current high foreign investors sell-offs to continue weighing down the economic outlook in the short term.
- Industry Report
- May Leading Economic Indicators (LEI)
During the week, the Kenya National Bureau of Statistics (KNBS) released the Leading Economic Indicators (LEI) May 2025 Report, which highlighted the performance of major economic indicators. Key highlights related to the Real Estate sector include:
- In May 2025, the number of international visitor arrivals through Jomo Kenyatta International Airport (JKIA) and Moi International Airport (MIA) was 171,269, reflecting an 1.2% increase from the 169,230 arrivals recorded in April 2025. On a year-on-year basis, May 2025 arrivals represent a 45.6% increase compared to 117,639 in May 2024, indicating a continued rebound in tourism activity. The growth is driven by (i) Increased air connectivity as Kenya’s international air links have significantly improved with the addition of new direct flights from Mumbai to Nairobi, Dubai and Mombasa; and Johannesburg to Nairobi which has expanded Kenya’s access from key destination, (ii) Tourism diversification with Kenya making efforts to diversify its tourism offerings beyond traditional wildlife safaris. The country is increasingly marketing niche experiences such as cruise, cultural tourism showcasing rich local heritage, adventure tourism including hiking and sports tourism with events like the World Rally Championship and international marathons drawing global attention, (iii) Aggressive marketing campaigns as The Ministry of Tourism and the Kenya Tourism Board (KTB) have ramped up global promotional efforts under the “Magical Kenya” brand. These campaigns utilize digital platforms, international travel expos, and influencer collaborations to reach wider audiences increasing visitor arrivals, (iv) Policy reforms and improved visa access, Kenya adopted a visa free entry regime which has simplified the entry process and enhanced the travel experience.
The chart below shows the number of international arrivals in Kenya between Q1 2023 and May 2025.
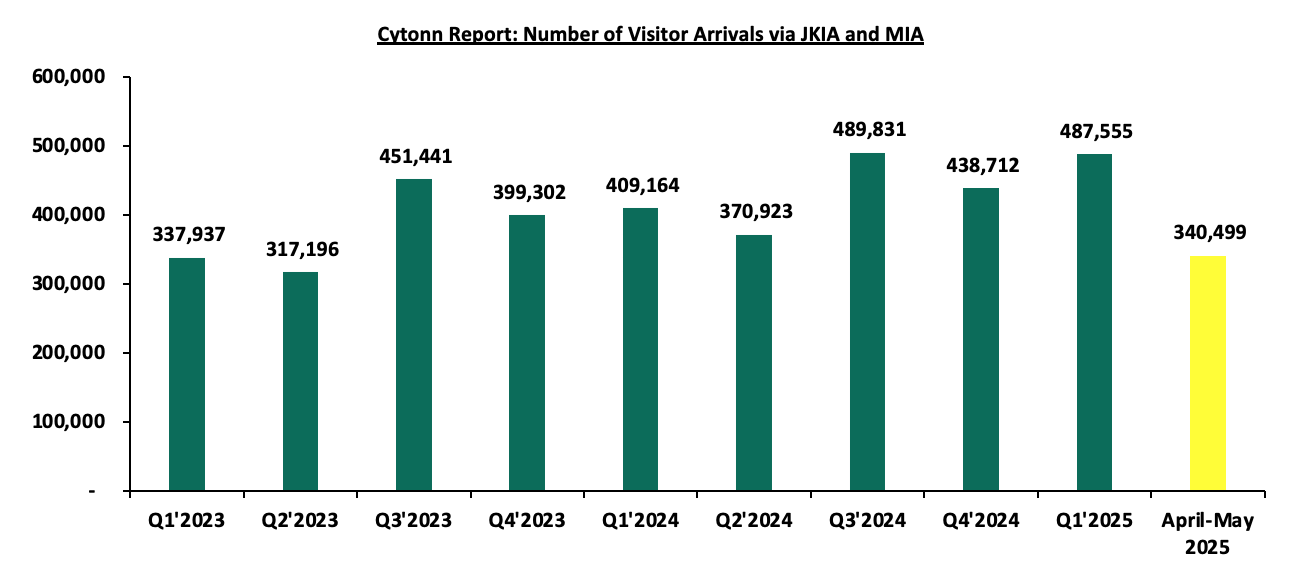
Source: Kenya National Bureau of Statistics (KNBS)
- The consumption of cement increased by 4.8% to 829,570 metric tonnes in May 2025, from 791,572 metric tonnes in April 2025. On a year-on-year basis, cement consumption in May 2025 increased by 31.1% to 829,570 metric tonnes in May 2025, from 632,906 metric tonnes recorded in May 2024. This significant growth reflects a broader resurgence in the construction sector, driven by, (i)A surge in domestic construction and infrastructure development as Increased private sector investments in residential, commercial, and mixed-use developments have spurred higher cement usage, particularly in urban growth zones like Nairobi, Mombasa, and Kisumu,(ii) Expanded government-led infrastructure programs that saw the government's continued investment in flagship infrastructure projects such as roads, affordable housing, water and sanitation systems, and public buildings under the Bottom-Up Economic Transformation Agenda (BETA) has sustained cement demand, (iii) Strategic public sector focus on stimulating local economic activity as Cement consumption growth is also fueled by employment-intensive public works projects aimed at improving livelihoods, especially in rural and semi-urban areas. These initiatives are designed to provide jobs while upgrading critical infrastructure.
The chart below shows cement consumption in metric tonnes in Kenya between Q1 2023 and May 2025.
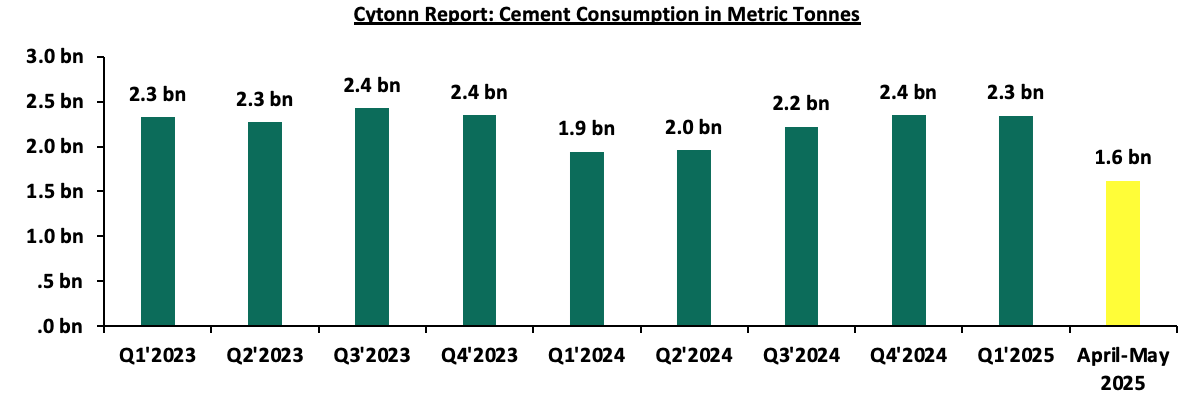
Source: Kenya National Bureau of Statistics (KNBS)
- Building plans approved decreased by 26.4% to 7.5 bn in May 2025, from 10.2 bn in April 2025. Similarly , On a year-on-year basis, building plans approved in May 2025 decreased by 62.6% to 7.5 bn in May 2025, from 20.1 bn recorded in May 2024. This decline reflects a slowdown in development activity, driven by several factors: (i) a cautious investment climate in the real estate sector amid rising construction costs, which has led many developers to delay or scale down planned projects. For instance, construction costs of luxurious office blocks in the Nairobi Metropolitan Area grew by 11.0% ; (ii) delays in project approvals due to longer turnaround times by planning authorities, often linked to increased scrutiny or procedural reforms; and (iv) a shift in market focus, where developers are prioritizing completion of ongoing projects over initiating new ones, in response to subdued demand and oversupply in some property segments such as commercial office space.
The chart below shows the building plans approved in billions in Kenya between Q1’2023 and May 2025.
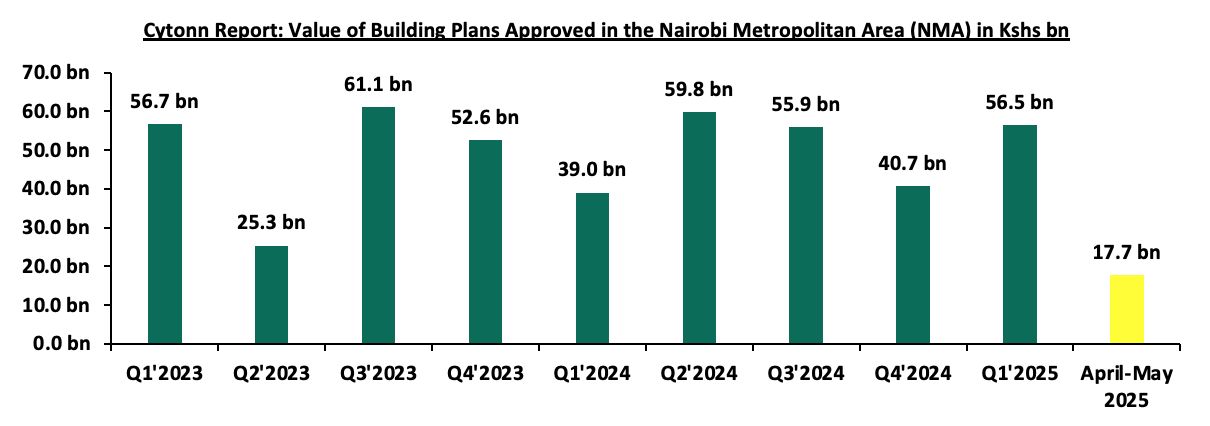
Source: Kenya National Bureau of Statistics (KNBS)
During the month, the below industry reports were also released;
|
Cytonn Report: Notable Industry Reports During the Month of July 2025 |
|||
|
# |
Theme |
Report |
Key Take-outs |
|
1. |
Hass Consult property Index |
Hass Consult released its Property Index Q1’2025 Report |
· The average selling prices for all properties posted a 3.8% increase on a quarter-on-quarter (q/q) basis in Q2’2025, 1.3% points increase up from 2.5% recorded in Q1’2025. On a year-on-year (y/y) basis, property prices recorded a robust 7.8% growth, a 2.9% increase up from 4.9% in Q2’2024. · The average asking rents of housing units in the Nairobi Metropolitan Area during Q2’2025 contracted by 0.2% quarter‑on‑quarter basis, a reversal from the 0.3% increase seen in Q1’2025. · Apartments recorded a 2.4% quarter-on-quarter increase in rents in Q2’2025, while semi-detached units declined by 0.4%, and detached units fell by 1.6%. · For more information, please see our Cytonn Weekly #30/2025
|
|
2 |
Hass Consult Land Price Index |
Hass Consult released Land Price Index Q2’2025 Report |
· In Q2’2025, the average quarter-on-quarter selling prices for land in Nairobi suburbs increased by 1.7%, maintaining the same pace as Q1’2025, indicating a stable trend. On a year-on-year basis, land prices in the suburbs appreciated by 6.9%, a marginal improvement from 6.5% recorded previously. · For more information, please see our Cytonn Weekly #30/2025 |
- Residential Sector
There was one notable highlight during the month
- During the month, Knight Frank released its annual report titled Africa Horizons 2025/26, where according to the report 15% of Nairobi’s housing units have shifted to short-term rentals, driving a 10% rent increase over two years as Nairobi residents are now competing with this new demand. Policymakers and various stakeholders face a daunting task of harnessing economic benefits of short-term rentals without worsening the housing crisis. This growth provides property owners with new income streams and travelers with flexible options. However, it also sparks concerns regarding affordability. For more information, please see our Cytonn Weekly #28/2025
We expect that the residential sector will continue to post a positive performance mainly on the back of (i) increased investment from local and international investors in the housing sector, (ii) favorable demographics in the country, shown by high population and urbanization rates of 3.7% p.a and 2.0% p.a, respectively, leading to higher demand for housing units. However, challenges such as rising construction costs, strain on infrastructure development, and limited access to financing will continue to restrict the optimal performance of the residential sector.
- Hospitality Sector
There was one notable highlight during the month;
- During the month, the National carrier, Kenya Airways, made efforts to enhance its flight capacity through a two-pronged strategy, that is, restoring grounded Boeing 787 Dreamliners and acquiring new narrow body aircrafts. This move promises to enhance the airline’s network and improve connectivity across Africa, which will create new opportunities for travel agents. For more information, please see our Cytonn Weekly #29/2025
We expect that tourism growth will continue to support this upcountry expansion, with international arrivals rising by over 45.6% in the past year. However, the success of this trend will depend on continued infrastructure improvements, such as roads, power, and water supply, which remain inconsistent in many rural regions. While developers are capitalizing on the promise of new markets, the shift is also partially influenced by challenges in Nairobi, including financial constraints, high loan default rates, and a rise in property auctions. Some developers may see upcountry locations as a strategic move to reduce exposure to the economic pressures affecting the capital. This ongoing redistribution of hospitality investment presents both opportunities for regional development and challenges that must be addressed to ensure long-term sustainability.
- Infrastructure Sector
There were five notable highlights during the month;
- During the month, the Kenya Airports Authority (KAA) announced plans to modernize Wilson Airport’s infrastructure, with particular focus on rehabilitating the runways and enhancing safety. KAA called for public participation through a Strategic Environmental and Social Assessment (SESA) in line with legal environmental obligations. The motivation behind this initiative stems from increasing safety threats posed by uncontrolled development and illegal structures within the airport's flight paths, especially in surrounding areas like Lang’ata and South C. KAA plans to hold three public forums to gather views from residents and stakeholders, a move signaling greater transparency and engagement. For more information, please see our Cytonn Weekly #30/2025
- During the month, Linzi Finco LLP, an affiliate of the Liaison Group made headlines with the Kshs 44.9 bn listing of the Linzi 003 Infrastructure Asset-Backed Security (IABS) on the Nairobi Securities Exchange (NSE). This milestone represents not only one of the largest securitization transactions in East Africa, but also a strategic breakthrough in how Kenya finances large-scale infrastructure. The transaction was strongly endorsed by President William Ruto, who termed it a prime example of financing innovation through public-private partnerships. For more information, please see our Cytonn Weekly #30/2025
- During the month, the Kenya National Highways Authority has invited prequalification bids from Chinese contractors for the expansion of the Pangani-Muthaiga-Kiambu-Ndumberi Road, following a financing deal from China’s Export-Import Bank. The project aims to upgrade the B32 corridor, which stretches from Muthaiga through Kiambu to Ndumberi from a two-lane single carriageway to a four-lane dual carriageway with service lanes and pedestrian pathways. The project is estimated to cost KES 35.0 bn which incorporates KES 7.0 bn for land acquisition and relocation services. For more information, please see our Cytonn Weekly #29/2025
- During the month, the government expressed its plan to upgrade and improve the Jomo Kenyatta International Airport (JKIA) before the end of the year. This comes after President William Ruto announced the cancellation of the Adani airport deal due to widespread public outcry and concern after controversial clauses in the contract, which had been shrouded in secrecy were discovered in the contract. The plan to upgrade and improve the JKIA is on course, 229 days since President William Ruto announced the cancellation of the Adani airport deal. Roads and Transport Cabinet Secretary, Davis Chirchir, says that the government intends to break ground before the end of the calendar year, 2025. For more information, please see our Cytonn Weekly #28/2025.
- During the month, Roads and Transport Cabinet Secretary, Davis Chirchir, confirmed that the Narok Airport project has officially taken off, with construction already underway. The development is jointly funded by the national and county governments at a cost of Kshs 1.4 bn. It is aimed at improving air connectivity to Narok County and the greater Maasai Mara region, one of Kenya’s key tourism and conservation zones. This infrastructure push is expected to open up the area to increased economic activity, particularly in the tourism, transport, and property sectors. The project stands in sharp contrast to the stalled Kericho Airport upgrade, which has been halted due to procurement irregularities and is currently inactive. For more information, please see our Cytonn Weekly #28/2025
We expect that the infrastructure sector will continue to register strong performance, mainly supported by (i) sustained government investment in flagship projects under the Bottom-Up Economic Transformation Agenda (BETA), including roads, airports, and affordable housing-linked infrastructure, (ii) increased participation by development partners and private investors through public-private partnerships (PPPs), as demonstrated by recent landmark transactions such as the Kshs 44.9 bn Linzi 003 IABS listing, and (iii) strategic focus on improving connectivity through airport upgrades. However, the sector still faces downside risks from challenges such as procurement bottlenecks, delayed disbursements, and land acquisition hurdles, which may slow down project implementation and inflate costs.
- Real Estate Investments Trusts (REITs)
- REITS performance H1’2025
- Acorn D-REIT AND I-REIT Financial performance H1’2025
- REITS performance H1’2025
Acorn Holdings released their H1’2025 financial results for the Acorn D-REIT and I-REIT, which invests in purpose-built student accommodation (PBSA). The Development Real Estate Investment Trust (D-REIT) finances the development of Purpose-Built Student Accommodation (PBSA) housing projects and later exit the projects to the Investment Real Estate Investment Trust (I-REIT) through legally bidding acquisition agreement. Rental incomes and other sources of income play a significant role in driving the investments and operations of the REITs.
Below is a summary of the Acorn’s I-REIT and D-REIT H1’2025 performances:
|
Cytonn Report: Income Statement |
||||||
|
|
Acorn I-REIT |
Acorn D-REIT |
||||
|
H1'2024 |
H1’2025 |
Change |
H1’2024 |
H1’2025 |
Change |
|
|
Rental Income |
534.2 |
524.1 |
(1.9%) |
53.1 |
157.9 |
197.6% |
|
Income from Other Sources |
0.3 |
0.3 |
(5.0%) |
0.0 |
0.0 |
|
|
Total operating income |
545.6 |
524.4 |
(3.9%) |
424.8 |
805.5 |
89.6% |
|
Operating Expenses |
243.3 |
231.4 |
(4.9%) |
153.6 |
238.6 |
55.4% |
|
Finance costs |
(194.9) |
(202.7) |
4.0% |
(0.1) |
(0.4) |
367.1% |
|
Profit Before Tax |
164.1 |
251.6 |
53.4% |
181.4 |
205.0 |
13.0% |
|
Basic EPS (Kshs) |
0.5 |
0.7 |
38.2% |
0.7 |
0.7 |
6.8% |
|
Cytonn Report: Balance Sheet |
||||||
|
|
Acorn I-REIT |
Acorn D-REIT |
||||
|
H1'2024 |
H1'2025 |
Change |
H1'2024 |
H1'2025 |
Change |
|
|
Total Assets |
10.6 |
11.3 |
7.3% |
13.4 |
16.1 |
33.7% |
|
Total Equity |
7.4 |
8.6 |
15.9% |
6.7 |
7.7 |
11.9% |
|
Total Liabilities |
3.1 |
2.7 |
(13.0%) |
5.8 |
8.4 |
62.8% |
|
Cytonn Report: Ratios Summary |
||||||
|
|
Acorn I-REIT |
Acorn D-REIT |
||||
|
H1'2024 |
H1'2025 |
Change |
H1'2024 |
H1'2025 |
Change |
|
|
ROA |
1.6% |
2.2% |
0.7% |
1.4% |
1.3% |
(0.1%) |
|
ROE |
2.2% |
2.9% |
0.7% |
2.7% |
2.7% |
0.0% |
|
Debt Ratio |
29.6% |
24.0% |
(5.6%) |
43.3% |
52.1% |
8.8% |
|
PBT Margin |
30.7% |
48.0% |
17.3% |
42.7% |
25.5% |
(17.3%) |
|
Annualized Rental Yield |
10.6% |
4.9% |
(5.7%) |
0.5% |
1.3% |
0.8% |
|
Distribution Per Unit |
9.9% |
7.4% |
(2.5%) |
46.3% |
104.0% |
57.7% |
|
Payout Ratio |
19.9% |
10.8% |
(9.1%) |
68.0% |
72.7% |
4.7% |
Acorn I-REIT
Income Statement:
- The basic earnings per unit increased by 38.2% to Kshs 0.7 in H1’2025, from Kshs 0.5 recorded in H1’2024. This was mainly driven by a 53.4% increase in profit to Kshs 251.6 mn recorded in H1’2025, from Kshs 164.1 mn that was recorded in H1’ 2024, linked to a 4.9% decrease in operating expenses coming in at Kshs 231.4 mn from 243.3 mn in H1’2024
- The I-REIT recorded a 1.9% decrease in rental income coming in at Kshs 524.1 mn from Kshs 534.2 mn in H1’2024. The performance was attributed to the decrease in residential rental income by 2.0% to 516.4 mn in H1’ 2025 from 527.1 mn in H1’ 2024;
- The REIT’s total operating expenses decreased by 4.9% to Kshs 231.4 mn from Kshs 243.3 mn in H1’ 2024. This performance was attributable to a 5.4 % decrease in administrative expenses which reduced to Kshs 178.5 mn in H1’2025 from Kshs 188.6 mn in H1’2024. However, this movement was mitigated by impairment gain on financial assets coming in at Kshs 3.3 mn in H1’2025 from an impairment loss of (4.8) bn in H1’ 2024, and,
- The current rental yield for the I-REIT decreased by 0.6% points to 10.0% in H1’ 2025, from 10.6% in H1’2024 following a decrease in the rental income which was due to the decrease in residential rental income by 2.0% to 516.4 mn in H1’ 2025 from 527.1 mn in H1’ 2024;
Balance Sheet:
- Total assets for the I-REIT increased by 7.3% to Kshs 11.3 bn in H1’2025 from Kshs 10.6 bn in H1’2024. This was mainly on the back of a 4.1% increase in investment property during the period, coming in at Kshs 10.7 bn from Kshs 10.3 bn in H1’2024. This was as a result of increase in fair value of investment property to Kshs 151.7 mn in H1’ 2025 from Kshs 49.1 mn in H1’ 2024,
- Total liabilities decreased by 13.0% to Kshs 2.7 bn in H1’ 2025, from Kshs 3.1 bn in H1’ 2024 as a result of a decrease in short term borrowings. During the period under review, short-term borrowings decreased by 5.2% to Kshs 2.4 bn from Kshs 2.6 bn in H1’ 2024. Moreover, the REIT registered payables amounting to Kshs 267.7 mn in H1’ 2025 which further contributed to the decrease in liabilities,
- The shareholder’s funds for I-REIT increased by 15.9% to Kshs 8.6 bn in H1’ 2025, from Kshs 7.4 bn in H1’ 2024. The I-REIT’s equity increase was as a result of; i) an increase in revaluation reserve at the end of the period by 60.6% to Kshs 1,093.8 mn in H1’ 2025 from 681.2 mn in H1’ 2024 and, ii) increase trust capital by 11.8% to Kshs 7.3 bn from 6.6 bn, and,
- The I-REIT’s Return on Assets (ROA) increased by 0.7 % point to 2.2% in H1’ 2025 from 1.6% in H1’ 2024, Return on Equity (ROE) increased by 0.7% points in H1’2025 to 2.9%, from 2.2% in H1’ 2024. This was attributable to a 53.4% increase in profit to Kshs 251.6 mn recorded in H1’ 2025, from Kshs 164.1 mn that was recorded in H1’2024
Acorn D-REIT
Income Statement:
- The basic earnings per unit for the REIT remained unchanged at Kshs 0.7 in H1’ 2024. This was mainly driven by a 13.0% increase in total profit to Kshs 205.0 mn in H1’2025 from Kshs 181.4 mn in H1’2024.
- Acorn D-REIT posted a 197.6% increase in rental income to Kshs 157.9 mn in H1’ 2025 from Kshs 53.1 mn in H1’ 2024. This can be attributed to increase in residential income by 99.2% to 155.7 mn in H1’ 2025 from 52.0 mn in H1’ 2025 due to the opening of the Kenyatta University (KU) properties which added on to the revenue to the existing Karen and Chiromo properties.
- The total operating expenses for the D-REIT increased by 55.4% to Kshs 238.6 mn in H1’ 2025 from Kshs 153.6 mn in H1’ 2024, mainly driven by a 92.4% increase in administrative expenses to Kshs 90.9 mn in H1’ 2025 from Kshs 47.2 mn in H1’ 2024, and,
- The current rental yield for the D-REIT increased by 0.8% points to 1.3% in H1’ 2025 from 0.5% recorded in H1’ 2024. This can be attributed to a 197.6% increase in rental income to Kshs 157.9 mn in H1’ 2025 from Kshs 53.1 mn in H1’ 2024.
Balance Sheet:
- Total assets for the D-REIT increased by 20.3% to Kshs 16.1 bn in H1’ 2025, from Kshs 13.4 bn in H1’ 2024. The increase in assets was mainly backed by an increase in cash and cash equivalent which increased by 14.3% to Kshs 250.8 mn in H1’ 2025 from Kshs 219.5 mn in H1’ 2024.
- Total liabilities for the D-REIT increased by 44.8% to Kshs 8.4 bn in H1’2025, from Kshs 5.8 bn in H1’ 2024, mainly driven by; i) 55.4% increase in borrowings which came in at Kshs 4.8 bn in H1’ 2025, from Kshs 1.8 bn in H1’2024, and ii) 15.0% increase in trade and other payables to Kshs 1.2 bn in H1’ 2025, from Kshs 1.1 bn in H1’ 2024,
- The total equity for the D-REIT increased by 14.3% to Kshs 7.7 bn in H1’ 2025, from Kshs 6.8 bn in H1’ 2025. The increase was attributed to an increase in shareholders contribution by 7.3% to Kshs 5.9 bn in H1’ 2025, from Kshs 5.5 bn in H1’ 2024.
- The D-REIT recorded 6.1%-point decrease in ROA to 1.3% in H1’2025 from 1.4% in H1’2024. This is attributable to slightly lower returns on assets in H1’2025 compared to H1’ 2024. The ROE recorded remained unchanged from 2.7% in H1’ 2024 which was mainly attributable to a 13.0% increase in total comprehensive profit to Kshs 205.0 mn in H1’2025 from Kshs 181.4 mn in H1’2024.
Looking ahead, Acorn Holdings is expected to sustain growth by leveraging its strong development pipeline and the increasing demand for affordable and quality student housing. For the I-REIT, efforts will likely focus on optimizing operational efficiency, improving occupancy rates, and stabilizing rental income, especially considering the recent decline in residential rental revenues. Meanwhile, the D-REIT is poised to benefit from its aggressive development strategy, with the surge in rental income indicating successful project handovers and improved monetization. However, rising finance and administrative costs will need close monitoring. Overall, the REITs’ improved profitability, balance sheet strength, and strategic focus on the student housing niche position them favorably to deliver long-term value to investors in Kenya’s evolving real estate landscape.
For a more comprehensive analysis, please see our Acorn I-REIT and D-REIT H1’’2025 Earnings Note.
- Laptrust Imara I-REIT Financial Performance H1’2025
Laptrust released the FY’2024 financial results for the Imara I-REIT for the period ended 30th June 2025. The I-REIT was authorized by the Capital Markets Authority (CMA) on 1st November 2022. Laptrust Imara I-REIT holds several properties across the country including; Pension towers, CPF House, Metro Park, Freedom Heights mall, Freedom Heights serviced plot, Man apartments, and Nova Pioneer in Eldoret.
Below is a summary of the Laptrust Imara I-REIT’s H1’2025 Performance.
|
Figures in Kshs bn unless stated otherwise |
|||
|
Balance Sheet |
H1'2024 |
H1’2025 |
H1’2025/H1'2024 Change |
|
Total Assets |
7.3 |
6.9 |
(5.27%) |
|
Total Equity |
6.9 |
6.4 |
(8.19%) |
|
Total Liabilities |
0.4 |
0.5 |
25.00% |
|
Figures in Kshs mn unless stated otherwise |
|||
|
Income Statement |
H1'2024 |
H1’2025 |
H1’2025/H1'2024 Change |
|
Rental Income |
198.3 |
247.2 |
24.63% |
|
Income from Other Sources |
73.8 |
57.9 |
(2.63%) |
|
Operating Expenses |
109.8 |
224.2 |
104.13% |
|
Profit/Loss |
162.4 |
80.9 |
(50.17%) |
|
Basic EPS (Kshs) |
0.5 |
0.2 |
(50.17%) |
|
Figures in Kshs mn unless stated otherwise |
|||
|
Ratios Summary |
H1'2024 |
H1’2025 |
FY’2024/FY'2023 Change |
|
ROA |
2.22% |
1.17% |
(1.05%) |
|
ROE |
2.34% |
1.27% |
(1.07%) |
|
Debt Ratio |
4.9% |
7.8% |
2.93% |
|
PBT Margin |
81.9% |
32.7% |
(49.13%) |
|
Rental Yield |
3.0% |
4.0% |
1.04% |
Income Statement:
- The basic earnings per unit came in at Kshs 0.2 in H1’2025, a 50.2% decline from Kshs 0.5 recorded in H1’2024. The performance was driven by a 50.2% decline in net earnings to a profit of Kshs 80.9 mn in H1’2025 from Kshs 162.4 mn recorded in H1’2024,
- Rental and related income for the REIT stood at Kshs 247.2 mn in H1’2025, a 24.6% increase from Kshs 198.3 mn in H1’2024, implying a gross annualized rental yield of 8.1% in H1’2025 on interest-earning assets, higher than the 3.0% rental yield recorded during H1’2024. This increase in rental income was driven by faster growth in rental rates than property prices supported by higher demand for rentals and delayed home ownership. The annual rental yield currently stands at 8.1%,
- Total operating expenses in H1’2025 for the REIT came in at Kshs 224.2 mn, 104.1% higher than the Kshs 109.8 mn recorded in H1’2024, attributed to Kshs 149.8 mn incurred in utility expenses, 39.7 mn in property expenses, and Kshs 34.7 mn in fund operating expenses.
Balance Sheet:
- Total assets for the REIT stood at Kshs 6.9 bn in H1’2025, a 5.3% decrease from Kshs 7.3 bn recorded in H1’2024, comprising of Kshs 6.2 bn in investment property that saw a 5.3% decrease from Kshs 6.7 bn in H1’2024 attributable to a Kshs 0.3 bn in cash and cash equivalents, and Kshs 0.3 bn in trade and other receivables,
- Total liabilities in H1’2025 came in at Kshs 0.5 bn, recording a 51.7% increase from Kshs 0.4 bn in H1’2024 wholly attributable to an increase in trade and other payables,
- The shareholder’s funds decreased by 8.2% to Kshs 6.4 bn from Kshs 6.9 bn in H1’2024, attributable to 6.9 bn in trust capital which recorded no change, and 200.6 mn in retained earnings
- The REIT currently has a Return on Asset and a Return on Equity of 1.2% and 1.3% respectively.
Going forward,
- We expect the three-year trading restriction period to be crucial for the I-REIT to establish a solid performance track record, thereby enhancing investor confidence in this asset class. However, at present, only high-net-worth individuals can invest in the I-REIT, as trading is limited to professional investors, excluding retail investors from participation.
III. ILAM Fahari I-REIT Financial Performance H1’2025
Below is a summary of the ILAM Fahari I-REIT’s H1’2025 Performance;
|
Values in Kshs bn unless stated otherwise |
|
|
|
|
|
|
|
|
|
Balance Sheet |
H1'2022 |
FY'2022 |
H1'2023 |
FY'2023 |
H1'2024 |
FY'2024 |
H1' 2025 |
∆ Y/Y (H1' 2025/H1'2024) |
|
Total Assets |
3.7 |
3.6 |
3.6 |
3.5 |
3.4 |
3.7 |
3.7 |
8.4% |
|
Total Equity |
3.5 |
3.4 |
3.4 |
3.3 |
3.2 |
3.6 |
3.6 |
10.3% |
|
Total Liabilities |
0.1 |
0.2 |
0.2 |
0.2 |
0.1 |
0.1 |
0.1 |
(34.3%) |
|
Values in Kshs bn unless stated otherwise |
|
|
|
|
|
|
|
|
|
Income Statement |
H1'2022 |
FY'2022 |
H1'2023 |
FY'2023 |
H1'2024 |
FY'2024 |
H1' 2025 |
∆ Y/Y (H1' 2025/H1'2024) |
|
Rental Income |
0.2 |
0.4 |
0.2 |
0.3 |
0.1 |
0.3 |
0.1 |
2.9% |
|
Income from Other Sources |
0.0 |
0.0 |
0.0 |
0.1 |
0.0 |
0.1 |
0.0 |
5.3% |
|
Operating Expenses |
0.1 |
0.2 |
0.1 |
0.2 |
0.1 |
0.2 |
0.1 |
(4.7%) |
|
Profit/Loss |
0.1 |
(0.03) |
0.1 |
(0.0003) |
0.1 |
0.4 |
0.1 |
19.5% |
|
Basic EPS |
0.5 |
(0.2) |
0.5 |
(0.002) |
0.3 |
2.1 |
0.4 |
19.5% |
|
Ratios Summary |
H1'2022 |
FY'2022 |
H1'2023 |
FY'2023 |
H1 2024 |
FY'2024 |
H1' 2025 |
∆ Y/Y (H1' 2025/H1'2024) |
|
ROA |
2.3% |
(0.8%) |
2.4% |
(0.01%) |
1.6% |
10.3% |
1.8% |
0.2% |
|
ROE |
2.4% |
(0.8%) |
2.5% |
(0.01%) |
1.7% |
10.6% |
1.8% |
0.1% |
|
Debt Ratio |
4.0% |
5.3% |
4.9% |
4.7% |
4.3% |
3.1% |
2.6% |
(1.7%) |
|
PBT Margin |
51.2% |
(8.4%) |
48.4% |
(0.1%) |
38.4% |
128.5% |
44.1% |
5.7% |
|
Annualized Rental Yield |
10.3% |
9.8% |
12.7% |
11.6% |
10.2% |
9.2% |
9.6% |
(0.7%) |
Income Statement:
- The basic earnings per unit increased by 19.5% to Kshs 0.4 in H1’2025 from Kshs 0.3 in H1’2024. The performance is attributed to an increase in ILAM Fahari’s comprehensive profit by 19.5% to Kshs 64.3 mn in H1’2025, from Kshs 53.8 mn recorded in H1’2024. This was mainly driven by a 143.0% Increase in straight lining of lease income of Kshs 3.1 mn realized in H1’2025 from Kshs 1.3 mn in H1’2024. Additionally, operating expenses declined by 4.7% to Kshs 104.7 mn in H1’2025 from Ksh 109.8 mn in H1’2024,
- Rental income increased by 2.9% to Kshs 142.8 mn in H1’2025, from Kshs 138.7 mn recorded in H1’ 2024, mainly due to increased occupancy at Greenspan Mall by 11.0% to 86.0% in H1’2025 from 75.0% H1’ 2024,
- Interest income increased by 5.3% to Kshs 26.2 mn in H1’2025, from Kshs 24.9 mn realized in the similar period in 2024, owing to the low interest rates experienced in the market during the year,
- The total operating expenses declined by 4.7% to Kshs 104.7 mn in H1’2025 from Ksh 109.8 mn in H1’2024, driven by a 1.6% decrease in Fund-Operating expenses to Kshs 52.8 mn in H1’2025, from Kshs 53.6 mn in H1’2024. There was a 7.7% decrease in the property expenses to Kshs 51.9 mn in H1’2025, from Kshs 56.2 mn in H1’2024. The decrease in expenses was mainly on the back of the one-off restructuring costs incurred during H1’2024 but was not present in this year.
- Distributable earnings per unit came in at Kshs 0.4 in H1’2025, a 20.0% increase from Kshs 0.3 recorded during a similar period in 2024 due increased rental income resulting from increased occupancy at Greenspan Mall and,
- The REIT Manager recommended a first and final distribution of Kshs 54.3 mn in relation to H1’2025 amounting to 30 cents per unit. This translates to a dividend yield of 2.5% and an implied capitalization rate of 7.4%.
Balance Sheet:
- Total assets increased by 8.4% to Kshs 3.7 bn in H1’2025, from Kshs 3.4 bn in H1’2024. This was primarily attributable to a 9.7% increase in investment securities to Kshs 3.1 bn in H1’ 2025, from Kshs 2.8 bn recorded in H1’2024,
- Total liabilities decreased by 34.3% to Kshs 94.7 mn in H1’2025, from Kshs 144.1 mn in H1’2024 attributable to a similar decrease in the trade and other payables to to Kshs 94.7 mn in H1’2025, from Kshs 144.1 mn in H1’2024. The REIT remained without non-current liabilities as at H1’ 2025,
- The shareholder’s funds increased by 10.3% to Kshs 3.6 bn in H1’2025, from Kshs 3.2 bn in H1’2024, following an increase in retained earnings of 25.0% to Kshs 91.8 mn in H1’ 2025 from Kshs 73.4 mn H1’2024, and,
- The REIT currently has a Return on Assets of 1.8% which was a 0.2% point increase from 1.6% in H1’ 2024 and a Return on Equity of 1.8% which was a 0.1% point increase from 1.7% in H1’ 2024 .
Going forward, ILAM Fahari I-REIT’s strategic focus will be on enhancing asset performance through active portfolio management, tenant retention, and targeted capital improvements, particularly at high-potential assets such as Greenspan Mall. With increased occupancy already evident, the REIT is well-positioned to drive further rental income growth. Additionally, prudent cost management and operational efficiency will remain key levers for sustaining profitability and distributable income. The REIT also aims to optimize its investment portfolio by exploring yield-accretive opportunities and diversifying income streams. Supported by a stronger balance sheet, low leverage, and positive earnings momentum, ILAM Fahari is set to deliver stable returns to investors while reinforcing its market position as a leading listed property income fund in Kenya.
For a more comprehensive analysis, please see our ILAM Fahari I-REIT H1’2025 earnings note.
The REITs registered positive returns of 4.9%, 9.6%, 4.0% and 1.3% for Acorn I-REIT, Fahari I-REIT, Laptrust Amara IREIT and Acorn D-REIT respectively. The chart below shows the comparison of REITs yield performance versus other assets.
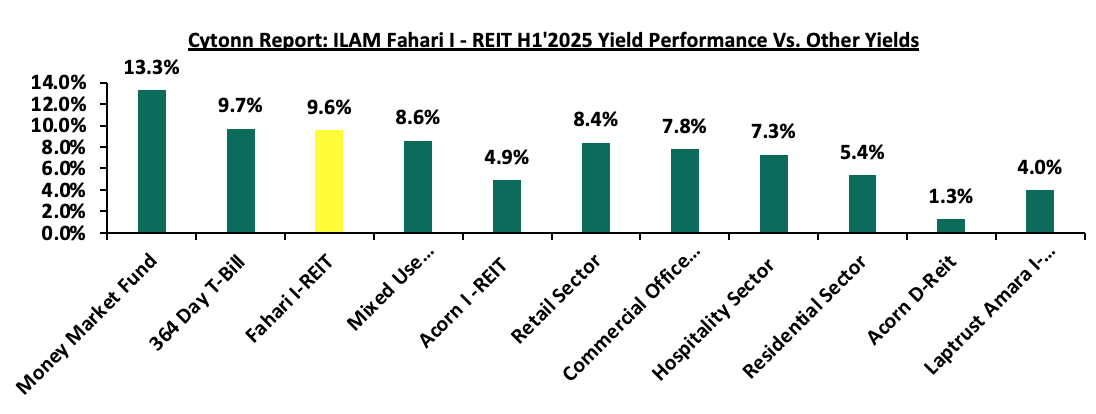
- REITS Weekly performance
On the Unquoted Securities Platform, Acorn D-REIT and I-REIT traded at Kshs 26.7 and Kshs 22.9 per unit, respectively, as per the last updated data on 1st August 2025. The performance represented a 33.4% and 14.5% gain for the D-REIT and I-REIT, respectively, from the Kshs 20.0 inception price. The volumes traded for the D-REIT and I-REIT came in at Kshs 12.8 mn and Kshs 36.1 mn shares, respectively, with a turnover of Kshs 323.5 mn and Kshs 791.5 mn, respectively, since inception in February 2021. Additionally, ILAM Fahari I-REIT traded at Kshs 11.0 per share as of 1st August 2025, representing a 45.0% loss from the Kshs 20.0 inception price. The volume traded to date came in at 1.2 mn shares for the I-REIT, with a turnover of Kshs 1.5 mn since inception in November 2015.
REITs offer various benefits, such as tax exemptions, diversified portfolios, and stable long-term profits. However, the ongoing decline in the performance of Kenyan REITs and the restructuring of their business portfolios are hindering significant previous investments. Additional general challenges include:
- Insufficient understanding of the investment instrument among investors leading to a slower uptake of REIT products,
- Lengthy approval processes for REIT creation,
- High minimum capital requirements of Kshs 100.0 mn for REIT trustees compared to Kshs 10.0 mn for pension funds Trustees, essentially limiting the licensed REIT Trustee to banks only
- The rigidity of choice between either a D-REIT or and I-REIT forces managers to form two REITs, rather than having one Hybrid REIT that can allocate between development and income earning properties
- Limiting the type of legal entity that can form a REIT to only a trust company, as opposed to allowing other entities such as partnerships, and companies,
- We need to give time before REITS are required to list – they would be allowed to stay private for a few years before the requirement to list given that not all companies maybe comfortable with listing on day one, and,
- Minimum subscription amounts or offer parcels set at Kshs 0.1 mn for D-REITs and Kshs 5.0 mn for restricted I-REITs. The significant capital requirements still make REITs relatively inaccessible to smaller retail investors compared to other investment vehicles like unit trusts or government bonds, all of which continue to limit the performance of Kenyan REITs.
We expect the performance of Kenya’s Real Estate sector to remain resilient supported by several factors: i) heightened activities from both private and government sectors, ii) an expanding population driving the need for housing, iii) government efforts under the Affordable Housing Program and the incentives advanced to developers aligned with the program, iv) an increase in deals in the commercial office sector likely to boost occupancy, v) increased investment by international and local investors in the retail sector, and vi) increased international arrivals in the country boosting the hospitality and tourism sector. However, challenges such as rising construction costs, an oversupply in select Real Estate classes, strain on infrastructure development, and high capital demands in REITs sector will continue to impede the real estate sector’s optimal performance by restricting developments and investments.
Disclaimer: The views expressed in this publication are those of the writers where particulars are not warranted. This publication, which is in compliance with Section 2 of the Capital Markets Authority Act Cap 485A, is meant for general information only and is not a warranty, representation, advice, or solicitation of any nature. Readers are advised in all circumstances to seek the advice of a registered investment advisor.

- Talk to us
- Kenya
- P.O Box 20695 - 00200, Nairobi, Kenya
- Cell +254709101200
- Tel +254709101200
- WhatsApp +254741676635
- United States
- +254709101200
- DOWNLOAD OUR APP
-


- Kenya
- 8th Floor, Pinetree Plaza, Kaburu Drive, Ngong Road, Nairobi, Kenya
- USA
- Suite 1150, 1775 Eye Street NW, USA, Washington DC 20006, USA
- Investments
- High Yield
- Private Equity
- Real Estate
- Real Estate
- RiverRun Estates
- Cytonn Towers
- The Ridge
- Taraji Heights
- The Alma