Review of Kenya's Public Debt 2025 Report, & Cytonn Weekly #29/2025
By Investments Team, Jul 20, 2025
Executive Summary
Fixed Income
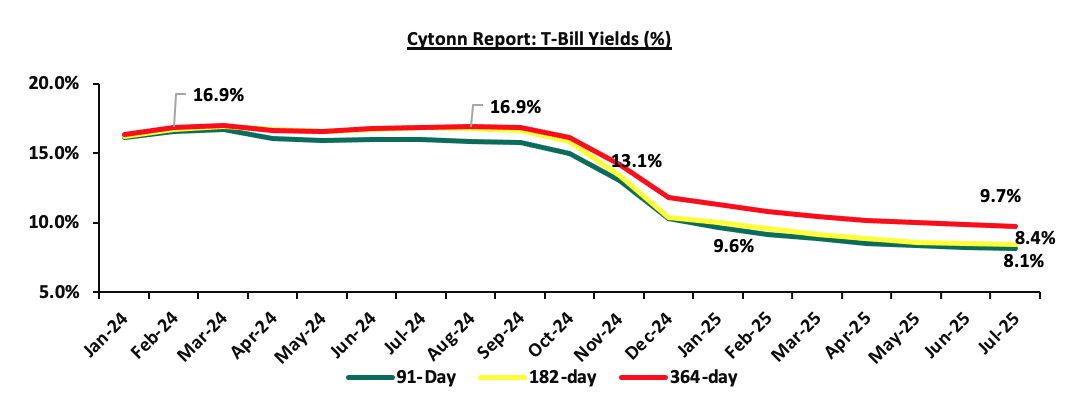
This week, T-bills were oversubscribed for the first time in four weeks, with the overall subscription rate coming in at 115.9%, higher than the subscription rate of 94.9% recorded the previous week. Investors’ preference for the shorter 91-day paper waned, with the paper receiving bids worth Kshs 2.0 bn against the offered Kshs 4.0 bn, translating to a subscription rate of 49.1%, lower than the subscription rate of 103.8%, recorded the previous week. The subscription rate for the 182-day paper decreased to 76.2%, from the 89.7% recorded the previous week, while that of the 364-day paper increased to 182.4% from the 96.6% recorded the previous week. The government accepted a total of Kshs 24.1 bn worth of bids out of Kshs 27.8 bn bids received, translating to an acceptance rate of 86.7%. The yields on the government papers registered a mixed performance with the yields on the 91-day paper and 182-day paper decreasing by 1.4 bps and 0.9 bps to 8.13% and 8.43%, from the 8.14% and 8.44% recorded the previous week respectively, while the yields on the 364-day paper increased by 0.6 bps to 9.73% from 9.72% recorded the previous week;
During the week, the Energy and Petroleum Regulatory Authority (EPRA) released their monthly statement on the maximum retail fuel prices in Kenya, effective from 15th July 2025 to 14th August 2025. Notably, the maximum allowed price for Super Petrol, Diesel and Kerosene increased by Kshs 9.0, Kshs. 8.7 and Kshs 9.7 respectively. Consequently, Super Petrol, Diesel and Kerosene will now retail at Kshs 186.3, Kshs 171.6 and Kshs 156.6 per litre respectively, from Kshs 177.3, Kshs 162.9 and Kshs 146.9 per litre respectively, representing increases of 5.1%, 5.3% and 6.6% for Super Petrol, Diesel and Kerosene respectively;
Equities
During the week, the equities market was on a downward trajectory, with NSE 10 losing the most by 1.4%, while NSE 25, NASI and NSE 20 lost by 0.9%, 0.7% and 0.5% respectively, taking the YTD performance to gains of 26.0%, 21.5%, 16.8% and 16.4% for NASI, NSE 20, NSE 25 and NSE 10 respectively. The equities market performance was driven by losses recorded by large-cap stocks such as EABL, Co-operative bank and Absa Bank of 8.3%, 1.8% and 1.8% respectively. The performance was however supported by gains recorded by large cap stocks such as Stanbic Bank, Standard Chartered Bank and Safaricom of 1.5%, 1.1% and 1.0% respectively;
Additionally, in the regional equities market, the East African Exchanges 20 (EAE 20) share index gained by 0.7%, attributable to gains recorded by large cap stocks such as Quality Chemicals Industry Limited, NMB Bank and Stanbic Uganda holdings of 7.7%, 5.2% and 2.9% respectively. The performance was however weighed down by losses recorded by large cap stocks such as Tanzania Breweries Limited, Safaricom and KCB Group of 3.0%, 1.7% and 1.3% respectively;
During the week, Centum Investments Company PLC released their FY’2025 financial results for the period ending 31st March 2025, recording a 68.8% decrease in the Profits After Tax (PAT) to Kshs 0.8 bn in FY’2025, from Kshs 2.6 bn in FY’2024. The decrease was mainly attributable to a 97.0% decrease in profit from their Two Rivers Special Economic Zone business to Kshs 0.1 bn, from Kshs 2.9 bn in FY’2024;
Real Estate
During the week, the National carrier, Kenya Airways, made efforts to enhance its flight capacity through a two-pronged strategy, that is, restoring grounded Boeing 787 Dreamliners and acquiring new narrow body aircrafts. This move promises to enhance the airline’s network and improve connectivity across Africa;
During the week, the Kenyan government unveiled its plans to hand over the operation of the upcoming Standard Gauge Railway (SGR) line from Naivasha to Malaba to a private investor in a strategic shift aimed at easing the financial burden of the mega infrastructure project on taxpayers. The project will be divided into two phases, that is, from Naivasha to Kisumu and then onward to Malaba, where the project is expected to cost approximately Kshs 646.0 bn;
During the week, the Kenya National Highways Authority invited prequalification bids from Chinese contractors for the expansion of the Pangani-Muthaiga-Kiambu-Ndumberi Road, following a financing deal from China’s Export-Import Bank. The project aims to upgrade the B32 corridor, which stretches from Muthaiga through Kiambu to Ndumberi from a two-lane single carriageway to a four-lane dual carriageway with service lanes and pedestrian pathways;
On the Unquoted Securities Platform, Acorn D-REIT and I-REIT traded at Kshs 26.7 and Kshs 22.9 per unit, respectively, as per the last updated data on 04th July 2025. The performance represented a 33.4% and 14.5% gain for the D-REIT and I-REIT, respectively, from the Kshs 20.0 inception price. Additionally, ILAM Fahari I-REIT traded at Kshs 11.0 per share as of 04th July 2025, representing a 45.0% loss from the Kshs 20.0 inception price. The volume traded to date came in at 1.2 mn shares for the I-REIT, with a turnover of Kshs 1.5 mn since inception in November 2015;
Focus of the Week
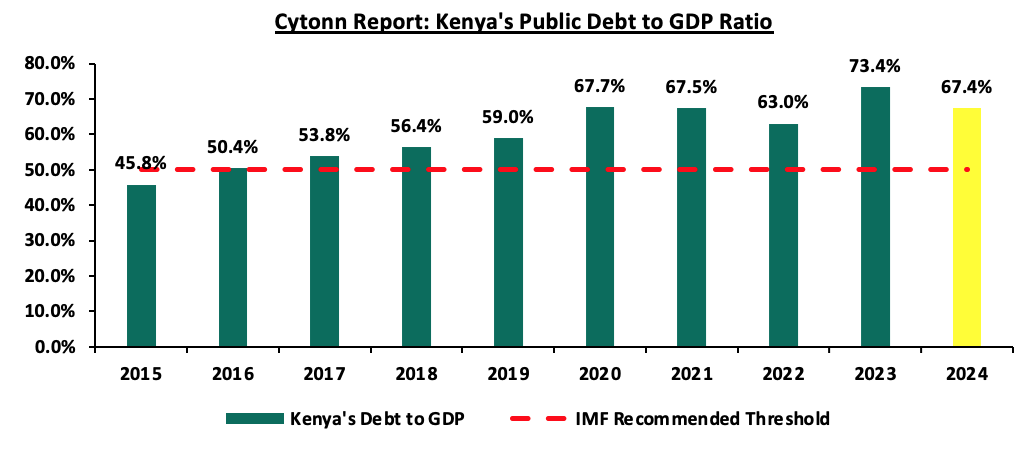
Kenya is one of the fastest growing economies in Sub-Saharan Africa, having registered a growth rate of 4.9% in the first quarter of 2025. Despite being one of the fastest growing economies in Sub-Saharan Africa with a projected economic growth rate of 4.8%, above the region’s expected average of 3.7% in 2025, Kenya is grappling with a high debt burden, facing elevated risk of debt distress and significant challenges in managing its public debt, which has increased rapidly in recent years. As per the latest data from the Central Bank of Kenya (CBK), the total public debt stood at Kshs 11.5 tn as of May 2025, compared to Kshs 10.4 tn recorded in May 2024, equivalent to an 10.3% increase. Notably, external debt increased marginally by 3.9% during the period to Kshs 5.3 tn in May 2025 from the Kshs 5.1 tn in May 2024, partly attributable to the partial buyback of the USD 900.0 mn Eurobond in February 2025 through the issuance of a new USD 1.5 bn Eurobond. Similarly, domestic debt increased by 16.6% to Kshs 6.2 tn in May 2025, from Kshs 5.3 tn in May 2024, attributable to the increased inclination towards domestic financing amid lower interest rates and constrained access to external financing. Consequently, the debt to GDP ratio stood at 67.4% as of December 2024, 17.4% points higher than the International Monetary Fund (IMF) threshold of 50.0% for developing countries, albeit lower than the 73.4% recorded as of December 2023. The rising public debt has raised concerns about its sustainability and implications for fiscal and macroeconomic stability. Kenya’s debt levels remain high with high debt servicing costs as evidenced by the B-, Caa1 and B- credit ratings by S&P Global, Moody’s and Fitch credit agencies respectively, signaling high credit risk but with ability to still meet its financial commitments. However, recent policy actions have begun to positively shift the credit trajectory. Notably, on 29th January 2025, Moody’s affirmed its Caa1 credit rating on Kenya and revised the outlook from negative to positive, indicating that there is potential for Kenya’s credit rating to improve in the future on the back of improved revenue collection and prudent debt repayments. The February 2025 Eurobond buyback and new issue helped smoothen Kenya’s external debt maturity profile and increase investor confidence. Consequently, in this week’s topical, we shall focus on the current status of Kenya’s public debt as of May 2025. We shall also give our outlook on the country’s debt sustainability.
Money Markets, T-Bills and T-Bonds Primary Auction:
This week, T-bills were oversubscribed for the first time in four weeks, with the overall subscription rate coming in at 115.9%, higher than the subscription rate of 94.9% recorded the previous week. Investors’ preference for the shorter 91-day paper waned, with the paper receiving bids worth Kshs 2.0 bn against the offered Kshs 4.0 bn, translating to a subscription rate of 49.1%, lower than the subscription rate of 103.8%, recorded the previous week. The subscription rate for the 182-day paper decreased to 76.2%, from the 89.7% recorded the previous week, while that of the 364-day paper increased to 182.4% from the 96.6% recorded the previous week. The government accepted a total of Kshs 24.1 bn worth of bids out of Kshs 27.8 bn bids received, translating to an acceptance rate of 86.7%. The yields on the government papers registered a mixed performance with the yields on the 91-day paper and 182-day paper decreasing by 1.4 bps and 0.9 bps to 8.13% and 8.43%, from the 8.14% and 8.44% recorded the previous week respectively, while the yields on the 364-day paper increased by 0.6 bps to 9.73% from 9.72% recorded the previous week;
The chart below shows the yield performance of the 91-day, 182-day and 364-day papers over the period;
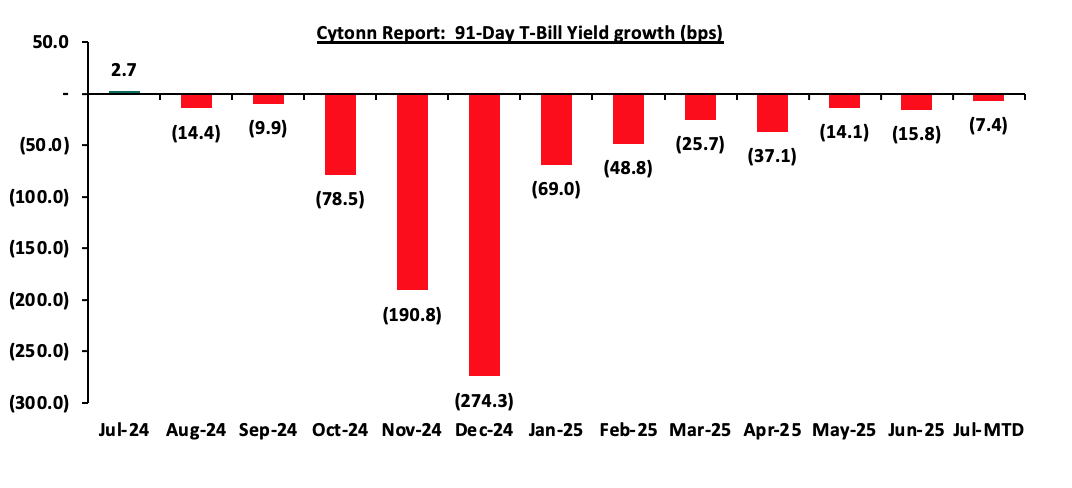
The chart below shows the yield growth for the 91-day T-bill:
The chart below compares the overall average T-bill subscription rates obtained in 2022,2023, 2024 and 2025 Year-to-date (YTD):

Money Market Performance:
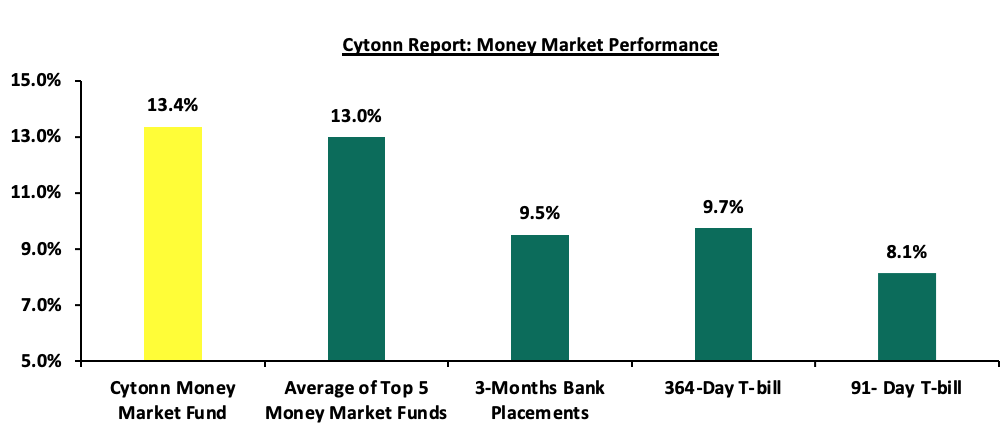
In the money markets, 3-month bank placements ended the week at 9.5% (based on what we have been offered by various banks) and the yields on the government papers registered a mixed performance with the yields on 91-day papers decreasing by 1.4 bps to 8.13% from the 8.14% recorded the previous week, while the yields on the 364-day papers increased by 0.6 bps to 9.73% from the 9.72% recorded the previous week. The yield on the Cytonn Money Market Fund remained unchanged from the 13.4% recorded the previous week, while the average yields on the Top 5 Money Market Funds decreased marginally by 0.1 bps to remain relatively unchanged from the 13.0% recorded the previous week.
The table below shows the Money Market Fund Yields for Kenyan Fund Managers as published on 18th July 2025:
|
Money Market Fund Yield for Fund Managers as published on 18th July 2025 |
||
|
Rank |
Fund Manager |
Effective Annual Rate |
|
1 |
Cytonn Money Market Fund (Dial *809# or download Cytonn App) |
13.4% |
|
2 |
Gulfcap Money Market Fund |
13.1% |
|
3 |
Ndovu Money Market Fund |
13.1% |
|
4 |
Lofty-Corban Money Market Fund |
12.8% |
|
5 |
Kuza Money Market fund |
12.6% |
|
6 |
Etica Money Market Fund |
12.1% |
|
7 |
Nabo Africa Money Market Fund |
11.9% |
|
8 |
GenAfrica Money Market Fund |
11.5% |
|
9 |
British-American Money Market Fund |
11.5% |
|
10 |
Old Mutual Money Market Fund |
11.0% |
|
11 |
Enwealth Money Market Fund |
11.0% |
|
12 |
Orient Kasha Money Market Fund |
11.0% |
|
13 |
Madison Money Market Fund |
11.0% |
|
14 |
Arvocap Money Market Fund |
11.0% |
|
15 |
Jubilee Money Market Fund |
10.9% |
|
16 |
Faulu Money Market Fund |
10.3% |
|
17 |
Sanlam Money Market Fund |
10.2% |
|
18 |
Dry Associates Money Market Fund |
10.2% |
|
19 |
Apollo Money Market Fund |
10.2% |
|
20 |
KCB Money Market Fund |
10.1% |
|
21 |
Genghis Money Market Fund |
9.7% |
|
22 |
Mali Money Market Fund |
9.4% |
|
23 |
Co-op Money Market Fund |
9.3% |
|
24 |
ICEA Lion Money Market Fund |
9.3% |
|
25 |
CIC Money Market Fund |
8.9% |
|
26 |
Mayfair Money Market Fund |
8.5% |
|
27 |
Absa Shilling Money Market Fund |
8.5% |
|
28 |
CPF Money Market Fund |
8.3% |
|
29 |
AA Kenya Shillings Fund |
8.0% |
|
30 |
Ziidi Money Market Fund |
6.8% |
|
31 |
Stanbic Money Market Fund |
6.6% |
|
32 |
Equity Money Market Fund |
4.5% |
Source: Business Daily
Liquidity:
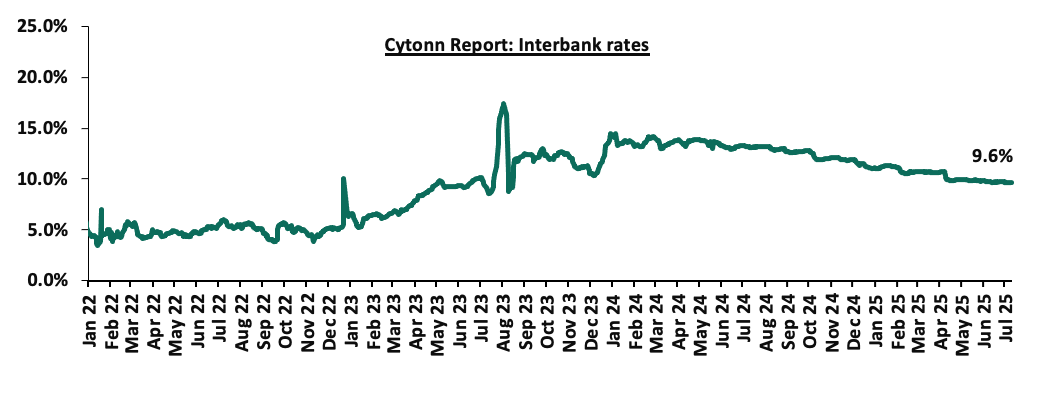
During the week, liquidity in the money markets marginally tightened, with the average interbank rate increasing by 0.8 bps, to remain relatively unchanged from the 9.6% recorded the previous week, partly attributable to government payments that were offset by tax remittances. The average interbank volumes traded decreased by 9.8% to Kshs 10.8 bn from Kshs 11.9 bn recorded the previous week. The chart below shows the interbank rates in the market over the years:
Kenya Eurobonds:
During the week, the yields on Kenya’s Eurobonds were on an upward trajectory with the yield on the 13-year Eurobond issued in 2021 increasing the most by 24.6 bps to 10.1% from the 9.9% recorded the previous week. The table below shows the summary performance of the Kenyan Eurobonds as of 10th July 2025;
|
Cytonn Report: Kenya Eurobond Performance |
|||||||
|
|
2018 |
2019 |
2021 |
2024 |
2025 |
||
|
Tenor |
10-year issue |
30-year issue |
7-year issue |
12-year issue |
13-year issue |
7-year issue |
11-year issue |
|
Amount Issued (USD) |
1.0 bn |
1.0 bn |
0.9 bn |
1.2 bn |
1.0 bn |
1.5 bn |
1.5 bn |
|
Years to Maturity |
2.7 |
22.7 |
1.9 |
6.9 |
9.0 |
5.7 |
10.7 |
|
Yields at Issue |
7.3% |
8.3% |
7.0% |
7.9% |
6.2% |
10.4% |
9.9% |
|
02-Jan-25 |
9.1% |
10.3% |
8.5% |
10.1% |
10.1% |
10.1% |
9.95% |
|
01-Jul-25 |
8.0% |
10.3% |
- |
9.4% |
9.7% |
9.3% |
|
|
10-Jul-25 |
8.4% |
10.5% |
- |
9.7% |
9.9% |
9.5% |
|
|
11-Jul-25 |
8.5% |
10.6% |
- |
9.7% |
10.0% |
9.6% |
|
|
14-Jul-25 |
8.5% |
10.7% |
- |
9.8% |
10.1% |
9.6% |
|
|
15-Jul-25 |
8.5% |
10.6% |
- |
9.8% |
10.0% |
9.6% |
|
|
16-Jul-25 |
8.6% |
10.7% |
- |
9.9% |
10.1% |
9.6% |
|
|
17-Jul-25 |
8.6% |
10.7% |
- |
9.8% |
10.1% |
9.6% |
|
|
Weekly Change |
0.2% |
0.2% |
- |
0.2% |
0.2% |
0.1% |
- |
|
MTD Change |
0.5% |
0.4% |
- |
0.4% |
0.4% |
0.4% |
- |
|
YTD Change |
(0.5%) |
0.4% |
- |
(0.2%) |
0.0% |
(0.5%) |
- |
Source: Central Bank of Kenya (CBK) and National Treasury
Kenya Shilling:
During the week, the Kenyan Shilling depreciated marginally against the US Dollar by 0.1 bps, to remain unchanged from the Kshs 129.2 recorded the previous week. On a year-to-date basis, the shilling has appreciated by 4.9 bps against the dollar, compared to the 17.6% appreciation recorded in 2024.
We expect the shilling to be supported by:
- Diaspora remittances standing at a cumulative USD 5,084.0 mn in the twelve months to June 2025, 12.1% higher than the USD 4,535.0 mn recorded over the same period in 2024. These has continued to cushion the shilling against further depreciation. In the June 2025 diaspora remittances figures, North America remained the largest source of remittances to Kenya accounting for 57.9% in the period,
- The tourism inflow receipts which came in at Kshs 452.2 bn in 2024, a 19.8% increase from Kshs 377.5 bn inflow receipts recorded in 2023, and owing to tourist arrivals that improved by 8.0% to 2,303,028 in the 12 months to February 2025 from 2,133,612 in the 12 months to February 2024 and,
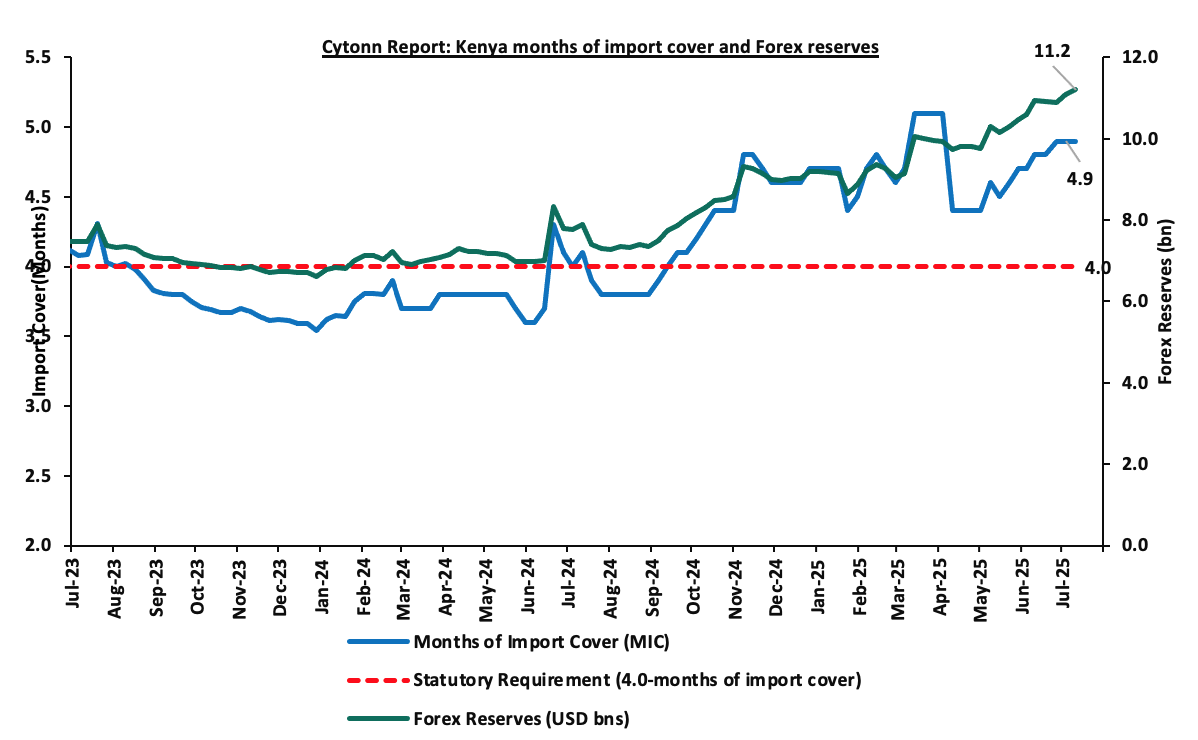
- Improved forex reserves currently at USD 11.2 bn (equivalent to 4.9-months of import cover), which is above the statutory requirement of maintaining at least 4.0-months of import cover and above the EAC region’s convergence criteria of 4.5-months of import cover.
The shilling is however expected to remain under pressure in 2025 as a result of:
- An ever-present current account deficit which came at 1.8% of GDP in the twelve months to April 2025, and,
- The need for government debt servicing, continues to put pressure on forex reserves given that 62.0% of Kenya’s external debt is US Dollar-denominated as of December 2024.
Key to note, Kenya’s forex reserves decreased marginally by 0.1% during the week, to remain stable at the USD 11.2 bn recorded in the previous week, (equivalent to 4.9 months of import cover), and above the statutory requirement of maintaining at least 4.0-months of import cover and above the EAC region’s convergence criteria of 4.5-months of import cover.
The chart below summarizes the evolution of Kenya's months of import cover over the years:
Weekly highlights
- Fuel Prices effective 15th July 2025 to 14th August 2025
During the week, the Energy and Petroleum Regulatory Authority (EPRA) released their monthly statement on the maximum retail fuel prices in Kenya, effective from 15th July 2025 to 14th August 2025. Notably, the maximum allowed price for Super Petrol, Diesel and Kerosene increased by Kshs 9.0, Kshs. 8.7 and Kshs 9.7 respectively. Consequently, Super Petrol, Diesel and Kerosene will now retail at Kshs 186.3, Kshs 171.6 and Kshs 156.6 per litre respectively, from Kshs 177.3, Kshs 162.9 and Kshs 146.9 per litre respectively, representing increases of 5.1%, 5.3% and 6.6% for Super Petrol, Diesel and Kerosene respectively.
Other key take-outs from the performance include;
- The average landing costs per cubic meter for Kerosene, Diesel and Super Petrol increased 6.5%, 6.3% and 7.0% to USD 628.3, USD 616.6 and USD 608.5 respectively, from the USD 590.2, USD 580.2 and USD 569.0 respectively recorded in May.
- The Kenyan Shilling remained stable against the US Dollar, depreciating slightly by 7.7 bps to Kshs 129.6 in May from the Kshs 129.5 recorded in May.
We note that fuel prices in the country have had recorded progressive declines in recent months largely due to the government's efforts to stabilize pump prices through the petroleum pump price stabilization mechanism which expended Kshs 9.9 bn in the FY’2023/24 to cushion the increases applied to the petroleum pump prices, coupled with the stabilization of the Kenyan Shilling against the dollar and other major currencies, as well as a decrease in international fuel prices. However, we note that the government hasn’t applied the fuel stabilization relief in the past two months leading to an increase in fuel prices. Going forward, we expect that fuel prices to be on an upward trajectory as international fuel prices continue to soar upwards, and an absence of fuel stabilization relief from the government. As such, we expect the business environment in the country to remain subdued as fuel is a major input cost, as well as a possible pressure on inflation rates. We however expect inflation rate to remain within the CBK’s preferred target range of 2.5%-7.5% in the short to medium-term, mainly supported by a stable exchange rate.
Rates in the Fixed Income market have been on a downward trend due to high liquidity in the money market which allowed the government to front load most of its borrowing. The government is 60.9% ahead of its prorated net domestic borrowing target of Kshs 34.9, having a net borrowing position of Kshs 56.2 bn (inclusive of T-bills). However, we expect a stabilization of the yield curve in the short and medium term, with the government looking to increase its external borrowing to maintain the fiscal surplus, hence alleviating pressure in the domestic market. As such, we expect the yield curve to stabilize in the short to medium-term and hence investors are expected to shift towards the long-term papers to lock in the high returns
Market Performance
During the week, the equities market was on a downward trajectory, with NSE 10 losing the most by 1.4%, while NSE 25, NASI and NSE 20 lost by 0.9%, 0.7% and 0.5% respectively, taking the YTD performance to gains of 26.0%, 21.5%, 16.8% and 16.4% for NASI, NSE 20, NSE 25 and NSE 10 respectively. The equities market performance was driven by losses recorded by large-cap stocks such as EABL, Co-operative bank and Absa Bank of 8.3%, 1.8% and 1.8% respectively. The performance was however supported by gains recorded by large cap stocks such as Stanbic Bank, Standard Chartered Bank and Safaricom of 1.5%, 1.1% and 1.0% respectively
Additionally, in the regional equities market, the East African Exchanges 20 (EAE 20) share index gained by 0.7%, attributable to gains recorded by large cap stocks such as Quality Chemicals Industry Limited, NMB Bank and Stanbic Uganda holdings of 7.7%, 5.2% and 2.9% respectively. The performance was however weighed down by losses recorded by large cap stocks such as Tanzania Breweries Limited, Safaricom and KCB Group of 3.0%, 1.7% and 1.3% respectively.
During the week, equities turnover increased by 13.2% to USD 18.0 mn, from USD 15.9 mn recorded the previous week, taking the YTD total turnover to USD 481.0 mn. Foreign investors became net sellers for the first time in six weeks, with a net selling position of USD 2.6 mn, from a net buying position of USD 0.2 mn recorded the previous week, taking the YTD foreign net selling position to USD 29.2 mn, compared to a net selling position of USD 16.9 mn in 2024.
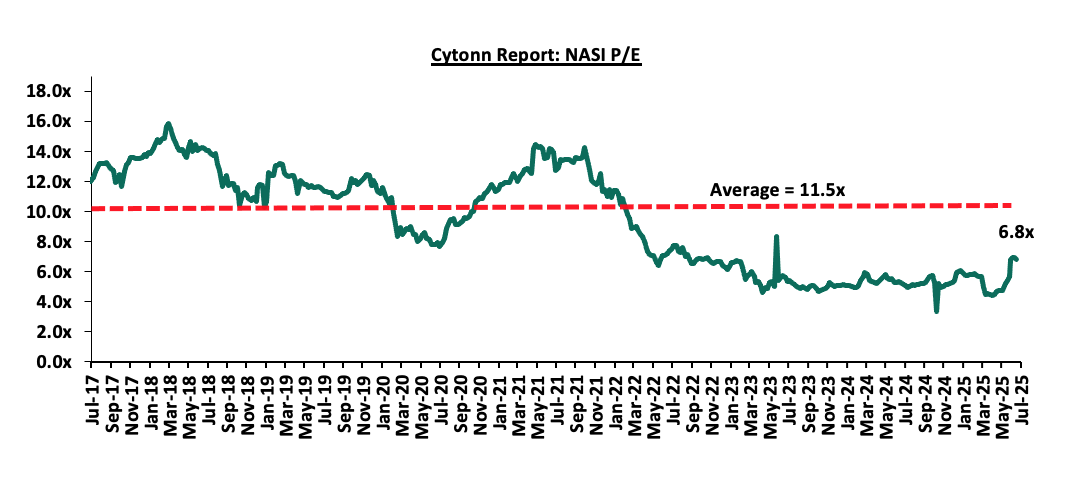
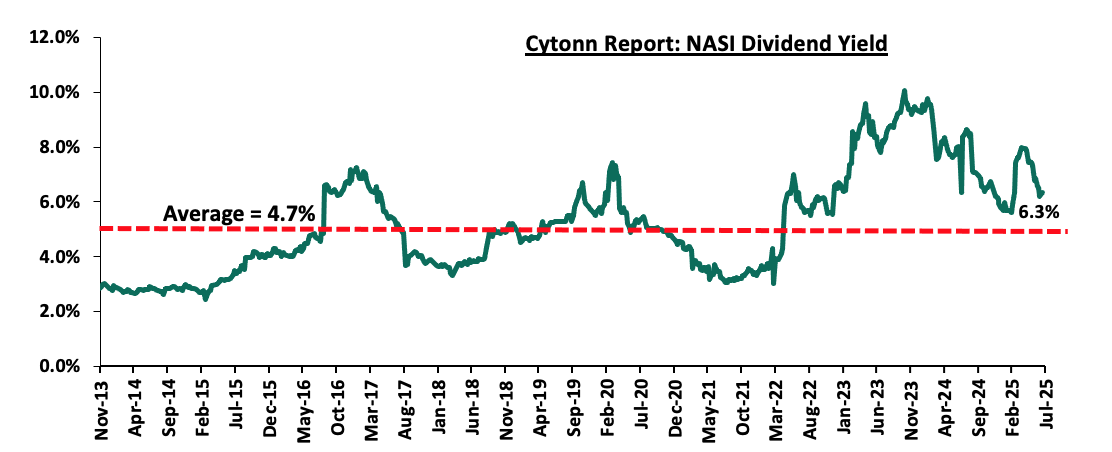
The market is currently trading at a price-to-earnings ratio (P/E) of 6.8x, 40.3% below the historical average of 11.5x. The dividend yield stands at 6.3%, 1.6% points above the historical average of 4.7%. Key to note, NASI’s PEG ratio currently stands at 0.9x, an indication that the market is undervalued relative to its future growth. A PEG ratio greater than 1.0x indicates the market is overvalued while a PEG ratio less than 1.0x indicates that the market is undervalued. The charts below indicate the historical P/E and dividend yields of the market;
|
Cytonn Report: Equities Universe of Coverage |
|||||||||||
|
Company |
Price as at 11/07/2025 |
Price as at 18/07/2025 |
w/w change |
YTD Change |
Year Open 2025 |
Target Price* |
Dividend Yield |
Upside/ Downside** |
P/TBv Multiple |
Recommendation |
|
|
Equity Group |
49.7 |
49.5 |
8.2% |
(0.3%) |
48.0 |
58.0 |
8.6% |
25.8% |
0.9x |
Buy |
|
|
CIC Group |
3.3 |
3.3 |
(4.1%) |
1.2% |
2.1 |
4.0 |
3.9% |
24.9% |
0.9x |
Buy |
|
|
Diamond Trust Bank |
79.3 |
78.3 |
(1.6%) |
(1.3%) |
66.8 |
90.4 |
8.9% |
24.4% |
0.3x |
Buy |
|
|
Standard Chartered Bank |
301.3 |
304.5 |
1.6% |
1.1% |
285.3 |
328.8 |
14.8% |
22.8% |
1.7x |
Buy |
|
|
KCB Group |
46.4 |
46.2 |
(1.3%) |
(0.4%) |
42.4 |
53.7 |
6.5% |
22.7% |
0.6x |
Buy |
|
|
Co-op Bank |
17.1 |
16.8 |
(3.0%) |
(1.8%) |
17.5 |
18.9 |
9.0% |
22.0% |
0.6x |
Buy |
|
|
Stanbic Holdings |
171.0 |
173.5 |
(3.7%) |
1.5% |
139.8 |
185.8 |
12.0% |
19.0% |
1.1x |
Accumulate |
|
|
Jubilee Holdings |
226.0 |
235.0 |
(1.4%) |
4.0% |
174.8 |
260.4 |
5.7% |
16.6% |
0.4x |
Accumulate |
|
|
ABSA Bank |
19.9 |
19.6 |
4.9% |
(1.8%) |
18.9 |
21.0 |
9.0% |
16.4% |
1.3x |
Accumulate |
|
|
I&M Group |
36.2 |
36.5 |
(3.3%) |
1.0% |
36.0 |
39.0 |
8.2% |
15.1% |
0.6x |
Accumulate |
|
|
Britam |
8.2 |
8.3 |
(0.3%) |
1.2% |
5.8 |
9.5 |
0.0% |
15.0% |
0.8x |
Accumulate |
|
|
NCBA |
63.5 |
63.0 |
1.2% |
(0.8%) |
51.0 |
60.2 |
8.7% |
4.2% |
1.0x |
Lighten |
|
|
*Target Price as per Cytonn Analyst estimates **Upside/ (Downside) is adjusted for Dividend Yield ***Dividend Yield is calculated using FY’2024 Dividends |
|||||||||||
Weekly Highlights
- Centum Investments Company PLC Q1’2025 Financial Performance
During the week, Centum Investments Company PLC released their FY’2025 financial results for the period ending 31st March 2025, recording a 68.8% decrease in the Profits After Tax (PAT) to Kshs 0.8 bn in FY’2025, from Kshs 2.6 bn in FY’2024. The decrease was mainly attributable to a 97.0% decrease in profit from their Two Rivers Special Economic Zone business to Kshs 0.1 bn, from Kshs 2.9 bn in FY’2024, coupled with a 39.9% decrease in profit from Real Estate Business to Kshs 1.5 bn in FY’2025, from Kshs 2.5 bn in FY’2024. This decrease outpaced the 434.2% increase in profit in their investment’s operations to Kshs 1.2 bn in FY’2025 from Kshs 0.4 bn in FY’2024. The tables below show the breakdown of the Group’s financial performance;
Trading Business
|
Cytonn Report: Centum Investments Plc Income Statement |
|||
|
|
FY’2024 |
FY’2025 |
y/y change |
|
|
(Kshs. Bn) |
(Kshs. Bn) |
(%) |
|
Net income from trading businesses |
0.5 |
0.5 |
(1.8%) |
|
Direct and other operating costs |
(1.2) |
(1.0) |
(18.6%) |
|
Loss from trading businesses |
(0.7) |
(0.5) |
(30.6%) |
|
Financial Services |
|||
|
Income from financial services |
4.1 |
0.6 |
(86.2%) |
|
Funding and other costs |
(4.6) |
(0.5) |
(89.7%) |
|
Profit/(loss) from financial services |
(0.5) |
0.1 |
(118.0%) |
|
Real Estate Business |
|||
|
Gross profit from residential unit sales |
0.5 |
0.3 |
(30.5%) |
|
Fair value gains on investment property |
3.7 |
2.0 |
(46.7%) |
|
Gain on disposal of investment properties |
0.1 |
0.1 |
81.6% |
|
Other income |
0.0 |
0.0 |
(40.4%) |
|
Operating costs |
(0.7) |
(0.9) |
38.9% |
|
Operating profit from Centum Real Estate |
3.6 |
1.5 |
(58.3%) |
|
Funding Income/(Costs) |
(1.1) |
0.0 |
(100.5%) |
|
Profit/(loss) |
2.5 |
1.5 |
(39.9%) |
|
Two Rivers Development |
|||
|
Sales and investments income |
0.4 |
0.4 |
11.6% |
|
Direct and other operating costs |
(0.4) |
(0.4) |
(9.9%) |
|
Finance costs |
(0.9) |
(0.3) |
(71.7%) |
|
Loss from Two Rivers Development Group |
(1.0) |
(0.2) |
(74.9%) |
|
Two Rivers Special Economic Zone |
|||
|
Sales and investments income |
0.0 |
0.1 |
191138.3% |
|
Fair value gains on investments property |
3.4 |
1.2 |
(63.8%) |
|
Funding and other costs |
(0.5) |
(1.3) |
162.0% |
|
Profit/(loss) from Two Rivers Special Economic Zone |
2.9 |
0.1 |
(97.0%) |
|
Investment operations |
|||
|
Investment and other income |
0.6 |
2.0 |
223.9% |
|
Operating and administrative costs |
(0.6) |
(0.6) |
5.6% |
|
Finance costs |
(0.4) |
(0.2) |
(50.5%) |
|
Profit/(loss) from investment operations |
(0.4) |
1.2 |
(434.2%) |
|
|
|||
|
Profit before tax |
2.9 |
2.1 |
(26.6%) |
|
Income tax (expense)/credit |
(0.3) |
(1.3) |
334.5% |
|
Profit/(loss) for the year |
2.6 |
0.8 |
(68.8%) |
|
Earnings Per Share |
4.3 |
2.1 |
(52.0%) |
|
Dividend Per Share |
0.32 |
0.32 |
0.0% |
|
Dividend yield |
3.6% |
2.7% |
(0.9%) points |
|
Dividend payout ratio |
8.1% |
25.8% |
8.1% points |
Source: Centum Investments Company PLC FY’2025 financial statements
|
Cytonn Report: Centum Investments PLC Balance Sheet |
|||
|
|
FY’2024 |
FY’2025 |
y/y change |
|
|
(Kshs. Bn) |
(Kshs. Bn) |
(%) |
|
Investment Portfolio |
58.4 |
61.5 |
5.4% |
|
Loans and advances |
0.3 |
0.4 |
49.1% |
|
Cash and cash equivalents |
1.4 |
1.1 |
(21.5%) |
|
Other assets |
16.1 |
19.3 |
20.0% |
|
Total assets |
76.2 |
82.4 |
8.1% |
|
Borrowings |
16.6 |
17.9 |
7.6% |
|
Other liabilities |
19.8 |
21.3 |
7.2% |
|
Total liabilities |
36.4 |
39.1 |
7.4% |
|
Total Equity |
39.8 |
43.2 |
8.8% |
|
Total Equity and Liabilities |
76.2 |
82.4 |
8.1% |
Source: Centum Investments Company PLC FY’2025 financial report
Key take outs from the financial performance include;
- Profits from the Group decreased by 68.8% to Kshs 0.8 bn in FY’2025, from Kshs 2.6 bn recorded in FY’2024, mainly attributable to a 97.0% decrease in profit from their Two Rivers Special Economic Zone business to Kshs 0.1 bn, from Kshs 2.9 bn in FY’2024, coupled with a 39.9% decrease in profit from Real Estate Business to Kshs 1.5 bn in FY’2025, from Kshs 2.5 bn in FY’2024. This decrease outpaced the 434.2% increase in profit in their investment’s operations to Kshs 1.2 bn in FY’2025 from Kshs 0.4 bn in FY’2024.
- Losses from the Group’s trading business decreased by 30.6% to Kshs 0.5 bn in FY’2025, from a loss of Kshs 0.7 bn recorded in FY’2024, mainly attributable to a 18.6% decrease in direct and other operational costs to Kshs 1.0 bn in FY’2025 from Kshs 1.2 bn recorded in FY’2024.
- The Group witnessed an 118.0% profit growth from finance and investments operations business to Kshs 0.1 bn, from Kshs the 0.5 bn loss recorded in FY’2024, mainly attributable to 89.7% decrease in funding and other costs to Kshs 0.5 bn in FY’2025 from the 4.6 bn recorded in FY’2024.
- The Group’s balance sheet recorded an expansion, with the total assets increasing by 8.1% to Kshs. 82.4 bn in FY’2025 from the Kshs 76.2 bn recorded in FY’2024. This is mainly attributable to increase in investments portfolio by 5.4% to Kshs 61.5 bn during the period, from Kshs 58.4 bn in FY’2024, coupled with a 20.0% increase in other assets to Kshs 19.3 bn in FY’2025 from Kshs 16.1 bn in FY’2024.
- Earnings per share decreased by 52.0% to Kshs 2.1, from the Kshs 4.3 loss per share in FY’2024, largely driven by a 68.8% decrease in profit after tax to Kshs 0.8 bn, from Kshs 2.6 bn loss in FY’2024. Additionally, the board of directors recommended a first and final dividend of Kshs 0.32 per share similar to the dividend declared in FY’2024 translating to 0.9% points decrease in dividend yield to 2.7% from a dividend yield of 3.6% in FY’2024, and 17.8% points increase in dividend pay-out ratio to 25.8% in FY’2025, from 8.1% in FY’2024.
Key to note, Centum initiated the share buyback program on the 6th of February 2023 at an offer price of Kshs 9.03. As of 26th July 2024, 9.7 million shares had been purchased under the buyback program, comprising 24% of the volume traded. Additionally, on the share buyback initiated in October 2024 at an offer price of Kshs 9.03 per share, a total of 150,800 shares by June 2025 representing 0.23% of the buyback target. The ongoing share buyback is expected to contribute to an increase in Earnings per share by reducing the number of outstanding shares.
FY’2023/24 marked the close of the Centum 4.0 strategy period. The focus during this period was preservation of shareholder value against the backdrop of a difficult economic environment characterized by the Covid-19 pandemic, global geopolitical conflicts that disrupted supply chains and had a spiral effect in local and regional key economic indicators. Despite these headwinds, Centum managed to preserve shareholder value, reducing its debt by 14.2 bn resulting in reduction in annual finance cost by 84.0% between FY’2020 to FY’2024. We expect the Group’s profitability to improve in the long-term following the Group’s transition into the new strategy period named Centum 5.0, with a focus is on optimizing the value of the current portfolio of investments. The company is working towards scaling up various businesses and monetizing them to realize a minimum of their carrying values. This strategic shift aims to enhance shareholder returns and stabilize financial performance amidst the prevailing economic challenges.
We are “Bullish” on the Equities markets in the short term due to current cheap valuations, lower yields on short-term government papers and expected global and local economic recovery, and, “Neutral” in the long term due to persistent foreign investor outflows. With the market currently trading at a discount to its future growth (PEG Ratio at 0.9x), we believe that investors should reposition towards value stocks with strong earnings growth and that are trading at discounts to their intrinsic value. We expect the current high foreign investors sell-offs to continue weighing down the economic outlook in the short term.
- Hospitality Sector
- Expansion of Kenya Airways Fleet
During the week, the National carrier, Kenya Airways, made efforts to enhance its flight capacity through a two-pronged strategy, that is, restoring grounded Boeing 787 Dreamliners and acquiring new narrow body aircrafts. This move promises to enhance the airline’s network and improve connectivity across Africa, which will create new opportunities for travel agents.
Three Dreamliners have remained grounded since late 2024 due to factors such as maintenance delays. However, they gradually being returned to service with the first aircraft resuming operations on 22nd July, 2025, with the remaining two scheduled for September and December 2025. This restoration will significantly boost long haul capacity, enabling Kenya Airways to better serve key international routes. Moreover, the National Carrier plans to lease three narrow-body aircrafts in Q4’ 2025. These additions will mainly serve regional and domestic routes, increasing seat capacity and expanding cargo capacity. These efforts highlight KQ’s commitment to adjust to rising travel demand and modernizing its fleet.
These efforts will have numerous benefits on Kenya’s hospitality sector. Such benefits include; (i) Boost in connectivity and visitor volume. Air connectivity is a key enabler for tourism growth, and industry leaders stress that enhanced flight networks underpin occupancy and investment in hospitality, (ii) Growth of luxury hospitality segment. Major global brands like Marriott are accelerating their safari lodge openings in Kenya, targeting ultra-luxury travellers seeking high-end wellness experiences. These brands are drawing a growing demographic of premium tourists which creates demand for top tier hotels.
The return of Kenya Airways’ Dreamliner fleet and the leasing of additional aircraft is a game-changer for Kenya’s hospitality sector. By expanding air connectivity and capacity, the airline is set to unlock increased tourist arrivals, higher hotel occupancy rates, and greater investor confidence in tourism infrastructure.
- Infrastructure Sector
- Partial privatization of Standard Gauge Railway from Naivasha to Malaba
During the week, the Kenyan government unveiled its plans to hand over the operation of the upcoming Standard Gauge Railway (SGR) line from Naivasha to Malaba to a private investor in a strategic shift aimed at easing the financial burden of the mega infrastructure project on taxpayers. The project will be divided into two phases, that is, from Naivasha to Kisumu and then onward to Malaba, where the project is expected to cost approximately Kshs. 646.0 bn.
The Transport Cabinet Secretary said the government will finance the construction of the railway infrastructure, while a private investor will supply the rolling stock, including locomotives, passenger coaches and freight wagons. This approach is attributable to the costly nature of rolling stock, therefore by offloading this to private investors, the government hopes to avoid heavy upfront spending and cut loan requirements. The private investor will recover their cash from passenger and freight charges while paying the state a fee for use of the modern railway and stations. Moreover, Kenya has been in talks with countries such as China in order to secure financing to extend the railway.
Privatizing a segment of the Kisumu-Malaba Standard Gauge Railway line represents a strategic shift with potential positive impact for Kenya’s broader infrastructure sector. (i) Acceleration of project delivery and efficiency-Shifting to private-sector management, through a public-private partnership, can fast-track construction and operational readiness. It can reduce government financing pressure and leverage private capital, driving efficiency while mitigating public debt risk, (ii) Integration with regional corridors-With Malaba being the gateway to Uganda and other East and Central African countries, the railway line could expand cross-border trade capacity, aligning with the Northern corridor and regional SGR networks. This integration has ripple effects such as encouraging investment in border infrastructure and regional logistics services, (iii) Improved financial sustainability- A well-structured public-private partnership agreement could reduce debt exposure of Kenya. Revenue sharing from private operators can support repayment of construction funding, including the Railway Development Levy.
The partial privatisation of the Kisumu–Malaba SGR line marks a pivotal step in redefining Kenya’s infrastructure development model. If well-executed, this move will not only improve regional connectivity and trade but also signal Kenya’s commitment to sustainable and integrated infrastructure growth. However, success will depend on transparent governance, strong regulatory oversight, and alignment with national development priorities.
- Proposed expansion of Kiambu Road
During the week, the Kenya National Highways Authority invited prequalification bids from Chinese contractors for the expansion of the Pangani-Muthaiga-Kiambu-Ndumberi Road, following a financing deal from China’s Export-Import Bank. The project aims to upgrade the B32 corridor, which stretches from Muthaiga through Kiambu to Ndumberi from a two-lane single carriageway to a four-lane dual carriageway with service lanes and pedestrian pathways. The project is estimated to cost Kshs 35.0 bn which incorporates Kshs 7.0 bn for land acquisition and relocation services.
This proposed project forms an important bridge within Eastern Nairobi and seeks to ease traffic congestion along Kiambu Road and the Thika Superhighway. This is mainly due to the inclusion of the main trunk road, new interchanges and bridges, enhancement of adjacent road networks and provision of pedestrian facilities such as footbridges. Moreover, the Kenya National Highways Authority added that the project will have a construction period of 36 months and 24 months defects rectification period.
This project will have numerous benefits on Kenya’s infrastructure sector. Such benefits include; (i) technology transfer-Since China’s commitment is tied to Kenya opening the bid to Chinese firms, this will provide an opportunity to exchange ideas and encourage adoption of modern construction methods and project management practices, (ii) Acceleration of Real Estate development-Better road access will foster residential and commercial development in areas along Kiambu Road such as Thindigua, (iii) Increased job opportunities-This project will offer both skilled and unskilled job opportunities during construction and ongoing maintenance phases, (iv) Enhanced transport efficiency- Improved connectivity between Nairobi and Kiambu will facilitate smoother movement of goods and services which will help foster economic integration.
The proposed expansion of Kiambu Road will act as a catalyst for growth in Kenya’s infrastructure sector. It represents a strategic opportunity to strengthen urban-rural linkages, stimulate local industries, and shape sustainable urban development. However, to maximize benefits and minimize risks, it must be integrated into a broader framework of urban planning, environmental management, and infrastructure resilience.
- Real Estate Investment Trusts (REITs)
On the Unquoted Securities Platform, Acorn D-REIT and I-REIT traded at Kshs 26.7 and Kshs 22.9 per unit, respectively, as per the last updated data on 4th July 2025. The performance represented a 33.4% and 14.5% gain for the D-REIT and I-REIT, respectively, from the Kshs s 20.0 inception price. The volumes traded for the D-REIT and I-REIT came in at Kshs s 12.3 mn and Kshs 31.6 mn shares, respectively, with a turnover of Kshs 311.5 mn and Kshs 702.7 mn, respectively, since inception in February 2021. Additionally, ILAM Fahari I-REIT traded at Kshs 11.0 per share as of 4th July 2025, representing a 45.0% loss from the Kshs 20.0 inception price. The volume traded to date came in at 1.2 mn shares for the I-REIT, with a turnover of Kshs 1.5 mn since inception in November 2015.
REITs offer various benefits, such as tax exemptions, diversified portfolios, and stable long-term profits. However, the ongoing decline in the performance of Kenyan REITs and the restructuring of their business portfolios are hindering significant previous investments. Additional general challenges include:
- Insufficient understanding of the investment instrument among investors leading to a slower uptake of REIT products,
- Lengthy approval processes for REIT creation,
- High minimum capital requirements of Kshs 100.0 mn for REIT trustees compared to Kshs 10.0 mn for pension funds Trustees, essentially limiting the licensed REIT Trustee to banks only
- The rigidity of choice between either a D-REIT or and I-REIT forces managers to form two REITs, rather than having one Hybrid REIT that can allocate between development and income earning properties
- Limiting the type of legal entity that can form a REIT to only a trust company, as opposed to allowing other entities such as partnerships, and companies,
- We need to give time before REITS are required to list – they would be allowed to stay private for a few years before the requirement to list given that not all companies maybe comfortable with listing on day one, and,
- Minimum subscription amounts or offer parcels set at Kshs 0.1 mn for D-REITs and Kshs 5.0 mn for restricted I-REITs. The significant capital requirements still make REITs relatively inaccessible to smaller retail investors compared to other investment vehicles like unit trusts or government bonds, all of which continue to limit the performance of Kenyan REITs.
We expect Kenya’s Real Estate sector to remain on a growth trend, supported by: i) demand for housing sustained by positive demographics, such as urbanization and population growth rates of 3.7% p.a and 2.0% p.a, respectively, against the global average of 1.7% p.a and 0.9% p.a, respectively, as at 2024,, ii) activities by the government under the Affordable Housing Program (AHP) iii) heightened activities by private players in the residential sector iv) increased investment by local and international investors in the hospitality and industrial sector,v) improved infrastructure throughout the country. However, challenges such as rising construction costs, strain on infrastructure development (including drainage systems), high capital requirements for REITs, and existing oversupply in select Real Estate sectors will continue to hinder the sector’s optimal performance by limiting developments and investments.
Kenya is one of the fastest growing economies in Sub-Saharan Africa, having registered a growth rate of 4.9% in the first quarter of 2025. Despite being one of the fastest growing economies in Sub-Saharan Africa with a projected economic growth rate of 4.8%, above the region’s expected average of 3.7% in 2025, Kenya is grappling with a high debt burden, facing elevated risk of debt distress and significant challenges in managing its public debt, which has increased rapidly in recent years. As per the latest data from the Central Bank of Kenya (CBK), the total public debt stood at Kshs 11.5 tn as of May 2025, compared to Kshs 10.4 tn recorded in May 2024, equivalent to an 10.3% increase. Notably, external debt increased marginally by 3.9% during the period to Kshs 5.3 tn in May 2025 from the Kshs 5.1 tn in May 2024, partly attributable to the partial buyback of the USD 900.0 mn Eurobond in February 2025 through the issuance of a new USD 1.5 bn Eurobond. Similarly, domestic debt increased by 16.6% to Kshs 6.2 tn in May 2025, from Kshs 5.3 tn in May 2024, attributable to the increased inclination towards domestic financing amid lower interest rates and constrained access to external financing. Consequently, the debt to GDP ratio stood at 67.4% as of December 2024, 17.4% points higher than the International Monetary Fund (IMF) threshold of 50.0% for developing countries, albeit lower than the 73.4% recorded as of December 2023. The rising public debt has raised concerns about its sustainability and implications for fiscal and macroeconomic stability. Kenya’s debt levels remain high with high debt servicing costs as evidenced by the B-, Caa1 and B- credit ratings by S&P Global, Moody’s and Fitch credit agencies respectively, signaling high credit risk but with ability to still meet its financial commitments. However, recent policy actions have begun to positively shift the credit trajectory. Notably, on 29th January 2025, Moody’s affirmed its Caa1 credit rating on Kenya and revised the outlook from negative to positive, indicating that there is potential for Kenya’s credit rating to improve in the future on the back of improved revenue collection and prudent debt repayments. The February 2025 Eurobond buyback and new issue helped smoothen Kenya’s external debt maturity profile and increase investor confidence. Consequently, in this week’s topical, we shall focus on the current status of Kenya’s public debt as of May 2025. We shall also give our outlook on the country’s debt sustainability.
We have been tracking the evolution of the public debt and below are the most recent topicals we have done on Kenya’s debt:
- Review of Kenya’s Public Debt 2024 - In July 2024, we highlighted the status of Kenya’s public debt in the light of the withdrawal of the Finance Bill 2024 and an outlook on the country’s debt sustainability,
- Kenya’s Public Debt Review 2023 – In October 2023, we highlighted Kenya’s public debt situation and the need for prudent fiscal management and strategic planning to ensure that the debt remains sustainable and does not compromise the country’s economic prospects,
- Kenya's Public Debt Review 2023: Is Kenya's Public Debt Level Sustainable- In April 2023, we highlighted the state of affairs concerning the country’s public debt and concluded by discussing strategies that the government could implement in order to reduce the economic consequences of high debt levels as well as mitigate the high risk of debt distress,
- Kenya’s Public Debt 2022; Debt Service Coverage- In July 2022, In December 2016, we wrote about Kenya’s debt level, questioning its sustainability, and concluded that the government needed to reduce the amount of public debt, giving suggestions as to how this could be achieved, and,
- Kenya’s Public Debt: On a path to Distress?- In October 2021, we highlighted the state of affairs concerning the country’s public debt profile and levels and concluded that Kenya’s risk of debt distress remained elevated.
In this week's topical, we will focus on the current status of Kenya's public debt at the end of May 2025. We will examine the economic consequences of high debt levels and provide our outlook on the country's debt sustainability. Additionally, the report will compare Kenya's public debt situation with that of other Sub-Saharan countries using various indicators such as the debt-to-GDP ratio and the debt service-to-revenue ratio.
This we shall cover as follows;
- The Current State of Kenya’s Public Debt,
- Kenya’s Debt Servicing Cost,
- Economic Impact of Kenya’s High Debt Levels,
- Kenya’s Debt Sustainability Analysis and Projection,
- Comparative Analysis with Regional Peers, and,
- Policy Recommendations and Conclusion.
Section I: The Current State of Kenya’s Public Debt
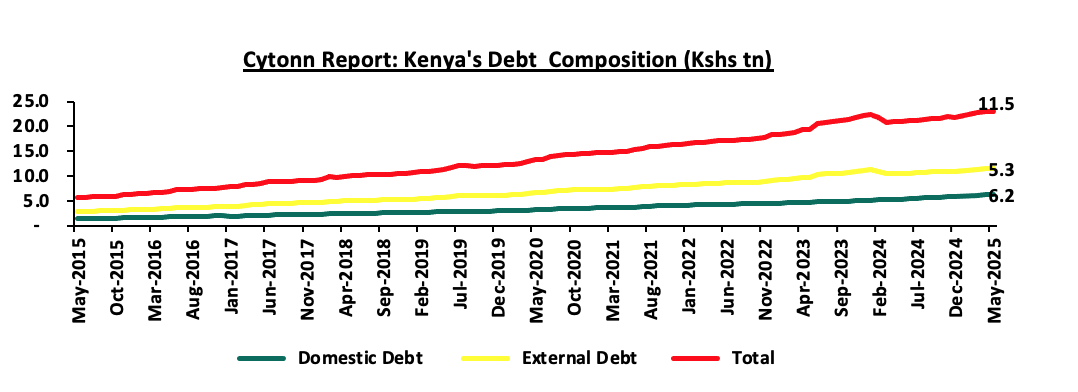
According to the Central Bank of Kenya (CBK) Weekly Bulletin Report, Kenya’s public debt reached Kshs 11.5 tn as of May 2025, marking a 10.3% increase from the Kshs 10.4 tn recorded in May 2024. Amidst the government’s fiscal consolidation efforts, the FY’2025/26 Budget Estimates reflect a faster 8.0% increase in revenue projections to Kshs 3.4 tn (equivalent to 17.5% of GDP), up from Kshs 3.1 tn in FY’2024/25 (equivalent to 17.9% of GDP), compared to a slower 7.1% increase in total expenditure projections to Kshs 4.3 tn (equivalent to 22.3% of GDP), from Kshs 4.0 tn (equivalent to 23.0% of GDP) in the FY’2024/25 Budget. These measures are aimed at stemming the escalation of debt accumulation and maintaining sustainable debt levels. Consequently, the estimated overall fiscal deficit level inclusive of grants reduced by 0.3% points to 4.8% of GDP, from the FY’2024/25 projection of 5.1% of GDP. However, we expect the government efforts to be impeded by the deteriorated macroeconomic environment as evidenced by the decline in Purchasing Manager's Index (PMI) to 48.6 in June 2025, from 49.6 in May 2025 and an average of 50.0 in H1’2025, from 50.5 in H1’2024, signaling a deterioration in the operating conditions across Kenya. This can be attributed to the recent political unrest in the country, in addition to the overall high cost of living. Additionally, the high fuel prices and slower economic growth is expected to stifle revenue collection. Below is a graph highlighting the trend in the Kenya’s debt to GDP ratio over the last 10 years:
Source: National Treasury, CBK
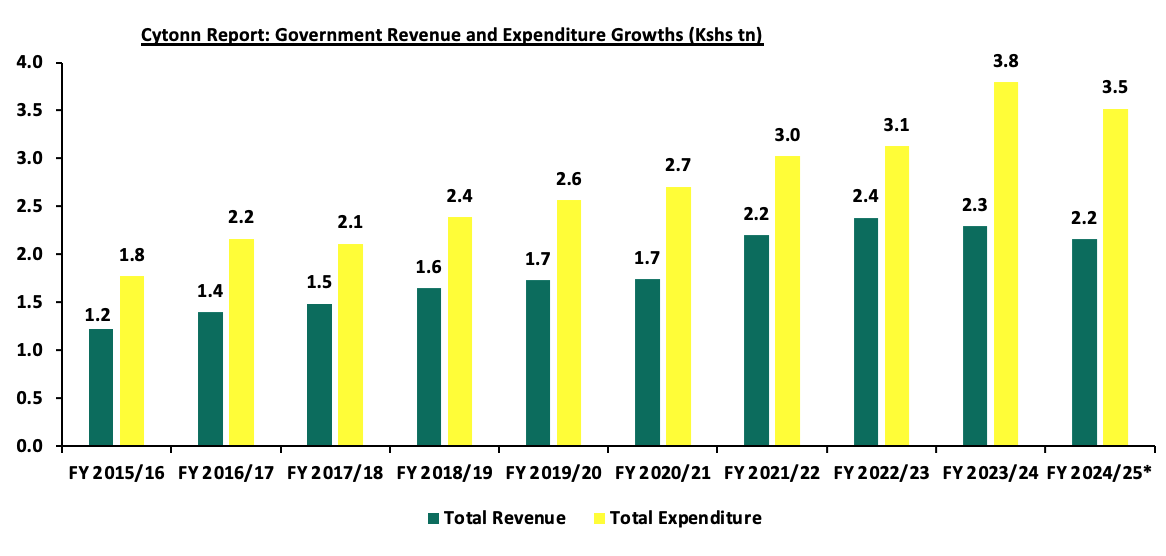
Kenya's debt levels have been rising due to persistent fiscal deficits, which have averaged 7.1% of GDP over the last 10 financial years. This increase is mainly attributed to sustained recurrent expenditures and debt servicing costs. Over this ten-year period, government revenue grew at a compound annual growth rate (CAGR) of 5.9%, reaching Kshs 2.2 tn by the end of the first eleven months of FY’2025/26, up from Kshs 1.2 tn by the end of FY‘2015/16. However, this revenue growth was outpaced by growth in government expenditure, which grew at a CAGR of 7.0%, reaching Kshs 3.5 tn by the end of the first eleven months of FY’2025/26, up from Kshs 1.8 tn in FY’2015/16. The chart below shows the growth in Kenya’s total revenue and expenditure in the last 10 fiscal years:
Source: Central Bank of Kenya, *data as of May 2025
- The Nature of Kenya’s Debt Composition (Domestic vs External)
Over the years, Kenya’s debt composition has been evenly distributed between domestic and external borrowing. However, from the beginning of 2023, there was a shift towards external borrowing, with the proportion of external debt against domestic debt standing at 54.7% to 45.3% in December 2023, compared to 51.1% to 48.9% over a similar period in 2022. This increase was partly attributed to the depreciation of the Kenya Shilling during that period, which increased the valuation of foreign currency-denominated debt. In 2024, the preference shifted towards domestic borrowing, with the proportion of external debt against domestic debt adjusting to 46.3% to 53.7% in December 2024, from 54.7% to 45.3% in December 2023. The shift was supported by currency appreciation in 2024, as evidenced by the 17.6% appreciation in the Shilling against the dollar which reduced the valuation of external debt, and the gradual easing of interest rates in H2’2024, which made domestic borrowing more attractive to the government. As of May 2025, the proportion of external debt against domestic debt stood at 46.1% to 53.9%. Notably, external debt increased at a 10-year CAGR of 12.2% to Kshs 5.3 tn as at May 2025, from Kshs 1.8 tn in May 2016, albeit lower than the 13.5% CAGR recorded by domestic debt to Kshs 6.2 tn as at May 2025 from Kshs 1.7 tn in May 2016. Consequently, the total public debt has increased at a 10-year CAGR of 12.9% to Kshs 11.5 tn as at May 2025, from the Kshs 3.4 tn recorded as at May 2016. Below is a graph highlighting the trend in the external and domestic debt composition over the last 10 years;
Source: National Treasury and Central Bank of Kenya
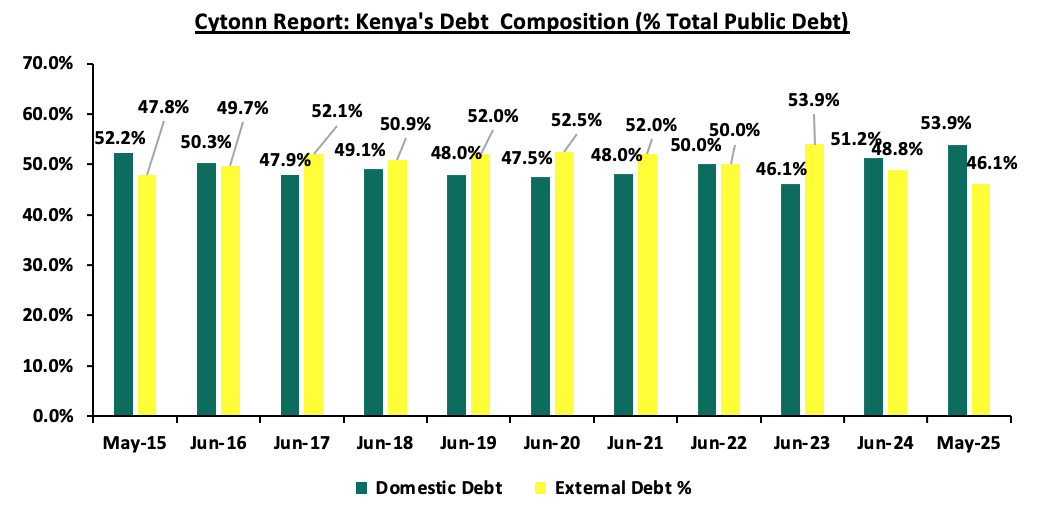
Below is a graph highlighting the composition of domestic and external debt as a percentage of total public debt over the last 10 years:
Source: National Treasury and Central Bank of Kenya
- Public Debt Mix by Holders
- External Debt Composition by Holders (Bilateral, Multilateral, and Commercial Banks)
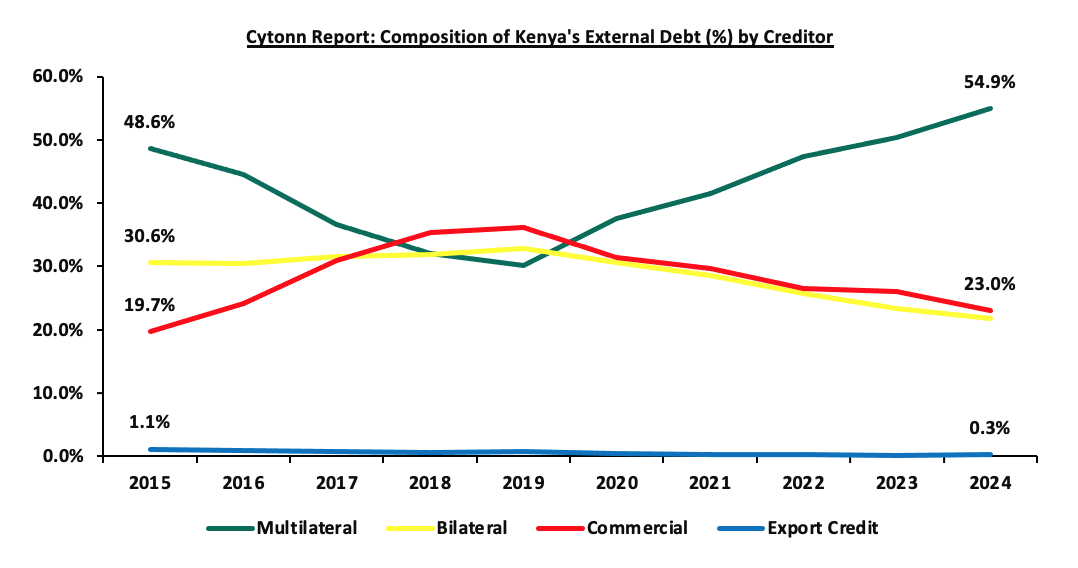
Kenya’s external debt stock is mainly composed of multilateral loans, bilateral loans and commercial loans. According to the CBK Quarterly Economic Review, in the second quarter of FY’2024/2025 ended in December 2024, Kenya’s exposure to multilateral loans recorded a 4.6% points increase to 54.9%, from 50.3% as at the end of December 2023. This was attributable to favourable terms offered in terms of low interest rates and longer repayment periods, when compared to bilateral loans and commercial loans. Notably, during the third quarter of FY’2024/25, Kenya was able to issue a new Eurobond worth USD 1.5 bn, aimed to facilitate the buyback of the USD 900.0 mn Eurobond originally issued in 2019, assuring foreign investors of the country’s broader plan to maintain debt sustainability and manage public debt efficiently. Despite, initial declines following the Eurobond buyback in February, the yields on the Eurobonds have once again shown volatility in recent months, indicating renewed investor concerns over Kenya’s economic stability and debt sustainability. This is attributable to perceived risks associated with Kenya’s economic environment, including fiscal deficits, debt sustainability concerns and the political unrest that continue to put pressure on the economy. The chart below shows external debt composition by creditors:
Source: National Treasury, CBK
It is key to note that:
- The portion of multilateral debt increased by 4.6% points to 54.9% in December 2024, from 50.7% recorded over a similar period in 2023, due to disbursements from IMF, USD 0 mn under the Extended Credit Facility arrangement (EFF/ECF) for budgetary support in October 2024. Notably, Bilateral debt decreased by 1.6% points to 21.8% in December 2024, from 23.4% in December 2023,
- Commercial debt as a percentage of external debt reduced by 3.1% points to 23.0% of total external debt in December 2024 from 26.1% in December 2023, mainly attributable to Kenya’s government shunning away from the more expensive debt due to the prevailing market conditions, and,
- According to the CBK Quarterly Economic Review as at December 2024, 62.0% of the external debt was US Dollar denominated contributing to the increasing debt servicing cost despite the stable and strengthened Kenyan Shilling, largely due to elevated global interest rates. The table below shows the currency composition of the external debt stock:
|
Cytonn Report: Currency composition of the External Debt Stock (%) |
||
|
Currency |
December-2023 |
December-2024 |
|
USD |
67.3% |
62.0% |
|
EUR |
21.4% |
24.8% |
|
Yuan |
5.1% |
5.3% |
|
Yen |
3.8% |
5.2% |
|
GBP |
2.2% |
2.5% |
|
Other Currencies |
0.2% |
0.2% |
Source: Central Bank of Kenya
- Domestic Debt Composition by Holders
Banking institutions make up for the highest percentage of domestic debt, accounting for 45.1% of government securities holdings as at 11th July 2025, largely unchanged from what was recorded at the end of the second quarter of FY’2024/25, with the slight decrease mainly attributed to the lower yields. Similarly, government securities holding by other domestic investors registered 0.3% points decrease to 12.9% as at 11th July 2025, from the 13.2% recorded at the end of December 2024. Notably, pension funds accounted for the second largest portion with 28.8% of holdings in government securities as at 11th July 2025, albeit 0.1% points lower than the 28.9% registered in December 2024. Below is a table of the composition of government domestic debt by holders:
|
Cytonn Report: Composition of Government Domestic Debt by Holder |
|||||||||||||
|
Domestic debt |
Dec-2014 |
Dec-2015 |
Dec-2016 |
Dec-2017 |
Dec-2018 |
Dec-2019 |
Dec-2020 |
Dec-2021 |
Dec-2022 |
Dec-2023 |
Dec-2024 |
Jul-2025 |
|
|
Banking institutions |
54.3% |
55.4% |
52.2% |
54.6% |
54.5% |
54.3% |
53.3% |
50.2% |
46.8% |
46.1% |
45.1% |
45.1% |
|
|
Insurance Companies |
9.9% |
8.4% |
7.3% |
6.4% |
6.1% |
6.4% |
6.4% |
6.8% |
7.4% |
7.2% |
7.3% |
7.2% |
|
|
Parastatals |
2.8% |
4.6% |
5.8% |
6.9% |
7.3% |
6.5% |
5.7% |
5.6% |
6.1% |
5.5% |
5.6% |
5.9% |
|
|
Pension Funds |
23.9% |
25.4% |
28.2% |
27.5% |
27.6% |
28.6% |
30.3% |
31.3% |
33.3% |
29.9% |
28.9% |
28.8% |
|
|
Other domestic investors |
9.0% |
6.2% |
6.5% |
4.6% |
4.6% |
4.2% |
4.3% |
6.1% |
6.4% |
11.3% |
13.2% |
12.9% |
|
|
TOTAL |
100.0% |
100.0% |
100.0% |
100.0% |
100.0% |
100.0% |
100.0% |
100.0% |
100.0% |
100.0% |
100.0% |
100.0% |
|
Source: Central Bank of Kenya
- GDP per Capita vs Debt per Capita
According to Central Bank data, Kenya’s Public Debt per Capita has increased at a 10-year CAGR of 11.1% to Kshs 193,597.9 in 2024, from Kshs 67,356.7 in 2015. Conversely, GDP per Capita has grown at a slower 10-year CAGR of 6.9% to Kshs 287,500.1 in 2024, from Kshs 146,939.1 in 2015. This discrepancy suggests that the rapid increase in public debt is not being matched by corresponding economic growth. The chart below compares Kenya’s GDP per capita to the debt per capita over the last 10 years:
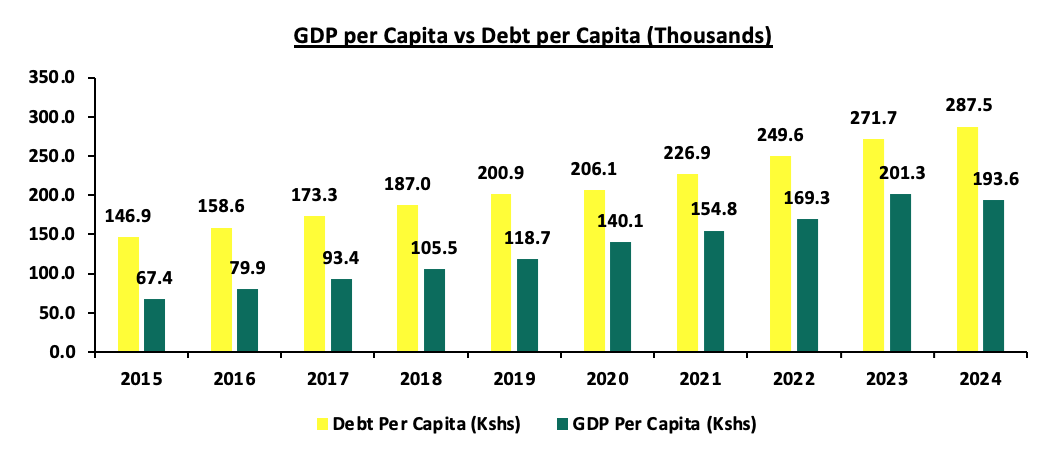
Source: World Bank, CBK
Factors that have accelerated the growth in Kenya’s Public debt;
- Fiscal Deficit – Kenya has witnessed a persistent fiscal deficit averaging at 7.1% of the GDP for the last 10 financial years and is projected to ease to 4.8% of the GDP for FY’2025/26, from the 5.1% estimated for FY’2024/25. According to the Budget Estimates for FY'2025/26 the approved budget for the FY’2025/26 is estimated to be Kshs 4.3 tn against a targeted revenue collection of Kshs 3.4 tn, hence the need to borrow an additional Kshs 0.6 tn domestically and Kshs 0.3 tn externally,
- Debt Servicing Costs – Debt servicing cost has been on the rise, with the debt service to revenue ratio averaging 50.7% over the last 10 financial years and standing at 67.1% as of May 2025. The rising debt servicing cost is attributed to the continuous accumulation of total public debt, resulting from the increased flow of international development assistance in the form of concessional loans, and,
- Guaranteed loans by the Government of Kenya – The guaranteed loans on state corporations put pressure on the need for excessive spending, despite poor performances by the said state corporations.
Section II: Kenya’s Debt Servicing Cost
According to the May 2025 Revenue and Net Expenditures Report for the FY’2024/25 by the National Treasury, the cumulative public debt servicing cost amounted to Kshs 1,448.1 bn which was 70.9% of the revised estimates II of Kshs 2,289.0 bn, and 77.4% of the prorated estimates of Kshs 1,871.9 bn. Notably, the Kshs 1,448.1 bn debt servicing cost was equivalent to 67.1% of the actual revenues of Kshs 2,157.8 bn collected as at the end of May 2025 and was 37.1% points above IMF’s recommended threshold of 30.0%. The sustained high debt service to revenue ratio above the recommended threshold is a worrying sign, with a large proportion of the government’s revenue being allocated to servicing debt rather than being available for other essential expenditures. A ratio of above 50.0% means that more than half of the government's revenue is being allocated to servicing debt which may leave limited fiscal space for public investments, social programs, and other critical government functions, which are essential for the long-term well-being of the country, as a significant part of the budget is pre-committed to debt repayment. Below is a chart showing the debt service to revenue ratio for the last ten fiscal years:
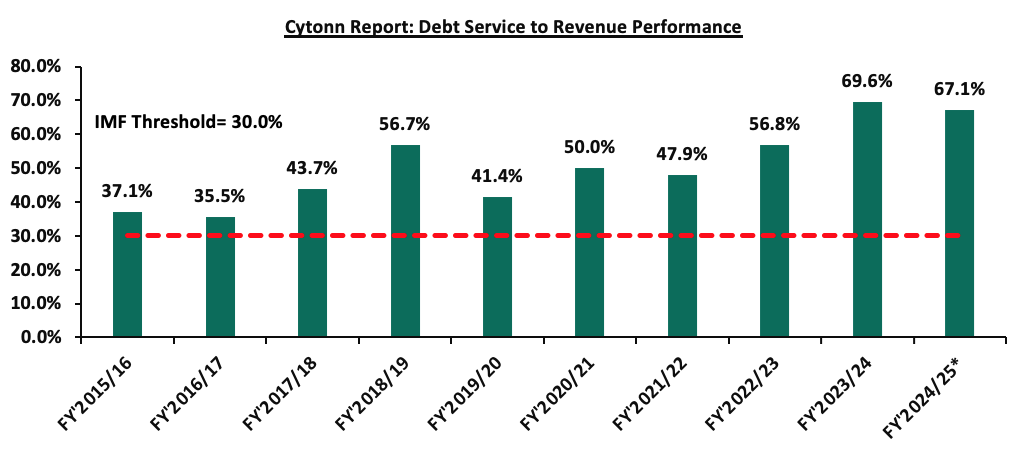
Source: National Treasury, FY’2024/25* data as of May 2025
Kenya’s debt servicing costs have continued to increase over time growing at a 10-year CAGR of 15.8% to Kshs 1,854.0 bn in FY’2024/25, from Kshs 427.6 bn in FY’2015/16. The graph below compares the domestic debt servicing cost to the external debt servicing cost over the last ten fiscal years:
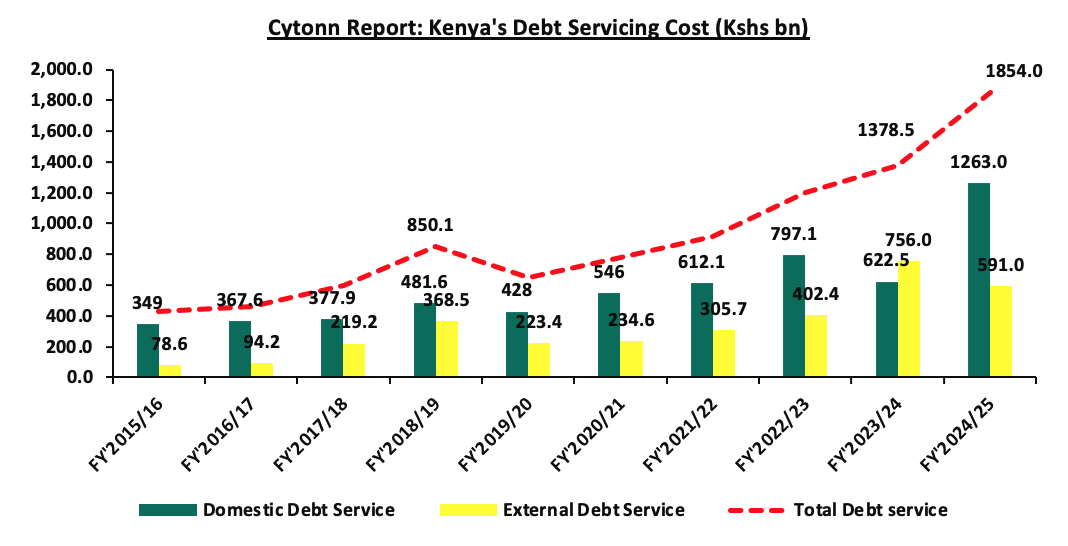
Source: National Treasury
Section III: Economic Consequences of High Debt Levels
The COVID-19 pandemic left numerous sub-Saharan African countries grappling with a fragile global economy, escalating prices, costly loans, and a high cost of living. Many of these nations continue to face challenges like high inflation, elevated interest rates, currency fluctuations, and political instability. Consequently, many developing countries, including Kenya, have had to increase borrowing to shield their economies from additional economic shocks caused by internal geopolitical tensions and supply chain disruptions amid emerging global conflicts. However, this ongoing borrowing has led to significant debt accumulation, posing several implications for the Kenyan economy.
- Impact on currency value-High debt levels can lead to a depreciation of the national currency. Investors may lose confidence in the country's ability to manage its debt, leading to capital flight and a weaker currency. A depreciated currency can increase the cost of imports, contributing to inflationary pressures,
- Increased Debt Servicing Costs – High debt levels have led to increased costs of debt servicing given that a significant portion of the debt is in foreign currencies despite the fact that the Kenyan Shilling has been stronger and stable. The government has had to increase taxes and cut spending in other areas to meet its debt obligations and the conditions set by multilateral lenders such as the IMF,
- Higher Borrowing Costs on New Loans – Given the country’s high levels of debt, lenders perceive Kenya’s credit environment to be riskier, therefore demanding higher interest rates for new borrowing. This makes it more expensive for the government to finance its operations and investments,
- Reduced Fiscal Space – High debt levels tend to limit a government’s fiscal space, or its ability to respond to economic shocks with fiscal policy. This is because a large portion of the government’s budget gets tied up in debt servicing, leaving less money for other expenditures and development,
- Crowding Out of the Private Sector – Because of the increased domestic borrowing, the government crowds out the private sector by driving up interest rates in the economy thus making it difficult for both businesses and individuals to borrow, and,
Section IV: Kenya’s Debt sustainability Analysis and Outlook
The country’s risk of debt distress remains elevated as evidenced by the high debt service to revenue ratio of 67.1% as of May 2024. Additionally, Kenya’s debt to GDP ratio currently stood at 67.4% as of December 2024, 17.4% points above IMF’s recommended threshold of 50.0% for developing countries. Notably, Kenya’s public debt recorded a 5-year CAGR of 9.0% to Kshs 11.5 tn as of May 2025, outpacing the economic growth’s 5-year average of 4.7% as of March 2025, with the International Monetary Fund (IMF) projecting Kenya’s 2025 GDP growth to come in at 4.8% as of April 2025, a downward revision from its projection of 5.0% made in October 2024 as a result of impact of US tariffs through direct and indirect trade linkage spillovers. The persistent fiscal deficits resulting from the revenue-expenditure mismatch continue to hamper fiscal consolidation efforts as revenue continues to lag behind expenditure.
Kenya’s debt levels remain high with high debt servicing costs as evidenced by the B-, Caa1 and B- credit ratings by S&P Global, Moody’s and Fitch credit agencies respectively, signaling high credit risk but with ability to still meet its financial commitments. While Kenya still faces elevated credit risk, recent policy actions have begun to positively shift the credit trajectory. The February 2025 Eurobond buyback and new issue helped smoothen Kenya’s external debt maturity profile and increase investor confidence. Notably, on 29th January 2025, Moody’s affirmed its Caa1 credit rating on Kenya and revised the outlook from negative to positive, indicating that there is potential for Kenya’s credit rating to improve in the future. On January 31st 2025, Fitch Rating’s affirmed Kenya’s credit score of B- while maintaining a stable outlook, while S&P Global Ratings affirmed Kenya’s B- credit rating with a stable outlook on 24th February 2025. The positive credit outlook from Moody’s, along with stable ratings from Fitch and S&P, reflecting an improvement. However, maintaining this trajectory will depend on continued fiscal discipline, prudent debt management, and a careful balance between external and domestic borrowing to avoid overexposure to foreign exchange risk. Below is a summary of the credit rating on Kenya by various rating agencies;
|
Cytonn Report: Kenya Credit Rating Agencies Ratings |
|||||
|
Rating Agency |
Previous Rating |
Previous Outlook |
Current Rating |
Current Outlook |
Date Released |
|
Moody's Rating |
Caa1 |
Negative |
Caa1 |
Positive |
29th January, 2025 |
|
Fitch Ratings |
B- |
Stable |
B- |
Stable |
31st January 2025 |
|
S&P Global |
B- |
Stable |
B- |
Stable |
24th February 2025 |
Source: Fitch Ratings, S&P Global
There has been a notable increase in revenue collection, with the government meeting its targets for the recently ended FY’2024/25. Revenue collection amounted to Kshs 2.6 tn, achieving 100.6% of the tax revenue target of Kshs 2.6 tn. However, with the persistent fiscal deficit and tough macro-economic environment in the country, the need for borrowing remains. The table below presents the trend of both expenditure and revenue growth over the l years and projections in the medium term.
|
Cytonn Report: Public Debt (Kshs tn) |
|||||||
|
FY'2019/20 |
FY'2020/21 |
FY'2021/22 |
FY2022/23 |
FY2023/24 |
FY2024/25 |
**FY2025/26 |
|
|
Cumulative Domestic Debt |
3.2 |
3.7 |
4.3 |
4.8 |
5.4 |
6.1 |
6.4 |
|
Cumulative External Debt |
3.4 |
3.8 |
4.3 |
5.4 |
5.2 |
5.2 |
6.0 |
|
Total |
6.5 |
7.5 |
8.6 |
10.3 |
10.6 |
11.4 |
12.4 |
|
Expenditure |
2.6 |
2.8 |
3.0 |
3.2 |
3.6 |
3.5 |
4.3 |
|
Revenue Collected |
1.6 |
1.6 |
1.9 |
2.1 |
2.6 |
2.6 |
3.4 |
|
Budget Deficit |
1.0 |
1.2 |
1.1 |
1.1 |
1.0 |
0.9 |
0.9 |
|
Domestic Borrowings |
0.5 |
0.6 |
0.6 |
0.5 |
0.6 |
0.6 |
0.6 |
|
External Borrowings |
0.3 |
0.3 |
0.1 |
0.3 |
0.3 |
0.3 |
0.3 |
|
Total |
0.8 |
1.0 |
0.7 |
0.8 |
0.9 |
0.9 |
0.9 |
|
Domestic debt service |
0.4 |
0.5 |
0.6 |
0.8 |
0.6 |
1.2 |
1.1 |
|
External debt Service |
0.2 |
0.2 |
0.3 |
0.4 |
0.8 |
0.6 |
0.7 |
|
Total Debt Service |
0.7 |
0.8 |
0.9 |
1.2 |
1.4 |
1.8 |
1.8 |
|
Debt service to Revenue |
41.4% |
50.0% |
47.9% |
56.8% |
69.6% |
62.7% |
64.4% |
Provisional data, **Projected data
Source: National Treasury (Annual Public Debt Management Report and Budget Policy Statement)
Key take outs;
- Debt servicing costs are expected to remain high in the FY’2025/26 due to the need for more borrowings. The high borrowings are expected to be channelled to debt repayment, financing the persistent fiscal deficit. Our View: Debt service is projected to grow in FY’2025/26 with debt servicing costs remaining high due to the continued local and external debt maturities,
- Revenue is expected to grow at a 5-year CAGR of 11.9% to Kshs 3.4 tn by the end of FY’2025/26, from Kshs 1.9 tn in FY’2021/22, attributable to the government’s focus to increased tax revenues. Due to the unfavourable business climate, combined with high cost of living in the country, it is anticipated that revenue collections may fail to meet the target. Consequently, the success of revenue collection is heavily reliant on the country’s economic performance and how quickly the business environment improves,
- Compared to revenue, expenditure is expected to grow at a relatively slower 5-year CAGR of 7.2% to Kshs 4.3 tn by the end of FY’2025/26, from 3.0 tn recorded in FY’2021/22, on the back of increased recurrent expenditure and persistent current account deficit, and,
- The budget deficit is expected to narrow in the projected years as revenue is projected to increase at a faster rate compared to expenditure. The persistent budget deficit in the projected financial years, is an indication of the need for further borrowing, impeding the government’s in managing the current debt level.
It is clear that the government faces challenges on how they shall finance their operations in the next couple of months as the debt servicing is high and the economic activity is much slower. However, the KRA collections for the FY’2024/25 amounted to Kshs 2.6 tn, achieving 100.6% of the tax revenue target of Kshs 2.6 tn, mainly attributed to the reduced inflation averaging at 4.5% in 2024, compared to 7.7% in 2023 coupled with the stable and stronger Shilling which boosted overall economic activity. Additionally, enhanced tax compliance through digital tools like eTIMS helped expand the tax base. Despite improved revenue collection, the government continues to face external repayment pressures amid tight global financial conditions, with 62.0% of external debt denominated in USD as of December 2024, exposing Kenya to significant exchange rate risks. Persistent fiscal deficits and a growing reliance on short-term domestic borrowing further strain the government’s ability to manage debt sustainably, raising concerns about crowding out private sector credit and elevating future refinancing risks. Consequently, the government’s capacity to meet upcoming maturities and fulfill its debt obligations remains a major concern.
Section V: Comparison with other African countries
Kenya's elevated debt situation is part of a broader trend seen across the sub-Saharan region, where debt levels remain high. According to World Bank’s International Debt Statistics, Africa's debt-to-GDP ratio reached 71.7% at the end of 2023, with 75.0% of this debt being long-term. Notably, 69.0% of the continent's debt is concentrated in just ten countries. South Africa leads with 14.0% of Africa's total debt, followed closely by Egypt at 13.0%. Kenya accounts for 4.0% of the continent's debt, while Senegal, Cote d’Ivoire, and Ghana each hold between 3.0% and 4.0%. This concentration of debt among a few countries highlights the significant financial pressures faced by these economies within the region. The graph below highlights the composition of the debt by the top 10 countries as a percentage of total region debt:
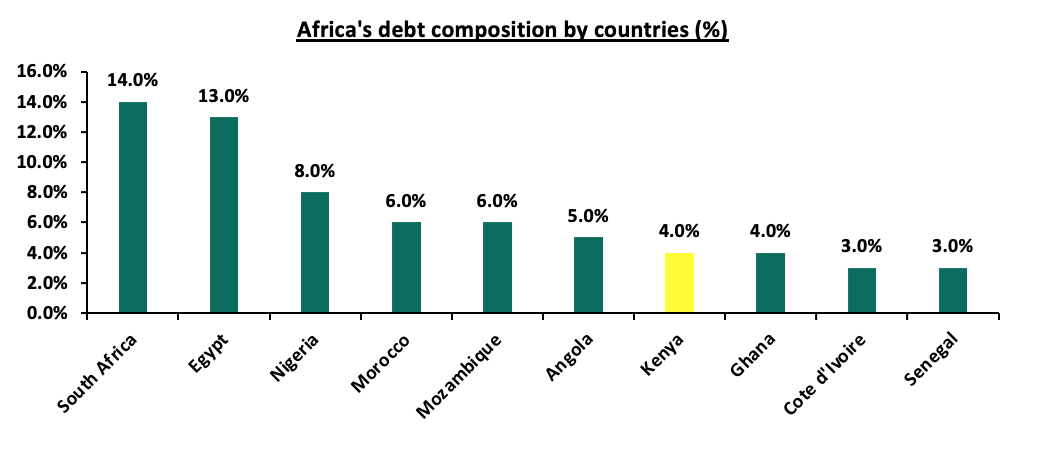
Source: Afrexim Bank Research
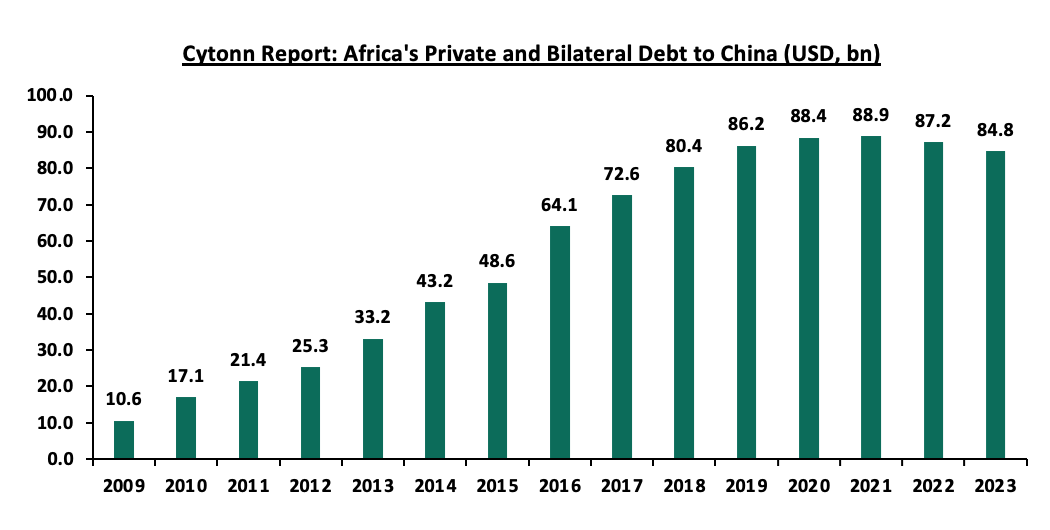
Currently, China makes up the largest portion of Africa’s debt stock, and is Africa’s biggest bilateral lender. As of 2023, China held almost USD 84.8 bn of Africa’s external debt (Private and bilateral debt). The graph below shows Africa’s debt to China in the last 15 years (Private and Bilateral):
Source: International debt statistics
Additionally, Africa’s debt to service ratio came in at 19.6% in 2023 according to the African Export-Import bank report, with 34 countries recording an increase in the ratio during the year. A high debt service to revenue ratio indicates vulnerability of the country and increased unsustainability of the country’s debt. The table below summarizes debt indicators for select countries in the region as of 2023:
|
Cytonn Report: Select African Countries Debt Ratios |
||||
|
|
Debt to GDP* |
Debt service to revenue |
Tax Revenue to GDP |
Expenditure to GDP |
|
Zambia |
114.9% |
14.0% |
16.8% |
14.3% |
|
Senegal |
111.4% |
30.5% |
18.7% |
16.3% |
|
Mauritius |
83.4% |
11.8% |
19.0% |
15.9% |
|
South Africa |
79.6% |
21.3% |
25.9% |
19.2% |
|
Rwanda |
77.6% |
15.9% |
15.0% |
17.0% |
|
Kenya |
68.3% |
62.6% |
15.2% |
24.6% |
|
Ghana |
66.4% |
43.5% |
11.3% |
6.7% |
|
Uganda |
54.0% |
18.4% |
12.5% |
9.8% |
|
Nigeria |
52.5% |
66.9% |
7.0% |
12.0% |
|
Tanzania |
47.1% |
44.6% |
11.7% |
8.3% |
|
Ethiopia |
41.8% |
31.0% |
6.2% |
7.4% |
*2025 IMF Data, Source: IMF, World bank, Afrexim Bank
From the table above,
- Zambia has the highest debt to GDP ratio of the select sub-Saharan region countries, at 114.9%, while Ethiopia has the least ratio at just 41.8%. At 68.3%, Kenya’s debt-to-GDP ratio ranks sixth of the select countries. Of these select countries, only two have a ratio below the IMF recommended threshold of 50.0%,
- On Debt service to Revenue ratio, which measures the amount of a country’s revenue that goes into payment of debt, Nigeria had the highest ratio at 66.9%, followed closely by Kenya at 62.6%. Mauritius had the lowest ratio, at 11.8%, indicating much more stability and sustainability of the country’s debt,
- South Africa recorded the highest tax revenue to GDP ratio, at 25.9%. This ratio indicates the level of taxation in a country relative to its GDP. A high ratio could indicate the country has a larger fiscal ability and can meet most of its requirements efficiently. Kenya’s ratio stood at 15.2%, while Ethiopia recorded the lowest ratio at 6.2%, and,
- On government spending to GDP ratio, Kenya led at 24.6%. This ratio measures the size of a government's expenditures relative to the overall economic output of a country. Kenya’s high ratio indicates that our government plays a larger role in the economy as compared to the other countries, with significant public sector activities and social services.
Africa’s return to the Eurobond market in 2024 and early 2025 has been marked by strong investor appetite and improving sentiment. Ivory Coast, Benin, Kenya, Senegal, and Cameroon collectively raised over USD 6.3 bn, with all issuances oversubscribed, driven by yield-seeking investors and positive regional recovery prospects. Notable deals included Ivory Coast’s USD 2.6 bn dual-tranche bond and Kenya’s USD 1.5 billion Eurobond used for a 2027 buy-back. Cameroon’s USD 550 mn issuance in July 2024 became the most expensive in recent years, with a 10.8% yield. By June 2025, bond yields declined across most issuers, including Kenya, Benin and Ivory Coast reflecting easing inflation, currency stability, and stronger investor confidence. This trend highlights improved market access for African sovereigns, though borrowing costs remain high for fiscally riskier nations like Nigeria, where the yield edged up slightly to 9.1%.
Section VI: Conclusions and Recommendations
Kenya's public debt situation underscores the need for prudent fiscal management and strategic planning to ensure that the debt remains sustainable and does not compromise the country's economic prospects. It is essential to strike a balance between funding the government's development projects and maintaining debt at manageable levels. To address the challenges posed by the high public debt in Kenya, here are some actionable steps that the Kenyan government can consider:
- Enhanced Debt Management – Implement a comprehensive debt management strategy that encompasses short, medium, and long-term objectives which regularly assess the cost and risk profile of the debt portfolio as well as Prioritizing refinancing high-cost debt with lower-cost alternatives to reduce debt service obligations,
- Capital Markets Reform – The government should strengthen the regulatory and supervisory framework for capital markets and improve the efficiency, stability, and inclusiveness of the financial sector, especially the markets for stocks, bonds, and other securities to improve capital formation and foreign direct investments (FDIs) flowing into the country,
- Improve Ease of Doing Business – The government should improve the competitiveness and attractiveness of the country for investors and entrepreneurs. This can be achieved by simplifying and streamlining the procedures and requirements for starting, operating, and closing a business. Also Promoting a conducive and competitive business environment that fosters innovation, productivity, and growth. These measures will spur business growth and improve the country’s production thus allowing the government to collect more revenue,
- Focus on Areas of Strength Such as Tourism and Diaspora - Kenya's tourism sector is a significant contributor to the economy, providing jobs, generating foreign exchange, and boosting infrastructure development. Additionally, the Kenyan diaspora plays a crucial role in remittances, which are a vital source of foreign currency. By investing in the tourism sector and fostering stronger ties with the diaspora, government can enhance its appeal as a premier travel destination and create favourable conditions for diaspora remittance flow to help diversify income sources and reduce reliance on debt.
- Fiscal Consolidation – High fiscal deficit is attributable to higher growth in expenditure volumes relative to revenue collections, creating the need for excessive borrowing levels. The government needs to implement robust fiscal consolidation through expenditure reduction by introducing austerity measures and limit capital expenditure to projects with either high social impact or have a high Economic Rate of Return (ERR), and high economic benefits outweighing costs,
- Investment in Productive Sectors – Direct investments toward sectors that have the potential for high economic growth and job creation, such as infrastructure, agriculture, and manufacturing as well as developing targeted incentive programs to attract both domestic and foreign investments in these sectors,
- Public-Private Partnerships (PPPs) – The government should identify infrastructure projects suitable for PPP arrangements and incentivize the private sector to participate in such projects, thus sharing the financial burden and transferring project risk to the private sector,
- Improving the Country’s Exports – The government should formulate export and manufacturing favourable policies to improve the current account. This would stabilize the exchange rate and stop our foreign-denominated debt from increasing as the shilling depreciates,
- Efficient Tax Collection – The government should strengthen tax collection and administration to improve revenue collection without increasing tax rates significantly. This can be done through broadening the tax base while ensuring tax policies are equitable and do not disproportionately burden the lower-income segments of the population,
- Transparency and Accountability: Maintain transparency in the utilization of borrowed funds and ensure that loans are allocated to projects with measurable returns. Better governance will help to reduce wastage and corruption levels that had impeded proper allocation of funds towards designated projects, resulting in misappropriation of funds,
- Cut Corruption and Wastage: Corruption and wastage of resources have long been significant impediments to Kenya's economic development. Addressing these issues is crucial for improving public trust and ensuring that borrowed funds and public revenues are used effectively, leading to better outcomes in public service delivery and infrastructure development, ultimately contributing to a more sustainable debt position, and,
- Monitoring and Reporting: Establish mechanisms for continuous monitoring of debt levels and fiscal health, with regular reporting to stakeholders and the public.
Addressing the public debt issue is a collective effort that requires cooperation among policymakers, stakeholders, and the general public, all working together to secure the country’s financial future and prosperity.
Disclaimer: The views expressed in this publication are those of the writers where particulars are not warranted. This publication, which is in compliance with Section 2 of the Capital Markets Authority Act Cap 485A, is meant for general information only and is not a warranty, representation, advice or solicitation of any nature. Readers are advised in all circumstances to seek the advice of a registered investment advisor.

- Talk to us
- Kenya
- P.O Box 20695 - 00200, Nairobi, Kenya
- Cell +254709101200
- Tel +254709101200
- WhatsApp +254741676635
- United States
- +254709101200
- DOWNLOAD OUR APP
-


- Kenya
- 8th Floor, Pinetree Plaza, Kaburu Drive, Ngong Road, Nairobi, Kenya
- USA
- Suite 1150, 1775 Eye Street NW, USA, Washington DC 20006, USA
- Investments
- High Yield
- Private Equity
- Real Estate
- Real Estate
- RiverRun Estates
- Cytonn Towers
- The Ridge
- Taraji Heights
- The Alma