Cytonn Monthly - August 2025
By research team, Aug 31, 2025
Executive Summary
Fixed Income
During the month of August 2025, T-bills were undersubscribed, with the overall average subscription rate coming in at 93.7%, albeit lower than the subscription rate of 117.1% recorded in July 2025. The overall average subscription rates for the 91-day, 182-day and 364-day papers decreased to 116.6%, 72.7%, 105.5% from 156.5%, 77.4% and 141.1% recorded in July 2025 respectively. The average yields on the government papers were on a downward trajectory during the month, with the average 91-day, 182-day, and 364-day papers yields decreasing by 8.3 bps, 24.2 bps, and 7.4 bps to 8.1%, 8.2% and 9.6% respectively, from an average of 8.1%, 8.4% and 9.7% recorded the previous month. For the month of August, the government accepted a total of Kshs 86.7 bn of the Kshs 89.9 bn worth of bids received in T-Bills, translating to an acceptance rate of 96.4%, compared to an acceptance rate of 83.7% in the month of July;
During the week, T-bills were oversubscribed for the second time in two weeks, with the overall subscription rate coming in at 133.5%, higher than the subscription rate of 113.5% recorded the previous week. Investors’ preference for the shorter 91-day paper persisted, with the paper receiving bids worth Kshs 20.0 bn against the offered Kshs 4.0 bn, translating to a subscription rate of 499.2%, significantly higher than the subscription rate of 194.3%, recorded the previous week. The subscription rates for the 182-day paper decreased to 18.0% from the 120.8% recorded the previous week while the 364-day paper decreased to 102.5% from the 73.9% recorded the previous week. The government accepted a total of Kshs 31.9 bn worth of bids out of Kshs 32.0 bn bids received, translating to an acceptance rate of 99.6%. The yields on the government papers were on a downward trajectory with the yields on the 182-day paper decreasing the most by 2.1 bps to 8.05% from the 8.07% recorded the previous week. The yields on the 91-day paper and 364-day paper decreased by 0.01 bps and 0.4 bps to 7.99% and 9.56% from the 8.01% and 9.57% respectively recorded the previous week;
Additionally, August 2025 bonds were oversubscribed, with the overall average subscription rate coming in at 387.1%, higher than the average subscription rate of 153.8% recorded in July 2025. The reopened bonds IFB1/2018/015 and IFB1/2022/019 with tenors to maturity of 7.6 years and 15.6 years respectively and fixed coupon rates of 12.5% and 13.0% respectively, received bids worth Kshs 323.4 bn against the offered Kshs 90.0 bn translating to an oversubscription rate of 359.4%. The government accepted bids worth Kshs 95.1 bn, translating to an acceptance rate of 32.4%, with the average accepted yields coming at 13.0% and 14.0% for the IFB1/2018/015 and IFB1/2022/019 respectively. Also, there was a tap sale of IFB1/2018/015 and IFB1/2022/019 with tenors to maturity of 7.6 years and 15.6 years respectively and a fixed coupon rate of 12.5% and 13.0% respectively, receiving bids worth Kshs 130.3 bn and Kshs 77.1 bn against the offered Kshs 50.0 bn translating to an oversubscription of 414.9%. The government accepted bids worth Kshs 128.0 and Kshs 51.8 bn for IFB1/2018/015 and IFB1/2022/019 respectively. For the month of August, the government accepted a total of Kshs 274.8 bn of the Kshs 530.9 bn worth of bids received in T-Bonds, translating to an acceptance rate of 57.5% compared to an acceptance rate of 87.4% in the month of July;
In the primary bond market, the government is looking to raise Kshs 40.0 bn through the reopened bonds; FXD1/2018/020 and FXD1/2022/025 and Kshs 20.0 bn through the reopened SDB1/2011/030 with fixed coupon rates of 13.2%, 14.2% and 12.0% respectively and tenors to maturity of 12.5 years, 22.2 years and 15.5 years respectively. The period of sale for the three bonds opened on Tuesday, 26th August 2025 and will close on 17th September 2025 for FXD1/2018/020 and FXD1/2022/025, while for SDB1/2011/030, it will close on 3rd September 2025. Our bidding ranges for FXD1/2018/020, FXD1/2022/025 and SDB1/2011/030 are 13.25%-13.55%, 13.75%-14.50% and 13.15%-13.65% respectively.
Equities
During the month of August 2025, the equities market was on an upward trajectory, with NSE 20 gaining the most by 11.2%, while NSE 10, NASI and NSE 25 gained by 8.3%, 7.7% and 7.5% respectively. The equities market positive performance was driven by gains recorded by large-cap stocks such as KCB, DTB-K and Equity of 14.5%, 12.9%, and 10.9% respectively. The monthly performance was however weighed down by losses recorded by large cap stocks such as NCBA Bank of 3.0%.
During the week, the equities market was on an upward trajectory, with NSE 20 gaining the most by 3.2% while NASI, NSE 25 and NSE 10 gained by 1.5%,1.4% and 1.4% respectively, taking the YTD performance to gains of 38.2%, 37.7%, 28.8% and 28.5% for NSE 20, NASI, NSE 10 and NSE 25 respectively. The week on week equities market performance was driven by gains recorded by large-cap stocks such as NCBA Bank, Coop Bank and DTB-K Bank of 3.2%, 2.6%, and 2.3% respectively. The performance was however weighed down by losses recorded by large-cap stocks such as BAT and Stanbic Bank of 3.1% and 0.7% respectively;
Additionally, in the regional equities market, the East African Exchanges 20 (EAE 20) share index gained by 0.8% to 99.7 from 99.4 recorded the previous week, attributable to gains recorded by large cap stocks such as Bank of Baroda Uganda, Quality Chemicals Industry Limited, and MTN Uganda of 5.4%, 4.9% and 4.2% respectively. However, the performance was weighed down by the losses recorded by large cap stocks such as CRDB Bank, Tanzania Breweries Limited and Tanzania Cigarette Corporation of 4.0%, 1.4% and 1.4% respectively;
During the week, NCBA group released their H1’2025 financial results highlighting that their core earnings per share increased by 12.6% to Kshs 6.7, from Kshs 6.0 in H1’2024, mainly driven by the 12.7% increase in total operating income to Kshs 35.3 bn, from Kshs 31.4 bn in H1’2024, which outpaced the 13.5% increase in total operating expenses to Kshs 21.8 bn, from Kshs 19.2 bn in H1’2024;
During the week, HF Group released their H1’2025 financial results highlighting the 134.5% increase in Profit After Tax to Kshs 0.6 bn from Kshs 0.3 bn in H1’2024, supported by a 53.3% growth in net interest income to Kshs 2.0 bn from Kshs 1.3 bn in H1’2024 and a 17.9% increase in non-interest income to Kshs 0.8 bn from Kshs 0.7 bn in H1’2024
During the week, Britam Holdings released their H1’ 2025 results. Britam’s Profit After Tax (PAT) decreased by 20.7% to Kshs 1.7 bn, from Kshs 2.2 bn recorded in H1’2024.The performance was mainly driven by the 39.4% decrease in net insurance income to Kshs 1.3 bn from Kshs 2.1 bn recorded in H1’2024 coupled with the 29.7% increase in net insurance and finance expenses to Kshs 16.0 bn from the Kshs 12.3 bn recorded in H1’2024;
During the week, CIC Group released their H1’2025 results. CIC’s Profit After Tax decreased by 10.1% to Kshs 0.6 bn in H1’ 2025, from Kshs 0.7 bn recorded in H1’2024. The performance was mainly driven by a significant 87.7% decrease in net insurance service revenue to Kshs 0.1 bn in H1’2025, from Kshs 1.0 bn in H1’2024, attributable to the 23.4% increase in insurance service expenses to Kshs 12.8 bn in H1’2025, from Kshs 10.4 bn in H1’2024. The performance was, however, supported by a 35.7% increase in net investment income to Kshs 2.7 bn in H1’2025 from Kshs 1.8 bn in H1’2024;
During the week, Jubilee Holdings Limited released their H1’2025 results. Jubilee’s Profit After Tax (PAT) increased by 21.7% to Kshs 3.1 bn, from Kshs 2.5 bn recorded in H1’2025. The performance was mainly driven by a 32.6% increase in Insurance Services Revenues to Kshs 16.7 bn, from Kshs 12.6 bn in H1’2024, but was however weighed down by the 36.6% increase in Insurance Services Expenses to Kshs 15.4 bn in H1’2025, from Kshs 11.3 bn in H1’2024;
During the week, Kenya Re corporation released their H1’2025 results, recording an 49.5% increase in Profit After Tax to Kshs 1.6 bn, from the Kshs 1.1 bn recorded in H1’2024. The performance was mainly driven by a 18.2% decrease in Insurance service expense to Kshs 5.4 bn from Kshs 6.6 bn in H1’2024 which outpaced the 14.8% decrease in Insurance revenue to Kshs 6.3 bn from Kshs 7.4 bn in H1’2024
Real Estate
During the week, the Kenya National Bureau of Statistics (KNBS) released the Leading Economic Indicators (LEI) June 2025Reports, which highlighted the performance of major economic indicators.
During the week, Parliament approved the Affordable Housing Regulations, 2025, paving the way for Kenyans to access loans of up to Kshs 4.0 mn from the Affordable Housing Fund for the development of rural housing units. Anchored in the Affordable Housing Act, 2024, the regulations seek to expand the government’s housing agenda beyond major cities by providing affordable credit solutions for households that have traditionally been excluded from the mortgage market.
On the Unquoted Securities Platform, Acorn D-REIT and I-REIT traded at Kshs 27.4 and Kshs 23.2 per unit, respectively, as per the last updated data on 15th August 2025. The performance represented a 37.0% and 16.0% gain for the D-REIT and I-REIT, respectively, from the Kshs 20.0 inception price. Additionally, ILAM Fahari I-REIT traded at Kshs 11.0 per share as of 15th August 2025, representing a 45.0% loss from the Kshs 20.0 inception price.
Investment Updates:
- Weekly Rates: Cytonn Money Market Fund closed the week at a yield of 13.18 % p.a. To invest, dial *809# or download the Cytonn App from Google Play store here or from the Appstore here;
- We continue to offer Wealth Management Training every Tuesday, from 7:00 pm to 8:00 pm. The training aims to grow financial literacy among the general public. To register for any of our Wealth Management Trainings, click here;
- If interested in our Private Wealth Management Training for your employees or investment group, please get in touch with us through wmt@cytonn.com;
- Cytonn Insurance Agency acts as an intermediary for those looking to secure their assets and loved ones’ future through insurance namely; Motor, Medical, Life, Property, WIBA, Credit and Fire and Burglary insurance covers. For assistance, get in touch with us through insuranceagency@cytonn.com;
- Cytonn Asset Managers Limited (CAML) continues to offer pension products to meet the needs of both individual clients who want to save for their retirement during their working years and Institutional clients that want to contribute on behalf of their employees to help them build their retirement pot. To more about our pension schemes, kindly get in touch with us through pensions@cytonn.com;
Hospitality Updates:
- We currently have promotions for Staycations. Visit cysuites.com/offers for details or email us at sales@cysuites.com;
Money Markets, T-Bills Primary Auction:
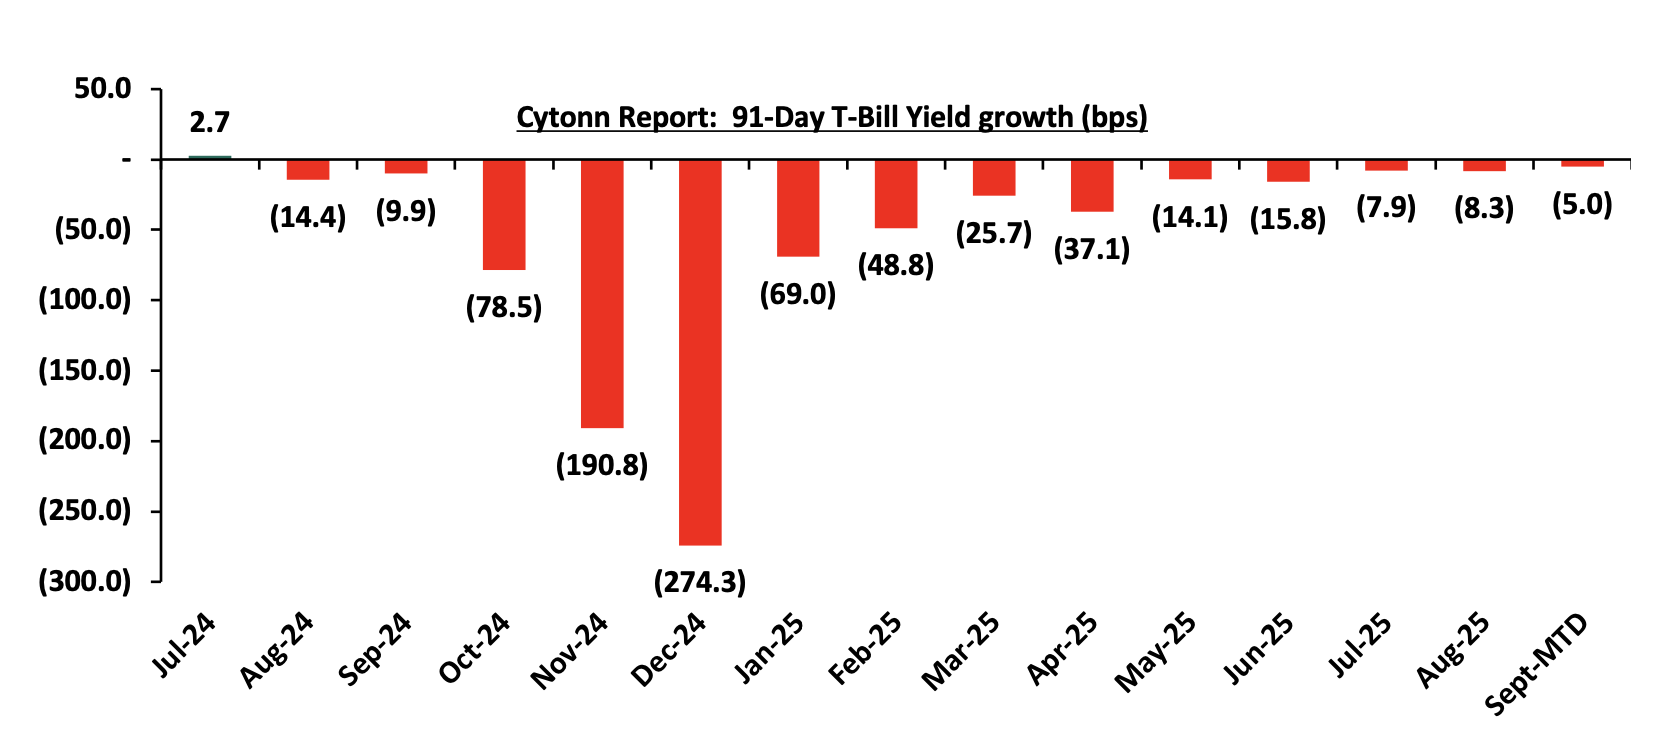
During the month of August 2025, T-bills were undersubscribed, with the overall average subscription rate coming in at 93.7%, albeit lower than the subscription rate of 117.1% recorded in July 2025. The overall average subscription rates for the 91-day, 182-day and 364-day papers decreased to 116.6%, 72.7%, 105.5% from 156.5%, 77.4% and 141.1% recorded in July 2025 respectively. The average yields on the government papers were on a downward trajectory during the month, with the average 91-day, 182-day, and 364-day papers yields decreasing by 8.3 bps, 24.2 bps, and 7.4 bps to 8.1%, 8.2% and 9.6% respectively, from an average of 8.1%, 8.4% and 9.7% recorded the previous month. For the month of August, the government accepted a total of Kshs 86.7 bn of the Kshs 89.9 bn worth of bids received in T-Bills, translating to an acceptance rate of 96.4%, compared to an acceptance rate of 83.7% in the month of July.
The chart below shows the yield growth rate for the 91-day paper in 2024 and during the year:
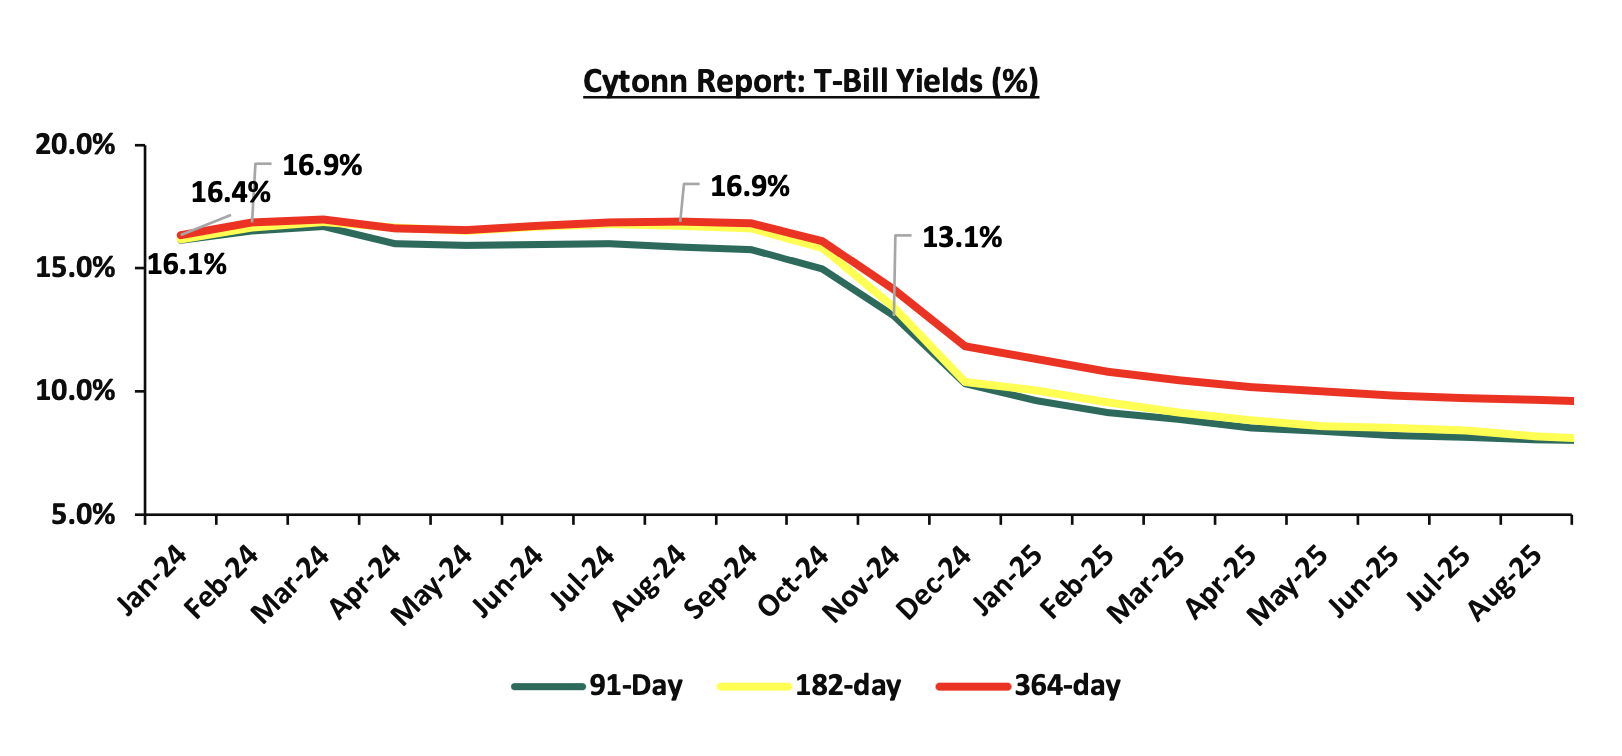
During the week, T-bills were oversubscribed for the second time in two weeks, with the overall subscription rate coming in at 133.5%, higher than the subscription rate of 113.5% recorded the previous week. Investors’ preference for the shorter 91-day paper persisted, with the paper receiving bids worth Kshs 20.0 bn against the offered Kshs 4.0 bn, translating to a subscription rate of 499.2%, significantly higher than the subscription rate of 194.3%, recorded the previous week. The subscription rates for the 182-day paper decreased to 18.0% from the 120.8% recorded the previous week while the 364-day paper decreased to 102.5% from the 73.9% recorded the previous week. The government accepted a total of Kshs 31.9 bn worth of bids out of Kshs 32.0 bn bids received, translating to an acceptance rate of 99.6%. The yields on the government papers were on a downward trajectory with the yields on the 182-day paper decreasing the most by 2.1 bps to 8.05% from the 8.07% recorded the previous week. The yields on the 91-day paper and 364-day paper decreased by 0.01 bps and 0.4 bps to 7.99% and 9.56% from the 8.0% and 9.57% respectively recorded the previous week.
The charts below show the performance of the 91-day, 182-day and 364-day papers from January 2024 to August 2025:
So far in the current FY’2025/26, government securities totaling Kshs 406.0 bn have been advertised. The government has accepted bids worth Kshs 554.2 bn, of which Kshs 212.8 bn and Kshs 341.4 bn were treasury bills and bonds, respectively. Total redemptions so far in FY’2025/26 equal to Kshs 218.2 bn, with treasury bills accounting for Kshs 218.2 bn. As a result, the government has a domestic borrowing surplus of Kshs 336.0 bn in FY’2025/26.
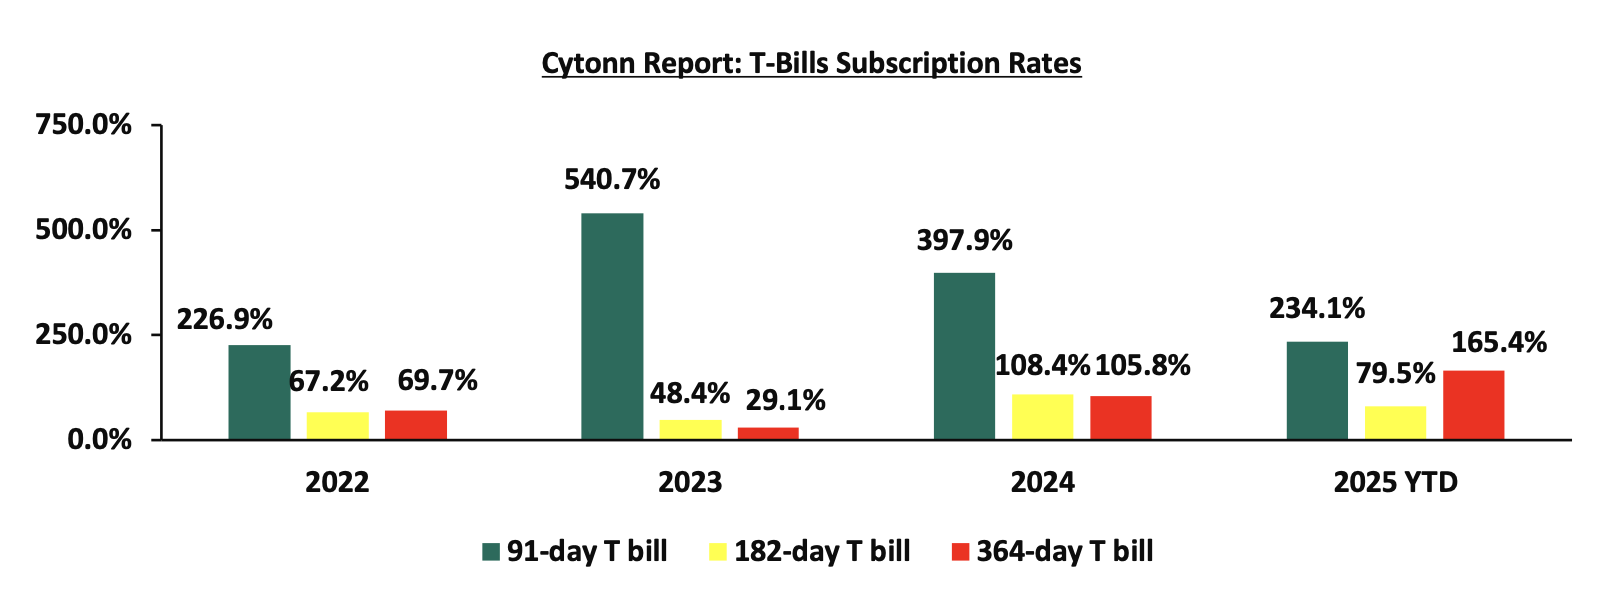
The chart below compares the overall average T-bill subscription rates obtained in 2022,2023, 2024 and 2025 Year-to-date (YTD):
August 2025 bonds were oversubscribed, with the overall average subscription rate coming in at 387.1%, higher than the average subscription rate of 153.8% recorded in July 2025. The reopened bonds IFB1/2018/015 and IFB1/2022/019 with tenors to maturity of 7.6 years and 15.6 years respectively and fixed coupon rates of 12.5% and 13.0% respectively, received bids worth Kshs 323.4 bn against the offered Kshs 90.0 bn translating to an oversubscription rate of 359.4%. The government accepted bids worth Kshs 95.1 bn, translating to an acceptance rate of 32.4%, with the average accepted yields coming at 13.0% and 14.0% for the IFB1/2018/015 and IFB1/2022/019 respectively. Also, there was a tap sale of IFB1/2018/015 and IFB1/2022/019 with tenors to maturity of 7.6 years and 15.6 years respectively and a fixed coupon rate of 12.5% and 13.0% respectively, receiving bids worth Kshs 130.3 bn and Kshs 77.1 bn against the offered Kshs 50.0 bn translating to an oversubscription of 414.9%. The bids accepted bids worth Kshs 128.0 and Kshs 51.8 bn for IFB1/2018/015 and IFB1/2022/019 respectively. For the month of August, the government accepted a total of Kshs 274.8 bn of the Kshs 530.9 bn worth of bids received in T-Bonds, translating to an acceptance rate of 57.5% compared to an acceptance rate of 87.4% in the month of July.
The table below provides more details on the bonds issued in August 2025:
|
Issue Date |
Bond Auctioned |
Effective Tenor to Maturity (Years) |
Coupon |
Amount offered (Kshs bn) |
Actual Amount Raised/Accepted (Kshs bn) |
Total bids received (Subscription) |
Average Accepted Yield |
Subscription Rate |
Acceptance Rate |
|
8/25/2025 |
IFB1/2018/015-Tapsale |
7.6 |
12.5% |
50.0 |
128.0 |
130.3 |
13.0% |
414.9% |
98.2% |
|
IFB1/2022/019-Tapsale |
15.6 |
13.0% |
51.8 |
77.1 |
14.0% |
67.2% |
|||
|
8/18/2025 |
IFB1/2018/015-Reopened |
7.6 |
12.5% |
90.0 |
50.7 |
215.9 |
13.0% |
359.4% |
23.5% |
|
IFB1/2022/019-Reopened |
15.6 |
13.0% |
44.4 |
107.5 |
14.0% |
41.3% |
|||
|
August 2025 Average |
11.6 |
12.8 |
140.0 |
274.8 |
530.9 |
13.5% |
387.1% |
57.5% |
|
|
July 2025 Average |
15.4 |
13.3% |
50.0 |
66.7 |
76.9 |
14.1% |
153.8% |
87.4% |
|
|
2024 Average
|
6.7 |
15.6% |
27.7 |
28.9 |
37.9 |
16.7% |
116.8% |
74.9% |
|
In the primary bond market, the government is looking to raise Kshs 40.0 bn through the reopened bonds; FXD1/2018/020 and FXD1/2022/025 and Kshs 20.0 bn through the reopened SDB1/2011/030 with fixed coupon rates of 13.2%, 14.2% and 12.0% respectively and tenors to maturity of 12.5 years, 22.2 years and 15.5 years respectively. The period of sale for the three bonds opened on Tuesday, 26th August 2025 and will close on 17th September 2025 for FXD1/2018/020 and FXD1/2022/025, while for SDB1/2011/030, it will close on 3rd September 2025. Our bidding ranges for FXD1/2018/020, FXD1/2022/025 and SDB1/2011/030 are 13.25%-13.55%, 13.75%-14.50% and 13.15%-13.65% respectively.
Secondary Bond Market:
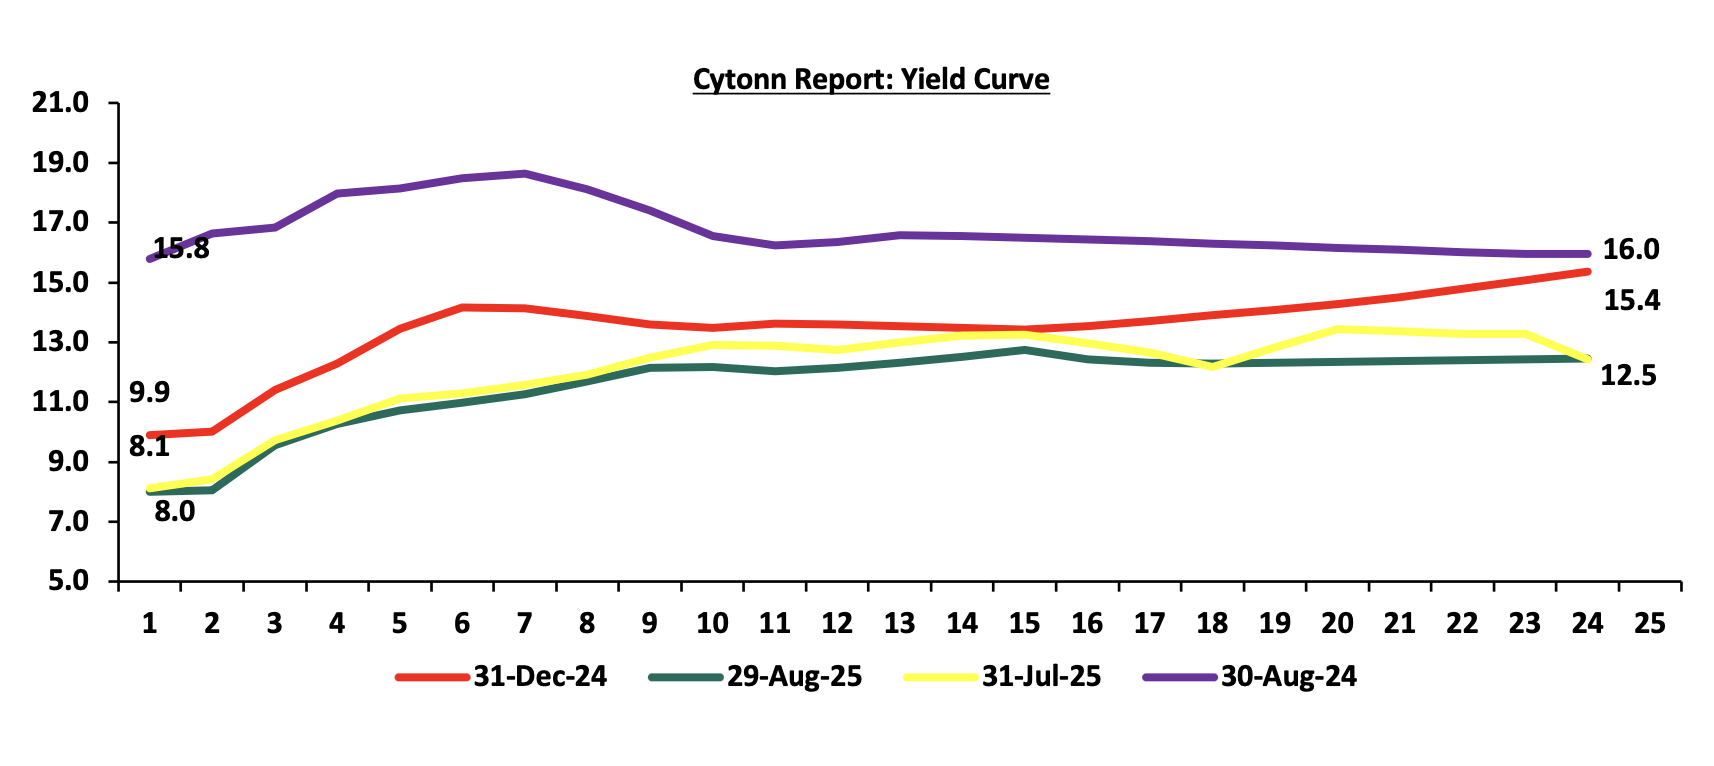
The yields on the government securities recorded a mixed performance during the month of August similar to July. Investors, apprehensive about the economic outlook in the long term, are demanding higher yields for bonds in the 11 to 22-year maturity range to compensate for the perceived risks as they anticipate potential fluctuations in economic conditions in the Kenyan market on the back of the government’s debt sustainability concerns. Notably, the yield curve has adjusted from a humped yield curve observed in most part of 2024, towards a normal upward sloping curve, with long-term bonds registering highest yields. The shift in sentiment indicates increased confidence in the short-term economic landscape, in comparison to the last two years. The chart below shows the yield curve movement during the period:
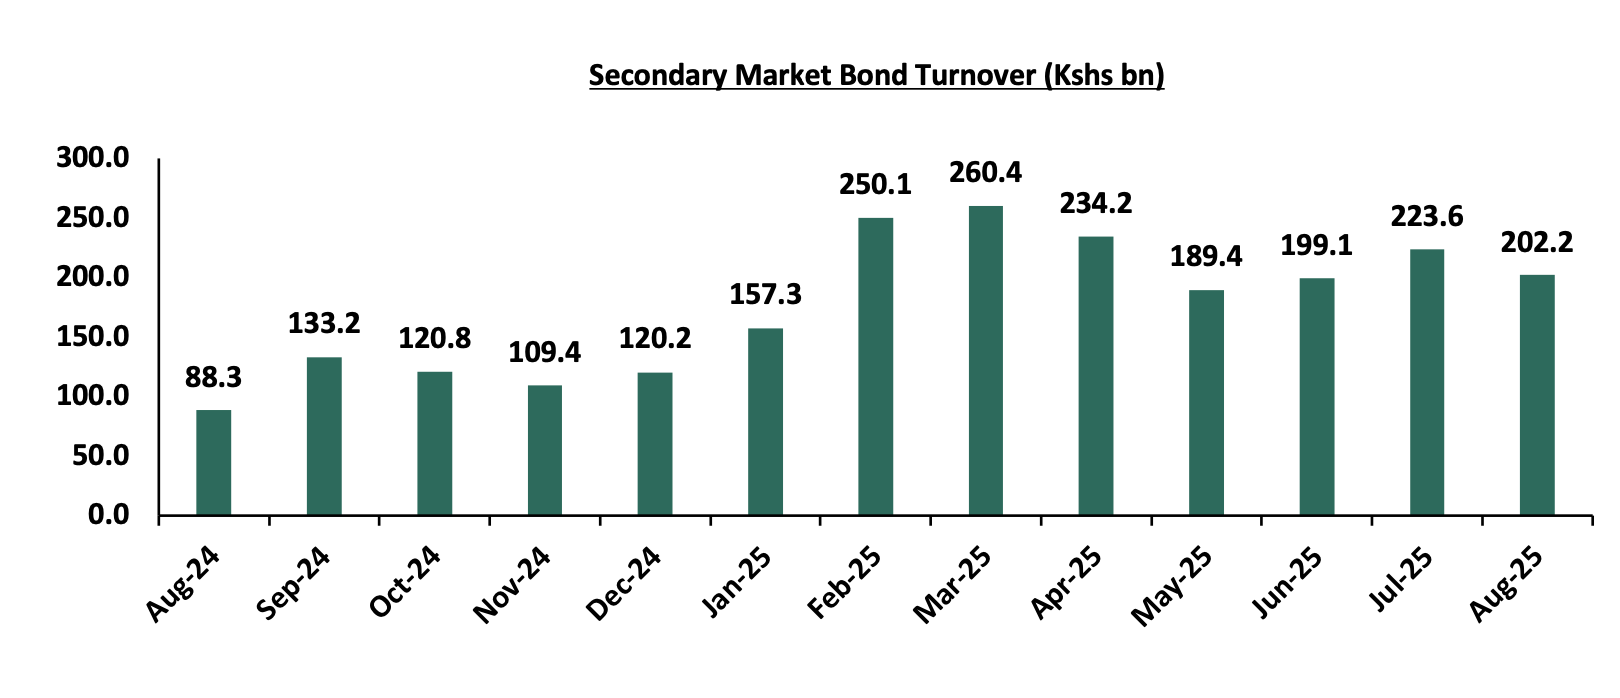
The secondary bond turnover decreased by 9.5% to Kshs 202.2 bn, from Kshs 223.6 bn recorded in July 2025, pointing towards decreased activities by commercial banks in the secondary bonds market for the month of August. On a year-on-year basis, the bond turnover increased by 128.9% from Kshs 88.3 bn worth of treasury bonds transacted over a similar period last year. The chart below shows the bond turnover over the past 12 months.
Money Market Performance:
In the money markets, 3-month bank placements ended the week at 9.5% (based on what we have been offered by various banks), The yields on the 91-day paper and 364-day paper decreased by 0.01 bps and 0.4 bps to 7.99% and 9.56% respectively, from the 8.0% and 9.57% respectively recorded the previous week and the yield on the Cytonn Money Market Fund decreased by 4.0 bps to 13.18% to 13.22% recorded in the previous week, while the average yields on the Top 5 Money Market Funds decreased by 3.8 bps to remain relatively unchanged from the 13.0% recorded the previous week.
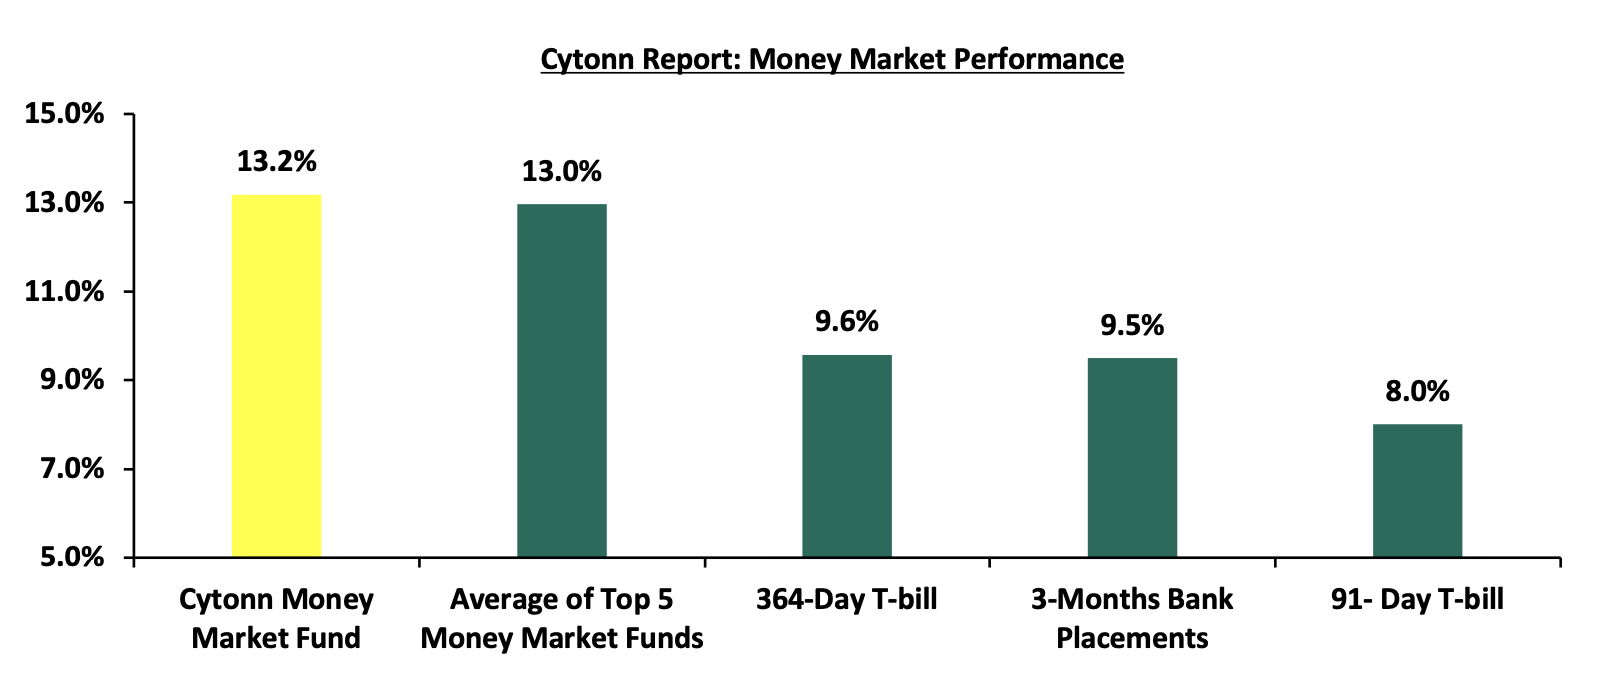
The table below shows the Money Market Fund Yields for Kenyan Fund Managers as published on 29th August 2025:
|
Cytonn Report: Money Market Fund Yield for Fund Managers as published on 29th August 2025 |
||
|
Rank |
Fund Manager |
Effective Annual Rate |
|
1 |
Cytonn Money Market Fund ( Dial *809# or download Cytonn App) |
13.2% |
|
2 |
Gulfcap Money Market Fund |
13.1% |
|
3 |
Ndovu Money Market Fund |
13.1% |
|
4 |
Nabo Africa Money Market Fund |
12.9% |
|
5 |
Lofty-Corban Money Market Fund |
12.6% |
|
6 |
Orient Kasha Money Market Fund |
12.1% |
|
7 |
Etica Money Market Fund |
12.1% |
|
8 |
Arvocap Money Market Fund |
12.0% |
|
9 |
Kuza Money Market fund |
12.0% |
|
10 |
Jubilee Money Market Fund |
11.2% |
|
11 |
Enwealth Money Market Fund |
11.2% |
|
12 |
Madison Money Market Fund |
11.1% |
|
13 |
British-American Money Market Fund |
11.0% |
|
14 |
Old Mutual Money Market Fund |
10.8% |
|
15 |
GenAfrica Money Market Fund |
10.6% |
|
16 |
Apollo Money Market Fund |
10.3% |
|
17 |
Dry Associates Money Market Fund |
10.2% |
|
18 |
Faulu Money Market Fund |
10.0% |
|
19 |
KCB Money Market Fund |
9.7% |
|
20 |
Mali Money Market Fund |
9.4% |
|
21 |
Sanlam Money Market Fund |
9.3% |
|
22 |
Absa Shilling Money Market Fund |
9.3% |
|
23 |
CPF Money Market Fund |
9.3% |
|
24 |
ICEA Lion Money Market Fund |
9.3% |
|
25 |
Co-op Money Market Fund |
9.1% |
|
26 |
Genghis Money Market Fund |
8.8% |
|
27 |
CIC Money Market Fund |
8.5% |
|
28 |
Mayfair Money Market Fund |
8.5% |
|
29 |
AA Kenya Shillings Fund |
7.7% |
|
30 |
Stanbic Money Market Fund |
6.5% |
|
31 |
Ziidi Money Market Fund |
6.3% |
|
32 |
Equity Money Market Fund |
5.1% |
Source: Business Daily
Liquidity:
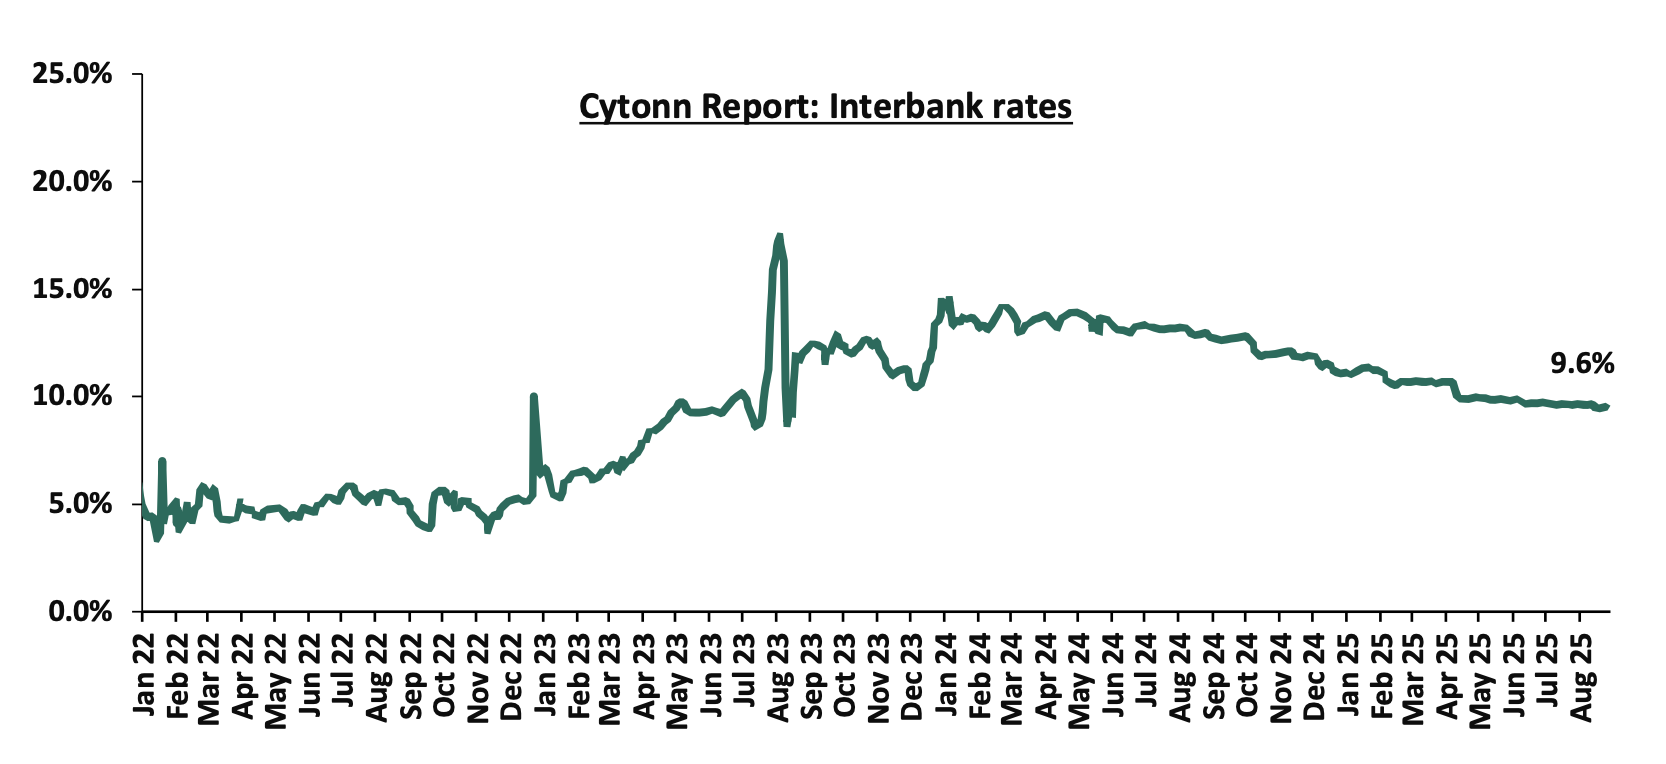
Liquidity in the money markets eased in the month of August 2025, with the average interbank rate decreasing by 0.1% points to 9.5% from 9.6% recorded the previous month. However, the average interbank volumes traded increased by 39.3% to Kshs 14.6 bn, from Kshs 10.5 bn recorded in July 2025.
Additionally, during the week, liquidity in the money markets increased, with the average interbank rate decreasing by 10.1 bps, to 9.5% from the 9.4% recorded the previous week, partly attributable to tax remittances that offset government payments. The average interbank volumes traded increased significantly by 527.5% to Kshs 38.9 bn from Kshs 6.2 bn recorded the previous week. The chart below shows the interbank rates in the market over the years:
Kenya Eurobonds:
During the month, the yields on the Eurobonds were on a downward trajectory, with the yield on the 10-year Eurobond issued in 2018 decreasing the most by 87.7 bps to 7.0% from 7.8% recorded at the beginning of the month.
Similarly, during the week, the yields on Kenya’s Eurobonds were on a downward trajectory with the yield on the 10-year Eurobond issued in 2018 decreasing the most by 44.4 bps to 7.0% from 7.4% recorded the previous week. The table below shows the summary performance of the Kenyan Eurobonds as of 28th August 2025;
|
Cytonn Report: Kenya Eurobond Performance |
|||||||
|
|
2018 |
2019 |
2021 |
2024 |
2025 |
||
|
Tenor |
10-year issue |
30-year issue |
7-year issue |
12-year issue |
13-year issue |
7-year issue |
11-year issue |
|
Amount Issued (USD) |
1.0 bn |
1.0 bn |
0.9 bn |
1.2 bn |
1.0 bn |
1.5 bn |
1.5 bn |
|
Years to Maturity |
2.5 |
22.5 |
1.7 |
6.7 |
8.8 |
5.5 |
10.5 |
|
Yields at Issue |
7.3% |
8.3% |
7.0% |
7.9% |
6.2% |
10.4% |
9.9% |
|
2-Jan-25 |
9.1% |
10.3% |
8.5% |
10.1% |
10.1% |
10.1% |
|
|
1-Aug-25 |
7.8% |
10.3% |
- |
9.3% |
9.8% |
9.2% |
|
|
21-Aug-25 |
7.4% |
10.1% |
- |
9.0% |
9.5% |
8.8% |
|
|
22-Aug-25 |
7.2% |
10.0% |
- |
8.9% |
9.4% |
8.6% |
|
|
25-Aug-25 |
7.1% |
10.0% |
- |
8.8% |
9.4% |
8.6% |
|
|
26-Aug-25 |
7.1% |
10.0% |
- |
8.8% |
9.4% |
8.6% |
|
|
27-Aug-25 |
7.0% |
9.9% |
- |
8.8% |
9.3% |
8.5% |
|
|
28-Aug-25 |
7.0% |
9.9% |
- |
8.8% |
9.3% |
8.5% |
|
|
Weekly Change |
(0.4%) |
(0.2%) |
- |
(0.3%) |
(0.3%) |
(0.2%) |
- |
|
MTD Change |
(0.9%) |
(0.4%) |
- |
(0.5%) |
(0.5%) |
(0.7%) |
- |
|
YTD Change |
(2.1%) |
(0.4%) |
- |
(1.3%) |
(0.8%) |
(1.6%) |
- |
Source: Central Bank of Kenya (CBK) and National Treasury
Kenya Shilling:
During the month, the Kenya Shilling depreciated marginally by 0.2 bps against the US Dollar, to remain relatively unchanged from the Kshs 129.2 recorded at the end of July.
During the week, the Kenya Shilling depreciated marginally against the US Dollar by 0.3 bps, to close the week at Kshs 129.2 to remain unchanged from the previous week. On a year-to-date basis, the shilling has appreciated by 4.9 bps against the dollar, a contrast to the 17.4% appreciation recorded in 2024.
We expect the shilling to be supported by:
- Diaspora remittances standing at a cumulative USD 5,084.0 mn in the twelve months to June 2025, 12.1% higher than the USD 4,535.0 mn recorded over the same period in 2024. These has continued to cushion the shilling against further depreciation. In the June 2025 diaspora remittances figures, North America remained the largest source of remittances to Kenya accounting for 57.9% in the period,
- The tourism inflow receipts which came in at Kshs 452.2 bn in 2024, a 19.8% increase from Kshs 377.5 bn inflow receipts recorded in 2023, and owing to tourist arrivals that improved by 8.0% to 2,303,028 in the 12 months to February 2025 from 2,133,612 in the 12 months to February 2024, and,
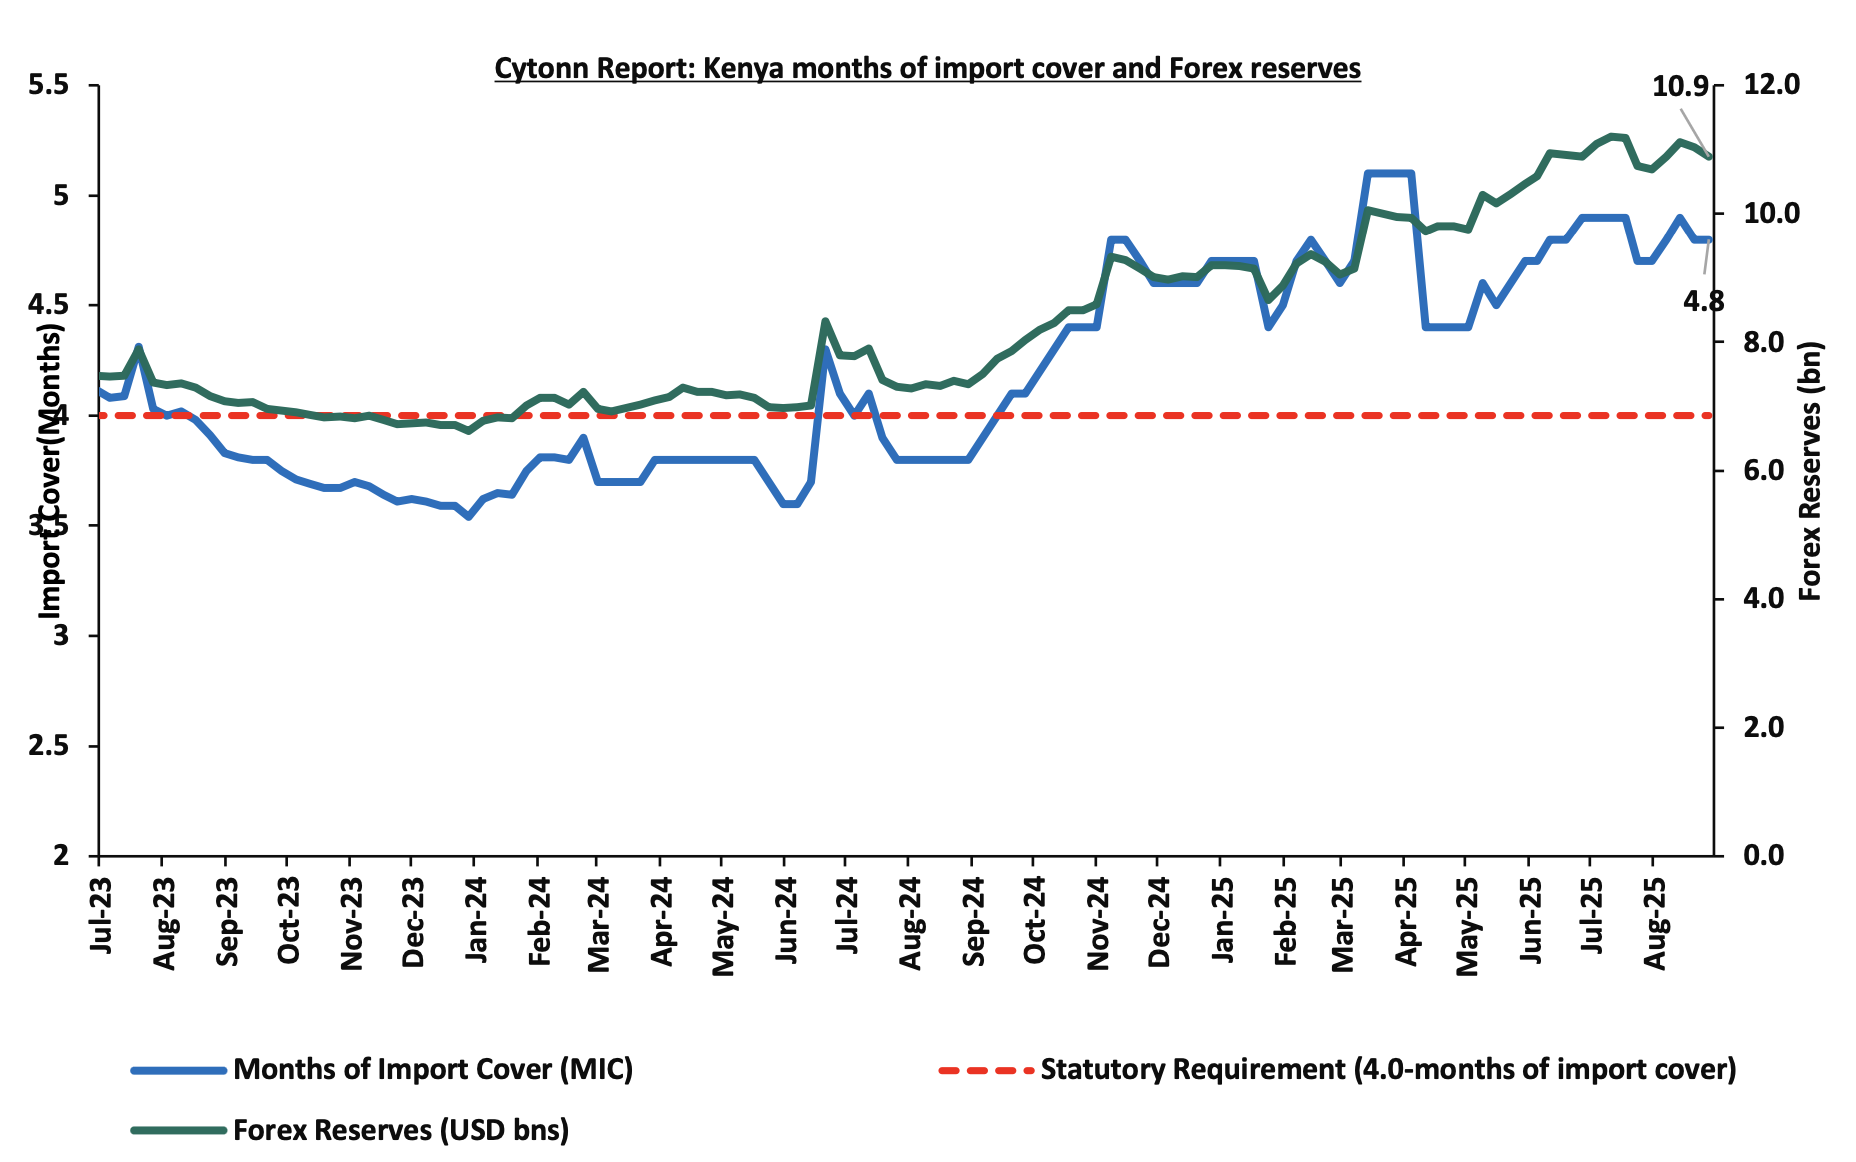
- Improved forex reserves currently at USD 10.9 bn (equivalent to 4.8-months of import cover), which is above the statutory requirement of maintaining at least 4.0-months of import cover and above the EAC region’s convergence criteria of 4.5-months of import cover.
The shilling is however expected to remain under pressure in 2025 as a result of:
- An ever-present current account deficit which came at 1.6% of GDP in the twelve months to June 2025, and,
- The need for government debt servicing, continues to put pressure on forex reserves given that 62.0% of Kenya’s external debt is US Dollar-denominated as of December2024.
Key to note, Kenya’s forex reserves increased by 1.8% during the month of August 2025, to USD 10.9 bn, from the USD 10.7 bn recorded in the previous month, equivalent to 4.8 months of import cover and above the statutory requirement of maintaining at least 4.0-months of import cover. Additionally, during the month, the months of import cover decreased to 4.8 from 4.7 recorded in the previous month. Additionally, Kenya’s forex reserves decreased by 1.3% during the week to Kshs 10.9 From Kshs 11.0 bn recorded the previous week, equivalent to 4.8 months of import cover, and above the statutory requirement of maintaining at least 4.0-months of import cover.
The chart below summarizes the evolution of Kenya's months of import cover over the years:
Weekly Highlights
- Inflation Highlight August 2025
The year-on-year inflation in August 2025 rose by 1.4% points to 4.5%, up from 4.1% recorded in July 2025. The headline inflation was primarily driven by price increases in the following categories: Food & Non-Alcoholic Beverages at 8.3%, Transport at 4.4%, and Housing, Water, Electricity, Gas and Other Fuels at 0.8%. The month-on-month inflation rate stood at 0.3% in August 2025. The table below summarizes the performance of commodity indices both on a year-on-year and month-on-month basis:
|
Cytonn Report: Major Inflation Changes – July 2025 |
|||
|
Broad Commodity Group |
Price change m/m (August-2025/ July -2025) |
Price change y/y (August-2025/August-2024) |
Reason |
|
Food and non- alcoholic beverages |
0.6% |
8.3% |
The m/m increase was mainly driven by the increase in prices of vegetables such as Cabbages, carrots, kales and tomatoes by 6.3%, 2.4%, 1.9% and 1.2% respectively, while wheat flour and onion bulb prices increased by 0.9% each. However, the increase was muted by decreases in prices of cow milk, fortified maize flour and sifted maize flour by 0.9%, 1.7% and 1.5% respectively |
|
Transport |
0.5% |
4.4% |
The transport index recorded a slight m/m increase mainly due to an increase in prices of passenger transport costs with the bus/matatu fare from Nairobi to Mombasa increasing by 15.4% while local transport costs such as tuktuk fares increased by 1.5%. Prices of Super Petrol declined by 0.5% to retail at Kshs 185.3. |
|
Housing, water, electricity, gas and other fuels |
(0.2%) |
0.8% |
The m/m decrease was mainly driven by a decrease in prices of 50kWh electricity and 200kWh electricity by 2.3% and 2.1% respectively coupled with a decrease in kerosene prices by 0.6%. The decrease was however weighed down by increase in prices of single-room house rent and gas/LPG by 0.1% and 0.4%. |
|
Overall Inflation |
0.3% |
4.5% |
The m/m increase was mainly attributable to the 0.6% increase in food and non-alcoholic beverages. |
Despite this, the inflation rate remained within the Central Bank of Kenya’s preferred range of 2.5%–7.5% for the twenty-sixth consecutive month, underscoring ongoing macroeconomic stability. The recent reduction in the Central Bank Rate to 9.50% from 9.75% is expected to stimulate credit uptake and increase money supply, which could gradually exert upward pressure on inflation in the coming months as monetary easing transmits through the broader economy.
The chart below shows the inflation rates for the past 5 years:
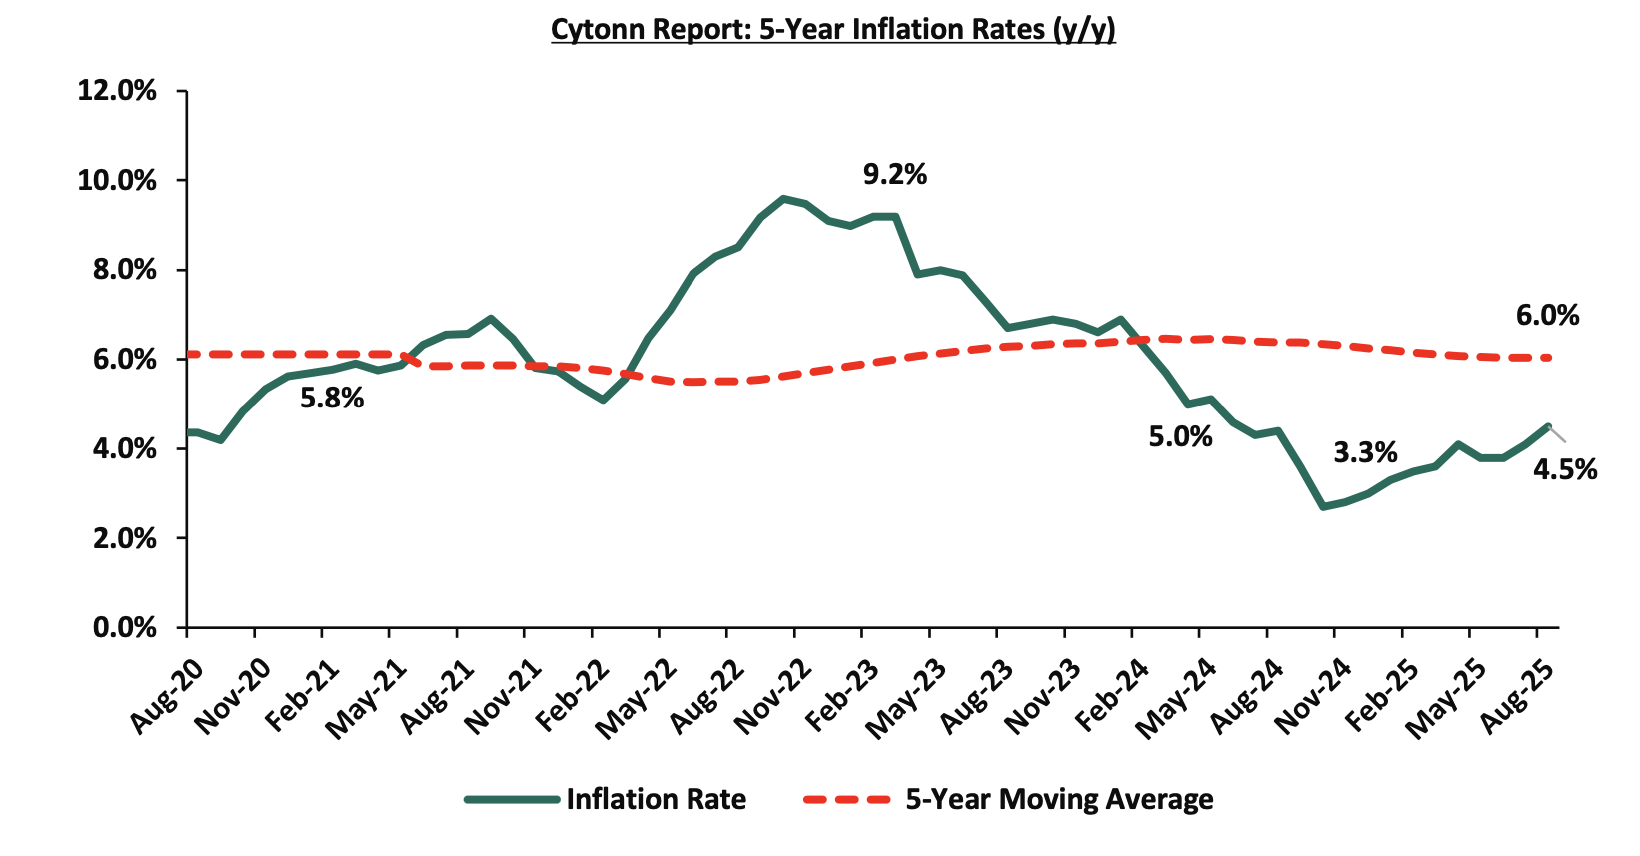
Going forward, we expect inflation to remain within the CBK’s preferred range of 2.5%-7.5%, mainly on the back of a stable currency and stable fuel prices. Additionally, favourable weather conditions will also contribute to stabilizing food prices, further supporting stable inflation rates. The risk, however, lies in the fuel prices which despite their stability, still remain elevated compared to historical levels. The MPC committee is expected to meet in October and the committee is expected to adopt a more cautious approach to rate adjustments in the coming meetings in a bid to continue supporting the private sector, while also keeping an eye on the effect on the inflation and exchange rate.
- Issuance of a Revised Risk-Based Credit Pricing Model
During the week, the Central Bank of Kenya (CBK) unveiled a revised Risk-Based Credit Pricing Model (RBCPM), a major step in reforming how banks set interest rates on loans. This follows a review process initiated in April 2025, involving consultations with banks, academics, development partners, and industry stakeholders. The new model, which takes effect on 1st September 2025 for new variable-rate loans, is designed to improve transparency, strengthen monetary policy transmission, and ensure that lending rates better reflect the actual risk profile of borrowers. Existing loans will be transitioned by February 2026.
The initial proposal suggested using the Central Bank Rate (CBR) as the benchmark for loan pricing, but following stakeholder feedback, CBK has adopted a more market-driven approach. The updated model now uses the Kenya Shilling Overnight Interbank Average (KESONIA) as the primary reference rate. KESONIA replaces the previous overnight interbank rate and serves as the new reference point for pricing variable-rate loans. KESONIA, explained in CBK’s guidance, represents the volume-weighted average interest rate at which commercial banks lend to each other overnight in the local currency. It is derived from actual market transactions, making it a transparent and reliable indicator of short-term funding costs. While the methodology for calculating the rate remains unchanged, the formal adoption of the name “KESONIA” aligns Kenya with global best practices, similar to benchmarks like Sterling Overnight Index Average (SONIA) in the UK or Secured Overnight Financing Rate (SOFR) in the US.
Previously, banks priced loans using the CBR plus a fixed margin (“K”), which often led to rigid and opaque pricing. Under the new framework, the total lending rate will now be calculated as KESONIA + Premium (“K”), with the total cost of credit incorporating any additional fees and charges. The premium reflects a bank’s operational costs, required return on capital, and the borrower’s individual risk profile. This approach standardizes loan pricing while still allowing differentiation based on credit risk. This shift allows banks to tailor rates more precisely to individual borrowers, encouraging fairer and more competitive lending. Key to note, the banks will publish on their websites and on the Total Cost of Credit (TCC) website, their weighted average lending rates, weighted average premium (K), and fees and charges for each of their lending products, while the CBK will publish KESONIA on its website daily.
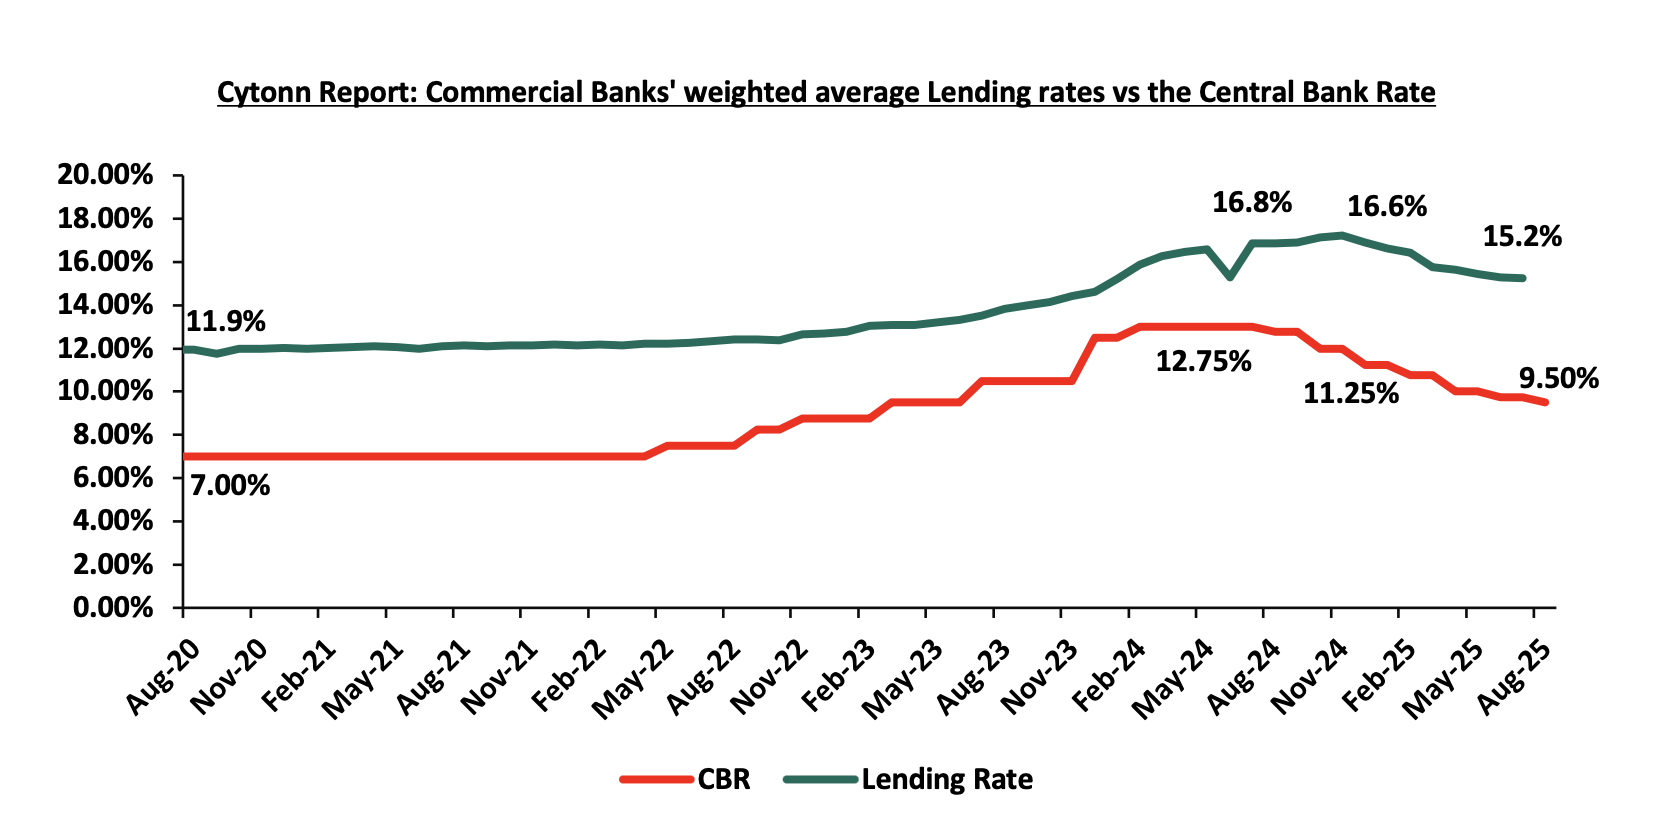
As of July 2025, the CBR stood at 9.75%, while the average commercial bank lending rate stood at 12.3%. This persistent gap highlights how slowly lending rates respond to changes in CBR a key issue the new model aims to fix. The MPC lowered the CBR by 25.0 bps in August 2025, to 9.50 from 9.75% in June 2025. By anchoring rates to actual market transactions through KESONIA, CBK expects to tighten the link between policy movements and lending costs, leading to clearer and more responsive pricing. The graph below shows the Central Bank Rate for the last five years, along with the commercial banks' lending rates and deposit rates:
Looking ahead, the revised RBCPM is designed to foster a healthier lending ecosystem where interest rates are more reflective of real-time market conditions and borrower risk. It encourages competition among banks, improves monetary policy effectiveness, and enhances consumer protection by making loan pricing clearer and fairer. Over time, this structure is expected to support broader financial inclusion and economic growth by making credit more accessible and appropriately priced.
- 2024 Foreign Investment Survey Review
On 20th August 2025, the Kenya National Bureau of Statistics (KNBS), in collaboration with the Central Bank of Kenya (CBK) and the Kenya Investment Authority (KenInvest), released the 2024 Foreign Investment Survey Report. The report, which is the eighth in the series, captures data on foreign private capital flows and positions for the period 2022–2023, alongside investor perceptions of the business environment in 2024. The survey is key for compiling Balance of Payments (BOP) and International Investment Position (IIP) statistics, and for informing policy on Kenya’s competitiveness in attracting and retaining foreign capital.
Key Highlights
- Foreign Liabilities- In 2023, Kenya's stock of foreign liabilities rose by 3.4% to Kshs 2.34 tn, up from Kshs 2.26 tn in 2022. This growth was primarily driven by an 8.5% increase in Foreign Direct Investment (FDI), which reached Kshs 1.5 tn in 2023 from 1.3 tn in 2022, and accounted for 62.2% of total foreign liabilities. However, Other Investment liabilities declined by 5.6% to Kshs 794.0 bn from Kshs 840.6 bn in the previous year. Despite the overall increase in stock, foreign liabilities registered net outflows of Kshs 27.5 bn in 2023, a reversal from net inflows of Kshs 43.6 bn in 2022. This shift was largely due to a sharp rise in net outflows from Other Investment, which jumped to Kshs 101.9 bn from Kshs 1.8 bn, alongside a decline in net FDI inflows to Kshs 84.6 bn from Kshs 93.2 bn. Regionally, Europe remained the leading source of foreign liabilities to Kenya, contributing 35.0% of the total stock of foreign liabilities, up from 32.9% in 2022, driven by the UK which accounted for 4% and the Netherlands accounting for 17.3%. Africa followed at 26.4%, with South Africa, the DRC, and Mauritius as key contributors, while America and Asia accounted for 9.1% and 9.3%, respectively. In terms of sectoral distribution, the finance and insurance sector attracted the highest FDI at Kshs 409.7 bn representing 28.1%, followed by manufacturing which made up 14.8% and ICT which accounted for 12.8%. Meanwhile, wholesale and retail trade saw a decline in FDI liabilities, falling by 1.8% to Kshs 169.8 bn from Kshs 172.9 bn in 2022.
- Foreign Assets: In 2023, the total stock of assets held abroad by resident enterprises rose by 36.8% to Kshs2 bn from 610.0 bn in 2022, driven mainly by a 64.6% increase in Other Investment to Kshs 459.9 bn from 279.4 bn in 2022 and a 13.3% rise in Foreign Direct Investment assets to Kshs 372.5 bn from 328.9 bn in 2022. Portfolio Investment assets increased modestly to Kshs 1.8 bn from 1.4 bn in 2022, while Financial Derivatives and Employee Stock Options dropped to zero from 400.5 mn in 2022. Foreign asset outflows surged by 42.8% to Kshs350.5 bn from 245.5 bn in 2022, primarily from Other Investment which grew from 68.3 bn to 292.9 bn in 2023, whereas inflows fell 28.8% to Kshs 132.9 bn from 186.6 bn in 2022, largely due to a decline in Foreign Direct Investment inflows which declined by 545.1% to 18.4 bn from 118.7 bn in 2022. The net outflows widened sharplyby 269.5% to Kshs 217.6 bn from 58.9 bn in 2022. Geographically, Uganda, Ethiopia, Tanzania, DRC, Mauritius, and South Africa accounted for 12.5%, 12.2%, 11.6%, 8.6% and 4.5% respectively, accounting for over half of Kenya’s foreign assets.
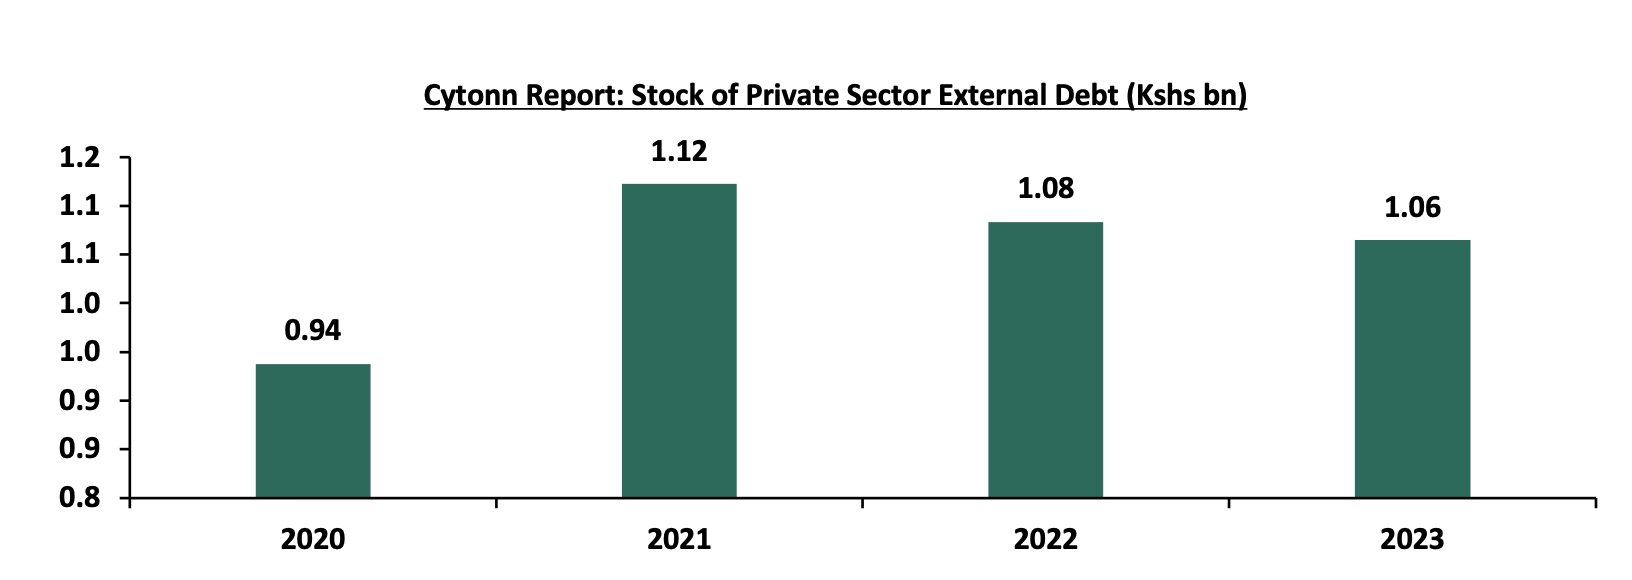
- Private Sector External Debt (PSED): Declined by 1.7% to Kshs06 trillion in 2023 from Kshs 1.08 trillion in 2022, mainly attributable to a significant reduction of 5.6% in the PSED stock under the Other Investment category to Kshs 793.8 billion in 2023 from Kshs 840.6 billion in 2022, with International Financial Institutions, DRC, and South Africa as the largest creditors. Net outflows of PSED widened significantly by 649.1% to Kshs 85.4 billion from Kshs 11.4 billion in 2022. The graph below shows the stock of private sector external debt in the last four years
 Source: KNBS
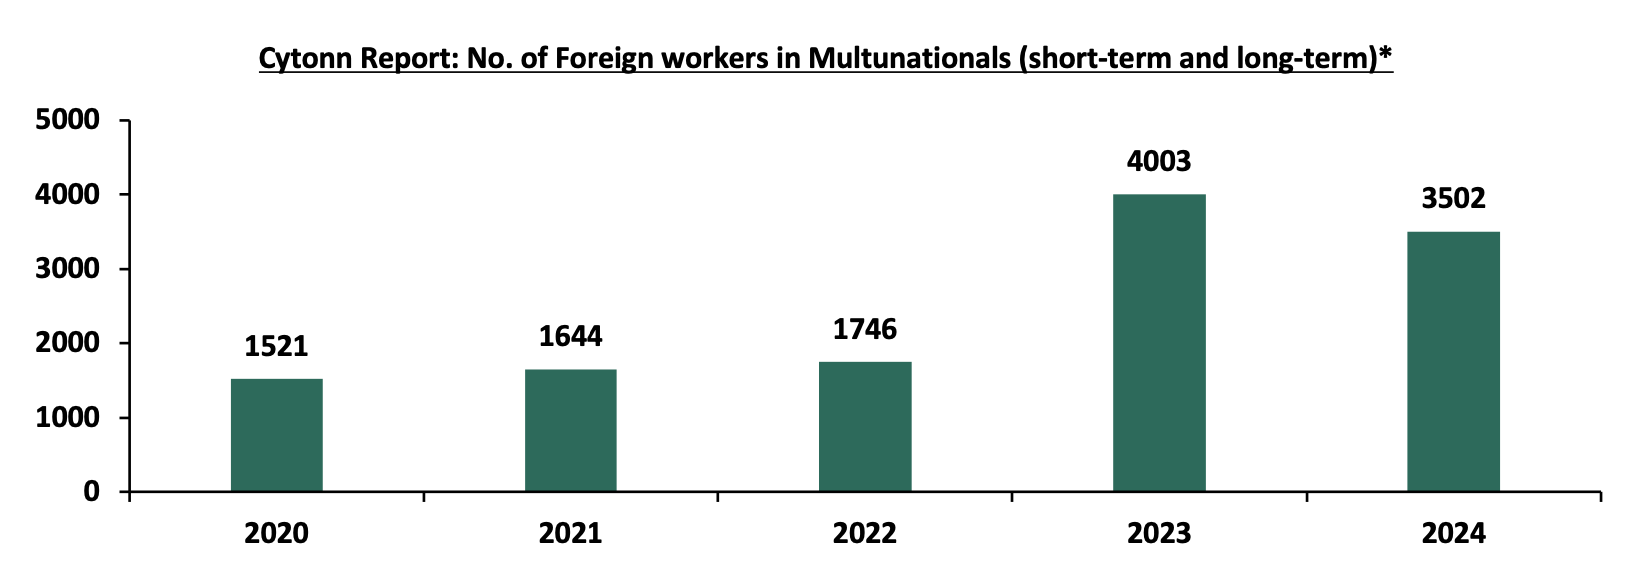
 - Employment: Total employment in surveyed firms rose by 3.3% to 224,769 employees in June 2024 from 217,541 in June 2023, with foreign employees decreasing to 3,502 in 2024 from 4,003 in 2023 female representation improved to 39.0% in 2024 from 37.8% in 2023 indicating progress towards gender inclusivity in employment. The number of foreign workers in multinationals has increased steadily from 1,521 in 2020 to 1,746 in 2022, before jumping sharply to 4,003 in 2023. In June 2024, the number slightly declined to 3,502 but remained significantly higher than in previous years. The graph below shows the number of short-term and long-term foreign workers working in multinationals in the last five years.
 Source: KNBS
*Data as at June
- Investor Sentiment: 66.4% of surveyed firms entered Kenya through greenfield investments and 18.6% as brownfield investments. Availability of skilled labour, cited by 22.9% of respondents, and market access, cited by 17.1%, were the main attractors. However, 70.1% of respondents identified electricity as the most expensive enabler, while taxation, corruption, and political risks were also significant concerns. Encouragingly, 39.5% of firms indicated plans to reinvest and expand within the next three years.
Going forward, Kenya’s Foreign investment landscape remains cautiously optimistic. The steady growth in FDI stock and expansion of outward investments demonstrate resilience and regional integration potential; however, rising net capital outflows, a widening private sector external debt burden, and persistent challenges around electricity costs, tax administration, and governance continue to weigh on competitiveness. In our view, Kenya’s ability to attract and retain sustainable foreign capital will hinge on accelerating structural reforms that lower the cost of doing business, improve regulatory efficiency, and provide a more predictable policy environment, positioning the country as a stronger regional investment hub.
Monthly Highlights:
- During the month, we projected the y/y inflation rate for August 2025 to remain stable within the range of 3.9% – 4.4%. For more information, please see our Cytonn Weekly #34
- During the month, S&P Global Ratings raised Kenya’s long-term sovereign credit rating to ‘B’ from ‘B-’, with a stable outlook, while affirming the short-term sovereign credit rating at ‘B’. At the same time, the agency revised Kenya’s transfer and convertibility assessment upward to ‘B+’ from ‘B’, reflecting the country’s improved external liquidity buffers and relatively resilient economic fundamentals compared to peers. For more information, please see our Cytonn Weekly #34
- During the month, The monetary policy committee met on August 12th, 2025, to review the outcome of its previous policy decisions against a backdrop of elevated uncertainties to the global outlook for growth, lower inflation in advanced economies heightened trade tensions as well as persistent geopolitical tensions. The MPC decided tolower the CBR rate by 25.0 bps to 9.50%, from 9.75% in June 2025. For more information, please see our Cytonn Weekly #33
- During the month, the Energy and Petroleum Regulatory Authority (EPRA) released their monthly statement on the maximum retail fuel prices in Kenya, effective from 15th August 2025 to 14th September 2025. Notably, the maximum allowed price for Super Petrol and Kerosene decreased by Kshs 1.0 respectively, while the price for diesel remained unchanged. Consequently, Super Petrol and Kerosene will now retail at Kshs 185.3 and Kshs 155.6 per litre respectively, from Kshs 186.3 and Kshs 156.6 per litre respectively, while diesel will remain unchanged at Kshs 171.6 per litre, representing decreases of 0.5% and 0.6% for Super Petrol and Kerosene respectively. For more information, please see our Cytonn Weekly #33
- During the month, the National Treasury gazetted the revenue and net expenditures for the first month of FY’2025/2026, ending 31st July 2025, highlighting that the total revenue collected as at the end of July 2025 amounted to Kshs 178.4 bn, equivalent to 6.5% of the original estimates of Kshs 2,754.7 bn for FY’2025/2026 and is 77.7% of the prorated estimates of Kshs 229.6 bn. For more information, please see our Cytonn Weekly #33
- During the month, Stanbic Bank released its monthly Purchasing Manager's Index (PMI) highlighting that the index for the month of July 2025 deteriorated further to the negative territory, coming in at 46.8, down from 48.6 in June 2025, marking a third consecutive month the index fell below the 50.0 neutral mark, signaling a worsening in business conditions, mainly attributable to weaker order inflows, rising price pressures and disruption from protests. On a year-to-year basis, the index recorded 8.6% increase from the 43.1 recorded in July 2024, indicating a slight improvement in business conditions compared to the same period last year. For more information, please see our Cytonn Weekly #32
Rates in the Fixed Income market have been on a downward trend due to high liquidity in the money market which allowed the government to front load most of its borrowing. The government is 210.8% ahead of its prorated net domestic borrowing target of Kshs 108.1, having a net borrowing position of Kshs 336.0 bn (inclusive of T-bills). However, we expect a stabilization of the yield curve in the short and medium term, with the government looking to increase its external borrowing to maintain the fiscal surplus, hence alleviating pressure in the domestic market. As such, we expect the yield curve to stabilize in the short to medium-term and hence investors are expected to shift towards the long-term papers to lock in the high returns.
Market Performance:
During the month of August 2025, the equities market was on an upward trajectory, with NSE 20 gaining the most by 11.2%, while NSE 10, NASI and NSE 25 gained 8.3%, 7.7% and 7.5% respectively. The equities market positive performance was driven by gains recorded by large-cap stocks such as KCB, DTB-K and Equity of 14.5%, 12.9%, and 10.9% respectively. The monthly performance was, however, weighed down by losses recorded by large cap stocks such as NCBA Bank of 3.0%.
During the week, the equities market was on an upward trajectory, with NSE 20 gaining the most by 3.2% while NASI, NSE 25 and NSE 10 gained by 1.5%,1.4% and 1.4% respectively, taking the YTD performance to gains of 38.2%, 37.7%, 28.8% and 28.5% for NSE 20, NASI, NSE 10 and NSE 25 respectively. The week-on-week equities market performance was driven by gains recorded by large-cap stocks such as NCBA Bank, Coop Bank and DTB-K Bank of 3.2%, 2.6%, and 2.3% respectively. The performance was, however, weighed down by losses recorded by large-cap stocks such as BAT and Stanbic Bank of 3.1% and 0.7% respectively.
Additionally, in the regional equities market, the East African Exchanges 20 (EAE 20) share index gained by 0.8% to 99.7 from 99.4 recorded the previous week, attributable to gains recorded by large cap stocks such as Bank of Baroda Uganda, Quality Chemicals Industry Limited, and MTN Uganda of 5.4%, 4.9% and 4.2% respectively. However, the performance was weighed down by the losses recorded by large cap stocks such as CRDB Bank, Tanzania Breweries Limited and Tanzania Cigarette Corporation of 4.0%, 1.4% and 1.4% respectively.
Equities turnover decreased by 12.3% in the month of August 2025 to USD 84.9 mn, from USD 96.8 mn recorded in July 2025. Foreign investors became net buyers, with a net buying position of USD 11.7 mn, a shift from a net selling position of USD 5.0 mn recorded in July 2025.
During the week, equities turnover increased by 7.2% to USD 24.4 mn from USD 22.8 mn recorded the previous week, taking the YTD total turnover to USD 604.1 mn. Foreign investors remained net buyers for the fifth consecutive week with a net buying position of USD 3.5 mn, from a net buying position of USD 2.1 mn recorded the previous week, taking the YTD foreign net selling position to USD 18.8 mn, compared to a net selling position of USD 16.9 mn recorded in 2024.
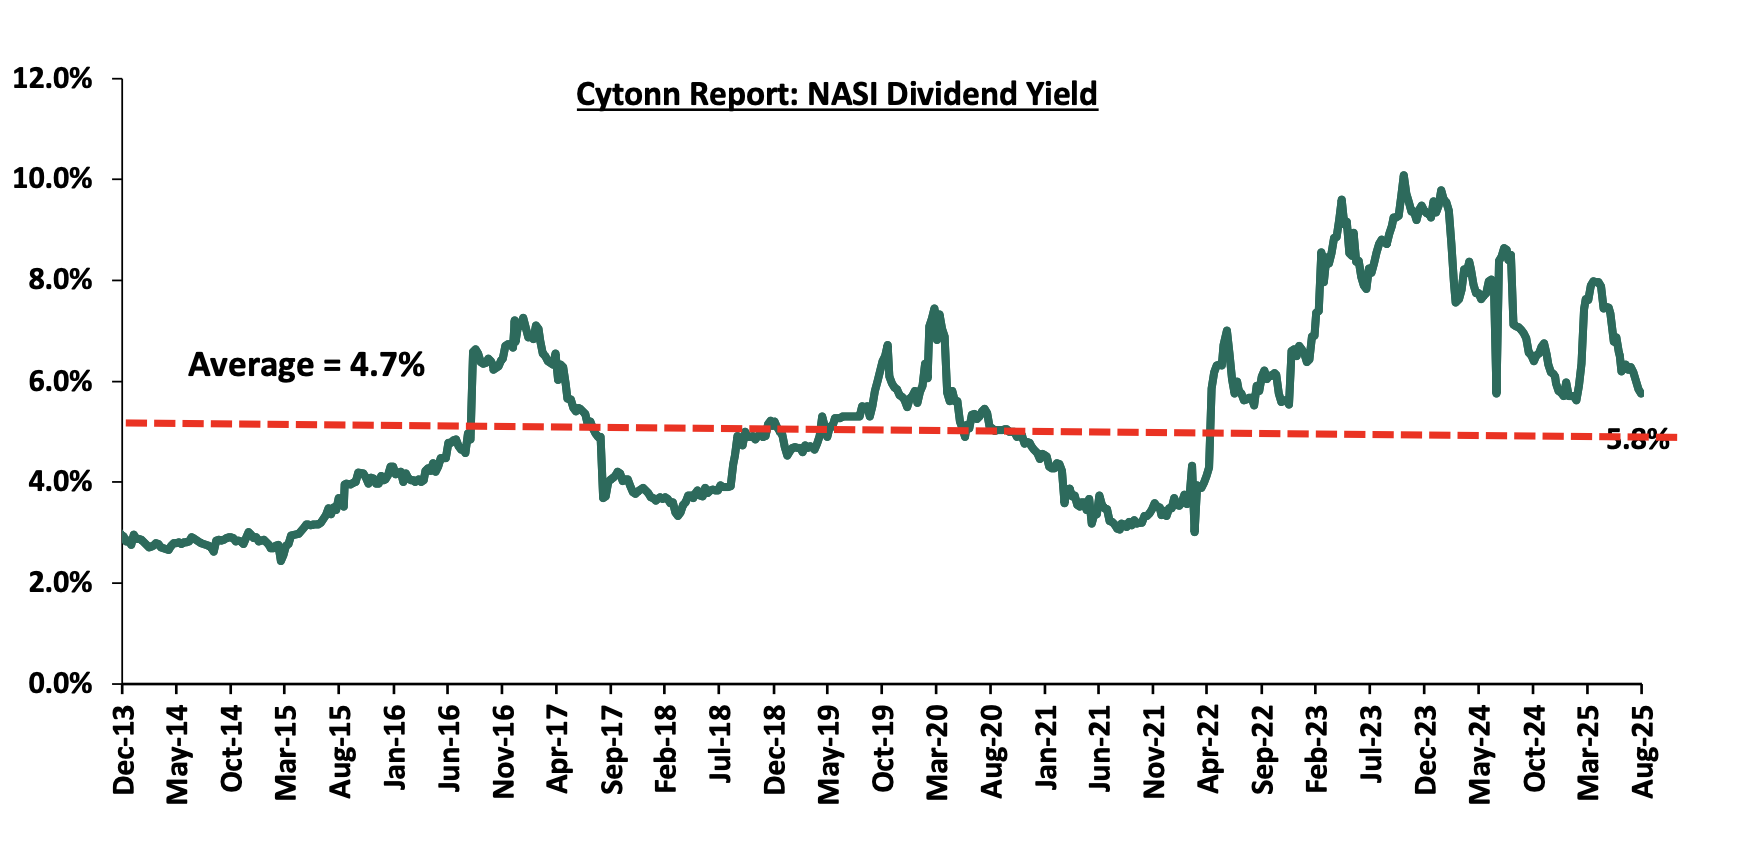
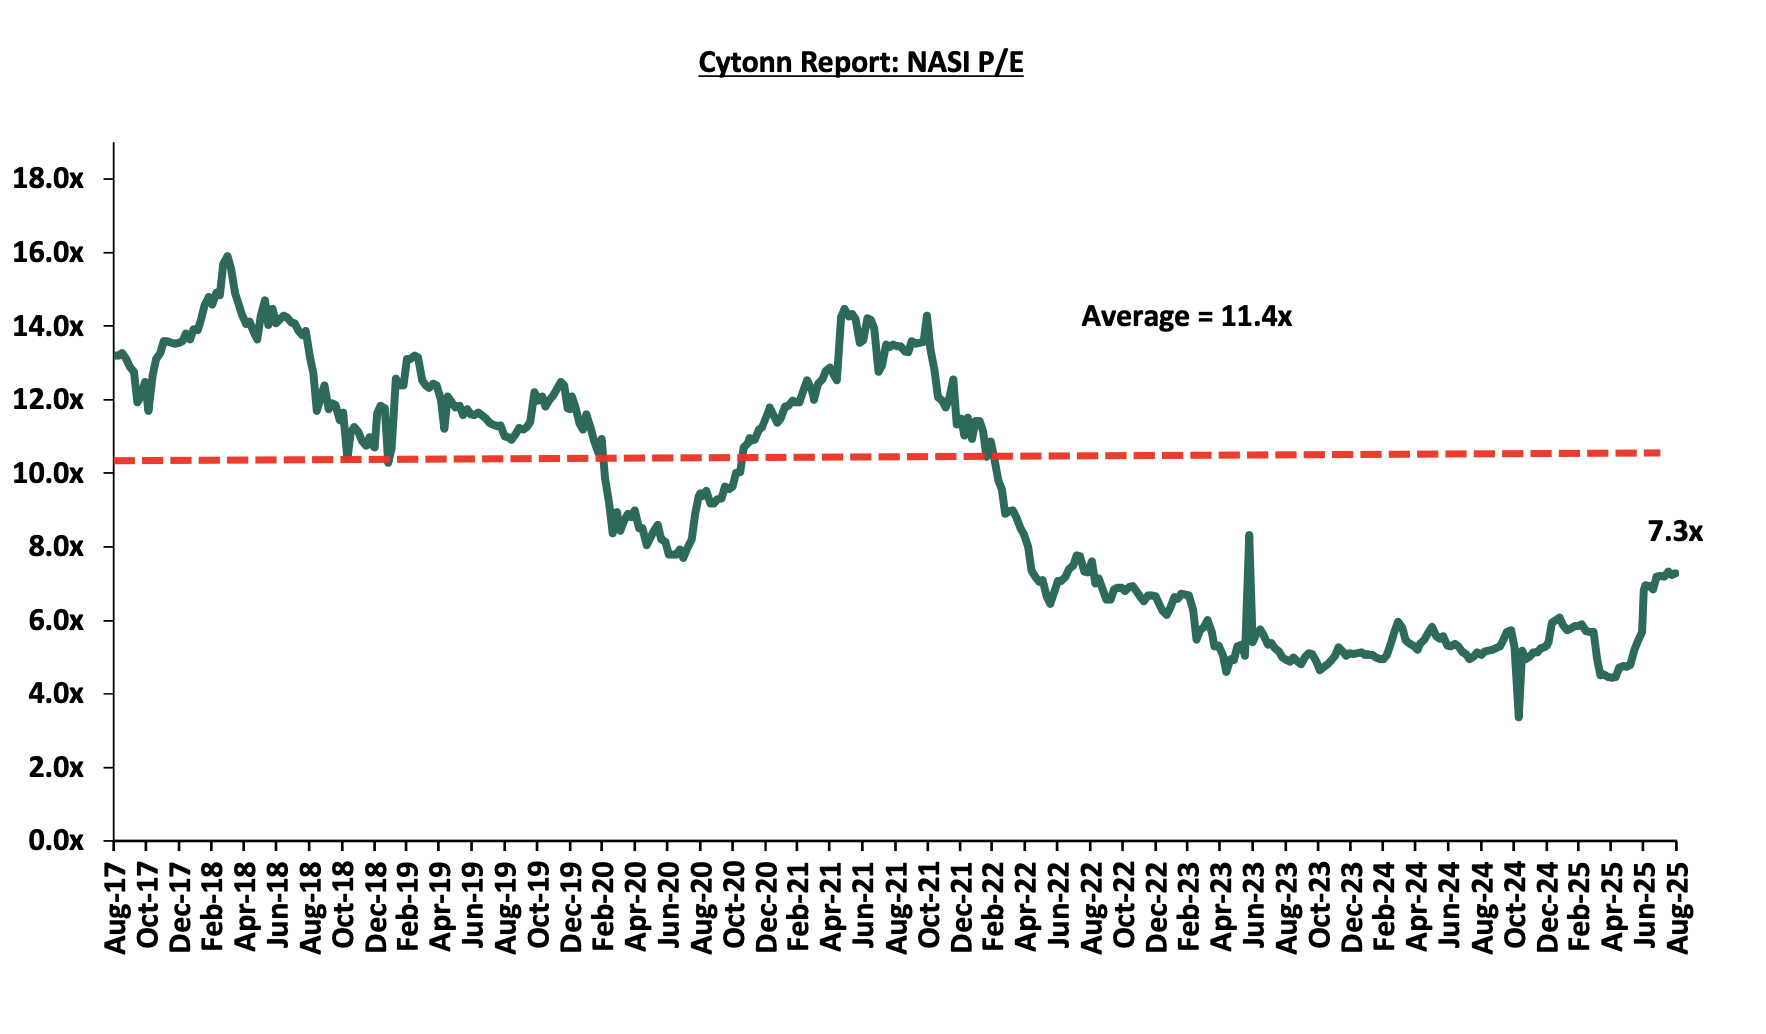
The market is currently trading at a price-to-earnings ratio (P/E) of 7.3x, 36.2% below the historical average of 11.4x. The dividend yield stands at 5.8%, 1.1% points above the historical average of 4.7%. Key to note, NASI’s PEG ratio currently stands at 0.9x, an indication that the market is undervalued relative to its future growth. A PEG ratio greater than 1.0x indicates the market is overvalued while a PEG ratio less than 1.0x indicates that the market is undervalued. The charts below indicate the historical P/E and dividend yields of the market;
Universe of Coverage:
|
|
Cytonn Report: Equities Universe of Coverage |
||||||||||||
|
Company |
Price as at 22/08/2025 |
Price as at 29/08/2025 |
w/w change |
m/m change |
YTD Change |
Year Open 2025 |
Target Price* |
Dividend Yield |
Upside/ Downside** |
P/TBv Multiple |
Recommendation |
|
|
|
Standard Chartered Bank |
315.3 |
320.0 |
1.5% |
1.2% |
6.8% |
285.3 |
393.4 |
14.1% |
37.0% |
1.8x |
Buy |
|
|
|
Co-op Bank |
17.4 |
17.8 |
2.6% |
4.7% |
(0.6%) |
17.5 |
21.6 |
8.4% |
29.7% |
0.6x |
Buy |
|
|
|
ABSA Bank |
20.0 |
20.1 |
0.8% |
3.1% |
4.7% |
18.9 |
23.5 |
8.7% |
25.6% |
1.3x |
Buy |
|
|
|
Equity Group |
55.0 |
56.0 |
1.8% |
10.9% |
14.5% |
48.0 |
61.7 |
7.6% |
17.8% |
1.0x |
Accumulate |
|
|
|
Stanbic Holdings |
183.8 |
182.5 |
(0.7%) |
2.8% |
10.9% |
139.8 |
193.4 |
11.4% |
17.3% |
1.1x |
Accumulate |
|
|
|
I&M Group |
38.2 |
38.7 |
1.2% |
5.5% |
8.1% |
36.0 |
41.2 |
7.8% |
14.4% |
0.7x |
Accumulate |
|
|
|
Jubilee Holdings |
288.8 |
294.5 |
2.0% |
20.7% |
30.9% |
174.8 |
312.9 |
4.6% |
10.8% |
0.4x |
Accumulate |
|
|
|
NCBA |
62.3 |
64.3 |
3.2% |
(3.0%) |
8.0% |
51.0 |
65.0 |
8.6% |
9.7% |
1.0x |
Hold |
|
|
|
KCB Group |
54.0 |
54.3 |
0.5% |
14.5% |
16.4% |
42.4 |
56.1 |
5.5% |
8.9% |
0.7x |
Hold |
|
|
|
Britam |
8.8 |
9.0 |
2.7% |
5.6% |
11.9% |
5.8 |
9.5 |
0.0% |
5.5% |
0.8x |
Hold |
|
|
|
Diamond Trust Bank |
87.8 |
89.8 |
2.3% |
12.9% |
16.2% |
66.8 |
87.1 |
7.8% |
4.8% |
0.3x |
Lighten |
|
|
|
CIC Group |
4.7 |
4.7 |
1.1% |
39.1% |
58.7% |
2.1 |
4.0 |
2.7% |
(12.1%) |
1.3x |
Sell |
|
|
|
|
*Target Price as per Cytonn Analyst estimates **Upside/ (Downside) is adjusted for Dividend Yield ***Dividend Yield is calculated using FY’2024 Dividends |
||||||||||||
Weekly Highlights
- NCBA Group H1’2025 Performance Highlight
Below is a summary of NCBA Group’s H1’2025 performance:
|
Balance Sheet Items |
H1'2024 |
H1'2025 |
y/y change |
|
Net Loans and Advances |
309.7 |
288.1 |
(7.0%) |
|
Government Securities |
182.6 |
180.1 |
(1.3%) |
|
Total Assets |
689.1 |
663.0 |
(3.8%) |
|
Customer Deposits |
528.9 |
497.0 |
(6.0%) |
|
Deposits per Branch |
4.6 |
4.2 |
(8.4%) |
|
Total Liabilities |
587.7 |
544.5 |
(7.3%) |
|
Shareholders’ Funds |
101.4 |
118.5 |
16.8% |
|
Key Ratios |
H1'2024 |
H1'2025 |
y/y change |
|
Loan to Deposit Ratio |
58.6% |
58.0% |
(0.6%) |
|
Government Securities to Deposit ratio |
34.5% |
36.2% |
1.7% |
|
Return on average equity |
23.1% |
21.0% |
(2.1%) |
|
Return on average assets |
3.2% |
3.4% |
0.2% |
|
Income Statement |
H1'2024 |
H1'2025 |
y/y change |
|
Net Interest Income |
16.5 |
20.8 |
26.7% |
|
Net non-Interest Income |
14.9 |
14.5 |
(2.9%) |
|
Total Operating income |
31.4 |
35.3 |
12.7% |
|
Loan Loss provision |
2.7 |
3.2 |
19.1% |
|
Total Operating expenses |
19.2 |
21.8 |
13.5% |
|
Profit before tax |
12.2 |
13.6 |
11.4% |
|
Profit after tax |
9.8 |
11.0 |
12.6% |
|
Core EPS (Kshs) |
6.0 |
6.7 |
12.6% |
|
Dividend Per Share (Kshs) |
2.25 |
2.50 |
11.1% |
|
Dividend Yield (Annualized) |
17.6% |
9.3% |
(8.3%) |
|
Dividend Payout ratio |
37.8% |
37.3% |
(0.5%) |
|
Income Statement Ratios |
H1'2024 |
H1'2025 |
y/y % points change |
|
Yield from interest-earning assets |
12.5% |
12.4% |
(0.1%) |
|
Cost of funding |
7.1% |
6.1% |
(1.0%) |
|
Net Interest Spread |
5.4% |
6.3% |
0.9% |
|
Net Interest Margin |
5.8% |
6.7% |
0.9% |
|
Cost of Risk |
8.6% |
9.1% |
0.5% |
|
Net Interest Income as % of operating income |
52.5% |
59.0% |
6.5% |
|
Non-Funded Income as a % of operating income |
47.5% |
41.0% |
(6.5%) |
|
Cost to Income Ratio |
61.2% |
61.6% |
0.4% |
|
Cost to Income Ratio without LLP |
52.6% |
52.5% |
(0.1%) |
|
Capital Adequacy Ratios |
H1'2024 |
H1'2025 |
y/y % points change |
|
Core Capital/Total Liabilities |
17.1% |
21.2% |
4.2% |
|
Minimum Statutory ratio |
8.0% |
8.0% |
0.0% |
|
Excess |
9.1% |
13.2% |
4.2% |
|
Core Capital/Total Risk Weighted Assets |
18.5% |
21.5% |
3.1% |
|
Minimum Statutory ratio |
10.5% |
10.5% |
0.0% |
|
Excess |
8.0% |
11.0% |
3.1% |
|
Total Capital/Total Risk Weighted Assets |
18.6% |
21.6% |
3.1% |
|
Minimum Statutory ratio |
14.5% |
14.5% |
0.0% |
|
Excess |
4.1% |
7.1% |
3.1% |
|
Liquidity Ratio |
51.6% |
55.8% |
4.2% |
|
Minimum Statutory ratio |
20.0% |
20.0% |
0.0% |
|
Excess |
31.6% |
35.8% |
4.2% |
Key Take-Outs:
- Increased earnings – Core earnings per share increased by 12.6% to Kshs 6.7, from Kshs 6.0 in H1’2024, mainly driven by the 12.7% increase in total operating income to Kshs 35.3 bn, from Kshs 31.4 bn in H1’2024, which outpaced the 13.5% increase in total operating expenses to Kshs 21.8 bn, from Kshs 19.2 bn in H1’2024
- Improved asset quality – The bank’s Asset Quality improved, with Gross NPL ratio reduced by 0.1% points to 12.18% in H1’ 2025 from 12.24% in H1’ 2024, attributable to the 6.3% decrease in gross loans to Kshs 313.1 bn, from Kshs 334.1 bn recorded in H1’2024, which outpaced the 6.8% decrease in gross non-performing loans to Kshs 38.1 bn, from Kshs 40.9 bn in H1’2024,
- Decreased Lending – The bank’s loan book recorded a contraction of 7.0% to Kshs 288.1 bn from Kshs 309.7 bn in H1’2024 attributed to increased credit risk aversion with NPLs decreasing to 12.18% in June 2025, from 12.24% in June 2024.
- Contracted Balance sheet- The balance sheet recorded a contraction as total assets declined by 3.8% to Kshs 663.0 bn, from Kshs 689.1 bn in H1’2024, mainly driven by a 7.0% loan book contraction to Kshs 288.1 bn from Kshs 309.7 bn in H1’2024.
- Declaration of dividends- The board of directors declared an interim dividend of Kshs 2.50 per share a 11.1% increase from Kshs 2.25 declared in H1’ 2024. This translates to an annualized dividend yield of 9.3% and a dividend payout ratio of 37.3%.
Going forward, the factors that would drive the group’s growth would be:
- Revenue diversification - The lender has also capitalized on revenue diversification and increasing the bottom line contribution of all the business lines.
Valuation Summary
- We are of the view that NCBA Group is a “accumulate” with a target price of Kshs 72.3 representing an upside of 16.0%, from the current price of 64.3 as of 29th August 2025, inclusive with a dividend yield of 3.9%.
NCBA Group is currently trading at a P/TBV of 1.0x and a P/E of 4.6x vs an industry average of 1.3x and 4.5x respectively
For a more detailed analysis please see our NCBA Group H1’2025 earnings note
- HF Group H1’2025 Performance Highlight
Below is a summary of HF Group’s H1’2025 performance:
|
Balance Sheet Items |
H1'2024 |
H1'2025 |
y/y change |
|
Government Securities |
37.9 |
38.9 |
2.7% |
|
Net Loans and Advances |
12.2 |
23.9 |
96.0% |
|
Total Assets |
63.7 |
76.9 |
20.7% |
|
Customer Deposits |
45.0 |
52.5 |
16.6% |
|
Deposits/Branch |
2.0 |
2.4 |
16.6% |
|
Total Liabilities |
54.4 |
60.2 |
10.5% |
|
Shareholders’ Funds |
9.3 |
16.8 |
79.8% |
|
Balance Sheet Ratios |
H1'2024 |
H1'2025 |
% y/y change |
|
Loan to Deposit Ratio |
84.2% |
74.2% |
(10.0%) |
|
Government Securities to Deposit Ratio |
27.1% |
45.5% |
18.4% |
|
Return on average equity |
5.2% |
6.8% |
1.6% |
|
Return on average assets |
0.8% |
1.3% |
0.5% |
|
Income Statement (Kshs Bn) |
H1'2024 |
H1'2025 |
y/y change |
|
Net Interest Income |
1.3 |
2.0 |
53.3% |
|
Net non-Interest Income |
0.7 |
0.8 |
17.9% |
|
Total Operating income |
2.0 |
2.9 |
40.9% |
|
Loan Loss provision |
(0.2) |
(0.2) |
25.9% |
|
Total Operating expenses |
(1.8) |
(2.2) |
23.7% |
|
Profit before tax |
0.3 |
0.7 |
148.3% |
|
Profit after tax |
0.3 |
0.6 |
134.5% |
|
Core EPS |
1.4 |
0.7 |
(52.2%) |
|
Income Statement Ratios |
H1'2024 |
H1'2025 |
y/y change |
|
Yield from interest-earning assets |
11.7% |
12.3% |
0.6% |
|
Cost of funding |
6.4% |
6.8% |
0.4% |
|
Net Interest Spread |
5.3% |
5.5% |
0.2% |
|
Net Interest Margin |
5.3% |
5.9% |
0.6% |
|
Cost of Risk |
8.2% |
7.3% |
(0.9%) |
|
Net Interest Income as % of operating income |
65.0% |
70.8% |
5.7% |
|
Non-Funded Income as a % of operating income |
35.0% |
29.2% |
(5.7%) |
|
Cost to Income Ratio |
86.2% |
75.7% |
(10.5%) |
|
Cost to Income Ratio (without LLP) |
78.0% |
68.4% |
(9.7%) |
|
Capital Adequacy Ratios |
H1'2024 |
H1'2025 |
% points change |
|
Core Capital/Total Liabilities |
4.0% |
17.1% |
13.1% |
|
Minimum Statutory ratio |
8.0% |
8.0% |
0.0% |
|
Excess |
(4.0%) |
9.1% |
13.1% |
|
Core Capital/Total Risk Weighted Assets |
4.6% |
21.3% |
16.7% |
|
Minimum Statutory ratio |
10.5% |
10.5% |
0.0% |
|
Excess |
(5.9%) |
10.8% |
16.7% |
|
Total Capital/Total Risk Weighted Assets |
8.1% |
24.2% |
16.1% |
|
Minimum Statutory ratio |
14.5% |
14.5% |
0.0% |
|
Excess |
(6.4%) |
9.7% |
16.1% |
|
Liquidity Ratio |
24.9% |
51.4% |
26.5% |
|
Minimum Statutory ratio |
20.0% |
20.0% |
0.0% |
|
Excess |
4.9% |
31.4% |
26.5% |
Key Take-Outs:
- Improved Profitability – HF posted a 134.5% increase in Profit After Tax to Kshs 0.6 bn from Kshs 0.3 bn in H1’2024, supported by a 53.3% growth in net interest income to Kshs 2.0 bn from Kshs 1.3 bn in H1’2024 and a 17.9% increase in non-interest income to Kshs 0.8 bn from Kshs 0.7 bn in H1’2024. However, operating expenses rose by 23.7% to Kshs 2.2 bn from Kshs 1.8 bn, weighing on performance, while core EPS declined by 52.2% to Kshs 0.7 from Kshs 1.4 due to dilution from the Kshs 6.0 bn rights issue in 2024.
- Improved asset quality – The bank’s asset quality improved marginally, as the Gross NPL ratio declined to 24.0% in H1’2025 from 24.2% in H1’2024. This was supported by a 2.5% growth in gross loans to Kshs 47.6 bn from Kshs 46.4 bn, which outpaced the 2.0% increase in gross non-performing loans to Kshs 11.4 bn from Kshs 11.2 bn.
- Expanded Balanced sheet - The balance sheet recorded an expansion as total assets increased by 20.7% to Kshs 76.9 bn, from Kshs 63.7 bn in H1’2024, mainly driven by a 96.0% increase in governments securities holdings to Kshs 23.9 bn, from 12.2 bn in H1’2024, coupled with a 2.7% increase in net loans and advances to Kshs 38.9 bn, from Kshs 37.9 bn in H1’2024.
- Increased lending- Customer net loans and advances increased by 2.7% to Kshs 38.9 bn in H1’2025, from Kshs 37.9 bn in H1’2024.
For a more detailed analysis please see our HF Group’s H1’2025 earnings note
Asset Quality:
The table below shows the asset quality of the 10 listed banks using several metrics:
|
Cytonn Report: Listed Banks Asset Quality in H1’2025 |
||||||
|
|
H1'2025 NPL Ratio* |
H1'2024 NPL Ratio** |
% point change in NPL Ratio |
H1'2025 NPL Coverage* |
H1'2024 NPL Coverage** |
% point change in NPL Coverage |
|
Absa Bank Kenya |
13.2% |
11.5% |
1.7% |
66.6% |
62.3% |
4.3% |
|
Equity Group |
15.3% |
13.9% |
1.4% |
62.4% |
58.8% |
3.6% |
|
Stanbic Holdings |
9.5% |
8.9% |
0.6% |
82.7% |
75.0% |
7.7% |
|
Cooperative Bank |
17.3% |
16.7% |
0.6% |
65.8% |
67.7% |
(1.9%) |
|
KCB Group |
17.9% |
18.1% |
(0.2%) |
64.3% |
59.5% |
4.8% |
|
I&M Group |
11.0% |
11.4% |
(0.5%) |
65.4% |
57.9% |
7.5% |
|
Diamond Trust Bank |
12.9% |
13.5% |
(0.6%) |
45.9% |
44.4% |
1.5% |
|
Standard Chartered Bank |
6.0% |
8.4% |
(2.4%) |
81.4% |
85.1% |
(3.7%) |
|
NCBA Bank |
12.2% |
12.2% |
(0.1%) |
65.5% |
59.8% |
5.7% |
|
HF Group |
24.2% |
24.0% |
0.1% |
75.6% |
75.4% |
0.2% |
|
Mkt Weighted Average* |
13.8% |
13.6% |
0.2% |
67.8% |
64.9% |
2.9% |
|
*Market cap weighted as at 29/08/2025 |
||||||
Key take-outs from the table include;
- Asset quality for the 10 listed banks deteriorated during H1’2025, with market-weighted average NPL ratio increasing by 0.2% points to 13.8% from 13.6% in H1’2024 largely driven by the increase in Absa and Equity, and,
- Market-weighted average NPL Coverage for the ten listed banks increased by 2.9% points to 67.8% in H1’2025 from 64.9% recorded in H1’2024. The increase was attributable to Stanbic Bank’s coverage ratio increasing by 7.7% points to 82.7% from 75.0% in H1’2024, coupled with I&M Group’s NPL coverage ratio increasing by 7.5% points to 65.4% from 57.9% in H1’2024.
Summary Performance
The table below shows the performance of the 10 listed banks using several metrics
|
Cytonn Report: Listed Banks Performance in H1’2025 |
||||||||||||||
|
Bank |
Core EPS Growth |
Interest Income Growth |
Interest Expense Growth |
Net Interest Income Growth |
Net Interest Margin |
Non-Funded Income Growth |
NFI to Total Operating Income |
Growth in Total Fees & Commissions |
Deposit Growth |
Growth in Government Securities |
Loan to Deposit Ratio |
Loan Growth |
Return on Average Equity |
|
|
I&M Group |
37.9% |
3.1% |
(20.3%) |
23.7% |
8.4% |
12.9% |
25.4% |
14.8% |
2.4% |
47.8% |
67.6% |
2.1% |
19.6% |
|
|
Diamond Trust Bank |
23.6% |
0.1% |
(10.8%) |
11.7% |
6.0% |
(5.0%) |
27.7% |
8.9% |
11.9% |
17.1% |
59.7% |
7.7% |
11.3% |
|
|
Equity Group |
16.8% |
(0.6%) |
(18.0%) |
9.1% |
7.5% |
(4.4%) |
40.8% |
3.1% |
1.6% |
21.6% |
62.5% |
4.3% |
22.8% |
|
|
NCBA Group |
12.6% |
(10.7%) |
(39.3%) |
26.7% |
6.7% |
(2.9%) |
41.0% |
-0.3% |
(6.0%) |
(1.3%) |
58.0% |
(7.0%) |
21.0% |
|
|
Absa Bank Kenya |
9.1% |
(8.3%) |
(21.3%) |
(2.9%) |
9.8% |
3.3% |
29.0% |
13.8% |
2.3% |
70.3% |
84.4% |
(3.6%) |
27.0% |
|
|
Co-operative Bank |
8.4% |
12.6% |
(3.3%) |
23.1% |
8.6% |
(8.2%) |
32.5% |
(3.4%) |
7.9% |
25.5% |
71.4% |
4.2% |
18.8% |
|
|
KCB Group |
8.0% |
3.2% |
(13.1%) |
12.7% |
8.4% |
(11.3%) |
29.9% |
1.8% |
(0.3%) |
(2.7%) |
73.7% |
6.1% |
23.4% |
|
|
Stanbic Group |
(9.3%) |
(10.5%) |
(35.3%) |
(5.8%) |
5.4% |
0.8% |
39.2% |
12.7% |
(2.5%) |
47.1% |
67.2% |
(2.2%) |
18.2% |
|
|
Standard Chartered Bank |
(21.4%) |
(10.5%) |
(29.4%) |
(7.4%) |
9.4% |
(29.1%) |
30.7% |
-2.0% |
5.1% |
51.1% |
52.4% |
1.9% |
27.5% |
|
|
HF Group |
(52.2%) |
19.6% |
(6.7%) |
53.3% |
5.9% |
17.9% |
29.2% |
19.6% |
16.6% |
96.0% |
74.2% |
2.7% |
6.8% |
|
|
H1'2025 Mkt Weighted Average* |
6.5% |
(1.2%) |
(19.3%) |
9.4% |
8.1% |
(6.3%) |
33.5% |
4.6% |
2.4% |
31.0% |
67.5% |
2.3% |
22.3% |
|
|
H1’2024 Mkt Weighted Average** |
28.9% |
29.7% |
58.6% |
17.6% |
7.2% |
13.6% |
38.0% |
10.8% |
16.1% |
(9.3%) |
66.5% |
0.4% |
22.7% |
|
|
*Market cap weighted as at 29/08/2025 |
||||||||||||||
|
**Market cap weighted as at 24/08/2024 |
||||||||||||||
Key take-outs from the table include:
- The 10 listed banks recorded a 6.5% market weighted average increase in core Earnings per Share (EPS) in H1’2025, compared to the weighted average growth of 28.9% in H1’2024, an indication of declined performance attributable to the declined operating environment experienced during H1’2025,
- Interest income growth recorded a weighted average decline of 1.2% in H1’2025, compared to 29.7% in H1’2024, while interest expenses recorded a market-weighted average decline of 19.3% in H1’2025 compared to a growth of 58.6% in H1’2024,
- The Banks’ net interest income recorded a weighted average growth of 9.4% in H1’2025, a decline from the 17.6% growth recorded over a similar period in 2024, while the non-funded income declined by 6.3% in H1’2025 compared to the 13.6% growth recorded in H1’2024 despite the revenue diversification strategies implemented by most banks, and,
- The Banks recorded a weighted average deposit growth of 2.4%, compared to the market-weighted average deposit growth of 16.1% in H1’2024.
- Britam H1’2025 Performance Highlight
During the week, Britam Holdings released their H1’ 2025 results. Britam’s Profit After Tax (PAT) decreased by 20.7% to Kshs 1.7 bn, from Kshs 2.2 bn recorded in H1’2024.The performance was mainly driven by the 39.4% decrease in net insurance income to Kshs 1.3 bn from Kshs 2.1 bn recorded in H1’2024 coupled with the 29.7% increase in net insurance and finance expenses to Kshs 16.0 bn from the Kshs 12.3 bn recorded in H1’2024.
|
Cytonn Report: Britam Holdings Income Statement |
|||
|
Item (All figures in Bns) |
H1'2024 |
H1'2025 |
y/y change |
|
Insurance Revenue |
17.8 |
19.7 |
10.6% |
|
Insurance service expenses |
13.6 |
15.1 |
11.4% |
|
Net Insurance income |
2.1 |
1.3 |
(39.4%) |
|
Net Investment Income |
13.3 |
17.3 |
30.2% |
|
Net Insurance and Finance expenses |
12.3 |
16.0 |
29.7% |
|
Other Income |
0.6 |
0.4 |
(30.5%) |
|
Other operating expenses |
1.2 |
1.2 |
0.0% |
|
Profit Before Tax |
3.0 |
2.5 |
(15.9%) |
|
Profit After Tax |
2.2 |
1.7 |
(20.7%) |
|
Core EPS |
0.9 |
0.7 |
(22.4%) |
|
Cytonn Report: Birtam Holdings Balance Sheet |
|||
|
Item (All figures in Bns) |
H1'2024 |
H1'2025 |
y/y change |
|
Investment assets |
167.8 |
206.9 |
23.3% |
|
Intangible Assets |
1.9 |
2.3 |
20.7% |
|
Total Assets |
188.8 |
225.0 |
19.2% |
|
Insurance Contract Liabilities |
148.2 |
179.5 |
21.1% |
|
Provisions & other payables |
11.9 |
13.3 |
12.3% |
|
Total liabilities |
162.5 |
193.8 |
19.2% |
|
Shareholder funds |
26.3 |
31.0 |
17.6% |
|
Minority Interest |
0.3 |
0.3 |
9.0% |
|
Total Equity |
26.6 |
31.2 |
17.5% |
Key take outs from the results:
- Core Earnings Per share decreased by 15.0% to Kshs 0.7 from Kshs 0.8 in H1’2024, mainly driven by the 39.4% decrease in net insurance income to Kshs 1.3 bn from Kshs 2.1 bn recorded in H1’2024 coupled with the 29.7% increase in net insurance and finance expenses to Kshs 16.0 bn from the Kshs 12.3 bn recorded in H1’2024.
- Net Investment Income (NII) increased by 30.2% to Kshs 17.3 bn in H1’2025, from Kshs 13.3 bn in H1’2024. This was majorly attributable to the 15.8% increase in interest and dividend income to 10.6 bn from Kshs 9.1 bn in H1’2024, coupled with a 31.7% increase in income from investment property to 0.4 bn from the Kshs 0.3 bn in H1’2024
- Insurance revenue increased by 10.6% to Kshs 19.7 bn in H1’2025 from Kshs 17.8 bn in H1’2024, while insurance expenses increased by 11.4% to Kshs 15.1 bn from Kshs 13.6 bn in H1’2024, and net expenses from reinsurance contracts increased by 55.9% to Kshs 3.3 bn from Kshs 2.1 bn in H1’2024, translating to a Net insurance service result decrease of 39.4% to Kshs 1.3 bn from Kshs 2.1 bn in H1’2024,
- The balance sheet recorded an expansion as total assets increased by 19.2% to Kshs 225.0 bn in H1’2025 from Kshs 188.8 bn in H1’2024 mainly driven by 23.3% increase in investment assets to Kshs 206.9 bn from Kshs 167.8 bn in H1’2024, coupled with a 32.3% increase in reinsurance contract assets to Kshs. 9.3 bn from the Kshs.7.0 bn recorded in H1 2024.
- Total liabilities increased by 19.2% to Kshs 193.8 bn from Kshs 162.5 bn in H1’2024, majorly on the back of Insurance contract liabilities 21.1% increase to Kshs 179.5 bn from Kshs 148.2 bn in H1’2024, coupled with the 12.3% increase in provisions and other payables to Kshs 13.3 bn from Kshs 11.9 bn in H1’2024
Other highlights from the release include:
- Non-declaration of dividends – The Group’s board of directors did nor recommend any dividends for the sixth consecutive year citing the group’s attempt to conserve capital.
Going forward, the factors that would drive the company’s growth would be:
- Microinsurance partnerships – With 43.0% market share in microinsurance, Britam continues to leverage on this segment through internal initiatives and partnerships. Partnerships such as that between the company and Bonfire adventures and Digital innovation hub Ohala to offer travel insurance, and another with Voltic Kenya to provide travel insurance and online ticketing are some notable initiatives
- Diversified Products – On top of their mainstream insurance products, Britam has innovatively introduced several products into the market. These diversified products, such as school personal accidents, newborn baby insurance products and their unit trust products, will contribute to a continued growth of the company’s growth.
Valuation Summary:
- We are of the view that Britam Holdings Plc is a “Hold” with a target price of Kshs 9.5 representing a upside of 5.5%, from the current price of 9.0 as of 29th August 2025.
- Britam is currently trading at a P/TBV of 0.8x and a P/E of 4.5x vs an industry average of 0.7x and 3.9x respectively.
- CIC Group H1’2025 Performance Highlight
During the week, CIC Group released their H1’2025 results. CIC’s Profit After Tax decreased by 10.1% to Kshs 0.6 bn in H1’ 2025, from Kshs 0.7 bn recorded in H1’2024. The performance was mainly driven by a significant 87.7% decrease in net insurance service revenue to Kshs 0.1 bn in H1’ 2025, from Kshs 1.0 bn in H1’2024, attributable to the 23.4% increase in insurance service expenses to Kshs 12.8 bn in H1’2025, from Kshs 10.4 bn in H1’2024.
|
Cytonn Report: CIC Group Income Statement |
|||
|
Item (All figures in Bns) |
H1’2024 |
H1’2025 |
y/y change |
|
Insurance Revenue |
12.8 |
13.9 |
8.4% |
|
Insurance service expenses |
(10.4) |
(12.8) |
23.4% |
|
Net expenses from reinsurance contracts held |
(1.4) |
(1.0) |
(31.5%) |
|
Net Insurance income |
1.0 |
0.1 |
(87.7%) |
|
Net Investment Income |
1.8 |
2.7 |
35.7% |
|
Net investment result |
0.7 |
1.5 |
121.5% |
|
Other Operating Expenses |
(0.7) |
(0.9) |
28.1% |
|
Operating Profit |
1.6 |
1.5 |
(4.4%) |
|
Profit Before Tax |
1.3 |
1.2 |
(6.1%) |
|
Profit After Tax |
0.7 |
0.6 |
(10.1%) |
|
Core EPS in Kshs |
0.3 |
0.2 |
(23.3%) |
|
Cytonn Report: CIC Group Balance Sheet |
|||
|
Item (All figures in Bns) |
H1'2024 |
H1'2025 |
y/y change |
|
Investment assets |
7.8 |
3.7 |
(52.6%) |
|
Financial Investments |
40.8 |
51.2 |
25.6% |
|
Property & Equipment and Intangibles |
1.5 |
1.4 |
(1.4%) |
|
Total Assets |
57.8 |
70.1 |
21.4% |
|
Insurance Contract Liabilities |
39.6 |
48.3 |
21.8% |
|
Provisions & other payables |
3.8 |
4.3 |
13.2% |
|
Total liabilities |
48.6 |
58.0 |
19.3% |
|
Shareholder funds |
9.1 |
12.1 |
32.8% |
|
Minority Interest |
(0.1) |
(0.1) |
(44.7%) |
|
Total Equity |
9.0 |
12.1 |
34.1% |
Key take outs from the results:
- Core earnings per share declined by 23.3% to Kshs 0.2 in H1’2025, from Kshs 0.3 in H1’2024, mainly attributable to an 87.7% decrease in net insurance income to Kshs 0.1 bn in H1’2025, from Kshs 1.0 bn in H1’2024. This was despite a strong performance in investments, with the net investment result increasing by 121.5% to Kshs 1.5 bn in H1’2025, from Kshs 0.7 bn in H1’2024, and net investment income rising by 127.0% to Kshs 1.5 bn in H1’2025, from Kshs 0.7 bn in H1’2024, which partially cushioned the decline.
- Net investment result increased by 121.5% to Kshs 1.5 bn in H1’2025, from Kshs 0.7 bn in H1’2024, mainly attributable to the 35.7% increase in investment income to Kshs 2.7 bn, from Kshs 1.8 bn. The performance was, however, weighed down by net finance expenses from insurance contracts, which increased by 23.6% to Kshs 2.2 bn in H1’2025 from Kshs 1.8 bn in H1’2024.
- Insurance service expenses rose by 23.4% to Kshs 12.8 bn in H1’2025, from Kshs 10.4 bn in H1’2024, outpacing the 8.4% growth in insurance revenue to Kshs 13.9 bn, from Kshs 12.8 bn. At the same time, net expenses from reinsurance contracts held decreased by 31.5% to Kshs 1.0 bn, from Kshs 1.4 bn in H1’2024. Consequently, net insurance income declined sharply by 87.7% to Kshs 0.1 bn, from Kshs 1.0 bn in H1’2024.
- The balance sheet recorded an expansion as total assets increased by 21.4% to Kshs 70.1 bn in H1’2025, from Kshs 57.8 bn in H1’2024, mainly driven by a 25.6% increase in financial investments to Kshs 51.2 bn, from Kshs 40.8 bn in H1’2024. The growth was however weighed down by a 52.6% decrease in investment assets to Kshs 3.7 bn, from Kshs 7.8 bn in H1’2024, and,
- Total liabilities increased by 19.3% to Kshs 58.0 bn in H1’2025 from Kshs 48.6 bn in H1’2024, mainly attributable to the 21.8% increase in insurance contract liabilities to Kshs 48.3 bn from Kshs 39.6 bn in H1’2024, coupled with a 13.2% increase in provisions and other payables to Kshs 4.3 bn from Kshs 3.8 bn in H1’2024.
Other highlights from the release include:
- Declaration of dividends – The Group’s Board of Directors did not declare any interim dividend for the H1’2025 ended June 30, 2025, consistent with the approach taken in H1’2024.
Going forward, the factors that would drive the company’s growth would be:
- Digital Transformation: Continued investment in technology to improve efficiency and customer experience, with initiatives such as EasyBima enhancing accessibility, convenience and faster policy onboarding for clients.
- Product and Business Diversification: The Group is broadening its revenue base through ventures such as CIC Micro Insurance Limited and CIC Pharmacy Limited, tapping into new segments like micro-insurance and healthcare services to reduce reliance on traditional insurance income.
- Strengthened Balance Sheet and Capital Base: With total assets rising by 21.4% y/y to Kshs 70.1 bn and shareholder funds up 32.8% to Kshs 12.1 bn in H1’2025, the Group is better positioned to underwrite larger risks, attract strategic partnerships, and fund long-term growth initiatives.
Valuation Summary:
- We are of the view that CIC Group is a “Sell” with a target price of Kshs 4.0 representing an downside of 14.8%, from the current price of 4.7 as of 29th August 2025, CIC Group is currently trading at a P/TBV of 1.9x and a P/E of 2.6x vs an industry average of 0.7x and 3.9x respectively.
- Jubilee Holdings Ltd H1’2025 Results
During the week, Jubilee Holdings Limited released their H1’ 2025 results. Jubilee’s Profit After Tax (PAT) increased by 21.7% to Kshs 3.1 bn, from Kshs 2.5 bn recorded in H1’ 2024. The performance was mainly driven by a 32.6% increase in Insurance Services Revenues to Kshs 16.7 bn, from Kshs 12.6 bn in H1’2024, but was however weighed down by the 36.6% increase in Insurance Services Expenses to Kshs 15.4 bn in H1’2025, from Kshs 11.3 bn in H1’2024.
|
Cytonn Report: Jubilee Holdings Ltd Income Statement |
|||
|
Item (All figures in Bns) |
H1’2024 |
H1’2025 |
y/y change |
|
Insurance Revenue |
12.6 |
16.7 |
32.6% |
|
Insurance service expenses |
(11.3) |
(15.4) |
36.6% |
|
Net expenses from reinsurance contracts held |
(0.4) |
(0.2) |
(45.8%) |
|
Net Insurance income |
1.0 |
1.1 |
15.0% |
|
Net insurance finance result |
-0.9 |
-1.6 |
76.1% |
|
Net non-attributable income (expenses) |
1.1 |
0.7 |
(35.2%) |
|
Profit Before Tax |
2.9 |
3.4 |
15.5% |
|
Taxation |
(0.4) |
(0.3) |
(20.7%) |
|
Profit After Tax |
2.5 |
3.1 |
21.7% |
|
Core EPS |
34.6 |
41.6 |
20.4% |
|
Cytonn Report: Jubilee Holdings Ltd Balance Sheet |
|||
|
Item (All figures in Bns) |
H1’2024 |
H1’2025 |
y/y change |
|
Investment assets |
181.6 |
206.8 |
13.8% |
|
Insurance Assets |
3.7 |
3.7 |
1.5% |
|
Total Assets |
202.6 |
228.4 |
12.7% |
|
Insurance Contract Liabilities |
138.1 |
166.8 |
20.8% |
|
Provisions & other payables |
7.6 |
7.8 |
2.0% |
|
Total liabilities |
145.7 |
174.6 |
19.8% |
|
Shareholder funds |
54.3 |
51.7 |
(4.8%) |
|
Minority Interest |
2.6 |
2.1 |
(17.6%) |
|
Total Equity |
56.9 |
53.8 |
(5.3%) |
Key take outs from the results:
- Core Earnings Per share increased by 20.4% to Kshs 41.6 from Kshs 34.6 in H1’2024, driven by the 32.6% increase in Insurance Services Revenues to Kshs 16.7 bn, from Kshs 12.6 bn in H1’2024, but was however weighed down by the 36.6% increase in Insurance Services Expenses to Kshs 15.4 bn in H1’2025, from Kshs 11.3 bn in H1’ 2024,
- Net Insurance finance result increased significantly by 76.1% to Kshs 1.6 bn in H1’ 2025, from Kshs 0.9 bn in H1’ 2024, while net non-attributable expenses decreased by 35.2% to Kshs 0.7 bn, from Kshs 1.1 bn in H1’ 2025, resulting in a 15.5% increase in the Profit Before Tax to Kshs 3.4 bn in H1’ 2025, from Kshs 2.9 bn recorded in H1’ 2024,
- Insurance services revenue increased by 32.6% to Kshs 16.7 bn in H1’ 2025 from Kshs 12.6 bn in H1’ 2024, while insurance expenses increased by 36.6% to Kshs 15.4 bn from Kshs 11.3 bn in H1’ 2024, and the net expenses from reinsurance contracts held decreased significantly by 45.8% to Kshs 0.2 bn, from Kshs 0.4 bn in H1’ 2024. This translated to a Net insurance service result increase of 76.1% to Kshs 1.6 bn from Kshs 0.9 bn in H1’ 2024,
- The balance sheet recorded an expansion as total assets increased by 12.7% to Kshs 228.4 bn in H1’ 2025 from Kshs 202.6 bn in H1’ 2024 mainly driven by 13.8% increase in investment assets to Kshs 206.8 bn from Kshs 181.6 bn in H1’ 2024, coupled with 1.5% increase in insurance assets to remain relatively unchanged from Kshs 3.7 bn recorded in H1’ 2024, and,
- Total liabilities increased by 19.8% to Kshs 174.6 bn from Kshs 145.7 bn in H1’ 2024, majorly on the back of Insurance contract liabilities 20.8% increase to Kshs 166.8 bn from Kshs 138.1 bn in H1’ 2024, and the 2.0% decrease in other liabilities to Kshs 7.8 bn from Kshs 7.6 bn in H1’ 2024.
Other highlights from the release include:
- Declaration of dividends – The board of directors did not declare a dividend for the period ending H1’2025.
Going forward, the factors that would drive the company’s growth would be:
- Strong regional footprint and diversification: Its presence in countries such as Kenya, Uganda and Tanzania allows Jubilee to tap into multiple economies. Moreover, diversification across life, health, and general insurance creates multiple revenue streams.
- Strategic partnerships: Partnerships with global players like Allianz enhance expertise, capital strength, and global best practices.
Valuation Summary:
- We are of the view that Jubilee Insurance is an “accumulate” with a target price of Kshs 312.9 representing an upside of 10.8%, from the current price of Kshs 288.5 as of 29th August 2025.
- Kenya Re Corporation Limited H1’2025 Financial Results.
During the week, Kenya Re corporation released their H1’2025 results, recording an 49.5% increase in Profit After Tax to Kshs 1.6 bn, from the Kshs 1.1 bn recorded in H1’2024. The performance was mainly driven by a 18.2% decrease in Insurance service expense to Kshs 5.4 bn from Kshs 6.6 bn in H1’2024 which outpaced the 14.8% decrease in Insurance revenue to Kshs 6.3 bn from Kshs 7.4 bn in H1’2024.
|
Cytonn Report: Kenya Re's Income Statement |
|||
|
Income Statement (Kshs bn) |
H1'2024 |
H1'2025 |
y/y change |
|
Insurance Revenue |
7.4 |
6.3 |
(14.8%) |
|
Insurance Service Expense |
(6.6) |
(5.4) |
(18.2%) |
|
Net Expense from reinsurance contracts held |
(0.2) |
(0.6) |
225.3% |
|
Insurance Service Result |
0.6 |
0.3 |
(50.1%) |
|
Investment Income |
1.8 |
2.7 |
51.2% |
|
Net Insurance and Investment Revenue |
2.4 |
2.9 |
18.2% |
|
Operating and other expenses |
(1.0) |
(0.7) |
(32.2%) |
|
Profit before tax |
1.5 |
2.24 |
48.4% |
|
Income tax expense |
(0.5) |
(0.66) |
45.8% |
|
Profit after tax |
1.1 |
1.6 |
49.5% |
|
Core EPS |
0.4 |
0.3 |
(26.3%) |
|
Cytonn Report: Kenya Re's Balance Sheet |
|||
|
Balance Sheet items |
H1'2024 |
H1'2025 |
y/y change |
|
Government Securities |
24.8 |
25.1 |
1.1% |
|
Reinsurance contract assets |
1.1 |
0.2 |
(82.1%) |
|
Other assets |
39.7 |
43.6 |
9.7% |
|
Total assets |
65.7 |
68.9 |
4.9% |
|
Insurance and Reinsurance contract liabilities |
13.0 |
14.8 |
14.6% |
|
Payables and Other liabilities |
3.8 |
2.1 |
(43.9%) |
|
Total liabilities |
16.8 |
17.0 |
1.2% |
|
Shareholder funds |
48.9 |
51.9 |
6.2% |
Key take outs from the results:
- Core Earnings Per share decreased by 26.3% to Kshs 0.3 from Kshs 0.4 per share in H1’2024, driven by the FY’24 bonus issue that doubled the number of outstanding shares to 5.6 bn from 2.8 bn thereby diluting per share earnings even as overall profitability improved.
- Net Investment revenue increased by 51.2% to Kshs 2.7 bn in H1’2025, from Kshs 1.8 bn in H1’2024 attributable to 4.1% increase in investment income to 2.7 bn in H1’2024 from 2.6 bn in H1’2025 coupled with the 97.4% decrease in net foreign exchange loss to 0.02 bn in H1’2025 from 0.8 bn H’2025.
- Insurance revenue increased by 14.8% to Kshs 6.3 bn in H1’2025 from Kshs 7.4 bn in H1’2024, while insurance service expenses decreased by 18.2% to Kshs 5.4 bn from Kshs 6.6 bn in H1’2024. In addition, there was a 225.3% increase in net expenses from reinsurance contracts held to Kshs 0.6 bn from Kshs 0.2 bn registered in H1’2024. This translated to a net insurance service result decrease of 50.1% to Kshs 0.3 bn from Kshs 0.6 bn in H1’2024,
- The balance sheet recorded an expansion as total assets increased by 4.9% to Kshs 68.9 bn in H1’2025 from Kshs 65.7 bn in H1’2024 mainly driven by 9.7% increase in other assets to Kshs 43.6 bn form Kshs 39.7 bn in H1’2024, coupled with a 1.1% increase in government securities to Kshs 25.1 bn from Kshs 24.8 bn in H1’2024.
- Total liabilities increased by 1.2% to Kshs 17.0 bn from Kshs 16.8 bn in H1’2024, majorly on the back of the 14.6% increase in insurance and reinsurance contract liabilities to Kshs 14.8 bn from Kshs 13.0 bn in H1’2024.
Other highlights from the release include:
- Non-declaration of dividends – The directors of Kenya Re corporation did not recommend a dividend payment for H1’2025.
Going forward, the factors that would drive Kenya Re’s growth would be:
- Regional and international expansion – Kenya Re is implementing a deliberate growth strategy through geographic diversification, with plans to set up a subsidiary in Tanzania and a branch in India. The Tanzanian subsidiary, requiring an initial capital injection of USD 6.0 mn, will enable the reinsurer to comply with new regulations that bar foreign reinsurers without local presence from underwriting in that market, thereby regaining previously lost business. The India branch, located in a Special Economic Zone (SEZ), will benefit from a 10–15-year tax holiday and foreign currency operations, giving Kenya-Re both a competitive edge and an opportunity to build dollar reserves. The expansion will initially target fire, engineering, and marine lines, with expected revenues of Kshs 1.5 bn in the first year and a break-even point within three years.
- Earnings recovery and strong investment performance – In H1’2025, Kenya Re posted a 49.5% growth in PAT to Kshs 1.6 bn, up from Kshs 1.1 bn in a similar period in 2024, supported by a sharp reduction in foreign exchange losses to Kshs 22.2 mn from Kshs 844.2 mn. The improvement came despite a weaker insurance service result, which fell to Kshs 302.9 mn from Kshs 606.6 mn due to higher reinsurance contract expenses. The balance sheet strengthened with an expanded asset base of Kshs 68.9 bn, reflecting higher cash balances, deposits, and quoted equities. This performance underscores Kenya Re’s ability to offset underwriting volatility with prudent investment strategies and disciplined cost management.
- Future growth pipeline – Beyond India and Tanzania, Kenya Re is eyeing new markets across Africa and the Middle East, including South Africa, Egypt, Ethiopia, the Democratic Republic of Congo, and Nigeria. This pipeline of expansion opportunities will not only diversify the firm’s revenue streams but also reinforce its ambition of becoming a leading Pan-African and international reinsurer. With presence already established in over 80 markets, as well as subsidiaries in Cote D’Ivoire, Zambia, and Uganda, Kenya Re is well positioned to leverage its scale, reputation, and government backing to deepen market penetration and strengthen its competitive positioning across emerging economies.
Monthly Highlights
- During the month, Sanlam Kenya Holdings released their H1’2025 results, recording an 89.0% decrease in Profit After Tax to Kshs 0.03 bn, from the Kshs 0.3 bn recorded in H1’2024. The performance was mainly driven by a 51.3% increase Net expenses from reinsurance contracts held, to Kshs 0.4 bn from Kshs 0.3 bn in H1’2024, but supported by a 34.0% increase in insurance investment revenue to Kshs 3.1 bn in H1’2025, from Kshs 2.3 bn in H1’2024. Please see our Cytonn Weekly #34/2025 for more info
- During the month, Liberty Kenya Holdings released their H1’ 2025 results, with Profit After Tax decreasing by 29.8% to Kshs 0.4 bn, from the Kshs 0.6 bn recorded in H1’2024. The performance was mainly driven by 61.0% decrease in net insurance service revenue to Kshs 0.2 bn in H1’2025, from Kshs 0.6 bn in H1’2024, coupled with 4.7% decrease in net investment revenue to Kshs 0.8 bn, from Kshs 0.9 bn in H1’2024. Please see our Cytonn Weekly #34/2025 for more info
We are “Bullish” on the Equities markets in the short term due to current cheap valuations, lower yields on short-term government papers and expected global and local economic recovery, and, “Neutral” in the long term due to persistent foreign investor outflows. With the market currently trading at a discount to its future growth (PEG Ratio at 0.9x), we believe that investors should reposition towards value stocks with strong earnings growth and that are trading at discounts to their intrinsic value. We expect the current high foreign investors sell-offs to continue weighing down the economic outlook in the short term
- Industry Report
- June Leading Economic Indicators (LEI)
During the week, the Kenya National Bureau of Statistics (KNBS) released the Leading Economic Indicators (LEI) June 2025Reports, which highlighted the performance of major economic indicators.
Key highlights related to the Real Estate sector include:
- In Q2’2025, international visitor arrivals through Jomo Kenyatta International Airport (JKIA) and Moi International Airport (MIA) rose sharply to 552,108, a 48.8% year-on-year increase from 370,923 in Q2’2024. On a quarter-on-quarter basis, this was an increase of 13.2% from 487,555 in Q1’2025, reflecting sustained momentum in Kenya’s tourism recovery. Growth was supported by (i) new direct flight connections from Mumbai to Nairobi, Dubai to Nairobi and Mombasa, and Johannesburg to Nairobi, (ii) diversification of tourism products beyond wildlife safaris into cruise tourism, cultural heritage circuits, adventure travel and sports events such as the World Rally Championship and international marathons, (iii) intensified global marketing under the “Magical Kenya” brand using digital platforms, expos, and influencer collaborations, and (iv) visa-free entry reforms, which simplified entry procedures and enhanced Kenya’s appeal as a global destination.
The chart below shows the number of international arrivals in Kenya between Q1’2023 and Q2’2025.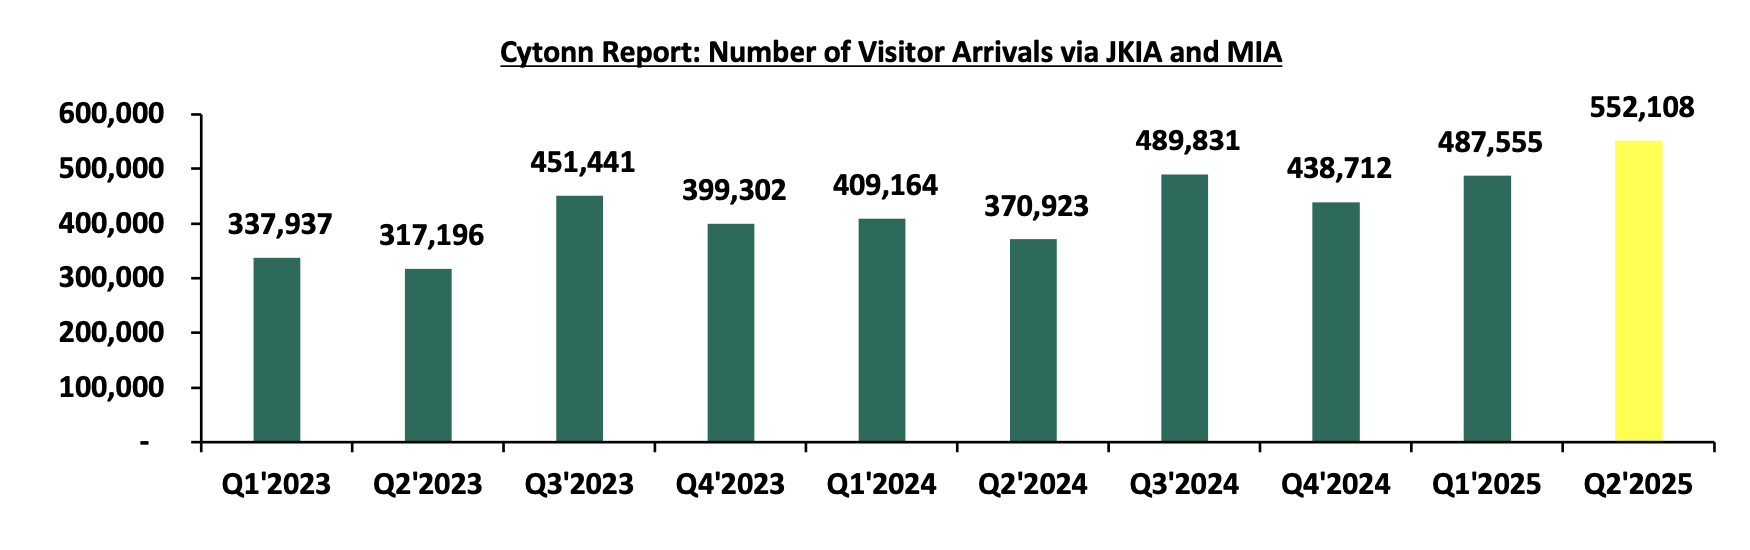
Source: Kenya National Bureau of Statistics (KNBS)
- In Q2’2025, cement consumption increased to 2.4 bn metric tonnes, a 23.6% y/y increase from 2.0 bn in Q2’2024. On a q/q basis, cement consumption grew by 3.2%, underscoring resilience in construction demand. The performance was anchored by (i) continued private sector construction activity in urban hubs like Nairobi, Mombasa, and Kisumu, (ii) government-led infrastructure investments under the Bottom-Up Economic Transformation Agenda (BETA), including roads, affordable housing, water, and sanitation projects, and (iii) public works initiatives in rural and semi-urban areas, which both support livelihoods and expand critical infrastructure.
The chart below shows cement consumption in metric tonnes in Kenya between Q1’2023 and Q2’2025.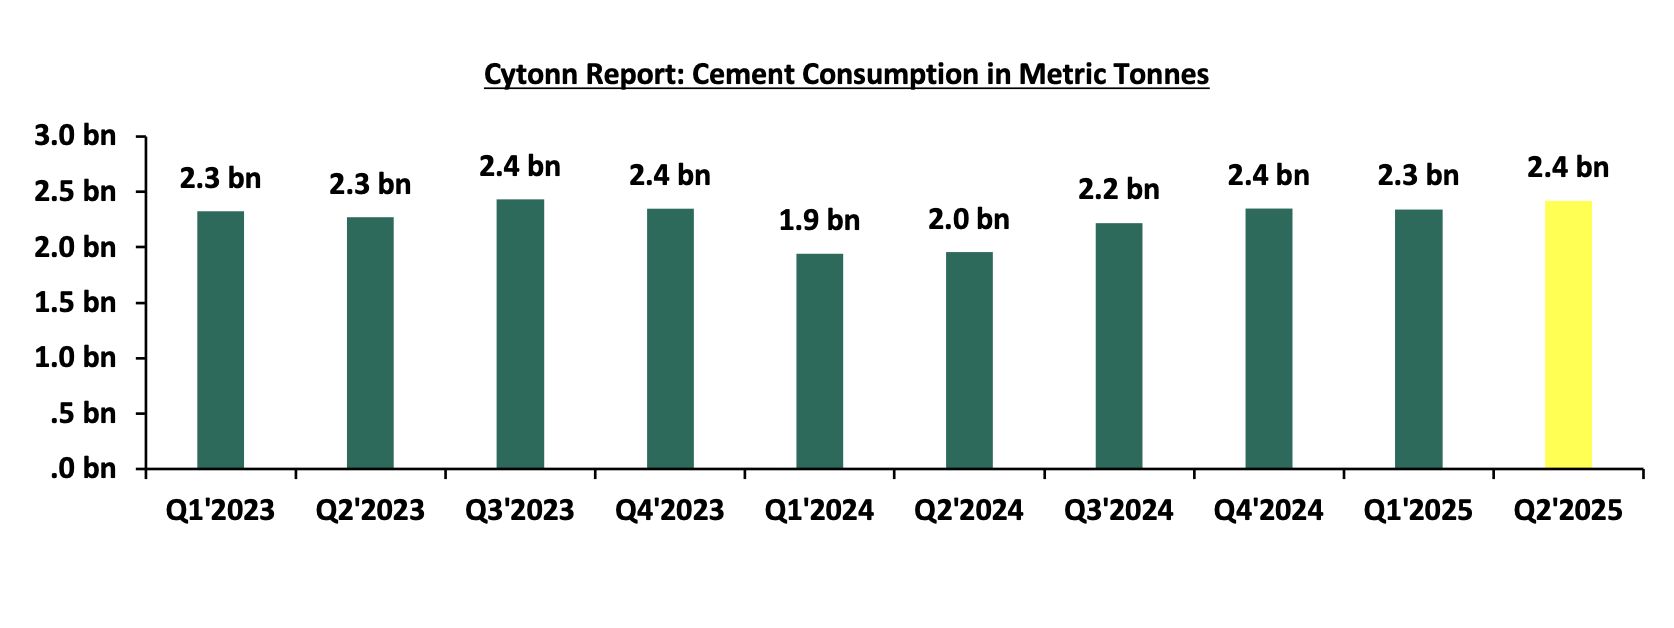
Source: Kenya National Bureau of Statistics (KNBS)
- In Q2’2025, the value of building plans approved in Nairobi City County declined by 47.5% on year-on-year basis to Ksh 31.4 bn from Ksh 59.8 bn in Q2’2024 and a 44.4% decrease on quarter-on-quarter basis, pointing to continued weakness in overall development activity. The slowdown reflects (i) a cautious investment climate in real estate amid elevated construction costs, with luxurious office block costs in the Nairobi Metropolitan Area rising by 11.0%,discouraging new project starts, (ii) longer approval timelines due to increased scrutiny and procedural reforms by planning authorities, and (iii) a strategic shift by developers toward completing ongoing projects rather than initiating new ones, especially in oversupplied segments such as commercial office space, iv) the high cost of construction loans, with lending rates above 20.0% in early 2025, which has significantly raised financing costs and made developers more reluctant to commit to new projects.
The chart below shows the building plans approved in billions in Kenya between Q1’2023 and Q2’2025.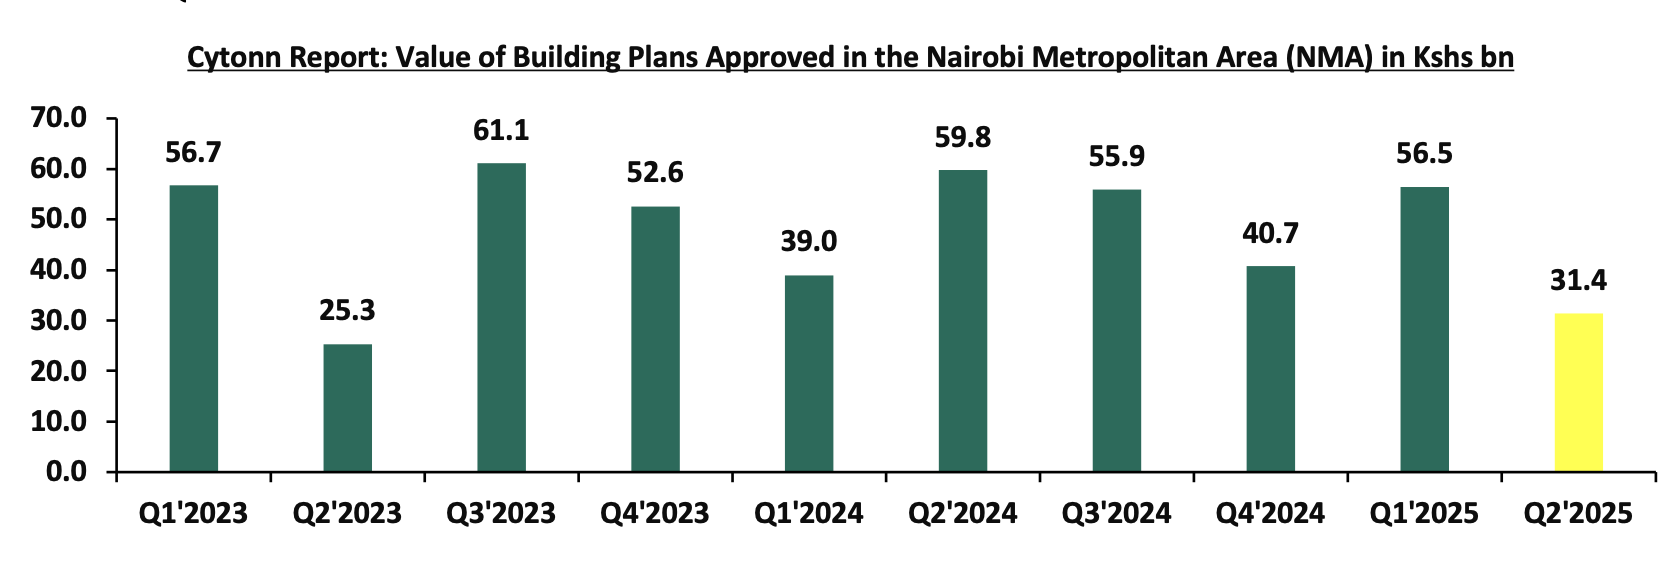
Source: Kenya National Bureau of Statistics (KNBS)
- Residential Sector
- Kenyans to access Ksh 4.0mn loans for rural housing in new rules
During the week, Parliament approved the Affordable Housing Regulations, 2025, providing the legal framework for Kenyans to borrow up to Kshs 4.0 mn from the Affordable Housing Fund to develop rural affordable housing units. The regulations, developed by the Ministry of Lands, Public Works, Housing and Urban Development, operationalize provisions of the Affordable Housing Act, 2024 and aim to expand homeownership opportunities beyond urban centers.
The financing model is designed to ease credit constraints for rural households, who have long faced limited access to mortgages due to stringent collateral requirements and low banking penetration. Eligible applicants will now be able to access structured and affordable loans, with repayment terms aligned to average household incomes.
This move could stimulate real estate growth in rural counties, shifting demand from informal individual builds to more formal and professionally executed housing projects. The requirement for valuation reports and bills of quantities prepared by registered professionals is also expected to raise construction standards and promote formalization of rural housing.
In addition, the initiative is projected to spur job creation in the construction sector, increase demand for building materials, and boost local economies. Developers and contractors may find new opportunities to partner with county governments and cooperatives to deliver housing units that align with the Fund’s objectives. Analysts believe this will help rebalance Kenya’s real estate development, which has been heavily concentrated in Nairobi and a few major towns, by channeling investment into underserved rural markets.
Overall, the approval of the regulations marks a key milestone in operationalizing the Affordable Housing Fund. If effectively implemented, the initiative could reshape Kenya’s housing landscape by opening new frontiers for real estate growth, promoting inclusive access to homeownership, and advancing the government’s affordable housing agenda.
We expect that this development will affect the residential sector by improving housing conditions, enhancing homeownership opportunities for low- and middle-income households, and stimulating construction activity in rural areas.
There were five notable highlights during the month.
- During the month, state-backed mortgage lender, Kenya Mortgage Refinance Company (KMRC) released its H1’2025 financial results, which reported a 18.6% decrease in Profit After Tax (PAT) to Kshs 544.3 mn from Kshs 669.0 mn recorded in H1’ 2024 attributable to 24.5% increase in interest expense to Kshs 649.8 mn in H1’2025 from 521.7 mn in H1’2024. For more information, please see our Cytonn Weekly #34/2025
- During the month, The National Social Security Fund (NSSF) is sought to secure a Kshs1.6 bn loan from a local bank to kickstart the first phase of its ambitious Kisumu Lakeview Estate project—a major real estate venture designed to deliver over 1,300 homes and commercial amenities in Kisumu. This marks one of the fund’s largest investments outside Nairobi in more than ten years, reflecting its growing focus on regional development and real estate as a source of long-term returns for pensioners. For more information, please see our Cytonn Weekly #34/2025
- During the month, the European Investment Bank (EIB) has made an equity investment in local developer, International Housing Solutions (IHS) Kenya, to help it deliver more than 3,000 affordable housing units in prime neighbourhoods such as Nairobi and Kiambu. The bank’s development arm, EIB Global, has committed Kshs 3.2 bn in IHS Kenya Green Housing Fund for the construction and acquisition of energy-efficient and affordable housing in Kenya. The IHS Kenya Green Housing Fund invests in the development and acquisition of green-certified, affordable properties in Kenya, with a focus on low- and moderate-income segments of the population. For more information, please see ourCytonn Weekly #33/2025
- During the month, Acorn Holdings cut its effective interest rate on debt by 5.2% to 11.1% in July from 16.3% in January after refinancing its facilities to take advantage of falling interest rates. Following the release of the semi-annual financial results of 2025, disclosures reveal that the Acorn I-REIT opened the year with total borrowings of Kshs 2.7 bn, which by the end of June had fallen to Kshs 2.4 bn. For more information, please see our Cytonn Weekly #32/2025
- During the month, Shelter Afrique Development Bank (ShafDB) has signed a Kshs 15.5 bn agreement with the Arab Bank for Economic Development in Africa (BADEA) to support its capital increase subscription initiative. The new capital increase program includes an initial equal allocation to all member states, followed by a phased reallocation, first on a pro-rata basis and then on a first-come, first-served basis. This approach aims to encourage active participation by member states and to strengthen Shelter’s capital adequacy in a balanced and transparent manner. For more information, please see our Cytonn Weekly #32/2025
We expect the residential sector to maintain a positive outlook, supported by increased investments such as Acorn’s refinancing, EIB’s Kshs 3.2 bn commitment to IHS Kenya, Shelter Afrique’s capital boost, and NSSF’s Kisumu Lakeview Estate project, alongside favorable demographics with population and urbanization growth of 3.7% and 2.0% p.a., respectively against the global average of 1.7% p.a and 0.9% p.a, respectively, as at 2024. However, rising construction costs, infrastructure constraints, and limited access to affordable financing, as reflected in KMRC’s weaker profitability, will continue to constrain optimal performance.
- Hospitality Sector
There were two notable highlights during the month;
- During the month, International hotel chain, Mariott International is set to debut its luxury The Ritz-Carlton brand in Africa with an exclusive luxury tented safari lodge in the Maasai Mara. It is set to officially open on August 15th in a ceremony to be presided by Narok County Governor, Patrick Ole Ntuntu. The camp will host 20 tented suites, 2 bridges, a restaurant and other facilities on a 49.4-acre piece of land sitting on the banks of the Sand River. Each suite will also include a personalised butler service, and the camp has been designed as an eco-friendly ecosystem utilising solar power, rainwater harvesting, and waste reduction. For more information, please see our Cytonn Weekly #33/2025
- During the month, the International Finance Corporation (IFC) is proposing to make an equity investment of Kshs 1.3 bn in Safari holdings, the parent firm of ARP Africa Travel, Pollman’s Tours and Safaris and Tanzanian tour company, Ranger Safaris. The IFC has disclosed a proposed equity co-investment of up to Kshs 1.3 bn in Safari Holdings. The co-investment will be made through a Mauritius investment vehicle alongside the Alterra Africa Accelerator Fund. For more information, please see our Cytonn Weekly #33/2025
We expect the hospitality sector to record positive performance, supported by increased investment activities such as Marriott International’s debut of The Ritz-Carlton luxury tented lodge in the Maasai Mara and IFC’s proposed Kshs 1.3 bn equity investment in Safari Holdings. Growth in international tourist arrivals, which rose by 45.6% over the past year, will continue to underpin sector expansion. However, inconsistent infrastructure in rural areas and financial constraints in urban markets remain key challenges that could limit the sector’s optimal growth.
- Commercial Office Sector
There was one notable highlight during the month;
- During the month, it was announced that three United Nations agencies UN Women, UNICEF and UNFPA will move their global headquarters from New York to Nairobi in 2026, marking a major boost for Kenya’s office real estate market. This relocation, part of the UN@80 reform agenda, seeks to cut bureaucratic delays, reduce operational costs and increase field effectiveness by positioning the agencies closer to the regions they serve. Nairobi was selected over other potential cities due to its robust diplomatic ecosystem, hosting over 120 foreign missions, as well as key UN bodies like UNEP and UN-Habitat, alongside strong transport links, ICT infrastructure and human capital. For more information, please see our Cytonn Weekly #32/2025
We expect the office sector to record improved performance, supported by increased demand from multinational and international organizations, exemplified by the planned relocation of UN Women, UNICEF, and UNFPA headquarters to Nairobi in 2026. This move will strengthen Nairobi’s position as a global diplomatic and organizational hub, boosting occupancy levels and investor confidence in the office real estate market. However, challenges such as existing oversupply in prime office spaces and high development costs may continue to limit the sector’s full recovery.
- Infrastructure Sector
There was one notable highlight during the month;
- During the month, Kenya has invited international development lenders to finance a Kshs 259.0 bn expansion of the Jomo Kenyatta International Airport located in Nairobi. This marks nine months after it cancelled a deal with India’s Adani Group after its founder, Gautam Adani, was indicted in the United States of America. Due to its soaring debt levels, Kenya is seeking new ways to finance infrastructure projects. For instance, Kenya will issue a securitized bond for Kshs 175.0 bn locally and abroad next month for road construction. For more information, please see our Cytonn Weekly #33/2025
We expect the infrastructure sector to maintain strong performance, driven by sustained government investment in flagship projects under the Bottom-Up Economic Transformation Agenda (BETA), alongside increased participation by development partners and private investors through PPPs. Recent initiatives, such as Kenya’s invitation to international lenders to finance the Kshs 259.0 bn expansion of Jomo Kenyatta International Airport and plans to issue a Kshs 175.0 bn securitized bond for road construction, underscore the government’s commitment to infrastructure development. However, risks such as procurement bottlenecks, delayed disbursements, and land acquisition challenges remain, potentially slowing project execution and raising costs.
- Real Estate Investments Trusts Weekly Performance
On the Unquoted Securities Platform, Acorn D-REIT and I-REIT traded at Kshs 27.4 and Kshs 23.2 per unit, respectively, as per the last updated data on 15th August 2025. The performance represented a 33.4% and 14.5% gain for the D-REIT and I-REIT, respectively, from the Kshs 20.0 inception price. The volumes traded for the D-REIT and I-REIT came in at Kshs 12.8 mn and Kshs 39.2 mn shares, respectively, with a turnover of Kshs 323.5 mn and Kshs 791.5 mn, respectively, since inception in February 2021. Additionally, ILAM Fahari I-REIT traded at Kshs 11.0 per share as of 15th August 2025, representing a 45.0% loss from the Kshs 20.0 inception price. The volume traded to date came in at 1.2 mn shares for the I-REIT, with a turnover of Kshs 1.5 mn since inception in November 2015.
REITs offer various benefits, such as tax exemptions, diversified portfolios, and stable long-term profits. However, the ongoing decline in the performance of Kenyan REITs and the restructuring of their business portfolios are hindering significant previous investments. Additional general challenges include:
- Insufficient understanding of the investment instrument among investors leading to a slower uptake of REIT products,
- Lengthy approval processes for REIT creation,
- High minimum capital requirements of Kshs 100.0 mn for REIT trustees compared to Kshs 10.0 mn for pension funds Trustees, essentially limiting the licensed REIT Trustee to banks only
- The rigidity of choice between either a D-REIT or and I-REIT forces managers to form two REITs, rather than having one Hybrid REIT that can allocate between development and income earning properties
- Limiting the type of legal entity that can form a REIT to only a trust company, as opposed to allowing other entities such as partnerships, and companies,
- We need to give time before REITS are required to list – they would be allowed to stay private for a few years before the requirement to list given that not all companies maybe comfortable with listing on day one, and,
- Minimum subscription amounts or offer parcels set at Kshs 0.1 mn for D-REITs and Kshs 5.0 mn for restricted I-REITs. The significant capital requirements still make REITs relatively inaccessible to smaller retail investors compared to other investment vehicles like unit trusts or government bonds, all of which continue to limit the performance of Kenyan REITs.
We expect the economy to record steady performance, supported by sustained growth in key indicators as highlighted by the June 2025 Leading Economic Indicators report, and reinforced by policy measures such as the Affordable Housing Regulations, 2025, which are set to expand access to rural housing finance. Additionally, the positive performance of Acorn’s D-REIT and I-REIT reflects rising investor confidence in real estate-backed securities. However, the continued underperformance of ILAM Fahari I-REIT underscores challenges of low liquidity and weak investor sentiment in some segments of the listed real estate market.
We expect the performance of Kenya’s Real Estate sector to remain resilient, supported by several factors: i) increased investments in the residential sector, including Acorn’s refinancing, EIB’s Kshs 3.2 bn commitment to IHS Kenya, Shelter Afrique’s capital boost, and NSSF’s Kisumu Lakeview Estate project, ii) government initiatives such as the Affordable Housing Regulations, 2025, aimed at expanding access to rural housing finance, iii) heightened activity in the hospitality sector driven by international investments like Marriott International’s entry into the Maasai Mara and IFC’s proposed Kshs 1.3 bn equity investment in Safari Holdings, iv) sustained infrastructure development initiatives, including the planned Kshs 259.0 bn expansion of Jomo Kenyatta International Airport and issuance of a Kshs 175.0 bn securitized bond for road construction, v) rising demand in the office sector, boosted by the planned relocation of three UN agencies’ global headquarters to Nairobi, and vi) improving investor confidence in structured real estate securities, evidenced by gains in Acorn’s D-REIT and I-REIT. However, challenges such as rising construction costs, infrastructure constraints, weak investor appetite in listed REITs such as ILAM Fahari I-REIT, oversupply in select real estate classes, and high capital demands will continue to impede the sector’s optimal performance.
Disclaimer: The views expressed in this publication are those of the writers where particulars are not warranted. This publication, which is in compliance with Section 2 of the Capital Markets Authority Act Cap 485A, is meant for general information only and is not a warranty, representation, advice, or solicitation of any nature. Readers are advised in all circumstances to seek the advice of a registered investment advisor.

- Talk to us
- Kenya
- P.O Box 20695 - 00200, Nairobi, Kenya
- Cell +254709101200
- Tel +254709101200
- WhatsApp +254741676635
- United States
- +254709101200
- DOWNLOAD OUR APP
-


- Kenya
- 8th Floor, Pinetree Plaza, Kaburu Drive, Ngong Road, Nairobi, Kenya
- USA
- Suite 1150, 1775 Eye Street NW, USA, Washington DC 20006, USA
- Investments
- High Yield
- Private Equity
- Real Estate
- Real Estate
- RiverRun Estates
- Cytonn Towers
- The Ridge
- Taraji Heights
- The Alma