Cytonn Monthly - April 2025
By Cytonn Research, Aug 3, 2026
Executive Summary
Fixed Income
During the month of April 2025, T-bills were oversubscribed, with the overall average subscription rate coming in at 183.0%, higher than the subscription rate of 135.2% recorded in March 2025. The overall average subscription rates for the 91-day, 182-day and 364-day paper increased to 292.1%, 99.0% and 223.4% respectively, from 269.8%, 78.5% and 138.1% respectively recorded in March 2025. The average yields on the government papers were on a downward trajectory during the month, with the average 91-day, 182-day, and 364-day papers yields decreasing by 37.1 bps, 30.3 bps, and 29.1 bps to 8.5%, 8.8%, and 10.2% respectively, from an average of 8.9%, 9.1%, and 10.5% recorded the previous month. For the month of April, the government accepted a total of Kshs 163.2 bn of the Kshs 175.7 bn worth of bids received in T-Bills, translating to an acceptance rate of 92.9%, compared to an acceptance rate of 89.3% in the month of March;
During the week, T-bills were undersubscribed for the first time in five weeks, with the overall subscription rate coming in at 76.6%, lower than the subscription rate of 178.5% recorded the previous week. Investors’ preference for the shorter 91-day paper waned, with the paper receiving bids worth Kshs 2.2 bn against the offered Kshs 4.0 bn, translating to an undersubscription rate of 54.6%, significantly lower than the oversubscription rate of 401.4%, recorded the previous week. The subscription rates for the 364-day paper increased to 149.1% from the 115.7% recorded the previous week while the 182-day paper decreased significantly to 12.8% from the 152.2% recorded the previous week. The government accepted a total of Kshs 18.4 bn worth of bids out of Kshs 18.4 bn bids received, translating to an acceptance rate of 100.0%. The yields on the government papers recorded a mixed performance with the yields on the 91-day paper decreasing the most by 3.8 bps to 8.41% from the 8.44% recorded the previous week, while the yields on the 364-day paper decreased by 1.5 bps to 10.01% from the 10.02% recorded the previous week. The 182-day paper remained unchanged from the 8.6% recorded the previous week;
Additionally, April 2025 bonds were oversubscribed, with the overall average subscription rate coming in at 117.4%, albeit lower than the average subscription rate of 188.0% recorded in March 2025. The reopened bonds FXD1/2020/015, FXD1/2022/015 and FXD1/2022/025 with tenors to maturity of 9.9 years, 12.1 years and 22.6years respectively and fixed coupon rates of 12.8%, 13.9% and 14.2% respectively, received bids worth Kshs 71.7 bn against the offered Kshs 70.0 bn translating to an oversubscription rate of 102.5%. The government accepted bids worth Kshs 71.4 bn, translating to an acceptance rate of 99.5%, with the average accepted yields coming at 13.7%, 13.8% and 14.2% for the FXD1/2020/015, FXD1/2022/015 and FXD1/2022/025 respectively. Additionally, the tapsale FXD1/2020/015, with a tenor to maturity of 9.9 years and a fixed coupon rate of 12.8%, received bids worth Kshs 13.2 bn against the offered Kshs 10.0 bn translating to an oversubscription rate of 132.4%, with the government accepting bids worth Kshs 12.6 bn, translating to an acceptance rate of 95.1%, with the average accepted yield remaining unchanged at 13.7%. For the month of April, the government accepted a total of Kshs 84.0 bn of the Kshs 85.0 bn worth of bids received in T-Bonds, translating to an acceptance rate of 98.4% compared to an acceptance rate of 75.0% in the month of March;
During the week, the Central Bank of Kenya released the auction results for the re-opened treasury bonds FXD1/2022/015 and FXD1/2022/025 with tenors to maturity of 12.0 years and 22.5 years respectively and a fixed coupon rate of 13.9% and 14.2% respectively. The bonds were oversubscribed, with the overall subscription rate coming in at 114.2%, receiving bids worth Kshs 57.1 bn against the offered Kshs 50.0 bn. The government accepted bids worth Kshs 50.4 bn, translating to an acceptance rate of 88.2%. The weighted average yield for the accepted bids for the FXD1/2022/015 and FXD1/2022/025 came in at 13.9% and 14.5% respectively. Notably, the 13.9% and 14.5% on the FXD1/2022/015 and FXD1/2022/025 respectively was higher from the 13.8% and 14.2% respectively the last time they were reopened in March 2025. With the Inflation rate at 4.1% as of April 2025, the real returns of the FXD1/2022/015 and FXD1/2022/025 are 9.8% and 10.4%. Given the 10.0% withholding tax on the bonds, the tax equivalent yields for normal bonds with 15.0% withholding tax are 14.7% and 15.4% for the FXD1/2022/015 and FXD1/2022/025 respectively;
During the week, KNBS released the y/y inflation noting that inflation in April 2025 increased by 0.5% points to 4.1%, from the 3.6% recorded in March 2025. This was in line with our projection of an increase where our decision was mainly driven by the increase in electricity prices in April 2025. The headline inflation in April 2025 was majorly driven by increase in prices of commodities in the following categories; Food & Non-Alcoholic Beverages, Transport sector and Housing, water, electricity, gas and other fuels by 7.1%, 2.3% and 0.8% respectively;
During the week, Kenya announced the pricing of USD 500.0 mn amortising notes with an annual interest rate of 8.3%, maturing in 2032, hence a tenor of xxx years. The bond was issued through a private placement at its par value at 100.0%, settled on 30th April 2025. Funds raised will support the national budget and help manage existing debt;
Equities
During the month of April 2025, the equities market was on a downward trajectory, with NSE 10 declining the most by 4.3%, while NSE 20, NASI and NSE 25 declined by 4.1%, 3.6% and 3.4% respectively. The equities market negative performance was driven by losses recorded by large-cap stocks such as Co-operative Bank, KCB Bank and ABSA Bank Kenya of 10.0%, 8.8%, and 4.5% respectively. The monthly performance was however supported by gains recorded by large cap stocks such as Stanbic Bank, NCBA and Standard Chartered Bank of 7.9%, 2.9% and 0.3% respectively.
During the week, the equities market was on a downward trajectory, with NSE 20, NSE 10, NSE 25 and NASI losing by 2.1%, 1.3%, 1.3% and 0.2% respectively, taking the YTD performance to gains of 2.3%, and 0.2% for NSE 20 and NASI respectively, and losses of 4.1% and 2.3% for NSE 10 and NSE 25 respectively. The week on week equities market performance was driven by losses recorded by large-cap stocks such as Standard Chartered Bank, Cooperative Bank and NCBA of 10.1 %, 10.0%, and 8.4% respectively. The performance was however supported by gains recorded by large-cap stocks such as Safaricom, Equity Bank and EABL of 4.7%, 1.3% and 0.6% respectively;
Additionally, in the regional equities market, the East African Exchanges 20 (EAE 20) share index gained by 0.1% to 100.1 from 100.0 recorded the previous week, attributable to gains recorded by large cap stocks such as Bank of Baroda Uganda, Absa Bank Kenya and Stanbic Uganda Holdings of 8.8%, 2.4% and 2.3% respectively, that were matched by the losses recorded by large cap stocks such as Cooperative Bank of Kenya, KCB group and I &M Rwanda of 9.9%, 1.1% and 0.2% respectively.
Real Estate
During the week, Hass Consult, a Kenyan consulting and Real Estate development firm, released its Property Price Index Q1’2025 Report focusing on the residential Real Estate sector's performance in the Nairobi Metropolitan Area (NMA).
Also during the week, Hass Consult released Land Price Index Q1’2025 Report which highlighted the performance of the Real Estate land sector in the Nairobi Metropolitan Area (NMA).
Additionally, during the week, the Kenyan government introduced new regulations under the Affordable Housing Programme, requiring applicants to provide proof of income, such as payslips, to qualify for housing allocation. This measure aims to ensure that beneficiaries can afford mortgage repayments and maintain the sustainability of the initiative.
On the Unquoted Securities Platform, Acorn D-REIT and I-REIT traded at Kshs 26.7 and Kshs 22.9 per unit, respectively, as per the last updated data on 17th April 2025. The performance represented a 33.4% and 14.5% gain for the D-REIT and I-REIT, respectively, from the Kshs 20.0 inception price. Additionally, ILAM Fahari I-REIT traded at Kshs 11.0 per share as of 17th April 2025, representing a 45.0% loss from the Kshs 20.0 inception price;
Investment Updates:
- Weekly Rates: Cytonn Money Market Fund closed the week at a yield of 13.9% p.a. To invest, dial *809# or download the Cytonn App from Google Play store here or from the Appstore here;
- We continue to offer Wealth Management Training every Tuesday, from 7:00 pm to 8:00 pm. The training aims to grow financial literacy among the general public. To register for any of our Wealth Management Trainings, click here;
- If interested in our Private Wealth Management Training for your employees or investment group, please get in touch with us through wmt@cytonn.com;
- Cytonn Insurance Agency acts as an intermediary for those looking to secure their assets and loved ones’ future through insurance namely; Motor, Medical, Life, Property, WIBA, Credit and Fire and Burglary insurance covers. For assistance, get in touch with us through insuranceagency@cytonn.com;
- Cytonn Asset Managers Limited (CAML) continues to offer pension products to meet the needs of both individual clients who want to save for their retirement during their working years and Institutional clients that want to contribute on behalf of their employees to help them build their retirement pot. To more about our pension schemes, kindly get in touch with us through pensions@cytonn.com;
Hospitality Updates:
- We currently have promotions for Staycations. Visit cysuites.com/offers for details or email us at sales@cysuites.com;
Money Markets, T-Bills Primary Auction:
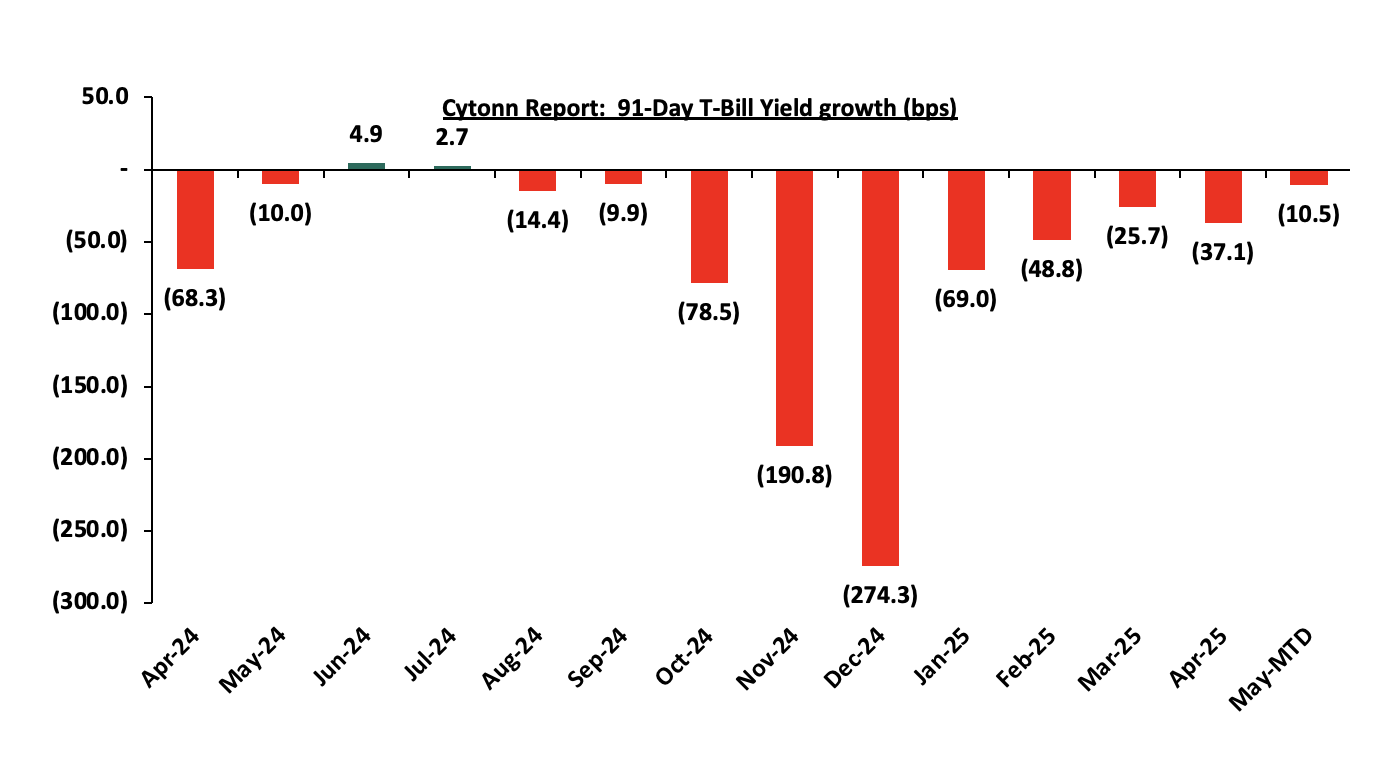
During the month of April 2025, T-bills were oversubscribed, with the overall average subscription rate coming in at 183.0%, higher than the subscription rate of 135.2% recorded in March 2025. The overall average subscription rate for the 91-day, 182-day and 364-day paper increased to 292.1%, 99.0% and 223.4% respectively, from 269.8%, 78.5% and 138.1% respectively recorded in March 2025. The average yields on the government papers were on a downward trajectory during the month, with the average 91-day, 182-day, and 364-day papers yields decreasing by 37.1 bps, 30.3 bps, and 29.1 bps to 8.5%, 8.8%, and 10.2% respectively, from an average of 8.9%, 9.1%, and 10.5% recorded the previous month. For the month of April, the government accepted a total of Kshs 163.2 bn of the Kshs 175.7 bn worth of bids received in T-Bills, translating to an acceptance rate of 92.9% compared to an acceptance rate of 89.3% in the month of March. The chart below shows the yield growth rate for the 91-day paper in 2024 and during the year:
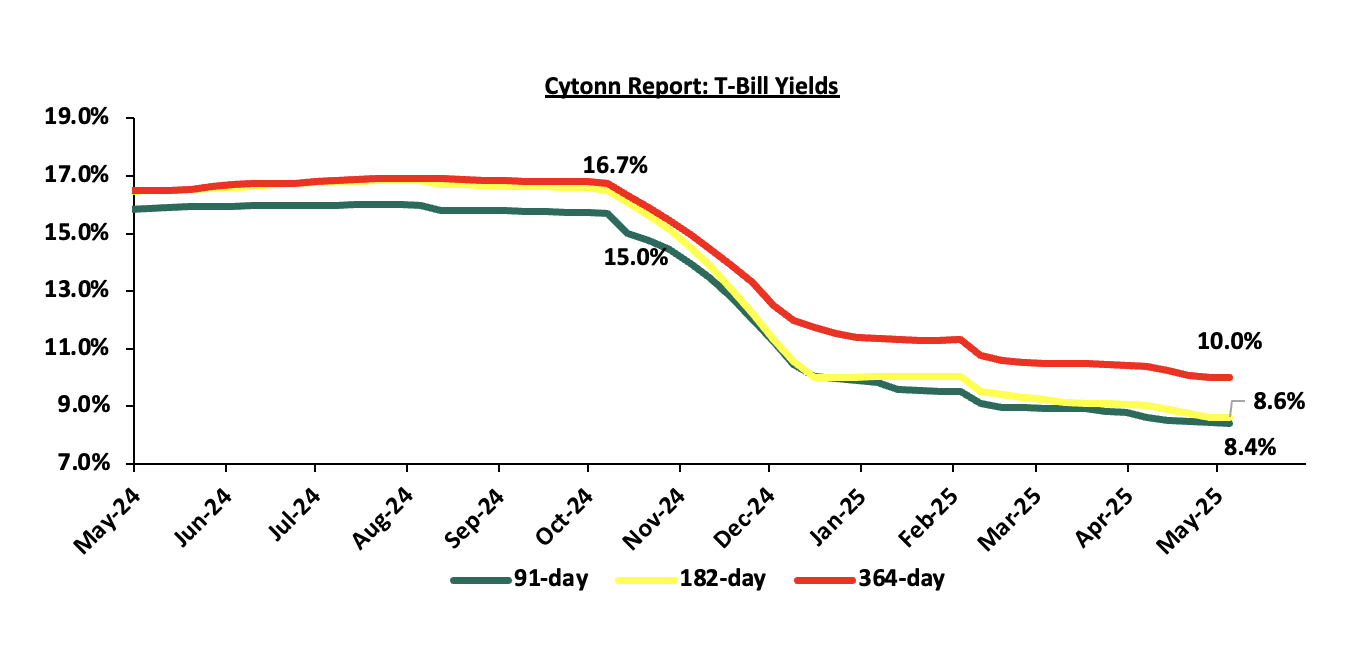
During the week, T-bills were undersubscribed for the first time in five weeks, with the overall subscription rate coming in at 76.6%, lower than the subscription rate of 178.5% recorded the previous week. Investors’ preference for the shorter 91-day paper waned, with the paper receiving bids worth Kshs 2.2 bn against the offered Kshs 4.0 bn, translating to an undersubscription rate of 54.6%, significantly lower than the oversubscription rate of 401.4%, recorded the previous week. The subscription rates for the 364-day paper increased to 149.1% from the 115.7% recorded the previous week while the 182-day paper decreased significantly to 12.8% from the 152.2% recorded the previous week. The government accepted a total of Kshs 18.4 bn worth of bids out of Kshs 18.4 bn bids received, translating to an acceptance rate of 100.0%. The yields on the government papers recorded a mixed performance with the yields on the 91-day paper decreasing the most by 3.8 bps to 8.41% from the 8.44% recorded the previous week, while the yields on the 364-day paper decreased by 1.5 bps to 10.01% from the 10.02% recorded the previous week. The 182-day paper remained unchanged from the 8.6% recorded the previous week.
The charts below show the performance of the 91-day, 182-day and 364-day papers from May 2024 to May 2025:
So far in the current FY’2024/25, government securities totaling Kshs 1,615.0 bn have been advertised. The government has accepted bids worth Kshs 1,990.8 bn, of which Kshs 1,292.2 bn and Kshs 698.6 bn were treasury bills and bonds, respectively. The government has a domestic borrowing surplus of Kshs 292.6 bn in FY’2024/25, 49.5% ahead of its net domestic borrowing target of Kshs 597.2 bn for FY’2024/25.
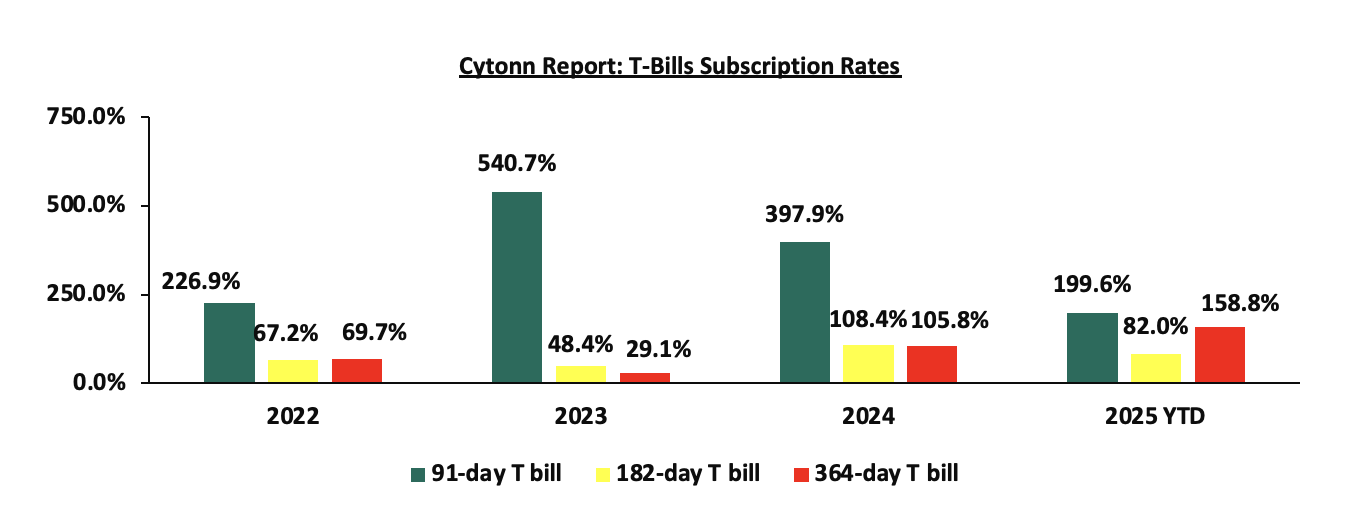
The chart below compares the overall average T-bill subscription rates obtained in 2022,2023, 2024 and 2025 Year-to-date (YTD):
Additionally, April 2025 bonds were oversubscribed, with the overall average subscription rate coming in at 117.4%, albeit lower than the average subscription rate of 188.0% recorded in March 2025. The reopened bonds FXD1/2020/015, FXD1/2022/015 and FXD1/2022/025 with tenors to maturity of 9.9 years, 12.1 years and 22.6years respectively and fixed coupon rates of 12.8%, 13.9% and 14.2% respectively, received bids worth Kshs 71.7 bn against the offered Kshs 70.0 bn translating to an oversubscription rate of 102.5%. The government accepted bids worth Kshs 71.4 bn, translating to an acceptance rate of 99.5%, with the average accepted yields coming at 13.7%, 13.8% and 14.2% for the FXD1/2020/015, FXD1/2022/015 and FXD1/2022/025 respectively. Additionally, the tapsale FXD1/2020/015, with a tenor to maturity of 9.9 years and a fixed coupon rate of 12.8%, received bids worth Kshs 13.2 bn against the offered Kshs 10.0 bn translating to an oversubscription rate of 132.4%, with the government accepting bids worth Kshs 12.6 bn, translating to an acceptance rate of 95.1%, with the average accepted yield remaining unchanged at 13.7%. For the month of April, the government accepted a total of Kshs 84.0 bn of the Kshs 85.0 bn worth of bids received in T-Bonds, translating to an acceptance rate of 98.4% compared to an acceptance rate of 75.0% in the month of March.
The table below provides more details on the bonds issued in April 2025:
|
Issue Date |
Bond Auctioned |
Effective Tenor to Maturity (Years) |
Coupon |
Amount offered (Kshs bn) |
Actual Amount Raised/Accepted (Kshs bn) |
Total bids received (Subscription) |
Average Accepted Yield |
Subscription Rate |
Acceptance Rate |
|
10/04/2025 |
FXD1/2020/015-Tapsale |
9.9 |
12.8% |
10.0 |
12.6 |
13.2 |
13.7% |
132.4% |
95.1% |
|
02/04/2025 |
FXD1/2022/025 - Reopened |
22.6 |
14.2% |
70.0 |
32.5 |
32.7 |
14.2% |
102.5% |
99.5% |
|
FXD1/2022/015 -Reopened |
12.1 |
13.9% |
18.0 |
18.1 |
13.8% |
99.1% |
|||
|
FXD1/2020/015 - Reopened |
9.9 |
12.8% |
20.9 |
20.9 |
13.7% |
99.9% |
|||
|
April 2025 Average |
13.6 |
13.4% |
80.0 |
84.0 |
85.0 |
13.8% |
117.4% |
98.4% |
|
|
March 2025 Average |
18.3 |
0.1 |
25.0 |
35.2 |
47.0 |
13.8% |
188.0% |
75.0% |
|
|
2024 Average
|
6.7 |
15.6% |
27.7 |
28.9 |
37.9 |
16.7% |
116.8% |
74.9% |
|
During the week, the Central Bank of Kenya released the auction results for the re-opened treasury bonds FXD1/2022/015 and FXD1/2022/025 with tenors to maturity of 12.0 years and 22.5 years respectively and a fixed coupon rate of 13.9% and 14.2% respectively. The bonds were oversubscribed, with the overall subscription rate coming in at 114.2%, receiving bids worth Kshs 57.1 bn against the offered Kshs 50.0 bn. The government accepted bids worth Kshs 50.4 bn, translating to an acceptance rate of 88.2%. The weighted average yield for the accepted bids for the FXD1/2022/015 and FXD1/2022/025 came in at 13.9% and 14.5% respectively. Notably, the 13.9% and 14.5% on the FXD1/2022/015 and FXD1/2022/025 respectively was higher from the 13.8% and 14.2% respectively the last time they were reopened in March 2025. With the Inflation rate at 4.1% as of April 2025, the real returns of the FXD1/2022/015 and FXD1/2022/025 are 9.8% and 10.4%. Given the 10.0% withholding tax on the bonds, the tax equivalent yields for normal bonds with 15.0% withholding tax are 14.7% and 15.4% for the FXD1/2022/015 and FXD1/2022/025 respectively
Secondary Bond Market:
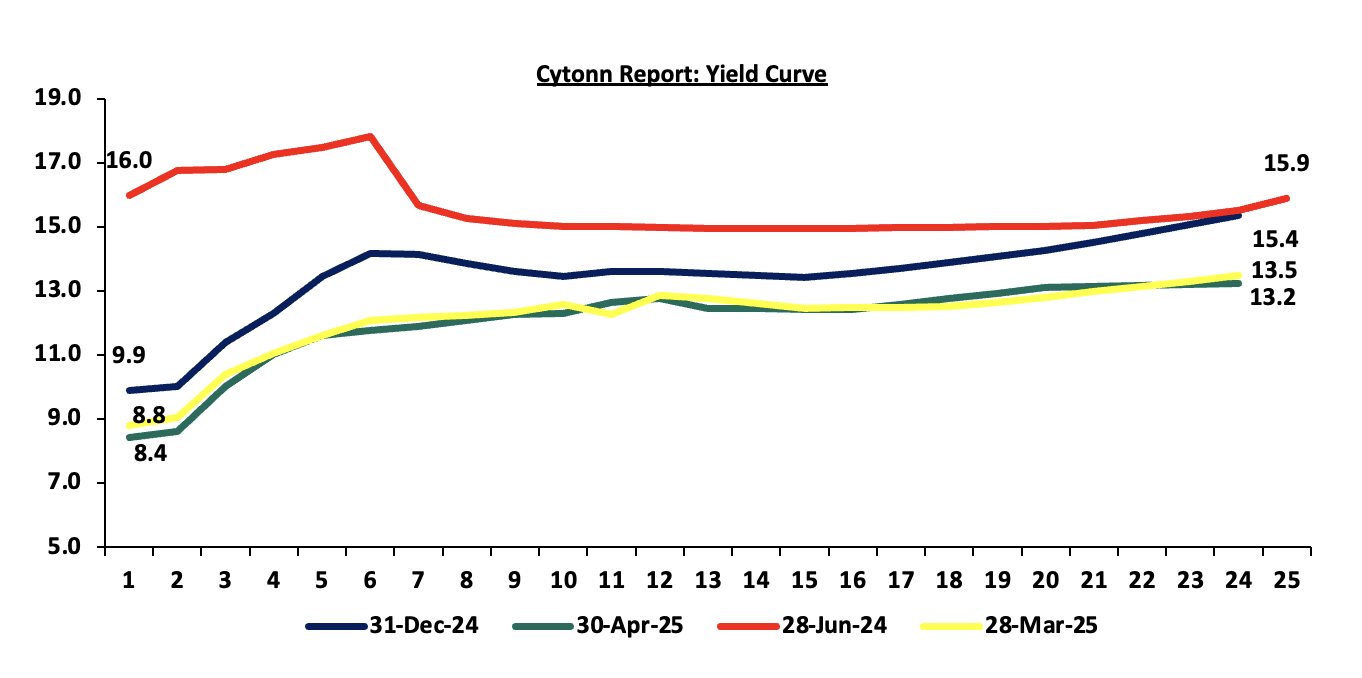
The yields on the government securities recorded a mixed performance during the month of April compared to March. Investors, apprehensive about the economic outlook in the long term, are demanding higher yields for bonds in the 14 to 20-year maturity range to compensate for the perceived risks as they anticipate potential fluctuations in economic conditions in the Kenyan market on the back of the government’s debt sustainability concerns. Notably, the yield curve has adjusted from a humped yield curve observed in 2023 and most part of 2024, towards a normal upward sloping curve, with long-term bonds registering highest yields. The shift in sentiment indicates increased confidence in the short-term economic landscape, in comparison to the last two years. The chart below shows the yield curve movement during the period:
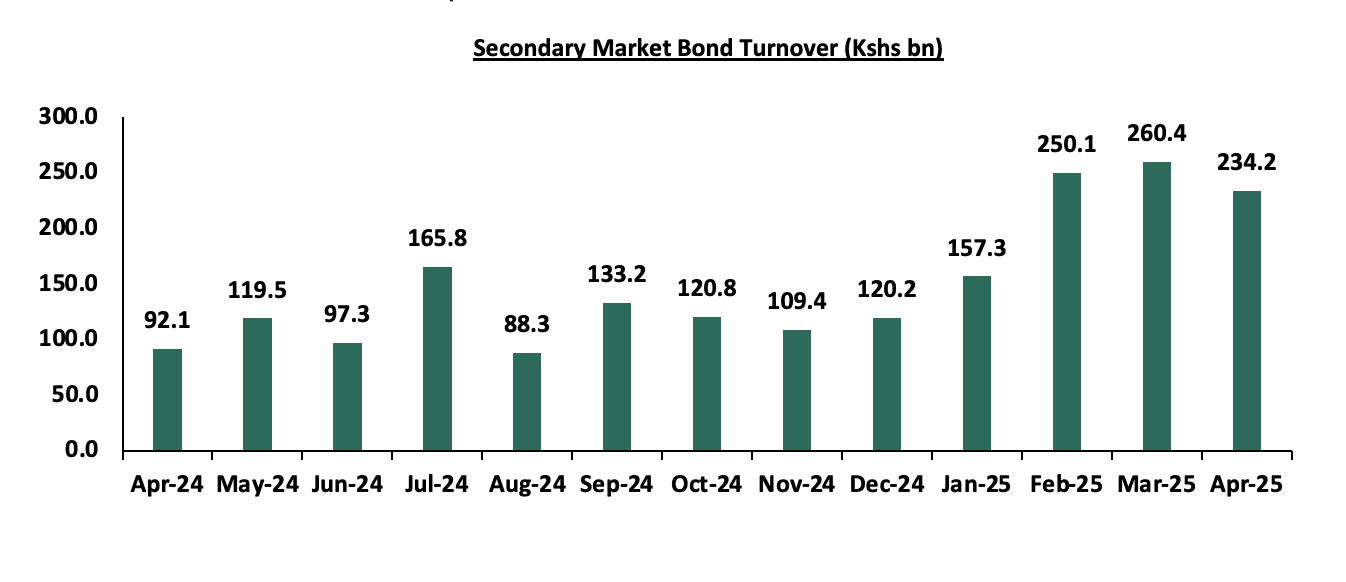
The secondary bond turnover decreased by 10.1% to Kshs 234.2 bn, from Kshs 260.4 bn recorded in March 2025, pointing towards decreased activities by commercial banks in the secondary bonds market for the month of April. However, on a year-on-year basis, the bond turnover increased significantly by 154.4% from Kshs 92.1 bn worth of treasury bonds transacted over a similar period last year. The chart below shows the bond turnover over the past 12 months
Money Market Performance:
In the money markets, 3-month bank placements ended the week at 10.4% (based on what we have been offered by various banks), and yields on the government papers were on a downward trajectory with the yields on the 91-day paper and 364-day paper decreasing by 3.8 bps and 1.5 bps respectively to remain relatively unchanged from the 8.4% and 10.0% respectively recorded the previous week. The yield on the Cytonn Money Market Fund remained unchanged, from the 13.9% recorded the previous week, while the average yields on the Top 5 Money Market Funds decreased by 24.6 bps to close the week at 13.4% from the 13.6% recorded the previous week.

The table below shows the Money Market Fund Yields for Kenyan Fund Managers as published on 1st May 2025:
|
Cytonn Report: Money Market Fund Yield for Fund Managers as published on 1st May 2025 |
||
|
Rank |
Fund Manager |
Effective Annual Rate |
|
1 |
Gulfcap Money Market Fund |
13.9% |
|
2 |
Cytonn Money Market Fund |
13.9% |
|
3 |
Orient Kasha Money Market Fund |
13.1% |
|
4 |
Etica Money Market Fund |
13.1% |
|
5 |
Ndovu Money Market Fund |
13.1% |
|
6 |
Lofty-Corban Money Market Fund |
13.0% |
|
7 |
GenAfrica Money Market Fund |
13.0% |
|
8 |
Kuza Money Market fund |
12.8% |
|
9 |
Enwealth Money Market Fund |
12.6% |
|
10 |
Arvocap Money Market Fund |
12.5% |
|
11 |
Old Mutual Money Market Fund |
12.3% |
|
12 |
British-American Money Market Fund |
12.2% |
|
13 |
Madison Money Market Fund |
12.0% |
|
14 |
Nabo Africa Money Market Fund |
11.9% |
|
15 |
Jubilee Money Market Fund |
11.7% |
|
16 |
Apollo Money Market Fund |
11.6% |
|
17 |
Dry Associates Money Market Fund |
11.4% |
|
18 |
Sanlam Money Market Fund |
11.4% |
|
19 |
Faulu Money Market Fund |
11.4% |
|
20 |
KCB Money Market Fund |
10.6% |
|
21 |
CIC Money Market Fund |
10.5% |
|
22 |
Co-op Money Market Fund |
10.4% |
|
23 |
ICEA Lion Money Market Fund |
10.3% |
|
24 |
Mali Money Market Fund |
10.0% |
|
25 |
Absa Shilling Money Market Fund |
9.8% |
|
26 |
Mayfair Money Market Fund |
9.4% |
|
27 |
Genghis Money Market Fund |
9.1% |
|
28 |
AA Kenya Shillings Fund |
8.4% |
|
29 |
Stanbic Money Market Fund |
7.9% |
|
30 |
Ziidi Money Market Fund |
7.3% |
|
31 |
Equity Money Market Fund |
5.5% |
Source: Business Daily
Liquidity:
Liquidity in the money markets eased in the month of April 2025, with the average interbank rate decreasing by 50.3 bps to 10.2% from 10.7% recorded the previous month. Similarly, during the month of April, the average interbank volumes traded increased by 9.1% to Kshs 15.0 bn, from Kshs 13.8 bn recorded in March.
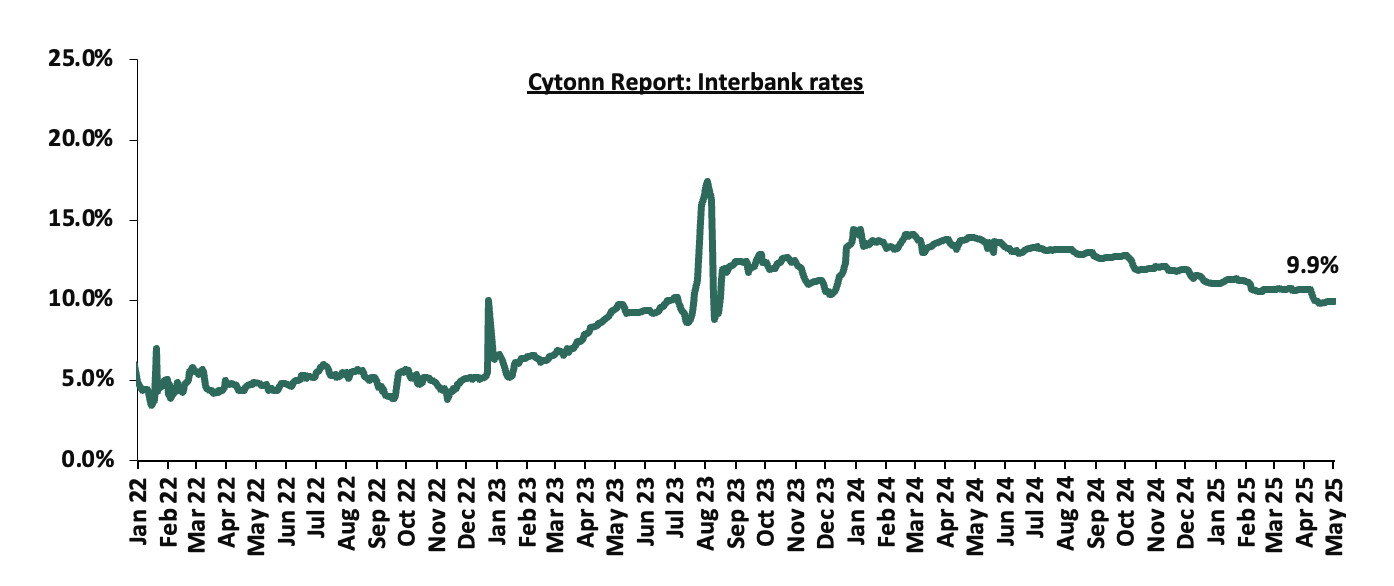
Additionally, during the week, liquidity in the money markets marginally tightened, with the average interbank rate increasing by 3.0 bps, to remain relatively unchanged at 9.9% from the previous week, partly attributable to government payments that were offset by tax remittances. The average interbank volumes traded decreased by 28.6% to Kshs 16.7 bn from Kshs 23.3 bn recorded the previous week. The chart below shows the interbank rates in the market over the years:
During the month, the yields on the Eurobonds were on an upward trajectory, with the yield on the 10-year Eurobond issued in 2018 increasing the most by 132.7 bps to 10.2% from 8.8% recorded at the beginning of the month.
During the week, the yields on Kenya’s Eurobonds recorded a mixed performance, with the yield on the 12-year Eurobond issued in 2019 increasing the most by 19.8 bps to 11.1% from 10.9% recorded the previous week while the yields on the 7-year Eurobond issued in 2019 decreased the most by 49.4 bps to 8.4% from 8.9% recorded the previous week. The table below shows the summary performance of the Kenyan Eurobonds as of 1st May 2025;
|
Cytonn Report: Kenya Eurobond Performance |
|||||||
|
|
2018 |
2019 |
2021 |
2024 |
2025 |
||
|
Tenor |
10-year issue |
30-year issue |
7-year issue |
12-year issue |
13-year issue |
7-year issue |
11-year issue |
|
Amount Issued (USD) |
1.0 bn |
1.0 bn |
0.9 bn |
1.2 bn |
1.0 bn |
1.5 bn |
1.5 bn |
|
Years to Maturity |
3.0 |
23.0 |
2.2 |
7.2 |
9.3 |
6.0 |
11.0 |
|
Yields at Issue |
7.3% |
8.3% |
7.0% |
7.9% |
6.2% |
10.4% |
9.9% |
|
02-Jan-25 |
9.1% |
10.3% |
8.5% |
10.1% |
10.1% |
10.1% |
|
|
01-Apr-25 |
8.8% |
10.8% |
7.5% |
10.4% |
10.4% |
10.4% |
|
|
24-Apr-25 |
10.1% |
11.2% |
8.9% |
10.9% |
10.7% |
11.1% |
|
|
25-Apr-25 |
9.8% |
11.1% |
8.5% |
10.7% |
10.4% |
10.8% |
|
|
26-Apr-25 |
9.7% |
11.1% |
8.5% |
10.6% |
10.4% |
10.8% |
|
|
29-Apr-25 |
9.7% |
11.2% |
8.4% |
10.7% |
10.5% |
10.8% |
|
|
30-Apr-25 |
10.2% |
11.4% |
8.4% |
11.1% |
10.9% |
11.3% |
|
|
01-May-25 |
10.1% |
11.4% |
8.4% |
11.1% |
10.9% |
11.2% |
|
|
Weekly Change |
(0.0%) |
0.2% |
(0.5%) |
0.2% |
0.2% |
0.1% |
- |
|
MTM Change |
1.3% |
0.7% |
1.0% |
0.8% |
0.5% |
0.9% |
- |
|
YTD Change |
1.0% |
1.1% |
(0.1%) |
1.0% |
0.8% |
1.1% |
- |
Source: Central Bank of Kenya (CBK) and National Treasury
Kenya Shilling:
During the month, the Kenya Shilling depreciated by 2.1 bps against the US Dollar, to close the month at Kshs 129.3 relatively unchanged from the end of March. During the week, the Kenya Shilling depreciated against the US Dollar by 11.8 bps, to close the week at Kshs 129.5, from 129.3 recorded the previous week. On a year-to-date basis, the shilling has depreciated by 15.0 bps against the dollar, a contrast to the 17.4% appreciation recorded in 2024.
We expect the shilling to be supported by:
- Diaspora remittances standing at a cumulative USD 4,972.0 mn in the twelve months to March 2025, 13.5% higher than the USD 4,380.0 mn recorded over the same period in 2024. These has continued to cushion the shilling against further depreciation. In the March 2025 diaspora remittances figures, North America remained the largest source of remittances to Kenya accounting for 53.0% in the period,
- The tourism inflow receipts which came in at Kshs 452.2 bn in 2024, a 19.8% increase from Kshs 377.5 bn inflow receipts recorded in 2023, and owing to tourist arrivals that improved by 14.6% to 2,394,376 in 2024 from 2,089,259 in 2023, and,
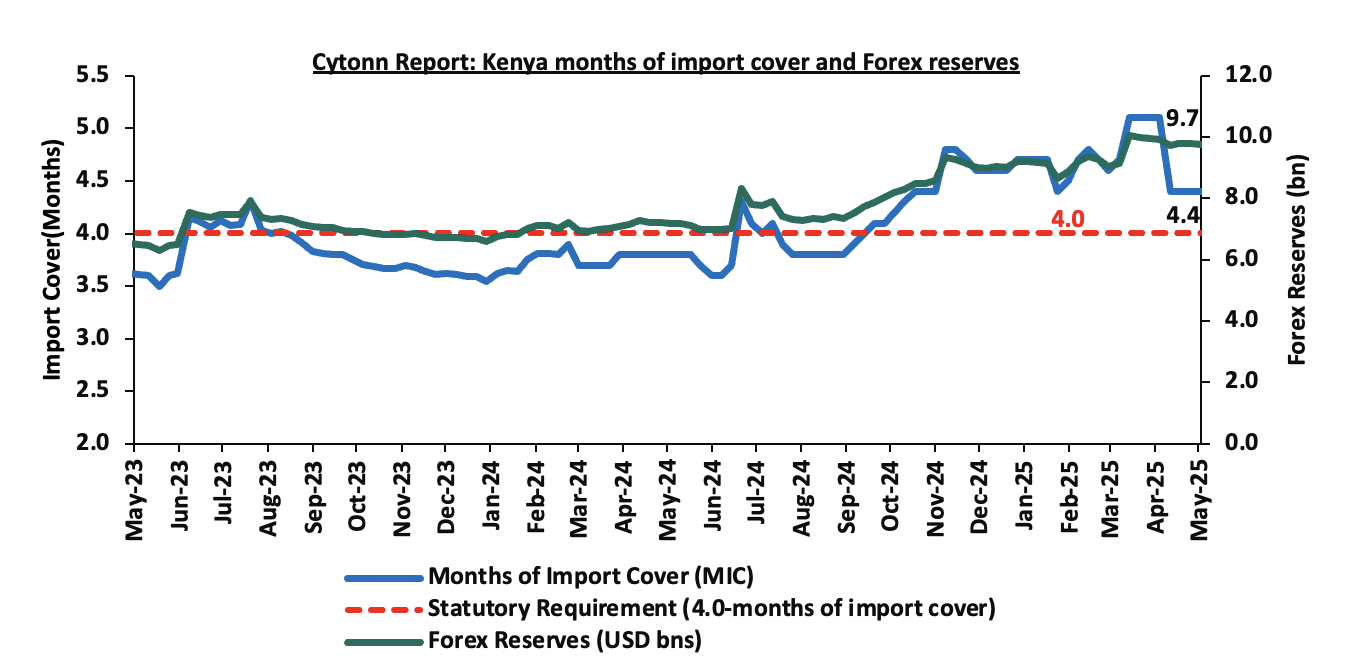
- Improved forex reserves currently at USD 9.7 bn (equivalent to 4.4-months of import cover), which is above the statutory requirement of maintaining at least 4.0-months of import cover and below the EAC region’s convergence criteria of 4.5-months of import cover.
The shilling is however expected to remain under pressure in 2025 as a result of:
- An ever-present current account deficit which came at 3.1% of GDP in the twelve months to February 2025, and,
- The need for government debt servicing, continues to put pressure on forex reserves given that 62.1% of Kenya’s external debt is US Dollar-denominated as of September 2024.
Key to note, Kenya’s forex reserves decreased by 2.1% during the month of April 2025, to USD 9.7 bn, from the USD 10.0 bn recorded in the previous month, equivalent to 4.4 months of import cover and above the statutory requirement of maintaining at least 4.0-months of import cover. Additionally, during the month, the months of import cover decreased to 4.4 (based on the new import data) from 5.1 recorded in the previous month. Additionally, Kenya’s forex reserves decreased by 3.1 bps during the week to USD 9.7 bn from USD 9.8 bn recorded the previous week, equivalent to 4.4 months of import cover, and above the statutory requirement of maintaining at least 4.0-months of import cover.
The chart below summarizes the evolution of Kenya's months of import cover over the years:
Weekly Highlights
- Inflation Highlight April 2025
The y/y inflation in April 2025 increased by 0.5% points to 4.1%, from the 3.6% recorded in March 2025. This was in line with our projection of an increase where our decision was mainly driven by the increase in electricity prices in April 2025. The headline inflation in April 2025 was majorly driven by increase in prices of commodities in the following categories; Food & Non-Alcoholic Beverages, Transport sector and Housing, water, electricity, gas and other fuels by 7.1%, 2.3% and 0.8% respectively.
|
Cytonn Report: Major Inflation Changes – April 2025 |
|||
|
Broad Commodity Group |
Price change m/m (April-2025/ March -2025) |
Price change y/y (April-2025/April-2024) |
Reason |
|
Food and non-alcoholic beverages |
0.4% |
7.1% |
The m/m increase was mainly driven by the increase in prices of commodities such as Irish potatoes, maize grain (loose) and fortified maize flour by 4.0%, 2.9% and 2.6% respectively. However, the increase was supported by decrease in prices of kales and cabbaged by 2.3% and 4.0% respectively |
|
Transport |
0.5% |
2.3% |
The transport index recorded a slight m/m increase mainly due to an increase in prices of country bus fares during Easter Holidays. Prices of Super Petrol and Diesel declined by 1.1% and 1.3% to retail at Kshs 174.6 and Kshs 164.9 respectively |
|
Housing, water, electricity, gas and other fuels |
0.3% |
0.8% |
The m/m increase was mainly driven by an increase in prices of gas/LPG by 0.3% coupled with an increase in prices of 50kWh electricity and 200kWh electricity by 3.8% and 3.4% respectively. |
|
Overall Inflation |
0.3% |
4.1% |
The m/m increase was mainly attributable to the 0.5% increase in transport. |
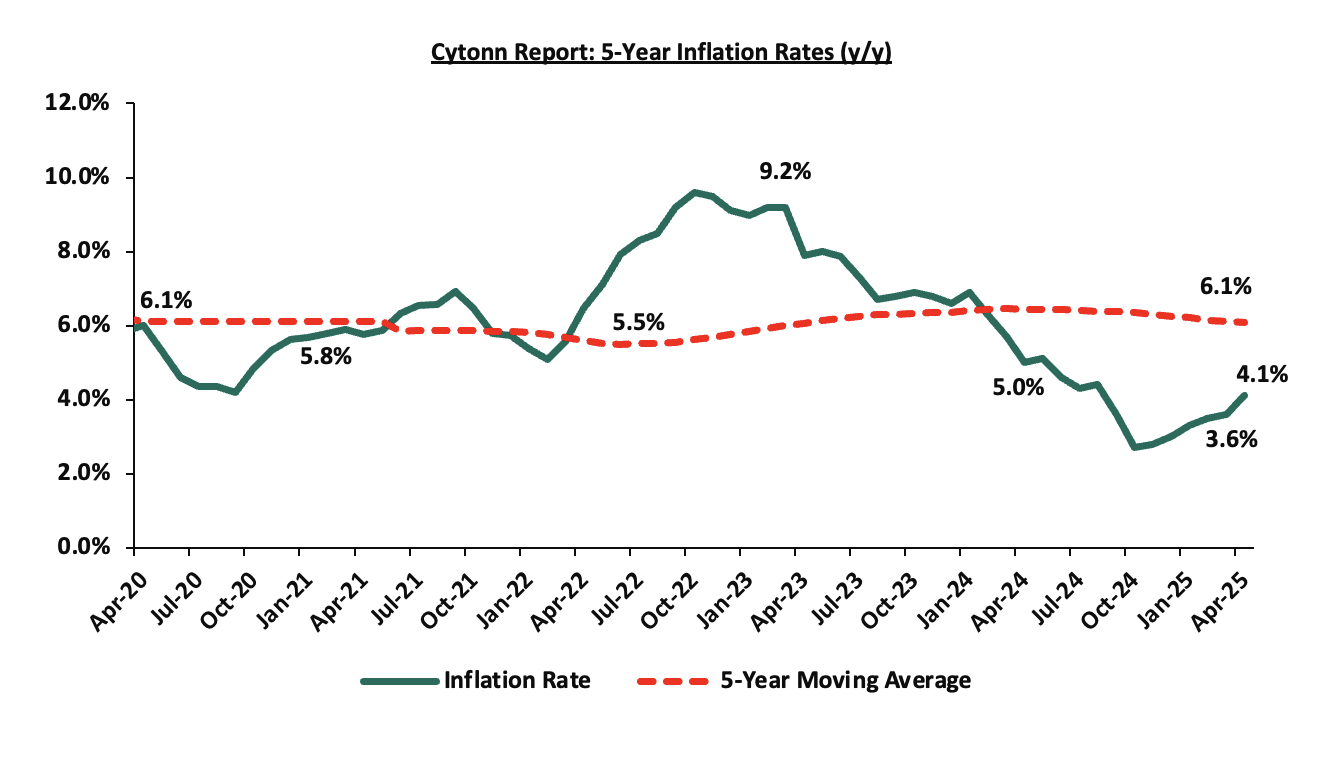
Notably, April’s overall headline inflation increased for the sixth consecutive month, but remaining within the CBK’s preferred range of 2.5%-7.5% for the twenty second consecutive month. The increase in headline inflation in April 2025 comes despite the maximum allowed price for Super Petrol and Diesel decreasing by 1.1% and 1.3% to retail at Kshs 174.6 and Kshs 164.9 respectively, from Kshs 176.6 and Kshs 167.1 respectively. Despite fuel prices decreasing, prices are still high, resulting in high production costs and high costs of goods and services. Additionally, the reduction in the CBR to 10.00% from 10.75% is likely to increase the money supply through lower borrowing costs, which may cause a gradual rise in inflation rates as the effects of the CBR gradually take hold in the broader economy. However, the stabilization in the exchange rate and reducing fuel prices is expected to continue anchoring inflationary pressures in the country, remaining within the CBK’s preferred range of 2.5%-7.5%. The chart below shows the inflation rates for the past 5 years:
Additionally, favourable weather conditions will also contribute to stabilizing food prices, further supporting stable inflation rates. The risk, however, lies in the fuel prices which despite their stability, still remain elevated compared to historical levels.
- Kenya’s Pricing of USD 500.0 mn Privately Placed Amortising Notes
On April 25, 2025, the Republic of Kenya announced the pricing of a USD 500.0 mn amortising Notes with an annual interest rate of 8.25%, maturing in 2032. The bond was issued through a private placement at its par value at 100.0%, settled on 30th April 2025, hence a tenor of 7 years. Funds raised will support the national budget and help manage existing debt. Private Placement is a form of fundraising method where securities are sold directly to a small group of selected investors rather than being offered to the public through an open market. Private placements are less costly than public offerings, but they are subject to fewer regulatory requirements.
Armotising notes repay the principal gradually over the bond’s life rather than in a single lumpsum at maturity. This means that with each coupon payment, a portion of the bond’s face value is also repaid, reducing the outstanding debt over time. For issuers, it lowers refinancing risk and spreads out repayment obligations, making debt management more predictable and sustainable.
In 2024, Kenya issued a USD 1.5 bn Eurobond with a similar tenor, carrying a higher coupon of 9.75% and a yield of 10.3%. Compared to this, the new armotising notes offer a lower coupon of 8.25%. comparing the two, the 8.25% coupon rate on the new armotising notes is fairly priced, especially considering the lower risk to investors and the reduced lumpsum repayment pressure on Kenya. Therefore, these notes are fairly priced and support better debt management without excessive cost. Typically, Armotising notes are considered lower-risk by investors, which justifies a lower coupon. Similarly, the government secured a USD 1.5 bn private placement from the United Arab Emirates in 2025 with an 8.25% coupon rate and a 7-year tenor. While the armotising notes gradually repay interest and principal over the seven years, reducing refinancing risk, the UAE loan is structured with bullet repayments in 2032, 2034 and2036, offering liquidity but deferring repayment pressure to the future.
This approach reflects Kenya's focus on securing funding outside conventional public debt markets. Additionally, this move is part of Kenya’s broader debt strategy, which includes refinancing and restructuring efforts to ease pressure from upcoming repayments. Earlier in the year, Kenya conducted its first domestic bond buyback retiring Kshs 50.1 bn in outstanding three bonds. Additionally, in February, the country raised USD 1.5 bn through a 11-year Eurobond to manage external obligations at 9.9%, including the planned buyback of a 7-year USD 900.0 mn Eurobond issued in 2019 with a maturity of May 2027.
The Notes are not registered under the U.S. Securities Act of 1933, a Private Placement, hence limiting their sale within the United States unless specific exemptions apply. Additionally, the announcement adheres to international standards outlined in the Market Abuse Regulation (EU) 596/2014, highlighting its significance as potentially inside information.
Monthly Highlights:
- During the month, Stanbic Bank released its monthly Purchasing Manager's Index (PMI) highlighting that the index for the month of March 2025 increased slightly, coming in at 51.7, up from 50.6 in February 2025, signaling another improvement in business conditions. This marked the sixth consecutive month that index fell above the 50.0 neutral mark. Increased output, new orders and increased sales supported the improvement. For more information, please see our Cytonn Q1’2025 Markets Review
- During the month, The monetary policy committee met on April 8th, 2025, to review the outcome of its previous policy decisions against a backdrop of elevated uncertainties to the global outlook for growth, lower but sticky inflation in advanced economies, heightened trade tensions as well as persistent geopolitical tensions. The MPC decided to lower the CBR rate by 75.0 bps to 10.00%, from 10.75% in February 2025 which was in line with our expectation for the MPC to lower the CBR rate to within a range of 10.00%-10.50%. For more information, please see our Cytonn weekly #15/2025
- During the month, the National Treasury gazetted the revenue and net expenditures for the ninth month of FY’2024/2025, ending 31st March 2025, highlighting that the total revenue collected as at the end of March 2025 amounted to Kshs 1,702.9 bn, equivalent to 66.0% of the revised estimates of Kshs 2,580.9 bn for FY’2024/2025 and was 88.0% of the prorated estimates of Kshs 1,935.7 bn. For more information, please see our Cytonn weekly #16/2025
- During the month, The Energy and Petroleum Regulatory Authority (EPRA) released their monthly statement on the maximum retail fuel prices in Kenya, effective from 15th April 2025 to 14th May 2025. Notably, the maximum allowed price for Super Petrol, Diesel and Kerosene decreased by Kshs 2.0, Kshs 2.2 and Kshs 2.4 respectively. Consequently, Super Petrol, Diesel and Kerosene will now retail at Kshs 174.6, Kshs 164.9 and Kshs 150.0 per litre respectively, from Kshs 176.6, Kshs. 167.1 and Kshs 151.4 per litre respectively, representing decreases of 1.1%,1.3% and 1.6% for Super Petrol, Diesel and Kerosene respectively. For more information, please see our Cytonn weekly #16/2025
- During the month The Central Bank of Kenya (CBK) initiated a comprehensive review of the Risk-Based Credit Pricing Model (RBCPM), five years after its implementation in 2019. The RBCPM was originally developed as a market-driven solution to address inefficiencies in Kenya’s credit market, including high lending rates and a lack of transparency in credit pricing. The aim is to have a clear pricing module for the banks. For more information, please see our Cytonn weekly #17/2025
Rates in the Fixed Income market have been on a downward trend due to high liquidity in the money market which allowed the government to front load most of its borrowing. The government is 76.7% ahead of its prorated net domestic borrowing target of Kshs 505.3 bn, and 49.5% ahead of the total FY’2024/25 net domestic borrowing target of Kshs 597.2 bn, having a net borrowing position of Kshs 892.7 bn (inclusive of T-bills). However, we expect the yield curve to stabilize in the short and medium term, with the government looking to increase its external borrowing to maintain the fiscal surplus, hence alleviating pressure in the domestic market. As such, we expect the yield curve to remain stable in the short to medium-term and hence investors are expected to shift towards the long-term papers to lock in the high returns
Market Performance:
During the month of April 2025, the equities market was on a downward trajectory, with NSE 10 declining the most by 4.3%, while NSE 20, NASI and NSE 25 declined by 4.1%, 3.6% and 3.4% respectively. The equities market negative performance was driven by losses recorded by large-cap stocks such as Co-operative Bank, KCB Bank and ABSA Bank Kenya of 10.0%, 8.8%, and 4.5% respectively. The monthly performance was however supported by gains recorded by large cap stocks such as Stanbic Bank, NCBA and Standard Chartered Bank of 7.9%, 2.9% and 0.3% respectively.
During the week, the equities market was on a downward trajectory, with NSE 20, NSE 10, NSE 25 and NASI losing by 2.1%, 1.3%, 1.3% and 0.2% respectively, taking the YTD performance to gains of 2.3%, and 0.2% for NSE 20 and NASI respectively, and losses of 4.1% and 2.3% for NSE 10 and NSE 25 respectively. The week on week equities market performance was driven by losses recorded by large-cap stocks such as Standard Chartered Bank, Cooperative Bank and NCBA of 10.1 %, 10.0%, and 8.4% respectively. The performance was however supported by gains recorded by large-cap stocks such as Safaricom, Equity Bank and EABL of 4.7%, 1.3% and 0.6% respectively;
Additionally, in the regional equities market, the East African Exchanges 20 (EAE 20) share index gained by 0.1% to 100.1 from 100.0 recorded the previous week, attributable to gains recorded by large cap stocks such as Bank of Baroda Uganda, Absa Bank Kenya and Stanbic Uganda Holdings of 8.8%, 2.4% and 2.3% respectively, that were matched by the losses recorded by large cap stocks such as Cooperative Bank of Kenya, KCB group and I &M Rwanda of 9.9%, 1.1% and 0.2% respectively.
Equities turnover decreased by 7.5% in the month of April 2025 to USD 58.0 mn, from USD 62.7 mn recorded in March 2025. Foreign investors remained net sellers, with a net selling position of USD 6.5 mn, a decrease from a net selling position of USD 7.2 mn recorded in March 2025.
During the week, equities turnover decreased by 44.3% to USD 9.8 mn from USD 17.6 mn recorded the previous week, taking the YTD total turnover to USD 261.4 mn. Foreign investors became net sellers for the fourth consecutive time with a net selling position of USD 0.02 mn, from a net selling position of USD 1.9 mn recorded the previous week, taking the YTD foreign net selling position to USD 31.7 mn, compared to a net selling position of USD 16.9 mn recorded in 2024.
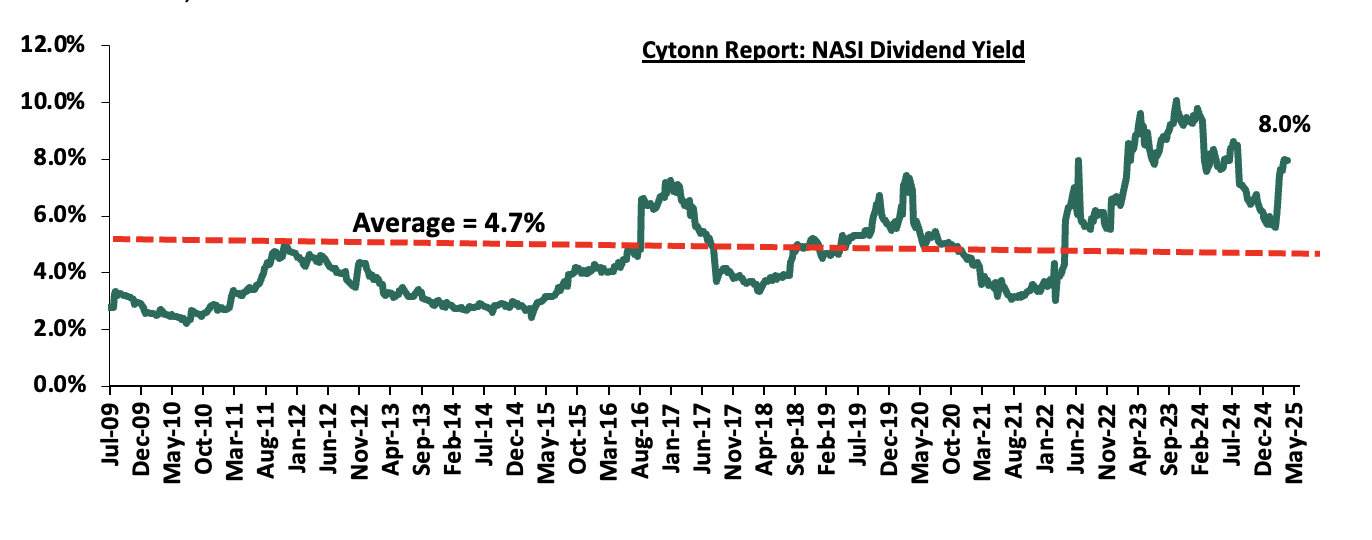
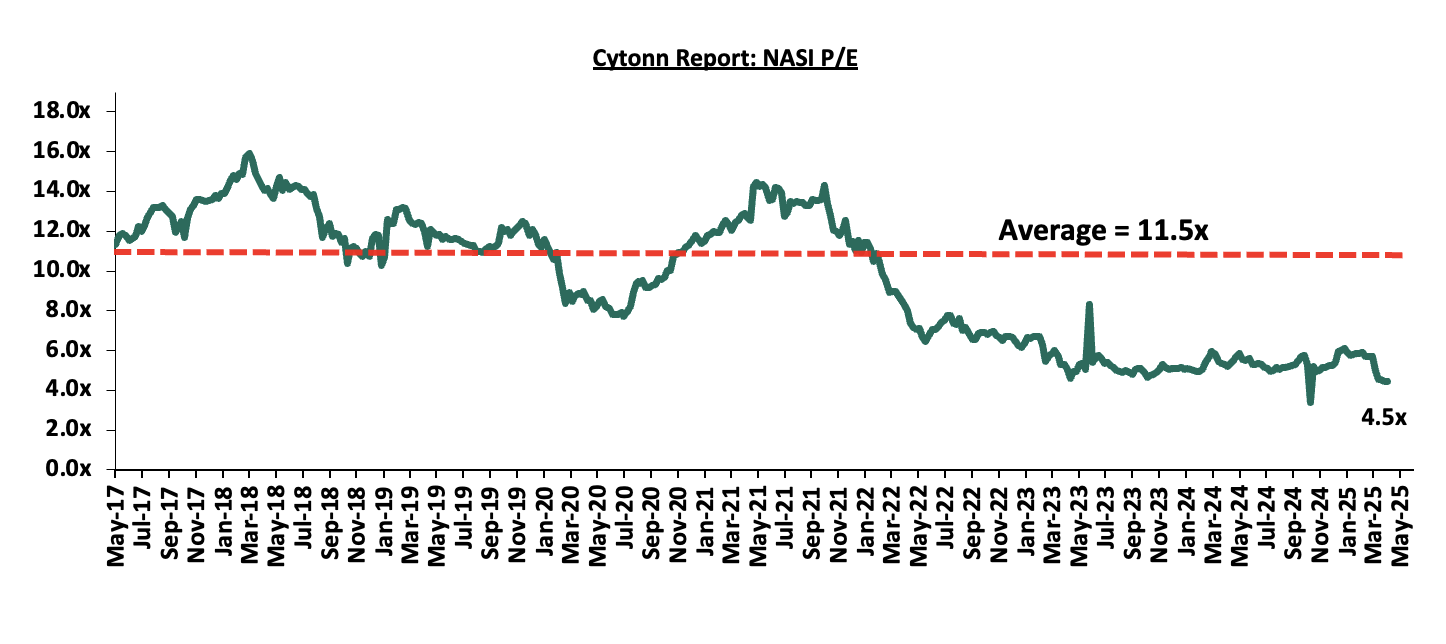
The market is currently trading at a price-to-earnings ratio (P/E) of 4.4x, 61.3% below the historical average of 11.5x. The dividend yield stands at 8.0%, 3.3% points above the historical average of 4.7%. Key to note, NASI’s PEG ratio currently stands at 0.6x, an indication that the market is undervalued relative to its future growth. A PEG ratio greater than 1.0x indicates the market is overvalued while a PEG ratio less than 1.0x indicates that the market is undervalued. The charts below indicate the historical P/E and dividend yields of the market;
Universe of Coverage:
|
Cytonn Report: Equities Universe of Coverage |
||||||||||||
|
Company |
Price as at 25/04/2025 |
Price as at 30/04/2025 |
Price as at 02/05/2025 |
w/w change |
m/m change |
YTD Change |
Year Open 2025 |
Target Price* |
Dividend Yield*** |
Upside/ Downside** |
P/TBv Multiple |
Recommendation |
|
Co-op Bank |
16.0 |
14.4 |
14.4 |
(10.0%) |
(10.0%) |
(17.5%) |
17.5 |
18.6 |
10.4% |
39.7% |
0.6x |
Buy |
|
KCB Group |
38.5 |
38.5 |
38.6 |
0.1% |
(8.8%) |
(9.1%) |
42.4 |
50.7 |
7.8% |
39.3% |
0.5x |
Buy |
|
Standard Chartered Bank |
300.3 |
300.0 |
270.0 |
(10.1%) |
0.3% |
(5.3%) |
285.3 |
328.8 |
16.7% |
38.4% |
1.7x |
Buy |
|
Jubilee Holdings |
191.0 |
200.0 |
200.0 |
4.7% |
4.0% |
14.4% |
174.8 |
260.7 |
6.8% |
37.1% |
0.3x |
Buy |
|
NCBA |
54.0 |
54.0 |
49.5 |
(8.4%) |
2.9% |
(3.0%) |
51.0 |
60.2 |
11.1% |
32.9% |
0.9x |
Buy |
|
ABSA Bank |
18.5 |
18.2 |
17.2 |
(7.0%) |
(4.5%) |
(8.8%) |
18.9 |
21.0 |
10.2% |
32.3% |
1.2x |
Buy |
|
I&M Group |
30.3 |
30.1 |
30.3 |
0.2% |
(7.0%) |
(15.8%) |
36.0 |
36.8 |
9.9% |
31.4% |
0.5x |
Buy |
|
Diamond Trust Bank |
75.0 |
74.3 |
72.8 |
(3.0%) |
(2.0%) |
9.0% |
66.8 |
87.1 |
9.6% |
29.4% |
0.3x |
Buy |
|
Equity Group |
45.5 |
45.7 |
46.1 |
1.3% |
(3.0%) |
(4.1%) |
48.0 |
52.8 |
9.2% |
23.9% |
0.8x |
Buy |
|
Stanbic Holdings |
175.8 |
174.5 |
174.5 |
(0.7%) |
7.9% |
24.9% |
139.8 |
185.3 |
11.9% |
18.1% |
1.1x |
Accumulate |
|
Britam |
6.9 |
6.8 |
6.6 |
2.1% |
(15.3%) |
12.7% |
5.8 |
7.5 |
0.0% |
14.3% |
0.6x |
Accumulate |
|
CIC Group |
2.9 |
2.9 |
2.9 |
1.4% |
2.8% |
37.4% |
2.1 |
3.1 |
4.4% |
9.9% |
0.8x |
Hold |
|
*Target Price as per Cytonn Analyst estimates **Upside/ (Downside) is adjusted for Dividend Yield ***Dividend Yield is calculated using FY’2024 Dividends |
||||||||||||
Monthly Highlights
- During the month, Sanlam Kenya’s Board of Directors announced commencement of Sanlam Kenya PLC’s rights issue following prior clearance by the shareholders, the Capital Markets Authority (CMA), the Nairobi Stock Exchange (NSE) and the Insurance Regulatory Authority (IRA), paving the way for a significant capital-raising initiative aimed at lowering the company’s outstanding long-term debt and to offer management operational and financial flexibility to support the company’s growth and return to profitability. Sanlam Kenya’s rights issue involves the issuance of up to 500.0 mn new ordinary shares, priced at Kshs 5.0 each, with a par value of Kshs 5.0 per share. Please see our Cytonn Weekly #15/2025 for more info
- During the month, the East African Securities Exchanges Association (EASEA) launched the East Africa Exchanges (EAE) 20 Share Index. The EAE 20 Share Index comprises of the top 20 listed companies in Kenya, Tanzania, Uganda and Rwanda securities exchanges. Please see our Cytonn Weekly #15/2025 for more info
- During the month, Bamburi Cement Plc released their FY’ 2024 results, reporting a loss for the year of Kshs 0.9 bn, a significant 126.8% increase from the Kshs 0.4 bn loss recorded in FY’2023. Please see our Cytonn Weekly #16/2025 for more info
We are “Bullish” on the Equities markets in the short term due to current cheap valuations, lower yields on short-term government papers and expected global and local economic recovery, and, “Neutral” in the long term due to persistent foreign investor outflows. With the market currently trading at a discount to its future growth (PEG Ratio at 0.6x), we believe that investors should reposition towards value stocks with strong earnings growth and that are trading at discounts to their intrinsic value. We expect the current high foreign investors sell-offs to continue weighing down the economic outlook in the short term.
- Industry Report
- Hass Consult Land and property price index
During the week, Hass Consult, a Kenyan consulting and Real Estate development firm, released its Property Index Q1 2025 Report, focusing on the residential Real Estate sector's performance in the Nairobi Metropolitan Area (NMA). The following are the key take-outs from the report;
- The average selling prices for all properties posted a 2.5% increase on a quarter-on-quarter (q/q) basis in Q1’2025, an improvement from 0.8 % increase recorded in Q4’2024. The performance can be linked to increased activity in satellite towns where asking prices surged by 4%. However, Nairobi’s suburbs saw a fifth consecutive quarter of price contraction, albeit marginal at 0.4%, compared to 0.8% in Q4’2024. On a year-on-year (y/y) basis, property prices showed a 4.9% increase, slightly below the 5.3% increase recorded in Q’1 2024 Detached houses posted the highest quarterly growth at 3.2%, followed by semi-detached houses at 1.6%, while apartments showed minimal change at 0.2%. This reflects shifting buyer preferences toward more spacious housing, particularly in satellite towns where affordability and better living conditions are increasingly attractive. The increase in prices further elevated the cost of financing house purchases, making it more expensive for buyers. Additionally, while the earlier market experienced volatility due to mid-2024 political protests and cautious pricing, the current trend points to a steady recovery. Developers continue to face rising construction costs, which they are forced to pass on to homebuyers, further contributing to the upward pressure on property prices.
- The average asking rents of housing units in the NMA during the period under review increased slightly by 0.3% on a quarter-on-quarter (q/q) basis, compared to a 0.2% increase in Q4’2024. The increase in rental prices was primarily driven by a 9% q/q rise in rents in satellite towns, supported by areas such as Ruiru 5.3%, Ngong 5.1%, and Limuru 4.9%, due to improving economic conditions and stable inflation. In contrast, Nairobi’s suburbs recorded a rental price contraction of 0.8%, their first decline in two years, weighed down by falling rents in areas like Muthaiga (4.9%), Nyari (4.7%), and Kilimani (4.6%). This downturn is partly attributed to concerns over tenant exits following the US government's aid funding cuts, which triggered job losses in higher end segments
- Apartments recorded a 0.3% q/q increase in rents in Q1’2025, while detached units rose by 0.9%, and semi-detached units experienced a q/q rental price drop of 1.2%. On an annual basis, houses in Kitengela had the highest rental price increase at 14.9%, followed by other high-performing nodes. However, Kileleshwa registered the steepest annual rental price drop at 12.0%. The overall rental trends reflect demand shifts, with growing middle-class interest in more affordable housing, particularly apartments in satellite towns, while detached units saw moderate growth as affluent renters sought more space. Meanwhile, the decline in semi-detached rental prices mirrors landlord responses to persistent market pressure and tenant affordability concerns.
- In Nairobi’s suburbs, property in Runda posted the highest quarterly sales price increase at 5.2%, reflecting sustained demand due to upscale developments and strong infrastructure, including well-maintained roads like Kiambu and Limuru Roads, ensuring seamless connectivity to Nairobi’s CBD and the Thika Superhighway. The area offers reliable utilities managed by Runda Water Limited and Kenya Power, alongside top-tier international schools such as Potterhouse and Brookhouse, catering to residents’ needs. Proximity to shopping hubs like Village Market, recreational spaces like Karura Forest, and high-standard healthcare facilities enhances its appeal. Enhanced security due to nearby UN and US Embassy presence, coupled with controlled development, maintains Runda’s status as an elite residential area.
- In contrast, apartments in Westlands recorded the steepest quarterly price drop at 6.6%, while annually, they fell by 3%, making them the weakest-performing segment. Notably, Kileleshwa saw an annual apartment rent drop of 12.0%, highlighting reduced appeal among tenants. Areas like Muthaiga and Nyari also experienced significant annual rent drops of 5.9% and 4.7%, respectively. These trends underscore shifting preferences, as residents increasingly seek better value in satellite areas offering similar amenities at lower price points.
- In satellite towns, Juja properties saw the highest year on year price appreciation 13.8%, driven by: i) strong connectivity through the Thika Super Highway, ii) growing middle-class interest in settling and raising families there, iii) closeness to major shopping hubs like Unicity Mall and Juja City Mall, and iv) access to key amenities, including Jomo Kenyatta University of Agriculture and Technology (JKUAT) and hospitals. Conversely, Athi River had the lowest yearly price growth at 4.2%, largely due to competition from nearby areas like Kitengela and Rongai, which are gaining popularity for better residential settings. This contrast highlights how location and infrastructure access shape performance differences among satellite towns
- In satellite towns’ apartments, Kitengela recorded the highest y/y price appreciation of 14.9%, closely followed by Ngong 10.5% and Ongata Rongai 9.9%. Kitengela led in annual rental price appreciation due to its affordability, improving infrastructure, and spacious housing options. Its proximity to amenities like schools, malls, and healthcare facilities has also made it an attractive alternative to Nairobi suburbs, boosting demand and driving up rents. Rongai on the other hand was supported by good connectivity through infrastructure such as the Lang’ata road, Southern bypass and Ngong’ road, with rising property prices in Nairobi itself, Rongai has become an ideal alternative, offering spacious apartments and gated communities that cater to middle-income earners, and the area has seen an increase in the development of social amenities, including shopping centers, schools, and healthcare facilities, making it convenient for residents. Proximity to retail centers like Galleria Mall and nearby medical facilities enhance Rongai’s attractiveness for families and working professionals alike. Conversely, Athi river registered the lowest y/y price depreciation of 2% attributed to stiff competition faced from neighbourhoods. The subdued growth was attributed to strong competion from nearby towns like Rongai and Kitengela which have become increasingly attractive to residents seeking better residential environments.
The findings of the report are in line with our Cytonn Annual Market Review Q1 2025, highlighting that selling prices of residential properties in the Nairobi Metropolitan Area (NMA) recorded a 0.1% price appreciation.
Hass Consult released the Land Price Index Q1’2025 Report which highlighted the performance of the Real Estate land sector in the Nairobi Metropolitan Area (NMA). The following were the key take outs from the report;
- The average q/q selling prices for land in the Nairobi suburbs grew by 1.7%, maintaining the same rate as recorded in Q1’2024. On a (y/y) basis, land prices appreciated by 0.4% points to 9% from the 6.5% increase recorded in Q1’2024. Consequently, q/q and y/y land prices in satellite towns of Nairobi recorded increases of 2.4% and 9.9% respectively, compared to the 1.9% and 10.6% growth respectively recorded in Q1’2024. This positive performance is driven by demand from a rising population, as individuals from various regions of the country migrate annually in search of employment, education, and other opportunities. The fixed supply of land has intensified demand, particularly for residential and commercial purposes, leading to an increase in land prices. Furthermore, there is an expanding middle class in the NMA with disposable income, willing to invest in land as a savings and investment option. On the other hand, the government's ongoing infrastructural development projects, such as roads and water connections, are opening up more satellite towns, subsequently driving land prices upward. The government’s Affordable Housing Program, under the Bottom-Up Economic Transformation Agenda (BETA), has initiated construction projects across various parts of Nairobi and the country, further increasing land values due to heightened construction activity.
- Spring Valley was the best-performing Nairobi suburb with a y/y price appreciation of 14.8%. This was attributed to; i) its strategic location near key commercial and diplomatic zones such as Westlands, Gigiri, and the CBD, making it attractive for high-end residential developments and mixed-use projects, including malls like West Gate, Village Market, Two Rivers mall and other retail centres. ii) its low-density zoning and serene environment, which have increasingly appealed to buyers seeking exclusivity and premium living experiences, iii) ongoing infrastructure enhancements in the surrounding areas, such as improved road networks including the Redhill Link Road and Waiyaki Way expansion, which have significantly boosted accessibility, and iv) a growing shift among developers and high-income buyers towards areas offering larger plots and the potential for high-value detached homes, in contrast to saturated apartment markets in other city zones. Kitisuru experienced the lowest year-on-year land price appreciation at 0.7%. This can be attributed to land buyers increasingly favoring nearby areas such as Spring Valley, Loresho and Nyali, offering wider range of amenities, superior infrastructure, closer proximity to retail hubs, and a more established residential environment.
- For satellite towns, Syokimau was the best-performing node with a y/y capital appreciation of 16.2%, followed by Ruiru which recorded a y/y capital appreciation of 15.9%. The improvement in performance in Syokimau was driven by; i) its strategic location near key transport corridors such as the Nairobi Expressway and Mombasa Road, which significantly enhance accessibility to Nairobi’s CBD and industrial zones, ii) ongoing infrastructure upgrades including the Standard Gauge Railway (SGR) terminus and improved road networks, making it attractive for residential and commercial developments, iii) a growing demand from the middle-income segment seeking affordable land for housing within commuting distance to Nairobi. This demand has been further boosted by infrastructure developments and the area's growing attractiveness to investors seeking high returns on their property investments. On the other hand, land prices in Ruiru were bolstered by its strategic location along the Thika Superhighway and Eastern Bypass; providing seamless connectivity to Nairobi and key commercial hubs, making it a prime location for residential and industrial developments. Conversely, Ongata Rongai was the least performing node with a y/y price depreciation of 3.1%, attributable to increased competition from neighboring towns like Kiserian and Ngong, which offer more affordable land and better infrastructure upgrades.
These findings align with broader market trends observed in the Cytonn Annual Market Review Q1 2025 which highlighted that the overall average selling prices for land in the NMA recorded a price appreciation of 2.7% to Kshs 130.9 mn from 128.9 mn. This performance was contributed by; i) The growing demand for land in the Nairobi Metropolitan Area (NMA) is driven by a rising population, as individuals from various regions of the country migrate annually in search of employment, education, and other opportunities, ii)The fixed supply of land has intensified demand, particularly for residential and commercial purposes, leading to an increase in land prices, iii)The expanding middle class in the NMA with disposable income, willing to invest in land as a savings and investment option, iv)The government's ongoing infrastructural development projects, such as roads, sewers, railways, and water connections, are opening up more satellite towns, subsequently driving land prices upward, v)The widely held belief among the middle class that land represents a secure form of wealth has prompted many families to save specifically for land acquisition, and, vi)The government’s Affordable Housing Program, under the Bottom-Up Economic Transformation Agenda (BETA), has initiated construction projects across various parts of Nairobi and the country, further increasing land values due to heightened construction activity.
During the month of April, the following industry reports were released and the key take-outs were as follows;
|
Cytonn Report: Notable Industry Reports During the Month of March 2025 |
|||
|
# |
Theme |
Report |
Key Take-outs |
|
1. |
Leading Economic Indicators |
Leading Economic Indicators (LEI) February 2025 Reports by the Kenya National Bureau of Statistics |
|
- Residential Sector
During the week, the Kenyan government introduced new regulations under the Affordable Housing Programme, requiring applicants to provide proof of income, such as payslips, to qualify for housing allocation. This measure aims to ensure that beneficiaries can afford mortgage repayments and maintain the sustainability of the initiative. The Affordable Housing Regulations, 2024, stipulate that applications must include income verification documents, a national ID or passport, and a 10.0% deposit of the unit's value. For individuals earning below Kshs 20,000 monthly, deposit assistance is available, provided the unit will serve as their primary residence and the estimated monthly repayment does not exceed 30.0% of their income.
President William Ruto signed the Affordable Housing Bill into law on March 19, 2024, reinstating the housing levy that mandates a 1.5% deduction from both employees' and employers' gross monthly pay. This legislation also extends to informal sector workers, requiring them to contribute 1.5% of their monthly gross earnings. The collected funds will be managed by the Affordable Housing Board, which is responsible for overseeing the programme's implementation and ensuring transparency through annual investment plans subject to Cabinet and parliamentary approval.
Lands Cabinet Secretary earlier, clarified that contributions to the Housing Levy do not guarantee automatic home ownership. Instead, the programme operates on a rent-to-own model, where individuals make monthly payments until they fully own the units. The Affordable Housing Programme is structured to cater to various income brackets, including social housing for those earning less than Ksh20,000, general affordable housing for incomes between Kshs 20,000 and Kshs 149,000, and middle-class housing for those earning above Kshs 49,000. Priority is given to slum residents, and measures are in place to prevent multiple allocations to a single applicant. The initiative also emphasizes the use of locally sourced materials and labor, aiming to boost employment and support local economies.
We expect the Affordable Housing Programme to greatly transform Kenya’s housing sector by making homeownership more accessible to low- and middle-income earners. By requiring payslips and proof of income for allotment, the government is introducing a more structured and transparent system that ensures homes are allocated to genuine beneficiaries who can sustainably manage repayments. This move is likely to strengthen public confidence in the programme and promote financial discipline among applicants. Additionally, the structured rent-to-own model, combined with initiatives to support those earning below Ksh20,000, is expected to create a more inclusive housing market.
There were five notable highlights during the month;
- Kenya’s affordable housing project initiative faced a fresh challenge where it was found that a financially unstable construction company, despite struggling with debt and tax issues, was controversially awarded a Kshs 2.2 bn contract in January 2025 to construct affordable housing units in Loitoktok, Kajiado County. At the time of the tender award, the company had not paid a court-ordered debt of Kshs 1.9 mn and was also involved in a tax dispute with the Kenya Revenue Authority over Kshs 4.2 mn in unpaid taxes. These financial struggles were confirmed through separate court proceedings, including one that led to the brief jailing of one of the company’s directors for defaulting on payments. For more information, please see our Cytonn Weekly #17/2025, and,
- Kenya’s Affordable Housing Programme (AHP) board announced a plan to have the AHP to undergo an independent economic impact audit following underperformance in meeting its objectives. Launched to address the country’s 0 mn-unit housing deficit and create one million jobs annually, the programme has struggled significantly. As of the 2023/24 financial year, only 40,000 housing units were delivered—16.0% of the annual target of 250,000—while job creation stood at just 120,000. Moreover, project delays and budget shortfalls have hindered progress, with the government’s 2024/25 housing budget of Kshs 92.5 bn still falling short of what’s needed. For more information, please see our Cytonn Weekly #16/2025, and,
- Kenya’s proposed amendments to the Land Act 2012 seek to shorten the period within which affordable housing loan defaulters must regularize their payments before lenders can initiate foreclosure. The changes would reduce the default notice window from 90 to 45 days and the foreclosure notice from 40 to 20 days. This move is intended to make affordable housing lending more attractive to financial institutions by reducing the time and risk associated with recovering defaulted loans. For more information, please see our Cytonn Weekly #16/2025, and,
- Gulf Cap Real Estate launched a Kshs 20.0 bn housing project in Nairobi, aiming to address Kenya’s acute housing shortage by delivering mid- and low-cost units. This initiative, underscores the developer’s commitment to easing the country’s estimated 2.0 mn-unit housing deficit, which grows by 250,000 units annually against a supply of just 50,000. The project comprises two key developments—InCity Suites and Starehe Point—both designed to provide affordable homes in the residential market. For more information, please see our Cytonn Weekly #15/2025, and,
- During the week, KCB Bank and Mi Vida Homes entered a partnership to accelerate the development of eco-friendly, affordable housing in Kenya. This collaboration supports the government’s Affordable Housing Programme, which aims to deliver 250,000 units annually to bridge the country’s significant housing deficit. Under the agreement, KCB will provide construction financing for Mi Vida’s projects and also offer mortgage loans to buyers, aiming to make homeownership more accessible. Mi Vida plans to develop 5,000 homes over the next five years, focusing on well-planned, sustainable communities. The initiative is positioned as a solution to the growing demand for affordable housing, particularly in urban and peri-urban areas. For more information, please see our Cytonn Weekly #15/2025,
We expect continued vibrant performance in the residential sector within the country sustained by; i)ongoing residential developments under the Affordable Housing Agenda, aiming to reduce the housing deficit in the country currently estimated at 80.0%, ii) increased investment from local and international investors in the housing sector, iii) favorable demographics in the country, shown by high population and urbanization rates of 3.8% p.a and 2.0% p.a, respectively, leading to higher demand for housing units. However, challenges such as rising construction costs, strain on infrastructure development, and limited access to financing will continue to restrict the optimal performance of the residential sector.
- Industrial Sector
There was one notable highlight during the month;
- President William Ruto's initiative to establish County Aggregation and Industrial Parks (CAIPs) across Kenya is faced significant challenges due to funding shortfalls. Initially, the national government pledged to fund half of the Kshs 500.0 mn cost for each CAIP, aiming to implement them in all counties within two years from July 2023. However, only KshS 3.3 bn of the planned Kshs 9.0 bn has been allocated, leading to a reduction in the number of counties expected to have operational CAIPs by June 2025, from all 47 to just 18. For more information, please see our Cytonn Weekly #16/2025, and,
We expect to witness more industrial expansions activities for the year 2025, driven by increased investments from both local and international companies, the availability of industial space, a growing consumer base, and evolving consumer preferences in the country.
- Hospitality
There was one notable highlight during the month;
- Hotel Chain Development Pipeline in Africa 2025 report noted that Kenya’s hospitality sector is undergoing a major transformation, with new hotel developments increasingly moving away from Nairobi and into upcountry regions. Nearly half of the hotel rooms currently under construction in the country are now located outside the capital, up from just over a quarter the previous year. Out of the 4,344 rooms being developed across 26 hotels, 2,038 are in towns and cities outside Nairobi, which now only accounts for 2,306 rooms. This shift has seen Nairobi lose its place among Africa’s top 10 cities for hotel development, a significant change driven by evolving investment patterns. For more information, please see our Cytonn Weekly #15/2025
We expect that tourism growth will continue to support this upcountry expansion, with international arrivals rising by over 13.5% in the past year. However, the success of this trend will depend on continued infrastructure improvements, such as roads, power, and water supply, which remain inconsistent in many rural regions. While developers are capitalizing on the promise of new markets, the shift is also partially influenced by challenges in Nairobi, including financial constraints, high loan default rates, and a rise in property auctions. Some developers may see upcountry locations as a strategic move to reduce exposure to the economic pressures affecting the capital. This ongoing redistribution of hospitality investment presents both opportunities for regional development and challenges that must be addressed to ensure long-term sustainability.
- Real Estate Investments Trusts (REITs)
On the Unquoted Securities Platform, Acorn D-REIT and I-REIT traded at Kshs 26.7 and Kshs 22.9 per unit, respectively, as per the last updated data on 17th April 2025. The performance represented a 33.4% and 14.5% gain for the D-REIT and I-REIT, respectively, from the Kshs 20.0 inception price. The volumes traded for the D-REIT and I-REIT came in at Kshs 12.8 mn and Kshs 36.1 mn shares, respectively, with a turnover of Kshs 323.5 mn and Kshs 791.5 mn, respectively, since inception in February 2021. Additionally, ILAM Fahari I-REIT traded at Kshs 11.0 per share as of 17th April 2025, representing a 45.0% loss from the Kshs 20.0 inception price. The volume traded to date came in at 1.2 mn shares for the I-REIT, with a turnover of Kshs 1.5 mn since inception in November 2015.
REITs offer various benefits, such as tax exemptions, diversified portfolios, and stable long-term profits. However, the ongoing decline in the performance of Kenyan REITs and the restructuring of their business portfolios are hindering significant previous investments. Additional general challenges include:
- Insufficient understanding of the investment instrument among investors leading to a slower uptake of REIT products,
- Lengthy approval processes for REIT creation,
- High minimum capital requirements of Kshs 100.0 mn for REIT trustees compared to Kshs 10.0 mn for pension funds Trustees, essentially limiting the licensed REIT Trustee to banks only
- The rigidity of choice between either a D-REIT or and I-REIT forces managers to form two REITs, rather than having one Hybrid REIT that can allocate between development and income earning properties
- Limiting the type of legal entity that can form a REIT to only a trust company, as opposed to allowing other entities such as partnerships, and companies,
- We need to give time before REITS are required to list – they would be allowed to stay private for a few years before the requirement to list given that not all companies maybe comfortable with listing on day one, and,
- Minimum subscription amounts or offer parcels set at Kshs 0.1 mn for D-REITs and Kshs 5.0 mn for restricted I-REITs. The significant capital requirements still make REITs relatively inaccessible to smaller retail investors compared to other investment vehicles like unit trusts or government bonds, all of which continue to limit the performance of Kenyan REITs.
We expect the performance of Kenya’s Real Estate sector to remain resilient supported by several factors: i) heightened activities from both private and government sectors, ii) an expanding population driving the need for housing, iii) government efforts under the Affordable Housing Program and the incentives advanced to developers aligned with the program, iv) an increase in deals in the commercial office sector likely to boost occupancy, v) increased investment by international and local investors in the retail sector, and vi) increased international arrivals in the country boosting the hospitality and tourism sector. However, challenges such as rising construction costs, an oversupply in select Real Estate classes, strain on infrastructure development, and high capital demands in REITs sector will continue to impede the real estate sector’s optimal performance by restricting developments and investments.
Disclaimer: The views expressed in this publication are those of the writers where particulars are not warranted. This publication, which is in compliance with Section 2 of the Capital Markets Authority Act Cap 485A, is meant for general information only and is not a warranty, representation, advice, or solicitation of any nature. Readers are advised in all circumstances to seek the advice of a registered investment advisor.

- Talk to us
- Kenya
- P.O Box 20695 - 00200, Nairobi, Kenya
- Cell +254709101200
- Tel +254709101200
- WhatsApp +254741676635
- United States
- +254709101200
- DOWNLOAD OUR APP
-


- Kenya
- 8th Floor, Pinetree Plaza, Kaburu Drive, Ngong Road, Nairobi, Kenya
- USA
- Suite 1150, 1775 Eye Street NW, USA, Washington DC 20006, USA
- Investments
- High Yield
- Private Equity
- Real Estate
- Real Estate
- RiverRun Estates
- Cytonn Towers
- The Ridge
- Taraji Heights
- The Alma