Cytonn Monthly-August 2019
By Research Team, Sep 1, 2019
Executive Summary
Fixed Income
During the month of August, T-bill auctions recorded an oversubscription, with the overall rate coming in at 104.7%, compared to 134.8% recorded in the month of July. The subscription rates for the 91-day, 182-day, and 364-day came in at 126.8%, 45.8%, and 154.8%, respectively, lower than the 131.1%, 64.0%, and 207.0%, recorded in July, respectively. The yields on the 91-day declined by 0.2% points to 6.4%, from 6.6% previously, while the yield on the 182-day paper declined by 0.4% points to 7.0%, from 7.4% in July. The yield on the 364-day paper however rose by 0.2% points to 9.2%, from 9.0% in July. The y/y inflation for the month of August declined to 5.0%, from 6.3% recorded in July, mainly due to a 1.9% decline in the food and non-alcoholic drinks’ index and a 0.1% decline in the housing, water, electricity, gas and other fuels index;
Equities
During the month of August, the equities market was on a downward trend, with NASI, NSE 20 and NSE 25 declining by 0.5%, 6.1% and 1.7%, respectively, taking their YTD performance to gains/ (losses) of 5.1%, (12.9%) and (0.8%), respectively. During the month, listed banks in Kenya released their H1’2019 financial results, recording a core earnings per share increase of 9.1%, down from 19.0% in H1’2018;
Private Equity
During the month of August, there was increased activity in the private equity sectors we cover. In Financial Services, Oiko Credit acquired a 22.8% stake in Credit Bank for Kshs 1.0 bn. In Fundraising, Tala raised Kshs 11.4 bn (USD 110.0 mn) in a Series D financing round led by RPS Ventures, Juhudi Kilimo raised EUR 2.2 mn (Kshs 252.2 mn) in equity capital from Incofin CVSO, and TechAdvance raised USD 1.0 mn (Kshs 103.5) mn in equity funding from Lamar Holding;
Real Estate
During the month, three real estate sector reports were released, namely (i) PWC Hotel Outlook 2019-2023 Report, (ii) Broll Intel Kenya Office Market Snapshot H1’2019, and (iii) Kenya Bankers’ Association (KBA) Housing Price Index Q2’2019. Central Bank of Kenya gazetted the Mortgage Refinancing Regulations paving the way for operationalization of the Kenya Mortgage Refinancing Company. In the residential sector, Centum Real Estate broke ground on their Riverbank Apartments to be located within Two Rivers while Erdemann Properties launched Greatwall Gardens Phase III, in Athi River. In the hospitality sector, various projects were announced, including expansion of Diani Reef Beach Resort and Accor’s debut of their M Gallery hotel brand in Gigiri.
- Following the licensing of our regulated affiliate, Cytonn Asset Managers Limited, we are transitioning to an agency model and are looking for agents for our regional markets – Kisumu, Nakuru, Mt. Kenya, and Mombasa. If you have an existing financial services sales business and interested in being an agent in any of these regions, please email us at IFA@cytonn.com;
- Cytonn Money Market Fund closed the week at an average yield of 11.0% p.a. To subscribe, just dial *809#;
- Shiv Arora, Head - Private Equity Real Estate, was on KTN to discuss saving for retirement. Watch Shiv here
- Caleb Mugendi, Assistant Manager – Public Markets, was on CNBC to discuss the share prices of 17 Nairobi Securities Exchange (NSE) listed firms. Watch Caleb here.
- Phase 1 of The Alma is now 100% sold with early buyers having achieved over 55% capital appreciation. We are now running a promotion in Phase 2: Buy a unit in Phase 2 with a 15-year payment plan and 0% deposit. For inquiries, please email us on clientservices@cytonn.com. The site is open between 8 am - 5 pm, 7-days a week for site visits;
- For an exclusive tour of Cytonn’s real estate developments, visit: Sharp Investor’s Tour and for more information, email us at sales@cytonn.com;
- Following the completion and handover of Amara Ridge in Karen, we have now launched our next Karen project, dubbed Applewood, a Kshs 2.5 bn residential development located in Miotoni, Karen. This signature development shall comprise luxury homes, each sitting on 1/2 acre. We invite you to the exhibition of Applewood which is ongoing at the Amara Ridge Clubhouse (Location pin: https://goo.gl/maps/B3GVnu8pHyn) or at the Applewood Sales Centre on Miotoni Road (Location pin: https://goo.gl/maps/ZfABuGjFo1z) from 9:00 am to 5:00 pm daily. Call 0709 101 000 or email resales@cytonn.com to reserve a villa! See Video here;
- We continue to hold weekly workshops and site visits on how to build wealth through real estate investments. The weekly workshops and site visits target both investors looking to invest in real estate directly and those interested in high yield investment products to familiarize themselves with how we support our high yields. Watch progress videos and pictures of The Alma, Amara Ridge, and The Ridge;
- We continue to see very strong interest in our weekly Private Wealth Management Training (largely covering financial planning and structured products). The training is at no cost and is open only to pre-screened participants. We also continue to see institutions and investment groups interested in the training for their teams. Cytonn Foundation, under its financial literacy pillar, runs the Wealth Management Training. If interested in our Private Wealth Management Training for your employees or investment group, please get in touch with us through wmt@cytonn.com. To view the Wealth Management Training topics, click here;
- For recent news about the company, see our news section here;
- We have 10 investment-ready projects, offering attractive development and buyer targeted returns. See further details here: Summary of Investment-Ready Projects.
During the month of August, T-bill auctions recorded an oversubscription, with the overall rate coming in at 104.7%, compared to 134.8% recorded in the month of July. The subscription rates for the 91-day, 182-day, and 364-day came in at 126.8%, 45.8%, and 154.8%, respectively, lower than the 131.1%, 64.0%, and 207.0%, recorded in July, respectively. The yields on the 91-day declined by 0.2% points to 6.4%, from 6.6% previously, while the yield on the 182-day paper declined by 0.4% points to 7.0%, from 7.4% in July. The yield on the 364-day paper however rose by 0.2% points to 9.2%, from 9.0% in July. The T-bills acceptance rate came in at 86.3% during the month, compared to 95.6% recorded in July, with the government accepting a total of Kshs 86.7 bn of the Kshs 100.5 bn worth of bids received. The Central Bank of Kenya (‘CBK’) remained disciplined in rejecting expensive bids in order to ensure stability of interest rates.
During the week, T-bills were undersubscribed, with the subscription rate coming in at 78.4%, up from 71.6% the previous week. The undersubscription is partly attributable to tightened liquidity in the money market during the week. The yield on the 91-day and 182-day papers remained unchanged at 6.4% and 7.0%, while the yield on the 364-day paper rose by 14.4 bps to 9.4%. The acceptance rate rose to 95.1% from 89.2%, recorded the previous week, with the government accepting Kshs 17.9 bn of the Kshs 18.8 bn bids received.
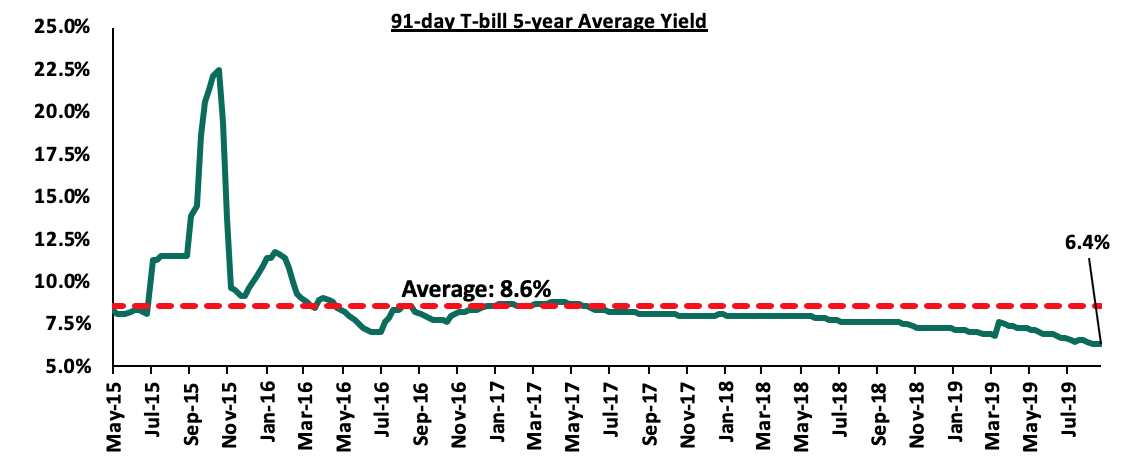
The 91-day T-bill is currently trading at a yield of 6.4%, which is below its 5-year average of 8.6%. The lower yield on the 91-day paper is mainly attributable to the low interest rate environment that has persisted since the passing of the law capping interest rates. We expect this to continue in the short-term given:
- The discipline of the CBK in stabilizing interest rates in the auction market by rejecting aggressive bids that are priced above market, for both T-bills and T-bonds, and,
- The maintaining of the Central Bank Rate (CBR) at 9.0% by the Monetary Policy Committee in their July 2019 meeting.
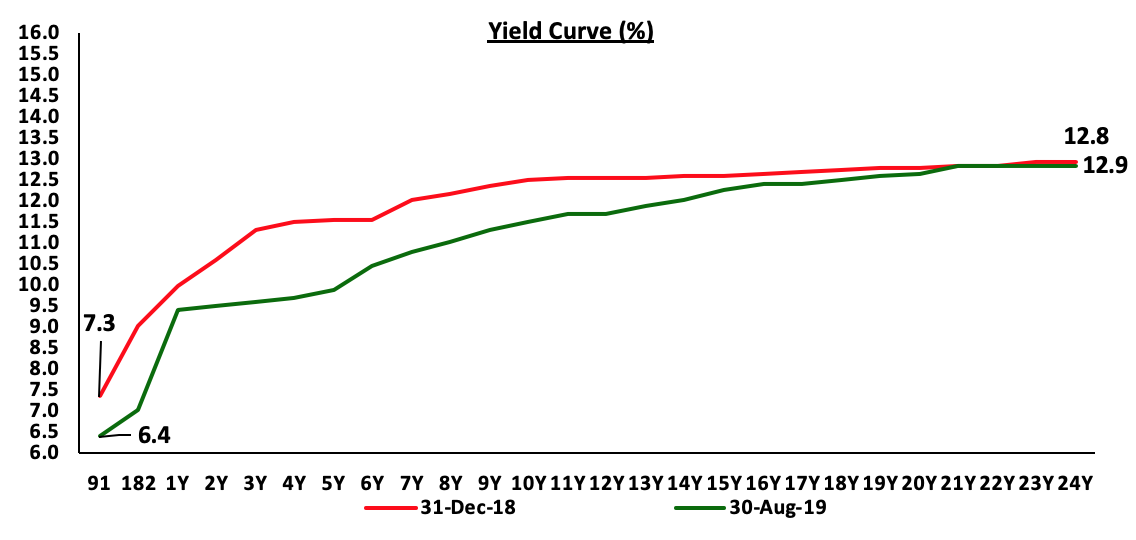
For the month of August, the Kenyan Government issued a 10-year bond (FXD 3/2019/10) and re-opened a 20-year bond (FXD 1/2019/20) to raise a total of Kshs 50.0 bn for budgetary support. The accepted yields for the issue came in at 11.6% and 12.7% for the (FXD 3/2019/10) and (FXD 1/2019/20), respectively, in line with our expectations as highlighted in last week’s bidding ranges of 11.5% - 11.7% and 12.6% - 12.8%, for the (FXD 3/2019/10) and (FXD 1/2019/20), respectively. The issue was oversubscribed with the subscription rate at 134.9%, having received Kshs 67.4 bn worth of bids against the advertised amount of Kshs 50.0 bn, with the market biased towards the 10-year bond that had bids amounting to Kshs 52.8 bn, mainly driven by the perception that risks may not be adequately priced on the longer end of the yield curve, which is relatively flat due to a narrowing spread between the short-term and long-term interest rates.
For the month of September, the Kenyan Government is set to re-open two 15-year bonds, (FXD 1/2018/15) and (FXD 2/2019/15) to raise a total of Kshs 50.0 bn for budgetary support. The government has issued the two medium-tenor bonds, in a bid to plug in the budget deficit, while at the same time trying to reduce the maturity risk profile of government debt. We expect the bonds to be oversubscribed as per recent trends, mainly driven by the perception that risks may not be adequately priced on the longer end of the yield curve, which is relatively flat due to saturation of long-term bonds, which has resulted in a lot of interest in the short-term and medium-term bonds. In the market, bonds with similar tenors are currently trading at yields of 11.9% and 12.0%, respectively. We expect bids for the (FXD 1/2018/15) and (FXD 2/2019/15) to come in at 11.9% - 12.1% and 12.0% - 12.2%, respectively.
In the money markets, 3-month bank placements remained unchanged, ending the week at 8.6% (based on what we have been offered by various banks). The 91-day T-bill was also unchanged, ending the week at 6.4%, while the average of Top 5 Money Market Funds came in at 10.0% compared to 9.5% last week, with the Cytonn Money Market Fund closing the week at 11.0%, unchanged from last week.
The table below is an extract showing the growth in Assets under Management (AUM) of money market funds of the fund managers who have released their H1’2019 results so far;
|
# |
Fund Managers |
H1'2018 Money Market Fund AUM (Kshs mn) |
FY'2018 Money Market Fund AUM(Kshs mn) |
H1'2019 Money Market Fund AUM(Kshs mn) |
Annualized H1'2019 AUM Growth |
|
1 |
Cytonn Money Market Fund |
19.7 |
62.8 |
306.9 |
777.8% |
|
2 |
Dry Associates |
619.8 |
894.3 |
1,318.3 |
94.8% |
|
3 |
Genghis Capital |
41.6 |
305.5 |
439.0 |
87.4% |
|
4 |
Nabo Capital |
214.5 |
237.7 |
296.1 |
49.2% |
|
5 |
Madison Asset Managers |
881.9 |
1,205.0 |
1,439.8 |
39.0% |
|
6 |
Commercial Bank of Africa |
4,238.3 |
4,946.9 |
5,837.0 |
36.0% |
|
7 |
CIC Asset Managers |
15,204.9 |
19,756.7 |
23,279.2 |
35.7% |
|
8 |
ICEA Lion |
5,253.8 |
5,916.3 |
6,438.6 |
17.7% |
|
9 |
British American Asset |
5,267.8 |
5,871.1 |
6,303.6 |
14.7% |
|
10 |
Zimele Asset Managers |
801.8 |
812.8 |
858.4 |
11.2% |
|
11 |
Apollo Asset Managers |
138.7 |
251.4 |
256.6 |
4.1% |
|
12 |
Old Mutual |
5,398.8 |
4,877.6 |
4,734.6 |
(5.9%) |
|
13 |
Sanlam Investments |
1,923.1 |
1,715.9 |
1,617.9 |
(11.4%) |
|
14 |
African Alliance Kenya |
246.9 |
261.5 |
231.9 |
(22.6%) |
|
15 |
Stanlib Kenya |
2,267.9 |
2,141.0 |
1,890.1 |
(23.4%) |
|
16 |
Amana Capital |
1,064.7 |
741.4 |
603.1 |
(37.3%) |
|
17 |
Equity Investment Bank |
868.1 |
644.5 |
480.3 |
(51.0%) |
|
18 |
Alpha Africa |
- |
0.0 |
30.5 |
- |
|
|
Total |
44,452.0 |
50,642.3 |
56,361.9 |
|
|
|
Weighted Average Growth |
28.2% |
|||
Secondary Bond Market:
The yields on government securities in the secondary market remained relatively stable during the month of August as the Central Bank of Kenya continued to reject expensive bids in the primary market. On an YTD basis, government securities on the secondary market have gained with yields declining across the board, which has in turn led to price appreciation.
Liquidity:
Liquidity in the money markets remained favourable during the month of August, despite the average interbank rate rising to 3.6%, from 2.3% in July, supported by government payments, which offset tax payments. During the week, the average interbank rate rose to 4.6%, from 3.4% recorded the previous week, pointing to declined liquidity in the money markets. The average interbank volumes declined by 19.1% to Kshs 11.8 bn, from Kshs 14.6 bn recorded the previous week.
Kenya Eurobonds:
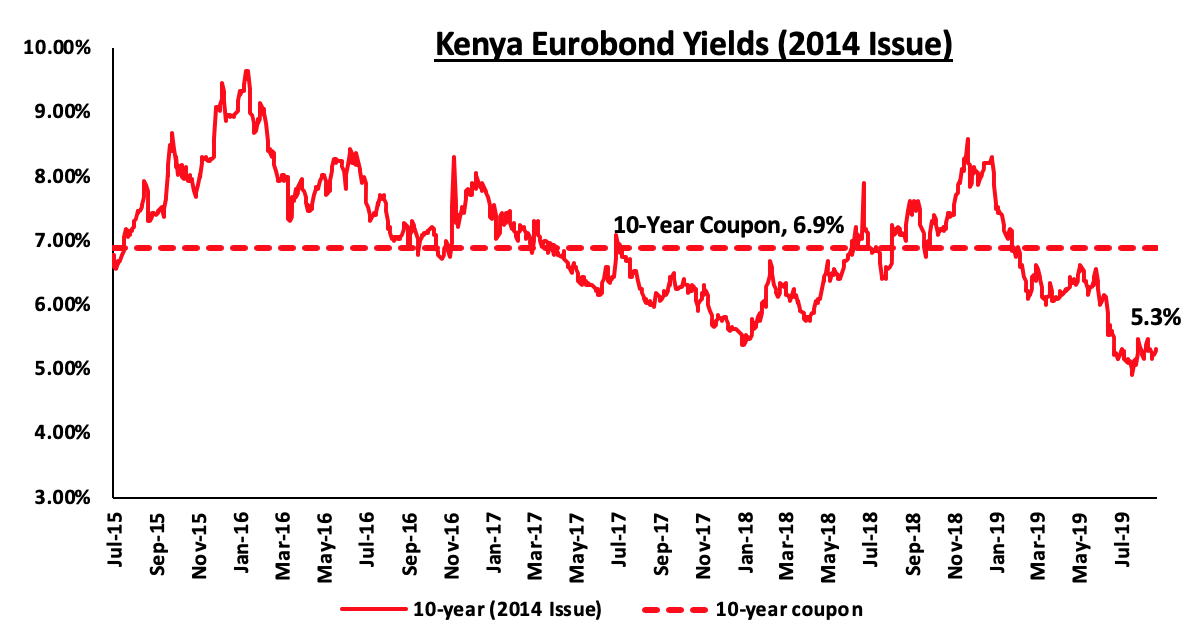
According to Reuters, the yield on the 10-year Eurobond issued in June 2014 increased by 0.2% points to 5.3% in August, from 5.1% in July 2019. During the week, the yield on the 10-year Eurobond increased by 0.1% points to 5.3%, from 5.2% the previous week.
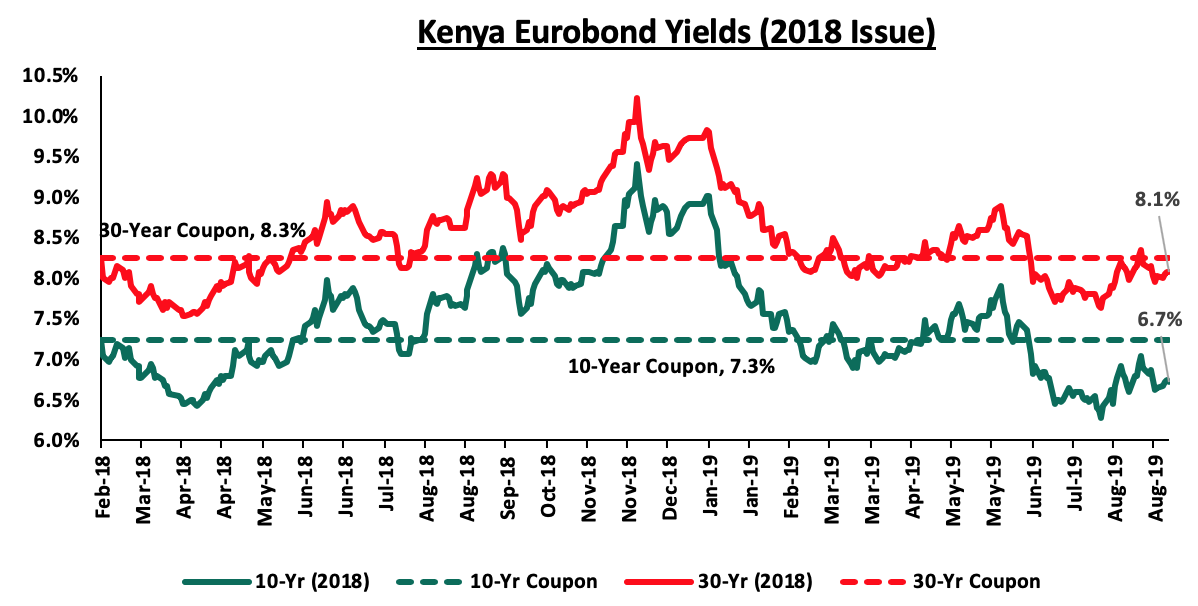
During the month, the yields on the 10-year and 30-year Eurobond issued in February 2018 rose by 0.2% points to close at 6.7% and 8.1% from 6.5% and 7.9% in July 2019, respectively. During the week, the yield on the 10-year Eurobond remained unchanged at 6.7%, while the yield on the 30-year Eurobond rose by 0.1% point to 8.1% from 8.0% recorded in the previous week.
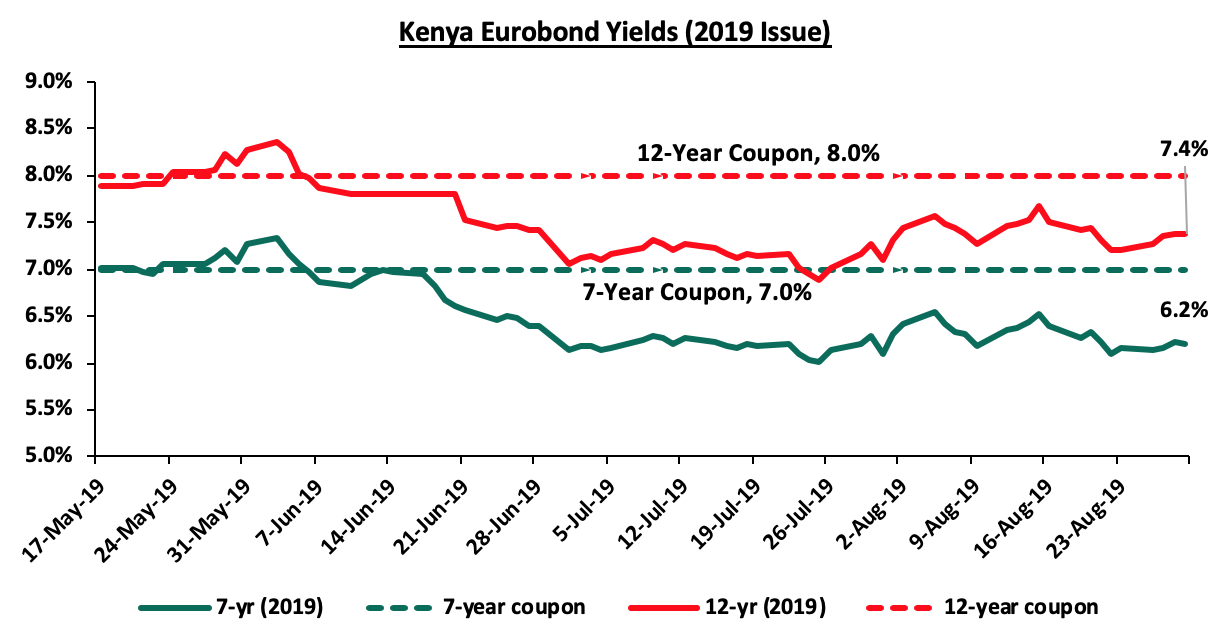
During the month, the yields on the newly issued dual-tranche Euro-bond with 7-years increased by 0.1% points while the 12-year Eurobond increased by 0.3% points to 7.4% from 7.1% recorded in July 2019. During the week, the yields on the 7-year Eurobond remained unchanged at 6.2%, while the 12-year Eurobond rose by 0.2% points to 7.4% from 7.2%, respectively.
Kenya Shilling:
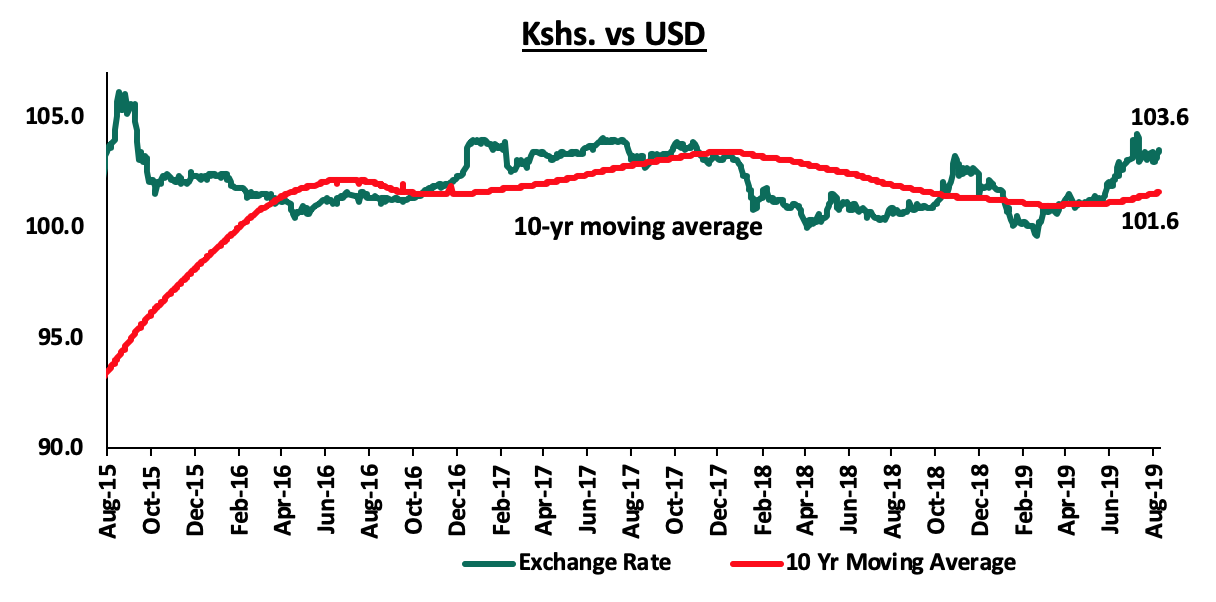
The Kenya Shilling appreciated by 0.5% against the US Dollar during the month of August, to Kshs 103.6 from Kshs 104.1 at the end of July, supported by inflows from diaspora remittances and portfolio investors buying government debt. During the week, the Kenya Shilling depreciated by 0.5% against the US Dollar to close at Kshs 103.6, from Kshs 103.1 in the previous week, driven by increased dollar demand from merchandise and oil importers buying dollars to meet their end-month obligations. On an YTD basis, the shilling has depreciated by 1.7% against the dollar, in comparison to the 1.3% appreciation in 2018. In our view, the shilling should remain relatively stable against the dollar in the short term, supported by:
- The narrowing of the current account deficit, with preliminary data indicating that the current account deficit narrowed to 4.2% of GDP in the 12-months to July 2019, from 5.0% recorded in December 2018. The decline has been attributed to the resilient performance of exports particularly horticulture and coffee, strong diaspora remittances, and higher receipts from tourism and transport services. Growth of imports also slowed mainly due to lower imports of food,
- Improving diaspora remittances, which have increased cumulatively by 13.6% in the 12-months to June 2019 to USD 2.8 bn, from USD 2.4 bn recorded in a similar period of review in 2018. The rise is due to:
- Increased uptake of financial products by the diaspora due to financial services firms, particularly banks, targeting the diaspora, and,
- New partnerships between international money remittance providers and local commercial banks making the process more convenient,
- CBK’s supportive activities in the money market, such as repurchase agreements and selling of dollars, and,
- High levels of forex reserves, currently at USD 9.3 bn (equivalent to 5.8-months of import cover), above the statutory requirement of maintaining at least 4.0-months of import cover, and the EAC region’s convergence criteria of 4.5-months of import cover.
Inflation:
|
Major Inflation Changes in the Month of August 2019 |
|||
|
Broad Commodity Group |
Price change m/m (August-19/July-19) |
Price change y/y (August-19/August-18) |
Reason |
|
Food & Non-Alcoholic Beverages |
(1.9%) |
7.1% |
The m/m rise decline was due to favourable weather conditions which led to lower prices for some commodities |
|
Transport Cost |
(0.03%) |
9.5% |
The m/m decline was mainly on account of the reduction in pump prices of diesel and petrol by 3.1%and 2.5%, respectively. |
|
Housing, Water, Electricity, Gas and other Fuels |
(0.1%) |
1.4% |
The m/m decline was mainly as a result of decrease in prices of some cooking fuels |
|
Overall Inflation |
(0.9%) |
5.0% |
The m/m decline was due to a 1.9% decline in the food index, which has a CPI weight of 36.0% |
The y/y inflation for the month of August declined to 5.0%, from 6.3% recorded in July, which was not in line with our projections of a decline to 5.7% - 6.1%, as we expected a 1.0% decline in the food & non-alcoholic beverages index and 0.6% rise in the housing, water, electricity, gas and other fuels index compared to the 1.9% and 0.1% declines recorded, respectively. Month-on-month inflation also declined by 0.9%, which was attributable to:
- A 1.9% decline in the food and non-alcoholic drinks’ index, due to a decrease in prices of significant food items including sukuma wiki (kales), potatoes, cabbages, carrots, tomatoes and maize grain loose which decreased by 8.0%, 7.8%, 6.8%, 6.0%, 4.9% and 2.8%, respectively,
- A 0.1% decline in the housing, water, electricity, gas and other fuels index, as a result of decrease in prices of some cooking fuels, and,
- A 0.03% decline in the transport index on account of the reduction in pump prices of diesel and petrol by 3.1% and 2.5%, respectively.
Monthly Highlights:
The National Treasury released the budgetary review for the 2018/2019 financial year. Below are the key take-outs:
|
(amounts in Kshs bns unless stated otherwise) |
|||||
|
FY’2018/2019 Budget Outturn |
|||||
|
Item |
FY'2017/2018 |
FY'2018/2019 |
|||
|
Collected/Spent |
Collected/Spent |
Target |
% of Target Met |
Change y/y |
|
|
Total Revenue |
1,522.4 |
1,671.1 |
1,794.3 |
93.1% |
9.8% |
|
External Grants |
26.5 |
19.7 |
34.7 |
56.7% |
-25.6% |
|
Total Revenue & External Grants |
1,548.9 |
1,690.8 |
1,829.0 |
92.4% |
9.2% |
|
Recurrent Expenditure |
1,349.7 |
1,496.2 |
1,574.1 |
95.1% |
10.9% |
|
Development Expenditure & Net Lending |
469.7 |
542.0 |
598.1 |
90.6% |
15.4% |
|
County Governments + Contingencies |
327.3 |
367.7 |
369.7 |
99.5% |
12.4% |
|
Total Expenditure |
2,146.7 |
2,405.9 |
2,541.9 |
94.7% |
12.1% |
|
Fiscal Deficit Excluding Grants |
(597.7) |
(715.2) |
(712.8) |
|
19.6% |
|
Deficit (excluding grants) as % of GDP |
7.0% |
7.5% |
7.5% |
|
|
|
Net Foreign Borrowing |
355.0 |
414.5 |
391.2 |
106.0% |
16.8% |
|
Net Domestic Borrowing |
273.7 |
303.7 |
255.4 |
118.9% |
10.9% |
|
Other Domestic Financing |
2.6 |
2.9 |
3.9 |
73.3% |
9.7% |
|
Total Borrowing |
631.3 |
721.1 |
650.5 |
110.8% |
14.2% |
|
GDP Estimate |
8,524.7 |
9,510.4 |
9,510.4 |
|
|
- Revenue Collection: Total revenue collected in FY’2018/2019 amounted to Kshs 1.7 tn, a 9.2% increase from Kshs 1.5 tn collected during the same period the previous year, meeting 93.1% of the budgetary target for the year of Kshs 1.8 tn. Ordinary revenue collection from taxes excluding Appropriation in Aid was at Kshs 1.5 tn, which is a 9.7% increase from Kshs 1.4 tn collected in FY’2017/2018, against a target of Kshs 1.6 tn, thus the Kenya Revenue Authority managed to meet 94.3% of the set target as per the budget, equivalent to 17.9% of GDP,
- Expenditure: Total expenditure amounted to Kshs 2.4 tn, a 12.1% increase from Kshs 2.1 tn recorded the same period last year. This was 94.7% of the Kshs 2.5 tn target, with a significant share of the expenditure being on recurrent expenditure, which accounted for 62.2% of total expenditure, a slight decline from 62.9% in FY’2017/2018. Development expenditure only accounted for 22.5%. Total expenditure was, however, 6.3% lower than the targeted expenditure as per the budget, an indication that the austerity measures undertaken by the government were taking effect. The lower expenditure was mainly attributed to lower expenditure recorded in operation and maintenance, pension and wages and salaries expenditures, which came in at Kshs 590.9 bn, Kshs 70.8 bn, and Kshs 417.5 bn, respectively, against target expenditures of Kshs 647.4 bn, Kshs 84.8 and Kshs 428.0 bn, respectively.
For a more comprehensive analysis, see our FY'2018/2019 Budget Outturn Note
Rates in the fixed income market have remained relatively stable as the government rejects expensive bids. A budget deficit is likely to result from depressed revenue collection with the revenue target for FY’2019/2020 at Kshs 2.1 tn, creating uncertainty in the interest rate environment as additional borrowing from the domestic market goes to plug the deficit. Despite this, we do not expect upward pressure on interest rates due to increased demand for government securities, driven by improved liquidity in the market owing to the relatively high debt maturities. Our view is that investors should be biased towards medium-term fixed income instruments to reduce duration risk associated with long-term debt, coupled with the relatively flat yield curve on the long-end due to saturation of long-term bonds.
Market Performance
During the month of August, the equities market was on a downward trend, with NASI, NSE 20 and NSE 25 declining by 0.5%, 6.1% and 1.7%, respectively, taking their YTD performance to gains/(losses) of 5.1%, (12.9%) and (0.8%), respectively. The decline recorded in NASI was driven by declines in large cap stocks such as Bamburi, Co-operative Bank, NIC Group, and EABL, which recorded declines of 8.6%, 4.6%, 3.9% and 2.5%, respectively. For this week, markets also recorded a declining performance, with NASI, NSE 20 and NSE 25 declining by 1.5%, 0.4% and 1.0%, respectively. The decline in the NASI was largely due to declines recorded in large cap counters such as Safaricom, Diamond Trust Bank Kenya, EABL and Bamburi, which recorded declines of 2.6%, 2.5%, 2.0% and 1.7%, respectively.
Equities turnover declined by 26.5% during the month to USD 79.7 mn, from USD 108.3 mn in July 2019. Foreign investors turned net buyers for the month, with a net buying position of USD 13.1 mn, from July’s net selling position of USD 20.6 mn.
For this week, equities turnover declined by 54.6% to USD 13.4 mn, from USD 29.5 mn the previous week, bringing the year to date (YTD) turnover to USD 958.8 mn. Foreign investors remained net buyers for the week, with a net buying position of USD 3.3 mn, a 71.9% decline from last week’s net buying position of USD 11.6 mn.
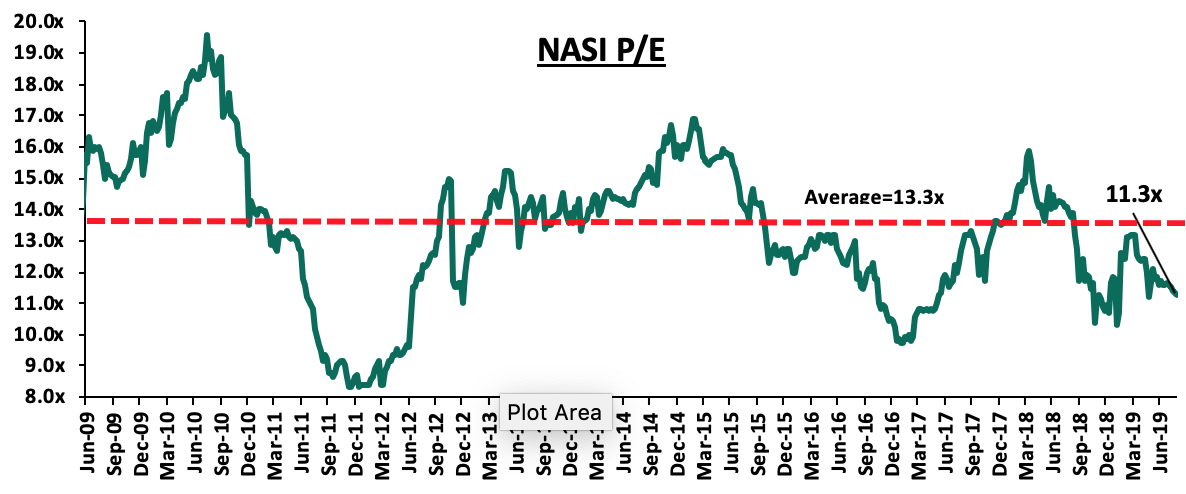
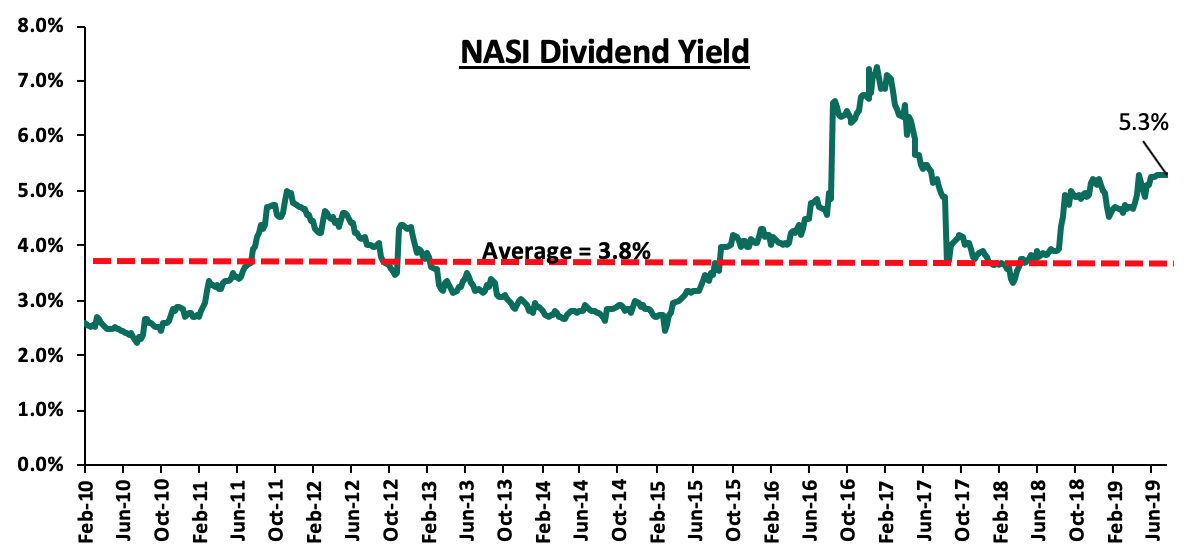
The market is currently trading at a price to earnings ratio (P/E) of 11.3x, 15.0% below the historical average of 13.3x, and a dividend yield of 5.3%, 1.5% points above the historical average of 3.8%. With the market trading at valuations below the historical average, we believe there is value in the market. The current P/E valuation of 11.3x is 16.5% above the most recent trough valuation of 9.7x experienced in the first week of February 2017, and 36.1% above the previous trough valuation of 8.3x experienced in December 2011. The charts below indicate the historical P/E and dividend yields of the market.
Earnings Releases
During the week, Barclays Bank Kenya released their H1’2019 financial results
Barclays Bank Kenya released their H1’2019 financial results with core earnings per share increasing by 18.0% to Kshs 0.8, from Kshs 0.69 in H1’2018, faster than our expectation of a 6.9% increase to Kshs 0.71. The performance was driven by the 4.2% growth in total operating income to Kshs 16.3 bn, from Kshs 15.7 bn in H1’2018, coupled with the 3.2% decline in total operating expenses to Kshs 10.1 bn, from Kshs 10.4 bn in H1’2018.
For more information, please see our Barclays Bank of Kenya H1’2019 Earnings Note
During the week, I&M Holdings released their H1’2019 financial results:
I&M Holdings released their H1’2019 results, registering a core earnings per share growth of 17.0% to Kshs 11.0, from Kshs 9.4 in H1’2018. Performance was driven by a 9.1% increase in operating income to Kshs 11.6 bn from Kshs 10.6 bn in H1’2018, which outpaced the marginal increase in operating expenses by 0.9% to Kshs 5.74 bn, from Kshs 5.69 bn recorded in H1’2018.
For more information, please see our I&M Holdings H1’2019 Earnings Note
During the week, Standard Chartered Bank Kenya released their H1’2019 financial results
Standard Chartered Bank Kenya released their H1’2019 financial results, with core earnings per share increasing by 5.4% to Kshs 13.7, from Kshs 13.0 in H1’2018. The performance was driven by a 5.6% decline in total operating expenses, which offset the 0.7% decline in total operating income.
For more information, see our SCBK H1’2019 Earnings Note
During the week, National Bank of Kenya released their H1’2019 financial results
National Bank of Kenya released their financial results with core earnings per share declining by 40.1% to Kshs. 0.4 from Kshs. 0.7 in H1’2018. However, this was after stripping out the exceptional items expense of Kshs 0.5 bn in H1’2018. Performance was driven by a 6.0% increase in total operating income, and was weighed down by the 5.8% increase in the total operating expenses.
For more information please see our National Bank of Kenya H1’2019 Earnings Note
During the week, HF Group released their H1’2019 financial results
HF Group released their H1’2019 financial results, recording a loss per share of Kshs 0.3 in H1’2019, from a core earnings per share of Kshs 0.02 recorded in H1’2018. The performance was driven by a 0.6% increase in total operating income, which was offset by a 6.2% increase in total operating expenses.
For more information, see our HF Group H1’2019 Earnings Note
During the month, Stanbic Holdings released its H1’2019 financial results
Stanbic Holdings released their H1’2019 financial results, recording a 14.4% increase in core earnings per share to Kshs 10.3, from Kshs 9.0 in H1’2018.
For more information, see our Stanbic Holdings H1’2019 Earnings Note
Diamond Trust Bank H1’2019 results
Diamond Trust Bank released their H1’2019 financial results, recording an 11.0% growth in core earnings per share to Kshs 13.9, from Kshs 12.5 in H1’2018. For more information, please see our Diamond Trust Bank Kenya H1’2019 Earnings Note
During the month, Equity Group released its H1’2019 financial results:
Equity Group Holdings released their H1’2019 financial results, recording a 9.1% increase in core earnings per share to Kshs 3.2, from Kshs 2.6 in H1’2018.
For more information, see out Equity Group H1’2019 Earnings Note
During the month, NIC Group released their H1’2019 financial results:
NIC Group released their H1’2019 financial results, recording an 8.6% growth in core earnings per share to Kshs 3.1, from Kshs 2.8 in H1’2018.
For more information, see our NIC Group H1’2019 Earnings Note
During the month, KCB Group released their H1’2019 financial results
KCB Group released their H1’2019 financial results, recording a 5.0% increase in core earnings per share to Kshs 4.1, from Kshs 4.0 in H1’2018, in line with our expectations.
For more information, see our KCB Group H1’2019 Earnings Note
During the month, Co-operative Bank Kenya released their H1’2019 financial results
Co-operative Bank released their H1’2019 financial results, recording a 4.6% growth in core earnings per share to Kshs 1.1, from Kshs 1.0 in H1’2018.
For more information, see our Co-operative Bank H1’2019 Earnings Note
A summary of the performance is highlighted in the table below:
|
Bank |
Core EPS Growth |
Interest Income Growth |
Interest Expense Growth |
Net Interest Income Growth |
Net Interest Margin |
Non-Funded Income Growth |
NFI to Total Operating Income |
Growth in Total Fees & Commissions |
Deposit Growth |
Growth in Government Securities |
Loan to Deposit Ratio |
Loan Growth |
Return on Average Equity |
|
|
HF Group |
N/A |
(15.6%) |
(9.8%) |
(23.5%) |
4.0% |
55.8% |
47.1% |
44.4% |
(6.6%) |
5.4% |
91.0% |
(14.8%) |
(6.5%) |
|
|
Barclays Bank |
18.0% |
7.4% |
30.8% |
0.6% |
8.4% |
12.6% |
32.4% |
11.1% |
5.9% |
15.4% |
81.3% |
6.0% |
18.1% |
|
|
I&M |
17.0% |
8.8% |
18.3% |
2.2% |
6.1% |
21.9% |
39.3% |
6.0% |
12.5% |
28.5% |
72.6% |
5.7% |
17.9% |
|
|
Stanbic |
14.4% |
10.5% |
5.2% |
19.5% |
5.1% |
10.1% |
47.8% |
53.2% |
10.3% |
8.1% |
74.4% |
15.0% |
15.3% |
|
|
DTBK |
11.0% |
(6.6%) |
(5.5%) |
(7.5%) |
5.8% |
8.5% |
24.5% |
(15.6%) |
0.5% |
14.4% |
67.4% |
(3.8%) |
13.9% |
|
|
Equity Group |
9.1% |
9.2% |
14.3% |
7.6% |
8.5% |
25.6% |
44.0% |
16.1% |
16.5% |
13.0% |
70.0% |
16.7% |
22.1% |
|
|
NIC Group |
8.6% |
0.9% |
(7.0%) |
7.7% |
6.0% |
23.9% |
32.5% |
29.3% |
3.5% |
8.1% |
77.8% |
3.1% |
12.0% |
|
|
SCBK |
5.4% |
(7.3%) |
(26.0%) |
0.0% |
7.6% |
(2.2%) |
32.4% |
(12.8%) |
(1.0%) |
(15.2%) |
52.5% |
7.4% |
18.2% |
|
|
KCB Group |
5.0% |
4.3% |
1.6% |
5.2% |
8.2% |
14.7% |
34.1% |
3.5% |
7.3% |
20.3% |
85.0% |
13.6% |
22.7% |
|
|
Co-operative |
4.6% |
(1.7%) |
3.5% |
(3.8%) |
8.4% |
25.1% |
38.0% |
38.1% |
9.0% |
14.2% |
79.6% |
2.6% |
18.8% |
|
|
NBK |
(40.1%) |
7.3% |
(14.4%) |
20.0% |
8.2% |
(28.7%) |
19.4% |
(4.6%) |
(4.9%) |
(17.5%) |
51.8% |
(1.0%) |
6.7% |
|
|
H1'2019 Mkt Weighted Average* |
9.1% |
3.8% |
5.4% |
3.8% |
7.4% |
16.7% |
37.3% |
13.0% |
8.7% |
12.3% |
73.8% |
9.7% |
19.3% |
|
|
H1'2018 Mkt Weighted Average** |
19.0% |
7.9% |
12.0% |
6.4% |
8.1% |
6.9% |
34.3% |
4.6% |
10.0% |
14.9% |
73.8% |
3.8% |
19.5% |
|
|
*Market cap weighted as at 30/06/2019 |
||||||||||||||
|
**Market cap weighted as at 31/08/2018 |
||||||||||||||
Key takeaways from the table above include:
- All listed Kenyan banks have released their financial results, recording a weighted average increase of 9.1% in core Earnings per Share (EPS), compared to an increase of 19.0% in H1’2018. The Return on Average Equity (RoAE) thus declined to 19.3%, from 19.5% in H1’2018,
- The sector has recorded a weaker deposit growth, which came in at 8.7%, slower than the 10.0% growth recorded in H1’2018. Interest expenses thus rose slower by 5.4%, compared to 12.0% in H1’2018, indicating banks have been able to mobilize relatively cheaper deposits. In addition, the removal of the 70.0% minimum deposit payable on deposits in the Finance Act 2018 reduced the cost of deposit funding,
- Average loan growth came in at 9.7%, which was faster than the 3.8% recorded in H1’2018, indicating that there was an improvement in credit extension to the economy. Government securities on the other hand recorded a growth of 12.3% y/y, which was faster compared to the loans, but a decline from the 14.9% recorded in H1’2018. This highlights that banks are beginning to adjust their business models back to private sector lending as opposed to investing in government securities, as the yields on government securities declined during the year. Interest income increased by 3.8%, slower than the 7.9% increase recorded in H1’2018. Consequently, the Net Interest Income (NII) grew by 3.8% compared to a growth of 6.4% in H1’2018,
- The average Net Interest Margin in the banking sector currently stands at 7.4%, down from the 8.1% recorded in H1’2018, despite the Net Interest Income increasing by 3.8% y/y. The decline was mainly due to the decline in yields recorded in government securities, coupled with the decline in yields on loans due to the 100 bps decline in the Central Bank Rate (CBR), and,
- Non-Funded Income grew by 16.7% y/y, faster than the 6.9% recorded in H1’2018. The growth in NFI was boosted by the total fee and commission income which improved by 13.0%, compared to the 4.6% growth recorded in H1’2018, owing to the faster loan growth.
Monthly Highlights
During the week, KCB Group revised its final offer to take over 7.5% of the deposits and loans held by Imperial Bank Limited Under Receivership (IBLR) as at the end of July 2019, after the bank conducted extensive due diligence on IBLR. With approximately Kshs 53.0 bn outstanding deposits, this translates to a final payout of approximately Kshs 3.975 bn, bringing the final recovery rate to approximately 38.0%. KCB Group’s management highlighted the payout would be derived from the bank’s loan assets, valued at ‘less than Kshs 5.0 bn’, which excludes 50.0% of the loans that are under litigation. The transaction has seen 92.0% depositors who held deposits in IBLR gain access to their deposits. We thus continue to maintain our view that a resolution of the matter would mark the second instance a bank is successfully brought out of receivership, thereby providing more confidence in the Kenyan financial services space regulation, which provides an avenue for remediation of collapsed entities as well as providing protection for depositors’ funds.
The Institute of Certified Public Accountants of Kenya (ICPAK) issued a proposal to the National Assembly Finance Committee during public hearings on the Finance Bill pushing for a two-year extension of the rate cap law arguing that its full benefits are yet to be realized. The ICPAK public tax committee chairman, Mr. Phillip Mwema, noted that the rate cap law had instilled discipline among borrowers, without affecting the operations of banks and the banking industry at large, which continues to be profitable. For more information, see here
The Finance and National Planning Committee voted to halt the planned acquisition of National Bank of Kenya (NBK) by KCB Group, on grounds that the offer undervalues the lender. The report of the committee, which was tabled in the National Assembly will, however, require the approval of the National Assembly. As an alternative, the committee recommended that NBK's principal shareholders - the National Social Security Fund (NSSF) and the National Treasury, who hold 48.1% and 22.5% of the ordinary shares of NBK, respectively, reject KCB's offer to acquire 100.0% shareholding. For more information see here. However, with the high court failing to stop the acquisition, 77.6% of NBK shareholders have accepted KCB’s offer, surpassing the 75.0% threshold required to term the transaction as successful. This will then see NBK’s shares suspended from trading from 2nd September 2019.
Universe of Coverage
Bank Models currently under review following the release of the H1’2019 financial results.
We are “Positive” on equities for investors as the sustained price declines has seen the market P/E decline to below its historical average. We expect increased market activity, and possibly increased inflows from foreign investors, as they take advantage of the attractive valuations, to support the positive performance.
During the month of August, there was increased activity in the Financial Services sector and FinTech sector. There was also activity in Fundraising and a private equity report released:
Financial Services
Oiko Credit, a Netherland’s based private equity firm, has acquired a 22.8% stake in Credit Bank. The stake acquired was through a capital injection of Kshs 1.0 bn. As at Credit Bank’s last reporting in Q1’2019, the bank had a book value of Kshs 3.0 bn. As such, the transaction was carried out at a price-to-book value (P/Bv) of 1.5x, which is a 7.1% premium to the average P/Bv of 1.4x of bank transactions in Kenya for the last 5-years as shown in the table below;
|
Acquirer |
Bank Acquired |
Book Value at Acquisition (Kshs bn) |
Transaction Stake |
Transaction Value (Kshs bn) |
P/Bv Multiple |
Date |
|
Oiko Credit |
Credit Bank |
3 |
22.8% |
1 |
1.5x |
29-Aug |
|
KCB Group |
National Bank of Kenya |
7 |
100.0% |
6.6 |
0.9x |
19-Apr* |
|
CBA Group |
Jamii Bora Bank |
3.4 |
100.0% |
1.4 |
0.4x |
19-Jan* |
|
AfricInvest Azure |
Prime Bank |
21.2 |
24.2% |
5.1 |
1.0x |
19-Jan |
|
CBA Group |
NIC Group |
33.5** |
53:47*** |
Undisclosed |
N/A |
19-Jan* |
|
KCB Group |
Imperial Bank |
Unknown |
Undisclosed |
Undisclosed |
N/A |
18-Dec |
|
SBM Bank Kenya |
Chase Bank ltd |
Unknown |
75.0% |
Undisclosed |
N/A |
18-Aug |
|
DTBK |
Habib Bank Kenya |
2.4 |
100.0% |
1.8 |
0.8x |
17-Mar |
|
SBM Holdings |
Fidelity Commercial Bank |
1.8 |
100.0% |
2.8 |
1.6x |
16-Nov |
|
M Bank |
Oriental Commercial Bank |
1.8 |
51.0% |
1.3 |
1.4x |
16-Jun |
|
I&M Holdings |
Giro Commercial Bank |
3 |
100.0% |
5 |
1.7x |
16-Jun |
|
Mwalimu SACCO |
Equatorial Commercial Bank |
1.2 |
75.0% |
2.6 |
2.3x |
15-Mar |
|
Centum |
K-Rep Bank |
2.1 |
66.0% |
2.5 |
1.8x |
14-Jul |
|
GT Bank |
Fina Bank Group |
3.9 |
70.0% |
8.6 |
3.2x |
13-Nov |
|
Average |
|
|
73.7% |
|
1.4x |
|
|
* Announcement date ** Book Value as of the announcement date *** Shareholder swap ratio between CBA and NIC, respectively |
||||||
The capital raised is intended to grow Credit Banks’ loan book, which stood at Kshs 14.2 bn as at Q1’2019, a 35.0% growth from Kshs 10.5 bn in Q1’2019, with the funds to be channeled towards lending to SMEs. Last year, Credit Bank approved the increase of its share capital from Kshs 5.0 bn to Kshs 7.0 bn. The company has been looking to raise Kshs 2.0 bn through a rights issue and has already raised Kshs 1.2 bn through private placements.
We expect consolidation in Kenya’s banking sector to continue as banks merge to form strategic partnerships, and struggling banks especially those that do not serve a niche, are acquired. This is an important and compelling trend given that the Kenyan banking sector is overbanked, relative to other markets. This will lead to a more stable and safer banking sector.
FinTech
Juhudi Kilimo, a Kenyan based microfinance institution, raised EUR 2.2 mn (Kshs 252.2 mn) in equity capital from Incofin CVSO, a fund managed by Belgian based Incofin Investment Management, for an undisclosed stake. This will be Incofin’s first equity investment in the country, adding to its expansive portfolio, which includes over 325 investments in 65 countries, with a combined value of over USD 1.0 bn, focused on growing the financial services industry in developing countries. For more information, please see our Cytonn Weekly #33/2019.
TechAdvance, a Nigerian based payment application development company, raised USD 1.0 mn (Kshs 103.5) mn in equity funding from Lamar Holding, an energy investment company based in Bahrain. TechAdvance will use this funding to support its expansion strategy, aimed at widening its coverage in Africa as well as reaching out to other markets globally, having gotten approval from the Central Bank of Bahrain to operate a payment solutions service business, in addition to a similar license from the Central Bank of Nigeria, indicating that the firm intends to leverage the partnership with Lamar Holdings to cross into the Middle Eastern market. For more information, please see our Cytonn Weekly #33/2019.
Fundraising
Tala, a California-based FinTech company with operations in Kenya, raised Kshs 11.4 bn (USD 110.0 mn) in a Series D financing round (the fourth round of capital injection from external investors) led by RPS Ventures, a California-based venture capital firm. Other investor in the round include GGV Capital, and previous investors IVP (Institutional Venture Partners), Revolution Growth, Lowercase Capital, Data Collective VC, ThomVest Ventures and PayPal Ventures. The new investment builds on PayPal Ventures’ strategic investment in Tala, announced in November 2018. This funding round brings the total amounts raised by Tala to over Kshs 22.6 bn (USD 219.4 mn). For more information, please see our Cytonn Weekly #34/2019.
Reports
KPMG East Africa and East Africa Venture Capital Association (EAVCA) released a joint report, Private Equity Sector Survey of East Africa, which looks into the private equity market over the period spanning 2017 and 2018, with a keen focus on the shift in trends in the private equity space since 2016. The report highlighted an improvement in deal activity in 2017 and 2018, with 33 and 51 deals disclosed, respectively, as well as the number of PE funds investing in East Africa increased to 97 up from 72 recorded in a similar study conducted between 2015 and 2016. For more information, please see our Cytonn Weekly #32/2019.
Private equity investments in Africa remain robust as evidenced by the increasing investor interest, which is attributed to; (i) rapid urbanization, a resilient and adapting middle class and increased consumerism, (ii) the attractive valuations in Sub Saharan Africa’s private markets compared to its public markets, (iii) the attractive valuations in Sub Saharan Africa’s markets compared to global markets, and (iv) better economic projections in Sub Sahara Africa compared to global markets. We remain bullish on PE as an asset class in Sub-Sahara Africa. Going forward, the increasing investor interest and stable macro-economic environment will continue to boost deal flow into African markets.
A. Industry Reports
During the week, PWC released the Hotels Outlook 2019-2023 Report. The outlook provides an overview of the hotel industry in Kenya, South Africa, Mauritius, Nigeria, Tanzania, and Namibia. As per the report, Kenya’s hospitality sector is expected to remain vibrant supported by growth in international tourist arrivals and positive economic growth, with security expected to hinder growth. Key take outs from the report for Kenya were:
- Tourist arrivals grew by 37.7% to 2.0 mn in 2018 from 1.5 mn in 2017. This is expected to drop by 13.6% to 1.8 mn in 2019, especially due to security scares following the Dusit D2 attack in early 2019, growing gradually by a 4-year CAGR of 1.3% to proximately 2.2 mn by 2023,
- Available rooms increased by 5.2% to 20,100 in 2018 from 19,100 in 2017, the largest growth in the last 5 years. This was as a result of new hotel openings such as City Lodge, Hilton Hotels, and Mövenpick. Additionally, 3,700 rooms are expected to come into the market from the hotel pipeline that includes hotel brands such as Pullman, Radisson, Novotel, Protea, Hyatt, among others,
- Average hotel occupancy rate was at 53.2% in 2018, 5.9% points increase from 47.3% in 2017. However, Average Daily Rate (ADR) came in at USD 131, a 3.0% drop from USD 135 in 2017 attributable to a decline in room rates. In 2019, ADR is expected to grow by 3.8% to USD 136 and a 4-year CAGR of 4.0% to USD 159 by 2023,
- Hotel room revenue is expected to decline marginally by 1.6% to USD 5.0 mn in 2019 from USD 5.1 mn in 2018, which in our view could be due to expected fall in guest nights owing to a precarious security situation.
The 2018 hotel performance was attributable to: (i) economic growth and security, which led to a drop in travel advisories making Kenya a desirable destination, (ii) increased air connectivity as new flight routes were introduced and expansion of airline capacities, which has made domestic flying relatively affordable, and (iii) the Magical Kenya promotional campaign, which increased Kenya’s attractiveness especially to audiences such as United States, Europe, India, and China. However, Kenya’s low ranking with respect to safety and security and insufficient tourist service infrastructure are expected to continue hindering the sector’s performance.
During the week, Broll Property released the Kenya Office Market Snapshot H1’2019. Key take outs from the report were as follows:
- Riverside and Lavington registered the highest annual rental growth for Grade A offices with 1.9% and 2.2%, respectively. However, average rental rates across the sector remained largely flat attributable to surplus office stock,
- Among the areas covered by the report, (Westlands, Upperhill, Kilimani, Riverside, Parklands, Karen, Lavington and Gigiri) had the largest office space market share with 623,141 SQM, followed by Upperhill with 453,006 SQM, translating to 36.5% and 26.5% of total office stock, respectively,
- Westlands had the largest market share of Grade A space with 485,712 SQM, translating to 77.9% of office space in the node. This was followed by Kilimani and Upperhill with 115,837 SQM and 100,007 SQM, respectively,
- Grade A offices registered the highest y/y growth in occupancies of 17.0% points to an average of 83.0% in H1’2019 from 65.0% in H1’2018 while Grade B offices registered an increase of 8.0% points to 88% from 80%. The growth in tenancy is attributed to innovative occupational terms such as revenue-share rent approach, progressive escalation rates instead of the usual fixed rates, and acceptance of security deposits in form of bank guarantees as opposed to the traditional cash deposits,
- Office sales remained subdued as clients prefer the flexibility offered by leasing. However, selling prices range between Kshs 1,000 and 1,500 per SQFT, and,
- Overall, the report outlook for the sector is largely positive with the relatively high FDI inflows, demand for high quality office stock and innovative products set to boost its performance.
This is in line with our Office Market Review H1’2019, according to which rental rates remained either stagnant or dropped slightly in select markets owing to the huge oversupply in the market of 5.2 mn SQFT. We expect the sector’s performance to stabilize as developers scale back on more supply, with the sector’s performance expected to be cushioned by increased foreign direct investment and growth of differentiated concepts such as serviced offices and mixed-use developments.
During the month, Kenya Bankers’ Association also released their Housing Price Index Q2'2019. Key take outs from the report were:
- Apartments continued to dominate the housing market, an indication of the predominance of the mid-income earning population. As per the report, in Q2’2019 apartments accounted for 81.2% of total market uptake while maisonettes and bungalows accounted for 12.9% and 5.9%, respectively, in comparison to 62.6%, 23.4% and 14.0%, respectively, in Q1’2019 attributed to apartments’ affordability. The increased supply of apartments was attributed to developers continued focus on optimization of returns through land maximization,
- Overall, the residential market prices slightly stabilized during the quarter declining marginally by 1.7% compared to a 2.8% decline in Q1’ 2019. The continued slowdown in prices is attributable to a weak household income, which continues to keep demand for housing tight, in addition to the slow private sector credit growth during the first half of the year. For our comparative analysis, please see Cytonn Weekly #33/2019
B. Residential Sector
- Central Bank of Kenya (CBK) gazetted regulations aimed at guiding operations of Mortgage Refinancing Companies (MRCs) in Kenya. As per the regulations, shareholders, with the exception of public entities and multilateral development banks, are limited to maximum ownership of 25.0%. To protect the facility from a decline in the value of the collateral, which might be brought about by market fluctuations, Mortgage Refinancing Companies are required by the CBK Act to address this by over-collateralization of refinancing loans by 120.0% of the level of advances, which translates to a Loan to Value of about 83.3%. For capital requirements, minimum core capital of Mortgage Refinancing Companies (MRCs) is set at Kshs 1.0 bn, which is the same level as that of commercial banks marking a great milestone for Kenya’s undeveloped secondary mortgage market. For analysis, please see Cytonn Weekly #34/2019
- Centum Real Estate broke ground on its Riverbank Apartments Project, consisting of 160-units, within the Two Rivers development complex, along Limuru Road, with completion planned to take 24 months. The project will comprise of one, two, and three-bedroom units with plinth areas of 89 SQM, 130 SQM and 195 SQM, respectively, selling at an average price per SQM of Kshs 172,746 (Kshs 16.0 mn, Kshs 24.0 mn, and Kshs 30.0 mn for one, two, and three-bedroom units, respectively), in comparison to the market average for Ruaka and Ridgeways at Kshs 98,098 and Kshs 99,270, respectively. For analysis, please see Cytonn Weekly #32/2019
- Erdemann Properties launched Phase III of their Greatwall Gardens Project in Athi River. The affordable housing project is set to have 288, 104 SQM three-bedroom units selling at an off-plan price of Kshs 2.9 mn, translating to a price per SQM of Kshs 27,885. Based on monthly rental rates of Greatwall Gardens I for three-bedroom units, at Kshs. 265 per SQM (Kshs 27,000 per three-bedroom unit) investors stand to gain rental yields of 11.2% at full occupancy, in comparison to the Athi River apartments’ average of 5.0%. For analysis, please see Cytonn Weekly #32/2019
We expect to continue to witness development activity across the sector with developers in the upper-end markets targeting niches that are underserved, and others shifting focus to the low-end markets in a bid to address the housing shortage and capitalize on government incentives for affordable housing developers.
C. Retail Sector
Amidst a softening retail sector performance, things continue to look up for malls as multinational retailers continue to set up shop in Kenya. During the month, Shoprite opened its third store in City Mall Nyali, Mombasa, marking its fourth store in the country since its debut in 2018. The South Africa-based retailer who has been targeting spaces vacated by Nakumatt has branches in Westgate and Garden City Malls in Nairobi. The sector has seen swift expansion drives by international retailers, reaffirming Kenya’s attractiveness to foreign investors, which is a factor of: (i) stable economic growth, and (ii) relatively low formal penetration at 35.0% despite a growing middle class, and thus, disposable incomes. International retailers such as Shoprite and Carrefour have also been quick to tap into prime spaces vacated by the cash-strapped Nakumatt, which was previously the anchor tenant to majority of the malls in Kenya.
For developers and property managers, the entry of strong anchor tenants is an added advantage as it drives footfall into a mall, and this, in turn, attracts other retailers. In our view, therefore, this will have a positive impact on the performance of retail real estate developments, where we currently estimate an oversupply of 2.0 mn SQFT.
We expect to see continued expansion of international retailers within Kenya especially with the improved ranking in World Bank’s Ease of Doing Business, as well as growing demand for formal retail spaces outside Nairobi, due to improved standards of living.
D. Hospitality Sector
- Global hospitality group Accor announced plans to open its first M Gallery Hotel Chain Collection in Gigiri, Nairobi, set to be opened by Q1’2021. The 105-keys hotel in partnership with Jit Group (a local investment firm in commercial sectors across East Africa) will grow Accor’s footprint in Nairobi to five properties, with three located within Nairobi. The new addition in Gigiri is an indicator of the node’s attractiveness for hospitality largely attributable to the relatively high population of expatriates creating demand for hospitality services, and the fact that the node is a Blue diplomatic Zone, thus, high levels of security. For more analysis, see Cytonn Weekly #32/2019
- ACME Dream Ltd, a Chinese conglomerate firm, announced plans to build a 25-room, luxury hotel in Embakasi, Nairobi. The hotel, which will be on 5.2-acres, in close proximity to the Jomo Kenyatta International Airport (JKIA), is expected to cost approximately Kshs 1.4 bn inclusive of the land cost (delivery timelines undisclosed). Nairobi’s vibrant hospitality sector boosted by presence of good quality infrastructure, growth of business tourism due to government’s aggressive marketing of the Meeting, Incentives, Conferences and Exhibition (MICE) sector, and an overall vibrant tourism sector, has continued to attract international hotel investors seeking to tap into the growing number of international tourists. For more analysis, see Cytonn Weekly #34/2019
- Diani Reef Beach Resort in Mombasa County announced plans to construct an additional 114 rooms to increase its capacity to 257 rooms from the current 143 rooms. The hotel, which was feted by World Travel Awards as Africa’s Leading Beach Resort in 2018 and awarded the five-star status by Kenya’s Tourism Regulatory Authority in 2019, has also expanded its conference facilities to tap into the growing number of delegates. For more analysis, see Cytonn Weekly #34/2019
The hospitality sector is set to continue registering a positive performance buoyed by vibrant international and domestic tourism, booming Meetings, Incentives, Conferencing and Exhibitions sector, availability of good quality accommodation facilities, and enhanced security.
E. Industrial Sector
ImpAct, a joint venture between Improvon, a South Africa based industrial and commercial property Investment Company, and Actis, a UK based Private Equity Firm, announced plans to have the Nairobi Gate Industrial Park located within Northlands City complete by end of Q1’2020. The 10,000 SQM industrial park is slated to be the largest industrial park investment in Kenya with an estimated construction cost of Kshs 11.0 bn. Over the last two years, investors in the Nairobi industrial sector have continued to shift focus away from the traditional industrial nodes such as Mombasa Road, Baba Dogo, and Industrial Area, which tend to be overcrowded and offer outdated warehousing stock, to other areas such as Satellite Towns within Kiambu County. This has been enabled by;
- Provision of infrastructure such as the Eastern Bypass and the Northern Bypass, which have eased transit to logistic hubs namely the Jomo Kenyatta International Airport, the Inland Container Depot (ICD), and the Standard Gauge Railway (SGR) station, all along Mombasa Road, and,
- Growth of foreign investment, creating a huge demand for high quality industrial parks with modernized logistic systems, which are lacking in the traditional nodes thus creating an investment niche in the Satellite Areas.
Key Industrial Parks that have been unveiled so far include Infinity Industrial Park in Ruai, Tatu City Industrial Park in Ruiru, and Tilisi Development in Limuru. The trend has also been encouraged by the growth of master-planned developments as they attract clientele due to the live-work-play environment in addition to being ultra-modern, tax incentives for Special Economic Zones (SEZs), and provision of large-scale infrastructure.
Nairobi as a highly regarded commercial hub in the region is set to continue attracting international players, thus, creating demand for high quality, ultra-modern industrial parks. Therefore, we expect to continue witnessing more upcoming parks in satellite towns and other counties where there is ample infrastructure.
F. Listed Real Estate
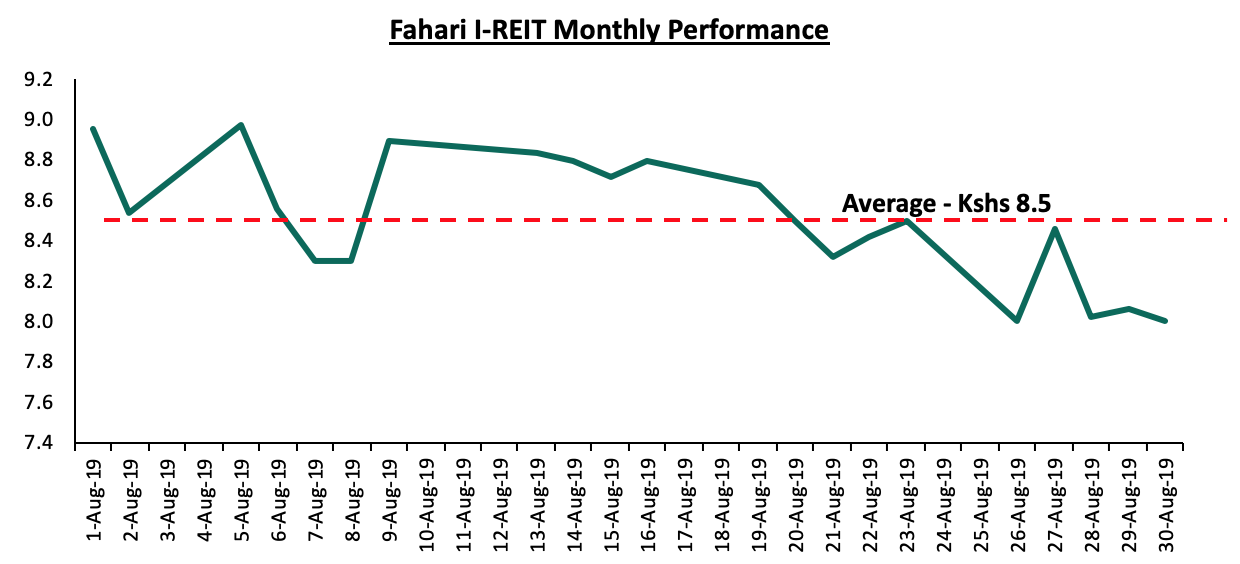
The Fahari Income REIT share price closed the month at Kshs 8.0, 5.9% lower than the monthly average of Kshs 8.5 and 61.4% lower than its initial price of Kshs 20.75 in November 2015. The low trading price is as a result of relatively low demand from investors owing to poor perception. However, in terms of earnings, the REIT registered a stable performance and as per our Stanlib Fahari Earnings Note H1'2019 the REIT recorded a 16.2% increase in net profit to Kshs 76.4 mn as at H1’2019 from Kshs 65.8 mn in H1’2018 translating to a growth in earnings per share to Kshs 0.42 from Kshs 0.36 in H1’2018, and the instrument’s performance is expected to remain stable with relatively high rental yields of 7% - 8%.
Our outlook for the real estate sector remains neutral with a bias to positive. We expect the sector’s performance to be cushioned by increasing investment by international players, growth of infrastructure which is bound to continue driving real estate investments to satellite towns, and growth of foreign direct investment.
Disclaimer: The views expressed in this publication are those of the writers where particulars are not warranted. This publication is meant for general information only and is not a warranty, representation, advice or solicitation of any nature. Readers are advised in all circumstances to seek the advice of a registered investment advisor.

- Talk to us
- Kenya
- P.O Box 20695 - 00200, Nairobi, Kenya
- Cell +254709101200
- Tel +254709101200
- WhatsApp +254741676635
- United States
- +254709101200
- DOWNLOAD OUR APP
-


- Kenya
- 8th Floor, Pinetree Plaza, Kaburu Drive, Ngong Road, Nairobi, Kenya
- USA
- Suite 1150, 1775 Eye Street NW, USA, Washington DC 20006, USA
- Investments
- High Yield
- Private Equity
- Real Estate
- Real Estate
- RiverRun Estates
- Cytonn Towers
- The Ridge
- Taraji Heights
- The Alma