Personal Financial Planning, & Cytonn Weekly #32/2019
By Research Team, Aug 11, 2019
Executive Summary
Fixed Income
T-bills remained oversubscribed during the week, with the overall subscription rate declining to 122.8%, from 137.5% recorded the previous week. The continued oversubscription is attributable to favorable liquidity in the market supported by government payments, coupled with the effects from the ongoing demonetization process, which has increased liquidity in the money markets triggered by the rush to exchange the old currency notes with the new notes. The yields on the 91-day and 182-day papers declined by 9.8 bps and 10 bps to 6.4% and 7.2%, respectively, while the yield on the 364-day paper rose by 11.4 bps to 9.2%. According to Stanbic Bank’s Monthly Purchasing Manager’s Index (PMI) released earlier during the week, the business environment in the country continued to improve during the month of July. The seasonally adjusted PMI came in at 54.1 in July, a slight decline from 54.3 in June. A PMI reading of above 50 indicates improvements in the business environment, while a reading below 50 indicates a worsening outlook;
Equities
During the week, the equities markets was on a downward trend with NASI, NSE 20 and NSE 25 falling by 0.8%, 1.2% and 0.6%, respectively, taking their YTD performance to gains/losses of 4.7%, (9.8%) and 0.3%, for NASI, NSE 20 and NSE 25, respectively. During the week, the Finance and National Planning Committee voted to halt the planned takeover of National Bank of Kenya (NBK) by KCB Group, on grounds that the offer undervalues the lender;
Private Equity
KPMG East Africa and East Africa Venture Capital Association (EAVCA) released a joint report, Private Equity Sector Survey of East Africa, which looks into the private equity market over the period spanning 2017 and 2018, with a keen focus on the shift in trends in the private equity space since 2016;
Real Estate
During the week, in the residential sector, Centum Real Estate broke ground on its Riverbank Apartments development project in Two Rivers, while Erdemann Properties also broke ground on Phase III of its Greatwall Gardens Project in Athi River. In the hospitality sector, International hotel group, Accor Hotels, announced plans to debut its M Gallery premium boutique hotel brand in Gigiri, marking its seventh hotel in Kenya and fifth in Nairobi;
Focus of the Week
We face various financial obligations in different stages of life. They range from medical expenses, education expenses, and other miscellaneous expenses. In most cases, a lot of challenges stem from lack money, often caused by poor financial planning. Personal financial planning refers to a systematic approach towards managing one’s finances in an effort to maximize the use of these resources in order to achieve one’s financial goals and objectives. This week, we follow up our previous focus on Investment Options in the Kenyan Market, where we now look at the importance of financial planning and the various considerations to make, based on one’s own characteristics, needs and preferences.
- Ian Kagiri, Investments Analyst, was on KBC to discuss the interest rate cap introduced by the Central Bank of Kenya. Watch Ian here.
- Wacu Mbugua, Research Analyst, was on Metropol TV to discuss the merits and demerits of taking a mortgage as opposed to building your own home. Watch Wacu here.
- Cytonn Investments held its Q2’2019 FA/IFA Awards, where the top selling financial advisors and independent financial advisors took home attractive cash prizes. Read the event note here.
- Phase 1 of The Alma is now 100% sold with early buyers having achieved up to 55% capital appreciation. We are now running a promotion in Phase 2: Buy a unit in Phase 2 with a 15-year payment plan and 0% deposit. For inquiries, please email us on clientservices@cytonn.com. The site is open between 8 am - 5 pm, 7-days a week for site visits;
- Cytonn Money Market Fund closed the week at an average yield of 11.0% p.a. To subscribe, just dial *809#
- For an exclusive tour of Cytonn’s real estate developments, visit: Sharp Investor’s Tour and for more information, email us at sales@cytonn.com;
- Following the completion and handover of Amara Ridge in Karen, we have now launched our next Karen project, dubbed Applewood, a Kshs 2.5 bn residential development located in Miotoni, Karen. This signature development shall comprise luxury homes, each sitting on 1/2 acre. We invite you to the exhibition of Applewood, which is ongoing at the Amara Ridge Clubhouse (Location pin: https://goo.gl/maps/B3GVnu8pHyn) or at the Applewood Sales Centre on Miotoni Road (Location pin: https://goo.gl/maps/ZfABuGjFo1z) from 9:00 am to 5:00 pm daily. Call 0709 101 000 or email resales@cytonn.com to reserve a villa! See Video here;
- We continue to hold weekly workshops and site visits on how to build wealth through real estate investments. The weekly workshops and site visits target both investors looking to invest in real estate directly and those interested in high yield investment products to familiarize themselves with how we support our high yields. Watch progress videos and pictures of The Alma, Amara Ridge, and The Ridge;
- We continue to see very strong interest in our weekly Private Wealth Management Training (largely covering financial planning and structured products). The training is at no cost and is open only to pre-screened participants. We also continue to see institutions and investment groups interested in the training for their teams. Cytonn Foundation, under its financial literacy pillar, runs the Wealth Management Training. If interested in our Private Wealth Management Training for your employees or investment group, please get in touch with us through wmt@cytonn.com. To view the Wealth Management Training topics, click here;
- For recent news about the company, see our news section here;
- We have 10 investment-ready projects, offering attractive development and buyer targeted returns. See further details here: Summary of Investment-Ready Projects.
T-Bills, T-Bonds Primary Auction & Money Markets:
T-bills remained oversubscribed during the week, with the overall subscription rate declining to 122.8%, from 137.5% recorded the previous week. The continued oversubscription is attributable to favorable liquidity in the market supported by government payments, coupled with the effects from the ongoing demonetization process, which has increased liquidity in the money markets triggered by the rush to exchange the old currency notes with the new notes. The yields on the 91-day and 182-day papers declined by 9.8 bps and 10 bps to 6.4% and 7.2%, respectively, while the yield on the 364-day paper rose by 11.4 bps to 9.2%. The acceptance rate rose to 90.3%, from 72.7% the previous week, with the government accepting Kshs 26.6 bn of the Kshs 29.5 bn worth of bids received, higher than the weekly quantum of Kshs 24.0 bn. The 91-day and 182-day papers registered lower subscription to 103.7% and 63.9%, from 205.2% and 77.6% recorded the previous week, respectively. The 364-day paper however recorded improved subscription to 189.5%, from 170.4% recorded the previous week.
For the month of August, the government is set to issue a 10-year bond (FXD 3/2019/10) and re-open a 20-year bond (FXD 1/2019/20) for a total of Kshs 50.0 bn for budgetary support. The government has adopted an approach of a blended issue of a medium-tenor and long-tenor bond, in a bid to plug in the budget deficit, while at the same time trying to reduce the maturity risk. Investors are expected to maintain a bias towards the 10-year bond as per recent trends, mainly driven by the perception that risks may not be adequately priced on the longer end of the yield curve, which is relatively flat due to saturation of long-term bonds. In the market, bonds with 10-years and 20-years to maturity are currently trading at yields of 11.5% and 12.6%, respectively. We expect bids for the (FXD 3/2019/10) and (FXD 1/2019/20) to come in at 11.5% - 11.7% and 12.6% - 12.8%, respectively.
In the money markets, 3-month bank placements ended the week at 8.6% (based on what we have been offered by various banks), 91-day T-bill at 6.4%, the average of Top 5 Money Market Funds at 10.1%, with the Cytonn Money Market Fund closing the week at an average yield of 11.0% p.a.
Liquidity:
Liquidity in the market remained favorable during the week attributable to government payments as well as effects emanating from the ongoing demonetization process. The average interbank rate however rose to 3.2%, from 2.5% recorded the previous week, due to banks trading cautiously in the interbank market in order to meet their CRR cycle ending August 14th. The average volumes traded in the interbank market declined by 28.7% to Kshs 6.2 bn, from Kshs 8.7 bn the previous week.
Kenya Eurobonds:
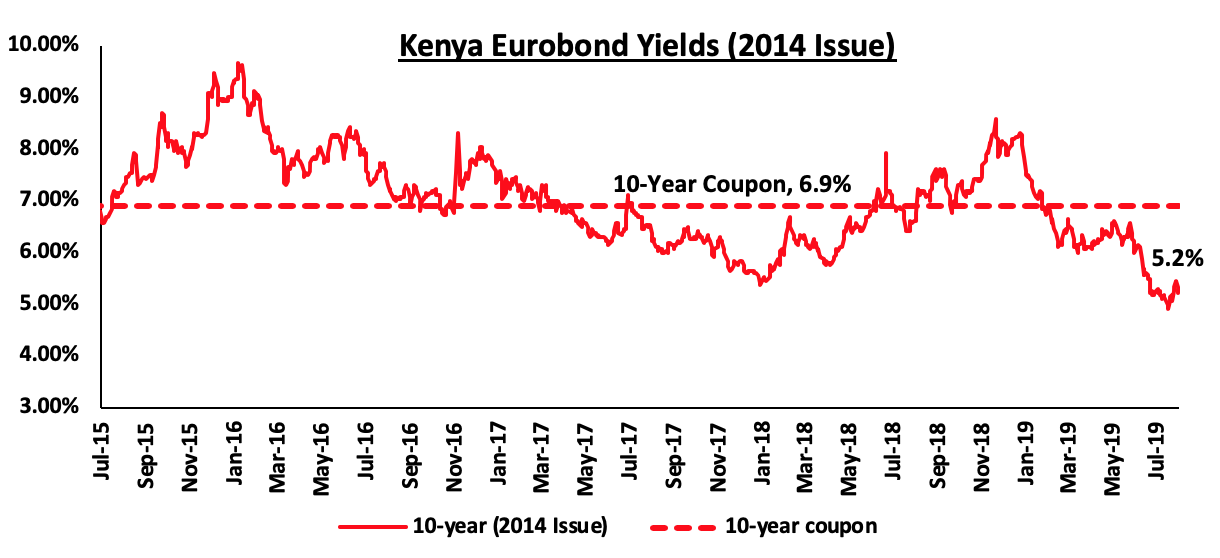
The yield on the 10-year Eurobond issued in 2014 dropped by 0.1% points to 5.2%, from 5.3% recorded the previous week. The continued decline in yields has been attributed to increased demand for emerging market fixed-income securities in the wake of the pause by the US Fed on its three-year cycle of tightening its monetary policy, which had made returns from fixed income securities more attractive as highlighted in our H1'2019 SSA Eurobond Performance Note
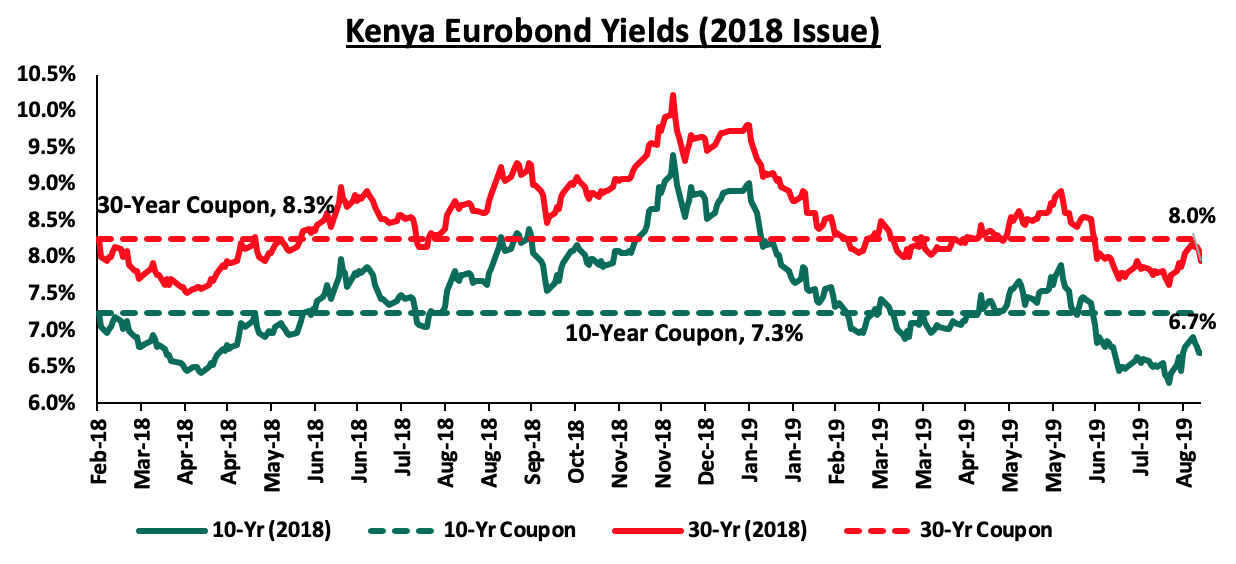
For the February 2018 Eurobond issue, yields on both the 10-year and 30-year Eurobonds remained stable to close at 6.7% and 8.0%, unchanged from the previous week.
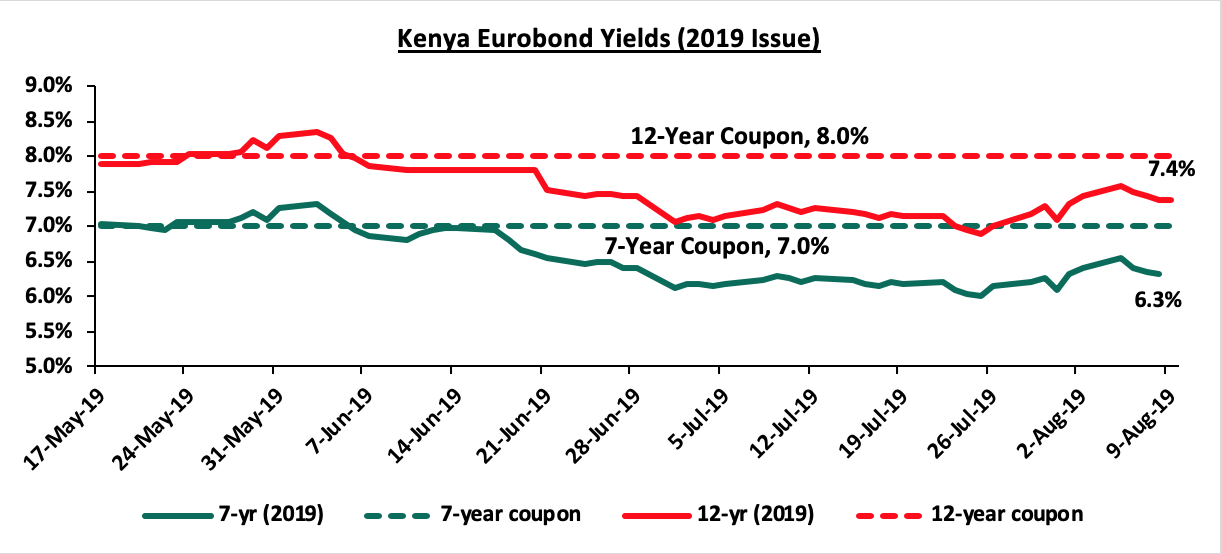
For the newly issued dual-tranche Eurobond with 7-years and 12-years tenor, priced at 7.0% for the 7-year tenor and 8.0% for the 12-year tenor, respectively, the yields on the 7-year bond remained unchanged at 6.3% while the yield on the 12-year bond rose marginally by 0.1% points to 7.4% from 7.3% recorded the previous week.
The Kenya Shilling:
During the week, the Kenya Shilling depreciated by 0.1% against the US Dollar to close at Kshs 103.4, from Kshs 103.2 the previous week, partly driven by a relatively liquid money market. The Kenya Shilling has depreciated by 1.5% year to date, in comparison to the 1.3% appreciation in 2018. Despite the recent depreciation we still expect the shilling to remain relatively stable to the dollar in the short term, supported by:
- The narrowing of the current account deficit, with preliminary data indicating that the current account deficit narrowed to 4.2% of GDP in the 12-months to June 2019, from 5.4% recorded in June 2018. The decline has been attributed to the resilient performance of exports particularly horticulture and coffee, strong diaspora remittances, and higher receipts from tourism and transport services. Growth of imports also slowed mainly due to lower imports of food,
- Improving diaspora remittances, which have increased cumulatively by 13.6% in the 12-months to June 2019 to USD 2.8 bn, from USD 2.4 bn recorded in a similar period of review in 2018. The rise is due to:
- Increased uptake of financial products by the diaspora due to financial services firms, particularly banks, targeting the diaspora, and,
- New partnerships between international money remittance providers and local commercial banks making the process more convenient,
- CBK’s supportive activities in the money market, such as repurchase agreements and selling of dollars, and,
- High levels of forex reserves, currently at USD 9.5 bn (equivalent to 6.0-months of import cover), above the statutory requirement of maintaining at least 4.0-months of import cover, and the EAC region’s convergence criteria of 4.5-months of import cover.
Weekly Highlights:
According to Stanbic Bank’s Monthly Purchasing Manager’s Index (PMI), released earlier during the week, the business environment in the country continued to improve during the month of July. The seasonally adjusted PMI came in at 54.1 in July, a slight decline from 54.3 in June. A PMI reading of above 50 indicates improvements in the business environment, while a reading below 50 indicates a worsening outlook. Firms showed sharp increases in new orders during the month from both domestic and external markets attributed to marketing efforts as well as referrals. Output levels continued to expand, but at a slower pace compared to June, an indication that some businesses lacked the capacity to keep up with the demand growth. This led to a sharp increase in the backlog of work, which was also heightened by insufficient staff numbers. Selling prices rose during the month as firms marked-up the prices in an effort to maintain profit levels, while mitigating the rise in input costs which were as a result of inflationary effects driven by taxes, fuel prices and exchange rate as a result of a weaker shilling in July. The July PMI index reflects the upbeat sentiment from businesses as the government continues to settle its arrears, easing of cash-flow issues, leading to the growth in sales. We expect the trend to continue considering the Kenyan President’s directive to ensure consignments are cleared faster at the port going forward, coupled with the proposal in the 2019/2020 Budget that all government suppliers should be paid within 60-days.
Rates in the fixed income market have remained relatively stable as the government rejects expensive bids. A budget deficit is likely to result from depressed revenue collection with the revenue target for FY’2019/2020 at Kshs 2.1 tn, creating uncertainty in the interest rate environment as additional borrowing from the domestic market goes to plug the deficit. Despite this, we do not expect upward pressure on interest rates due to increased demand for government securities, driven by improved liquidity in the market owing to the relatively high debt maturities. Our view is that investors should be biased towards medium-term fixed income instruments to reduce duration risk associated with long-term debt, coupled with the relatively flat yield curve on the long-end due to saturation of long-term bonds.
Market Performance
During the week, the equities market was on an downward trend with NASI, NSE 20 and NSE 25 falling by 0.8%, 1.2% and 0.6%, respectively, taking their YTD performance to gains/losses of 4.7%, (9.8%) and 0.3%, for NASI, NSE 20 and NSE 25, respectively. The performance in NASI was driven by declines in Diamond Trust Bank, NIC Group, KCB Group, and Standard Chartered, which declined by 1.8%, 1.0%, 0.7%, and 0.4%, respectively.
Equities turnover decreased by 74.7% during the week to USD 5.4 mn, from USD 21.3 mn the previous week, taking the YTD turnover to USD 888.2 mn. Foreign investors remained net sellers for the week, with a net selling position of USD 1.8 mn, from a net buying position of USD 2.1 mn the previous week.
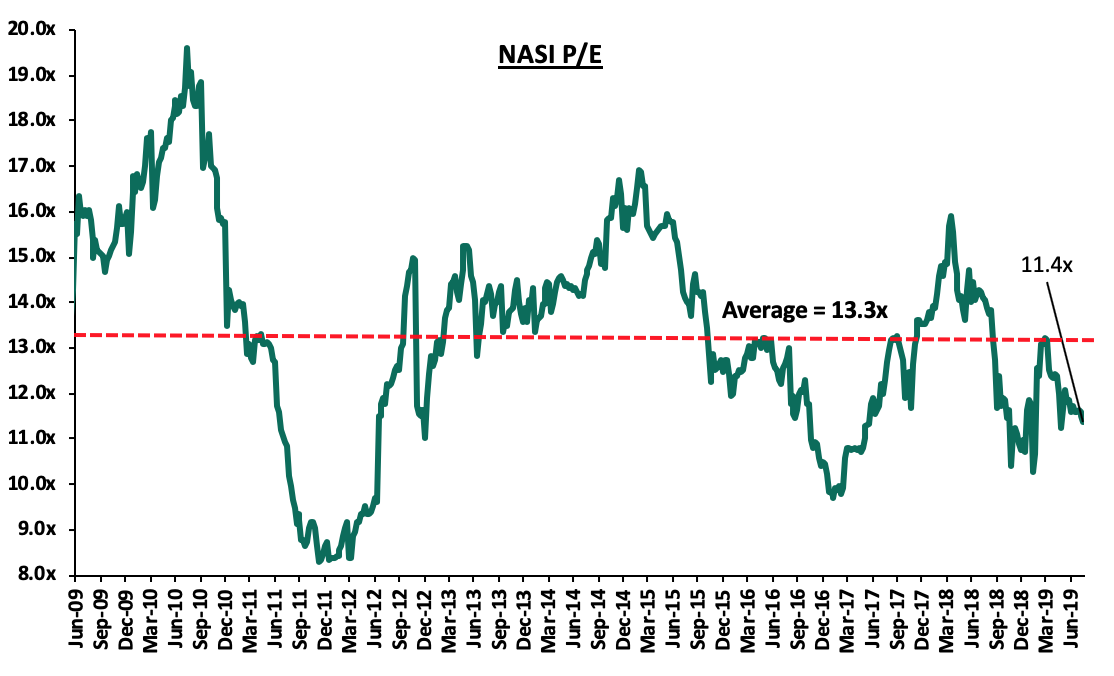
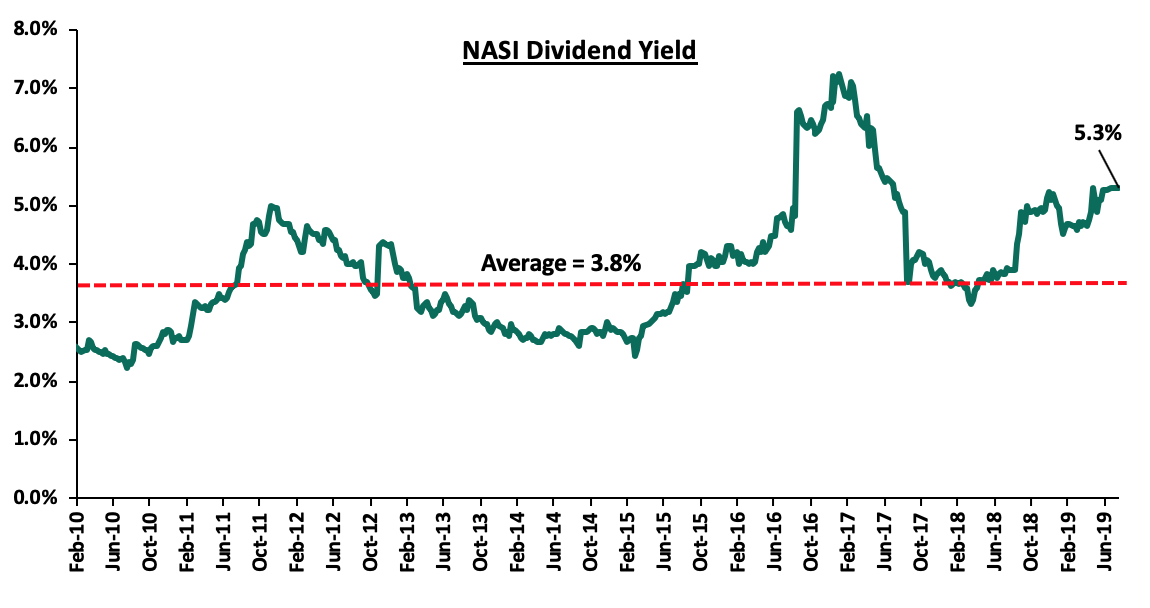
The market is currently trading at a price to earnings ratio (P/E) of 11.4x, 14.7% below the historical average of 13.3x, and a dividend yield of 5.3%, 1.5% points above the historical average of 3.8%. With the market trading at valuations below the historical average, we believe there is value in the market. The current P/E valuation of 11.4x is 17.5% above the most recent trough valuation of 9.7x experienced in the first week of February 2017, and 37.3% above the previous trough valuation of 8.3x experienced in December 2011. The charts below indicate the historical P/E and dividend yields of the market.
Earnings Releases
Stanbic Bank released their H1’2019 financial results, recording a 14.4% increase in core earnings per share to Kshs 10.3, from Kshs 9.0 in H1’2018, driven by a 14.8% increase in total operating income, despite the 21.6% increase in total operating expenses. Highlights of the performance from H1’2018 to H1’2019 include:
- Total operating income increased by 14.8% to Kshs 12.8 bn in H1’2019, from Kshs 11.2 bn in H1’2018. This was driven by a 19.5% increase in Net Interest Income (NII) to Kshs 6.7 bn, from Kshs 5.6 bn in H1’2018, coupled with a 10.1% increase in Non-Funded Income (NFI) to Kshs 6.1 bn, from Kshs 5.6 bn in H1’2018,
- Interest income increased by 10.5% to 10.1 bn, from 9.1 bn recorded in H1’2018, driven by the 12.9% increase in interest income from loans and advances to Kshs 7.6 bn, from Kshs 6.7 bn in H1’2018, coupled with the 64.5% increase in interest income from deposit placements to Kshs 147.2 mn, from Kshs 89.5 mn in H1’2018, and the 1.4% increase in interest income from government securities to Kshs 2.32 bn, from Kshs 2.28 bn in H1’2018. The yield on interest earning assets however declined to 7.9%, from 8.4% in H1’2018, owing to the decline in yield on loans as a result of the 50 bps decline of the Central Bank Rate (CBR) from 9.5% to 9.0% in Q2’2018 as well as the decline in yields on government securities,
- Interest expense increased by 5.2% to 3.7 bn, from 3.5 bn in H1’2018, caused by the 11.6% increase in interest expense from customer deposits to Kshs 2.5 bn, from Kshs 2.2 bn in H1’2018, coupled with the 31.6% increase in other interest expenses to Kshs 0.4 bn, from Kshs 0.3 bn in H1’2018, and offset slightly by the 17.8% decline in interest expenses on placement liabilities to Kshs 0.8 bn, from Kshs 1.0 bn. Cost of funds declined marginally to 3.0%, from 3.1% in H1’2018, as a result of a decline in deposits costs after the removal of the 70.0% of the CBR minimum interest payable on deposits in the Finance Act 2018, as interest bearing liabilities increased faster by 12.3% to Kshs 254.7 bn, from Kshs 226.8 bn in H1’2018.The Net Interest Margin (NIM) rose marginally to 5.1%, from 4.9% in H1’2018,
- Non-Funded Income (NFI) increased by 10.1% to Kshs 6.1 bn, from Kshs 5.6 bn in H1’2018, mainly driven by a 53.2% increase in fees and commissions on loans to Kshs 0.2 bn, from Kshs 0.1 bn in H1’2018, coupled with a 37.5% increase in other fees and commissions to Kshs 2.5 bn, from Kshs 1.8 bn in H1’2018, and a 59.4% increase in Forex trading gains to Kshs 2.7 bn, from Kshs 1.7 bn in H1’2018. The increase in NFI was however weighed down by the 76.7% decline in other income to Kshs 0.4 bn, from Kshs 1.6 bn in H1’2018,
- Total operating expenses increased by 21.6% to Kshs 7.3 bn, from Kshs 6.0 bn, largely driven by a 387.6% increase in Loan Loss Provisions (LLP) to Kshs 1.2 bn in H1’2019, from Kshs 0.3 bn in H1’2018, and a 3.2% increase in staff costs to Kshs 2.9 bn, from Kshs 2.8 bn, in H1’2018,
- The cost to income ratio thus deteriorated to 56.7%, from 53.5% in H1’2018 as a result of the faster growth in operating expenses Without LLP, the Cost to income ratio improved to 47.1% from 51.3% in H1’2018, highlighting the increase in cost of risk to 9.6%, from 2.3% in H1’2018,
- Profit before tax increased by 7.1% to Kshs 5.6 bn, up from Kshs 5.2 bn in H1’2018. Profit after tax increased 14.4% to Kshs 4.1 bn in H1’2019, from Kshs 3.6 bn in H1’2018, highlighting the decline in the effective tax rate to 26.9%, from 31.6% in H1’2018, and,
- The bank declared an interim dividend of Kshs 1.25, a 45.7% decline from the Kshs 2.3 interim dividend declared in H1’2018. Assuming a similar final dividend payout of Kshs 3.6, it translates to a dividend yield of 4.8%.
Balance Sheet
- The balance sheet recorded an expansion as total assets increased by 12.4% to Kshs 313.3 bn, from Kshs 278.8 bn in H1’2018. This growth was largely driven by a 15.0% increase in net loans and advances to Kshs 177.1 bn, from Kshs 154.0 bn in H1’2018, coupled with an 8.1% increase in investment securities to Kshs 94.1 bn, from Kshs 87.0 bn in H1’2018,
- Total liabilities rose by 12.6% to Kshs 266.5 bn, from Kshs 236.6 bn in H1’2018, driven by a 10.3% increase in total deposits to Kshs 238.0 bn, from Kshs 215.8 bn in H1’2018, coupled with the 30.6% increase in borrowings to Kshs 9.2 bn, from Kshs 7.0 bn in H1’2018,
- Deposits per branch increased by 10.3% to Kshs 9.2 bn, from Kshs 8.3 bn in H1’2018, as the number of branches remained unchanged at 26,
- The faster growth in loans as compared to deposits led to an increase in the loan to deposit ratio to 74.4%, from 71.4% in H1’2018,
- Gross Non Performing Loans (NPLs) increased by 69.7% to Kshs 17.9 bn from Kshs 10.6 bn recorded in H1’2018, and consequently the Gross NPL ratio rose to 9.6%, from 6.6% in H1’2018. General provisions rose by 100.7% to Kshs 6.5 bn, from Kshs 3.3 bn in H1’2018. As a result, the NPL Coverage increased by 11.5% points to 57.5%, from 51.5% in H1’2018,
- Shareholders’ funds increased by 10.9% to Kshs 46.8 bn in H1’2019, from Kshs 42.2 bn in H1’2018, driven by the 19.8% increase in revenue and other reserves to Kshs 28.0 bn, from Kshs 23.3 bn in H1’2018,
- Stanbic Bank remains sufficiently capitalized with a core capital to risk weighted assets ratio of 14.2%, 3.7% points above the statutory requirement of 10.5%. In addition, the total capital to risk weighted assets ratio stood at 17.5%, exceeding the statutory requirement by 3.0% points. Adjusting for IFRS 9, the core capital to risk weighted assets stood at 15.3%, while total capital to risk weighted assets came in at 18.6%, and,
- Stanbic Holdings currently has a return on average assets of 2.3% and a return on average equity of 15.3%.
Key Take-Outs:
- The bank recorded a relatively strong performance in both funded and NFI segments. The bank’s aggressive lending has led to increased interest income, as well as the associated fees and commissions. The increased lending has however, come at a cost as asset quality deteriorated, as shown by the rise in the NPL ratio to 9.6%, from 6.6% in H1’2018. Consequently, impairment costs rose by 387.6%, which saw the cost of risk rise to 9.6% from 2.3% in H1’2018.
For more information, please see our Stanbic Holdings Earnings Note.
Weekly Highlights
During the week, the Finance and National Planning Committee voted to halt the planned acquisition of National Bank of Kenya (NBK) by KCB Group, on grounds that the offer undervalues the lender. The report of the committee, which was tabled in the National Assembly will, however, require the approval of the National Assembly. As an alternative, the committee has recommended that NBK's principal shareholders - the National Social Security Fund (NSSF) and the National Treasury, who hold 48.1% and 22.5% of the ordinary shares of NBK, respectively, reject KCB's offer to acquire 100.0% shareholding. The committee wants the Treasury to seek alternative means to fund the lender in order to ensure that the bank is compliant with capital adequacy requirements as stipulated in the Banking Act. However, the Treasury continues to back the proposed buyout by KCB Group, and warned that should the proposed takeover by KCB fail, NBK is likely to collapse and this may lead to a systemic shock in the banking sector. This is because the principal shareholders have previously failed to honour their obligations following their failure to follow through plans of raising cash through a rights issue in 2013, and thus the acquisition presents the most likely certain option of recapitalization. Further, the committee is of the opinion that of the two lenders, NBK is the stronger bank with 70 branches across the country compared to KCB Group with 257 branches, which is inaccurate as fewer branches does not imply a bank is stronger. KCB Group is also sufficiently capitalized with a total capital to risk weighted assets ratio of 20.0%, which is 5.5% points above the regulatory requirement of 14.5%, compared to NBK, which has a total capital to risk-weighted assets ratio of 3.8%, which is 10.7% points below the minimum requirement of 14.5%.
We are of the view that the acquisition would present NBK with the opportunity to recapitalize and grow, as under the current undercapitalized conditions, the bank is constrained from deposit mobilization and lending. This is in line with our expectation of additional consolidation in the banking sector, as highlighted in our topical Consolidation in Kenya's Banking Sector to Continue .
Universe of Coverage
Below is a summary of our SSA universe of coverage:
|
Banks |
Price as at 02/08/2019 |
Price as at 09/08/2019 |
w/w change |
YTD Change |
Target Price* |
Dividend Yield |
Upside/ Downside |
P/TBv Multiple |
Recommendation |
|
Diamond Trust Bank |
114 |
112 |
(1.8%) |
(28.4%) |
228.4 |
2.3% |
96.3% |
0.6x |
Buy |
|
CRDB |
100.0 |
100.0 |
0.0% |
(33.3%) |
207.7 |
0.0% |
88.8% |
0.3x |
Buy |
|
UBA Bank |
5.9 |
5.7 |
(4.2%) |
(26.6%) |
10.7 |
15.0% |
87.6% |
0.4x |
Buy |
|
Zenith Bank |
18.4 |
16.8 |
(8.4%) |
(27.1%) |
33.3 |
16.1% |
84.4% |
0.7x |
Buy |
|
KCB Group*** |
40.0 |
39.7 |
(0.7%) |
6.0% |
60.4 |
8.8% |
66.8% |
1.1x |
Buy |
|
GCB Bank |
5.0 |
5.0 |
0.6% |
9.3% |
7.7 |
7.6% |
64.1% |
1.2x |
Buy |
|
I&M Holdings |
52.0 |
53.0 |
1.9% |
24.7% |
81.5 |
6.6% |
54.8% |
1.0x |
Buy |
|
Access Bank |
6.2 |
6.2 |
0.0% |
(8.8%) |
9.5 |
6.5% |
52.6% |
0.4x |
Buy |
|
Co-operative Bank |
12.0 |
12.1 |
0.8% |
(15.7%) |
17.1 |
8.3% |
50.4% |
1.0x |
Buy |
|
Equity Group |
40.3 |
40.5 |
0.6% |
16.2% |
53.7 |
4.9% |
42.7% |
1.7x |
Buy |
|
NIC Group |
29.3 |
29.0 |
(0.9%) |
4.3% |
42.5 |
3.4% |
42.3% |
0.6x |
Buy |
|
CAL Bank |
1.0 |
1.0 |
0.0% |
1.0% |
1.4 |
0.0% |
40.0% |
0.8x |
Buy |
|
Barclays Bank*** |
10.7 |
10.8 |
0.5% |
(1.8%) |
12.8 |
10.2% |
32.7% |
1.3x |
Buy |
|
Stanbic Bank Uganda |
29.0 |
29.0 |
0.0% |
(6.5%) |
36.3 |
4.0% |
29.1% |
2.1x |
Buy |
|
SBM Holdings |
5.5 |
5.5 |
(0.4%) |
(8.1%) |
6.6 |
5.5% |
23.0% |
0.8x |
Buy |
|
Guaranty Trust Bank |
27.9 |
26.8 |
(3.9%) |
(22.2%) |
37.1 |
9.0% |
21.7% |
1.7x |
Buy |
|
Stanbic Holdings |
98.5 |
100.0 |
1.5% |
10.2% |
113.6 |
5.9% |
20.6% |
1.1x |
Buy |
|
Ecobank |
8.5 |
8.5 |
0.0% |
13.3% |
10.7 |
0.0% |
19.2% |
1.9x |
Accumulate |
|
Union Bank Plc |
7.0 |
6.8 |
(2.9%) |
21.4% |
8.2 |
0.0% |
16.4% |
0.7x |
Accumulate |
|
Standard Chartered |
197.0 |
196.3 |
(0.4%) |
0.9% |
200.6 |
6.4% |
9.5% |
1.4x |
Hold |
|
Bank of Kigali |
275.0 |
274.0 |
(0.4%) |
(8.7%) |
299.9 |
5.1% |
8.5% |
1.5x |
Hold |
|
FBN Holdings |
5.6 |
4.9 |
(12.5%) |
(38.4%) |
6.6 |
5.1% |
6.3% |
0.3x |
Hold |
|
Bank of Baroda |
128.0 |
128.0 |
0.0% |
(8.6%) |
130.6 |
2.0% |
3.4% |
1.1x |
Lighten |
|
Standard Chartered |
19.0 |
19.0 |
0.0% |
(9.5%) |
19.5 |
0.0% |
2.3% |
2.4x |
Lighten |
|
National Bank |
3.9 |
4.0 |
2.6% |
(25.8%) |
3.9 |
0.0% |
(4.8%) |
0.2x |
Sell |
|
Stanbic IBTC Holdings |
38.1 |
38.1 |
0.0% |
(20.5%) |
37.0 |
1.6% |
(6.5%) |
2.0x |
Sell |
|
Ecobank Transnational |
7.6 |
7.0 |
(7.9%) |
(58.8%) |
9.3 |
0.0% |
(15.6%) |
0.3x |
Sell |
|
HF Group |
4.1 |
4.0 |
(1.5%) |
(28.0%) |
2.9 |
0.0% |
(27.7%) |
0.2x |
Sell |
|
*Target Price as per Cytonn Analyst estimates **Upside / (Downside) is adjusted for Dividend Yield ***Banks in which Cytonn and/or its affiliates are invested in ****Stock prices indicated in respective country currencies |
|||||||||
We are “Positive” on equities for investors as the sustained price declines have seen the market P/E decline to below its historical average. We expect increased market activity, and possibly increased inflows from foreign investors, as they take advantage of the attractive valuations to support the positive performance.
KPMG East Africa and East Africa Venture Capital Association (EAVCA) released a joint report, Private Equity Sector Survey of East Africa, a report that looks into the private equity market over the period spanning 2017 and 2018, with a keen focus on the shift in trends in the private equity space since 2016.
Some of the key highlights are below:
Fundraising
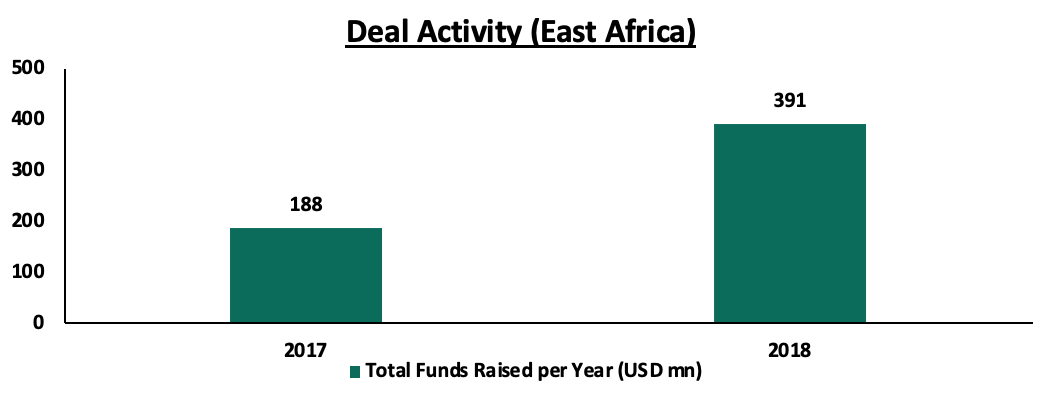
East Africa’s private equity landscape witnessed an improvement in deal activity in 2017 and 2018, with 33 and 51 deals disclosed, respectively. Over this period, the number of PE funds investing in East Africa increased to 97 up from 72 recorded in a similar study conducted between 2015 and 2016, as shown below,
|
|
2017-2018 |
2015-2016 |
|
Number of Investments |
84 |
36 |
|
Number of Funds |
97 |
72 |
In terms of fundraising, East Africa-focused private equity funds raised USD 579.0 mn (Kshs 59.6 bn), which was a significant drop from the USD 1.1 bn (Kshs 113.1 bn) that was raised between 2015 and 2016. This drop was quite different from what was witnessed globally, whereby funds raised grew by 25% to USD 1.1 tn (Kshs 164.8 tn). The strain in capital raising in the region can be attributed to the improvement in economic conditions in Asia, Southern Africa and Northern Africa, with most investors preferring to channel funds to these regions that are considered safer, given the longer track record in delivering returns to investors. The drop in funds raised by East African firms has closely mirrored that of the entire continent, with funds raised by Africa-focused funds dropping from USD 6.0 bn (Kshs 618.1 bn) in the 2015-2016 period to USD 5.1 bn (Kshs 525.4 bn) in 2017-2018.
Development Finance Institutions (DFI’s) and High Net Worth individuals/family offices emerged the most common sources of funds according to the report, accounting for 52% of the total funds raised in 2017 and 2018. Alternative asset managers and international and local pension funds collectively contributed to 34% of the funds raised.
Entry
Of the total 84 deals reported by the PE sector in East Africa, Kenya led, having 61 deals. Of these 61, the top two sectors were financial services, with 15 deals, and energy and natural resources with 9. Kenya recorded diverse investments with most sectors represented. This was a significant growth, compared to the 22 reported deals in 2015 and 2016. This growth was majorly driven by the Financial Services and Fintech sectors, which have grown rapidly within the country, with the fast-mobile penetration as well as development of supporting infrastructure for the financial services sector. Uganda was the second preferred geography by investors, with Ethiopia coming in third. The financial services sector recorded the largest share of deals in the region with 16 deals recorded in 2017-2018, with agribusiness coming in a close second, recording 14 deals.
In terms of value, Kenya led the pack, with an estimated USD 1.2 bn (Kshs 123.6 bn) of activities, compared to the total value of deals in the region, estimated at USD 1.4 bn (Kshs 144.2 bn). This large proportion of the share can be attributed not only to the number of deals in Kenya, but also to the relatively larger size of individual deals. In terms of sectoral contribution, energy, financial services and healthcare had the largest contribution, with over USD 1.0 bn (Kshs 103.1 bn) invested over the period of review.
Exits
There were 10 exits reported over the period of review, compared to 13 recorded in the period 2015 - 2016. Some of the notable exits included the sale of the 24.9 per cent stake held in Equity Bank by Helios Investment Partners in 2015 to long-term investors who included Norfund and NorFinance, NSSF Kenya, NSSF Uganda and Genesis Investment LLP. Exits in the region remain sparse as funds hold their investments for a longer period, as shown in the table below:
|
|
2017-2018 |
Total (2007-2018) |
|
Number of Investments |
84 |
190 |
|
Number of Exits |
10 |
44 |
|
Rate of Exit |
11.9% |
23.2% |
Source: Survey, Private Equity Africa, Thomson Reuters
While there seems to be a slowdown in exits over 2017 to 2018, collectively over 2007 to 2018 there have been 44 exits versus 190 investments resulting in a 23% rate of exit.
Of the 10 exits in 2017 and 2018, 2 were through an IPO, with the most notable being the exit of Helios from Vivo through a dual-listing on the LSE and the JSE, being the first PE exit via an IPO on both the LSE and the JSE, as well as 5 exits to strategic investors and 3 to financial investors. Of the 44 exits reported by the respondents, 17 are in financial services, 6 in healthcare, and 4 in agribusiness and manufacturing. 18 exits were made via sale to strategic investors followed by 11 share buy backs. Sale to financial investors, listing and others accounted for 15 of the total 44 exits over the period 2007 - 2018. Sale to a strategic investor remains the most preferred route of exit at 37%.
There has also been an increase in supporting framework, with the average number of investment professionals across the PE funds having increased from 1 to 5 between 2007 to 2014, and 5 to 20 from 2015 to 2018.
Private equity investments in Africa remain robust as evidenced by the increasing investor interest, which is attributed to; (i) rapid urbanization, a resilient and adapting middle class and increased consumerism, (ii) the attractive valuations in Sub Saharan Africa’s private markets compared to its public markets, (iii) the attractive valuations in Sub Saharan Africa’s markets compared to global markets, and (iv) better economic projections in Sub Sahara Africa compared to global markets. We remain bullish on PE as an asset class in Sub-Sahara Africa. Going forward, the increasing investor interest and stable macro-economic environment will continue to boost deal flow into African markets.
- Residential Sector
During the week, Centum Real Estate broke ground on its Riverbank Apartments Project, consisting of 160-units, within the Two Rivers development complex, along Limuru Road. According to the firm, the project, which is to be completed within 24-months, marks the first phase of a deal pipeline of 1,560 residential units planned for the 102-acre master-planned development, which also entails the 65,000 SQM Two Rivers mall, the largest mall in East and Central Africa, a City Hotel, and an office tower. The Riverbank project will comprise of one, two, and three-bedroom units with plinth areas of 89 SQM, 130 SQM and 195 SQM, respectively, selling at an average price per SQM of Kshs 172,746 (Kshs 16.0 mn, Kshs 24.0 mn, and Kshs 30.0 mn for one, two, and three bedroom units, respectively), in comparison to the market average for Ruaka and Ridgeways at Kshs 98,098 and Kshs 99,270, respectively. Such mixed-use development (MUD) projects as Two Rivers create operational synergy across the various themes as they complement each other, thus boosting the performance and returns to investors. Consequently, this leads to a higher price per SQM than the market average due to the additional value created by other themes. According to our MUD Report 2018, MUDs encompassing office, retail and residential themes registered an average rental yield of 8.0%, with Limuru Road posting the highest rental yields at 9.6% attributable to its proximity to high-end neighborhoods such as Gigiri, Runda, Rosslyn, Kitisuru, hosting Nairobi’s middle-end and high-end populations, with higher purchasing power and who are willing to pay a premium for class and extra amenities.
In terms of residential performance, apartments along Kiambu/Limuru Roads posted average total returns of 7.1% (Ruaka at 8.0% and Thindigua/Ridgeways at 6.1%), in comparison to the residential market average of 4.7%, as per the Cytonn 2019 Residential Report. The performance of these nodes is attributable to (i) relatively good infrastructure, enhancing accessibility to commercial nodes such as Gigiri, Westlands and the CBD, thus boosting demand from Nairobi’s working class, (ii) demand from expatriates serving in international organizations located along Limuru Road, (iii) presence of amenities such as Two Rivers, Village Market, Rosslyn Riviera, Ridgeways Mall, as well as learning institutions such as Potterhouse Runda, Sabis International, and Braeburn Ridgeways, and (iv) relatively high levels of security due to proximity to the UN Blue Zone.
In addition, during the week, Chinese developers Erdemann Properties launched Phase III of their Greatwall Gardens Project in Athi River. The affordable housing project is set to have 288, 104 SQM three-bedroom units selling at an off-plan price of Kshs 2.9 mn, translating to a price per SQM of Kshs 27,885. Based on monthly rental rates of Greatwall Gardens I for three-bedroom units, at Kshs. 265 per SQM (Kshs 27,000 per three-bedroom unit) investors stand to gain rental yields of 11.2% at full occupancy, in comparison to the Athi River apartments’ average of 5.0%. Other projects by Erdemann Properties include Seefar Apartments on Mbagathi Way, Greatwall Gardens One and Two in Athi River, and the recently launched River Estates in Ng’ara, which is set to deliver 2,720 apartments to the market. Athi River, as a real estate investment node, continues to attract affordable housing developments owing to:
- Affordable land for development with a price per acre of Kshs 12.0 mn as at 2019, in comparison to other satellite towns such as Ruiru and Ruaka Kshs 22.0 mn and Kshs 84.0 mn, respectively,
- Improved infrastructure, especially with the Standard Gauge Railway, the incoming terminus in Mlolongo, and planned dualling of Mombasa Road,
- Demand for residential units from the working class based in Mombasa Road’s and Athi River’s huge industrial sector, and,
- Relatively sufficient sewerage systems in Mavoko County, in comparison to other satellite towns, thus attracting high-rise developments.
(All Values in Kshs Unless Stated Otherwise)
|
Nairobi Metropolitan Area Residential Performance 2018/2019: Satellite Towns |
|||||||
|
Area |
Average Price per SQM |
Average Rent per SQM |
Annual Uptake |
Average Occupancy |
Average Price Appreciation |
Average Rental Yield |
Total Returns |
|
Ruaka |
98,098 |
454 |
20.6% |
91.9% |
2.4% |
5.6% |
8.0% |
|
Kitengela |
60,124 |
341 |
16.5% |
76.3% |
2.2% |
4.5% |
6.6% |
|
Thindigua |
99,270 |
499 |
21.1% |
88.4% |
1.8% |
4.2% |
6.1% |
|
Athi River |
66,156 |
356.4 |
17.6% |
84.8% |
0.7% |
5.0% |
5.7% |
|
Rongai |
63,064 |
350 |
19.1% |
68.5% |
1.1% |
4.6% |
5.7% |
|
Syokimau |
59,242 |
289 |
15.6% |
88.2% |
0.0% |
4.9% |
4.9% |
|
Kikuyu |
77,269 |
409 |
21.7% |
72.1% |
0.0% |
4.3% |
4.3% |
|
Lower Kabete |
96,876 |
449 |
20.8% |
86.5% |
(1.1%) |
4.3% |
3.3% |
|
Ruiru |
89,421 |
433 |
31.1% |
74.0% |
(0.8%) |
3.9% |
3.2% |
|
Thika |
46,722 |
331 |
24.2% |
71.0% |
(2.0%) |
4.6% |
2.6% |
|
Average |
75,624 |
391 |
20.8% |
80.2% |
0.4% |
4.6% |
5.0% |
|
· Athi River ranked #4 among Satellite Towns with returns to investors at 5.7%, 1.7% points higher than the Satellite Towns’ average of 5.0% and 1.0% points higher than the overall residential average of 4.7%. With continued urbanization in Nairobi and thus, growing need for affordable housing, we expect more mass housing projects to continue being unveiled in towns like Athi River where land is relatively affordable, and infrastructure constantly improving |
|||||||
Source: Cytonn Research 2019
- Hospitality Sector
Global hospitality group Accor announced plans to open its first M Gallery Hotel Chain Collection in Gigiri, Nairobi, set to be opened by Q1’2021. The 105-keys hotel in partnership with Jit Group (a local investment firm in commercial sectors across East Africa) will grow Accor’s footprint in Nairobi to five properties, with three Accor brands already operating namely, Fairmont the Norfolk in CBD, ibis Styles Hotel and Mövenpick Residences and Hotel in Westlands, with Pullman brand on track to open in Q4’2019, also in Westlands. Outside of Nairobi, the hospitality group also operates two facilities: Fairmont Mara Safari Club and Fairmont Mount Kenya Safari Club. The new addition in Gigiri is an indicator of the node’s attractiveness for hospitality, which is attributble to: (i) relatively low supply of hotels in comparison to nodes such as Westlands, Upperhill and CBD, (ii) relatively high population of expatriates creating demand for hospitality services, (iii) relatively good infrastructure with the Northern Bypass as well as the Westlands Link Road and the ongoing Western Bypass, which boost its accessibility, (iv) Blue diplomatic Zone, thus, high levels of security, and (v) presence of recreational amenities along Limuru Road such as the Village Market and Two Rivers Mall that create shopping convenience to the residents.
Overall, the hospitality sector in Nairobi has continued to attract multinational hotel operators keen on expanding their portfolio in Africa. This is due to (i) Nairobi’s status as a key financial hub in Africa, which attracts many foreign workers on short stays, as well as room for Meeting, Incentives, Conferences and Exhibitions (MICE) initiative, (ii) relatively good infrastructure, and (iii) vibrant recreational scene including game and museum parks, which attract tourists globally. According to KNBS, international visitors reported in 2018 increased by 14.0% to 2.0 mn from 1.8 mn in 2017.
According to W Hospitality Group’s Hotel Chain Development Pipelines in Africa 2019 Report, Kenya ranked #5 among African countries with the highest hotel room pipeline with 27 hotels and 4,232 keys in total, as at 2019, ranking it behind Egypt, Nigeria, Morocco and Ethiopia. Key hotel operators that form the deal pipeline include Marriott, Best Western, Radisson Group, Accor, Hyatt, among others.
Our outlook for the real estate sector remains neutral with a bias to positive. We expect the sector’s performance to be cushioned by increasing investment by international players, growth of infrastructure which is bound to continue driving real estate investments to satellite towns, and growth of middle-income earners creating demand for real estate.
More often than not, out of the challenges we face in life, we face various financial obligations in different stages of life. They range from medical expenses, education expenses and other miscellaneous expenses. In most cases, a lot of challenges stem from lack of money, often caused by poor financial planning. This week, we follow up our previous focus on Investment Options in the Kenyan Market, where we now look at the importance of financial planning and the various considerations to make, based on one’s own characteristics, needs and preferences.
Therefore, we shall be discussing the following:
- What is Personal Financial Planning?
- The Financial Planning Process,
- The Key Considerations to Make,
- Conclusion.
Section I: What is Personal Financial Planning?
Personal Financial Planning refers to a systematic approach towards managing one’s finances in an effort to maximize the use of these resources in order to achieve one’s financial goals and objectives. In other words, it is allocating resources optimally so as to realize one’s financial goals. Having a sound personal financial plan helps reduce and possibly eliminate financial distress arising from various responsibilities and unexpected situations. Having highlighted the need for a personal financial plan, it is key to note that financial planning, to a large extent, depends on one’s age, the responsibilities at hand, and future objectives.
Section II: The Financial Planning Process
Personal financial planning is a continuous process that can be achieved through the following steps:
- Assessment: This is the first step towards financial planning and it involves identifying factors that are likely to affect one’s financial plan. In this step, an individual will need to look at their income statement, spending habits, lifestyle and see how each of them will affect their financial plan. Some of the factors likely to inform one’s financial plan include:
-
- Age: Younger people have time on their side and can therefore make riskier investment decisions as they have time to recover if they end up making losses. Their investment of choice would include real estate and equities, which allow the investor time to grow value in their investment. For an older person, time is limited and therefore high-risk investments are not an option. They prefer safer investment options that offer steady and predictable income, which include; government backed assets such as bills and bonds, which offer an almost guaranteed return after a given period of time. They may also invest in various collective investment schemes such as fixed income or money market funds, which are professionally managed, offer liquidity, periodic income and principal protection;
- Risk Profile: Some people are more risk averse than others, and they will generally avoid riskier investment decisions which means that their financial planning decisions will be geared towards safer investment plans. Their portfolio will most likely include investment instruments such as treasury bonds, bills and bank deposits. They can also invest in these securities through money market funds or fixed income funds. As for the risk takers, they will channel their planning towards high risk investments such as real estate and equities, with the aim of generating higher returns;
- Income: An individual’s income will affect their disposable income, and the amount of money they have left to invest. With proper financial planning, the higher the income, the more disposable income that one has to place into savings and investments. This however does not mean low income earners can’t invest. Through the various types of collective investment schemes and structured products, individuals can gain access to various securities such as bank deposits, treasury bills, bonds and equities, given the relatively lower initial investment requirement. Furthermore, it means they have to put in more effort in prioritizing their needs to achieve a reasonable disposable income; and,
- Number of Dependents: People with few dependents have the freedom to make riskier investment decisions as compared to those with many people depending on their income.
- Goal Setting: In this step, one should outline their future financial targets. An individual could have multiple goals, some long-term and others short-term. These different goals will influence the path one takes towards achievement of their financial objective. Your financial planning goals should be measurable and achievable by one or a combination of the following four practices:
-
- Saving: It entails setting aside part of your income in an account. Efficient saving requires discipline, and here are a few tips to guide you. Firstly, save with a goal. Secondly, save first, and then spend what you have left. Thirdly, don’t just save, invest;
- Investing -There are different asset classes that one can consider. An investor will be drawn to a different channel based on their risk appetite, the returns expected and the liquidity requirement. The most common asset classes include:
-
-
- Equities: They represent ownership interest in a company. They are considered as traditional investments that are relatively liquid, highly volatile and are therefore considered risky. They are suitable for long term investors and offer returns in form of dividends and capital appreciation,
- Fixed Income: These are securities that offer fixed returns to investors. They are also considered as traditional investments that are moderately liquid, have low volatility and are therefore considered less risky. They are suitable for medium term investors and offer returns in form of interest income and capital appreciation. They include deposits, bonds and commercial papers,
- Real Estate: This involves investment in property and land. Real Estate is considered as an alternative investment that is illiquid, relatively stable and uncorrelated to traditional investments. They are suitable for long-term investment plans, which makes them a risky investment. Real Estate offers returns in form of rental yield and price appreciation, and,
- Private Equity: Private equity involves investing in a young, private company looking for growth capital. They are suitable for high net worth individuals with a long-term investment plan, which makes them a risky investment. Private Equity offers returns in form of dividend and capital appreciation.
-
As you invest, it is important to diversify one’s portfolio. This means that you invest in different instruments so as to spread your risks across them.
-
- Debt and Debt Management - Is debt good or not? Debt is only good if you are borrowing for investment or for future financial gain such as business, education, or property. Here are a few do’s and don’ts for debt management;
-
-
- You should never use more than 1/3 of your net income in loan repayment,
- Never borrow for things you desire but don’t need,
- Avoid borrowing on consumption items, and
- Live within your means.
- Budgeting - Lastly, is the discipline to budget around the resources we have. As you budget, give priority to necessary expenses and try as much as possible to cut down on discretionary expenses.
-
- Plan Creation and Execution: The financial plan details how to accomplish the goals identified in the step above, the time it may take to achieve each, and the best step to take towards achieving it. Execution refers to putting the created plan to action. A well laid out plan should highlight the following items:
-
- Suitable channels and investment instruments that will assist you in achieving your goals: This involves making decisions on the best ways to attain your financial targets. This may be through saving, proper budgeting, cutting on expenses, and through investing, and,
- Timelines: This will indicate how long you are willing to invest in a given investment instrument. Long-term investments may be most suitable for long-term goals. This is because, long-term investments offer higher returns, and long-term goals often have higher cash requirements.
- Monitoring and Reassessment: A financial plan needs to be monitored for possible adjustments or reassessments. A review allows you to analyze your individual investments and determine if they are worth keeping. The following factors should prompt one to make changes on their financial plan during a review:
-
- Status of Set Goals: Determine whether your pre-determined goals have been achieved or not and whether or not the unachieved goals are still achievable, given the present circumstances,
- Change in income: Any significant adjustment in income would directly impact your financial plan and may lead to early maturity or a delay of set goals and therefore affect the set timelines,
- Number of dependents: A change in number of dependents may mean that one has more or less disposable income to put into investments or vice versa, and,
- Change in Risk Appetite and Risk Tolerance: An individual’s risk appetite and risk tolerance may change as one progresses with life. Age, change in income and a change in number of dependents are the factors likely to affect one’s risk appetite and tolerance levels.
Section III: The Key Considerations to Make
The investment considerations to be made will to a large extent depend on one’s individual risk tolerance and appetite, which depends on the age and the level of income. The table below summarizes the investment allocation depending on the highlighted factors.
|
Investors Age |
Expected Risk Profile |
Income Level |
Skew investments towards |
Reasoning |
|
Below 25 |
High |
Starting up so not high |
Real Estate and Equities |
Has a long investment horizon to withstand volatility and get enhanced returns |
|
25- 35 |
High |
Medium to high |
Real Estate and Equities |
Few cash flow requirements. Still has time to withstand volatility |
|
35-45 |
Medium |
Medium to high |
Real Estate, Equities and Fixed Income |
There are constant cash flow obligations. Still has time to withstand medium volatility |
|
45-60 |
Medium |
Medium to high (Generating income from prior investments) |
Real Estate, Equities and Fixed Income |
There are constant cash flow obligations. Still has time to withstand volatility |
|
Above 60 |
Low |
Low or non-existent |
REITS and Fixed Income |
Stability of income is key |
Section IV: Conclusion
If for nothing else, personal financial planning is important for an individual’s present and future financial stability. Ultimately, with properly planned finances, peace of mind is almost guaranteed. Similar to medical planning, financial planning is important for the following reasons:
- Defining Financial Goals – Most people spend their time planning on how they wish to purchase a plot or a car or even that well deserved holiday. Having a financial plan allows you to identify your financial goals as opposed to focusing on “side-shows”. Thus one is able to focus on execution which ultimately increases the chances of realizing their goals,
- Income Management – When you have a defined plan, it is easier to manage your income through budgeting and prioritizing spending. It also helps you to pick out wasteful expenditures and adapt quickly when your financial situation changes,
- Measuring Progress – Once you have a plan in place, it is easy to track your progress towards your financial goals. It instills discipline when it comes to maintaining set targets & goals,
- Financial Understanding – By taking time to plan your financials, you get to understand better and take control of your financial lifestyle,
- Asset-Liability Management – through financial planning, one is able to distinguish the real value of an asset since some of them come with liabilities attached to it. For example; buying a car that needs to be serviced every 3-months, needs to fueled and requires an insurance cover in case of accidents,
- Emergencies – through planning you are able to set aside an investment with high liquidity such as a money market fund or bank deposit, which will act as a safety net during times of emergency, and,
- Comfortable Retirement- In order to enjoy your retirement years, one needs a stable source of income and given that formal employment is no longer an option, it is important to sign up to a registered Retirement Benefits Scheme and make regular contributions in your employed years. Aside from reducing poverty in old age, some of the benefits of saving through a retirement benefits scheme include:
- Provision of regular income to replace earnings in retirement, and,
- Provision of lump sum benefit income for surviving dependents in the event of your passing.
Disclaimer: The views expressed in this publication are those of the writers where particulars are not warranted. This publication is meant for general information only and is not a warranty, representation, advice or solicitation of any nature. Readers are advised in all circumstances to seek the advice of a registered investment advisor

- Talk to us
- Kenya
- P.O Box 20695 - 00200, Nairobi, Kenya
- Cell +254709101200
- Tel +254709101200
- WhatsApp +254741676635
- United States
- +254709101200
- DOWNLOAD OUR APP
-


- Kenya
- 8th Floor, Pinetree Plaza, Kaburu Drive, Ngong Road, Nairobi, Kenya
- USA
- Suite 1150, 1775 Eye Street NW, USA, Washington DC 20006, USA
- Investments
- High Yield
- Private Equity
- Real Estate
- Real Estate
- RiverRun Estates
- Cytonn Towers
- The Ridge
- Taraji Heights
- The Alma