Cytonn Monthly – May 2024
By Research Team, Jun 2, 2024
Executive Summary
Fixed Income
During the month of May 2024, T-bills were oversubscribed, with the overall average oversubscription rate coming in at 153.3%, higher than the oversubscription rate of 129.6% recorded in April 2024. The overall average subscription rates for the 91-day and 182-day papers increased to 326.7% and 134.1%, from 231.9% and 78.0% respectively, while the overall average subscription rates for the 364-day paper decreased to 103.1% from 140.3%, which was recorded in April 2024. The average yields on the government papers decreased during the month, with the 364-day, 182-day, and 91-day papers yields decreasing by 5.8 bps, 13.2 bps, and 10.0 bps to 16.6%, 16.5%, and 15.9% respectively from 16.6%, 16.7%, and 16.0% recorded the previous month. For the month of May 2024, the government accepted a total of Kshs 178.0 bn of the Kshs 183.9 bn worth of bids received, translating to an acceptance rate of 96.8%;
Additionally, May 2024 bonds were undersubscribed, with the overall undersubscription rate coming in at 53.7%, lower than the oversubscription rate of 146.1% recorded in April 2024. The reopened bond FXD1/2024/010 received bids worth Kshs 15.0 bn against the offered Kshs 25.0 bn translating to an undersubscription rate of 59.9%, with the government accepting bids worth Kshs 11.0 bn, translating to an acceptance rate of 73.4% and a coupon rate of 16.2%. Moreover, the tap sale issue for the FXD1/2024/010 received bids worth Kshs 7.1 bn against the offered Kshs 15.0 bn, translating to an undersubscription rate of 47.4%, with the government accepting bids worth Kshs 7.0 bn, translating to an acceptance rate of 98.8%;
This week, T-bills were oversubscribed for the fifth consecutive week, with the overall oversubscription rate coming in at 139.6%, higher than the oversubscription rate of 100.1% recorded the previous week. Investors’ preference for the shorter 91-day paper persisted, with the paper receiving bids worth Kshs 17.9 bn against the offered Kshs 4.0 bn, translating to an oversubscription rate of 446.6%, significantly higher than the oversubscription rate of 177.6% recorded the previous week. The subscription rate for the 182-day paper decreased to 91.7% from 116.5% while the subscription rate for the 364-day paper increased to 64.7% from the 52.8% recorded the previous week. The government accepted a total of Kshs 32.8 bn worth of bids out of Kshs 24.0 bn bids received, translating to an acceptance rate of 97.9%. The yields on the government papers were on an upward trajectory, with the yields on the 91-day, 182-day, and 364-day papers increasing by 0.9 bps, 4.4 bps, and 8.3 bps to 15.95%, 16.61%, and 16.71% from 15.94%, 16.56% and 16.62% respectively recorded the previous week;
In the primary bond market, the government is seeking to raise an additional Kshs 60.0 bn for budgetary support by issuing four fixed coupon treasury bonds concurrently, the re-opened FXD1/2023/02, FXD1/2024/03, FXD1/2023/05 and FXD1/2023/10, with a tenor to maturity of 1.2 years, 2.6 years, 4.1 years and 8.7 years, respectively and have their coupon rates set at 17.0%, 18.4%, 16.8% and 14.2% respectively. The bonds’ value dates will be 10th June 2024 for the FXD1/2023/03 and FXD1/2024/03 and 17th June 2024 for the FXD1/2023/05 and FXD1/2023/10, with maturity dates of 18th August 2025, 11th January 2027, 10th July 2028 and 31st January 2033 respectively; Given the bonds are trading at 16.7%%, 17.2%, 17.3% and 15.5% for theFXD1/2023/02, FXD1/2024/03, FXD1/2023/05 and FXD1/2023/10 respectively in the secondary bond market, we expect the bidding range to come in at 16.55% - 16.75%, 17.00% -17.35%, 16.90% - 17.30% and 15.45% - 15.65% respectively;
During the week, the Kenya National Bureau of Statistics (KNBS) released the year-on-year inflation, highlighting that the inflation in May 2024 increased marginally by 0.1% points to 5.1%, from the 5.0% recorded in April 2024. This was within our projections to within a range of 4.7% to 5.1%. The headline inflation in May 2024 was majorly driven by increase in prices of commodities in the following categories; transport, food and non-alcoholic beverages, and housing, water, electricity, gas, and other fuels by 8.1%, 6.2%, and 4.4%, respectively;
Equities
During the month of May 2024, the equities market was on an upward trajectory, with NASI gaining the most by 6.0%, while NSE 10, NSE 25, and NSE 20 gained by 5.3%, 3.9% and 1.9% respectively. The equities market performance was driven by gains recorded by large-cap stocks such as KCB Group, Safaricom, and Standard Chartered Group of 18.7%, 12.2%, and 11.3% respectively. The gains were, however, weighed down by losses recorded by large-cap stocks such as Bamburi, Stanbic Bank, and BAT of 14.2%, 12.2%, and 10.0% respectively;
During the week, the equities market recorded a mixed performance, with NSE 10, NSE 25, and NASI declining by 0.6%, 0.4%, and 0.1% respectively, while NSE 20 gained by 0.3%, taking the YTD performance to gains of 28.5%, 24.1%, 22.8% and 14.2% for NSE 10, NSE 25, NASI, and NSE 20 respectively. The equities market performance was driven by losses recorded by large-cap stocks such as Bamburi Cement, BAT, and DTB-K of 14.3%, 9.7%, and 8.2% respectively. The losses were, however, mitigated by gains recorded by large-cap stocks such as NCBA, ABSA bank, and Cooperative Bank of 2.3%, 1.9 and 1.5% respectively;
During the week, three more of the listed banks released their Q1’2024 results. Diamond Trust Bank released its Q1’2024 financial results, with its Core Earnings per Share (EPS) increasing by 11.0% to Kshs 10.5, from Kshs 9.5 in Q1’2023. ABSA Group released their Q1’2024 financial results, with its Core Earnings per Share (EPS) increasing by 33.6% to Kshs 1.1 bn, from Kshs 0.8 bn in Q1’2023. Lastly, Standard Chartered Bank also released their Q1’2024 financial results, with its Core Earnings per Share (EPS) increasing by 39.5% to Kshs 14.9, from Kshs 10.7 in Q1’2023;
Also, During the week, Jubilee Holdings Limited released their FY’2023 results. This marked the second time the company released its results under the new IFRS 17 reporting system. Jubilee’s Profit After Tax (PAT) decreased by 19.8% to Kshs 4.4 bn, from Kshs 5.5 bn recorded in FY’2022. The performance was mainly driven by an 11.1% increase in Insurance Services Expenses to Kshs 21.8 bn, from Kshs 19.6 bn in FY’2022, but was supported by the 8.0% increase in Insurance Services Revenue to Kshs 22.8 bn in FY’2023, from Kshs 21.1 bn in FY’2022;
Real Estate
During the week, the Kenya National Bureau of Statistics (KNBS) released the Leading Economic Indicators (LEI) February and March 2024 Reports, which highlighted the performance of major economic indicators;
In the REITs segment, property developer Acorn Holdings announced its decision to exercise the early redemption of its green bond, with an outstanding balance of Kshs 1.9 bn. The green bond, initially launched in 2019, successfully raised Kshs 5.7 bn through multiple transactions to develop Acorn's branded student hostels;
On the Unquoted Securities Platform, Acorn D-REIT and I-REIT traded at Kshs 24.5 and Kshs 22.0 per unit, respectively, as of 31st May 2024. The performance represented a 22.5% and 10.0% gain for the D-REIT and I-REIT, respectively, from the Kshs 20.0 inception price;
Investment Updates:
- Weekly Rates:
- Cytonn Money Market Fund closed the week at a yield of 17.67% p.a. To invest, dial *809# or download the Cytonn App from Google Play store here or from the Appstore here;
- We continue to offer Wealth Management Training every Monday, from 10:00 am to 12:00 pm. The training aims to grow financial literacy among the general public. To register for any of our Wealth Management Trainings, click here;
- If interested in our Private Wealth Management Training for your employees or investment group, please get in touch with us through wmt@cytonn.com;
- Cytonn Insurance Agency acts as an intermediary for those looking to secure their assets and loved ones’ future through insurance namely; Motor, Medical, Life, Property, WIBA, Credit and Fire and Burglary insurance covers. For assistance, get in touch with us through insuranceagency@cytonn.com;
- Cytonn Asset Managers Limited (CAML) continues to offer pension products to meet the needs of both individual clients who want to save for their retirement during their working years and Institutional clients that want to contribute on behalf of their employees to help them build their retirement pot. To more about our pension schemes, kindly get in touch with us through pensions@cytonn.com;
Real Estate Updates:
- For more information on Cytonn’s real estate developments, email us at sales@cytonn.com;
- Phase 3 of The Alma is now ready for occupation and the show house is open daily. To join the waiting list to rent, please email properties@cytonn.com;
- For Third Party Real Estate Consultancy Services, email us at rdo@cytonn.com;
- For recent news about the group, see our news section here;
Hospitality Updates:
- We currently have promotions for Staycations. Visit cysuites.com/offers for details or email us at sales@cysuites.com;
Money Markets, T-Bills Primary Auction:
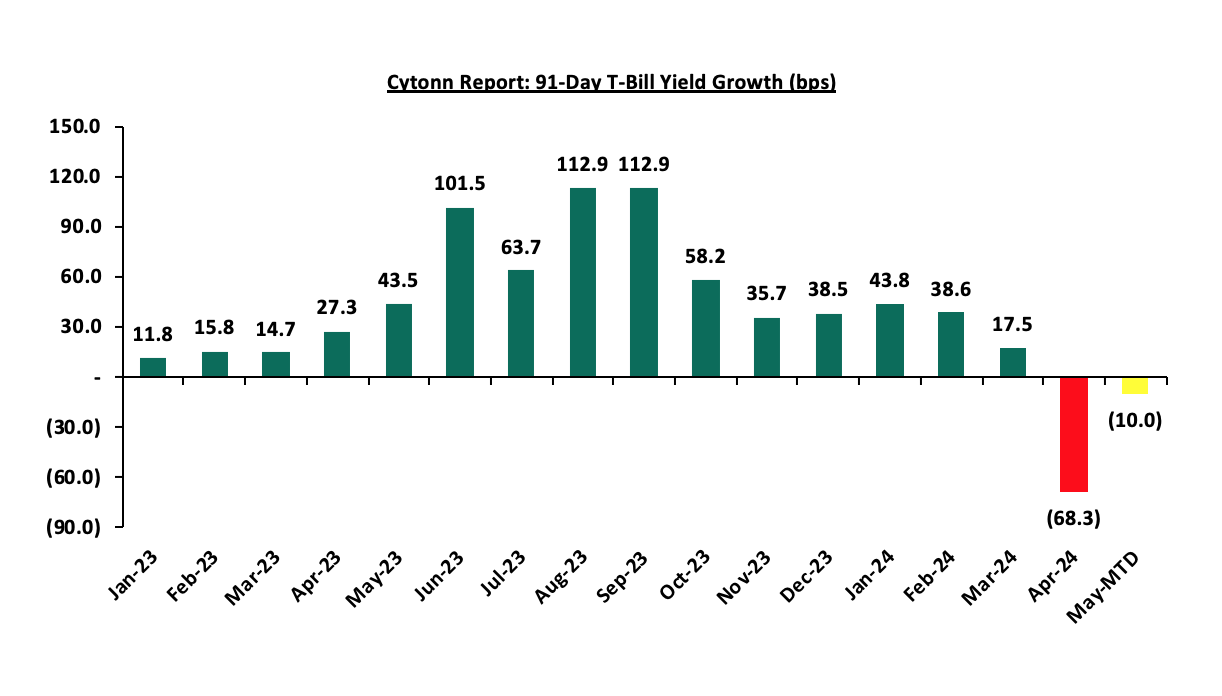
During the month of May 2024, T-bills were oversubscribed, with the overall average oversubscription rate coming in at 153.3%, higher than the oversubscription rate of 129.6% recorded in April 2024. The overall average subscription rates for the 91-day and 182-day papers increased to 326.7% and 134.1%, from 231.9% and 78.0% respectively, while the overall average subscription rates for the 364-day paper decreased to 103.1% from 140.3%, which was recorded in April 2024. The average yields on the government papers decreased during the month, with the 364-day, 182-day, and 91-day papers yields decreasing by 5.8 bps, 13.2 bps, and 10.0 bps to 16.6%, 16.5%, and 15.9% respectively from 16.6%, 16.7%, and 16.0% recorded the previous month. For the month of May, the government accepted a total of Kshs 178.0 bn of the Kshs 183.9 bn worth of bids received, translating to an acceptance rate of 96.8%. The chart below shows the yield growth rate for the 91-day paper during the year:
This week, T-bills were oversubscribed for the fifth consecutive week, with the overall oversubscription rate coming in at 139.6%, higher than the oversubscription rate of 100.1% recorded the previous week. Investors’ preference for the shorter 91-day paper persisted, with the paper receiving bids worth Kshs 17.9 bn against the offered Kshs 4.0 bn, translating to an oversubscription rate of 446.6%, significantly higher than the oversubscription rate of 177.6% recorded the previous week. The subscription rate for the 182-day paper decreased to 91.7% from 116.5% while the subscription rate for the 364-day paper increased to 64.7% from the 52.8% recorded the previous week. The government accepted a total of Kshs 32.8 bn worth of bids out of Kshs 24.0 bn bids received, translating to an acceptance rate of 97.9%. The yields on the government papers were on an upward trajectory, with the yields on the 91-day, 182-day, and 364-day papers increasing by 0.9 bps, 4.4 bps, and 8.3 bps to 15.95%, 16.61%, and 16.71% from 15.94%, 16.56% and 16.62% respectively recorded the previous week.
So far in the current FY’2023/24, government securities totalling Kshs 1,762.0 bn have been advertised. The government has accepted bids worth Kshs 2,107.5 bn, of which Kshs 1,403.3bn and Kshs 704.1 bn were treasury bills and bonds, respectively. Total redemptions so far in FY’2023/24 equal to Kshs 1,642.5 bn, with treasury bills accounting for Kshs 1,485.3 bn and bonds accounting for Kshs 39.2 bn. As a result, the government has a domestic borrowing surplus of Kshs 464.9 bn in FY’2023/24.
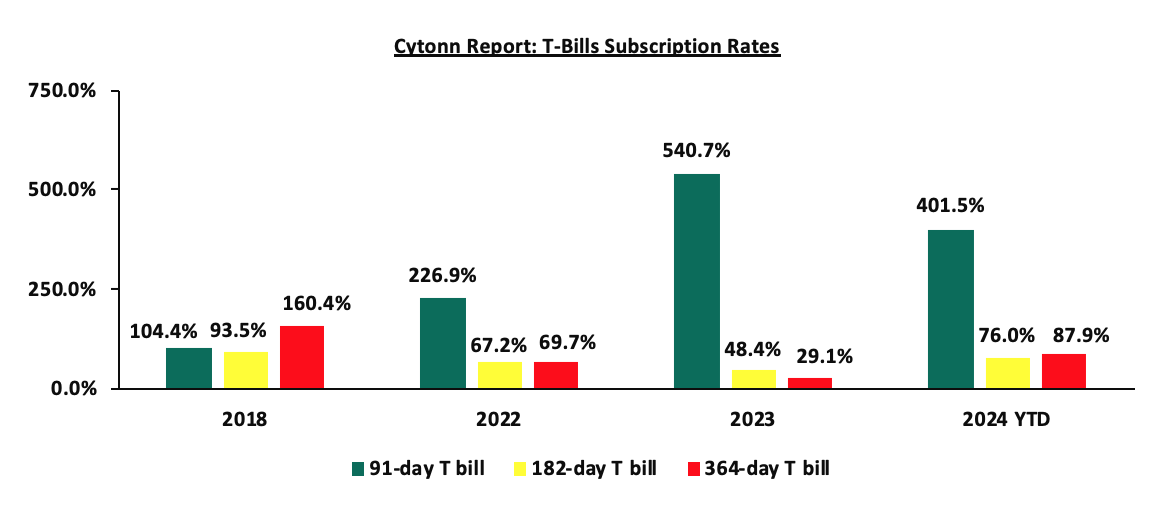
The chart below compares the overall average T-bill subscription rates obtained in 2018, 2022, 2023, and 2024 Year to Date (YTD):
Additionally, May 2024 bonds were undersubscribed, with the overall undersubscription rate coming in at 53.7%, lower than the oversubscription rate of 146.1% recorded in April 2024. The reopened bond FXD1/2024/010 received bids worth Kshs 15.0 bn against the offered Kshs 25.0 bn translating to an undersubscription rate of 59.9%, with the government accepting bids worth Kshs 11.0 bn, translating to an acceptance rate of 73.4% and a coupon rate of 16.2%. Moreover, the tap sale issue for the FXD1/2024/010 received bids worth Kshs 7.1 bn against the offered Kshs 15.0 bn, translating to an undersubscription rate of 47.4%, with the government accepting bids worth Kshs 7.0 bn, translating to an acceptance rate of 98.8%.
|
Cytonn Report: T-Bond Issues in March, April and May 2024 |
|||||||||
|
Issue Date |
Bond Auctioned |
Effective Tenor to Maturity (Years) |
Coupon |
Amount Offered (Kshs bn) |
Actual Amount Raised/Accepted (Kshs bn) |
Total bids received (Subscription) |
Average Accepted Yield |
Subscription Rate |
Acceptance Rate |
|
11/3/2024 |
FXD1/2024/003 |
2.8 |
18.4% |
40.0 |
34.3 |
43.1 |
18.4% |
107.7% |
79.6% |
|
25/3/2024 |
FXD1/2023/005-Re-opened |
4.3 |
16.8% |
40.0 |
17.8 |
35.8 |
18.4% |
89.6% |
49.6% |
|
FXD1/2024/010-New |
10.0 |
16.0% |
4.8 |
23.9 |
16.5% |
59.7% |
20.3% |
||
|
4/4/2024 |
FXD1/2023/005 – Tapsale |
4.5 |
16.8% |
25.0 |
45.8 |
47.8 |
18.4% |
191.2% |
95.9% |
|
FXD1/2024/010 – Tapsale |
10.0 |
16.0% |
16.5% |
||||||
|
22/4/2024 |
FXD1/2023/002-Reopened |
1.4 |
17.0% |
40.0 |
34.8 |
47.2 |
17.0% |
118.0% |
73.7% |
|
06/05/2024 |
FXD1/2024/010-Re-opened |
9.9 |
16.0% |
25.0 |
11.0 |
15.0 |
16.2% |
59.9% |
73.4% |
|
13/05/2024 |
FXD1/2024/010-Tapsale |
9.9 |
16.0% |
15.0 |
7.0 |
7.1 |
16.2% |
47.4% |
98.8% |
|
May 2024 Average |
|
9.9 |
16.0% |
20.0 |
9.0 |
11.0 |
16.2% |
53.7% |
86.1% |
|
Apr 2024 Average |
5.3 |
16.6% |
65.0 |
80.6 |
95.0 |
17.3% |
146.1% |
84.9% |
|
|
2023 Average |
|
6.1 |
14.8% |
740.3 |
735.2 |
872.4 |
15.5% |
117.8% |
82.0% |
Source: Central Bank of Kenya (CBK)
In the primary bond market, the government is seeking to raise an additional Kshs 60.0 bn for budgetary support by issuing four fixed coupon treasury bonds concurrently, the re-opened FXD1/2023/02, FXD1/2024/03, FXD1/2023/05 and FXD1/2023/10, with a tenor to maturity of 1.2 years, 2.6 years, 4.1 years and 8.7 years, respectively and have their coupon rates set at 17.0%, 18.4%, 16.8% and 14.2% respectively. The bonds’ value dates will be 10th June 2024 for the FXD1/2023/03 and FXD1/2024/03 and 17th June 2024 for the FXD1/2023/05 and FXD1/2023/10, with maturity dates of 18th August 2025, 11th January 2027, 10th July 2028 and 31st January 2033 respectively; Given the bonds are trading at 16.7%%, 17.2%, 17.3% and 15.5% for theFXD1/2023/02, FXD1/2024/03, FXD1/2023/05, and FXD1/2023/10 respectively in the secondary bond market, we expect the bidding range to come in at 16.55% - 16.75%, 17.00% -17.35%, 16.90% - 17.30% and 15.45% - 15.65% respectively.
Secondary Bond Market:
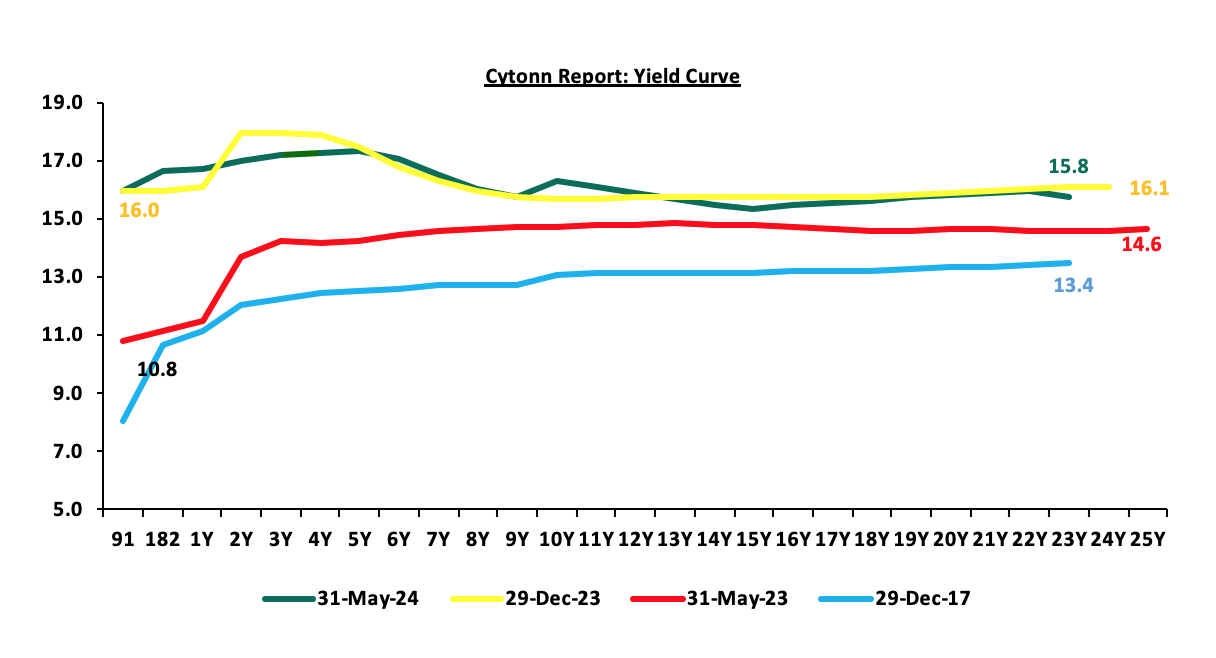
The yields on the government securities were on an upward trajectory during the month compared to the same period in 2023. We observe a humped yield curve for the medium-term bonds in the 3 to 10-year maturity range, an indication of the prevailing uncertainty in the market regarding both medium-term interest rates and inflation. Investors, apprehensive about the economic outlook in the near to medium term, are demanding higher yields for bonds in the 3 to 10-year maturity range to compensate for the perceived risks as they anticipate potential fluctuations in economic conditions in the Kenyan market on the back of the government’s debt sustainability concerns. The chart below shows the yield curve movement during the period:
The secondary bond turnover increased by 29.8% to Kshs 119.5 bn, from Kshs 92.1 bn recorded in April 2024, pointing towards increased activities by commercial banks in the secondary bonds market for the month of May. Similarly, on a year-on-year basis, the bond turnover increased significantly by 78.0% from Kshs 68.0 bn worth of treasury bonds transacted over a similar period last year.
Money Market Performance:
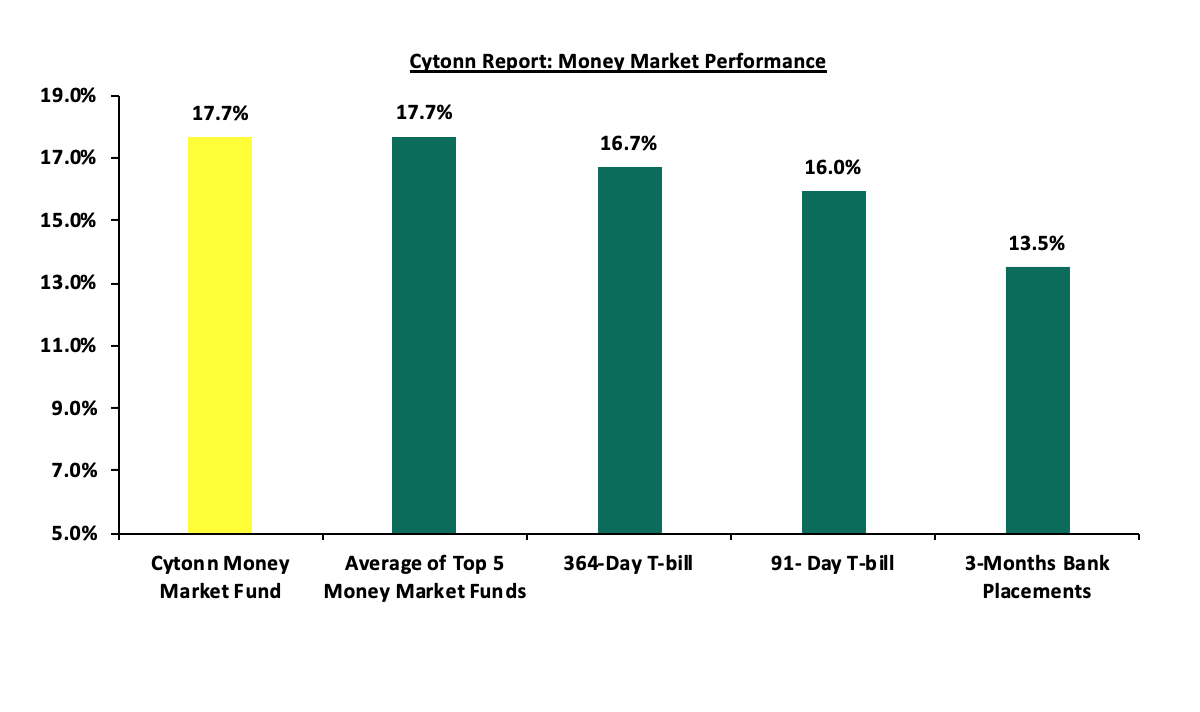
In the money markets, 3-month bank placements ended the week at 13.5% (based on what we have been offered by various banks), while the yield on the 364-day and 91-day papers increased by 8.3 bps and 0.9 bps to 16.7% and 16.0% respectively, from 16.6% and 15.9% respectively recorded the previous week. The yield of Cytonn Money Market Fund remained unchanged to close the week at 17.7% recorded the previous week, and the average yields on the Top 5 Money Market Funds increased by 4.8 bps to 17.7% from 17.6% recorded the previous week
The table below shows the Money Market Fund Yields for Kenyan Fund Managers as published on 31st May 2024:
|
Cytonn Report: Money Market Fund Yield for Fund Managers as published on 31st May 2024 |
||
|
Rank |
Fund Manager |
Effective Annual |
|
1 |
Lofty-Corban Money Market Fund |
18.3% |
|
2 |
Etica Money Market Fund |
18.1% |
|
3 |
Cytonn Money Market Fund (Dial *809# or download the Cytonn app) |
17.7% |
|
4 |
Kuza Money Market fund |
17.5% |
|
5 |
GenAfrica Money Market Fund |
16.9% |
|
6 |
Nabo Africa Money Market Fund |
16.3% |
|
7 |
Apollo Money Market Fund |
16.1% |
|
8 |
Enwealth Money Market Fund |
16.0% |
|
9 |
Madison Money Market Fund |
15.6% |
|
10 |
Jubilee Money Market Fund |
15.4% |
|
11 |
KCB Money Market Fund |
15.4% |
|
12 |
Co-op Money Market Fund |
15.3% |
|
13 |
GenCap Hela Imara Money Market Fund |
15.3% |
|
14 |
Absa Shilling Money Market Fund |
15.2% |
|
15 |
Mali Money Market Fund |
15.2% |
|
16 |
Sanlam Money Market Fund |
15.1% |
|
17 |
Mayfair Money Market Fund |
14.9% |
|
18 |
AA Kenya Shillings Fund |
14.8% |
|
19 |
Equity Money Market Fund |
14.7% |
|
20 |
Dry Associates Money Market Fund |
13.8% |
|
21 |
Old Mutual Money Market Fund |
13.5% |
|
22 |
Orient Kasha Money Market Fund |
13.3% |
|
23 |
CIC Money Market Fund |
13.2% |
|
24 |
ICEA Lion Money Market Fund |
12.3% |
|
25 |
British-American Money Market Fund |
9.4% |
Source: Business Daily
Liquidity:
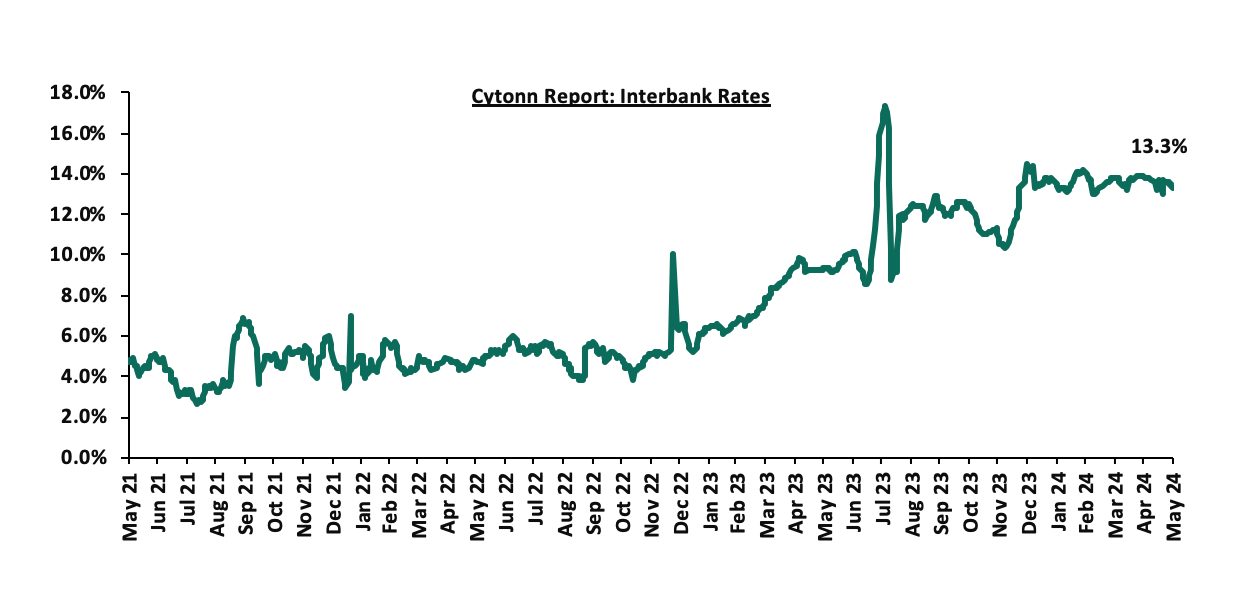
Liquidity in the money markets eased in the month of May 2024, with the average interbank rate decreasing by 13.7 bps to 13.6% from 13.7% recorded the previous month. During the month of May, the average interbank volumes traded decreased by 10.6% to Kshs 20.0 bn, from Kshs 22.4 bn recorded in April. Also, during the week, liquidity in the money markets marginally eased, with the average interbank rate decreasing by 2.9 bps to remain relatively unchanged from 13.5% recorded the previous week, partly attributable to government payments that offset tax remittances. The average interbank volumes traded decreased by 20.9% to Kshs 17.4bn, from Kshs 22.1 bn recorded the previous week. The chart below shows the interbank rates in the market over the years:
Kenya Eurobonds:
During the month, the yields on the Eurobonds recorded mixed performance, with the yield on the 30-year Eurobond issued in 2018 increasing the most by 8.6 bps to 10.1% from 10.0%, while the yield on the 12-year Eurobond issued in 2019 decreased by 4.1 bps to remain relatively at 9.8% recorded at the end of May 2024. Also, during the week, the yields on Eurobonds were on an upward trajectory, with the yields on the 7-year Eurobond issued in 2019 increasing the most by 53.0 bps to 9.1% from 8.5% recorded the previous week. The table below shows the summary of the performance of the Kenyan Eurobonds as of 23rd May 2024;
|
Cytonn Report: Kenya Eurobonds Performance |
||||||
|
|
2018 |
2019 |
2021 |
2024 |
||
|
Tenor |
10-year issue |
30-year issue |
7-year issue |
12-year issue |
13-year issue |
7-year issue |
|
Amount Issued (USD) |
1.0 bn |
1.0 bn |
0.9 bn |
1.2 bn |
1.0 bn |
1.5 bn |
|
Years to Maturity |
3.8 |
23.8 |
3.0 |
8.0 |
10.1 |
6.8 |
|
Yields at Issue |
7.3% |
8.3% |
7.0% |
7.9% |
6.2% |
10.4% |
|
1-Jan-24 |
9.8% |
10.2% |
10.1% |
9.9% |
9.5% |
|
|
30-Apr-24 |
9.1% |
10.0% |
9.1% |
9.8% |
9.8% |
9.7% |
|
17-May-24 |
8.8% |
9.8% |
8.5% |
9.4% |
9.4% |
9.4% |
|
20-May-24 |
8.8% |
9.8% |
8.6% |
9.4% |
9.5% |
9.4% |
|
21-May-24 |
9.0% |
9.9% |
8.7% |
9.5% |
9.6% |
9.5% |
|
22-May-24 |
9.0% |
10.0% |
8.8% |
9.6% |
9.7% |
9.6% |
|
23-May-24 |
9.2% |
10.1% |
9.1% |
9.8% |
9.8% |
9.8% |
|
Weekly Change |
0.4% |
0.3% |
0.5% |
0.4% |
0.4% |
0.4% |
|
MTM Change |
0.1% |
0.1% |
0.0% |
(0.0%) |
0.0% |
0.0% |
|
YTD Change |
(0.7%) |
(0.1%) |
(1.0%) |
(0.1%) |
0.3% |
- |
Source: Central Bank of Kenya (CBK) and National Treasury
Kenya Shilling:
During the month, the Kenya Shilling gained by 2.3% against the US Dollar, to close the month at Kshs 130.2, from Kshs 133.3 recorded at the end of April 2024. Also, during the week, the Kenya Shilling gained by 1.1% against the US Dollar to close at Kshs 130.2 from the Kshs 131.7 recorded the previous week. On a year-to-date basis, the shilling has appreciated by 17.0% against the US Dollar, a sharp contrast to the 26.8% depreciation recorded in 2023.
We expect the shilling to be supported by:
- Diaspora remittances standing at a cumulative USD 4,457.5 mn in the 12 months to April 2024, 11.9% higher than the USD 3,984.9 mn recorded over the same period in 2023, which has continued to cushion the shilling against further depreciation. In the April 2024 diaspora remittances figures, North America remained the largest source of remittances to Kenya accounting for 54.0% in the period, and,
- The tourism inflow receipts which came in at USD 352.5 bn in 2023, a 31.5% increase from USD 268.1 bn inflow receipts recorded in 2022, and owing to tourist arrivals that improved by 27.6% to 182,000 in the 12 months to January 2024, from 151,000 recorded during a similar period in 2023.
The shilling is however expected to remain under pressure in 2024 as a result of:
- An ever-present current account deficit which came at 4.0% of GDP in FY’2023 from 5.1% recorded in FY’2022,
- The need for government debt servicing, continues to put pressure on forex reserves given that 67.3% of Kenya’s external debt was US Dollar denominated as of December 2023, and,
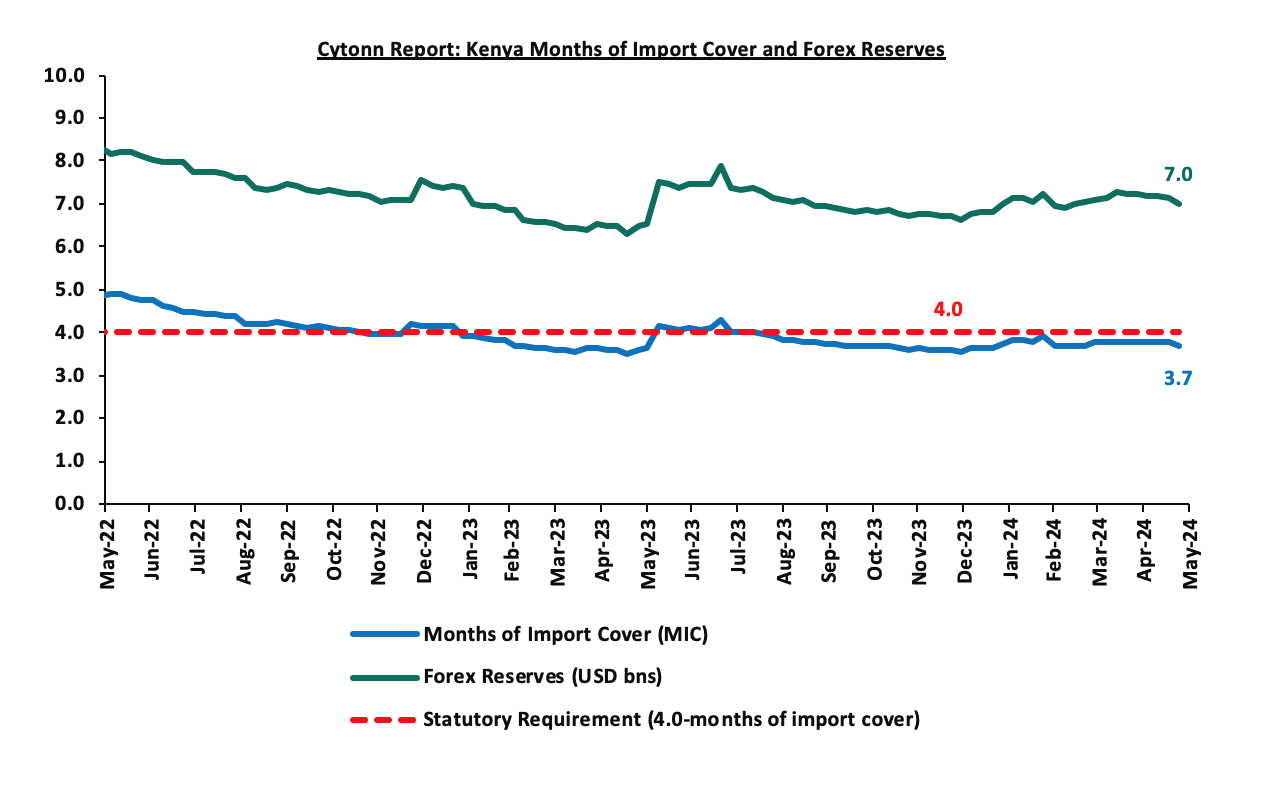
- Dwindling forex reserves, currently at USD 7.0 mn (equivalent to 3.7 months of import cover), which is below the statutory requirement of maintaining at least 4.0 months of import cover.
Key to note, During the month of May 2024, Kenya’s forex reserves decreased by 3.4% to USD 7.0 bn from USD 7.2 bn recorded at the end of April 2024. Also, Kenya’s forex reserves decreased by 2.0% during the week to USD 7.0 b from USD 7.1 bn recorded the previous week, equivalent to 3.7 months of import cover down from 3.8 recorded the previous week, and remained below the statutory requirement of maintaining at least 4.0-months of import cover.
The chart below summarizes the evolution of Kenya's months of import cover over the years:
Weekly Highlights:
- May 2024 Inflation Highlight
The y/y inflation in May 2024 increased marginally by 0.1% points to 5.1%, from the 5.0% recorded in April 2024. This was within our projections to within a range of 4.7% to 5.1%. The headline inflation in May 2024 was majorly driven by increase in prices of commodities in the following categories; transport, food and non-alcoholic beverages, and housing, water, electricity, gas and other fuels by 8.1%, 6.2% and 4.4%, respectively. The table below shows a summary of both the year on year and month on month commodity indices performance:
|
Cytonn Report: Major Inflation Changes – 2024 |
|||
|
Broad Commodity Group |
Price change m/m (May-2024/April -2024) |
Price change y/y (May-2024/May -2023) |
Reason |
|
Transport |
0.2% |
8.1% |
The m/m increase in transport Index was recorded despite the decline in the prices of a litre of petrol and diesel by 0.5% and 0.7%, respectively |
|
Food and non-alcoholic beverages |
2.0% |
6.2% |
The m/m increase was mainly driven by the increase in prices of commodities such as spinach, Sukuma wiki, tomatoes and potatoes (Irish) by 18.2%, 15.0%, 14.0% and 6.2%, respectively. However, the increase was weighed down by decrease in prices of maize flour-sifted, fortified maize flour, maize grain-loose and wheat flour-white by 3.2%, 2.3%, 1.6%, and 1.3%, respectively |
|
Housing, water, electricity, gas and other fuels |
1.2% |
4.4% |
The m/m performance was mainly driven by the increase in prices of Electricity of 200kWh and 50kWh by 6.9% and 5.5% respectively. However, the price of gas/LPG and kerosene dropped by 0.6% and 1.0% respectively |
|
Overall Inflation |
1.0% |
5.1% |
The m/m increase was mainly attributable to the 2.0% increase in food and alcoholic beverages |
Notably, May’s overall headline inflation was back on the rise after decreasing for three consecutive months to April 2024, however, it has remained within the Central Bank of Kenya (CBK) target range of 2.5% to 7.5% for the eleventh consecutive month. The increase in headline inflation in May 2024 comes despite the decline in the prices for Super Petrol, Diesel, and Kerosene which decreased by Kshs 1.0, Kshs 1.2, and Kshs 1.3 each respectively, and will retail at Kshs 192.8, Kshs 179.2 and Kshs 168.7 per litre respectively, for the period between 15th May 2024 to 14th June 2024. The chart below shows the inflation rates for the past 5 years:
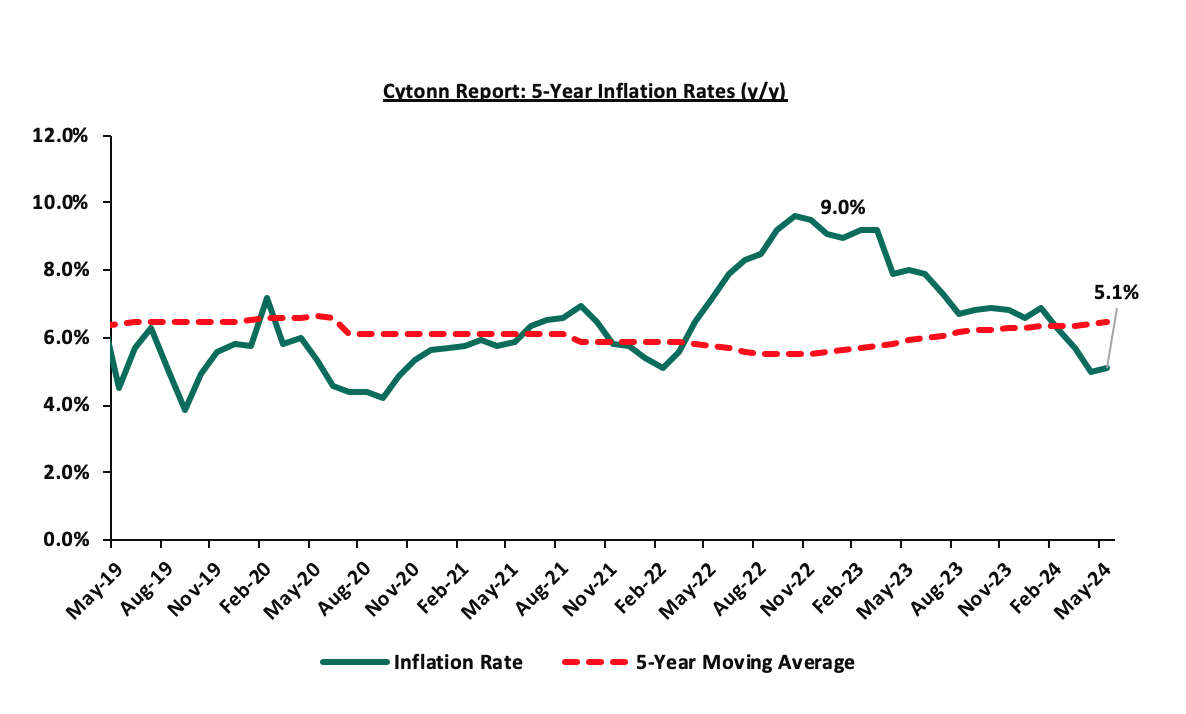
Going forward, we expect inflation to remain within the CBK’s preferred range of 2.5%-7.5%, mainly on the back of a strengthened currency, tight monetary policy, reduced fuel prices and reduced electricity prices. The risk, however, lies in the fuel prices which despite their decline in May 2024, still remain elevated compared to historical levels, coupled with an upwards trend in international fuel prices, owing to geo-political pressures. Key to note is that the Monetary Policy Committee maintained the Central Bank Rate at 13.0% in April 2024, with the aim of anchoring the inflation rate, and is expected to meet again on 5th June 2024. In our view, the rate will be pegged on whether the shilling will sustain its appreciation against the dollar, resulting in a decline in the import bill and costs passed to consumers through hiked consumer prices.
Monthly Highlights:
- During the month, Stanbic Bank released its monthly Purchasing Manager's Index (PMI) highlighting that the index for the month of April 2024 improved slightly, coming in at 50.1, fractionally above the 50.0 neutral, up from 49.7 in March 2024, signalling a modest and softer improvement in operating conditions across Kenya. Please see our Cytonn Weekly 19/2024,
- During the month, the Energy and Petroleum Regulatory Authority (EPRA) released their monthly statement on the maximum retail fuel prices in Kenya, effective from 15th May 2024 to 14th June 2024. Notably, the maximum allowed price for Super Petrol, Diesel and Kerosene decreased by Kshs 1.0, Kshs 1.2, and Kshs 1.3 each respectively, and will retail at Kshs 192.8, Kshs 179.2 and Kshs 168.7 per litre respectively from the April 2024 prices of Kshs 193.8, Kshs 180.4 and Kshs 170.0 respectively. Please see our Cytonn Weekly 20/2024,
- Also, during the month, the National Treasury gazetted the revenue and net expenditures for the tenth month of FY’2023/2024, ending 30th April 2024, highlighting that the total revenue collected as at the end of April 2024 amounted to Kshs 1,830.0 bn, equivalent to 71.0% of the revised estimates of Kshs 2,576.8 bn for FY’2023/2024 and is 85.2% of the prorated estimates of Kshs 2,147.3 bn. Please see our Cytonn Weekly 20/2024,
- During the week, the Kenya National Bureau of Statistics (KNBS) released the 2024 Economic Survey, highlighting that the Kenyan economy recorded a 5.6% growth in FY’2023, faster than the 4.9% growth recorded in FY’2022. The main contributor to Kenyan GDP remains to be the Agriculture, fishing and forestry sector which grew by 6.5% in FY’2023 compared to a contraction of 1.5% in FY’2022. All sectors in FY’2023, except Mining and Quarrying, recorded positive growths, with varying magnitudes across activities. Most sectors recorded improved growth compared to FY’2022, with Agriculture, Forestry and Fishing, Accommodation and Food Services and Real Estate Sectors recording the highest growth improvements of 7.9% points, 6.8% points, and 2.8% points, respectively. Please see our Cytonn Weekly 21/2024, and,
- During the week, the Kenya National Bureau of Statistics released the FY’2023 Economic Survey Report highlighting that Kenya’s balance of payments position improved by 46.4% in FY’2023, coming in at a deficit of Kshs 134.8 bn, from a deficit of Kshs 251.5 bn in FY’2022, and a slight deterioration from the Kshs 131.5 bn deficit recorded in Q3’2023. Please see our Cytonn Weekly 21/2024,
Rates in the Fixed Income market have been on an upward trend given the continued high demand for cash by the government and the occasional liquidity tightness in the money market. The government is 23.0% ahead of its prorated net domestic borrowing target of Kshs 377.9 bn, and 14.2% ahead of the total domestic net borrowing target of Kshs 407.0 bn for FY’2023/2024, having a net borrowing position of Kshs 464.9bn. However, we expect a downward readjustment of the yield curve in the short and medium term, with the government looking to increase its external borrowing to maintain the fiscal surplus, hence alleviating pressure in the domestic market. As such, we expect the yield curve to normalize in the medium to long-term and hence investors are expected to shift towards the long-term papers to lock in the high returns.
Market Performance:
During the month of May 2024, the equities market was on an upward trajectory, with NASI gaining the most by 6.0%, while NSE 10, NSE 25, and NSE 20 gained by 5.3%, 3.9% and 1.9% respectively. The equities market performance was driven by gains recorded by large-cap stocks such as KCB Group, Safaricom, and Standard Chartered Group of 18.7%, 12.2%, and 11.3% respectively. The gains were, however, weighed down by losses recorded by large-cap stocks such as Bamburi, Stanbic Bank, and BAT of 14.2%, 12.2%, and 10.0% respectively.
During the week, the equities market recorded a mixed performance, with NSE 10, NSE 25, and NASI declining by 0.6%, 0.4%, and 0.1% respectively, while NSE 20 gained by 0.3%, taking the YTD performance to gains of 28.5%, 24.1%, 22.8% and 14.2% for NSE 10, NSE 25, NASI, and NSE 20 respectively. The equities market performance was driven by losses recorded by large-cap stocks such as Bamburi Cement, BAT, and DTB-K of 14.3%, 9.7%, and 8.2% respectively. The losses were, however, mitigated by gains recorded by large-cap stocks such as NCBA, ABSA bank, and Cooperative Bank of 2.3%, 1.9, and 1.5% respectively.
Equities turnover significantly increased by 147.8% in the month of May 2024 to USD 138.2 mn, from USD 55.8 mn recorded in April 2024. Foreign investors remained net buyers, with a net buying position of USD 11.3 mn, from a net buying position of USD 8.0 mn recorded in April 2024.
During the week, equities turnover significantly increased by 421.4% to USD 88.3 mn from USD 16.9 mn recorded the previous week, taking the YTD total turnover to USD 307.9 mn. Foreign investors remained net buyers for the second consecutive week with a net buying position of USD 6.6 mn, from a net buying position of USD 4.2 mn recorded the previous week, taking the YTD foreign net buying position to USD 3.0 mn.
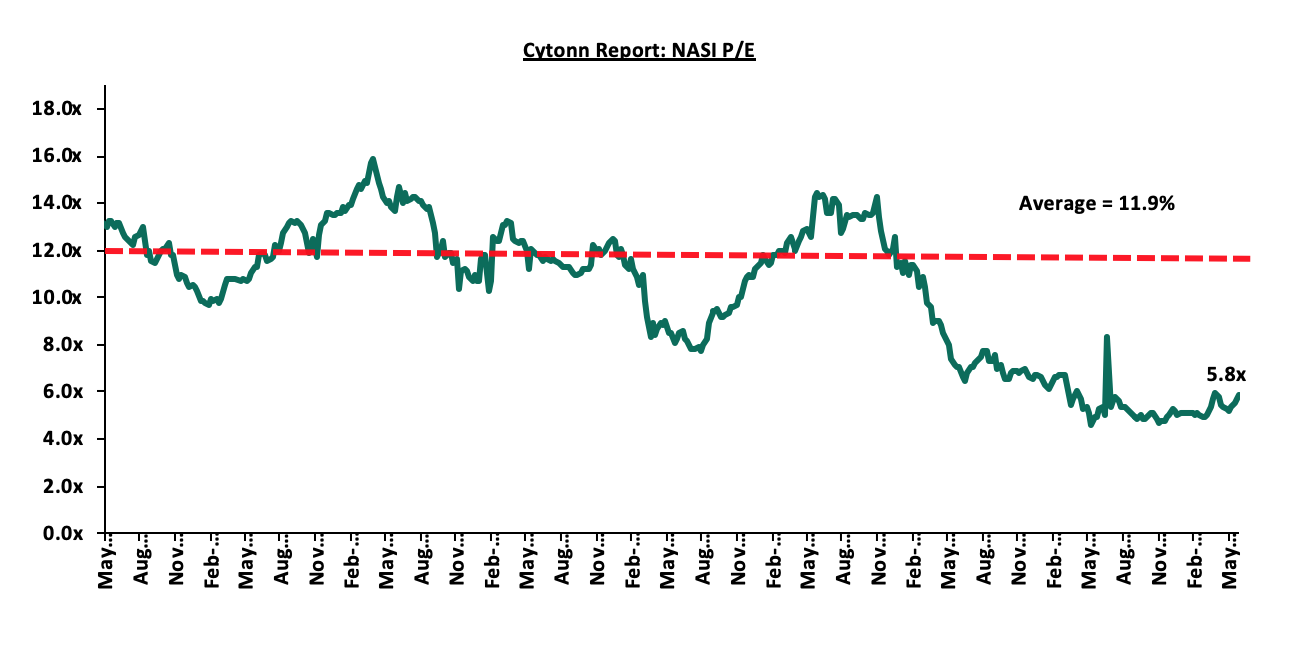
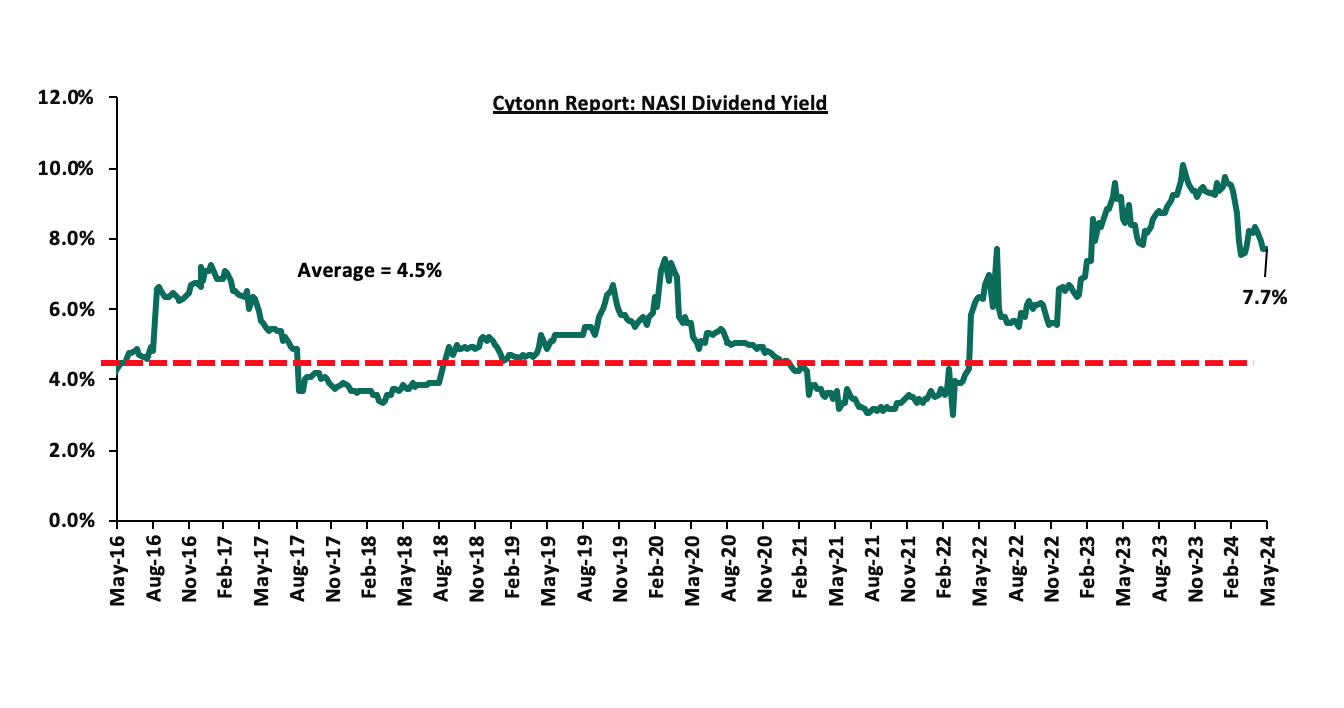
The market is currently trading at a price-to-earnings ratio (P/E) of 5.8x, 51.1% below the historical average of 11.9x. The dividend yield stands at 7.7%, 3.2% points above the historical average of 4.5%. Key to note, NASI’s PEG ratio currently stands at 0.8x, an indication that the market is undervalued relative to its future growth. A PEG ratio greater than 1.0x indicates the market is overvalued while a PEG ratio less than 1.0x indicates that the market is undervalued. The charts below indicate the historical P/E and dividend yields of the market;
Universe of Coverage:
|
Cytonn Report: Equities Universe of Coverage |
|||||||||||
|
Company |
Price as at 24/05/2024 |
Price as at 31/05/2024 |
w/w change |
m/m change |
YTD Change |
Year Open 2024 |
Target Price* |
Dividend Yield |
Upside/ Downside** |
P/TBv Multiple |
Recommendation |
|
Diamond Trust Bank*** |
50.0 |
45.9 |
(8.2%) |
(8.2%) |
2.6% |
44.8 |
65.2 |
10.9% |
52.9% |
0.2x |
Buy |
|
Equity Group*** |
46.5 |
43.5 |
(6.5%) |
2.2% |
27.2% |
34.2 |
60.2 |
9.2% |
47.6% |
0.9x |
Buy |
|
Stanbic Holdings |
108.8 |
110.3 |
1.4% |
(12.2%) |
4.0% |
106.0 |
145.3 |
13.9% |
45.7% |
0.7x |
Buy |
|
Jubilee Holdings |
184.8 |
189.0 |
2.3% |
(0.5%) |
2.2% |
185.0 |
260.7 |
7.6% |
45.5% |
0.3x |
Buy |
|
NCBA*** |
41.1 |
42.0 |
2.3% |
(5.2%) |
8.1% |
38.9 |
55.2 |
11.3% |
42.7% |
0.8x |
Buy |
|
Sanlam |
6.2 |
6.3 |
0.6% |
5.4% |
4.3% |
6.0 |
8.8 |
0.0% |
40.8% |
1.8x |
Buy |
|
Standard Chartered*** |
187.0 |
186.5 |
(0.3%) |
11.3% |
16.4% |
160.3 |
233.1 |
15.5% |
40.5% |
1.2x |
Buy |
|
Co-op Bank*** |
13.3 |
13.5 |
1.5% |
8.4% |
18.9% |
11.4 |
17.2 |
11.1% |
38.5% |
0.6x |
Buy |
|
ABSA Bank*** |
13.5 |
13.8 |
1.9% |
0.0% |
19.0% |
11.6 |
17.3 |
11.3% |
37.1% |
1.1x |
Buy |
|
Kenya Reinsurance |
2.0 |
2.4 |
19.5% |
23.8% |
29.2% |
1.9 |
3.0 |
8.4% |
33.9% |
0.2x |
Buy |
|
CIC Group |
2.2 |
2.2 |
0.9% |
(1.8%) |
(2.2%) |
2.3 |
2.8 |
5.8% |
30.8% |
0.7x |
Buy |
|
KCB Group*** |
35.2 |
35.6 |
1.1% |
18.7% |
62.0% |
22.0 |
45.7 |
0.0% |
28.4% |
0.5x |
Buy |
|
I&M Group*** |
18.6 |
20.3 |
9.2% |
10.4% |
16.0% |
17.5 |
22.5 |
12.6% |
23.7% |
0.4x |
Buy |
|
Britam |
5.4 |
5.7 |
5.5% |
5.5% |
11.3% |
5.1 |
7.0 |
0.0% |
22.4% |
0.8x |
Buy |
|
HF Group |
4.2 |
4.4 |
5.3% |
13.4% |
27.2% |
3.5 |
5.0 |
0.0% |
13.9% |
0.2x |
Accumulate |
|
Liberty Holdings |
5.6 |
5.8 |
3.6% |
2.5% |
50.3% |
3.9 |
6.1 |
6.4% |
11.6% |
0.4x |
Accumulate |
|
Target Price as per Cytonn Analyst estimates **Upside/ (Downside) is adjusted for Dividend Yield ***For Disclosure, these are stocks in which Cytonn and/or its affiliates are invested in |
|||||||||||
Monthly Highlights
- During the month, Stanbic Bank released their Q1’2024 financial results recording a 2.8% increase in Profit After Tax (PAT) to Kshs 4.0 bn, from Kshs 3.9 bn recorded in Q1’2023. The performance was mainly driven by a 19.6% increase in Net-Interest Income to Kshs 6.5 bn in Q1’2024, from Kshs 5.4 bn recorded in Q1’2023, but was weighed down by a 34.0% decrease in Non-Interest Income to Kshs 3.8 bn from Kshs 5.7 bn recorded in Q1’2023; For more details please see our Cytonn Weekly #19/2024,
- During the month, Safaricom released their FY’2024 financial results, recording a 16.8% increase in Earnings Before Interest, Taxes, Depreciation, and Amortization (EBITDA) to Kshs 163.3 bn, from Kshs 139.9 bn in FY’2023, while Profit After Tax (PAT) decreased by 18.7% to Kshs 42.7 bn, from Kshs 52.5 bn recorded in FY’2023. The performance was mainly driven by a 12.4% increase in total revenue to Kshs 349.4 bn in FY’2024, from Kshs 310.9 bn recorded in FY’2023. The performance was however weighed down by an 8.8% increase in operating costs to Kshs 186.2 bn in FY’2024, from Kshs 171.0 bn in FY’2023. For more details please see our Cytonn Weekly #19/2024,
- During the month, Co-operative Bank released their Q1’2024 Financial results, recording a 7.7% increase in Profit After Tax (PAT) to Kshs 6.6 bn, from Kshs 6.1 bn recorded in Q1’2023. The performance was mainly driven by an 8.6% increase in Net-Interest Income to Kshs 11.7 bn in Q1’2024, from Kshs 10.8 bn recorded in Q1’2023, but was weighed down by a marginal 0.3% decrease in Non-Interest Income to remain relatively unchanged at Kshs 7.1 bn recorded in Q1’2023, For more details please see our Cytonn Weekly #20/2024,
- Also, during the month, Equity Group released their Q1’2024 Financial results, recording a 25.2% increase in Profit After Tax (PAT) to Kshs 16.0 bn, from Kshs 12.8 bn recorded in Q1’2023. The performance was mainly driven by a 28.4% increase in net interest income to Kshs 27.8 bn in Q1’2024, from Kshs 21.7 bn recorded in Q1’2023, coupled with a 21.0% increase in net non-interest income to Kshs 22.2 bn, from Kshs 18.4 bn recorded in Q1’2023, For more details please see our Cytonn Weekly #20/2024,
- During the month, CIC Group released their FY’2023 results. This was the second time the company was releasing their results under the new IFRS 17 reporting system. CIC’s Profit After Tax (PAT) increased by 817.6% to Kshs 1.4 bn, from Kshs 0.2 bn recorded in FY’2022. The performance was mainly driven by a 22.5% increase in Insurance revenue to Kshs 25.4 bn, from Kshs 20.7 bn in FY’2022, but was weighed down by the 21.2% increase in Insurance Expenses to Kshs 22.5 bn in FY’2023, from Kshs 18.6 bn in FY’2022. For more details please see our Cytonn Weekly #17/2024 ,and,
- During the month, four more of the listed banks released their Q1’2024 results. KCB Group released its Q1’2024 financial results, with its Core Earnings per Share (EPS) increasing by 69.0% to Kshs 5.1, from Kshs 3.0 in Q1’2023. HF group released its Q1’2024 financial results, with its Core Earnings per Share (EPS) increasing by 80.4% to Kshs 0.4 bn, from Kshs 0.2 bn in Q1’2023. NCBA Group released its Q1’2024 financial results, with its Core Earnings per Share (EPS) increasing by 4.7% to Kshs 3.2, from Kshs 3.1 in Q1’2023. Lastly, I&M Group released its Q1’2024 financial results, with its Core Earnings per Share (EPS) increasing by 35.4% to Kshs 2.2, from Kshs 1.2 in Q1’2023. For more details please see our Cytonn Weekly #21/2024.
Earnings Release
- DTB-K Kenya Q1’2024 Financial Performance
During the week, DTB-K Bank released their Q1’2024 financial results. Below is a summary of the performance:
|
Balance Sheet Items |
Q1'2023 |
Q1'2024 |
y/y change |
|
Government Securities |
131.6 |
115.4 |
(12.4%) |
|
Net Loans and Advances |
270.4 |
268.9 |
(0.5%) |
|
Total Assets |
553.3 |
571.9 |
3.4% |
|
Customer Deposits |
404.6 |
425.2 |
5.1% |
|
Deposits per branch |
3.1 |
3.2 |
1.2% |
|
Total Liabilities |
470.8 |
490.5 |
4.2% |
|
Shareholders’ Funds |
72.9 |
71.9 |
(1.5%) |
|
Key Ratios |
Q1'2023 |
Q1'2024 |
% point change |
|
Loan to Deposit ratio |
66.8% |
63.3% |
(3.6%) |
|
Government Securities to Deposits ratio |
32.5% |
27.1% |
(5.4%) |
|
Return on Average Equity |
9.9% |
11.2% |
1.2% |
|
Return on Average Assets |
1.4% |
1.3% |
(0.1%) |
|
Income Statement |
Q1'2023 (Kshs bn) |
Q1'2024 (Kshs bn) |
y/y change |
|
Net interest Income |
6.7 |
7.1 |
6.2% |
|
Net non-interest income |
2.8 |
3.7 |
31.8% |
|
Total Operating income |
9.5 |
10.8 |
13.8% |
|
Loan loss provision |
1.4 |
1.5 |
13.1% |
|
Total Operating expenses |
5.9 |
6.8 |
16.4% |
|
Profit before tax |
3.6 |
4.0 |
9.2% |
|
Profit after tax |
2.6 |
2.9 |
11.0% |
|
Core EPS |
9.5 |
10.5 |
11.0% |
|
Income Statement Ratios |
Q1'2023 |
Q1'2024 |
y/y change |
|
Yield from interest-earning assets |
9.7% |
11.4% |
1.8% |
|
Cost of funding |
4.5% |
6.0% |
1.5% |
|
Net Interest Spread |
5.2% |
5.4% |
0.2% |
|
Net Interest Income as % of operating income |
70.4% |
65.7% |
(4.7%) |
|
Non-Funded Income as a % of operating income |
29.6% |
34.3% |
4.7% |
|
Cost to Income Ratio (CIR) |
61.7% |
63.1% |
1.4% |
|
CIR without provisions |
47.3% |
48.8% |
1.5% |
|
Cost to Assets |
4.7% |
5.7% |
1.0% |
|
Net Interest Margin |
5.4% |
5.7% |
0.3% |
|
Capital Adequacy Ratios |
Q1'2023 |
Q1'2024 |
% points change |
|
Core Capital/Total Liabilities |
21.1% |
18.6% |
(2.5%) |
|
Minimum Statutory ratio |
8.0% |
8.0% |
|
|
Excess |
13.1% |
10.6% |
(2.5%) |
|
Core Capital/Total Risk Weighted Assets |
19.3% |
17.4% |
(1.9%) |
|
Minimum Statutory ratio |
10.5% |
10.5% |
|
|
Excess |
8.8% |
6.9% |
(1.9%) |
|
Total Capital/Total Risk Weighted Assets |
20.2% |
18.2% |
(2.0%) |
|
Minimum Statutory ratio |
14.5% |
14.5% |
|
|
Excess |
5.7% |
3.7% |
(2.0%) |
|
Liquidity Ratio |
56.2% |
50.5% |
(5.7%) |
|
Minimum Statutory ratio |
20.0% |
20.0% |
|
|
Excess |
36.2% |
30.5% |
(5.7%) |
Key Take-Outs:
- Increased earnings - Core earnings per share (EPS) grew by 11.0% to Kshs 10.5, from Kshs 9.5 in Q1’2023, driven by the 13.8% increase in total operating income to Kshs 10.8 bn, from Kshs 9.5 bn in Q1’2023,
- Declined asset quality – The bank’s gross NPL ratio increased 14.9% in Q1’2024, from 12.3% in Q1’2023, attributable to 22.4% increase in Gross non-performing loans to Kshs 43.0 bn, from Kshs 35.1 bn in Q1’2023, which outpaced the 0.5% increase in gross loans to Kshs 287.9 bn, from Kshs 286.5 bn recorded in Q1’2023, and,
- Increased Provisioning - On the back of high credit risk still attached to the country despite the improvement in business environment in Q1’2024, the bank increased its provisions holdings to cover for the anticipated losses in the future, with its general provisions increasing by 23.6% to Kshs 18.3 bn in Q1’2024 from Kshs 14.8 bn in Q1’2023.
For a more detailed analysis, please see the DTB-K Bank’s Q1’2024 Earnings Note
- ABSA Bank Q1’2024 Financial Performance
During the week, ABSA Bank released their Q1’2024 financial results. Below is a summary of the performance:
|
Balance Sheet Items |
Q1’2023 |
Q1’2024 |
y/y change |
|
Government Securities |
87.0 |
68.6 |
(21.2%) |
|
Net Loans and Advances |
310.0 |
326.8 |
5.4% |
|
Total Assets |
514.6 |
497.7 |
(3.3%) |
|
Customer Deposits |
310.8 |
355.0 |
14.2% |
|
Deposits per branch |
4.1 |
4.3 |
5.8% |
|
Total Liabilities |
446.6 |
422.7 |
(5.4%) |
|
Shareholders’ Funds |
68.0 |
75.0 |
10.4% |
|
Balance Sheet Ratios |
Q1’2023 |
Q1’2024 |
% points change |
|
Loan to Deposit Ratio |
99.7% |
92.1% |
(7.6%) |
|
Government Securities to Deposit Ratio |
28.0% |
19.3% |
(8.7%) |
|
Return on average equity |
25.3% |
25.0% |
(0.3%) |
|
Return on average assets |
3.4% |
3.5% |
0.2% |
|
Income Statement |
Q1’2023 |
Q1’2024 |
y/y change |
|
Net Interest Income |
9.4 |
11.4 |
21.7% |
|
Net non-Interest Income |
4.5 |
5.1 |
12.7% |
|
Total Operating income |
13.9 |
16.5 |
18.8% |
|
Loan Loss provision |
(2.4) |
(2.4) |
0.1% |
|
Total Operating expenses |
(7.4) |
(8.0) |
7.3% |
|
Profit before tax |
6.4 |
8.5 |
32.0% |
|
Profit after tax |
4.5 |
5.9 |
33.6% |
|
Core EPS |
0.8 |
1.1 |
33.6% |
|
Income Statement Ratios |
Q1’2023 |
Q1’2024 |
% points change |
|
Yield from interest-earning assets |
10.6% |
13.4% |
2.8% |
|
Cost of funding |
3.1% |
4.7% |
1.6% |
|
Net Interest Spread |
0.9% |
1.3% |
0.4% |
|
Net Interest Margin |
8.3% |
9.7% |
1.3% |
|
Cost of Risk |
17.3% |
14.6% |
(2.7%) |
|
Net Interest Income as % of operating income |
67.5% |
69.2% |
1.7% |
|
Non-Funded Income as a % of operating income |
32.5% |
30.8% |
(1.7%) |
|
Cost to Income Ratio |
53.7% |
48.5% |
(5.2%) |
|
Cost to Income Ratio (without LLPs) |
36.3% |
33.9% |
(2.4%) |
|
Capital Adequacy Ratios |
Q1’2023 |
Q1’2024 |
% points change |
|
Core Capital/Total Liabilities |
18.6% |
18.0% |
(0.6%) |
|
Minimum Statutory ratio |
8.0% |
8.0% |
0.0% |
|
Excess |
10.6% |
10.0% |
(0.6%) |
|
Core Capital/Total Risk Weighted Assets |
14.1% |
14.2% |
0.1% |
|
Minimum Statutory ratio |
10.5% |
10.5% |
0.0% |
|
Excess |
3.6% |
3.7% |
0.1% |
|
Total Capital/Total Risk Weighted Assets |
18.1% |
17.9% |
(0.2%) |
|
Minimum Statutory ratio |
14.5% |
14.5% |
0.0% |
|
Excess |
3.6% |
3.4% |
(0.2%) |
|
Liquidity Ratio |
28.6% |
33.5% |
4.9% |
|
Minimum Statutory ratio |
20.0% |
20.0% |
0.0% |
|
Excess |
8.6% |
13.5% |
4.9% |
Key Take-Outs:
- Increased earnings - Core earnings per share (EPS) increased by 33.6% to Kshs 1.1, from Kshs 0.8 in Q1’2023, mainly driven by the 18.8% increase in total operating income to Kshs 16.5 bn, from Kshs 13.9 bn in Q1’2023 which outpaced the 7.3% increase in total operating expenses to Kshs 8.0 bn, from Kshs 7.4 bn in Q1’2023,
- Declined asset quality – The bank’s Gross NPL ratio increased to 11.1% in Q1’2024 from 9.4% in Q1’2023, attributable to 24.7% increase in Gross non-performing loans to Kshs 38.8 bn, from Kshs 31.1 bn in Q1’2023, compared to the 6.4% increase in gross loans to Kshs 351.0 bn, from Kshs 329.9 bn recorded in Q1’2023, and,
- Improved Lending – The bank’s loan book recorded an expansion of 5.4% to Kshs 326.8 bn, from Kshs 310.0 bn in Q1’2023.
For a more detailed analysis, please see the ABSA Bank’s Q1’2024 Earnings Note
- Standard Chartered Q1’2024 Financial Performance
During the week, Standard Chartered Bank released their Q1’2024 financial results. Below is a summary of the performance:
|
Balance Sheet Items |
Q1’2023 |
Q1’2024 |
y/y change |
|
Net Loans and advances |
137.1 |
153.6 |
12.0% |
|
Government Securities |
95.1 |
69.0 |
(27.5%) |
|
Total Assets |
388.6 |
391.3 |
0.7% |
|
Customer Deposits |
302.9 |
306.0 |
1.0% |
|
Deposits per branch |
8.4 |
9.6 |
13.6% |
|
Total Liabilities |
328.3 |
323.4 |
(1.5%) |
|
Shareholders’ Funds |
60.4 |
68.0 |
12.6% |
|
Balance Sheet Ratios |
Q1’2023 |
Q1’2024 |
% points change |
|
Loan to Deposit Ratio |
45.3% |
50.2% |
4.9% |
|
Government Securities to Deposit Ratio |
31.4% |
22.5% |
(8.8%) |
|
Return on average equity |
23.0% |
24.0% |
1.1% |
|
Return on average assets |
3.7% |
4.0% |
0.3% |
|
Income Statement |
Q1’2023 |
Q1’2024 |
y/y change |
|
Net Interest Income |
6.9 |
8.3 |
20.0% |
|
Net non-Interest Income |
3.9 |
4.8 |
23.9% |
|
Total Operating income |
10.8 |
13.1 |
21.4% |
|
Loan Loss provision |
0.8 |
0.5 |
(30.7%) |
|
Total Operating expenses |
5.1 |
5.4 |
6.0% |
|
Profit before tax |
5.6 |
7.6 |
35.4% |
|
Profit after tax |
4.0 |
5.6 |
39.5% |
|
Core EPS |
10.7 |
14.9 |
39.5% |
|
Income Statement Ratios |
Q1’2023 |
Q1’2024 |
% points change |
|
Yield from interest-earning assets |
8.3% |
9.6% |
1.4% |
|
Cost of funding |
1.1% |
1.2% |
0.1% |
|
Net Interest Spread |
7.1% |
8.5% |
1.3% |
|
Net Interest Margin |
7.3% |
8.6% |
1.4% |
|
Cost of Risk |
7.3% |
4.2% |
(3.2%) |
|
Net Interest Income as % of operating income |
64.1% |
63.3% |
(0.7%) |
|
Non-Funded Income as a % of operating income |
35.9% |
36.7% |
0.7% |
|
Cost to Income Ratio |
47.6% |
41.6% |
(6.1%) |
|
Cost to Income Ratio (without LLPs) |
40.3% |
37.4% |
(2.9%) |
|
Capital Adequacy Ratios |
Q1’2023 |
Q1’2024 |
% points change |
|
Core Capital/Total Liabilities |
15.1% |
17.6% |
2.6% |
|
Minimum Statutory ratio |
8.0% |
8.0% |
0.0% |
|
Excess |
7.1% |
9.6% |
2.6% |
|
Core Capital/Total Risk Weighted Assets |
16.0% |
18.4% |
2.4% |
|
Minimum Statutory ratio |
10.5% |
10.5% |
0.0% |
|
Excess |
5.5% |
7.9% |
2.4% |
|
Total Capital/Total Risk Weighted Assets |
17.5% |
18.5% |
0.9% |
|
Minimum Statutory ratio |
14.5% |
14.5% |
0.0% |
|
Excess |
3.0% |
4.0% |
0.9% |
|
Liquidity Ratio |
73.8% |
66.9% |
(6.8%) |
|
Minimum Statutory ratio |
20.0% |
20.0% |
0.0% |
|
Excess |
53.8% |
46.9% |
(6.8%) |
Key Take-Outs:
- Strong earnings growth - Core earnings per share (EPS) grew by 39.5% to Kshs 14.9, from Kshs 10.7 in Q1’2023, driven by the 21.4% growth in total operating income to Kshs 13.1 bn, from Kshs 10.8 bn in Q1’2024,
- Improved asset quality – The bank’s gross NPL ratio decreased to 9.9% in Q1’2023 from 14.4% in Q1’2023, attributable to 26.9% decrease in Gross non-performing loans to Kshs 16.5 bn, from Kshs 22.6 bn in Q1’2023, compared to the 6.8% increase in gross loans to Kshs 167.4 bn, from Kshs 156.7 bn recorded in Q1’2023, and,
- Improved Lending – The bank’s loan book increased by 12.0% to kshs 153.6 bn, from Kshs 137.1 bn in Q1’2023, compared to the 27.5% decline in government securities to Kshs 69.0 bn, from Kshs 95.1 bn in Q1’2023, highlighting the bank’s strategy to increase lending through digital transformation, while at the same time managing its non-performing loan book.
For a more detailed analysis, please see the Stanchart’s Q1’2024 Earnings Note
Asset Quality:
The table below shows the asset quality of listed banks that have released their Q1’2024 results using several metrics:
|
Cytonn Report: Listed Banks Performance in Q1’2024 |
||||||
|
|
Q1'2024 NPL Ratio* |
Q1'2023 NPL Ratio** |
% point change in NPL Ratio |
Q1'2024 NPL Coverage* |
Q1'2023 NPL Coverage** |
% point change in NPL Coverage |
|
Stanbic Bank |
8.9% |
11.7% |
(2.9%) |
72.3% |
66.7% |
5.6% |
|
SCBK |
9.9% |
14.4% |
(4.5%) |
83.7% |
86.8% |
(3.1%) |
|
I&M Group |
10.8% |
10.6% |
0.3% |
58.3% |
65.8% |
(7.5%) |
|
Absa Bank |
11.1% |
9.4% |
1.6% |
62.3% |
63.9% |
(1.6%) |
|
NCBA |
11.7% |
12.8% |
(1.1%) |
55.7% |
56.8% |
(1.0%) |
|
Equity Group |
14.2% |
10.0% |
4.2% |
58.3% |
62.0% |
(3.8%) |
|
DTB-k |
14.9% |
12.3% |
2.7% |
44.0% |
45.9% |
(1.8%) |
|
Co-op Bank |
15.9% |
14.1% |
1.8% |
58.6% |
62.2% |
(3.6%) |
|
KCB Group |
17.9% |
17.1% |
0.8% |
62.0% |
57.3% |
4.8% |
|
HF Group |
24.1% |
19.9% |
4.2% |
74.4% |
81.4% |
(7.0%) |
|
Mkt Weighted Average* |
13.5% |
12.6% |
0.9% |
62.5% |
63.7% |
(1.2%) |
|
*Market cap weighted as at 31/05/2024 |
||||||
|
**Market cap weighted as at 15/06/2023 |
||||||
Key take-outs from the table include;
- Asset quality for the listed banks that have released declined during Q1’2024, with market-weighted average NPL ratio increasing by 0.9% points to 13.5% from 12.6% in Q1’2023, and,
- Market-weighted average NPL Coverage for the listed banks decreased by 1.2% points to 62.5% in Q1’2024 from 63.7% recorded in Q1’2023. The decrease was attributable to I&M Group’s coverage ratio decreasing by 7.5% to 58.3% from 65.8% in Q1’2023, coupled with HF Group’s NPL coverage ratio decreasing by 7.0% points to 74.4% from 81.4% in Q1’2023. The performance was however supported by Stanbic Bank’s NPL Coverage ratio increasing by 5.6% to 72.3% from 66.7% in Q1’2023.
Summary Performance
The table below shows the performance of listed banks that have released their Q1’2024 results using several metrics:
|
Cytonn Report: Listed Banks Performance in Q1’2024 |
||||||||||||||
|
Bank |
Core EPS Growth |
Interest Income Growth |
Interest Expense Growth |
Net Interest Income Growth |
Net Interest Margin |
Non-Funded Income Growth |
NFI to Total Operating Income |
Growth in Total Fees & Commissions |
Deposit Growth |
Growth in Government Securities |
Loan to Deposit Ratio |
Loan Growth |
Return on Average Equity |
|
|
HF Group |
80.4% |
28.5% |
52.4% |
7.6% |
5.4% |
40.7% |
36.3% |
56.0% |
6.2% |
6.4% |
87.1% |
3.1% |
5.1% |
|
|
KCB Group |
69.0% |
46.0% |
56.0% |
40.8% |
7.4% |
17.8% |
35.9% |
2.4% |
25.4% |
39.6% |
67.8% |
9.5% |
20.1% |
|
|
SCBK |
39.5% |
25.4% |
78.0% |
20.0% |
8.6% |
23.9% |
36.7% |
17.0% |
1.0% |
(27.5%) |
50.2% |
12.0% |
24.0% |
|
|
I&M Group |
35.4% |
53.1% |
76.0% |
37.7% |
8.0% |
(9.4%) |
27.4% |
24.4% |
18.2% |
0.8% |
75.9% |
13.1% |
15.0% |
|
|
Absa Bank |
33.6% |
33.8% |
74.4% |
21.7% |
9.7% |
12.7% |
30.8% |
5.1% |
14.2% |
(21.2%) |
92.1% |
5.4% |
25.0% |
|
|
Equity Group |
25.2% |
32.7% |
41.4% |
28.4% |
8.2% |
21.0% |
44.4% |
22.6% |
11.3% |
16.2% |
63.0% |
3.0% |
23.8% |
|
|
DTB-K Bank |
11.0% |
20.0% |
36.8% |
6.2% |
5.7% |
31.8% |
34.3% |
42.7% |
5.1% |
(12.4%) |
63.3% |
(0.5%) |
11.2% |
|
|
Co-op Bank |
7.7% |
24.7% |
60.8% |
8.6% |
7.8% |
(0.3%) |
37.7% |
(7.3%) |
14.8% |
11.7% |
78.5% |
5.0% |
19.7% |
|
|
NCBA |
4.7% |
29.8% |
70.8% |
(1.2%) |
6.0% |
7.4% |
48.3% |
16.9% |
9.7% |
(14.0%) |
58.5% |
11.6% |
23.2% |
|
|
Stanbic Holdings |
2.8% |
53.9% |
130.2% |
19.6% |
8.4% |
(34.0%) |
36.9% |
(10.4%) |
22.2% |
(28.4%) |
71.9% |
11.1% |
20.8% |
|
|
Q1'24 Mkt Weighted Average* |
29.9% |
76.5% |
64.4% |
22.8% |
7.9% |
11.0% |
38.6% |
10.8% |
14.1% |
3.4% |
68.4% |
7.5% |
21.8% |
|
|
Q1'23 Mkt Weighted Average* |
25.0% |
26.2% |
40.2% |
20.1% |
7.3% |
48.1% |
41.3% |
30.0% |
19.0% |
(1.2%) |
73.1% |
19.6% |
22.1% |
|
|
*Market cap weighted as at 31/05/2024 |
||||||||||||||
|
**Market cap weighted as at 15/06/2023 |
||||||||||||||
Key take-outs:
- The listed banks recorded a 29.9% growth in core Earnings per Share (EPS) in Q1’2024, compared to the weighted average growth of 25.0% in Q1’2023, an indication of improved performance attributable to the improved operating environment experienced during Q1’2024,
- Interest income recorded a weighted average growth of 76.5% in Q1’2024, compared to 26.2% in Q1’2023. Similarly, interest expenses recorded a market-weighted average growth of 64.4% in Q1’2024 compared to a growth of 40.2% in Q1’2023,
- The Banks’ net interest income recorded a weighted average growth of 22.8% in Q1’2024, an increment from the 20.1% growth recorded over a similar period in 2023, while the non-funded income grew by 11.0% in Q1’2024 slower than the 48.1% growth recorded in Q1’2023 despite the revenue diversification strategies implemented by most banks, and,
- The Banks recorded a weighted average deposit growth of 14.1%, lower than the market-weighted average deposit growth of 14.1% in Q1’2023.
- Jubilee Holdings Ltd FY’2023 Financial Results
During the week, Jubilee Holdings Limited released their FY’2023 results. This marked the second time the company released their results under the new IFRS 17 reporting system. Jubilee’s Profit After Tax (PAT) decreased by 19.8% to Kshs 4.4 bn, from Kshs 5.5 bn recorded in FY’2022. The performance was mainly driven by a 11.1% increase in Insurance Services Expenses to Kshs 21.8 bn, from Kshs 19.6 bn in FY’2022, but was supported by the 8.0% increase in Insurance Services Revenue to Kshs 22.8 bn in FY’2023, from Kshs 21.1 bn in FY’2022, as shown below;
|
Cytonn Report: Jubilee Holdings Ltd Income Statement |
|||
|
Item (All figures in Bns) |
FY'2022 |
FY'2023 |
y/y change |
|
Insurance Revenue |
21.1 |
22.8 |
8.0% |
|
Insurance service expenses |
(19.6) |
(21.8) |
11.1% |
|
Net expenses from reinsurance contracts held |
(0.03) |
(0.3) |
793.8% |
|
Net Insurance income |
1.4 |
0.7 |
52.2% |
|
Net Financial Result |
6.4 |
6.2 |
(1.9%) |
|
Net non-attributable income (expenses) |
(1.3) |
(1.6) |
27.9% |
|
Profit Before Tax |
6.5 |
5.3 |
(18.5%) |
|
Taxation |
(1.0) |
(0.9) |
(11.4%) |
|
Profit Before Tax |
5.5 |
4.4 |
(19.8%) |
|
Cytonn Report: Jubilee Holdings Ltd Balance Sheet |
|||
|
Item (All figures in Bns) |
FY'2022 |
FY'2023 |
y/y change |
|
Investment assets |
151.5 |
170.9 |
12.8% |
|
Insurance assets |
3.4 |
4.3 |
27.6% |
|
Total Assets |
168.6 |
191.7 |
13.7% |
|
Insurance Contract Liabilities |
114.5 |
129.7 |
13.2% |
|
Provisions & other payables |
6.9 |
7.7 |
11.4% |
|
Total liabilities |
121.5 |
137.4 |
13.1% |
|
Shareholder funds |
44.7 |
51.7 |
15.7% |
|
Minority Interest |
2.5 |
2.6 |
3.6% |
|
Total Equity |
47.2 |
54.3 |
15.1% |
Key take-outs:
- Core Earnings Per share decreased by 19.8% to Kshs 75.0 from Kshs 59.0 in FY’2022, driven by the 11.1% increase in Insurance Services Expenses to Kshs 21.8 bn, from Kshs 19.6 bn in FY’2022, coupled with 1.9% decrease in net financial result to Kshs 6.2 bn from Kshs 6.4 bn in FY’2022, which outpaced the 8.0% increase in insurance services revenues to Kshs 22.8 bn from Kshs 21.1 bn in FY’2022,
- Net financial result decreased by 1.9% to Kshs 6.2 bn in FY’2023, from Kshs 6.4 bn in FY’2022, while net non-attributable expenses increased by 27.9% to Kshs 1.6 bn, from Kshs 1.3 bn in FY’2022; resulting in a 18.5% decline in the Profit Before Tax to Kshs 5.3 bn in FY’2023, from Kshs 6.5 bn recorded in FY’2022,
- Insurance services revenue increased by 8.0% to Kshs 22.8 bn in FY’2023 from Kshs 21.1 bn in FY’2022, while insurance expenses increased by 11.1% to Kshs 21.8 bn from Kshs 19.6 bn in FY2022, and the net expenses from reinsurance contracts held increased significantly by 793.8% to Kshs 0.3 bn, from Kshs 0.03 bn in FY’2022. This translated to a Net insurance service result decrease of 52.2% to Kshs 0.7 bn from Kshs 1.4 bn in FY’2022,
- The balance sheet recorded an expansion as total assets increased by 13.7% to Kshs 191.7 bn in FY’2023 from Kshs 168.6 bn in FY’2022 mainly driven by 47.8% increase in fixed assets to Kshs 2.6 bn from Kshs 1.8 bn in FY’2022, coupled with 12.8% increase in financial investment assets to Kshs 170.9 bn form Kshs 151.5 bn in FY’2022, and,
- Total liabilities increased by 13.1% to Kshs 137.4 bn from Kshs 121.5 bn in FY’2022, majorly on the back of Insurance contract liabilities 13.2% increase to Kshs 129.7 bn from Kshs 114.5 bn in FY’2022, coupled with the 11.4% increase in other liabilities to Kshs 7.7 bn from Kshs 6.9 bn in FY’2022.
Other highlights from the release include:
- Declaration of dividends – The board of directors declared a final of Kshs 10.0 and special dividend of Kshs 2.30, adding to the interim dividend of Kshs 2.0 declared in H1’2023 bringing the total dividend to Kshs 14.3 for the FY’2023. This translated to a dividend yield of 7.6% and a dividend payout of 24.3%.
Key to note, Jubilee Holdings Ltd also restated its FY’2022 financial results to comply with the new reporting standards (IFRS 17). This standard requires insurers to measure insurance contracts using updated estimates and assumptions that account for the timing of cash flows and any uncertainties related to insurance contracts. Looking ahead, the Group's earnings are expected to benefit from its enhanced performance in both the life and general insurance segments.
We are “Neutral” on the Equities markets in the short term due to the current tough operating environment and huge foreign investor outflows, and, “Bullish” in the long term due to current cheap valuations and expected global and local economic recovery. With the market currently being undervalued for its future growth (PEG Ratio at 0.8x), we believe that investors should reposition towards value stocks with strong earnings growth and that are trading at discounts to their intrinsic value. We expect the current high foreign investors’ sell-offs to continue weighing down the equities outlook in the short term.
- Statutory Review
During the month, there was only one notable highlight;
- The National Treasury tabled the Finance Bill 2024, which addresses several key areas impacting taxation, housing, and infrastructure financing. The aim of the bill is to introduce amendments and proposals aimed at refining the taxation system, several of which tie in enhancing infrastructure financing and advancing housing initiatives in Kenya. For more information, please see our Cytonn Weekly #20/2024.
- Industry Reports
During the week, the Kenya National Bureau of Statistics (KNBS) released the Leading Economic Indicators (LEI) February and March 2024 Reports, which highlighted the performance of major economic indicators. Key highlights related to the Real Estate sector include;
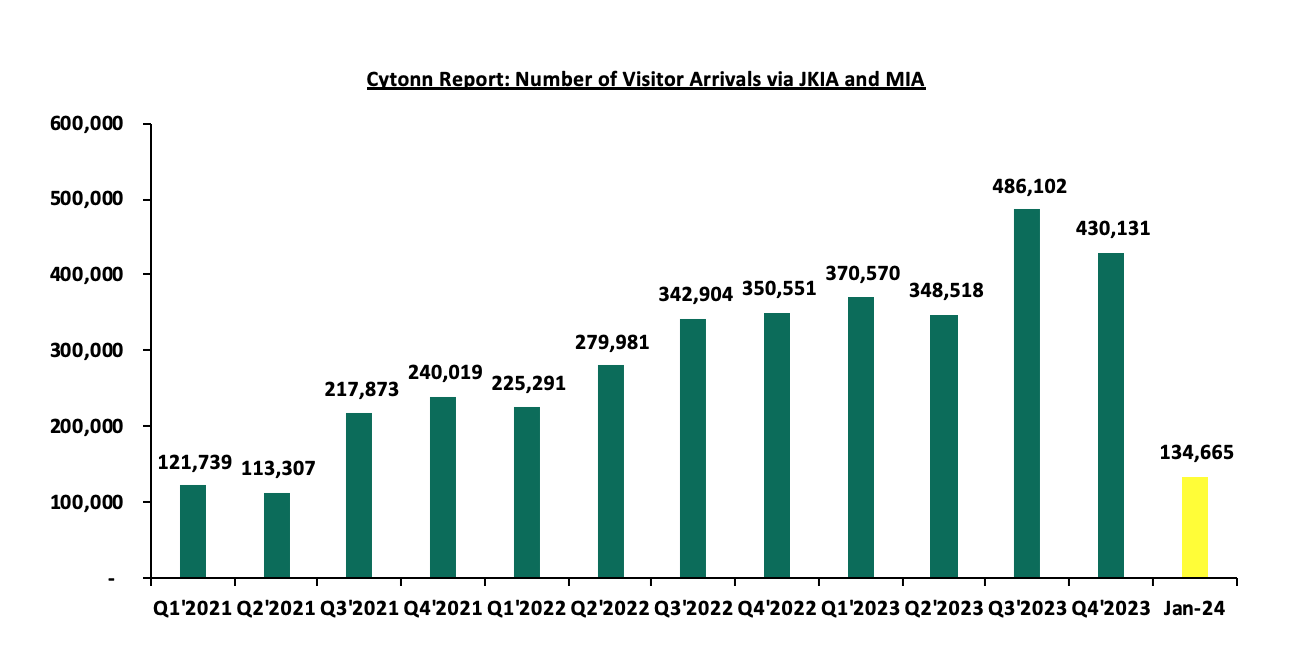
- In January 2024, the number of arrivals was 134,665, reflecting a 12.7% decrease from 154,283 in December 2023. However, on a year-on-year basis, this represented a 4.6% increase compared to 128,772 arrivals in January 2023. The improved performance can be attributed to several factors: the introduction of direct flights by three new airlines—IndiGo (Mumbai-Nairobi), Fly Dubai (Dubai-Mombasa), and Airlink (Johannesburg-Nairobi); the creation of specialized tourism offerings such as cruise, adventure, cultural, and sports tourism; expanded global promotion of Kenya's tourism by the Ministry of Tourism and the Kenya Tourism Board using platforms like Magical Kenya; Nairobi City being recognized as the top city in the world by Lonely Planet, a U.S.-based travel agency; and the alignment of marketing strategies by the tourism board to focus on both emerging and established source markets. The chart below shows the number of international arrivals in Kenya between Q1’2021 and January 2024;
Source: Kenya National Bureau of Statistics (KNBS)
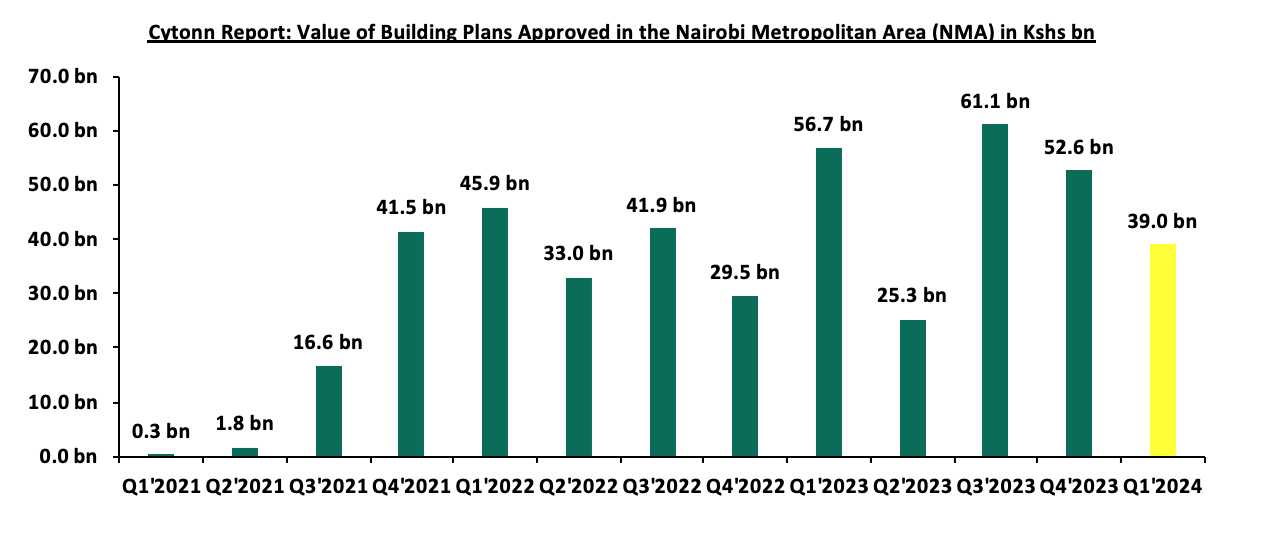
- The total value of building plans approved in the Nairobi Metropolitan Area (NMA) decreased y/y basis by 31.2% to Kshs 39.0 bn in Q1’2024, from Kshs 56.7 bn recorded in Q1’2023. In addition, on a q/q basis, the performance represented a 25.8% decline from Kshs 52.6 bn recorded in Q4’2023. The decline in performance was attributable to pending approvals amid delays in processing construction permits enhanced by backlogs in registry systems. The chart below shows the value of building plans approved in the Nairobi Metropolitan Area (NMA) between Q1’2021 and Q1’2024;
Source: Kenya National Bureau of Statistics (KNBS)
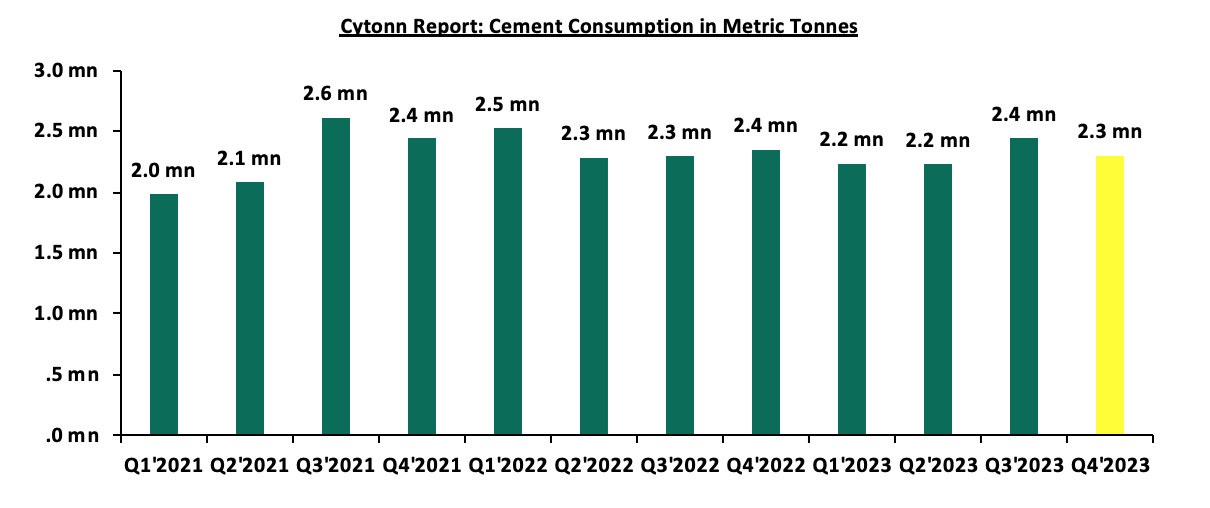
- The consumption of cement came in at 2.3 mn metric tonnes in Q4’2023, a 2.2% decline from 2.35 mn metric tonnes recorded in Q4’2022. On a q/q basis, the performance represented a 5.7% decrease from 2.44 mn metric tonnes recorded in Q3’2023. The decline in performance was attributable to; i) increased costs of the commodity, which increased by 15.4% to Kshs 750 from Kshs 650 per 50 kg bag, ii) an increase in pending approvals amid delays in processing construction permits owing to backlogs in registry systems, which led to an overall decrease in the consumption of construction materials. The chart below shows cement consumption in metric tonnes in Kenya between Q1’2021 and Q4’2023;
Source: Kenya National Bureau of Statistics (KNBS)
During the month, the following industry reports were released and the key take-outs were as follows;
|
Cytonn Report: Notable Industry Reports During the Month of April 2024 |
|||
|
# |
Theme |
Report |
Key Take-outs |
|
1
|
Hospitality Sector |
2024 Economic Survey by Kenya Bureau of Statistics |
|
|
2 |
Real Estate, Hospitality, and Building and Construction sector |
Quarterly Economic Review Q4’2023 Report by the Central Bank of Kenya (CBK) |
|
We expect continued growth in the Real Estate sector, driven largely by the increasing number of visitor arrivals. This influx is expected to boost the performance of serviced apartments and hotel accommodations by increasing room and bed occupancies, restaurant activities, and overall hospitality operations. Furthermore, ongoing development in the aviation sector, hotel industry expansions—such as the recent opening of the JW Marriott—and Nairobi’s rising status as a prime travel destination and a preferred location for international conferences will further strengthen the sector. However, we foresee potential challenges that could impact the sector's growth, including unpredictable weather causing frequent flooding, higher construction costs, and a rise in non-performing loans in the Real Estate sector, which increased by 26.7% to Kshs 101.7 mn in Q4’2023 from Kshs 80.3 mn recorded in Q4’2022. Additionally, the reduction in construction activities, as indicated by the decreased cement consumption, is likely to continue limiting the sector's optimal performance.
- Commercial Office Sector
There was one notable highlight during the month;
- Gateway Real Estate Africa, a subsidiary of London-listed Grit Real Estate Income Group, unveileda significant development in Kenya's real estate landscape. The project, named Eneo, is a state-of-the-art Business Process Outsourcing (BPO) facility located within the Tatu City Special Economic Zone (SEZ). Comprising 2 towers with a combined gross lettable area of approximately 26,000 SQM, Eneo boasts modern amenities and interconnected retail spaces, including a grocer, restaurants, pharmacy, and convenience retail shops. For more information, please see our Cytonn Weekly #20/2024.
- Infrastructure Sector
Notable highlights during the month include;
- President Ruto signed an agreement with Everstrong Capital, a U.S. firm, for the construction of the 440-kilometer Nairobi-Mombasa Expressway. The project, estimated to cost Kshs 470.0 bn (USD 3.6 bn), will be a six-lane dual carriageway. The project received approval from the National Assembly last year to proceed under a public-private partnership (PPP) model. It aims to reduce traffic congestion and decrease travel time between the two cities from the current average of 10.5 hours to 4 hours. For more information, please see our Cytonn Weekly #21/2024,
- President Ruto presided over the launch of the second phase of the Kenya Urban Support Programme (KUSP) in collaboration with the World Bank, where Kenya received Kshs 46.5 bn towards strengthening the capacity of urban areas by improving settlement structures. The project will be implemented in 77 municipalities across 45 counties, excluding Nairobi and Mombasa. For more information, please see our Cytonn Weekly #19/2024.
- Industrial Sector
The notable highlight during the month was;
- President Ruto's visit to the U.S. resulted in the signing of an agreementbetween G42 and Microsoft to build a data center worth Kshs 131.0 bn (USD 1.0 bn) at the KenGen Green Park in Olkaria. The data center will run on 100.0% renewable geothermal power from the Olkaria Geothermal fields in Naivasha, Nakuru County. G42, in collaboration with other partners, will design and construct the state-of-the-art facility, which will provide access to Microsoft Azure through a new East Africa Cloud Region. For more information, please see our Cytonn Weekly #21/2024.
- Real Estate Investments Trusts (REITs)
During the week, property developer Acorn Holdings announced its decision to exercise the early redemption of its green bond, with an outstanding balance of Kshs 1.9 bn. The green bond, initially launched in 2019, successfully raised Kshs 5.7 bn through multiple transactions to develop Acorn's branded student hostels. The bond, which carries a fixed interest rate of 12.25%, was designed with provisions for early redemption to de-risk it compared to traditional corporate bonds. CEO Edward Kirathe confirmed that the bond would be retired slightly ahead of its November 8, 2024 maturity date, ensuring investors receive the full value of their investment.
The impact of this early redemption is significant for the Nairobi Securities Exchange, as it will retire the first and only green debt instrument listed there. Acorn Holdings' strategic financial management and successful capital raise, including a recent Kshs 23.6 bn (USD 180 mn) concessional loan from the US Development Finance Corporation (DFC), demonstrate the developer's robust financial health and commitment to meeting its obligations. This move not only strengthens investor confidence but also sets a positive precedent for future green bonds in the Kenyan market.
We expect that Acorn Holdings' early bond redemption will enhance its reputation in the financial markets, potentially attracting more investors to future projects. Additionally, this development underscores the growing importance of green financing in Kenya, encouraging other developers to consider sustainable investment instruments. As Acorn continues to expand its student accommodation capacity, the company's proactive financial strategies are likely to contribute to the overall growth and stability of the real estate sector.
On the Unquoted Securities Platform, Acorn D-REIT and I-REIT traded at Kshs 24.5 and Kshs 22.0 per unit, respectively, as of 31st May 2024. The performance represented a 22.5% and 10.0% gain for the D-REIT and I-REIT, respectively, from the Kshs 20.0 inception price. The volumes traded for the D-REIT and I-REIT came in at 12.3 mn and 30.7 mn shares, respectively, since inception in February 2021.
REITs provide various benefits like tax exemptions, diversified portfolios, and stable long-term profits. However, the continuous deterioration in the performance of Kenyan REITs and the restructuring of their business portfolios is hampering major investments that had previously been made. The other general challenges include; i) inadequate comprehension of the investment instrument among investors, ii) prolonged approval processes for REIT creation, iii) high minimum capital requirements of Kshs 100.0 mn for trustees, and, iv) minimum investment amounts set at Kshs 5.0 mn, continue to limit the performance of the Kenyan REITs market.
We expect the Real Estate sector in Kenya to remain resilient, supported by several key factors. These include favorable demographics, such as a relatively high population growth and an urbanization rate of 1.9% and 3.7%, respectively. Additionally, ongoing government-led infrastructure development projects, along with increased residential sector activities by both government and private entities under the affordable housing program, are likely to contribute positively to sector growth. Furthermore, initiatives to expand the mortgage market, led by industry players like the Kenya Mortgage Refinance Company (KMRC), are expected to stimulate additional activity. However, despite these positive indicators, we anticipate that rising construction costs, prevailing challenging macroeconomic conditions, and limited investor knowledge regarding Real Estate Investment Trusts (REITs) could constrain growth in the sector.
Disclaimer: The views expressed in this publication are those of the writers where particulars are not warranted. This publication, which is in compliance with Section 2 of the Capital Markets Authority Act Cap 485A, is meant for general information only and is not a warranty, representation, advice, or solicitation of any nature. Readers are advised in all circumstances to seek the advice of a registered investment advisor.

- Talk to us
- Kenya
- P.O Box 20695 - 00200, Nairobi, Kenya
- Cell +254709101200
- Tel +254709101200
- WhatsApp +254741676635
- United States
- +254709101200
- DOWNLOAD OUR APP
-


- Kenya
- 8th Floor, Pinetree Plaza, Kaburu Drive, Ngong Road, Nairobi, Kenya
- USA
- Suite 1150, 1775 Eye Street NW, USA, Washington DC 20006, USA
- Investments
- High Yield
- Private Equity
- Real Estate
- Real Estate
- RiverRun Estates
- Cytonn Towers
- The Ridge
- Taraji Heights
- The Alma