Cytonn Monthly – November 2018
By Cytonn Research Team, Dec 2, 2018
Executive Summary
Fixed Income
During the month of November, T-bill auctions recorded an undersubscription, with the average subscription rate coming in at 84.1%, an increase from 77.8%, recorded in the month of October. The yields on the 91-day and 182-day papers both declined by 0.2% points, to 7.3% and 8.2%, from 7.5% and 8.4%, recorded in October, respectively, while the yield on the 364-day paper rose by 0.1% points to 9.6% from 9.5%, recorded in October. The Monetary Policy Committee (MPC) met on Tuesday 27th November 2018 to review the prevailing macroeconomic conditions and give direction on the Central Bank Rate (CBR). The MPC maintained the CBR at 9.0%, in line with our expectations as detailed in our MPC Note, citing that inflation expectations were still well anchored within the target range and that the economy was operating close to its potential;
Equities
During the month of November, the equities market had mixed performance with NASI and NSE 25 gaining by 1.2% and 2.5%, respectively, while NSE 20 declined by 0.5%, taking their YTD performance as at the end of November to declines of 14.7%,24.6% and 14.1%, for NASI, NSE 20 and NSE 25, respectively. Listed banks in Kenya released their Q3’2018 financial results, with the core earnings per share rising by an average of 15.4% y/y compared to a 9.3% decline for the same period in 2017;
Private Equity
During the month of November, there was private equity activity in the financial services, FinTech and education sectors. In the financial services sector, TransCentury, a Kenyan-based investment firm with focus in infrastructure, rolled over USD 3.5 mn (Kshs 360.2 mn) worth of short-term loans by one year. In education, UNICAF, the largest online higher education platform in Africa, announced a USD 28.0 mn Series B financing. In FinTech, MFS Africa, a Pan-African FinTech company announced the close of its second round of Series B funding, raising equity totalling to USD 14.0 mn (Kshs 1.4 bn). In fundraising, Catalyst Principal Partners, a Kenyan private equity firm raised USD 155.0 mn (Kshs 15.9 bn) in its second round of funding;
Real Estate
During the month, the Cabinet Secretary for Housing and Urban Planning, Hon. James Macharia released the Housing Fund Regulations, which are designed to provide guidelines and procedures for the National Housing Development Fund, as part of the Affordable Housing initiative. In the retail sector, internationally renowned fashion houses, Hugo Boss and Mango, opened their first branches in East and Central Africa at the Westgate Mall, in Westlands, Nairobi. In the commercial office sector, the European Union and Coca Cola Company announced plans of relocating their offices from Upperhill to Westlands and Lavington, respectively. In the hospitality sector, the Kenyan Government announced plans to rehabilitate six airstrips nationwide.
- John Ndua, Investments Associate at Cytonn was on CNBC to discuss the state on economy in Kenya. Watch John here
- Faith Maina, Investments Analyst at Cytonn was on KTN to discuss about the gender bill in parliament. Watch Faith here
- The Ridge, a comprehensive lifestyle development at Ridgeways in Nairobi County by Cytonn Real Estate offers a work-play environment. It offers a prime real estate development opportunity. To view show house images click here. The site is open to clients all week long.
- We continue to hold weekly workshops and site visits on how to build wealth through real estate investments. The weekly workshops and site visits target both investors looking to invest in real estate directly and those interested in high yield investment products to familiarize themselves with how we support our high yields. Watch progress videos and pictures of The Alma, Amara Ridge, The Ridge, and Taraji Heights. Key to note is that our cost of capital is priced off the loan markets, where all-in pricing ranges from 16.0% to 20.0%, and our yield on real estate developments ranges from 23.0% to 25.0%, hence our top-line gross spread is about 6.0%. If interested in attending the site visits, kindly register here;
- We continue to see very strong interest in our weekly Private Wealth Management Training (largely covering financial planning and structured products). The training is at no cost and is open only to pre-screened participants. We also continue to see institutions and investment groups interested in the training for their teams. The Wealth Management Training is run by the Cytonn Foundation under its financial literacy pillar. If interested in our Private Wealth Management Training for your employees or investment group, please get in touch with us through wmt@cytonn.com. To view the Wealth Management Training topics, click here;
- For recent news about the company, see our news section here;
- We have 10 investment-ready projects, offering attractive development and buyer targeted returns of around 23.0% to 25.0% p.a. See further details here: Summary of Investment-Ready Projects; and
- We continue to beef up the team with ongoing hires for Financial and Real Estate Advisors for our offices in Nairobi, Nakuru, Kisumu, and Nyeri. Visit the Careers section on our website to apply.
- Cytonn Centre for Affordable Housing (CCFAH) is looking for a 2-acre land parcel for a joint venture in Kiambu County (Ruiru, Kikuyu, Lower Kabete), Nairobi County and its environs. The parcel should be; i) fronting a main road, or not more than 800 metres from the main road and ii) priced at Kshs 20mn per acre or below. For more information or leads email us at affordablehousing@cytonn.com.
T-Bills & T-Bonds Primary Auction:
During the month of November, T-bill auctions recorded an undersubscription, with the average subscription rate coming in at 84.1%, an increase from 77.8%, recorded in October. The average subscription rates for the 91-day, 182-day and 364-day papers came in at 100.8%, 31.6% and 129.9%, from 108.1%, 41.8% and 101.7%, in the previous month, respectively. The yields on the 91-day and 182, day papers declined by 0.2% points, to 7.3% and 8.2%, from 7.5% and 8.4%, recorded in October, respectively, while the yield on the 364-day paper rose by 0.1% points to 9.6% from 9.5%, recorded in October. The T-bills acceptance rate came in at 92.6% during the month, compared to 92.4% recorded in October with the government accepting a total of Kshs 74.7 bn of the Kshs 80.7 bn worth of bids received, indicating that bids were largely within ranges the Central Bank of Kenya (CBK) deemed acceptable.
During the week, T-bills were undersubscribed, with the overall subscription rate coming in at 75.9%, up from 48.8% recorded the previous week. The undersubscription was attributed to tight liquidity in the interbank market, which saw average interbank rate increasing to 5.9% from 4.7%, the previous week. The yields on the 91-day, 182-day, and 364-day papers remained unchanged at 7.3%, 8.2%, and 9.6%, the previous week, respectively. The acceptance rate rose to 94.7% from 76.2% the previous week, with the government accepting Kshs 17.3 bn out of the Kshs 24.0 bn of bids received. The subscription rate for the 91-day and 182-day improved to 269.8% and 48.2% from 43.5% and 19.3%, respectively, while the subscription rate for the 364-day paper declined to 26.1% from 80.4%, recorded the previous week.
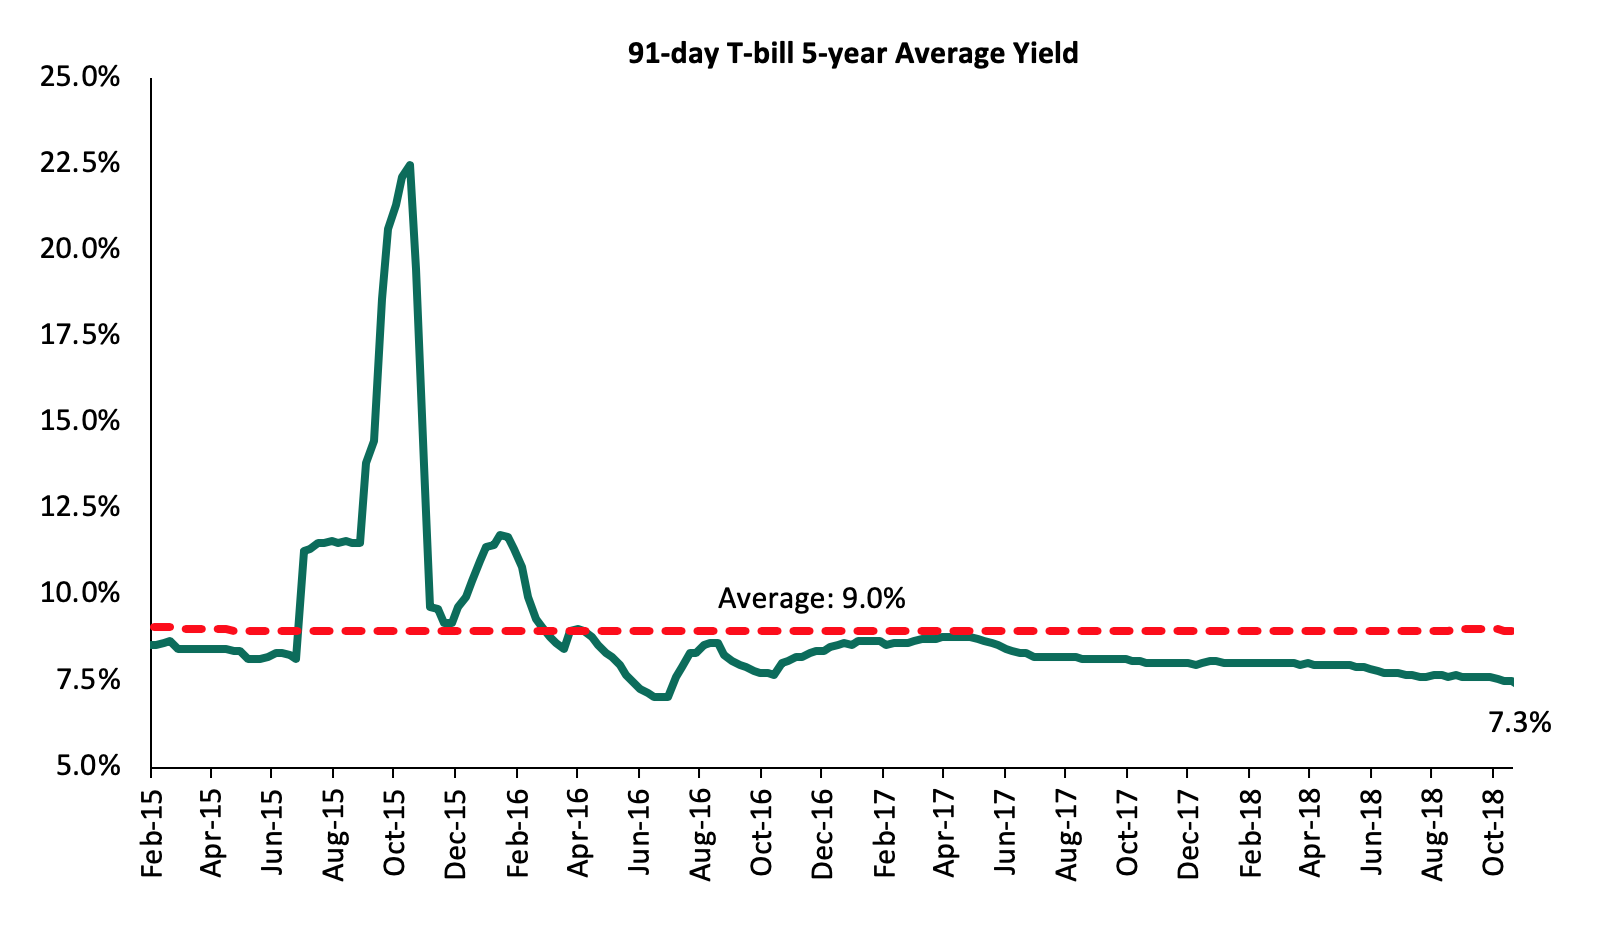
The 91-day T-bill is currently trading at a yield of 7.3%, which is below its 5-year average of 9.0%. The lower yield on the 91-day paper is mainly attributable to the low-interest rate environment that has been experienced since the passing of the law capping interest rates. We expect this to continue in the short-term, given:
- The discipline of the CBK in stabilizing interest rates in the auction market by rejecting aggressive bids that are priced above market, for both T-bills and T-bonds, and,
- The maintaining of the Central Bank Rate at 9.0% by the Monetary Policy Committee in their November meeting.
During the month, the Kenyan Government issued a 20-year infrastructure bond (IFB1/2018/20) at a coupon rate of 11.95%, aimed at funding infrastructure projects in the road, water and energy sectors. The issue was under-subscribed, with the subscription rate coming in at 80.8%, with bids worth Kshs 40.4 bn received against the Kshs 50.0 bn on offer. The government consequently issued a tap sale on the bond at a yield of 12.2% in a bid to raise Kshs 22.4 bn, and received Kshs 8.7 bn, a 38.9% subscription rate. The low subscription rate was attributed to:
- Uncertainty over the interest rate environment that has made investors reluctant to commit to long-term bonds,
- Tight liquidity in the interbank market as evidenced by the rise in the average interbank rate to 4.1% in November, from 3.6% recorded in October, and
- Relatively low returns due to the continued decline of yields in the primary auction as the government continues to reject expensive bids. The 20-year bond’s coupon was set at 11.95% with the accepted yield coming in at 12.2%, which was relatively low compared to the shorter tenor 15-year infrastructure bond issued in January, which had a coupon of 12.5% with the accepted yield coming at 12.5%.
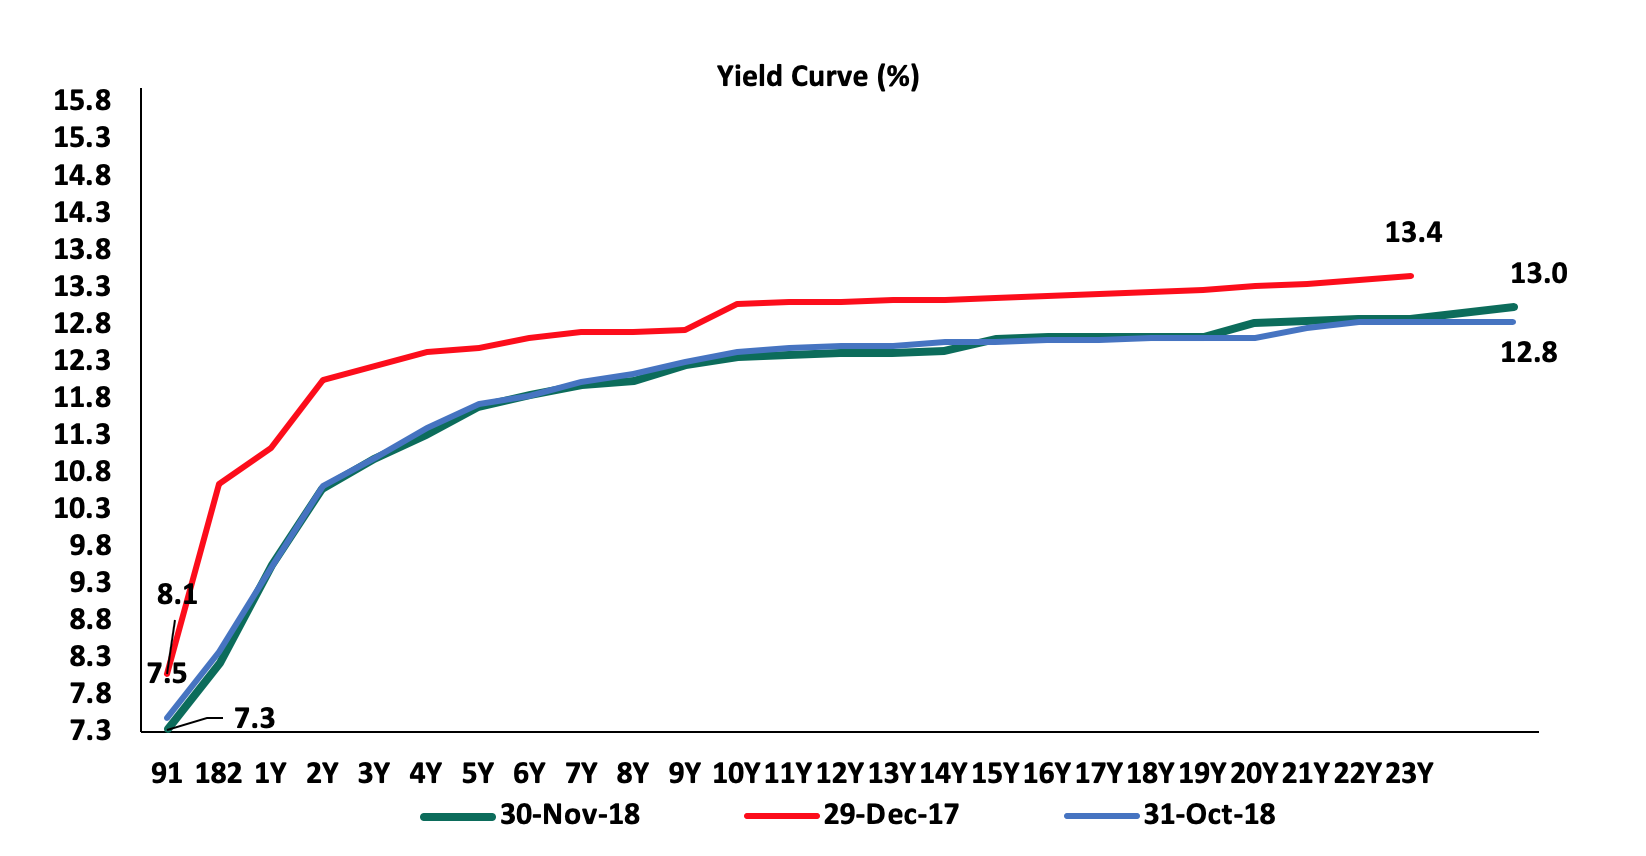
Despite the Government’s effort of issuing longer-term bonds in a bid to lengthen the average maturity and reduce the potential rollover risks in the medium term, it is evident that there is a low appetite for the long-dated papers. This is attributed to the saturation of long-end offers, leading to a relatively flat yield curve on the long-end, making Treasury rely on the short-term treasury bills to meet its domestic borrowing target. We are of the view that the Government will need to offer more incentive for the long-term bonds by increasing the yields to attract investors.
Secondary Bond Market:
The yields on government securities in the secondary market remained relatively stable in the month of November as the Central Bank of Kenya continued to reject expensive bids in the primary market. According to the FTSE NSE Bond Index, Treasury bonds listed at the Nairobi Securities Exchange (NSE) gained by 1.0% during the month, bringing the YTD performance to 14.6%.
Liquidity:
The average interbank rate increased to 4.1% during the month of November from 3.6% in October, pointing to declined liquidity during the month, which the CBK attributed to reduced government payments.
During the week, the average interbank rate increased to 5.9%, from 4.7% the previous week, while the average volumes traded in the interbank market decline by 17.1% to Kshs 22.6 bn from Kshs 27.3 bn the previous week. The increase in the average interbank rate points to tight liquidity, attributed to efforts by banks to shore up reserves following the Kshs 15.0 bn shortfall recorded the previous week with regard to the 5.25% CRR monthly averaging requirement.
Kenya Eurobonds:
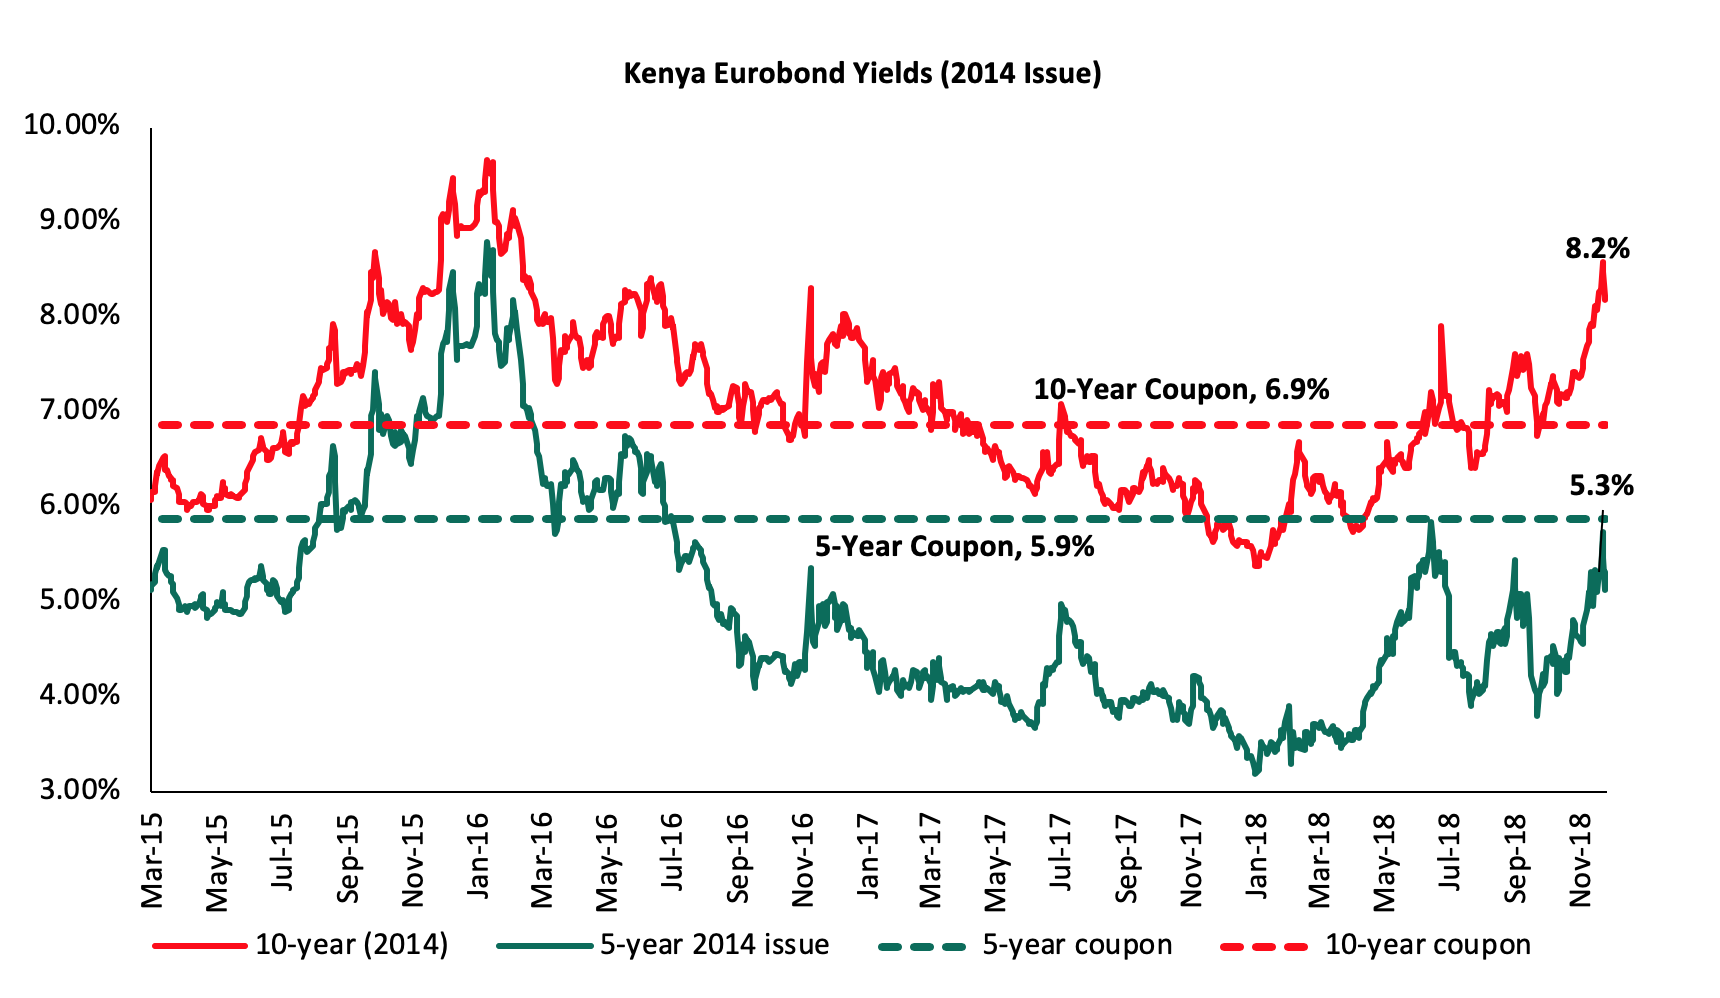
According to Bloomberg, the yield on the 5-year and 10-Year Eurobonds issued in June 2014 rose by 0.5% points and 0.8% points to 5.3% and 8.2%, respectively, from 4.8% and 7.4% in October. During the week, the yields on the 5-year Eurobond issued in 2014 remained flat at 5.3% while the 10-year Eurobond issued in the same year declined by 0.1% points to 8.2% from 8.3%, the previous week. Since the mid-January 2016 peak, yields on the Kenya Eurobonds have declined by 3.5% points and 1.5% points for the 5-year and 10-year Eurobonds, respectively, an indication of the relatively stable macroeconomic conditions in the country.
During the month, the yields on the 10-year and 30-year Eurobond issued in February 2018 both rose by 0.8% points and 0.6% to 8.9% and 9.7% from 8.1% and 9.1% in October, respectively. During the week, the yields on the 10-year and 30-year Eurobonds both declined by 0.2% points, to 8.9% and 9.7% from 9.1% and 9.9% recorded the previous week, respectively. Since the issue date, the yields on the 10-year Eurobond and 30-year Eurobond have increased by 1.6% points and 1.4% points respectively.
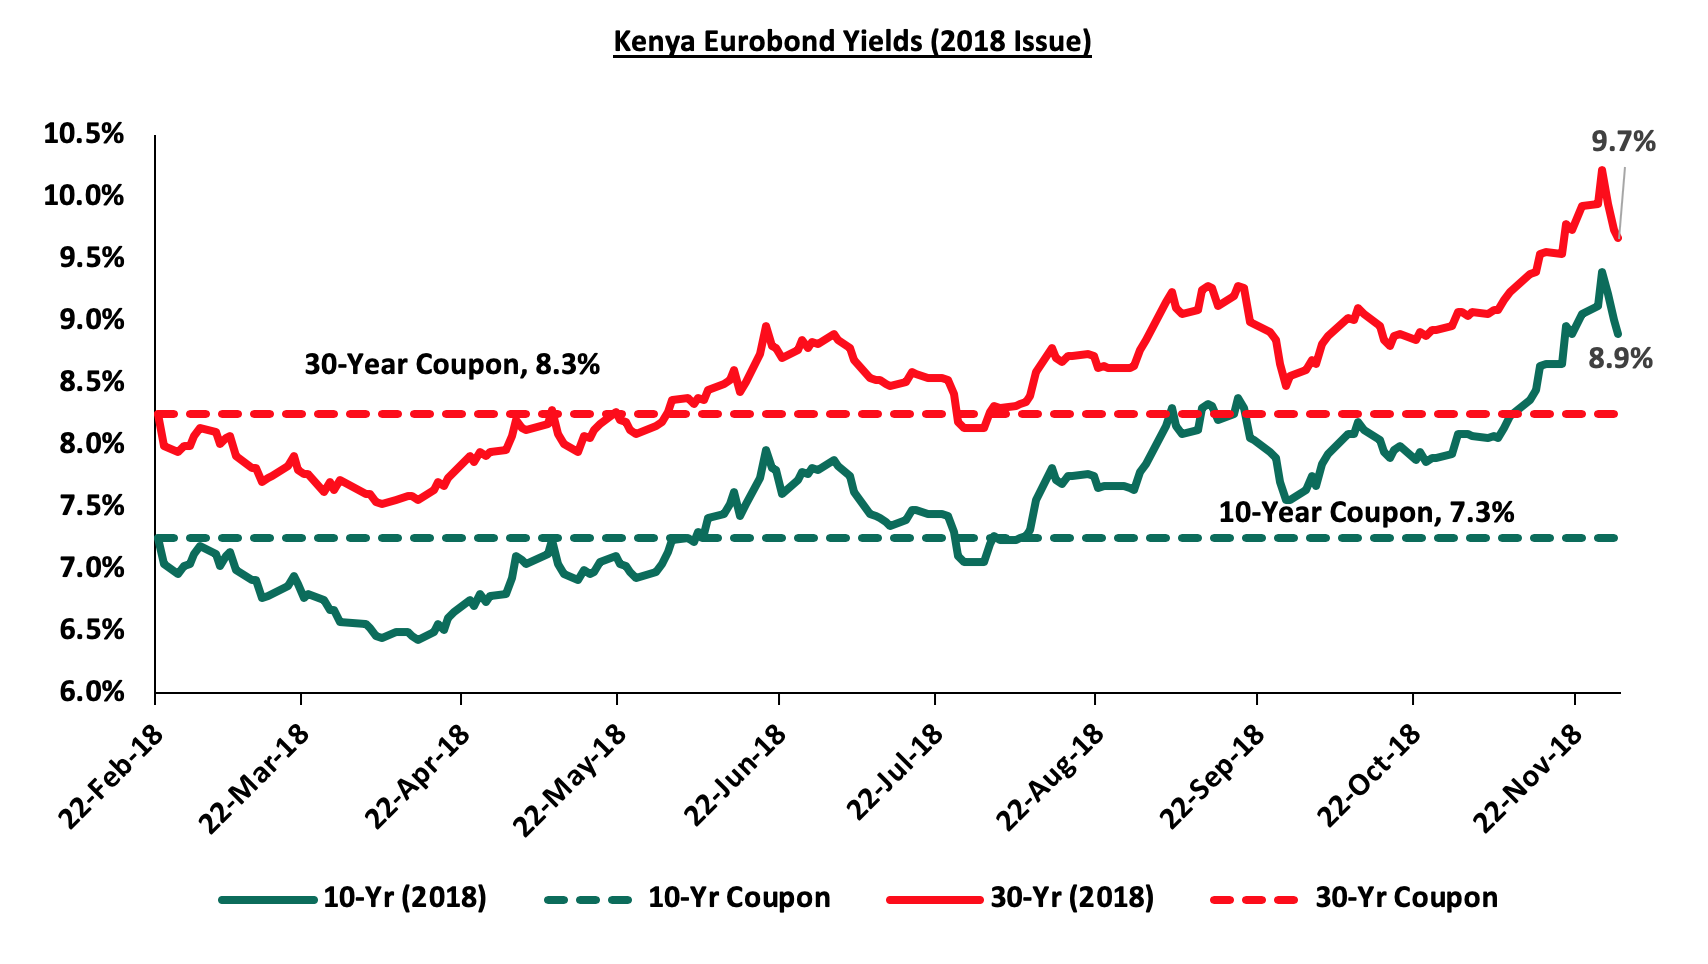
The rising yields on all the Eurobonds during the month signals higher country risk perception by investors, which was partly attributed to the International Monetary Fund (IMF) raising the risk of Kenya’s debt distress from low to moderate in October, resulting in investors demanding a higher return for the risk. The increment in the Federal Rate twice this year, currently at 2.0% - 2.3% has also led to market correction in Eurobond yields in the emerging markets.
The Kenya Shilling:
The Kenya Shilling depreciated by 0.7% against the US Dollar during the month of November to Kshs 102.5 from Kshs 101.8 at the end of October. This was driven by dollar demand by companies in the oil, manufacturing and energy sectors to close end of year orders ahead of the December holidays. During the week, the Kenya Shilling depreciated by 0.1% against the US Dollar to close at Kshs 102.5 from Kshs 102.4, the previous week, due to the end-month demand from oil importers and manufacturers amidst excess liquidity in the market. On an YTD basis, the shilling has appreciated by 0.7% against the US Dollar. In our view, the shilling should remain relatively stable against the dollar in the short term, supported by:
- The narrowing of the current account deficit to 5.3% in the 12-months to September 2018, from 6.5% in September 2017, attributed to improved agriculture exports, increased diaspora remittances, strong receipts from tourism, and lower food and SGR-related equipment relative to 2017,
- Improving diaspora remittances, which increased by 6.9% m/m growth in diaspora remittances in the month of October 2018 to USD 219.2 mn from USD 205.1 mn recorded in September. The y/y growth came in at 18.2% from USD 185.5 mn recorded in October 2017. Cumulatively, total diaspora remittances rose by 39.5% in the 12 months to October 2018 to USD 2.6 bn from USD 1.9 bn recorded in a similar period in 2017., attributed to; (a) recovery of the global economy, (b) increased uptake of financial products by the diaspora due to financial services firms, particularly banks, targeting the diaspora, and (c) new partnerships between international money remittance providers and local commercial banks making the process more convenient, For more analysis on this see our October diaspora remittances note,
- CBK’s activities in the money market, such as repurchase agreements and selling of dollars, and,
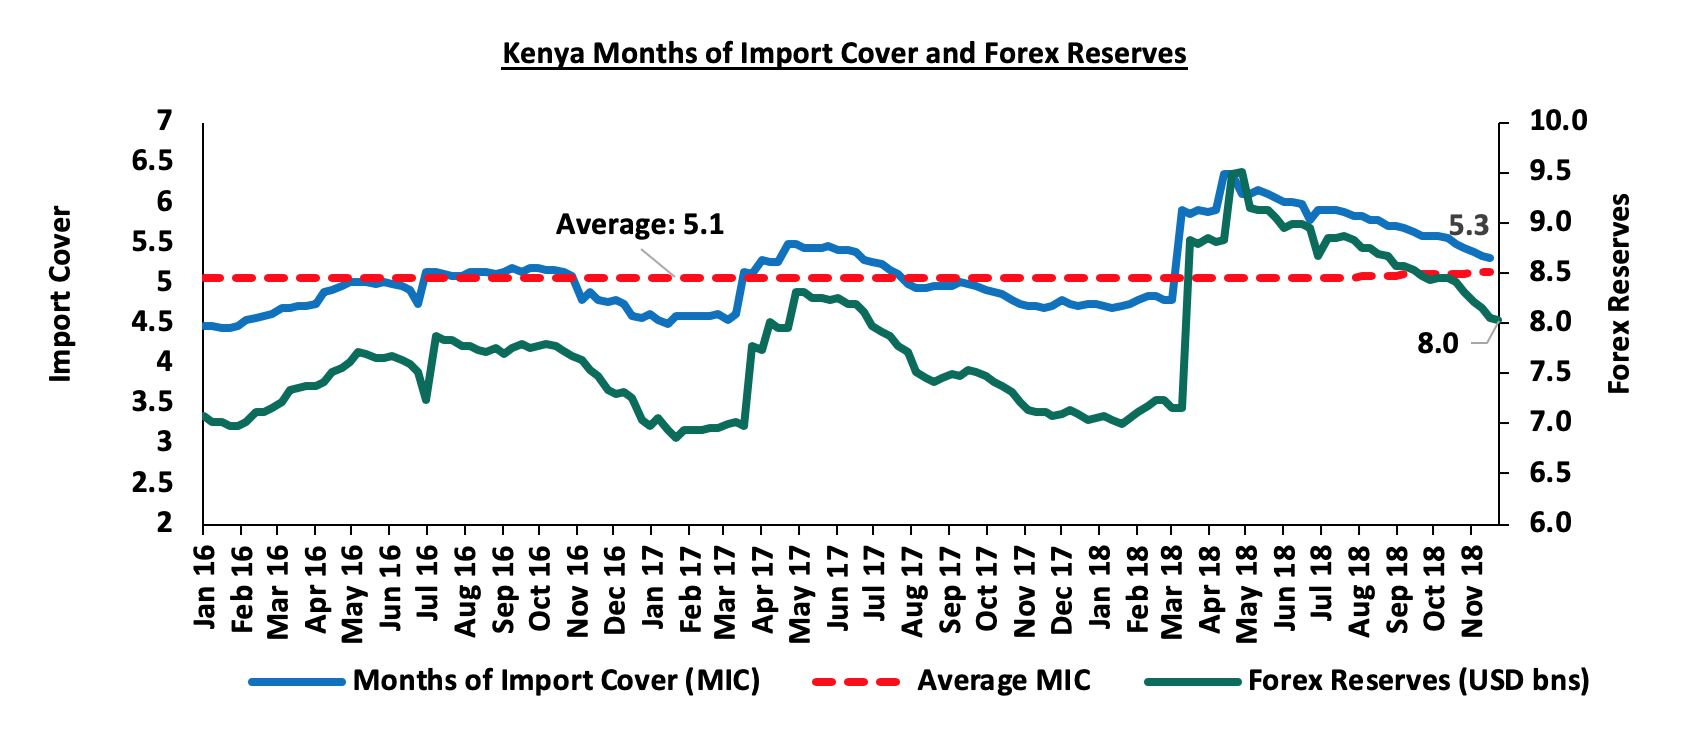
- High levels of forex reserves, currently at USD 8.0 bn, equivalent to 5.3-months of import cover, compared to the one-year average of 5.1 months, as highlighted below:
Inflation:
The Y/Y inflation rate for the month of November increased to 5.6% from 5.5% recorded in October. This was not in line with our projections of 5.7% to 6.1%, as highlighted our Cytonn Weekly Report #45/2018. The variance was due to a 1.2% decline in the housing, water and electricity, gas and other fuels index against our expectations of a marginal rise by 0.2%. The Y/Y rise was mainly due to the base effect as inflation was on a decline in the last quarter of 2017. M/M inflation however declined by 0.2%, attributed to a 0.2% decline in the food and non-alcoholic beverages index coupled with a 1.2% decline in the housing, water, electricity, gas and other fuels index. The decline in the food index was attributed to a decline in the prices of some foodstuffs, which outweighed the increase recorded in others with sugar and cabbages declining by 2.2% and 4.4%. The 1.2% decline in the housing, water, electricity, gas and other fuels index was driven by lower prices of electricity during the month. The cost of consumption of 50 KWh of electricity declined by 31.4% to Kshs 758.0 in November, from Kshs 1,105.0 in October 2018. Transport costs however increased during the month on account of increased pump prices of petrol that outweighed the drop in diesel prices. Below is a summary of key changes in the Consumer Price Index (CPI) in November:
|
Major Inflation Changes in the Month of November 2018 |
|||
|
Broad Commodity Group |
Price change m/m (Nov-18/Oct-18) |
Price change y/y (Nov-18/Nov-17) |
Reason |
|
Food & Non-Alcoholic Beverages |
(0.2%) |
1.7% |
This was on account of a decline in prices of some foodstuffs outweighing increases recorded in others. Price of sugar and cabbages for instance, declined by 2.2% and 4.4%, respectively. |
|
Transport Cost |
0.8% |
15.6% |
This was on account of an increase in the pump prices of petrol which outweighed the decline in diesel prices |
|
Housing, Water, Electricity, Gas and other Fuels |
(1.2%) |
13.7% |
This was on account of lower electricity costs with the cost of consumption of 50 KWh of electricity declining by 31.4% to Kshs 758.0 in November, from Kshs 1,105.0 in October 2018 |
|
Overall Inflation |
(0.2%) |
5.6% |
The m/m decline was due to a 0.2% and 0.9% decline in the food index and the housing, water, electricity, gas and other fuels index which have CPI weights of 36.0% and 18.3%, respectively |
Monetary Policy:
The Monetary Policy Committee (MPC) met on Tuesday 27th November 2018 to review the prevailing macroeconomic conditions and give direction on the Central Bank Rate (CBR). The MPC maintained the CBR at 9.0%, in line with our expectations as detailed in our MPC Note, citing that inflation expectations were still well anchored within the target range and that the economy was operating close to its potential, as evidenced by:
- Month-on-month overall inflation remained within the target range in September and October, largely due to lower food prices and muted demand-driven inflationary pressures. The MPC noted that the inflation rate fell to 5.5% in October from 5.7% in September, following decreases in food prices, which offset the increase in energy prices and transport costs following the implementation of VAT on petroleum products in September 2018,
- The foreign exchange market remained balanced, supported by the narrowing current account deficit, which came in at 5.3% in the 12 months to September 2018 compared to 6.5% in September 2017. The narrowing of the current account deficit is largely due to increased exports of tea and horticulture, increased diaspora remittances, strong receipts from tourism, and lower imports of food and SGR-related equipment relative to 2017,
- Private sector credit growth, which grew by 4.4% in the 12 months to October 2018, compared to 3.9% in September, driven by strong growth in the following key sectors: manufacturing, business services, finance and insurance, and building and construction, which grew by 14.9%, 12.4%, 9.1% and 7.2%, respectively. Growth in private sector credit is expected to pick up gradually with the continued expansion of the economy, and,
- Strong pickup of the economy as per data for the second quarter of 2018, with real GDP growth averaging 6.0% in the first half of 2018 compared to 4.7% in the first half of 2017. This outcome was due to a strong recovery in the agricultural activity due to improved weather conditions, continued recovery of the manufacturing sector, and resilient performance of the service sector particularly trade, tourism, information and communication, transport, and real estate.
The MPC noted that the current policy was still appropriate, but it would continue monitoring any perverse response to its previous decisions as well as developments in the global and domestic economy to take additional measures as necessary See the CBK Release.
Monthly Highlights:
The National Treasury released the budgetary review for the first quarter of the 2018/2019 financial year. Below are the key take-outs:
(All amounts in ‘Kshs bn’ unless stated otherwise)
|
Q1’2018/2019 Budget outturn |
|||||
|
Item |
Q1'2017/2018 |
Q1'2018/2019 |
|||
|
Collected/Spent |
Collected/Spent |
Target |
% met |
Change y/y |
|
|
Total revenue |
345.6 |
366.0 |
438.3 |
83.5% |
5.9% |
|
External grants |
1.6 |
3.6 |
8.1 |
44.4% |
124.0% |
|
Total revenue & external grants |
347.2 |
369.6 |
446.4 |
82.8% |
6.5% |
|
Recurrent expenditure |
294.7 |
345.4 |
360.0 |
96.0% |
17.2% |
|
Development expenditure & Net Lending |
90.7 |
83.6 |
87.8 |
95.2% |
(7.9%) |
|
County governments+contingencies |
26.9 |
23.5 |
55.2 |
42.6% |
(12.5%) |
|
Total expenditure |
412.3 |
452.5 |
502.9 |
90.0% |
9.7% |
|
Fiscal deficit excluding grants |
(65.1) |
(82.9) |
(56.6) |
||
|
Deficit as % of GDP |
0.7% |
0.8% |
0.6% |
||
|
Net foreign borrowing |
7.5 |
16.8 |
14.9 |
113.1% |
125.8% |
|
Net domestic borrowing |
49.2 |
69.2 |
40.7 |
170.1% |
40.7% |
|
Other domestic financing |
0.5 |
3 |
4.0 |
65.0% |
394.9% |
|
Total borrowing |
57.2 |
88.7 |
59.6 |
148.7% |
55.1% |
|
Nominal GDP at market price Estimate |
8,804.9 |
9,990.0 |
9,990.0 |
||
- The total revenue collected amounted to Kshs 366.0 bn, a 5.9% increase from Kshs 345.6 bn collected during the same period the previous year. The government managed to hit 83.5% of the Kshs 438.3 bn target. Ordinary revenue collection from taxes excluding Appropriation in Aid was at Kshs 332.2 bn, against a target of Kshs 400.9 bn, thus the Kenya Revenue Authority managed to meet 82.9% of the set target as per the budget. The revenue was 3.7% of GDP, and,
- The total expenditure amounted to Kshs 452.5 bn, a 9.8% increase from Kshs 412.3 bn recorded the same period last year. This was 90.0% of the Kshs 502.9 bn target, with a significant share of the expenditure being on recurrent expenditure, which accounted for 76.3% of total expenditure. Development expenditure only accounted for 18.5%. Total expenditure was, however, 10.0% lower than the targeted expenditure as per the budget an indication that the austerity measures undertaken by the government were taking effect. The lower expenditure was mainly attributed to lower expenditure recorded in domestic interest payment, wages and salaries and pension expenditures, which came in at Kshs 19.1 bn, Kshs 16.1 bn, and Kshs 9.9 bn, respectively.
We are of the view that revenue mobilization still remains a key concern, with the government having managed to meet 83.5% of its target, which is a decline from the 89.1% recorded in Q1’2017/2018 indicating that the government efforts of improving revenue mobilization have not been successful. The key concern, however, remains on the expenditure side, which has continued to grow faster recording a 9.8% growth, compared to the 5.9% growth in revenue collection. This has led to widening of the fiscal deficit to Kshs 82.9 bn, 0.8% of GDP from Kshs 65.1 bn, 0.7% of GDP in Q1’2017/2018. This in effect has led to increased total government borrowing, both foreign and domestic to plug in the deficit, with domestic borrowing having increased by 40.7% to Kshs 69.2 bn from Kshs 49.2 bn in Q1’2017/2018, while foreign borrowing has increased by 124.0% to Kshs 16.8 bn, from Kshs 7.5 bn in Q1’2017/2018. We are of the view that the government efforts of raising revenue through the implementation of the 8.0% VAT on fuel might not be effective as evidenced by the 25.0% drop in petrol and diesel sales to 255,450 tons in September after its implementation, from 338,460 tons recorded in August. The declined sales might also have a trickle effect in the corporate earnings from oil marketers, due to dampened profits and eventually reduced revenue collections from corporate tax. For more information, see our Cytonn Weekly #44/2018.
Rates in the fixed income market have been on a declining trend, as the government continues to reject expensive bids, as it is currently 14.3% ahead of its pro-rated borrowing target for the current financial year, having borrowed Kshs 137.5 bn against a pro-rated target of Kshs 120.3 bn. The 2018/19 budget had given a domestic borrowing target of Kshs 271.9 bn, 8.6% lower than the 2017/2018 fiscal year’s target of Kshs 297.6 bn, which may result in reduced pressure on domestic borrowing. With the rate cap still in place, with the president having assented to the Finance Bill 2018, we maintain our expectation of stability in the interest rate environment. With the expectation of a relatively stable interest rate environment, our view is that investors should be biased towards medium-term fixed-income instrument.
Market Performance
During the month of November, the equities market had mixed performance with NASI and NSE 25 gaining by 1.2% and 2.5%, respectively, while NSE 20 declined by 0.5%, taking their YTD performance as at the end of November to declines of 14.7%,24.6% and 14.1%, for NASI, NSE 20 and NSE 25, respectively. The equities market performance during the month was driven by gains in large caps stocks such as BAT, East Africa Breweries Limited (EABL), Standard Chartered Bank of Kenya Ltd, Cooperative Bank Kenya and KCB Group, which gained by 9.3%, 8.6%, 3.8%, 3.5% and 3.3%, respectively.
During the week, the equities market was on an upward trend with NASI, NSE 20 and NSE 25 gaining by 1.4%, 1.3% and 2.2%, respectively, due to gains in counters such as East Africa Breweries Limited (EABL), BAT and Co-operative Bank, which gained by 15.2%, 9.3% and 4.2%, respectively.
Equities turnover declined by 39.7% during the month to USD 100.7 mn from USD 167.1 mn in October, taking the YTD turnover to USD 1.7 bn. For this week, equities turnover rose by 89.6% to USD 31.0 mn from USD 16.3 mn in the previous week with foreign investors turning net sellers, with a net selling position of USD 2.3 mn from a net buying position of USD 1.1 mn the previous week. For this month, foreign investors remained net sellers with the net selling position declining by 86.4% m/m to USD 5.9 mn from USD 43.2 mn in October. We expect the market to remain subdued in the near-term as international investors exit the broader emerging markets due to the expectation of rising US interest rates coupled with the strengthening of the US Dollar.
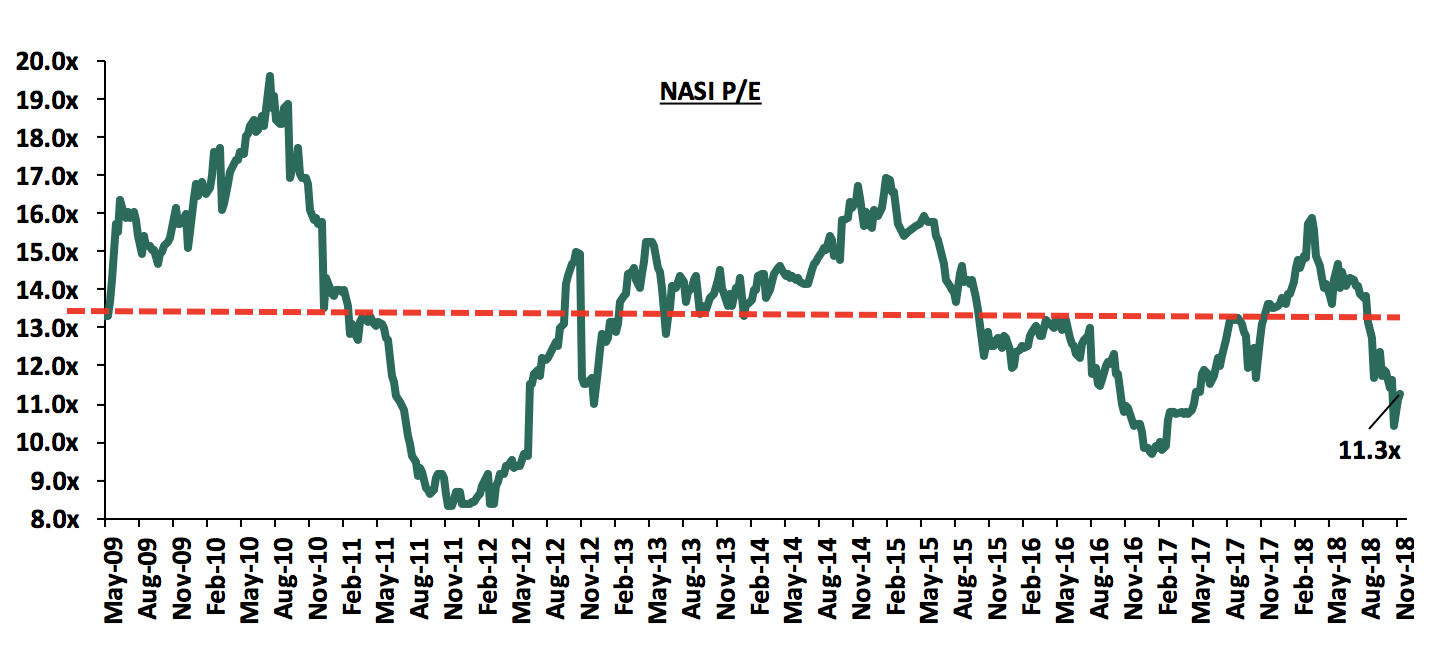
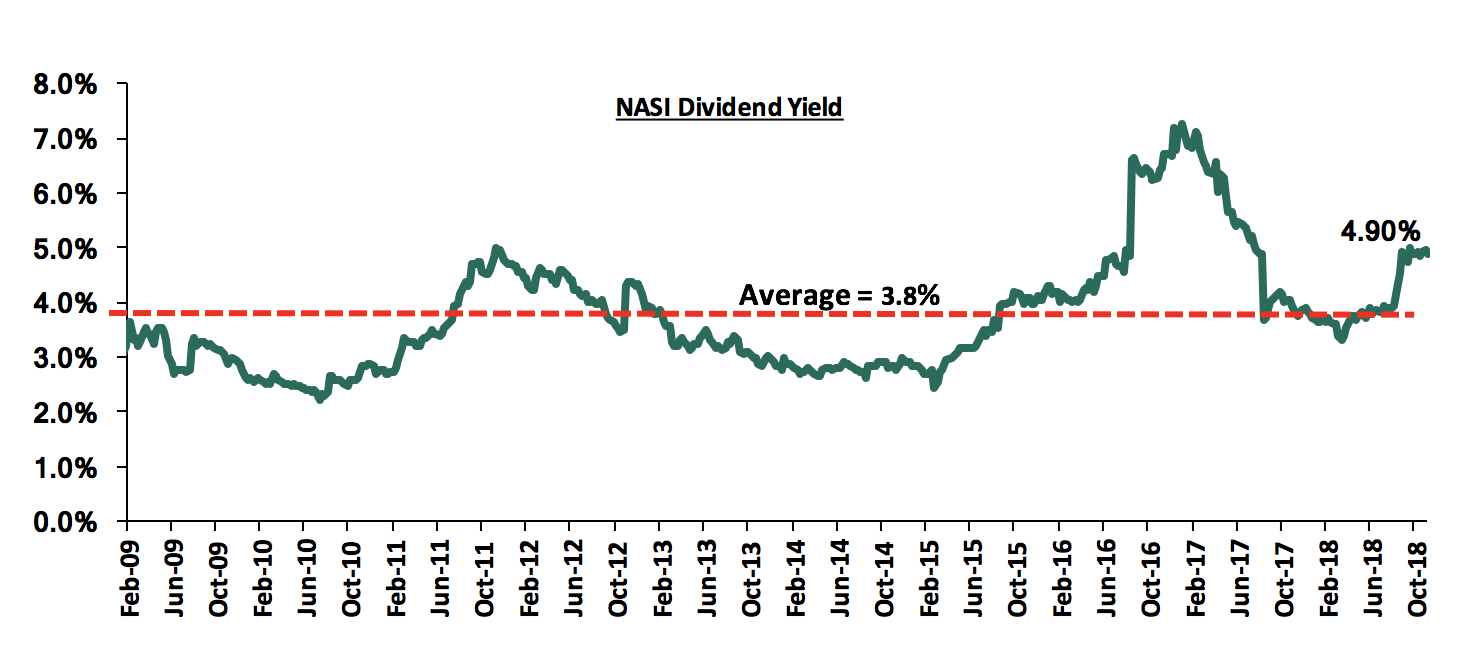
The market is currently trading at a price to earnings ratio (P/E) of 11.3x, 15.7% below the historical average of 13.4x, and a dividend yield of 4.9%, above the historical average of 3.8%. The current P/E valuation of 11.3x is 16.5% above the most recent trough valuation of 9.7x experienced in the first week of February 2017, and 36.1% above the previous trough valuation of 8.3x experienced in December 2011. The charts below indicate the historical P/E and dividend yields of the market.
Earnings Releases
National Bank of Kenya released Q3’2018 results during the week;
National Bank of Kenya released their Q3’2018 financial results with core Earnings Per Share (EPS) increasing by 303.2% to Kshs 1.7, from Kshs 0.4 in Q3’2017, exceeding our expectation of a decrease to a loss per share of Kshs 0.3. However, this was due to the stripping out of an exceptional expense of Kshs 0.5 bn. The bank registered an 84.1% decline in the profit after tax to Kshs 22.0 mn from Kshs 138.1 mn in Q3’2017. The performance was supported by a 16.5% decline in the total operating expenses to Kshs 5.2 bn from Kshs 6.2 bn in Q3’2017 despite an 11.8% decline in total operating income to Kshs 5.6 bn from Kshs 6.4 bn. The variance in core earnings per share growth against our expectations was largely due to the 16.5% decline in total operating expenses to Kshs 5.2 bn from Kshs 6.2 bn, largely due to the write back in Loan Loss Provisions (LLP) of Kshs 0.2 bn, from an expense of Kshs 0.5 bn in Q3’2017. We had anticipated a provisioning expense of Kshs 0.5 bn in Q3’2018.
Highlights of the performance from Q3’2017 to Q3’2018 includes:
- Total operating income declined by 11.8% to Kshs 5.6 bn from Kshs 6.4 bn in Q3’2017. This was due to a 10.0% decline in Net Interest Income (NII) to Kshs 4.1 bn from Kshs 4.6 bn, coupled with the 16.3% decline in Non-Funded Income (NFI) to Kshs 1.5 bn, from Kshs 1.8 bn,
- Interest income declined by 10.5% to Kshs 6.3 bn, from Kshs 7.1 bn in Q3’2017. This was caused by an 18.0% decline in interest income from loans and advances to Kshs 3.1 bn, from Kshs 3.8 bn in Q3’2017, a 0.8% decline in interest income from government securities to Kshs 3.18 bn, from Kshs 3.21 bn in Q3’2017, and a 44.9% decline in interest income on deposits and placements with other banking institutions, to Kshs 0.05 bn from Kshs 0.09 bn in Q3’2017. The yield on interest earning assets remained at 9.6%,
- Interest expense declined by 11.5% to Kshs 2.2 bn, from Kshs 2.5 bn, following an 11.8% decline in the interest expense on customer deposits to Kshs 2.0 bn, from Kshs 2.3 bn in Q3’2017, coupled with an 8.5% decline in Interest expense on deposits and placements from banking institutions to Kshs 0.21 bn from Kshs 0.23 bn in Q3’2017. As a result, of the decrease in interest expenses, the cost of funds declined to 3.0%, from 3.4% in Q3’2017. The Net Interest Margin (NIM) thus rose to 6.6%, from 6.1% in Q3’2017,
- Non-Funded Income (NFI) declined by 16.3% to Kshs 1.5 bn, from Kshs 1.8 bn in Q3’2017. This was largely due to the 32.1% decline in fees and commissions on loans to Kshs 96.2 mn, from Kshs 141.6 mn in Q3’2017, coupled with the 16.8% decline in other fees and commission income to Kshs 0.8 bn, from Kshs 1.0 bn in Q3’2017.Futhermore, other income declined by 28.3% to Kshs 0.2 bn, from Kshs 0.3 bn in Q3’2017 while foreign exchange trading income declined by 2.4% to Kshs 0.40 bn from Kshs 0.42 bn in Q3’2017. As a result of the above performance, the current revenue mix shifted to 73:27 funded to non-funded income as compared to 72:28 in Q3’2017, with the NFI as proportion of total operating income decreasing owing to its faster decline than NII,
- Total operating expenses declined by 16.5% to Kshs 5.2 bn, from Kshs 6.2 bn, largely driven by a write back in Loan Loss Provisions (LLP) of Kshs 0.2 bn in Q3’2018, from a Loan Loss Provision expense of Kshs 0.5 bn in Q3’2017, coupled with a 10.5% decline in other operating expenses to Kshs 2.5 bn in Q3’2018, from Kshs 2.8 bn in Q3’2017. However, staff costs rose marginally by 0.7% to Kshs 2.92 bn from Kshs 2.90 bn in Q3’2017,
- Consequently, the Cost to Income Ratio (CIR) improved to 91.8%, from 96.9% in Q3’2017. However, without LLP, the cost to income ratio deteriorated to 95.9%, from 88.8% in Q3’2017,
- Profit before tax and exceptional items increased by 135.3% to Kshs 0.5 bn, up from Kshs 0.2 bn in Q3’2017. Profit after tax and exceptional items declined by 84.1% to Kshs 0.02 bn in Q3’2018, from Kshs 0.1 bn in Q3’2017, owing to the exceptional items expense of Kshs 0.5 bn incurred in Q3’2018,
- The balance sheet recorded a contraction as total assets decreased by 3.3% to Kshs 112.5 bn from Kshs 116.3 bn in Q3’2017. This decline was largely driven by a 17.1% decline in the net loans and advances to Kshs 48.0 bn, from Kshs 57.9 bn in Q3’2017, which outweighed the 3.2% increase in the government securities to Kshs 41.0 bn, from Kshs 39.7 bn in Q3’2017, and the 22.3% increase in other assets to Kshs 9.1 bn from Kshs 7.4 bn in Q3’2017,
- Total liabilities rose marginally by 0.4% to Kshs 105.5 bn from Kshs 105.1 bn in Q3’2017, driven by a 168.8% increase in placement liabilities to Kshs 5.8 bn from Kshs 2.2 bn in Q3’2017, coupled with a 24.0% rise in other liabilities to Kshs 6.8 bn from Kshs 5.5 bn in Q3’2017. These were however weighed down by a 4.7% decline in customer deposits to Kshs 92.8 bn from Kshs 97.4 bn in Q3’2017. Deposits per branch rose by 2.1% to Kshs 1.33 bn, from Kshs 1.30 bn in Q3’2017, with 5 branches closed during the period to bring the total number of branches to 70,
- The faster decline in loans as compared to deposits led to an decrease in the loan to deposit ratio to 51.7%, from 59.4% in Q3’2017.The proportion of government securities to deposits increased, to 44.2% from 38.1% in Q3’2017, owing to an increase in government securities coupled with a decline in deposits,
- Gross Non-Performing Loans (NPLs) increased by 4.3% to Kshs 30.9 bn in Q3’2018, from Kshs 29.6 bn in Q3’2017. Consequently, the NPL ratio deteriorated to 47.1% in Q3’2018, from 43.8% in Q3’2017. General Loan Loss Provisions (LLPs) increased by 113.3% to Kshs 13.3 bn from Kshs 6.2 bn in Q3’2017. Thus, as a consequence, the NPL coverage improved to 57.1% in Q3’2018 from 33.0% in Q3’2017. The write back in specific provisions despite a deterioration in asset quality, is due banks being allowed to charge provisions on equity, on the initial implementation of IFRS 9,
- Shareholders’ funds declined by 37.6% to Kshs 7.0 bn in Q3’2018 from Kshs 11.2 bn in Q3’2017, as retained earnings of Kshs 2.1 bn in Q3’2017 were depleted, to accumulated losses of Kshs 5.0 bn in Q3’2018, outweighing the 203.3% increase in statutory loan loss reserves to Kshs 3.8 bn from Kshs 1.3 bn in Q3’2017,
- National Bank of Kenya Ltd remains severely undercapitalized with a core capital to risk weighted assets ratio of 2.6%, 7.9% points below the statutory requirement. In addition, the total capital to risk weighted assets ratio was 4.1%, below the statutory requirement by 10.4% points. Adjusting for IFRS 9, the core capital to risk weighted assets stood at 3.1%, while total capital to risk weighted assets came in at 4.5%, indicating that the bank’s total capital relative to its risk-weighted assets declined by 0.4% points on implementation of IFRS 9,
- The bank currently has a Return on Average Assets (ROaA) of 0.3% and a Return on Average Equity (ROaE) of 3.2%.
Key Take-Outs:
- National Bank remains severely undercapitalized with the total capital to risk-weighted assets ratio coming in at 4.1%, 10.4% points below the 14.5%, as required by regulation. The bank has been granted exemption to operate below the regulatory requirement, with the promise of mobilizing capital to meet the requirements, by both debt and a rights issue. With such depleted capital reserves, the bank becomes increasingly vulnerable to any future external shocks that may affect its continuity in the future, in addition to rendering the bank unable to issue new loans.
- The bank experienced a deterioration in its asset quality, with the NPL ratio rising to 47.1% from 43.8% in Q3’2017, and is still the highest in the listed banking space, thus requiring the bank needs to adopt a raft of corrective measures to improve on the overall asset quality. The bank’s lending activities have continued to be hampered by the poor asset quality, as corrective and recovery efforts seem not to be bearing fruit, leading to a decline in its interest income, as well as the associated fees and commission income.
- The bank recorded declines in all of its revenue lines, as the bank has failed to adapt to a tough operating environment occasioned by the interest rate cap, and a severe drought that affected the country, and whose effects spilled over to the current year. This consequently led to the overall decline in the operating profit as they were not matched proportionate declines in the operating expenses. Furthermore, the bank incurred an exceptional items expense of Kshs 0.5 bn, which negatively affected the bank’s profitability.
For more information, see our National Bank Q3’2018 Earnings Note.
I&M Holdings released their Q3’2018 financial results during the week;
I&M Holdings released their Q3’2018 financial results with core Earnings Per Share increasing by 21.4% to Kshs 13.4 from Kshs 11.0 in Q3’2017, in line with our projections of a 22.6% growth to Kshs 13.5. The performance was driven by a 6.8% increase in total operating income to Kshs 15.8 bn from 14.8 bn in Q3’2017, despite being weighed down by the 5.4% increase in the total operating expenses to Kshs 8.2 bn from Kshs 7.8 bn in Q3’2017.
Highlights of the performance from Q3’2017 to Q3’2018 include:
- Total operating income increased by 6.8% to Kshs 15.8 bn from Kshs 14.8 bn in Q3’2017. This was due to a 38.4% increase in Non-Funded Income (NFI) to Kshs 5.6 bn, from Kshs 4.0 bn in Q3’2017, which outpaced the 4.9% decrease in Net Interest Income (NII) to Kshs 10.3 bn, from Kshs 10.8 bn in Q3’2017,
- Interest income increased by 3.3% to Kshs 17.9 bn, from Kshs 17.3 bn in Q3’2017, largely driven by the 4.0% growth in interest income on loans and advances to Kshs 13.7 bn from Kshs 13.1 bn in Q3’2017. Interest income on government securities remained flat at Kshs 4.0 bn. Interest income on deposits and placements with banking institutions rose by 74.6% to Kshs 0.2 bn from Kshs 0.1 bn in Q3’2017. However, the yield on interest earning assets declined to 8.0% in Q3’2018, from 8.7% in Q3’2017, due to a relatively faster growth in the interest earning assets by 15.3% to of 240.8bn from 208.7 bn in Q3’2017,
- Interest expense increased by 16.8% to Kshs 7.6 bn, from Kshs 6.5 bn in Q3’2017, following a 14.5% increase in the interest expense on customer deposits to Kshs 6.4 bn, from Kshs 5.8 bn in Q3’2017. Interest expense on deposits and placements from banking institutions increased by 114.8% to Kshs 0.5 bn from Kshs 0.2 bn in Q3’2017. Thus, the cost of funds increased to 4.8%, from 3.8% in Q3’2017. As a consequence, the Net Interest Margin (NIM) declined to 6.7%, from 7.7% in Q3’2017,
- Non-Funded Income (NFI) increased by 38.4% to Kshs 5.6 bn, from Kshs 4.0 bn in Q3’2017. The growth in NFI was largely driven by the 48.0% growth in Fees and commission income on loans to Kshs 1.2 bn from Kshs 0.8 bn in Q3’2017, coupled with a 42.6% growth in foreign exchange trading income to Kshs 1.9 bn from Kshs 1.3 bn in Q3’2017. Furthermore, other fees and commission income grew by 20.3% to Kshs 1.8 bn, from Kshs 1.5 bn in Q3’2017. As a result of the above performance, the current revenue mix shifted to 65:35 funded to non-funded income as compared to 73:27 in Q3’2017,
- Total operating expenses increased by 5.4% to Kshs 8.2 bn, from Kshs 7.8 bn in Q3’2017, largely driven by a 8.3% increase in staff cost to Kshs 3.1 bn in Q3’2018, from Kshs 2.9 bn in Q3’2017, coupled with a 6.7% increase in other expenses to Kshs 3.2 bn in Q3’2018, from Kshs 3.0 bn in Q3’2017. Loan Loss provision (LLP) however declined marginally by 1.1% to Kshs 1.91 bn from Kshs 1.90 bn in Q3’2017,
- As a result, Cost to Income Ratio (CIR) improved to 51.7%, from 52.4% in Q3’2017. Without LLP, the cost to income ratio deteriorated, albeit marginally, to 39.7%, from 39.5% in Q3’2017,
- Profit before tax increased by 11.9% to Kshs 8.3 bn from Kshs 7.4 bn in Q3’2017. Profit after tax increased by 21.4% to Kshs 5.5 bn in Q3’2018, from Kshs 4.6 bn in Q3’2017,
- The balance sheet recorded an expansion as total assets increased by 22.4% to Kshs 289.6 bn, from Kshs 236.6 bn in Q3’2017. This growth was largely driven by a 304.0% increase in deposits and placements with banking institutions to Kshs 34.1 bn from Kshs 8.4 bn in Q3’2017, coupled with a 8.6% increase in the loan book to Kshs 163.3 bn, from Kshs 150.5 bn in Q3’2017, despite a 13.0% decline in government securities to Kshs 43.4 bn from Kshs 49.9 bn in Q3’2017,
- Total liabilities rose by 25.7% to Kshs 239.8 bn, from Kshs 190.8 bn in Q3’2017, driven by a 27.6% increase in total deposits to Kshs 209.0 bn, from Kshs 163.8 bn in Q3’2017. Placement liabilities increased by 86.8% to Kshs 12.4 bn from Kshs 6.6 bn in Q3’2017. Borrowed funds however decreased by 2.2% to Kshs 12.0 bn from Kshs 12.3 bn in Q3’2017,
- The faster growth in deposits as compared to loans led to a decline in the loan to deposit ratio to 78.1% from 91.8% in Q3’2017. The proportion of government securities to deposits decreased to 20.8% from 30.5% in Q3’2017,
- Gross Non-Performing Loans (NPLs) increased by 94.2% to Kshs 22.1 bn in Q3’2018 from Kshs 11.4 bn in Q3’2017. Consequently, the NPL ratio deteriorated to 12.7% in Q3’2018 from 7.2% in Q3’2017. General Loan Loss Provisions (LLPs) increased by 59.0% to Kshs 5.9 bn from Kshs 3.7 bn in Q3’2017. The NPL coverage declined to 49.2% in Q3’2018 from 62.2% in Q3’2017, despite a 48.1% increase in interest in suspense to Kshs 5.0 bn, from Kshs 3.4 bn in Q3’2017. The decline in the specific provisions by 1.1% to Kshs 1.91 bn from Kshs 1.90 bn in Q3’2017 despite a deterioration in asset quality, is due to banks being allowed to charge provisions on equity, on the initial implementation of IFRS 9,
- Shareholders’ funds increased by 8.7% to Kshs 47.0 bn in Q3’2018 from Kshs 43.2 bn in Q3’2017. The growth was mainly driven by a 19.4% increase in the statutory loan loss reserves to Kshs 1.4 bn from Kshs 1.2 bn in Q3’2017, coupled with a 9.8% increase in the revaluation reserve to Kshs 0.8 bn from Kshs 0.7 bn in Q3’2017,
- I&M Holdings is currently sufficiently capitalized with a core capital to risk weighted assets ratio of 15.3%, 4.8% points above the statutory requirement. In addition, the total capital to risk weighted assets ratio was 16.9%, exceeding the statutory requirement by 2.4% points. Adjusting for IFRS 9, the core capital to risk weighted assets stood at 15.3%, while total capital to risk weighted assets came in at 17.3%, indicating that the bank’s total capital relative to its risk-weighted assets increased by 0.4% points due to implementation of IFRS 9,
- The bank currently has a Return on Average Assets (ROaA) of 2.9%, and a Return on Average Equity (ROaE) of 17.2%.
Key Take-Outs:
- The bank had a deterioration in its asset quality, with the gross NPLs rising by 94.2% y/y, as the industry wide asset quality continues to deteriorate, sighting delayed government payments coupled with the relatively tighter macroeconomic environment, affecting borrowers’ credit servicing ability,
- The bank managed to improve the Non- Funded Income by 38.4%. This shows the bank’s improved focus on digital innovation and alternative banking channels, which enhanced the increase in the fee income hence increasing the total operating income.
For more information, see our I&M Holdings Q3’2018 Earnings Note.
NIC Group released their Q3’2018 financial results during the week;
NIC Group released their Q3’2018 financial results during the week with core earnings per share declining by 3.3% to Kshs 4.56 from Kshs 4.72 in Q3’2017, which was in line with our expectation of a 2.8% decline to Kshs 4.58. Performance was driven by a 2.2% decline in total operating income to Kshs 11.0 bn from Kshs 11.2 bn in Q3’2017, which outweighed the 2.5% decline in total operating expenses to Kshs 6.6 bn from Kshs 6.8 bn..
Highlights of the performance from Q3’2017 to Q3’2018 includes:
- Total operating income declined by 2.2% to Kshs 11.0 bn in Q3’2018 from Kshs 11.2 bn in Q3’2017. This was due to a 5.9% decrease in Net Interest Income (NII) to Kshs 7.6 bn from Kshs 8.0 bn in Q3’2017, which outweighed the 7.2% increase in Non-Funded Income (NFI) to Kshs 3.4 bn from Kshs 3.2 bn in Q3’2017,
- Interest income increased by 5.5% to Kshs 14.2 bn from Kshs 13.5 bn in Q3’2017. This was largely driven by the 40.5% increase in interest income from government securites to Kshs 5.0 bn in Q3’2018 from Kshs 3.6 bn in Q3’2017, coupled with a 144.0% increase in interest income from deposits and placements with banking institutions to Kshs 133.3 mn from Kshs 46.5 mn in Q3’2017. However, interest income on loans and advances decreased by 7.9% to Kshs 9.1 bn from Kshs 9.9 bn in Q3’2017.However, the yield on interest earning assets declined to 10.8% in Q3’2018 from 10.9% in Q3’2017, due to the 2.8% increase in interest-earning assets to Kshs 180.6 bn from Kshs 175.7 bn in Q3’2017,
- Interest expense increased by 22.2% to Kshs 6.7 bn from Kshs 5.5 bn in Q3’2017, as interest expense on customer deposits increased 29.0% to Kshs 5.5 bn from Kshs 4.3 bn in Q3’2017. Interest expense on deposits from other banking institutions remained relatively flat at Kshs 0.1 bn, same as in Q3’2017. As a consequence, the cost of funds rose to 5.6% from 4.7% in Q3’2017, and the Net Interest Margin declined to 5.8% from 6.6% in Q3’2017,
- Non-Funded Income increased by 7.2% to Kshs 3.4 bn from Kshs 3.2 bn in Q3’2017. The increase in NFI was driven by a 10.7% increase in forex trading income to Kshs 1.0 bn from Kshs 0.9 bn in Q3’2017, coupled with an 11.2% increase in income from other fees and commissions to Kshs 739.6 mn from Kshs 665.3 mn in Q3’2017. Furthemore, Income from fees and commissions on loans increased by 2.2% to Kshs 1.09 bn from Kshs 1.07 bn in Q3’2017, while other income increased by 6.2% to Kshs 0.6 bn from Kshs 0.5 bn in Q3’2017. The revenue mix shifted to 69:31 funded to non-funded income in Q3’2018 from 72:28 in Q3’2017, owing to the increase in NFI, coupled with the decline in NII,
- Total operating expenses decreased by 2.5% to Kshs 6.6 bn from Kshs 6.8 bn, largely driven by a 25.4% decrease in loan loss provision (LLP) to Kshs 1.6 bn in Q3’2018 from Kshs 2.1 bn in Q3’2017. Staff costs, however, increased by 8.8% to Kshs 2.6 bn in Q3’2018 from Kshs 2.4 bn in Q3’2017. Other operating expenses rose by 7.2% to Kshs 2.4 bn from 2.3 bn in Q3’2017,
- The cost to income ratio improved marginally to 60.6% from 60.8% in Q3’2017. Without LLP, however, the cost to income ratio deteriorated to 46.0% from 41.6% in Q3’2017,
- Profit before tax decreased by 1.7% to Kshs 4.3 bn, from Kshs 4.4 bn in Q3’2017. Profit after tax decreased by 3.3% to Kshs 3.2 bn in Q3’2018 from Kshs 3.3 bn in Q3’2017,
- The balance sheet recorded an expansion with total assets growth of 3.1% to Kshs 201.8 bn from Kshs 195.7 bn in Q3’2017. This growth was largely driven by a 16.2% increase in government securities to Kshs 60.2 bn from Kshs 51.8 bn in Q3’2017, alongside a 26.9% increase in other assets to Kshs 9.6 bn from Kshs 7.6 bn in Q3’2017,
- The loan book contracted by 3.1% to Kshs 114.9 bn in Q3’2018 from Kshs 118.6 bn in Q3’2017,
- Total liabilities rose by 3.8% to Kshs 167.9 bn from Kshs 161.8 bn in Q3’2017, driven by a 10.3% increase in customer deposits to Kshs 145.0 bn from Kshs 131.4 bn in Q3’2017, alongside a 46.1% increase in other liabilities, to Kshs 4.2 bn, from Kshs 2.8 bn in Q3’2017. Deposits per branch decreased marginally by 0.5% to Kshs 3.5 bn from Kshs 3.6 bn in Q3’2017 due to the opening of 4 new branches,
- The growth in deposits coupled with the decline in loans led to a decline in the loan to deposit ratio to 79.3% from 90.2% in Q3’2017. Government securities to deposits rose to 41.5% from 39.4% in Q3’2017, due to the faster increase in government securities compared to the increase in deposits,
- Gross non-performing loans increased by 11.7% to Kshs 16.4 bn in Q3’2018 from Kshs 14.7 bn in Q3’2017. Consequently, the NPL ratio deteriorated to 13.3% in Q3’2018 from 11.7% in Q3’2017. General Loan loss provisions increased by 27.7% to Kshs 6.6 bn from Kshs 5.2 bn in Q3’2017. Consequently, the NPL coverage improved to 51.4% in Q3’2018 from 48.1% in Q3’2017. The decline in the specific provisions despite the deterioration in asset quality is due to banks being allowed to charge the provision expense on shareholders equity, on implementation of IFRS 9,
- Shareholders’ funds increased by 0.3% to Kshs 33.5 bn in Q3’2018 from Kshs 33.4 bn in Q3’2017, driven by a 0.6% increase in retained earnings to Kshs 27.6 bn from Kshs 27.4 bn in Q3’2017,
- NIC Group is currently sufficiently capitalized with a core capital to risk weighted assets ratio of 18.1%, 7.6% above the statutory requirement. In addition, the total capital to risk weighted assets ratio was 20.1%, exceeding the statutory requirement by 5.6%. Adjusting for IFRS 9, the core capital to risk weighted assets stood at 19.3%, while total capital to risk weighted assets came in at 21.2%,
- NIC Group currently has a return on average assets of 2.0% and a return on average equity of 12.1%.
Key Take-Outs:
- NIC Group’s cost of funds increased to 5.6% in Q3’2018 from 4.7% in Q3’2017, which is way above the listed banking sector average of 3.4%, on the back of a 37.7% increase in interest expense on customer deposits brought about by a 5% increase in customer deposits. This highlights the bank’s inability to mobilize inexpensive deposits from its clientele base as it offers high rates to attract deposits. The bank needs to mobilize cheap deposits for it to benefit from the clause in the Finance Bill 2018, which scrapped the 70.0% floor on bank deposits,
- The bank’s cost to income ratio (without loan loss provisions) deteriorated to 46.0% in Q3’2018, from 41.6% in Q3’2017. This was partly attributable to an 8.8% increase in staff costs to Kshs 2.6 bn in Q3’2018 from Kshs 2.4 bn in Q3’2017, coupled with the 2.2% decline in total operating income, to Kshs0 bn in Q3’2018, from Kshs 11.2 bn in Q3’2017.
For more information, see our NIC Group Q3’2018 Earnings Note.
HF Group released their Q3’2018 financial results during the week;
HF Group released their Q3’2018 financial results recording a loss per share of Kshs 0.9 in Q3’2018, from a core earnings per share of Kshs 0.5 recorded in Q3’2017, in line with our expectations of a decline to a loss per share of Kshs 0.4. The performance was driven by a 15.4% decline in total operating income, coupled with a 4.6% rise in the total operating expenses.
Highlights of the performance from Q3’2017 to Q3’2018 include:
- Total operating income declined by 15.4%, to Kshs 2.4 bn in Q3’2018, from Kshs 2.8 bn over the same period to Q3’2017. This was due to a 17.8% decline in Net Interest Income (NII) to Kshs 1.8 bn from Kshs 2.2 bn in Q3’2017, coupled with a 7.2% decline in Non-Funded Income (NFI) to Kshs 0.60 bn, from Kshs 0.64 bn in Q3’2017,
- Interest income declined by 14.1% to Kshs 4.7 bn, from Kshs 5.5 bn in Q3’2017. This was driven by a 13.6% decline in interest income on loans and advances to Kshs 4.4 bn from Kshs 5.1 bn recorded in Q3’2017, coupled with a 12.5% decline in interest from government securities to Kshs 237.9 mn, from Kshs 314.1 mn in Q3’2017. As a result of the decline in interest income, the yield on interest earning assets declined to 11.8% in Q3’2018, from 12.4% in Q3’2017,
- Interest expense declined by 11.7% to Kshs 2.9 bn, from Kshs 3.3 bn in Q3’2017, following a 6.8% decline in the interest expense on customer deposits to Kshs 1.7 bn, from Kshs 1.8 bn in Q3’2017. Furthermore, other interest expenses declined by 22.8% to Kshs 1.1 bn, from Kshs 1.4 bn in Q3’2017. Due to the decline in interest expenses, the cost of funds declined to 7.0%, from 7.4% in Q3’2017. The Net Interest Margin (NIM) declined to 4.6%, from 5.1% in Q3’2017,
- Non-Funded Income (NFI) declined by 7.2% to Kshs 598.0 mn, from Kshs 644.6 mn in Q3’2017. Fees and commissions on loans declined by 36.0% to Kshs 27.7 mn, from Kshs 43.2 mn in Q3’2017. Other fees and commission income declined by 29.5% to Kshs 112.6 mn, from Kshs 159.8 mn in Q3’2017. Forex trading income increased by 10.9% to Kshs 2.1 bn, from Kshs 1.9 bn in Q3’2017. However, other income rose by 7.2% to Kshs 426.8 mn, from Kshs 398.0 mn in Q3’2017. As a result of the above performance, the current revenue mix shifted to 75:25 funded to non-funded income as compared to 77:23 in Q3’2017. The proportion of NII to total revenue decreased owing to the slower decline in NFI at 7.2%, compared to the 17.8% decline in Net Interest Income (NII),
- Total operating expenses rose by 4.6% to Kshs 2.7 bn, from Kshs 2.6 bn, largely driven by a 15.7% rise in staff costs to Kshs 932.5 mn from Kshs 806.3 mn in Q3’2017, which the management attributed to a redundancy exercise taken, which increased the staff cost due to the one-off payout. Other operating expenses rose by 9.5% to Kshs 1.1 bn from Kshs 967.1 mn in Q3’2017. Loan Loss Provisions (LLP) however declined by 25.4% to Kshs 357.2 mn in Q3’2018, from Kshs 478.9 mn in Q3’2017.Consequently, the Cost to Income Ratio (CIR) deteriorated to 113.5%, from 91.8% in Q3’2017. Without LLP, the cost to income ratio also deteriorated to 98.6%, from 74.9% in Q3’2017,
- HF Group made a loss after tax of Kshs 332.1 mn from a profit after tax of Kshs 231.9 mn in Q3’2017,
- The balance sheet recorded a contraction as total assets declined by 10.5% to Kshs 63.4 bn from Kshs 70.8 bn in Q3’2017. This decline was largely driven by an 11.3% decline in loans and advances to Kshs 45.4 bn, from Kshs 51.2 bn in Q3’2017. Government securities rose by 429.5% to Kshs 3.9 bn from Kshs 730.6 mn in Q3’2017,
- Total liabilities declined by 11.6% to Kshs 52.6 bn from Kshs 59.5 bn in Q3’2017, mainly attributed to a 35.3% decline in borrowed funds to Kshs 15.4 bn from Kshs 23.7 bn in Q3’2017. Deposits however rose by 3.0% to Kshs 34.7 bn from Kshs 33.6 bn recorded in Q3’2017. Deposits per branch rose by 17.2% to Kshs 1.6 bn from Kshs 1.4 bn in Q3’2017 with the number of branches declining to 22 from 25 as at Q3’2017, on the closure of 3 branches in H1’2018,
- The decline in loans and advances coupled with the increase in deposits led to a decline in the loan to deposit ratio to 131.1%, from 152.3% in Q3’2017. Loans to loanable funds however rose to 92.0% from 88.8% recorded in Q3’2017 The proportion of government securities to deposits increased, to 11.2% from 2.2% in Q3’2017,
- Gross Non-Performing Loans (NPLs) increased by 10.4% to Kshs 8.9 bn in Q3’2018, from Kshs 8.1 bn in Q3’2017. The increase in NPL’s was attributed to the unfavorable trading environment during the quarter, leading to a slowdown in the real estate sector. Consequently, the NPL ratio deteriorated to 18.2% in Q3’2018, from 15.0% in Q3’2017. General Loan Loss Provisions (LLPs) increased by 45.2% to Kshs 2.3 bn from Kshs 1.6 bn in Q3’2017. Consequently, the NPL coverage improved to 42.4% in Q3’2018 from 36.8% in Q3’2017 supported by the 45.2% increase in in general provisions. The decline in the specific provisions despite a deterioration in asset quality, is due banks being allowed to charge provisions on equity, on the initial implementation of IFRS 9,
- Shareholders’ funds declined by 4.3% to Kshs 10.8 bn in Q3’2018 from Kshs 11.3 bn in Q3’2017, as retained earnings of Kshs 3.8 bn in Q3’2017 were depleted by 32.5% to Kshs 2.6 bn in Q3’2018,
- HF Group Limited remains sufficiently capitalized with a core capital to risk weighted assets ratio of 14.1%, 3.6% points above the statutory requirement. In addition, the total capital to risk weighted assets ratio was 15.5%, exceeding the statutory requirement by 1.0% points. Adjusting for IFRS 9, the core capital to risk weighted assets stood at 14.7%, while total capital to risk weighted assets came in at 16.2%, indicating that the bank’s total capital relative to its risk-weighted assets declined by 0.7% points due to implementation of IFRS 9,
- The bank currently has a Return on Average Assets (ROaA) of (0.5%) and a Return on Average Equity (ROaE) of (3.3%).
Key Take-Outs:
- The bank experienced a deterioration in asset quality, with gross non-performing loans (NPLs) rising by 10.4%, to Kshs 8.9 bn in Q3’2018, from Kshs 8.1 bn in Q3’2017. This warranted increased provisioning by 45.2% to Kshs 2.3 bn from Kshs 1.6 bn in Q3’2017 and consequently an increase in the NPL coverage to to 42.4% in Q3’2018 from 36.8% in Q3’2017. The deteriorating asset quality, coupled with the tough operating environment occasioned by the interest rate cap, has continued to hamper the bank’s lending activities, leading to a decline in its interest income, as well as the associated fees and commission income.
- The bank recorded declines in all of its revenue lines. This has resulted in the Bank issuing a profit warning for FY’2018 which the management has attributed to the downward revisions of the Central Bank Rate (CBR) that have led to reductions in lending rates during the year, hence negatively impacting the bank’s net interest income. The Business performance of the Bank has also been adversely affected by increased non-performing loans due to the unfavorable trading environment that has led to a slowdown in the real estate sector.
- The bank deteriorated on its operational efficiency as the Cost to income ratio increased to 113.5%, from 91.8% in Q3’2017. Without LLP, the cost to income ratio also deteriorated to 98.6%, from 74.9% in Q3’2017. This was largely driven by a 15.7% rise in staff costs to Kshs 932.5 mn from Kshs 806.3 mn in Q3’2017 which the management attributed to a redundancy exercise taken which increased the staff cost due to a one-off payout. Going forward we expect the expenses to decline, with the continued implementation of the Bank’s digital banking strategy.
For more information, please see our HF Group Q3’2018 Earnings Note.
The performance of the listed banking sector is summarized in the table below:
|
Listed Banking Sector Operating Metrics |
||||||||||||||
|
Bank |
Core EPS Growth |
Interest Income Growth |
Interest Expense Growth |
Net Interest Income Growth |
Net Interest Margin |
Non-Funded Income (NFI) Growth |
NFI to Total Operating Income |
Growth in Total Fees & Commissions |
Deposit Growth |
Growth In Govt Securities |
Loan Growth |
LDR |
Cost of Funds |
Return on Average Equity |
|
NBK |
303.2% |
(10.5%) |
(11.5%) |
(10.0%) |
6.6% |
(16.3%) |
26.8% |
(18.7%) |
(4.7%) |
3.2% |
(17.1%) |
51.7% |
3.0% |
3.2% |
|
Stanbic Bank |
46.7% |
13.3% |
19.7% |
9.7% |
6.2% |
19.6% |
47.0% |
9.3% |
20.3% |
(17.6%) |
16.3% |
77.8% |
2.2% |
14.3% |
|
SCBK |
33.9% |
4.8% |
2.1% |
5.9% |
8.5% |
9.7% |
32.6% |
31.2% |
(8.0%) |
(6.1%) |
(2.8%) |
50.6% |
3.4% |
18.6% |
|
KCB Group |
19.7% |
5.1% |
16.0% |
1.8% |
8.5% |
2.6% |
33.1% |
(7.9%) |
6.2% |
15.3% |
3.8% |
82.6% |
3.2% |
21.7% |
|
I&M |
18.3% |
3.3% |
16.8% |
(4.9%) |
6.7% |
38.4% |
35.1% |
30.1% |
27.6% |
(13.0%) |
8.6% |
78.1% |
4.8% |
17.2% |
|
DTB |
10.0% |
3.0% |
3.0% |
2.9% |
6.1% |
6.3% |
21.7% |
7.4% |
6.5% |
17.7% |
0.7% |
70.0% |
4.9% |
13.3% |
|
Co-op Bank |
8.2% |
3.5% |
0.7% |
4.7% |
8.3% |
4.3% |
32.7% |
(29.7%) |
2.5% |
16.9% |
(2.0%) |
85.9% |
3.8% |
17.6% |
|
Equity Group |
8.1% |
8.6% |
13.5% |
7.2% |
8.5% |
(6.7%) |
40.0% |
(1.7%) |
9.1% |
24.1% |
8.6% |
71.7% |
2.7% |
22.2% |
|
Barclays Bank |
2.0% |
7.7% |
30.1% |
2.1% |
9.1% |
14.0% |
30.8% |
5.5% |
9.9% |
29.5% |
6.7% |
81.0% |
3.1% |
16.5% |
|
NIC |
(3.3%) |
5.5% |
22.2% |
(5.9%) |
5.8% |
7.2% |
30.9% |
5.7% |
10.3% |
16.2% |
(3.1%) |
79.3% |
5.6% |
12.1% |
|
HF |
N/A) |
(14.1%) |
(11.7%) |
(17.8%) |
4.6% |
(7.2%) |
25.0% |
(30.9%) |
3.1% |
429.5% |
(11.3%) |
90.7% |
7.0% |
(3.3%) |
|
Weighted Average Q3'2018* |
16.2% |
6.1% |
12.5% |
3.8% |
8.0% |
5.9% |
34.5% |
0.6% |
7.4% |
14.6% |
4.2% |
75.3% |
3.4% |
18.8% |
|
Weighted Average Q3'2017** |
(9.3%) |
(5.8%) |
(0.5%) |
(7.3%) |
8.5% |
10.9% |
33.3% |
10.5% |
13.8% |
10.3% |
6.1% |
77.7% |
3.4% |
17.5% |
|
*Market Capitalization weighted average as at 31/11/2018 ** Market Capitalization-weighted average as at 31/11/2017 |
||||||||||||||
Key take-outs from the table above include:
- All listed banks have released results for Q3’2018, and have recorded a 16.2% average increase in core Earnings Per Share (EPS), compared to a decline of 9.3% in Q3’2017. NIC Group and HF group were the only banks that recorded declines in core EPS, with NIC recording a decline of 3.3%, and HF recording a decline to a loss per share of Kshs 0.9 from a core earnings per share of Kshs 0.5 in Q3’2017. National Bank recorded the highest growth of 303.2% y/y,
- The sector recorded weaker deposit growth, which came in at 7.4%, slower than the 13.8% growth recorded in Q3’2017. Despite the slower deposit growth, interest expenses increased by 12.5%, indicating banks have been mobilizing expensive deposits,
- Average loan growth was anemic coming in at 4.2%, which was lower than 6.1% recorded in Q3’2017, indicating that there was an even slower credit extension in the economy, due to sustained effects of the interest rate cap. Government securities on the other hand recorded a growth of 14.6% y/y, which was faster compared to the loans, and faster than 10.3% recorded in Q3’2017. This indicates that banks’ continued preference towards investing in government securities, which offer better risk-adjusted returns. Interest income increased by 6.1%, compared to a decline of 5.8% recorded in Q3’2017, as banks adapted to the interest rate cap regime, with increased allocations in government securities. The Net Interest Income (NII) thus grew by 3.8% compared to a decline of 7.3% in Q3’2017,
- The average Net Interest Margin in the banking sector currently stands at 8.0%, down from the 8.5% recorded in H1’2017, despite the Net Interest Income by increasing 3.8% y/y. The decline was mainly due to the faster 14.6% increase in allocation to relatively lower yielding government securities, and,
- Non-funded Income grew by 5.9% y/y, slower than 10.9% recorded in Q3’2017. The growth in NFI was weighed down as total fee and commission growth was flat, growing by 0.6%, slower than the 10.5% growth recorded in Q3’2017. The growth in fee and commission income continued to be subdued by the slow loan growth.
It is worth noting that some banks reduced their specific provisioning levels, even after experiencing a deterioration in asset quality. This is largely due to the fact that the first year of implementation of IFRS 9, banks are allowed to pass the effect of asset quality through the balance sheet, hence reducing the specific provisioning demands for the period , even after the implementation of IFRS 9.
Universe of Coverage
|
Universe of Coverage |
||||||||||
|
Banks |
Price as at 31/10/2018 |
Price as at 23/11/2018 |
Price as at 30/11/2018 |
w/w change |
m/m change |
YTD Change |
Target Price* |
Dividend Yield |
Upside/Downside** |
P/TBv Multiple |
|
NIC Bank*** |
23.0 |
22.8 |
22.8 |
0.0% |
(1.1%) |
(32.6%) |
48.8 |
4.4% |
118.9% |
0.6x |
|
Diamond Trust Bank |
155.0 |
146.0 |
146.0 |
0.0% |
(5.8%) |
(24.0%) |
283.7 |
1.8% |
96.1% |
0.8x |
|
Ghana Commercial Bank*** |
5.2 |
4.8 |
4.8 |
0.2% |
(6.8%) |
(5.0%) |
7.7 |
7.9% |
68.8% |
1.1x |
|
KCB Group |
38.3 |
38.8 |
39.5 |
1.9% |
3.3% |
(7.6%) |
61.3 |
7.6% |
62.8% |
1.3x |
|
I&M Holdings |
90.0 |
85.0 |
89.0 |
4.7% |
(1.1%) |
(29.9%) |
138.6 |
3.9% |
59.7% |
0.9x |
|
Union Bank Plc |
5.1 |
5.1 |
5.2 |
2.0% |
2.0% |
(34.0%) |
8.2 |
0.0% |
58.3% |
0.5x |
|
Zenith Bank*** |
23.5 |
24.0 |
23.2 |
(3.3%) |
(1.3%) |
(9.5%) |
33.3 |
11.6% |
55.3% |
1.0x |
|
UBA Bank |
7.9 |
7.8 |
7.5 |
(3.8%) |
(5.1%) |
(27.2%) |
10.7 |
11.3% |
54.0% |
0.5x |
|
Equity Group |
39.3 |
39.0 |
39.5 |
1.3% |
0.6% |
(0.6%) |
56.2 |
5.1% |
47.3% |
1.9x |
|
CAL Bank |
1.0 |
1.0 |
1.0 |
0.0% |
(7.7%) |
(11.1%) |
1.4 |
0.0% |
45.8% |
0.8x |
|
Ecobank Ghana |
6.7 |
7.5 |
7.5 |
0.0% |
12.3% |
(1.3%) |
10.7 |
0.0% |
43.1% |
1.6x |
|
Co-operative Bank |
14.3 |
14.2 |
14.8 |
4.2% |
3.5% |
(7.8%) |
19.9 |
5.4% |
40.3% |
1.3x |
|
CRDB |
150.0 |
150.0 |
150.0 |
0.0% |
0.0% |
(6.3%) |
207.7 |
0.0% |
38.5% |
0.5x |
|
HF Group |
5.3 |
5.4 |
5.1 |
(6.3%) |
(3.6%) |
(51.3%) |
6.6 |
6.9% |
37.4% |
0.2x |
|
Access Bank |
7.9 |
7.4 |
7.8 |
4.7% |
(1.9%) |
(25.8%) |
9.5 |
5.2% |
27.7% |
0.5x |
|
Barclays |
10.7 |
11.0 |
10.8 |
(1.8%) |
0.9% |
12.0% |
12.5 |
9.3% |
25.6% |
1.5x |
|
Stanbic Bank Uganda |
33.0 |
32.0 |
31.0 |
(3.1%) |
(6.1%) |
13.8% |
36.3 |
3.8% |
20.8% |
2.2x |
|
Guaranty Trust Bank |
37.5 |
36.4 |
34.4 |
(5.6%) |
(8.4%) |
(15.7%) |
37.1 |
7.0% |
15.0% |
2.1x |
|
SBM Holdings |
6.2 |
6.1 |
6.1 |
0.0% |
(1.3%) |
(18.4%) |
6.6 |
4.9% |
12.1% |
0.9x |
|
Bank of Kigali |
290.0 |
290.0 |
290.0 |
0.0% |
0.0% |
(3.3%) |
299.9 |
4.8% |
8.2% |
1.6x |
|
Standard Chartered |
186.0 |
188.0 |
193.0 |
2.7% |
3.8% |
(7.2%) |
196.3 |
6.5% |
8.2% |
1.6x |
|
Stanbic Holdings |
92.0 |
92.5 |
91.5 |
(1.1%) |
(0.5%) |
13.0% |
92.6 |
2.5% |
3.7% |
0.9x |
|
FBN Holdings |
8.0 |
7.6 |
7.1 |
(6.6%) |
(11.3%) |
(19.3%) |
6.6 |
3.5% |
(3.1%) |
0.4x |
|
Standard Chartered |
21.8 |
20.2 |
20.2 |
0.2% |
(7.2%) |
(19.9%) |
19.5 |
0.0% |
(3.8%) |
2.5x |
|
Bank of Baroda |
127.0 |
126.0 |
139.0 |
10.3% |
9.4% |
23.0% |
130.6 |
1.8% |
(4.2%) |
1.2x |
|
National Bank |
5.0 |
5.8 |
5.7 |
(0.5%) |
15.6% |
(38.8%) |
4.9 |
0.0% |
(14.3%) |
0.4x |
|
Stanbic IBTC Holdings |
47.3 |
49.0 |
48.0 |
(2.0%) |
1.6% |
15.7% |
37.0 |
1.2% |
(21.7%) |
2.5x |
|
Ecobank Transnational |
16.0 |
15.8 |
16.0 |
1.3% |
(0.3%) |
(6.2%) |
9.3 |
0.0% |
(41.8%) |
0.6x |
| *Target Price as per Cytonn Analyst estimates **Upside / (Downside) is adjusted for Dividend Yield ***Banks in which Cytonn and/or its affiliates holds a stake. ****Stock prices indicated in respective country currencies |
||||||||||
We are “NEUTRAL” on equities for investors with a short-term investment horizon since the market has rallied and brought the market P/E slightly above its’ historical average. However, pockets of value exist, with a number of undervalued sectors like Financial Services, which provide an attractive entry point for long-term investors, and with expectations of higher corporate earnings this year, we are “POSITIVE” for investors with a long-term investment horizon.
During the month of November, there was private equity activity in the financial services, FinTech and education sectors.
Financial Services Sector:
- TransCentury, a Kenyan-based investment firm, with a focus in infrastructure, rolled over USD 3.5 mn (Kshs 360.2 mn) worth of short-term loans by 1-year. The loan was taken from Kuramo Capital, a New York-based investment management firm focused on alternative investments in frontier and emerging markets. The loan was acquired through three separate transactions:
- A USD 1.8 mn (Kshs 185.2 mn) loan issued in February 2017 at an interest rate of 6.0% p.a. and is due in December 2018. The loan is secured by a charge of 56.7 mn ordinary shares of East African Cables,
- A USD 1.2 mn (Kshs 123.5 mn) loan issued in June 2017 at an interest rate of 5.0% p.a. and was due July 2018. The loan is secured by a similar number of shares (56.7 mn shares) in East African Cables, and,
- A USD 0.5 mn (Kshs 51.5 mn) loan issued in October 2017 at an interest rate of 5.0% p.a. and matures in December 2018. The loan is secured by a charge of 0.1 mn ordinary shares of Tanelec Limited. Tanalec is a leading manufacturing company in the Power and Energy Sector, supplying transformers and switchgears across Africa and is based in Tanzania.
This comes after the Capital Markets Authority (CMA) called out TransCentury and its subsidiary East African Cables, which are currently operating in a negative working capital position contrary to the rules governing issuers at the Nairobi Securities Exchange (NSE). For more information, see our Cytonn Weekly #44/2018.
- Kenyan Tier 3 Sidian Bank secured Kshs 235.0 mn from the East African Development Bank (EADB) for lending to small and medium enterprises (SMEs) in the agribusiness sector across the country. The loan will run for eight-years at an undisclosed rate and comes with technical assistance through capacity building to equip the bank’s staff with skills on best practices for agribusiness financing. Kenyan banks have, in recent years, taken on substantial loans from international financiers including International Finance Corporation (IFC), European Investment Bank and the African Development Bank (AfDB) for SME lending. Previously, Equity Group, Co-operative Bank, Diamond Trust Bank, Stanbic Holdings and KCB Group have borrowed from international financiers, mainly to finance their onward lending businesses. This is highlighted below:
|
International Loans to Kenyan Banks |
|||||
|
Issuer |
Bank |
Issue Date |
Amount of Loan (Kshs bn) |
Term of Credit |
|
|
1. |
Africa Development Bank |
Kenya Commercial Bank |
Oct-17 |
10.4 |
Not specified |
|
2. |
IFC |
I&M Holdings |
Jan-18 |
1.0 |
Not specified |
|
3. |
IFC |
Cooperative Bank |
Feb-18 |
15.2 |
7-years |
|
4. |
Africa Development Bank |
Diamond Trust bank |
Mar-18 |
7.5 |
7-years |
|
5. |
SwedFund |
Victoria Commercial Bank |
Apr-18 |
0.5 |
Not specified |
|
6. |
14 Financial Institutions (syndicated) |
Stanbic Bank |
May-18 |
10.0 |
2 and 3 years |
|
7. |
FMO |
I&M Holdings |
Oct-18 |
4.0 |
Not Specified |
|
8. |
Africa Development Bank |
Sidian Bank |
Nov-18 |
0.3 |
8-years |
|
Total |
48.8 |
||||
Source: Cytonn Report
For more information, see our Cytonn Weekly #44/2018.
FinTech:
- MFS Africa, a Pan-African FinTech company founded in 2009, headquartered in Johannesburg, South Africa, announced the close of its second round of Series B funding, raising equity totaling to USD 14.0 mn (Kshs 1.4 bn). The funding was from a consortium of investors, who participated in undisclosed portions led by LUN Partners Group, a Shanghai-based global investment management group, Goodwell Investments, an Amsterdam based investment firm, ShoreCap III, a private equity fund managed by US-based Equator Capital Partners, and UK-based FSD Africa, bringing the total round of funding to USD 14.0 mn. The total equity raised of USD 14.0 mn is for the expansion of its mobile financial services (MFS) into additional areas in Africa, starting with Mauritius, Rwanda, Tanzania, Uganda and Kenya. For more information, see our Cytonn Weekly #43/2018.
- South African private equity firm, Ethos, announced a USD 49.0 mn (Kshs 5.0 bn) investment into Channel VAS, a FinTech provider that specializes in data analytics, airtime credit services and mobile financial services. The stake acquired in this transaction has however not been disclosed. This investment was the first to be made by the firm’s new buyout fund, Ethos Fund VII, which has set the trend for the firm’s increasing investments towards technology, with the fund set to invest alongside the firm’s specialized Artificial Intelligence Fund. The fund is targeting USD 563.0 mn (Kshs 57.7 bn) in capital from local and international investors, having already raised USD 141.0 mn (Kshs 14.5 bn), with the second round of USD 322.0 mn (Kshs 33.0 bn) by Q1’2019. For more information, see our Cytonn Weekly #43/2018.
- BitPesa, a Kenyan digital currency exchange and payments company, has secured USD 5.0 mn (Kshs 512.8 mn) in funding from Sompo Holdings, a Japanese insurance group that provides property and casualty insurance, life insurance, other financial services in Japan and internationally, in return for an undisclosed stake in the business. The deal is expected to revolutionize cross-border payments and insurance services globally. BitPesa was launched in 2013 and has expanded into other African countries including Ghana, Morocco, Nigeria and Uganda. Since 2015, BitPesa has raised over USD 12.6 mn (Kshs 1.3 bn) with USD 7.6 mn (Kshs 779.4 mn) raised through three funding rounds as follows:
- In 2015, BitPesa raised USD 1.1 mn led by Pantera Capital Management LP and Crypto Currency Partners LP,
- In February 2017, BitPesa raised USD 2.5 mn led by Draper VC and Greycroft Partners, and,
- In August 2017, BitPesa raised USD 4.0 mn led by Greycroft, a majority existing shareholder.
Sompo will use BitPesa’s technology to extend its presence in the international remittance service market and use it for its insurance services. The two firms aim to solve international remittance and cross-border payment obstacles by reducing international remittance fees and lengthy processing times to facilitate global trade and contribute to macro-economic development.
Education:
UNICAF, the largest online higher education platform in Africa, announced a USD 28.0 mn Series B financing. The new investment round is led by Goldman Sachs, with other participants in the round being existing investors, including the UK Government's Development Finance Institution, CDC Group, leading higher education fund, University Ventures, and the Educational Excellence Corporation Ltd (EDEX), the Founder of the University of Nicosia and UNICAF. The funds are to meet the growing demand for high-quality university education across Africa. The new funding will enable UNICAF to grow enrolment to over 100,000 students, expand the program offering and open as many as five additional African campuses in the next five-years. For more information, see our Cytonn Weekly #45/2018.
Fundraising:
- Catalyst Principal Partners, a Kenyan private equity firm specializing in growth, emerging growth, expansion, buyout, recapitalization, acquisition, replacement capital, and pre-IPO investments in medium-sized companies, has raised USD 155.0 mn (Kshs 15.9 bn) in its second round of funding. The capital was mainly from local pension funds and international investors. The capital raised will target USD 7.5 mn - USD 22.5 mn range of investments, targeting companies in Kenya, Uganda, Tanzania, Ethiopia, Zambia, Rwanda and the Democratic Republic of Congo. They mainly focus on consumer goods and retail, financial and business services, industrials, manufacturing and value-add processing, technology and communication sectors. Founded in 2009, Catalyst Principal Partners secured their first funding in November 2012 of USD 125.0 mn (Kshs 12.8 bn) under Catalyst Fund I. They have made investments in a range of companies with the most recent in May & April 2017, when they invested in Britania Foods Limited and Kensta Group, respectively. For more information, see our Cytonn Weekly #43/2018.
- Centum Investment Group plans to raise between Kshs 40.0 bn and Kshs 50.0 bn in a fresh private equity fund as the company aims to cut finance costs from expensive borrowings. On the fund, Kshs 30.0 bn to Kshs 35.0 bn of this amount will be sourced from high net worth individuals and institutions such as pension schemes, with the additional Kshs 10.0 bn to Kshs 15.0 bn coming from its internal revenue source. The fund will be largely deployed in mature cash generative businesses and marketable securities such as government securities and equities. In 2015, Centum Investment issued out a Kshs 6.0 bn Commercial Paper, the proceeds of which were invested in the financial services sector, energy sector and real estate as follows;
|
Centum Investment sectors from the Commercial paper |
|||||
|
No. |
Sector |
Companies Invested |
Nature of Investment |
Bonds Proceed (Kshs "mn" |
Current Stake |
|
1. |
Financial Services |
Sidian Bank |
Equity Investment |
3,600 |
77.0% |
|
2. |
Energy |
Akiira One Geothermal Limited |
Equity Investment |
2,100 |
51.0% |
|
Amu Power Limited |
37.5% |
||||
|
3. |
Real Estate |
Pearl Marina Estates Limited |
Equity Investment |
222 |
100% |
|
4. |
Offer Expenses |
|
|
78 |
|
|
|
Total |
|
|
6,000 |
|
Source: Centum HY’2018 Investor Briefing
Centum’s private equity business reported a 200.0% profit growth to Kshs 1.5 bn in HY’2018 from Kshs 0.5 bn recorded in HY’2017. This growth was mainly driven by Centum’s disposal of the Company’s stake in GenAfrica Asset Managers Limited, which saw the Company realize gains of Kshs 1.2 bn, with Kshs 1.1 bn being the initial investment and Kshs 2.3 bn being the exit proceeds.
Private equity investments in Africa remains robust as evidenced by the increasing investor interest, which is attributed to; (i) rapid urbanization, a resilient and adapting middle class and increased consumerism, (ii) the attractive valuations in Sub Saharan Africa’s private markets compared to its public markets, (iii) the attractive valuations in Sub Saharan Africa’s markets compared to global markets, and (iv) better economic projections in Sub Sahara Africa compared to global markets. We remain bullish on PE as an asset class in Sub-Sahara Africa. Going forward, the increasing investor interest and stable macro-economic environment will continue to boost deal flow into African markets.
The activities during the month of November were as highlighted below:
- Industry Reports
During the month, two reports were released highlighting real estate drivers and the performance in the residential sector during Q3’2018. The various reports are as explained in the table below:
|
Coverage |
Report |
Key Highlights |
|
Residential Sector |
Kenya Bankers Association ‘Housing Price Index Q3'2018 Report’ |
· Housing prices recorded marginal growth by 1.4% in Q3’2018, 0.4% points lower than the 1.8% growth in Q2’2018. The softening growth rate is attributed to increased supply of units in the upper mid-end and high-end segments, resulting in increased competition between developers, · In terms of preference, more homebuyers opted for bungalows accounting for 38.0% of the total market uptake, whereas apartments and maisonettes accounted for 35.0% and 27.0%, respectively. According to the report, however, this does not necessarily signify preference because maisonettes are mainly located in high-end areas, whereas bungalows are mostly found in the low and upper mid-end areas. Apartments, on the other hand, are evenly spread out, · The report findings tally with Cytonn Q3’2018 Report that showed the average price appreciation came in at 0.9% p.a., a 1.1% points decline from the 2.0% recorded in Q2’2018. The performance, in our view, is attributable to increased supply as well as factors limiting house purchase such as shortage of affordable credit, · In our view, going forward investors ought to conduct proper due diligence in order to identify specific market niches before investing. |
|
Urbanization |
Mercer: ‘People First: Driving Growth in Emerging Megacities’ |
· Factors that will determine where Nairobi City residents will live and work in the next 1 to 5-years, according to the report, are; i) affordable housing, ii) safety and security, iii) air and water pollution, iv) transportation and traffic, and v) pay and bonuses, in that order, and, · The overall life satisfaction in Nairobi stood at 41.0% compared to the sampled global average of 62.0%, due to low human, health, money and work satisfaction at 40.0%, 37.0%, 42.0% and 47.0%, respectively compared to global average at 63.0%, 62.0%, 58.0% and 63.0% for human, health, money and work satisfaction, respectively. · The report highlighted the need for heightened efforts towards provision of affordable housing and infrastructure in order to improve Kenyans’ living standards. For more information, see Cytonn Weekly #43. |
- Residential Sector
During the month, the residential sector continued to record increased activity with various developments being launched spanning from affordable to luxury developments. Key developments were as follows:
- During the week, the Cabinet Secretary for Housing and Urban Planning, Hon. James Macharia announced that the groundbreaking for the affordable housing initiative by the government will be held on 11th December 2018 at Parklands. According to the CS, 1 bedroom houses under the social housing program will cost Kshs 600,000 with those buying them expected to pay Kshs 2,500 p.m. for 25 years; 2-bedroom units will cost Kshs 1.0 mn for Kshs 4,500 p.m.; while 3-bedroom units will cost Kshs 1.4 mn for Kshs 6,500 p.m.,
- Real estate developer Karibu Homes announced a Kshs 4.0 bn residential project at Tatu City in a deal that will see them develop 1,000 affordable homes within the mixed-use development situated in Kiambu County, with price points of Kshs 2.5 - 5.0 mn. The development will have one, two and three bedroom apartments with amenities such as a clubhouse and a retail center. Currently, the Karibu Homes portfolio includes the Karibu Homes Estate in Athi River, whose price points range between Kshs 3.2 - 5.6 mn,
- Local real estate agency Hass Consult announced a joint venture with the family of the late Government Minister Munyua Waiyaki, which will see the development of 450 apartment units, on 22-acres of land owned by the family. The Kshs 10.0 bn project located along Redhill Road will have one, two, three, and four bedroom apartments with price points of Kshs 15.0 mn, 20.0 mn, 40.0 mn, and 80.0 mn, respectively, as well as studio apartments of Kshs 6.0 – 10.0 mn (sizes undisclosed). The Mixed-use Development dubbed ‘Enaki’ is slated to break ground mid-2019, and will include a hotel, retail, and high-end amenities such as an amphitheater, a floating restaurant, and a public botanical garden,
- Lancet Kenya broke ground on its latest project ‘Lancet Village’ on 10-acres in Katani, Syokimau, approximately 25 km from the Nairobi CBD. The Kshs 1.2 bn project comprises of two and three-bedroom apartments and four-bedroom maisonettes with price points of Kshs 5.0 mn, 6.5 mn, and 10.5 mn, respectively. The development also comprises a commercial area and various amenities. Completion of the project is estimated to take 24 to 30-months,
- Real estate developer, Superior Homes launched their gated retirement village in Athi River. The development, referred to as Fadhili Care, comprises of one and two bedroom cottages, sitting on 5-acres and is located within the developer’s Green Park Estate. The project targets the elderly seeking a retirement village concept, and is set to provide 24-hour care with a 24-hour ambulance, a clubhouse, medical care, resident team of nurses who will provide psychological, physiotherapy, and social home care services.
From the above, we can see that there is sustained investor appetite for upper mid-end and high-end markets, especially in the Nairobi Metropolitan Area. However, given the surplus supply and increased competition in these segments, we are likely to see redirected efforts to development of housing for the lower middle and low-end segments where demand is highest, with more than 70.0% of individuals employed in the formal sector earning Kshs 49,999 per month and below according to the Kenya National Bureau of Statistics (KNBS).
We therefore expect to continue witnessing development activity within the sector in a bid to address the housing shortage and capitalize on government incentives for residential developers.
- Retail Sector
During the month, notable international retailers made an entry into the local retail scene, affirming Kenya’s position as a regional investments hub. International retailers are looking to tap into the growing middle class seeking aspirational lifestyles.
Some of the major activities in the retail sector included:
- South African retailer, Shoprite, announced plans to take up space as an anchor tenant, at the proposed mall dubbed “The Beacon”, to be situated off Uhuru Highway towards Bunyala Roundabout, in Nairobi. Shoprite intends to take up approximately 43,055 SQFT of retail space at the 306,771 SQFT mall, representing 14.0% booking at the project. This is part of the retailer’s ambitious plans to open 7 other stores in malls across Kenya, including; the Garden City Mall along Thika Road, the Westgate Mall in Westlands, and the City Mall in Mombasa. For more information and analysis, see Cytonn Weekly #45,
- Spanish fashion house Mango and German fashion house Hugo Boss opened their first stores in East Africa at the Westgate Mall in Westlands, Nairobi. The continued expansion of global retailers demonstrates the attractiveness of Kenya as an investment destination,
- Naivas supermarket announced plans of taking up space at the Likoni Mall in Mombasa, in space previously occupied by Nakumatt. This will be the retailer’s 47th store nationwide and 3rd in Mombasa County, and,
- Chinese construction conglomerate, China Wu Yi, announced plans to open a home furnishing materials supermarket in Athi River, Machakos County. The Kshs 5.0 bn facility known as ‘Zhong Wu E-Commerce Kenya Limited’ spanning 23,850 SQM is scheduled for opening in December 2018, and is expected to be a one-stop shop providing a wide range of products such as furniture, electrical appliances and building materials.
The continued entry of foreign retailers in response to the growing demand for international brands from the expanding middle and wealthy classes has continued to boost the performance of retail real estate developments with multinational forms demanding high-quality spaces. For developers and property managers, the entry of strong anchor tenants is an added advantage as it drives footfall into a mall, and this, in turn, attracts other retailers. In our view, therefore, this will have a positive impact on the performance of retail real estate developments, where we currently estimate an oversupply of 2.0 mn SQFT. As per our last research, Cytonn’s Q3 2018 Market Review Report, retail developments in the Nairobi Metropolitan Area recorded an average rental yield of 9.4%, with average occupancy rates of 83.7%. This is a 0.3% points decrease q/q in rental yields from the 9.7% recorded in Q2’2018 as a result of a 5.8% points decrease q/q in rental charges attributed to increased competition due to increased supply that has led to developers decreasing rents to attract retailers.
We expect to see continued expansion of local and international retailers especially with the improved ranking in World Bank’s Ease of Doing Business, as well as growing demand for formal retail spaces outside Nairobi, due to improved standards of living.
- Commercial Office
During the month, the commercial office sector recorded minimal activity. A few highlights included:
- The European Union (EU) delegation to Kenya announced its headquarters’ relocation from Union Insurance House along Ragati Road in Upperhill to Dunhill Towers along Waiyaki Way in Westlands. For more information, see Cytonn Weekly #43,
- Coca Cola, a multi-national beverage company, intends to sell its Upperhill office, which has been the company’s headquarters for the East and Central Africa Region since 2008, and relocate to newly built 90 James Gichuru office in Lavington, Nairobi. This is in line with its Vision 2020 on workplace agenda that aims at achieving a new modernized space built to suit the needs of a more agile, and fast-paced business. For more information and analysis, see Cytonn Weekly #45, and,
- Jesus House of Praise International Church launched plans to build a 30-floor commercial property in Meru County located 1.6-km from Meru Town along the Meru-Embu-Nairobi Highway. The development will comprise of office spaces, retail complex, serviced apartments, and hotel, church and conference halls. For more information, see Cytonn Weekly #43.
The commercial office sector continues to record subdued activity and this is attributable to the reported oversupply in the sector, which as per the Cytonn 2018 Nairobi Commercial Office Report came in at 4.7 mn in 2017. This is mainly on account of increased supply of office stock with low commensurate demand. In our view, investment in commercial office should be in differentiated concepts such as serviced offices, which have low supply with a market share of just 0.4%, and high returns with average rental yields of 13.4% compared to a market average of 9.5%.
- Hospitality Sector
In the tourism and hospitality sectors, the main developments were as follows;
- During the month, Deputy President William Ruto launched the Nyali Golf View Residence in Nyali, Mombasa County. The facility is meant to provide accommodation facilities for both short and long-term tourists to the area. The development comprises of 2 bedroom en-suite, 2-bedroom duplex and 3-bedroom en-suite apartment units with rental rates of Kshs 65,000, 70,000, and 85,000, respectively, and,
- The Kenyan tourism and hospitality sector received global recognition as 10 local hotels brands bagged various awards at the World Luxury Hotel Brands Awards 2018 held in Bali, Indonesia. For more information click here.
We expect to see continued improvement in hospitality performance with the increased focus to improve tourism in counties outside Nairobi, Kisumu, and Mombasa, which is bound to diversify products to international and domestic tourists. The increased recognition of local hotel facilities is also a testament to the ongoing efforts to increase Kenya’s edge as a tourist attraction stronghold.
- Infrastructure
Various activities reported during the month were as follows:
- The Kenya Airports Authority (KAA) allocated Kshs 691.0 mn to upgrade airstrips in six counties in order to meet the increased demand for air travel. The six airstrips are:
- Suneka airstrip in Kisii County
- Ukunda airstrip in Kwale County
- Manda airstrip in Lamu County
- Kakamega airstrip in Kakamega County
- Migori airstrip in Migori County
- Kitale airstrip in Trans-Nzoia County
The airstrips’ expansion is bound to spur trade and tourism in the counties reducing the time taken to access the counties. Therefore, we expect this to open up the affected areas for real estate development particularly in the commercial and hospitality themes, and,
- The Kenya Electricity Transmission Company (Ketraco) unveiled plans to electrify the Standard Gauge Railway. The Kshs 25.0 bn plan, which is currently pending NEMA approval, will involve establishment of 12 transmission lines and 14 substations to supply the high-voltage power needed for the Nairobi-Mombasa line. This is also set to boost trade across the five counties it traverses (Kwale, Kilifi, Taita Taveta, Makueni and Machakos), which in our view will create real estate opportunities for commercial spaces and residential units.
In our view, the increased investment in infrastructure is an indication that the government is committed to its developmental agenda and guarantees overall growth of the Kenyan economy. If successfully completed and implemented, the State’s infrastructural initiatives would have a positive effect on the real estate sector in Kenya, since infrastructure helps open up more areas for real estate development increasing accessibility and access to essential services such as water, electricity and a sewerage system.
- Listed Real Estate
During the month, the Fahari I-REIT recorded an average trading price of Kshs 10.1, closing at Kshs 10.0, a 1.5% decline from the month’s opening price of Kshs 10.2. Overall, the instrument has shed 51.8% of its initial price of Kshs 20.8. The poor performance is attributable to:
- The negative sentiments currently engulfing the sector given the poor performance of the Fusion D-REIT (FRED), which failed to raise the minimum capital required to list on the NSE,
- Inadequate investor knowledge, and,
- The poor performance of Fahari I-REIT recording a dividend yield of 5.7% compared to brick and mortar office and retail at 9.5% and 9.7%, respectively.
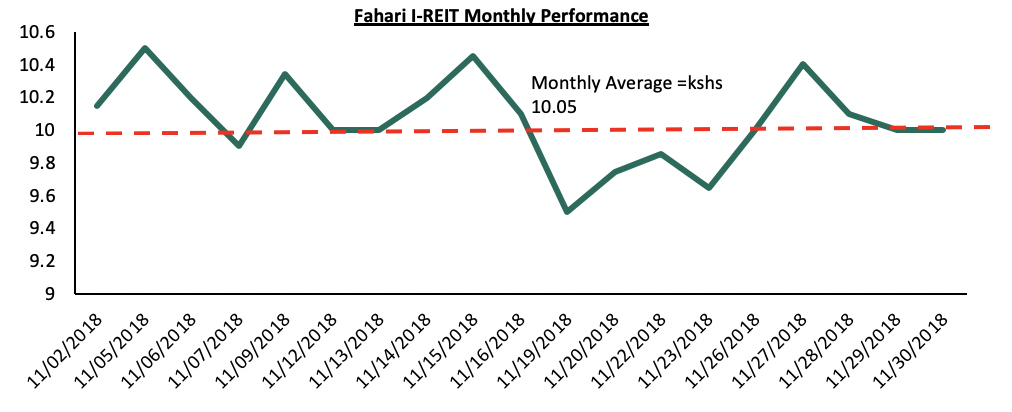
The Nigerian I-REIT market remained relatively stable during the week, with, Skye Shelter and Union Homes retaining an average price per share of N95.0 and N45.2, respectively, while UPDC recorded 2.2% decline to N8.8 from N9.0 the previous week. We attribute the performance to inadequate investor knowledge about the market hence low investor interest in the instrument.
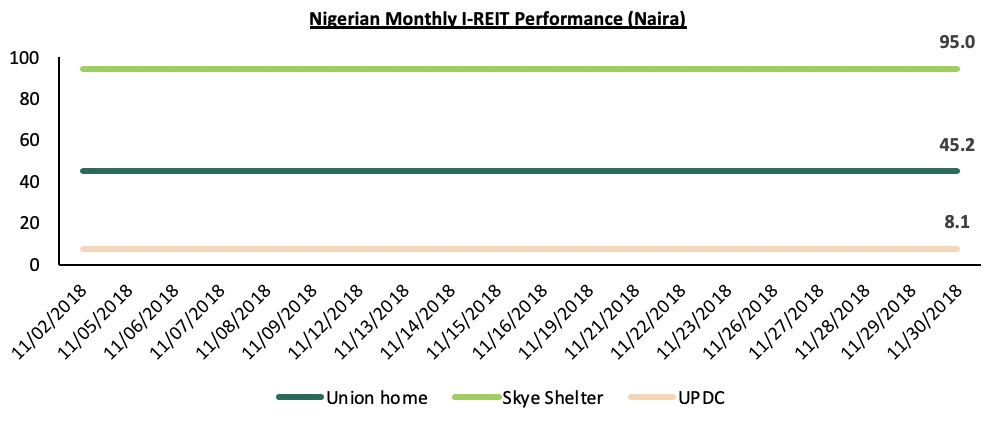
Our overall outlook for the real estate is positive given the increased traction in the sector evidenced by (i) expansion by global retailers into the country, (ii) implementation of the Affordable Housing initiative by the Central Government, (iii) expanding middle-class, and hence growing disposable incomes, and (iv) Continued improvement in infrastructure.
Disclaimer: The Cytonn Weekly is a markets report published by Cytonn Asset Managers Limited, “CAML”, which is regulated by the Capital Markets Authority. CAML is also an affiliate of Cytonn Investments Management Plc. However, the views expressed in this publication are those of the writers where particulars are not warranted. This publication, which is in compliance with Section 2 of the Capital Markets Authority Act Cap 485A, is meant for general information only and is not a warranty, representation, advice or solicitation of any nature. Readers are advised in all circumstances to seek the advice of a registered investment advisor.

- Talk to us
- Kenya
- P.O Box 20695 - 00200, Nairobi, Kenya
- Cell +254709101200
- Tel +254709101200
- WhatsApp +254741676635
- United States
- +254709101200
- DOWNLOAD OUR APP
-


- Kenya
- 8th Floor, Pinetree Plaza, Kaburu Drive, Ngong Road, Nairobi, Kenya
- USA
- Suite 1150, 1775 Eye Street NW, USA, Washington DC 20006, USA
- Investments
- High Yield
- Private Equity
- Real Estate
- Real Estate
- RiverRun Estates
- Cytonn Towers
- The Ridge
- Taraji Heights
- The Alma