Cytonn Monthly – October 2024
By Research Team, Nov 3, 2024
Executive Summary
Fixed Income
During the month of October 2024, T-bills were oversubscribed, with the overall average oversubscription rate coming in at 305.9%, significantly higher than the oversubscription rate of 113.2% recorded in September 2024. The overall average subscription rate for the 91-day paper increased to 546.6% from 365.8%, while the overall average subscription rates for the 182-day and 364-day paper increased to 278.4% and 237.2% respectively, from 63.5% and 61.8% respectively, which was recorded in September 2024. The average yields on the government papers were on a downward trajectory during the month, with the 91-day, 182-day, and 364-day papers yields decreasing by 78.5 bps, 77.3 bps, and 70.7 bps to 15.0%, 15.8%, and 16.1% respectively from 15.8%, 16.6%, and 16.8% recorded the previous month. For the month of October, the government accepted a total of Kshs 136.7 bn of the Kshs 293.7 bn worth of bids received in T-Bills, translating to an acceptance rate of 46.5% compared to an acceptance rate of 87.3% in the month of September;
During the week, T-bills were oversubscribed for the fifth consecutive week, with the overall oversubscription rate coming in at 259.0%, albeit lower than the oversubscription rate of 357.3% recorded the previous week. Investors’ preference for the shorter 91-day paper persisted, with the paper receiving bids worth Kshs 15.0 bn against the offered Kshs 4.0 bn, translating to an oversubscription rate of 375.2%, significantly lower than the oversubscription rate of 855.7% recorded the previous week. The subscription rate for the 182-day paper decreased to 232.4% from the 281.5% recorded the previous week, while that of the 364-day paper increased to 239.2% from the 233.8% recorded the previous week. The government accepted a total of Kshs 28.1 bn worth of bids out of Kshs 62.2 bn bids received, translating to an acceptance rate of 45.3%. The yields on the government papers were on a downward trajectory, with the yields on the 364-day, 182-day, and 91-day papers decreasing by 50.1 bps, 62.3 bps, and 46.7 bps to 15.0%, 14.5%, and 14.0% respectively from 15.5%, 15.1% and 14.4% respectively recorded the previous week;
Additionally, October 2024 bonds were oversubscribed, with the overall average oversubscription rate coming in at 139.9%, albeit lower than the oversubscription rate of 155.0% recorded in September 2024. The reopened bonds FXD1/2016/010 and FXD1/2022/010, with tenors to maturity of 1.8 years and 7.6 years respectively and fixed coupon rates of 15.0% and 13.5% respectively, received bids worth Kshs 51.0 bn against the offered Kshs 30.0 bn translating to an oversubscription rate of 169.9%, with the government accepting bids worth Kshs 31.3 bn, translating to an acceptance rate of 61.5%, with the average accepted yields coming at 17.0% each. Additionally, the tapsale of the bond FXD1/2022/010, with a tenor to maturity of 7.5 years and a fixed coupon rate of 13.5%, received bids worth Kshs 16.5 bn against the offered Kshs 15.0 bn translating to an oversubscription rate of 110.0%, with the government accepting bids worth Kshs 15.1 bn, translating to an acceptance rate of 91.5%, with the average accepted yield remaining unchanged at 17.0%;
During the week, KNBS released the y/y inflation highlighting that in October 2024 inflation decreased by 0.9% points to 2.7%, from the 3.6% recorded in September 2024. This was below our projected range of 3.4% to 3.8%. Our estimate was mainly driven by the reduction in the Central Bank Rate (CBR) by 75.0 bps to 12.00% from 12.75% on 8th October 2024, which would increase the money supply, coupled with increased electricity prices. The headline inflation in October 2024 was majorly driven by an increase in prices of commodities in the following categories; Food & Non-Alcoholic Beverages and Housing, Water, Electricity, Gas & other fuels, by 4.3% and 0.4% respectively. However, the commodity prices in the Transport sector declined by 1.3%;
Also, during the week, The International Monetary Fund (IMF) Executive Board completed the seventh and eighth reviews under the Extended Fund Facility (EFF) and Extended Credit Facility (ECF), alongside a review under the Resilience Sustainability Facility (RSF). This decision enables the immediate disbursement of approximately USD 606.1 mn to support Kenya’s efforts to stabilize its economy, address fiscal challenges, and enhance resilience to climate-related shocks. The IMF’s approval allows Kenya to receive USD 485.8 mn under the EFF/ECF arrangements, aimed at reducing Kenya’s debt vulnerabilities, safeguarding funds for social and developmental priorities, and supporting broader economic reforms and USD 120.3 mn under the RSF, which focuses on reinforcing Kenya's climate-related initiatives and catalysing additional private sector climate finance. Earlier this year, Kenya faced intense financial pressures with discussions of a possible debt default. However, following the USD 1.5 mn Eurobond buyback, market confidence improved, the Kenyan Shilling stabilized and this allowed Kenya to quickly rebuild its foreign currency reserves. However, pushback against the new tax reforms due to concerns about how the government handles funds has further hindered the government’s efforts on fiscal consolidation and reducing debt;
Equities
During the month of October 2024, the equities market was on an upward trajectory, with NSE 10 and NSE 25 gaining the most by 10.1% each; while NASI and NSE 20 gained by 9.8% and 7.3% respectively. The equities market's positive performance was driven by gains recorded by large-cap stocks such as EABL, Bamburi, and Safaricom of 18.3%, 11.9%, and 11.7% respectively;
Likewise, during the week, the equities markets were on an upward trajectory, with NSE 20 gaining the most by 2.8%, while NSE 25, NSE 10, and NASI gained by 1.9%, 1.9% and 1.8% respectively, taking the YTD performance to gains of 35.9%, 33.7%, 27.9%, and 26.3% for NSE 10, NSE 25, NASI, and NSE 20 respectively. The equities market performance was driven by gains recorded by large-cap stocks such as Stanbic Holdings, EABL, and KCB Group of 3.6%, 3.2%, and 2.5% respectively. The performance was, however, weighed down by losses recorded by large-cap stocks such as Bamburi and DTBK of 4.7% and 1.4% respectively;
During the week, Kenya Electricity Generating Company released their FY’2024 Financial Results, for the year ended 30th June 2024, recording a 35.5% increase in Profits after Tax (PAT) to Kshs 6.8 bn, from Kshs 5.0 bn recorded in FY’2023. The increase in PAT was majorly attributed to the 148.8% increase in finance income to Kshs 4.2 bn from Kshs 1.7 bn, coupled with the 5.3% increase in net revenue to Kshs 48.3 bn in FY’2024 from Kshs 45.8 bn recorded in FY’2023;
Real Estate
During the week, Shelter Afrique Development Bank (ShafDB) and the regional stock exchange serving the West African Economic and Monetary Union (WAEMU) region, Bourse Régionale des Valeurs Mobilières (BRVM), announced the signing of a partnership aimed at addressing Africa’s housing deficit, by establishing a framework to mobilize financial resources through innovative instruments such as green, sustainability-linked, and social bonds, as well as Real Estate Investment Trusts (REITs);
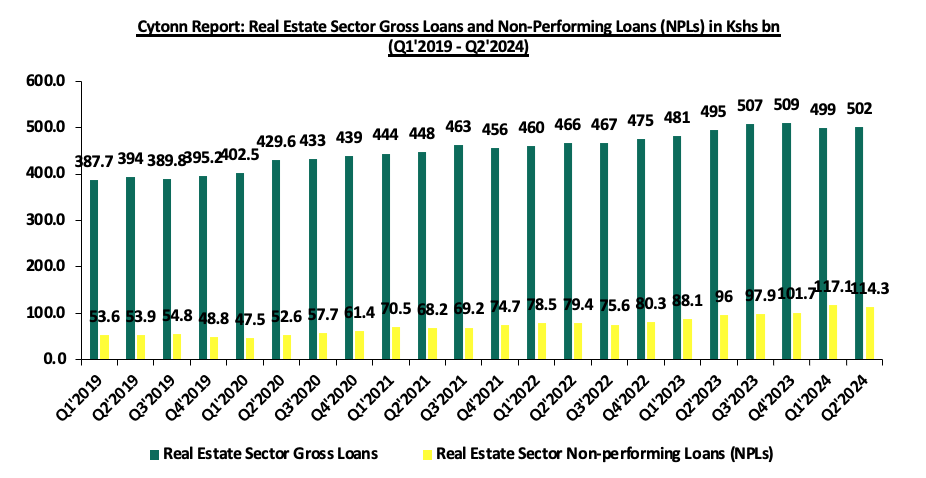
Additionally, during the week, the Central Bank of Kenya (CBK) released its Q2’2024 Quarterly Economic Review which highlighted that on a year-on-year (y/y) basis, gross loans advanced to the Real Estate sector increased by 1.4% to Kshs 502.0 bn, from Kshs 495.0 bn in Q2’2023;
On the Unquoted Securities Platform, Acorn D-REIT and I-REIT traded at Kshs 25.4 and Kshs 22.2 per unit, respectively, as per the last updated data on 25th October 2024. The performance represented a 27.0% and 11.0% gain for the D-REIT and I-REIT, respectively, from the Kshs 20.0 inception price. Additionally, ILAM Fahari I-REIT traded at Kshs 11.0 per share as of 25th October, 2024, representing a 45.0% loss from the Kshs 20.0 inception price;
Investment Updates:
- Weekly Rates:
- Cytonn Money Market Fund closed the week at a yield of 18.06% p.a. To invest, dial *809# or download the Cytonn App from Google Play store here or from the Appstore here;
- We continue to offer Wealth Management Training every Monday, from 10:00 am to 12:00 pm. The training aims to grow financial literacy among the general public. To register for any of our Wealth Management Trainings, click here;
- If interested in our Private Wealth Management Training for your employees or investment group, please get in touch with us through wmt@cytonn.com;
- Cytonn Insurance Agency acts as an intermediary for those looking to secure their assets and loved ones’ future through insurance namely; Motor, Medical, Life, Property, WIBA, Credit and Fire and Burglary insurance covers. For assistance, get in touch with us through insuranceagency@cytonn.com;
- Cytonn Asset Managers Limited (CAML) continues to offer pension products to meet the needs of both individual clients who want to save for their retirement during their working years and Institutional clients that want to contribute on behalf of their employees to help them build their retirement pot. To more about our pension schemes, kindly get in touch with us through pensions@cytonn.com;
Hospitality Updates:
- We currently have promotions for Staycations. Visit cysuites.com/offers for details or email us at sales@cysuites.com;
Money Markets, T-Bills Primary Auction:
During the month of October 2024, T-bills were oversubscribed, with the overall average oversubscription rate coming in at 305.9%, significantly higher than the oversubscription rate of 113.2% recorded in September 2024. The overall average subscription rate for the 91-day paper increased to 546.6% from 365.8%, while the overall average subscription rates for the 182-day and 364-day paper increased to 278.4% and 237.2% respectively, from 63.5% and 61.8% respectively, which was recorded in September 2024. The average yields on the government papers were on a downward trajectory during the month, with the 91-day, 182-day, and 364-day papers yields decreasing by 78.5 bps, 77.3 bps, and 70.7 bps to 15.0%, 15.8%, and 16.1% respectively from 15.8%, 16.6%, and 16.8% recorded the previous month. For the month of October, the government accepted a total of Kshs 136.7 bn of the Kshs 293.7 bn worth of bids received in T-Bills, translating to an acceptance rate of 46.5% compared to an acceptance rate of 87.3% in the month of September:
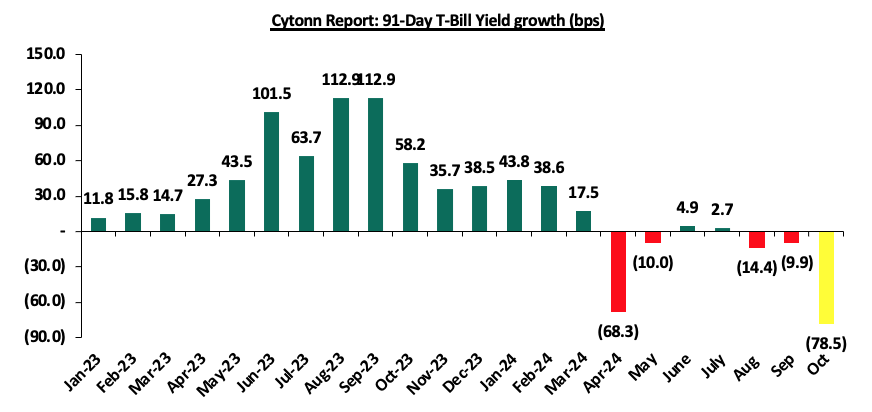
This week, T-bills were oversubscribed for the fifth consecutive week, with the overall oversubscription rate coming in at 259.0%, albeit lower than the oversubscription rate of 357.3% recorded the previous week. Investors’ preference for the shorter 91-day paper persisted, with the paper receiving bids worth Kshs 15.0 bn against the offered Kshs 4.0 bn, translating to an oversubscription rate of 375.2%, significantly lower than the oversubscription rate of 855.7% recorded the previous week. The subscription rates for the 182-day paper decreased to 232.4% from the 281.5% recorded the previous week, while that of the 364-day paper increased to 239.2% from the 233.8% recorded the previous week. The government accepted a total of Kshs 28.1 bn worth of bids out of Kshs 62.2 bn bids received, translating to an acceptance rate of 45.3%. The yields on the government papers were on a downward trajectory, with the yields on the 364-day, 182-day, and 91-day papers decreasing by 50.1 bps, 62.3 bps, and 46.7 bps to 15.0%, 14.5%, and 14.0% respectively from 15.5%, 15.1% and 14.4% respectively recorded the previous week.
So far in the current FY’2024/25, government securities totalling Kshs 646.0 bn have been advertised. The government has accepted bids worth Kshs 686.0 bn, of which Kshs 489.4 bn and Kshs 196.6 bn were treasury bills and bonds, respectively. The government has a domestic borrowing surplus of Kshs 316.6 bn in FY’2024/25.
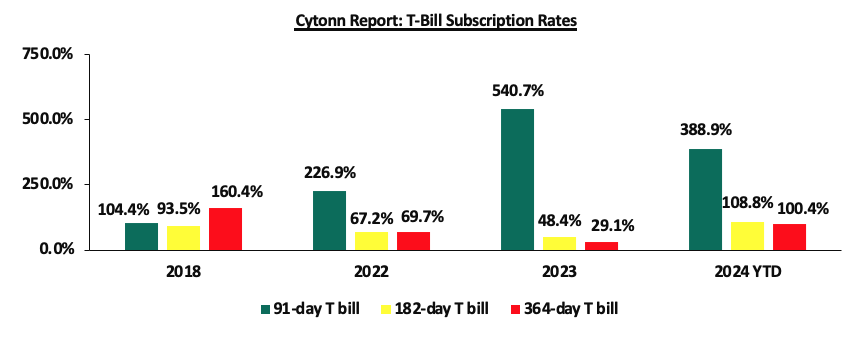
The chart below compares the overall average T-bill subscription rates obtained in 2018, 2022, 2023, and 2024 Year to Date (YTD):
Additionally, October 2024 bonds were oversubscribed, with the overall average oversubscription rate coming in at 139.9%, albeit lower than the oversubscription rate of 155.0% recorded in September 2024. The reopened bonds FXD1/2016/010 and FXD1/2022/010, with tenors to maturity of 1.8 and 7.6 years respectively and fixed coupon rates of 15.0% and 13.5% respectively, received bids worth Kshs 51.0 bn against the offered Kshs 30.0 bn translating to an oversubscription rate of 169.9%, with the government accepting bids worth Kshs 31.3 bn, translating to an acceptance rate of 61.5%, with the average accepted yields coming at 17.0% each. Additionally, the tapsale of the bond FXD1/2022/010, with a tenor to maturity of 7.5 years and a fixed coupon rate of 13.5%, received bids worth Kshs 16.5 bn against the offered Kshs 15.0 bn translating to an oversubscription rate of 110.0%, with the government accepting bids worth Kshs 15.1 bn, translating to an acceptance rate of 91.5%, with the average accepted yield remaining unchanged at 17.0%. The table below provides more details on the bonds issued in August, September, and October 2024:
|
Cytonn Report: Bond Issuances in September and October 2024 |
||||||||||
|
Issue Date |
Bond Auctioned |
Effective Tenor to Maturity (Years) |
Coupon |
Amount offered (Kshs bn) |
Actual Amount Raised (Kshs bn) |
Total bids received |
Average Accepted Yield |
Subscription Rate |
Acceptance Rate |
|
|
02/09/2024 |
IFB1/2023/17- Tapsale |
15.7 |
14.4% |
15.0 |
32.0 |
35.2 |
17.7% |
234.6% |
91.0% |
|
|
23/09/2024 |
FXD1/2016/020 - Re-opened |
12.0 |
14.0% |
30.0 |
19.3 |
22.6 |
17.3% |
75.5% |
85.1% |
|
|
FXD1/2024/010 - Re-opened |
9.5 |
16.0% |
16.9% |
|||||||
|
14/10/2024 |
FXD1/2016/010- Re-opened |
1.8 |
15.0% |
30.0 |
31.3 |
51.0 |
17.0% |
169.9% |
61.4% |
|
|
FXD1/2022/010- Re-opened |
7.6 |
13.5% |
17.0% |
|||||||
|
21/10/2024 |
FXD1/2022/010-Tapsale |
7.5 |
13.5% |
15.0 |
15.1 |
16.5 |
17.0% |
110.0% |
91.5% |
|
|
October 2024 Average |
5.6 |
14.0% |
22.5 |
15.5 |
22.5 |
17.0% |
139.9% |
76.4% |
||
|
September 2024 Average |
12.4 |
14.8% |
45.0 |
51.3 |
57.8 |
17.3% |
155.0% |
88.1% |
||
|
2023 Average |
6.1 |
14.8% |
740.3 |
735.2 |
872.4 |
15.5% |
117.8% |
82.0% |
||
Source: Central Bank of Kenya (CBK)
Secondary Bond Market:
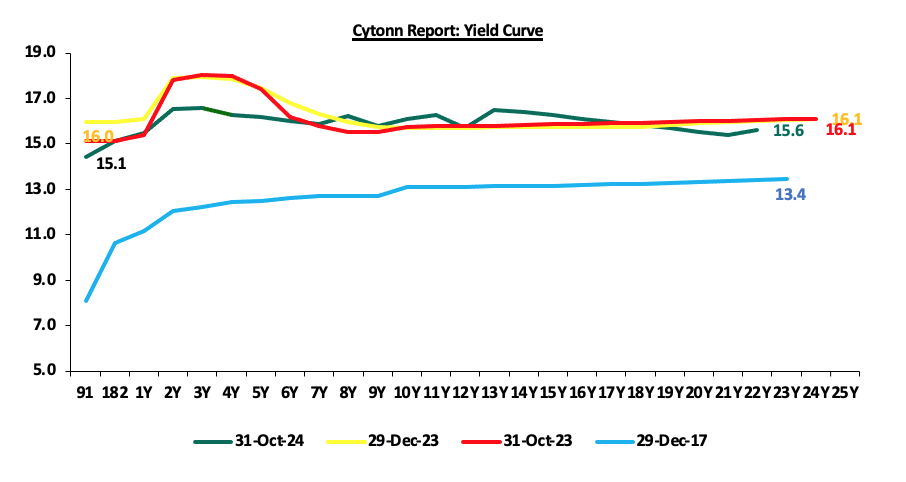
The yields on the government securities were on a downward trajectory during the month compared to September 2024, attributed to easing interest rates following the Monetary Policy Committee (MPC) decision to decrease the Central Bank Rate (CBR) by 75.0 bps to 12.00% from 12.75% earlier in the month and relatively stable inflation which came in at 2.7% in October 2024, which have fostered a more positive outlook among investors. The shift in sentiment indicates increased confidence in the economic landscape. The chart below shows the yield curve movement during the period:
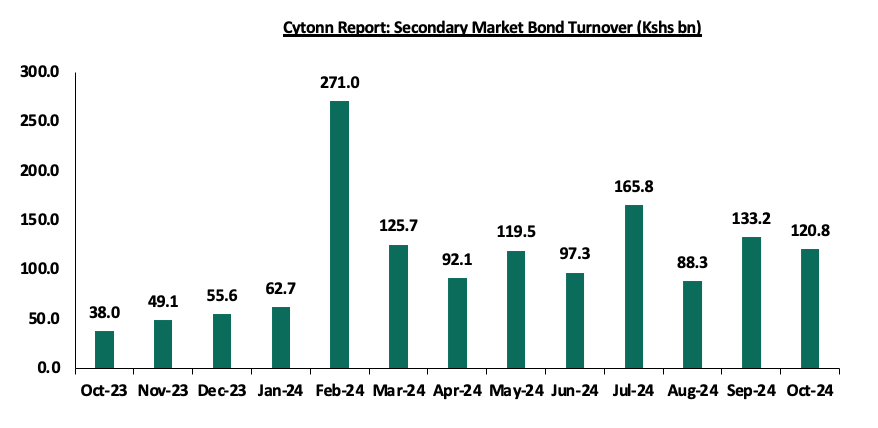
The secondary bond turnover decreased by 9.3% to Kshs 120.8 bn, from Kshs 133.2 bn recorded in September 2024, pointing towards decreased activities by commercial banks in the secondary bonds market for the month of October. However, on a year-on-year basis, the bond turnover increased by 217.9% from Kshs 38.0 bn worth of treasury bonds transacted over a similar period last year. The chart below shows the bond turnover over the past 12 months;
Money Market Performance:
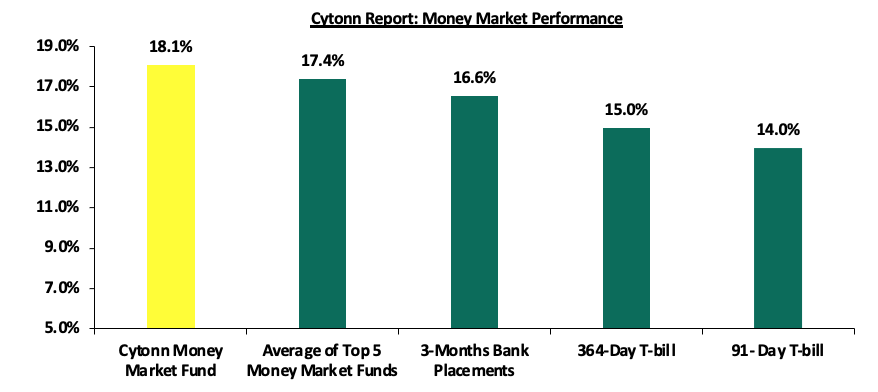
In the money markets, 3-month bank placements ended the week at 17.6% (based on what we have been offered by various banks), while the yield on the 364-day and 91-day papers decreased by 50.1 bps and 46.7 bps to 15.0% and 14.0% from the 15.5% and 14.4% respectively recorded the previous week. The yield of Cytonn Money Market Fund decreased marginally by 1.0 bps to remain unchanged at 18.1% recorded the previous week, and the average yields on the Top 5 Money Market Funds decreased marginally by 6.0 bps to remain unchanged from the 17.4% recorded the previous week.
The table below shows the Money Market Fund Yields for Kenyan Fund Managers as published on 1st November 2024:
|
Cytonn Report: Money Market Fund Yield for Fund Managers as published on 1st November 2024 |
||
|
Rank |
Fund Manager |
Effective Annual |
|
1 |
Cytonn Money Market Fund (Dial *809# or download the Cytonn App) |
18.1% |
|
2 |
Lofty-Corban Money Market Fund |
17.9% |
|
3 |
Etica Money Market Fund |
17.4% |
|
4 |
Arvocap Money Market Fund |
16.9% |
|
5 |
Kuza Money Market fund |
16.8% |
|
6 |
GenAfrica Money Market Fund |
15.7% |
|
7 |
Ndovu Money Market Fund |
15.5% |
|
8 |
Jubilee Money Market Fund |
15.5% |
|
9 |
Nabo Africa Money Market Fund |
15.4% |
|
10 |
Co-op Money Market Fund |
15.4% |
|
11 |
Madison Money Market Fund |
15.3% |
|
12 |
Mali Money Market Fund |
15.2% |
|
13 |
KCB Money Market Fund |
15.2% |
|
14 |
Absa Shilling Money Market Fund |
15.0% |
|
15 |
Sanlam Money Market Fund |
14.9% |
|
16 |
Apollo Money Market Fund |
14.9% |
|
17 |
Enwealth Money Market Fund |
14.9% |
|
18 |
Orient Kasha Money Market Fund |
14.7% |
|
19 |
Genghis Money Market Fund |
14.6% |
|
20 |
Faulu Money Market Fund |
14.5% |
|
21 |
Mayfair Money Market Fund |
14.4% |
|
22 |
Dry Associates Money Market Fund |
14.1% |
|
23 |
Old Mutual Money Market Fund |
13.9% |
|
24 |
Stanbic Money Market Fund |
13.8% |
|
25 |
CIC Money Market Fund |
13.5% |
|
26 |
ICEA Lion Money Market Fund |
13.4% |
|
27 |
British-American Money Market Fund |
13.3% |
|
28 |
Equity Money Market Fund |
13.2% |
|
29 |
AA Kenya Shillings Fund |
11.9% |
Source: Business Daily
Liquidity:
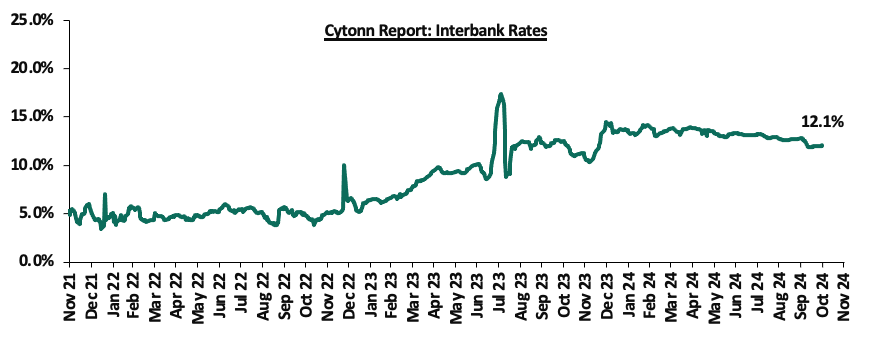
Liquidity in the money markets eased in the month of October 2024, with the average interbank rate decreasing by 52.9 bps to 12.2% from 12.7% recorded the previous month. However, during the month of August, the average interbank volumes traded increased by 28.6% to Kshs 34.1 bn, from Kshs 26.5 bn recorded in September.
Also, during the week, liquidity in the money markets tightened, with the average interbank rate increasing by 3.8 bps to remain relatively unchanged from 12.0% recorded the previous week, partly attributable to tax remittances that offset government payments. The average interbank volumes traded decreased by 24.8% to Ksh 31.5 bn from Kshs 41.9 bn recorded the previous week. The chart below shows the interbank rates in the market over the years:
Kenya Eurobonds:
During the month, the yields on the Eurobonds were on an upward trajectory, with the yield on the 12-year Eurobond issued in 2019 increasing the most by 31.7 bps to 9.9% from 9.6%, recorded at the end of September 2024. However, during the week, the yields on Eurobonds were on a downward trajectory, with the yields on the 12-year Eurobond issued in 2019 decreasing the most by 22.9 bps to 9.9% from 10.1% recorded the previous week. The table below shows the summary of the performance of the Kenyan Eurobonds as of 31st October 2024;
|
Cytonn Report: Kenya Eurobonds Performance |
||||||
|
2018 |
2019 |
2021 |
2024 |
|||
|
Tenor |
10-year issue |
30-year issue |
7-year issue |
12-year issue |
13-year issue |
7-year issue |
|
Amount Issued (USD) |
1.0 bn |
1.0 bn |
0.9 bn |
1.2 bn |
1.0 bn |
1.5 bn |
|
Years to Maturity |
3.6 |
23.6 |
2.8 |
7.8 |
9.9 |
6.5 |
|
Yields at Issue |
7.3% |
8.3% |
7.0% |
7.9% |
6.2% |
10.4% |
|
01-Jan-24 |
9.8% |
10.2% |
10.1% |
9.9% |
9.5% |
|
|
30-Sep-24 |
8.6% |
9.9% |
8.3% |
9.6% |
9.4% |
9.5% |
|
24-Oct-24 |
9.1% |
10.3% |
8.4% |
10.1% |
9.9% |
10.0% |
|
25-Oct-24 |
9.0% |
10.2% |
8.5% |
10.0% |
9.8% |
9.9% |
|
28-Oct-24 |
9.0% |
10.2% |
8.4% |
10.0% |
9.8% |
9.9% |
|
29-Oct-24 |
9.0% |
10.2% |
8.3% |
9.9% |
9.8% |
9.9% |
|
30-Oct-24 |
9.0% |
10.2% |
8.3% |
9.9% |
9.7% |
9.8% |
|
31-Oct-24 |
8.9% |
10.1% |
8.2% |
9.9% |
9.7% |
9.8% |
|
Weekly Change |
(0.2%) |
(0.2%) |
(0.2%) |
(0.2%) |
(0.2%) |
(0.2%) |
|
M/M Change |
0.3% |
0.2% |
(0.1%) |
0.3% |
0.3% |
0.3% |
|
YTD Change |
(0.9%) |
(0.0%) |
(1.9%) |
(0.0%) |
0.2% |
- |
Source: Central Bank of Kenya (CBK) and National Treasury
Kenya Shilling:
During the month, the Kenya Shilling depreciated marginally by 0.3 bps against the US Dollar, to close the month relatively unchanged at Kshs 129.2 recorded at the end of September 2024. Also, during the week, the Kenya Shilling depreciated marginally by 0.3 bps against the US Dollar to remain unchanged from the Kshs 129.2 recorded the previous week. On a year-to-date basis, the shilling has appreciated by 17.7% against the US Dollar, a sharp contrast to the 26.8% depreciation recorded in 2023.
We expect the shilling to be supported by:
- Diaspora remittances standing at a cumulative USD 4,723.0 mn in the 12 months to September 2024, 14.0% higher than the USD 4,142.0 mn recorded over the same period in 2023, which has continued to cushion the shilling against further depreciation. In the September 2024 diaspora remittances figures, North America remained the largest source of remittances to Kenya accounting for 55.4% in the period,
- The tourism inflow receipts which came in at USD 352.5 bn in 2023, a 31.5% increase from USD 268.1 bn inflow receipts recorded in 2022, and owing to tourist arrivals that improved by 21.0% in the 12 months to August 2024, compared to a similar period in 2023, and,
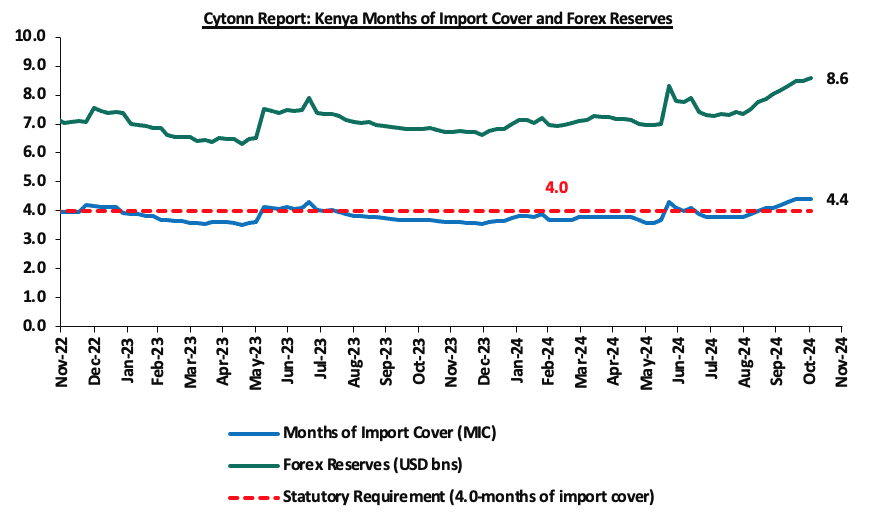
- Improved forex reserves currently at USD 8.5 bn (equivalent to 4.4-months of import cover), which is above the statutory requirement of maintaining at least 4.0-months of import cover, but slightly lower than the EAC region’s convergence criteria of 4.5-months of import cover.
The shilling is however expected to remain under pressure in 2024 as a result of:
- An ever-present current account deficit which came at 3.8% of GDP in Q2’2024 from 3.7% recorded in Q2’2023, and,
- The need for government debt servicing, continues to put pressure on forex reserves given that 67.9% of Kenya’s external debt is US Dollar-denominated as of March 2024.
Key to note, during the month of October 2024, Kenya’s forex reserves increased by 7.0% to USD 8.6 bn at USD 8.0 bn recorded the previous month, and the months of import cover increased to 4.4 months from 4.1 months, recorded at the end of September 2024. Also, Kenya’s forex reserves increased by 1.1% during the week to USD 8.6 bn from USD 8.5 bn recorded the previous week, equivalent to 4.4 months of import cover, and above the statutory requirement of maintaining at least 4.0-months of import cover.
The chart below summarizes the evolution of Kenya's months of import cover over the years:
Monthly Highlights:
- During the month, the Kenya National Bureau of Statistics (KNBS) released the Q2’2024 Quarterly Gross Domestic Product Report, highlighting that the Kenyan economy recorded a 4.6% growth in Q2’2024, slower than the 5.6% growth recorded in Q2’2023. The main contributor to Kenyan GDP remains to be the Agriculture, Fishing, and Forestry sector which grew by 4.8% in Q2’2024, lower than the 7.8% expansion recorded in Q2’2023. All sectors in Q2’2024, except Mining and Quarrying; and Construction recorded positive growths, with varying magnitudes across activities. Most sectors recorded declining growth rates compared to Q2’2023 with Accommodation and Food Services; Financial & Insurance; and Construction Sectors recording the highest declines of 16.2%, 8.1%, and 5.6% points, respectively. Other sectors that recorded a contraction in growth rate, from what was recorded in Q2’2023 were Financial Services Indirectly Measured, Agriculture and Forestry, and Real Estate sectors, of 4.0%, 3.0%, and 2.1% points respectively. For more information, see our Cytonn Q3’2024 Markets review,
- During the month, the Kenya National Bureau of Statistics released the Q2’2024 Balance of Payment Report, highlighting that Kenya’s balance of payments position deteriorated by 45.0% in Q2’2024, coming in at a surplus of Kshs 84.1 bn, from a surplus of Kshs 152.9 bn in Q2’2023, and a significant improvement from the Kshs 36.0 bn deficit recorded in Q1’2024. For more information, see our Cytonn Q3’2024 Markets review,
- During the month, Stanbic Bank released its monthly Purchasing Manager's Index (PMI)highlighting that the index for the month of September 2024 declined, coming in at 49.7, down from 50.6 in August 2024, signalling a deterioration in business conditions. This is attributable to the slowdown in business activity and reduced intake of new business intakes, owing to challenging economic conditions. This also implied that the uptick in August was due to some recovery after disruptions by the protests. For more information, see our Cytonn Q3’2024 Markets review,
- Additionally, during the month, the National Treasury gazettedthe revenue and net expenditures for the third month of FY’2024/2025, ending 30th September 2024, highlighting that the total revenue collected as at the end of September 2024 amounted to Kshs 592.0 bn, equivalent to 22.5% of the revised estimates of Kshs 2,631.4 bn for FY’2024/2025 and is 90.0% of the prorated estimates of Kshs 657.9 bn. For more information, see our Cytonn Weekly #42/2024,
- During the month, the National Treasury publishedthe Annual Borrowing Plan for FY’2024/25, with details of the government’s borrowing requirements for the fiscal year. The 2024 Annual Borrowing Plan outlines the requirements and sources of borrowing for FY’2024/25 as specified in Supplementary Estimates 1 for FY’2024/2025 and the 2024 Medium Term Debt Management Strategy (MTDS). For more information, see our Cytonn Weekly #42/2024,
- During the month, the US Federal Reserve announced their decision to cut its benchmark interest rate by 50 bps, to a range of 4.75%-5.00% from a range of 5.25%-5.50%. The decision came after the Federal Open Market Committee (FOMC) voted eleven to one to lower the federal funds rates after holding it for more than a year at its highest level in two decades. Notably, it was the Fed’s first rate cut in more than four years,
- During the month, the Monetary Policy Committee (MPC) met on October 8th, 2024, to review the outcome of its previous policy decisions against a backdrop of improved global outlook for growth, easing in inflation in advanced economies as well as the persistent geopolitical tensions. The MPC decided to lowerthe CBR rate by 75.0 bps to 12.00%, from 12.75% which was in line with our expectation for the MPC to lower the CBR rate. Our expectation to cut the rate was mainly on the back of rate cuts by some major economies, a stable exchange rate, and anchored inflationary pressures, with inflation coming in at 3.6% in September 2024 from 4.4% in August, remaining within the CBK preferred range of 2.5%-7.5% for the fifteenth consecutive month, as well as the need to support the economy by adopting an accommodative policy that will ease financing activities. For more information, see our Cytonn Weekly #41/2024.
Weekly Highlights:
- October 2024 Inflation Highlight
The y/y inflation in October 2024 decreased by 0.9% points to 2.7%, from the 3.6% recorded in September 2024. This was below our projected range of 3.4% to 3.8%, where our decision was mainly driven by the reduction in the Central Bank Rate (CBR) by 75.0 bps to 12.00% from 12.75%, which would increase the money supply, coupled with increased electricity prices. The headline inflation in October 2024 was majorly driven by an increase in prices of commodities in the following categories; Food & Non-Alcoholic Beverages, Housing, Water, Electricity, Gas & other fuels by 4.3% and 0.4% respectively. However, the commodity prices in the Transport sector declined by 1.3%. The table below shows a summary of both the year-on-year and month-on-month commodity indices performance:
|
Cytonn Report: Major Inflation Changes – October 2024 |
|||
|
Broad Commodity Group |
Price change m/m (October-2024/September -2024) |
Price change y/y (October-2024/October-2023) |
Reason |
|
Food and non-alcoholic beverages |
0.5% |
4.3% |
The m/m increase was mainly driven by the increase in prices of commodities such as mangoes, carrots and oranges by 9.9%, 5.7% and 5.1% respectively. However, the increase was supported by decrease in prices of sugar, maize flour sifted and fortified maize flour by 2.8%, 2.1%, and 0.6%, respectively |
|
Transport |
(0.3%) |
(1.3%) |
The m/m decrease recorded in the transport index was mainly on the back of a decrease in the prices of Super Petrol and Diesel by 4.3% and 2.1% to Kshs 180.7 and Kshs 168.1 from Kshs 188.8 and Kshs 168.1 per litre respectively recorded in September 2024. |
|
Housing, water, electricity, gas and other fuels |
(0.3%) |
0.4% |
The m/m performance was mainly driven by the decrease in prices of Kerosene by 4.4% to Kshs 151.4, from Kshs 158.4 per litre recorded in September 2024. The decrease was however weighed down by an increase in prices of 50 kWh of electricity and 200 kWh of electricity by 0.3% and 0.2% respectively |
|
Overall Inflation |
0.2% |
2.7% |
The m/m increase was mainly attributable to the 0.5% increase in Food and non-alcoholic beverages. |
Notably, October’s overall headline inflation declined sharply, following the decline recorded in September 2024. The decrease in headline inflation in October 2024 comes amid the decrease in the maximum allowed price for Super Petrol, Diesel, and Kerosene by Kshs 8.2, Kshs 3.5, and Kshs 6.9 per litre respectively to retail at Kshs 180.7, Kshs 168.1 and Kshs 151.4 per litre respectively, from Kshs 188.8, Kshs 171.6 and Kshs 158.4 per litre respectively in the last month. Furthermore, it has remained within the Central Bank of Kenya (CBK) target range of 2.5% to 7.5% for the sixteenth consecutive month. The chart below shows the inflation rates for the past 5 years:
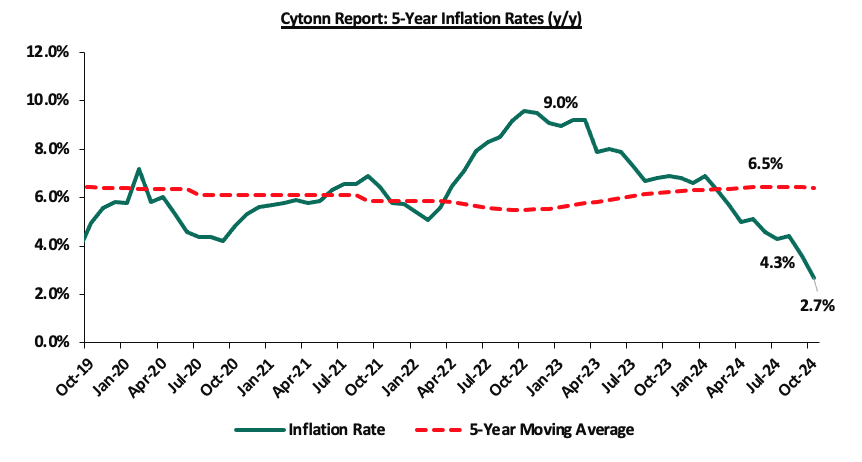
We note that while prices of commodities still increased as reflected in the cost of living pressures felt by netizens in the country, the rate of increase was the slowest it has been, since 2010. Going forward, we expect inflation to remain within the CBK’s preferred range of 2.5%-7.5%, mainly on the back of a strengthened currency and reduced fuel prices. The risk, however, lies in the fuel prices which despite their decline over the last months, still remain elevated compared to historical levels. Additionally, favourable weather conditions will also contribute to stabilizing food prices, further supporting lower inflation rates. Key to note is that the Monetary Policy Committee cut the Central Bank Rate by 75.0 bps to 12.00% from 12.75% in its October 2024 meeting, with the aim of easing the monetary policy and maintaining exchange rate stability, and will meet again on December 2024. This cut in the Central Bank Rate is likely to elevate inflationary pressures as consumer spending rises leading to demand-pull inflation. The committee is expected to lower rates further, though gradually, to provide further support for the economy.
- International Monetary Fund (IMF) Loan facility
During the week, The International Monetary Fund (IMF) executive board completed the seventh and eighth reviews under the Extended Fund Facility (EFF) and Extended Credit Facility (ECF), alongside a review under the Resilience Sustainability Facility (RSF). This decision enables the immediate disbursement of approximately USD 606.1 mn to support Kenya’s efforts to stabilize its economy, address fiscal challenges, and enhance resilience to climate-related shocks. The IMF’s approval allows Kenya to receive USD 485.8 mn under the EFF/ECF arrangements, aimed at reducing Kenya’s debt vulnerabilities, safeguarding funds for social and developmental priorities, and supporting broader economic reforms and USD 120.3 mn under the RSF, which focuses on reinforcing Kenya's climate-related initiatives and catalysing additional private sector climate finance. Earlier this year, Kenya faced intense financial pressures with discussions of a possible debt default. However, following the USD 1.5 mn Eurobond buyback, market confidence improved, the Kenyan Shilling stabilized and this allowed Kenya to quickly rebuild its foreign currency reserves. However, pushback against the new tax reforms due to concerns about how the government handles funds has further hindered the government’s efforts on fiscal consolidation and reducing debt. The Board noted that as the government continues to increase domestic revenues mainly through taxes and meet high debt repayment obligations, delivering on these calls for the government to build public trust by making government spending more accountable and transparent.
In addition to the approval of the immediate disbursement of USD 606.1 mn, in response to Kenya’s recent fiscal challenges, the IMF approved a reduction in the total access under the EFF/ECF arrangements from exceptional access that was approved in January 2024 to align with normal access limits. In the Annual Debt Plan, the government had factored in a disbursement of USD. 874.0 mn, which brings the shortfall for this disbursement to USD 267.9 mn. This deficit now means the government will need to look in other directions to get this funding. Last month, the Cabinet Secretary of Finance had alluded to a USD 1.5 mn commercial loan from the United Arab Emirates, which the IMF wasn’t comfortable with on account of the cost. On revenue-raising, Treasury already proposed some amendments to the Tax Procedures Act, aimed at mobilizing revenue collection, which is now under public participation.
The IMF also rebalanced access toward the zero-interest ECF, which, combined with changes to the IMF’s charges and surcharges policy, will reduce Kenya’s interest obligations. This adjustment is intended to alleviate Kenya's debt burden and make it more sustainable. This approval is part of Kenya's broader program with the IMF, which has provided a combined financial commitment of approximately USD 3.6 bn under the EFF/ECF programs and USD 541.3 mn under the RSF arrangement. Under the EFF/ECF arrangements, about USD 3.1 bn has already been approved while USD 180.4mn has already been approved under the RSF arrangement.
The IMF Executive Board noted that Kenya’s progress under the EFF/ECF programs has been promising, particularly in reducing inflation, strengthening financial reserves, and stabilizing the currency. Given Kenya's recent corrective steps, including passing a revised FY’2024/25 budget, the IMF approved waivers on some missed revenue and budget targets. These adjustments, coupled with a medium-term fiscal strategy, are intended to address Kenya’s debt vulnerabilities. However, achieving sustainable progress will require Kenya to improve the quality of its fiscal policies, address weaknesses in the financial sector, and implement structural reforms.
The IMF commended the Central Bank of Kenya’s proactive steps to support price stability and improve exchange rate flexibility, which is crucial for resilience against external shocks. The CBK’s decisions this year have so far led to an ease in inflationary pressures, coming in at 2.7% as of October 2024, and a stability of the Kenyan Shilling against the USD with the year-to-date gain at 17.7%. However, the IMF recommends that the Central Bank closely monitor banks' asset quality and address emerging risks within the financial sector.
|
Cytonn Report: International Monetary Fund (IMF) EFF and ECF Financing Programme |
||
|
Date |
Amount Received (USD mn) |
Amount Received (Kshs bn, 1 USD= Kshs 160.8) |
|
Apr-21 |
307.5 |
49.4 |
|
Jun-21 |
407.0 |
65.4 |
|
Dec-21 |
258.1 |
41.5 |
|
Jul-22 |
235.6 |
37.9 |
|
Nov-22 |
433.0 |
69.6 |
|
Jul-23 |
415.4 |
66.8 |
|
Jan-24 |
624.5 |
100.4 |
|
Nov-24 |
485.8 |
62.8 |
|
Total Amount Received |
3,166.9 |
493.9 |
|
Amount Pending |
713.1 |
114.7 |
|
*Funds expected upon IMF management and executive board disbursement |
||
This latest disbursement brings the total amount received in this program to USD 3.2 bn, USD 0.7 bn short of the USD 3.9 bn expected from the whole program. Given the program ends in April 2025, there’s still room for another review and disbursement of the remaining amount.
|
Cytonn Report: International Monetary Fund (IMF) RSF Financing Programme |
||
|
Date |
Amount Received (USD mn) |
Amount Received (Kshs bn, 1 USD= Kshs 160.8) |
|
Jan-24 |
60.2 |
7.8 |
|
Nov-24 |
120.3 |
15.5 |
|
Total Amount Received |
180.5 |
23.3 |
|
Amount Pending |
360.9 |
63.7 |
|
*Funds expected upon IMF management and executive board disbursement |
||
This financing will go a long way in solving some of the liquidity issues faced by the government including debt servicing, pending bill payments, and the public sector wage bill. However, we expect introduction of revenue-raising measures to curb the shortfall from the funding, including tax reforms through the Tax Procedures (Amendment) Bill, 2024, and a probable Supplementary II budget to revise the budget. The disbursements under the RSF program are also expected to give a boost to the climate agenda, whose progress the IMF team noted was quite strong. Finally, the loan disbursement will support the country’s Medium Term Debt Strategy, which aims to optimize the use of concessional loans and reduce the use of costly commercial loans, and the current administration’s plans to cut public expenditure to reduce the budget deficit.
Rates in the Fixed Income market have been on an upward trend given the continued high demand for cash by the government and the occasional liquidity tightness in the money market. The government is 123.9% ahead of its prorated net domestic borrowing target of Kshs 141.4 bn, having a net borrowing position of Kshs 316.6 bn. However, we expect a downward readjustment of the yield curve in the short and medium term, with the government looking to increase its external borrowing to maintain the fiscal surplus, hence alleviating pressure in the domestic market. As such, we expect the yield curve to normalize in the medium to long-term and hence investors are expected to shift towards the long-term papers to lock in the high returns.
Market Performance:
During the month of October 2024, the equities market was on an upward trajectory, with NSE 10 and NSE 25 gaining the most by 10.1% each; while NASI and NSE 20 gained by 9.8% and 7.3% respectively. The equities market's positive performance was driven by gains recorded by large-cap stocks such as EABL, Bamburi, and Safaricom of 18.3%, 11.9%, and 11.7% respectively.
During the week, the equities markets were on an upward trajectory, with NSE 20 gaining the most by 2.8%; NSE 25, NSE 25, and NASI gained by 1.9%, 1.9%, and 1.8% respectively, taking the YTD performance to gains of 35.9%, 33.7%, 27.9%, and 26.3% for NSE 10, NSE 25, NASI, and NSE 20 respectively. The equities market performance was driven by gains recorded by large-cap stocks such as Stanbic Holdings, EABL, and KCB Group of 3.6%, 3.2%, and 2.5% respectively. The performance was, however, weighed down by losses recorded by large-cap stocks such as Bamburi and DTBK of 4.7% and 1.4% respectively.
Equities turnover decreased by 1.6% in the month of October 2024 to USD 38.2 mn, from USD 38.8 mn recorded in September 2024. Foreign investors became net sellers, with a net selling position of USD 4.4 mn, from a net buying position of USD 0.2 mn recorded in September 2024.
During the week, equities turnover decreased by 3.3% to USD 8.8 mn from USD 9.1 mn recorded the previous week, taking the YTD total turnover to USD 521.3 mn. Foreign investors remained net sellers for the fourth consecutive week with a net selling position of USD 1.7 mn, from a net selling position of USD 1.6 mn recorded the previous week, taking the YTD foreign net selling position to USD 2.3 mn.
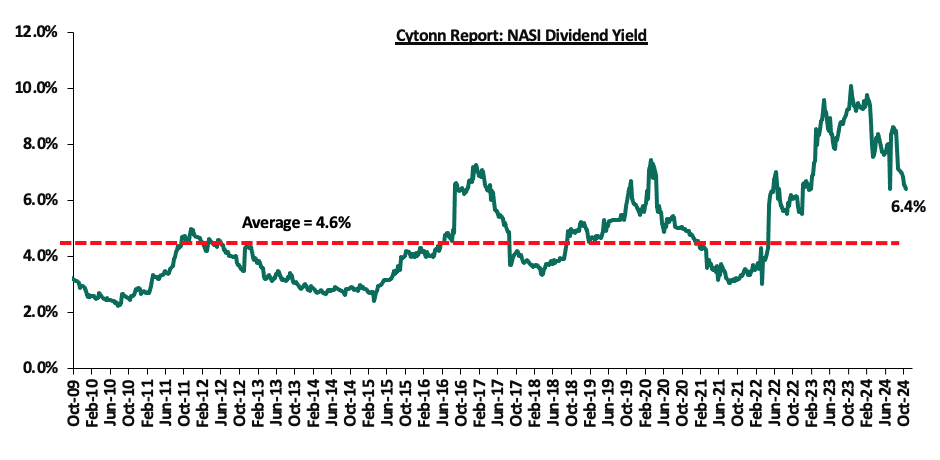
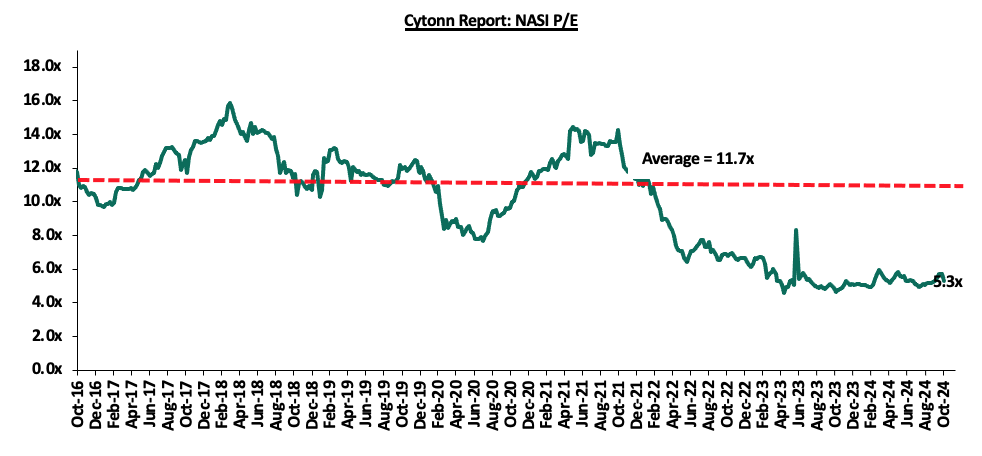
The market is currently trading at a price-to-earnings ratio (P/E) of 5.3x, 55.0% below the historical average of 11.7x. The dividend yield stands at 6.4%, 1.9% points above the historical average of 4.6%. Key to note, NASI’s PEG ratio currently stands at 0.7x, an indication that the market is undervalued relative to its future growth. A PEG ratio greater than 1.0x indicates the market is overvalued while a PEG ratio less than 1.0x indicates that the market is undervalued. The charts below indicate the historical P/E and dividend yields of the market;
Universe of Coverage:
|
|
Cytonn Report: Equities Universe of Coverage |
||||||||||||
|
Company |
Price as at 25/10/2024 |
Price as at 31/10/2025 |
w/w change |
m/m change |
YTD Change |
Year Open 2024 |
Target Price* |
Dividend Yield*** |
Upside/ Downside** |
P/TBv Multiple |
Average |
||
|
Jubilee Holdings |
165.0 |
170.0 |
3.0% |
6.1% |
(8.1%) |
185.0 |
260.7 |
8.4% |
61.7% |
0.3x |
Buy |
||
|
NCBA*** |
44.0 |
44.1 |
0.1% |
3.2% |
13.4% |
38.9 |
55.2 |
10.8% |
36.1% |
0.8x |
Buy |
||
|
Equity Group*** |
46.9 |
47.3 |
1.0% |
7.9% |
38.3% |
34.2 |
60.2 |
8.5% |
35.7% |
0.9x |
Buy |
||
|
Britam |
5.5 |
5.5 |
0.7% |
(7.0%) |
7.8% |
5.1 |
7.5 |
0.0% |
35.4% |
0.8x |
Buy |
||
|
CIC Group |
2.1 |
2.2 |
5.3% |
7.8% |
(3.9%) |
2.3 |
2.8 |
5.9% |
33.2% |
0.7x |
Buy |
||
|
Co-op Bank*** |
13.8 |
14.1 |
2.2% |
5.6% |
24.2% |
11.4 |
17.2 |
10.6% |
32.6% |
0.6x |
Buy |
||
|
Diamond Trust Bank*** |
53.8 |
53.0 |
(1.4%) |
7.7% |
18.4% |
44.8 |
65.2 |
9.4% |
32.5% |
0.2x |
Buy |
||
|
Stanbic Holdings |
124.5 |
129.0 |
3.6% |
10.0% |
21.7% |
106.0 |
145.3 |
11.9% |
24.5% |
0.8x |
Buy |
||
|
ABSA Bank*** |
15.0 |
15.3 |
2.3% |
8.9% |
32.5% |
11.6 |
17.3 |
10.1% |
23.2% |
1.2x |
Buy |
||
|
KCB Group*** |
37.6 |
38.5 |
2.5% |
11.0% |
75.4% |
22.0 |
46.7 |
0.0% |
21.2% |
0.6x |
Buy |
||
|
Standard Chartered Bank |
230.3 |
232.0 |
0.8% |
10.5% |
44.8% |
160.3 |
235.2 |
12.5% |
13.9% |
1.5x |
Accumulate |
||
|
I&M Group*** |
27.5 |
28.1 |
2.4% |
19.6% |
61.0% |
17.5 |
26.5 |
9.1% |
3.4% |
0.6x |
Lighten |
||
|
|
*Target Price as per Cytonn Analyst estimates **Upside/ (Downside) is adjusted for Dividend Yield ***Dividend Yield is calculated using FY’2023 Dividends |
||||||||||||
Monthly Highlights
On October 25, 2024, the Capital Markets Authority (CMA) of Kenya approved HF Group PLC’s rights issue, paving the way for a significant capital-raising initiative aimed at strengthening its balance sheet and supporting its strategic growth objectives. This move comes as part of HF Group's broader vision to bolster investments in its subsidiary, HFC Limited, and expand into diversified business segments, especially in the digital space. For more information, please see our Cytonn Weekly #43/2024.
Weekly Highlights
- Kenya Electricity Generating Company (KenGen) FY’2024 Financial Performance
During the week, Kenya Electricity Generating Company released their FY’2024 Financial Results, for the period ended 30th June 2024, recording a 35.5% increase in Profits after Tax (PAT) to Kshs 6.8 bn, from Kshs 5.0 bn recorded in FY’2023. The increase in PAT was majorly attributed to the 148.8% increase in finance income to Kshs 4.2 bn from Kshs 1.7 bn, coupled with the 5.3% increase in net revenue to Kshs 48.3 bn in FY’2024 from Kshs 45.8 bn recorded in FY’2023. The performance was however weighed down by the 2.7% increase in finance costs to Kshs 2.8 bn in FY’2024, from Kshs 2.7 bn recorded in FY’2023 as well as the 1.4% increase in operating expenses to Kshs 39.3 bn, from Kshs 38.8 in FY’2023. The tables below show the breakdown of KenGen’s financial performance;
|
Cytonn Report: Kenya Electricity Generating Company (KenGen) FY’2024 Performance |
|||
|
Income Statement |
FY’2023 Kshs (bn) |
FY’2024 Kshs (bn) |
% Change |
|
Revenue |
54.0 |
56.3 |
4.3% |
|
Fuel & Water Costs |
(8.1) |
(8.0) |
(1.5%) |
|
Revenue Net Reimbursable Expenses |
45.8 |
48.3 |
5.3% |
|
Other Income |
2.1 |
1.3 |
(37.7%) |
|
Gains/(Losses) on Net Forex & Fair Valuation of Financial Assets |
0.4 |
(0.7) |
(268.7%) |
|
Operating Expenses |
(38.8) |
(39.3) |
1.4% |
|
Operating Profit |
9.6 |
9.6 |
(0.2%) |
|
Finance Income |
1.7 |
4.2 |
148.8% |
|
Finance Cost |
(2.7) |
(2.8) |
2.7% |
|
Profit/(Loss) Before Tax |
8.5 |
10.9 |
28.4% |
|
Income Tax |
(3.5) |
(4.2) |
18.3% |
|
Profit/(Loss) After Tax |
5.0 |
6.8 |
35.5% |
|
Earnings Per Share (EPS) |
0.8 |
1.0 |
35.5% |
|
Dividend Per Share (DPS) |
0.30 |
0.65 |
116.7% |
|
Dividend Payout ratio |
39.4% |
63.1% |
23.6% |
|
*Dividend Yield |
13.0% |
16.6% |
28.0% |
source: Kenya Electricity Generating Company (KenGen) FY’2024 Financial Report, *Dividend Yield calculated as of 30th June
|
Cytonn Report: Kenya Electricity Generating Company (KenGen) FY’2024 Performance |
|||
|
Balance Sheet |
FY’2023 Kshs (bn) |
FY’2024 Kshs (bn) |
% Change |
|
Non-Current Assets |
470.7 |
443.1 |
(5.9%) |
|
Current Assets |
45.9 |
48.2 |
5.1% |
|
Total Assets |
516.6 |
491.3 |
(4.9%) |
|
Non-Current Liabilities |
220.2 |
194.4 |
(11.7%) |
|
Current Liabilities |
22.2 |
18.8 |
(15.3%) |
|
Total Liabilities |
242.4 |
213.2 |
(12.0%) |
|
Total Equity |
274.2 |
278.1 |
1.4% |
Source: Kenya Electricity Generating Company (KenGen) FY’2024 Financial Report
Key take outs from the financial performance include;
- Net revenue increased by 5.3% to Kshs 48.3 bn in FY’2024, from Kshs 45.8 bn recorded in FY’2023, mainly driven by the 4.3% increase in gross revenue to Kshs 56.3 bn from Kshs 54.0 bn in FY’2024, attributable to enhanced availability of the geothermal and hydropower plants enabling greater capitalization on the rising energy demand. The rise in net revenue was further supported by the 1.5% decline in reimbursable expenses (fuel & water costs) to Kshs 8.0 bn in FY’2024, from Kshs 8.1 bn in FY’2023. Notably, the decrease in reimbursable expenses is attributed to the impact of favourable hydrology and plant efficiency,
- Income tax increased by 18.3% to Kshs 4.2 bn, from Kshs 3.5 bn despite the decrease in unrealized foreign exchange differences disallowable for tax purposes as a result of the strengthening of the Kenya Shilling during the period,
- Operating profit decreased marginally by 0.2% to Kshs 9.55 bn in FY’2024 from Kshs 9.57 bn in FY’2024, largely driven by the 37.7% decrease in other income to Kshs 1.3 bn in FY’2024, from Kshs 2.1 bn in FY’2023. The decline was further weighed down by the 1.4% growth in the total expenses to 39.3 bn in FY’2024 from 38.8 bn in FY’2023,
- The balance sheet recorded a contraction as total assets declined by 4.9% to Kshs 491.3 bn in FY’2024 from Kshs 516.6 bn in FY’2023, attributable to the 95.9% decrease in the financial assets at fair value to Kshs 0.7 bn from Kshs 17.8 bn in FY’2023. The performance was however supported by the 5.1% increase in the current assets to Kshs 48.2 from Kshs 45.9 bn in FY’2023,
- The current liabilities decreased by 15.3% to Kshs 18.8 bn in FY’2024, from Kshs 22.2 bn recorded in FY’2023, mainly attributable to decreased borrowing as a result of downward revaluation following the strengthening of the Kenya Shilling against major currencies and loan repayments,
- Earnings per share increased by 35.5% to Kshs 1.0 in FY’2024, from Kshs 0.8 in FY’2023, mainly due to the 35.5% increase in the company’s profit after tax to Kshs 6.8 bn in FY’2024 from Kshs 5.0 bn in FY’2023, and,
- The board of directors recommends a first and final dividend for the year of Kshs 0.65 per share, a significant 116.7% increase from Kshs 0.30 declared in FY’2024. This translates to a dividend payout ratio of 63.1% and a dividend yield of 16.6%, from 39.4% and 13.0% respectively recorded in FY’2023.
Going forward, we expect the company’s earnings to be supported by increased revenues as a result of increased national demand for clean electric energy. Notably, the company has continued to implement strategies to increase production and revenue such as the rehabilitation of Olkaria I geothermal power plant to increase its capacity to 63 MW from 45 MW and the construction of the 80 MW Olkaria VII Geothermal project, the Gogo hydro-power plant and the Seven Forks Solar PV project. These projects will further diversify the company’s energy portfolio and increase its installed capacity in turn reducing the company’s carbon footprint, reinforcing its commitment to sustainability, environmental responsibility, and responsible growth.
We are “Neutral” on the Equities markets in the short term due to the current tough operating environment and huge foreign investor outflows, and, “Bullish” in the long term due to current cheap valuations and expected global and local economic recovery. With the market currently being undervalued for its future growth (PEG Ratio at 0.7x), we believe that investors should reposition towards value stocks with strong earnings growth and that are trading at discounts to their intrinsic value. We expect the current high foreign investors’ sell-offs to continue weighing down the equities outlook in the short term.
- Industry Report
During the week, the Central Bank of Kenya (CBK) released its Q2’2024 Quarterly Economic Review which highlighted the status and performance of Kenya’s economy during the period under review. The following were the key take outs from the report, with regard to the Real Estate and related sectors;
- The year-on-year (y/y) gross loans advanced to the Real Estate sector increased by 1.4% to Kshs 502.0 bn, from Kshs 495.0 bn in Q2’2023. The advanced loans also represented a 0.6% quarter-on-quarter (q/q) increase from Kshs 500.0 bn realized in Q1’2024. The improved performance can be attributable to a 1% increase in the value of approved building plans in the Nairobi Metropolitan Area (NMA) to Kshs 59.8 bn in Q2’2024, from Kshs 25.3 bn recorded in Q2’ 2023, which is a major contribution to the Real Estate market in the country,
- The gross Non-Performing Loans (NPLs) in the Real Estate sector recorded a q/q decrease of 2.4% to Kshs 114.3 bn in Q2’2024, from 117.1 bn recorded in Q1’2024. This can be attributable to; i) a slight easing of inflation in the month of April 2024 by 0.7% points to 5.0%, from the 5.7% recorded in March 2024 thus improving property owners’ and developers’ ability to meet debt obligations, ii) the Kenyan Shilling appreciating against the US Dollar by 17.2% in H1’2024, to close at Kshs 129.5, from Kshs 156.5 as at the end of FY’2023 increasing investor confidence in the country, and, iii) repayments of loans as the economy recorded an improvement in performance during the period under review. The graph below shows Gross Loans advanced to the Real Estate sector against Non-Performing Loans in the sector from Q1’2019 to Q2’2024;
Source: Central Bank of Kenya (CBK)
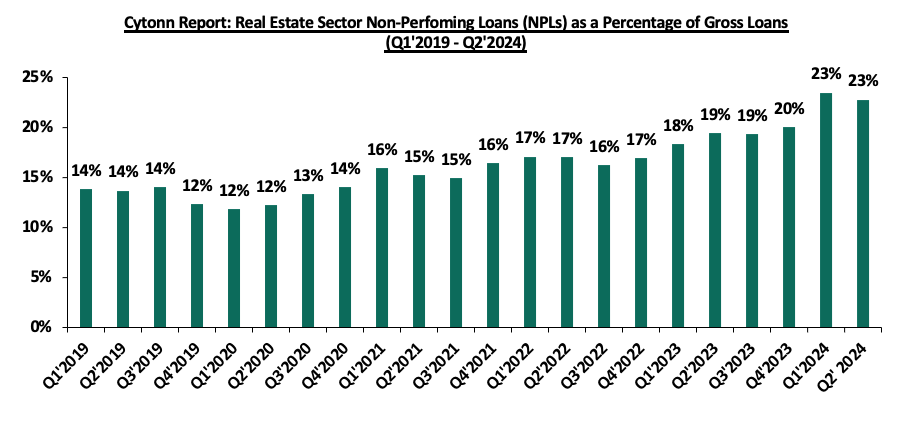
The graph below shows Non-performing Loans (NLPs) as a percentage of the gross loans advanced to the Real Estate Sector;
Source: Central Bank of Kenya (CBK)
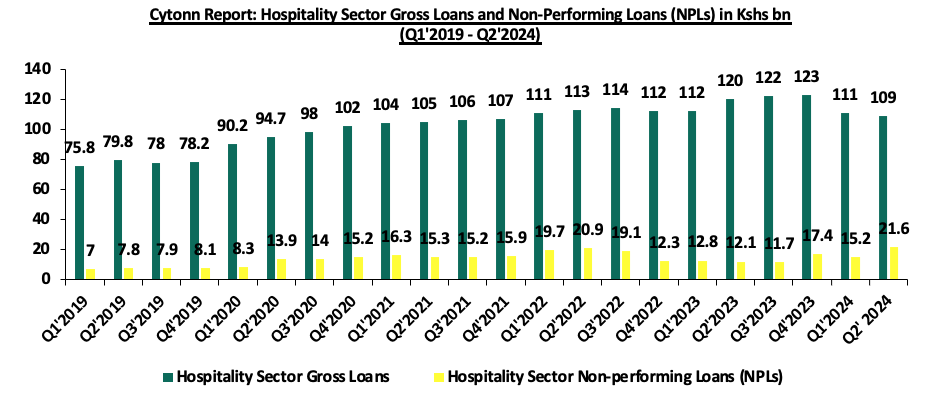
- The gross loans advanced to the hospitality sector on a y/y basis decreased by 9.2% to Kshs 109.0 bn in Q2’2024, from Kshs 120.0 bn in Q2’2023. On a q/q basis, the performance also represented a 1.8%-point decrease to Kshs 109.0 bn in Q2’2024 from Kshs 111.0 bn in Q1’2024. The decrease can be attributed to year-round repayment of outstanding loans, as the sector experiences recovery post-COVID-19 Pandemic, coupled with the tightening of the monetary policies whereby the MPC decided to raise the CBR rate by 0.5% points to 13.0% from 12.5% in February 2024, thus increasing the cost of borrowing for individuals and businesses in the hospitality industry in the subsequent period under review,
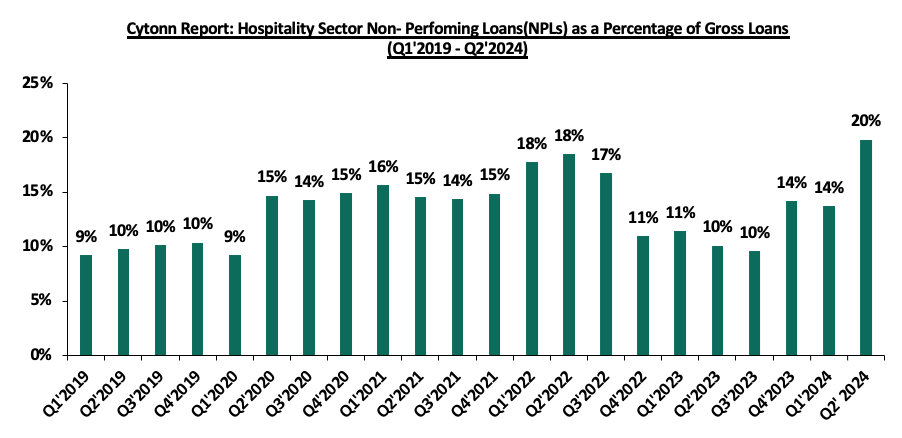
- Gross NPLs in the hospitality sector increased by 78.5% on y/y basis to Kshs 21.6 bn in Q2’2024 from Kshs 12.1 bn in Q2’2023. The performance was primarily driven by the increased cost of operations on the back of borrowers struggling to make timely repayments as the MPC maintained the CBR at a high of 0% during the period under review. The graph below shows Gross Loans advanced to the Hospitality sector against Non-Performing Loans in the sector from Q1’2019 to Q2’2024;
Source: Central Bank of Kenya (CBK)
The graph below shows Non-performing Loans (NLPs) as a percentage of the gross loans advanced to the Hospitality Sector
Source: Central Bank of Kenya (CBK)
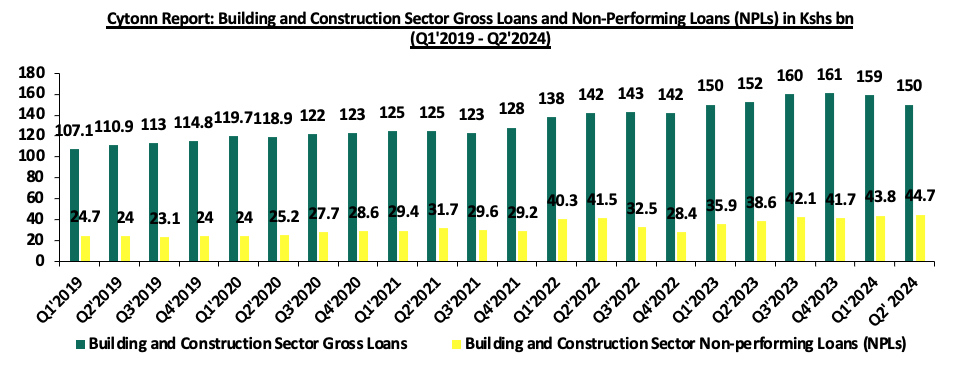
- Gross loans advanced to the building and construction sector recorded a y/y decrease of 1.3% to Kshs 150.0 bn in Q2’ 2024, from Kshs 152.0 bn in Q2’2023. On a q/q basis, the performance represented a 5.7% decline to Kshs 150.0 bn in Q2’2024 from Kshs 159.0 bn recorded in Q1’2024. This can be attributable to a tightening of the monetary policies whereby the MPC decided to raise the CBR rate by 0.5% points to 13.0% from 12.5% in February 2024. Additionally, the building and construction significantly reduced during the period under review due to heavy rains experienced in the country,
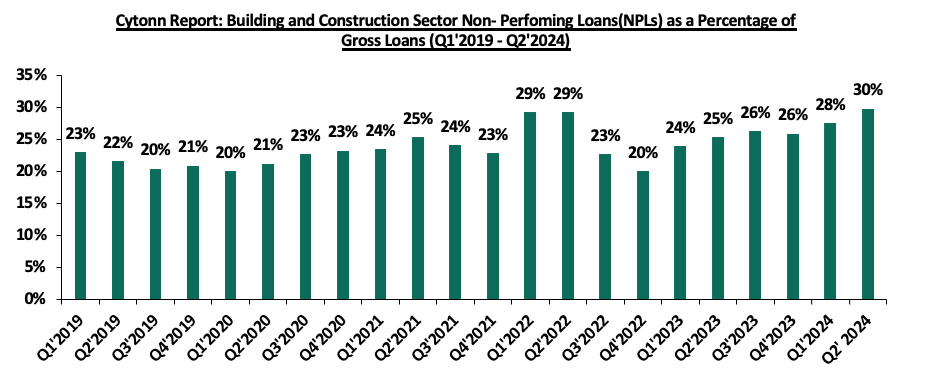
- Gross NPLs in the building and construction sector increased by 15.8% on a y/y basis to Kshs 44.7 bn in Q2’ 2024 from Kshs 38.6 bn in Q2’2023 on the back of operational challenges such as project delays. These challenges were further propelled by geo-political challenges, including the Russia-Ukrainian war disrupting the supply chain of building materials and fuel which impacted the ability of businesses in the building and construction sector. Additionally, it can be attributed to delayed payment from completed projects. The graph below shows Gross Loans advanced to the Building and Construction sector against Non-Performing Loans in the sector from Q1’2019 to Q2’2024;
Source: Central Bank of Kenya (CBK)
The graph below shows Non-performing Loans (NLPs) as a percentage of the gross loans advanced to the Building and Construction sector;
Source: Central Bank of Kenya (CBK)
During the month of October, the following industry reports were also released and the key take-outs were as follows;
|
Cytonn Report: Notable Industry Reports During the Month of October 2024 |
|||
|
# |
Theme |
Report |
Key Take-outs |
|
1 |
Hospitality Sector, Real Estate, Building and construction Sector |
Q2’2024 GDP Report by the Kenya National Bureau of Statistics (KNBS) |
· The Kenya National Bureau of Statistics (KNBS) Q2’2024 GDP Report highlighted that the Real Estate sector posted steady growth of 6.0% in Q2’2024, which is 2.1% points slower than the 8.1% growth registered in Q2’2023. · The construction sector contracted by 2.7% in Q2’2024, which is 5.4% points slower than the 2.7% growth in Q2 2023. On a quarter-on-quarter basis, this performance represented a 2.8%-point decrease from the 0.1% growth recorded in Q1’2024. · The accommodation and restaurant services grew by 26.6% during Q2’2024, representing a 16.2%-points y/y decline from the 42.8% growth recorded in Q2’2023. On a q/q basis, this performance represented a 1.4%-point decrease from the 28.0% growth recorded in Q1’2024. · For more information, please see our Cytonn Weekly #41/2024 |
|
2 |
Residential sector |
Q3’2024 House Price Index Report, focusing on the residential Real Estate sector's performance in the Nairobi Metropolitan Area (NMA) by Hass Consult. |
· The average selling prices for all properties posted a 0.7% increase on a quarter-on-quarter (q/q) basis in Q3’2024, an improvement from a 1.1% decrease in Q3’2023. On a year-on-year (y/y) basis, property prices showed an 8.7% increase, contrasting with a 3.7% decrease witnessed in Q3’2023. · The average asking rents of housing units in the NMA during the period under review decreased slightly by 0.6% on a q/q basis, a reversal from the 0.4% increase recorded in Q3’2023. On a y/y basis, the average asking rent increased by 2.2% compared to the 1.5% decline recorded in Q3’2023. · Apartments registered the highest y/y increase in asking rents of 5.5% in Q3’2024, a decrease from 5.9% increase in Q3’2023. In addition, semi-detached and detached units witnessed increases of 1.1% and 0.9% in asking rents respectively, a major turnaround from the 5.2% and 3.6% declines recorded in Q3’2023 respectively. · In the Nairobi Suburbs properties, Ridgeways was the best-performing region registering a y/y capital appreciation of 13.5% while in the Nairobi Suburbs apartments, Kileleshwa was the best-performing region recording a y/y capital appreciation of 7.6%. · In the satellite towns, properties in Juja posted the highest year-on-year price appreciation, coming at 15.6% while Satellite towns’ apartments, Syokimau recorded the highest y/y price appreciation of 11.4%. · For more information, please see our Cytonn weekly #43/2024 |
|
3
|
Land Sector |
Hass Consult a Land Price Index Q3’2024 Report which highlighted the performance of the Real Estate land sector in the Nairobi Metropolitan Area (NMA)) |
· The average q/q selling prices for land in the Nairobi suburbs grew by 1.6%, compared to a 0.4% increase recorded in Q3’2023. On a y/y basis, the performance represented an 8.2%-points increase, compared to the 0.8% increase recorded in Q3’2023. Consequently, q/q and y/y land prices in satellite towns of Nairobi increased by 3.0% and 12.6% respectively, compared to the 2.7% and 6.4% growth recorded in Q3’2023. · Spring Valley was the best-performing node in the Nairobi suburbs with a y/y price appreciation of 13.5% while for satellite towns, Mlolongo was the best-performing node with a y/y capital appreciation of 18.5%, followed by Syokimau which recorded a y/y capital appreciation of 18.1%. · For more information, please see our Cytonn Weekly #43/2024. |
Source: Kenya National Bureau of Statistics (KNBS)
- Residential Sector
During the week, Shelter Afrique Development Bank (ShafDB) and the regional stock exchange serving the West African Economic and Monetary Union (WAEMU) region, Bourse Régionale des Valeurs Mobilières (BRVM), announced the signing of a partnership aimed at addressing Africa’s housing deficit, by establishing a framework to mobilize financial resources through innovative instruments such as green, sustainability-linked, and social bonds, as well as Real Estate Investment Trusts (REITs). As part of the partnership, ShafDB and BRVM plan to create a strategy for issuing debt securities on BRVM’s financial market and to explore innovative bonds that support affordable housing, including gender-focused, Islamic, and diaspora bonds. The collaboration will also facilitate knowledge sharing, technical support, and joint research to strengthen their shared objectives.
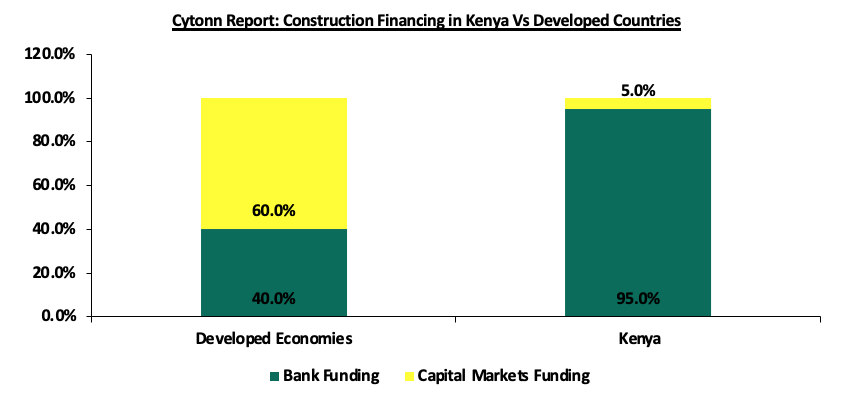
We expect that this collaboration will bring multiple benefits across Africa's housing sector. By mobilizing diverse funding sources, it should expand affordable housing options, reduce the housing deficit, and stimulate economic growth in local communities. With increased access to capital, African developers will likely have more opportunities to scale up housing projects that meet sustainability standards. The funding from ShafDB will come as a welcome boost for Kenyan developers, providing a crucial alternative to the limited financing options currently dominated by local banks, which provide nearly 95.0% of construction financing compared to the 40.0% typically seen in developed countries.
Source: Cytonn Report
We also expect continued vibrant performance in the residential sector within the country sustained by; i)ongoing residential developments under the Affordable Housing Agenda, aiming to reduce the housing deficit in the country currently estimated at 80.0%, ii) increased investment from local and international investors in the housing sector, iii) favorable demographics in the country, shown by high population and urbanization rates of 3.7% p.a and 2.0% p.a, respectively, leading to higher demand for housing units. However, challenges such as rising construction costs, strain on infrastructure development, and limited access to financing will continue to restrict the optimal performance of the residential sector.
- Real Estate Investments Trusts (REITs)
During the month, Student accommodation developer Acorn Holdings announced that it has fully redeemed its Kshs 5.7 bn green bond before its scheduled maturity on November 8, 2024. The firm announced that it had paid the balance of Kshs 2.7 bn from the paper, alongside the accrued interest, on its five-year medium-term note issued in November 2019. For more information, please see our Cytonn Weekly #43/2024.
On the Unquoted Securities Platform, Acorn D-REIT and I-REIT traded at Kshs 25.4 and Kshs 22.2 per unit, respectively, as per the last updated data on 25th October 2024. The performance represented a 27.0% and 11.0% gain for the D-REIT and I-REIT, respectively, from the Kshs 20.0 inception price. The volumes traded for the D-REIT and I-REIT came in at Kshs 12.3 mn and Kshs 31.6 mn shares, respectively, with a turnover of Kshs 311.5 mn and Kshs 702.7 mn, respectively, since inception in February 2021. Additionally, ILAM Fahari I-REIT traded at Kshs 11.0 per share as of 25th October, 2024, representing a 45.0% loss from the Kshs 20.0 inception price. The volume traded to date came in at 138,600 for the I-REIT, with a turnover of Kshs 1.5 mn since inception in November 2015.
REITs offer various benefits, such as tax exemptions, diversified portfolios, and stable long-term profits. However, the ongoing decline in the performance of Kenyan REITs and the restructuring of their business portfolios are hindering significant previous investments. Additional general challenges include: i) insufficient understanding of the investment instrument among investors, ii) lengthy approval processes for REIT creation, iii) high minimum capital requirements of Kshs 100.0 mn for trustees, and iv) minimum investment amounts set at Kshs 5.0 mn for the Investment REITs, all of which continue to limit the performance of the Kenyan REITs market.
We expect the performance of Kenya’s Real Estate sector to remain resilient supported by several factors: i) heightened activities from both private and government sectors, ii) an expanding population driving the need for housing, iii) government efforts under the Affordable Housing Program and the incentives advanced to developers aligned with the program, iv) the initiation and completion of major infrastructure projects, opening up areas for development. However, challenges such as rising construction costs, an oversupply in select Real Estate classes, strain on infrastructure development, and high capital demands in REIT sector will continue to impede the real estate sector’s optimal performance by restricting developments and investments.
Disclaimer: The views expressed in this publication are those of the writers where particulars are not warranted. This publication, which is in compliance with Section 2 of the Capital Markets Authority Act Cap 485A, is meant for general information only and is not a warranty, representation, advice, or solicitation of any nature. Readers are advised in all circumstances to seek the advice of a registered investment advisor.

