Cytonn H1’2024 Markets Review
By Research Team, Jun 30, 2024
Executive Summary
Global Markets Review
According to the World Bank’s June 2024 Global Economic Prospects, the global economy is projected to grow at a rate of 2.6% in 2024, similar to the estimated growth of 2.6% recorded in 2023. The latest projection is 0.6% points lower than the IMF’s projection of 3.2% growth, with the downward revision being on the back of the continued tightening of monetary policies by the Central Banks around the world aimed at curbing the elevated inflationary pressures. Notably, advanced economies are expected to record a 1.5% growth in 2024, remaining unchanged from the 1.5% expansion recorded in 2023. However, emerging markets and developing economies are projected to expand by 4.0% in 2024, marginally downwards from an estimated growth of 4.2% in 2023;
Sub-Saharan Africa Regional Review
According to the World Bank, the Sub-Saharan economy is projected to grow at a moderate rate of 3.4% in 2024, which is 0.8% higher than the 2.6% growth estimate recorded in 2023. The expected recovery is primarily driven by private consumption growth as declining inflation boosts the purchasing power of household incomes. Nevertheless, the risk of debt distress remains high with more than half of countries facing unsustainable debt burdens as the region’s public debt to GDP ratio is expected to remain high at 57.0% in 2024, albeit a decline from 60.0% in 2023. The public debt is expected to remain high due to increased debt servicing costs as a result of continued currency depreciation and increased interest rates in developed economies. Additionally, many countries are providing subsidies in order to mitigate inflationary pressures, which could worsen public finance, increase public debt, and weigh down on debt sustainability;
Kenya Macroeconomic Review
According to the Kenya National Bureau of Statistics (KNBS) 2024 Economic Survey, the Kenyan economy recorded a 5.6% expansion in FY’2023, faster than the 4.9% growth recorded in FY’2022. The main contributor to Kenyan GDP remains to be the Agriculture, Fishing and Forestry sector which grew by 6.5% in FY’2023 compared to a contraction of 1.5% in FY’2022. All sectors in FY’2023, except Mining and Quarrying, recorded positive growths, with varying magnitudes across activities. Most sectors recorded improved growth compared to FY’2022, with Agriculture, Forestry and Fishing, Accommodation and Food Services, and Real Estate Sectors recording the highest growth improvements of 7.9% points, 6.8% points, and 2.8% points, respectively. The average inflation rate for the first half of 2024 came in at 5.6%, lower than the 8.5% recorded in H1’2023, mainly as a result of reduced food and fuel prices. As a result, the business environment improved in H1’2024, with the average Purchasing Managers Index (PMI) coming in at 50.5 in the first five months of 2024, up from the 48.9 recorded in the same period in 2023, as consumers increased their spending;
Fixed Income
During H1’2024, T-bills were oversubscribed, with the overall subscription rate coming in at 132.6%, up from 121.7% in H1’2023. Investors’ preference for the 91-day paper persisted as they sought to avoid duration risk, with the paper receiving bids worth Kshs 420.6 bn against the offered Kshs 104.0 bn, translating to an oversubscription rate of 404.4%, albeit lower than the oversubscription rate of 481.8% recorded in H1’2023. Overall subscription rates for the 364-day and 182-day papers came in at 80.7% and 75.7%, higher than the 37.9% and 61.3%, respectively, recorded in H1’2023. The average yields on the 364-day, 182-day, and 91-day papers increased by 5.7% points, 6.1% points, and 6.1% points to 16.7%, 16.6%, and 16.2% in H1’2024, respectively, from 11.0%, 10.5%, and 10.2%, respectively, in H1’2023. The upward trajectory in yields is mainly on the back of investors attaching higher risks amid increased credit risk in the country, hence the need to demand higher returns to cushion against the possible loss, and, the government’s desperate need to keep borrowing in the domestic market. The acceptance rate during the period came in at 92.3%, higher than the 91.6% recorded in H1’2023, with the government accepting a total of Kshs 763.5 bn out of the Kshs 827.3 bn worth of bids received;
During the week, T-bills remained undersubscribed for the third consecutive week, with the overall undersubscription rate coming in at 32.0%, lower than the undersubscription rate of 60.0% recorded the previous week. Investors’ preference for the shorter 91-day paper persisted, with the paper receiving bids worth Kshs 4.4 bn against the offered Kshs 4.0 bn, translating to an oversubscription rate of 109.0%, albeit lower than the oversubscription rate of 148.0% recorded the previous week. The subscription rates for the 182-day and 364-day papers decreased to 14.9% and 18.3% respectively from the 39.3% and 45.5% respectively recorded the previous week. The government accepted a total of Kshs 6.1 bn worth of bids out of Kshs 7.7 bn bids received, translating to an acceptance rate of 78.7%. The yields on the government papers were on an upward trajectory, with the yields on the 364-day, 182-day, and 91-day papers increasing by 3.7 bps, 2.6 bps, and 0.6 bps to 16.79%, 16.76%, and 15.98% respectively from 16.75%, 16.74% and 15.97% respectively recorded the previous week;
In the primary bond market, the government is seeking to raise a total of Kshs 50.0 bn for budgetary support in the month of July by re-opening two bonds and issuing a tap sale. The two fixed coupon treasury bonds issued concurrently include the re-opened FXD1/2024/10 and FXD1/2008/20, with a tenor to maturity of 9.7 years and 3.9 years, respectively, and have their coupon rates set at 16.0% and 13.8% respectively. The bonds’ value dates will be 22nd July 2024, with maturity dates of 13th March 2034 and 5th June 2028 for FXD1/2024/10 and FXD1/2008/20 respectively; Given the bonds are trading at 15.0% and 17.7% for the FXD1/2024/10 and FXD1/2008/20 respectively in the secondary bond market, we expect the bidding range to come in at 15.25% - 16.55% and 17.55% - 17.75% respectively. Further, the government is seeking to raise Kshs 20.0 bn through the tap sale of the FXD1/2023/002 bond, with a tenor to maturity of 1.2 years, a coupon rate of 17.0% and a period of sale of Wednesday 26th June 2024 to Thursday 4th July 2024. The bids shall be priced at the average rate of accepted yield for the initial values which stood at 17.1%;
Equities
During Q2’2024, the equities market was on a downward trajectory, with NSE 20, NSE 25, NSE 10, and NASI declining by 5.5%, 3.8%, 3.3%, and 3.2%, respectively, taking the H1’2024 performance to gains of 22.6%, 19.8%, 19.0% and 9.8% for NSE 10, NSE 25, NASI, and NSE 20 respectively. The equities market performance during the quarter was driven by losses recorded by large caps such as DTB-K Group, Co-operative Bank, and BAT of 15.5%, 15.3%, and 14.7%, respectively. The losses were however mitigated by gains recorded by East African Breweries Limited (EABL), KCB Group, and ABSA Bank of 12.5%, 4.0%, and 0.4% respectively;
During the week, the equities market was on a downward trajectory, with NSE 20, NASI, NSE 10, and NSE 25 declining by 4.3%, 2.9%, 2.6%, and 2.2%, respectively, taking the YTD performance to gains of 22.6%, 19.8%, 19.0% and 9.8% for NSE 10, NSE 25, NASI, and NSE 20 respectively. The equities market performance was mainly driven by losses recorded by large-cap stocks such as KCB Group, Safaricom, and Equity Group of 8.5%, 4.7%, and 2.6%, respectively. The losses were however mitigated by gains recorded by East African Breweries Limited (EABL), NCBA Group, and Stanbic Bank of 2.8%, 0.5%, and 0.4% respectively;
Real Estate
In H1’2024, Kenya’s Real Estate sector recorded notable growth in terms of activity compared to a similar period in 2023, attributable to continued investments flowing into the sector. The NMA residential sector recorded a slight downturn in performance, with the average total returns coming in at 5.9%, a 0.2%-point decline from 6.1% recorded in H1’2023. The performance was primarily attributed to a decrease in the residential average y/y price appreciation which came in at 0.6% in H1’2024, 0.4%-points lower than the 1.0% appreciation recorded in H1’2023, mainly driven by reduced property transactions during the period under review. The retail sector recorded average rental yields of 7.9% in H1’2024, representing a 0.2% points y/y decline from 8.2% recorded in H1’2023. The average selling prices for land in the Nairobi Metropolitan Area (NMA) in H1’2024 recorded a capital appreciation of 3.9% to Kshs 132.7 mn, from Kshs 128.6 mn recorded in H1’2023;
Investment Updates:
- Weekly Rates:
- Cytonn Money Market Fund closed the week at a yield of 17.54% p.a. To invest, dial *809# or download the Cytonn App from Google Play store here or from the Appstore here;
- We continue to offer Wealth Management Training every Monday, from 10:00 am to 12:00 pm. The training aims to grow financial literacy among the general public. To register for any of our Wealth Management Trainings, click here;
- If interested in our Private Wealth Management Training for your employees or investment group, please get in touch with us through wmt@cytonn.com;
- Cytonn Insurance Agency acts as an intermediary for those looking to secure their assets and loved ones’ future through insurance namely; Motor, Medical, Life, Property, WIBA, Credit and Fire and Burglary insurance covers. For assistance, get in touch with us through insuranceagency@cytonn.com;
- Cytonn Asset Managers Limited (CAML) continues to offer pension products to meet the needs of both individual clients who want to save for their retirement during their working years and Institutional clients that want to contribute on behalf of their employees to help them build their retirement pot. To more about our pension schemes, kindly get in touch with us through pensions@cytonn.com;
Real Estate Updates:
- For more information on Cytonn’s real estate developments, email us at sales@cytonn.com;
- Phase 3 of The Alma is now ready for occupation and the show house is open daily. To join the waiting list to rent, please email properties@cytonn.com;
- For Third Party Real Estate Consultancy Services, email us at rdo@cytonn.com;
- For recent news about the group, see our news section here;
Hospitality Updates:
- We currently have promotions for Staycations. Visit cysuites.com/offers for details or email us at sales@cysuites.com;
Global Economic Growth:
According to the World Bank’s June 2024 Global Economic Prospects, the global economy is projected to grow at a rate of 2.6% in 2024, similar to the estimated growth of 2.6% recorded in 2023. The latest projection is 0.6% points lower than the IMF’s projection of 3.2% growth, with the downward revision being on the back of the continued tightening of monetary policies by the Central Banks around the world aimed at curbing the elevated inflationary pressures. Notably, advanced economies are expected to record a 1.5% growth in 2024, remaining unchanged from the 1.5% expansion recorded in 2023. However, emerging markets and developing economies are projected to expand by 4.0% in 2024, marginally downwards from an estimated growth of 4.2% in 2023.
The stabilization in global economic growth in 2024 as compared to 2023 is majorly attributable to;
- The recovery in global trade supported by a pickup in goods trade. Services-trade growth is expected to provide less of a tailwind this year, given that tourism has nearly recovered to prepandemic levels. However, the trade outlook remains lackluster compared to recent decades, partly reflecting a proliferation of trade-restrictive measures and elevated trade policy uncertainty, and,
- A decrease in inflation rates making progress toward central bank targets in advanced economies and Emerging Markets and Developing Economies (EMDEs), but at a slower pace than previously expected. Core inflation has remained stubbornly high in many economies, supported by rapid growth of services prices. As such, by the end of 2026, global inflation is expected to settle at an average rate of 2.8%, broadly consistent with central bank targets.
The global economy is expected to remain subdued in the short term, mainly as a result of persistent inflationary pressures as well as tight monetary policies, which are expected to curtail economic growth.
Global Commodities Market Performance:
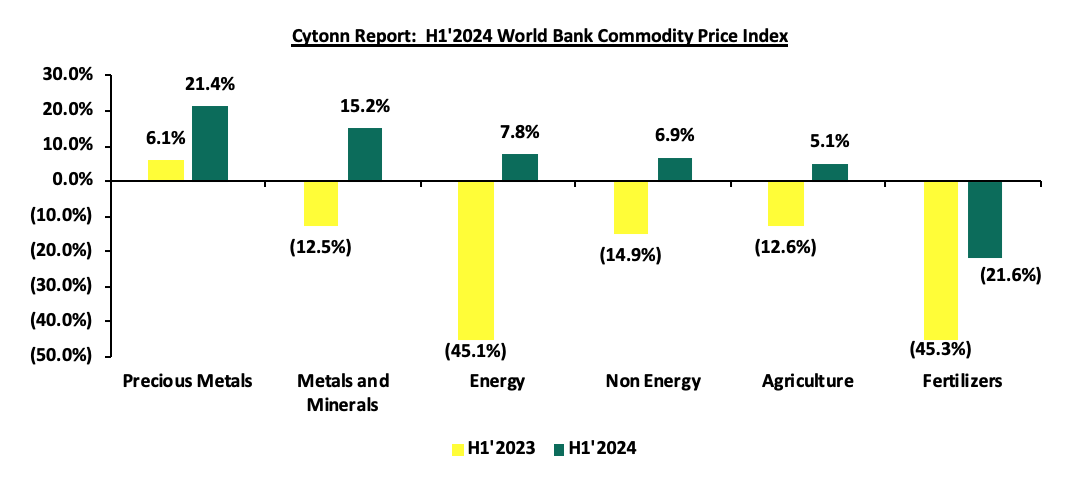
Global commodity prices registered mixed performance in H1’2024, with prices of fertilizers declining by 21.6%, which is an improvement compared to the 45.3% decrease recorded in H1’2023, mainly as a result of the stabilization in fertilizer trade volumes and improved availability of primary nutrients like nitrogen, phosphorus, and potassium. On the other hand, prices of precious metals, Metals and Minerals, Energy, Non-Energy and Agriculture increased by 21.4%, 15.2%, 7.8%, 6.9% and 5.1%, respectively, on the back of increased global demand coupled with easing supply chain constraints. Below is a summary performance of various commodities;
Source: World Bank
Global Equities Market Performance:
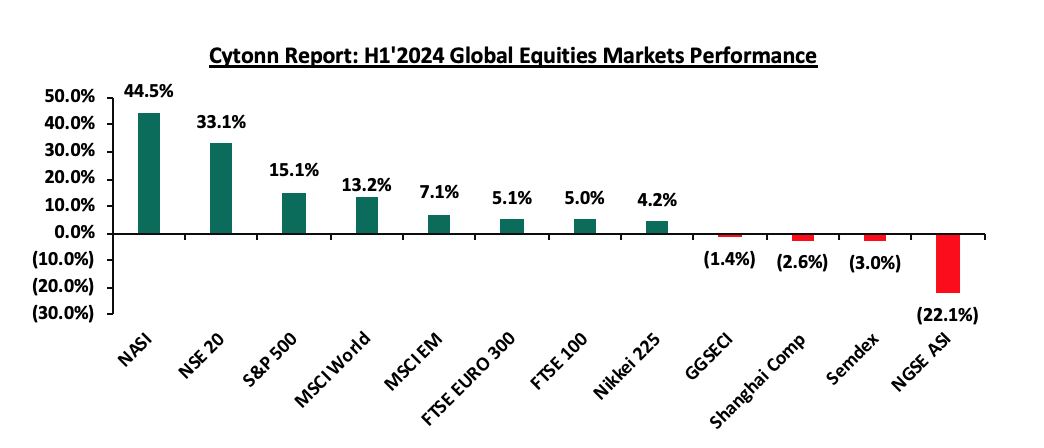
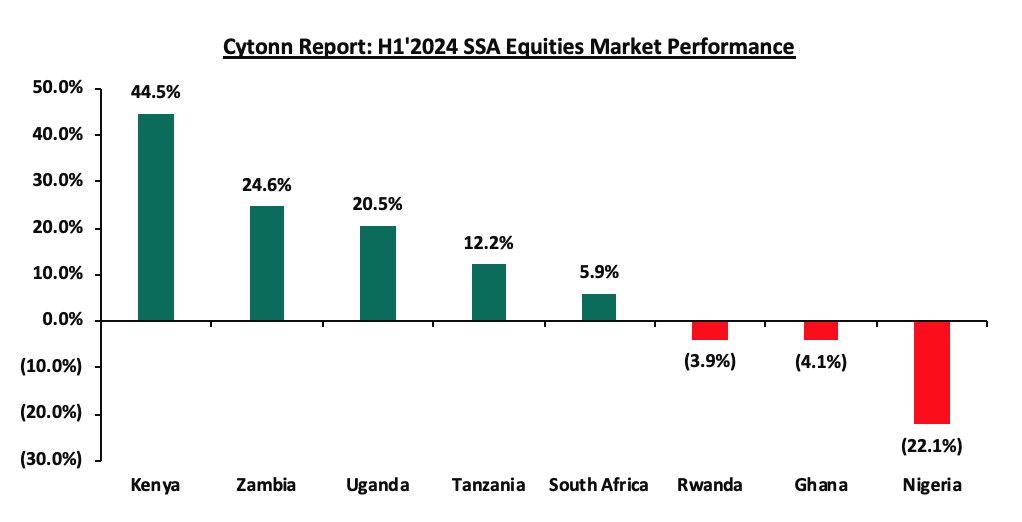
The global stock market recorded mixed performance in H1’2024, with most indices in the developed countries recording gains during the period, largely attributable to increased investor sentiments as a result of continued economic recovery following the full reopening of the economies coupled with investor preference for the stock markets in the developed countries. Notably, NASI recorded the largest gain at 44.5% in H1’2024 largely driven by gains in the large-cap stocks in the financial sector following improved earnings during the period in addition to the improved business environment as evidenced by the average Purchasing Managers Index (PMI) of 50.5 in the first five months of 2024 up from the 48.7 recorded in the same period last year. NGSE ASI was the largest decliner, recording losses of 22.1% with the performance being skewed by the weakened Nigerian Naira following a recent decision by the Central Bank of Nigeria to adopt a floating exchange rate regime. Below is a summary of the performance of key indices:
*Dollarized performance
According to the World Bank, the Sub-Saharan economy is projected to grow at a moderate rate of 3.4% in 2024, which is 0.8% higher than the 2.6% growth estimate recorded in 2023. The expected recovery is primarily driven by private consumption growth as declining inflation boosts the purchasing power of household incomes. Nevertheless, the risk of debt distress remains high with more than half of countries facing unsustainable debt burdens as the region’s public debt to GDP ratio is expected to remain high at 57.0% in 2024, albeit a decline from 60.0% in 2023. The public debt is expected to remain high due to increased debt servicing costs as a result of continued currency depreciation and increased interest rates in developed economies. Additionally, many countries are providing subsidies in order to mitigate inflationary pressures, which could worsen public finance, increase public debt, and weigh down on debt sustainability.
Currency Performance:
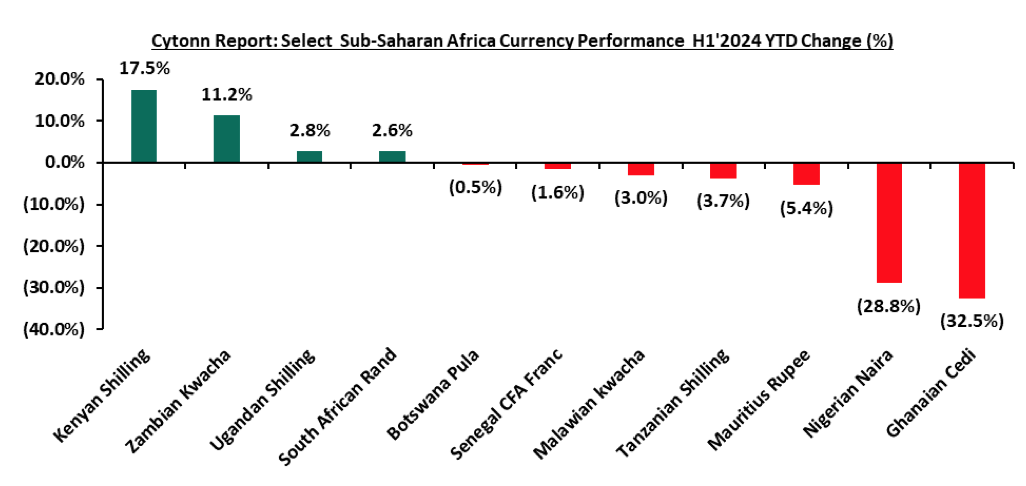
In H1’2024, most of the select Sub-Saharan currencies depreciated against the US Dollar, mainly attributable to the elevated inflationary pressures in the region, high debt servicing costs that continue to dwindle foreign exchange reserves, and monetary policy tightening by advanced economies. The high interest rates in developed countries have led to massive capital outflows as investors, both institutional and individual seek to take advantage of the higher returns offered in developed economies. Further, the elevated inflationary pressures in most economies in the region puts pressure on the value of local currencies due to expensive importation. Below is a table showing the performance of select African currencies against the US Dollar:
|
Cytonn Report: Select Sub Saharan Africa Currency Performance vs USD |
|||||
|
Currency |
Jun-23 |
Jan-24 |
Jun-24 |
2024 y/y change (%) |
YTD change (%) |
|
Ghanaian Cedi |
11.3 |
11.6 |
15.3 |
(35.1%) |
(32.5%) |
|
Malawian kwacha |
1043.0 |
1683.4 |
1734.0 |
(66.2%) |
(3.0%) |
|
Kenyan Shilling |
140.5 |
157.0 |
129.5 |
7.8% |
17.5% |
|
Botswana Pula |
13.4 |
13.5 |
13.6 |
(1.0%) |
(0.5%) |
|
Zambian Kwacha |
17.7 |
27.1 |
24.0 |
(35.6%) |
11.2% |
|
Nigerian Naira |
758.8 |
1191.9 |
1535.4 |
(102.4%) |
(28.8%) |
|
Senegal CFA Franc |
625.0 |
602.8 |
612.5 |
2.0% |
(1.6%) |
|
South African Rand |
18.8 |
18.7 |
18.2 |
3.4% |
2.6% |
|
Ugandan Shilling |
3665.0 |
3815.0 |
3710.1 |
(1.2%) |
2.8% |
|
Mauritius Rupee |
45.4 |
44.8 |
47.2 |
(4.0%) |
(5.4%) |
The chart below shows the year-to-date performance of different sub-Saharan African countries in H1’2024;
Source: Yahoo Finance
Key take outs from the above table and chart include:
- The Kenyan Shilling was the largest gainer against the USD Dollar, gaining by 17.5% year to date to close at Kshs 129.5 as at the end of June from the Kshs 157.0 recorded at the beginning of the year. The shilling was supported by the government’s Eurobond buyback in February, alleviating the debt risk on the country, increased dollar inflows into the country including the recent World Bank funding amounting USD 1.2 bn under the Development Policy Operations (DPO), partly channeled towards settling the last June 2024 Eurobond maturity payment. Notably, the Kenyan economy has continued to improve during the period under review with the Purchasing Managers Index (PMI) having crossed the 50.0 points threshold to 51.8 as of May 2024,
- The Ghanaian Cedi was the worst performing currency in H1’2024, depreciating by 32.5%, mainly as a result of the lower current account surplus due to increased import demand, a sharp decline in cocoa exports and energy sector payments, in addition to speculative activity and delays in external debt restructuring,
African Eurobonds:
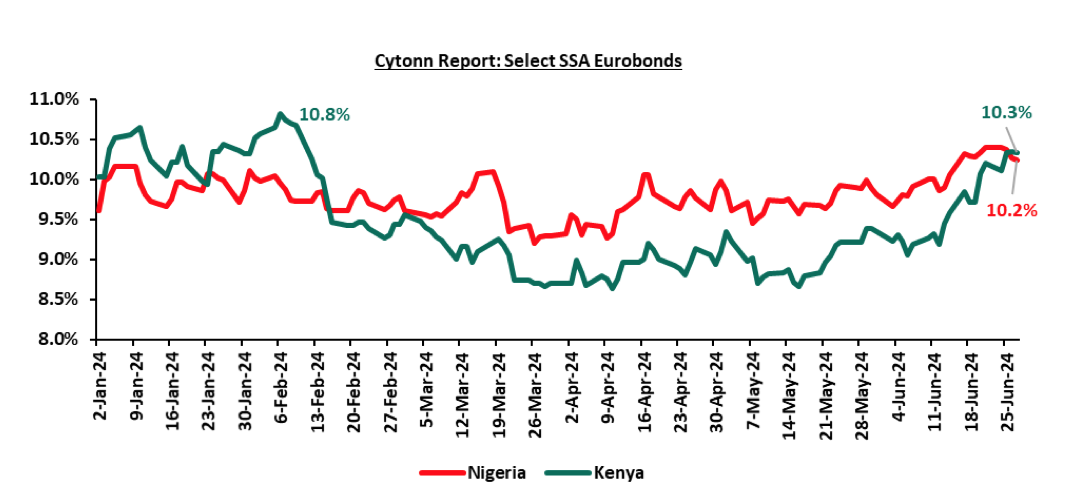
Africa’s appetite for foreign-denominated debt has increased in recent times with the latest issuers during the first half of 2024 being Ivory Coast, Benin, and Kenya raising a total of USD 2.6 bn, USD 0.8 bn, and USD 1.4 bn respectively. Notably, all the bonds were oversubscribed with the high support being driven by the yield hungry investors and also the outlook of positive recovery in the regional economies. It is good to note that there was a general decline in the yields of the various bonds from different countries due to general improvement in investor sentiment as the economy recovers and the easing inflationary pressures in the region. The yields of the Nigeria’s 10-year Eurobond maturing in 2031 increased marginally by 0.8% points to 10.2% as at the end of June 2024 from 9.5% recorded in December 2023. Similarly, the Yields of the Kenya’s 10-year Eurobond maturing in 2028 increased by 0.5% points to 10.3% as at the end of June 2024 from 9.8% in December 2023, partly attributable to improved investor confidence following the successful buy-back of the 2024 Eurobond maturity, increased IMF Credit funding and the strengthening of the Kenyan shilling against the dollar having gained by 17.5% on a year-to-date. Below is a graph showing the Eurobond secondary market performance of select 10-year Eurobonds issued by the respective countries:
Source: Debt Management Office Nigeria, CBK
Equities Market Performance:
Sub-Saharan Africa (SSA) stock markets recorded mixed performance in H1’2024, with Kenya’s stock market (NASI) being the best performing market gaining by 44.5% YTD driven by gains in the large-cap stocks in the financial sector following improved earnings during the period as well as the improved business conditions in the country as evidenced by the Purchasing Managers Index (PMI) which came in at 51.8 as of May 2024. Nigeria’s NGSEASI was the worst performing stock market, declining by 22.1% YTD, mainly attributable to increased capital flight with investors chasing higher returns from advanced economies following hiking of interest rates as well as deterioration in investor confidence in country on the back of macroeconomic uncertainties occasioned by the high inflation at 34.0% as of May 2024 and continued weakening of the Nigerian Naira which has depreciated by 28.8% on year-to-date basis in 2024. Below is a summary of the performance of key indices:
|
Cytonn Report: SSA Equities Market Performance H1’2024 (Dollarized*) |
||||||
|
Country |
Index |
Jun-23 |
Jan-24 |
Jun-24 |
Last 12 months |
YTD Change |
|
Kenya |
NASI |
0.8 |
0.6 |
0.8 |
10.5% |
44.5% |
|
Zambia |
LASILZ |
474.4 |
455.5 |
567.7 |
19.7% |
24.6% |
|
Uganda |
USEASI |
0.3 |
0.2 |
0.3 |
0.1% |
20.5% |
|
Tanzania |
DARSDEI |
0.7 |
0.7 |
0.8 |
2.3% |
12.2% |
|
South Africa |
JALSH |
4,038.4 |
4,137.9 |
4,383.5 |
8.5% |
5.9% |
|
Rwanda |
RSEASI |
0.1 |
0.1 |
0.1 |
(9.7%) |
(3.9%) |
|
Ghana |
GSECI |
255.7 |
263.0 |
252.3 |
(1.4%) |
(4.1%) |
|
Nigeria |
NGEASI |
80.4 |
84.9 |
66.1 |
(17.7%) |
(22.1%) |
|
*The index values are dollarized for ease of comparison |
||||||
Source: Cytonn Research, Kwayisi, Yahoo Finance
The chart below shows the YTD Performance of the sub-Saharan Equities Market;
Dollarized performance
GDP growth in Sub-Saharan Africa region is expected to slow down, in line with the rest of the global economy. Additionally, public debt continues to be a major headwind, with high debt levels experienced in the region on the back of continued weakening of local currencies, which will make debt servicing costlier, making the region less attractive to foreign capital.
According to the Kenya National Bureau of Statistics (KNBS) 2024 Economic Survey, the Kenyan economy recorded a 5.6% expansion in FY’2023, faster than the 4.9% growth recorded in FY’2022. The main contributor to Kenyan GDP remains to be the Agriculture, Fishing and Forestry sector which grew by 6.5% in FY’2023 compared to a contraction of 1.5% in FY’2022. All sectors in FY’2023, except Mining and Quarrying, recorded positive growths, with varying magnitudes across activities. Most sectors recorded improved growth compared to FY’2022, with Agriculture, Forestry and Fishing, Accommodation and Food Services, and Real Estate Sectors recording the highest growth improvements of 7.9% points, 6.8% points, and 2.8% points, respectively. Notably, the improved growth in the economy highlighted the economy’s resilience following multiple shocks such as supply chain constraints, soaring global fuel prices, elevated inflationary pressures and currency depreciation. The Kenyan Economy is projected to grow at an average of 5.3% in 2024 according to various organizations as shown below:
|
Cytonn Report: Kenya 2024 Growth Projections |
||
|
No. |
Organization |
2024 GDP Projections |
|
1 |
International Monetary Fund |
5.3% |
|
2 |
National Treasury |
5.5% |
|
3 |
World Bank |
5.2% |
|
4 |
Fitch Solutions |
5.2% |
|
5 |
Cytonn Investments Management PLC |
5.4% |
|
Average |
5.3% |
|
Source: Cytonn Research
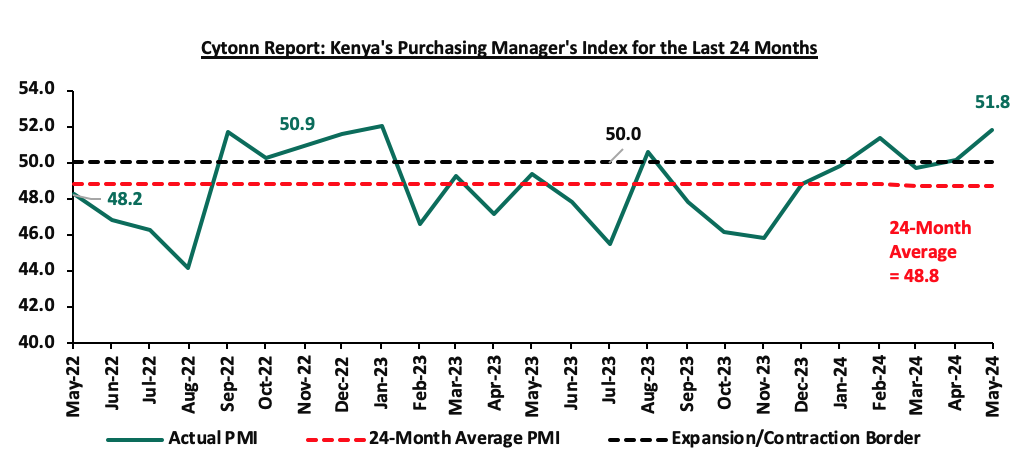
Key to note, Kenya’s general business environment improved in the first half of 2024, with the average Purchasing Manager’s Index for the first five months of the year coming at 50.5, compared to 48.9 recorded in a similar period in 2023. The improvement was mainly on the back of the eased inflationary pressures experienced in the country, which have seen consumers increase their spending, coupled with aggressive appreciation of the Kenyan shilling which has contributed significantly to the reduced cost of inputs and production by most businesses. The chart below summarizes the evolution of PMI over the last 24 months. (A reading above 50.0 signals an improvement in business conditions, while readings below 50.0 indicate a deterioration):
Inflation:
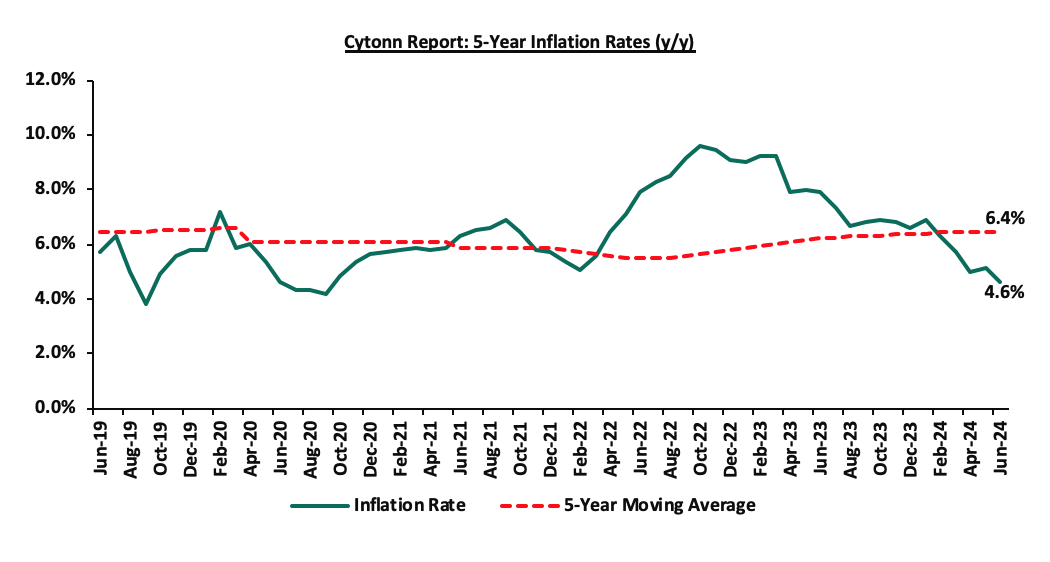
The average inflation rate decreased to 5.6% in H1’2024, compared to 8.5% in H1’2023, attributable to an appreciating Shilling, leading to reduced fuel prices. Notably, fuel prices decreased by 2.9%, 3.7% and 6.0% in June 2024 to Kshs 189.8, Kshs 173.1 and Kshs 163.1, from Kshs 195.5, Kshs 179.7, and Kshs 173.4 per liter in June 2023 for Super petrol, Diesel, and Kerosene, respectively. Inflation for the month of June 2024 eased to 4.6%, from 5.1% recorded in May 2024, mainly driven by a 0.2% decrease in the transport index. Below is a chart showing the inflation trend for the last five years:
For the last 12 months, Kenya’s inflation has persistently remained within the Central Bank of Kenya (CBK) target range of 2.5% - 7.5%, owing to a stronger Shilling, reduced fuel and electricity prices, and efforts by the Monetary Policy Committee (MPC) to contain the rise by raising the Central Bank Rate (CBR) by cumulative of 250 bps in June to 13.0% in June 2024 from the 10.5% CBR rate that was set in June 2023. Going forward, we expect the inflationary pressures to remain within the CBK’s preferred target, mainly on the back of stronger Shilling, reduced fuel and electricity prices. However, the high VAT on petroleum products of 16.0% is meant to hold the fuel prices elevated in the country.
June 2024 Inflation
The y/y inflation in June 2024 decreased by 0.5% points to 4.6%, from the 5.1% recorded in May 2024. This was within our expectation of a decline, but slightly below our projected range of 4.7% to 5.1%. The headline inflation in June 2024 was majorly driven by increase in prices of commodities in the following categories; transport, food and non-alcoholic beverages, and housing, water, electricity, gas and other fuels by 7.7%, 5.6% and 3.1%, respectively. The table below shows a summary of both the year on year and month on month commodity indices performance:
|
Cytonn Report: Major Inflation Changes – June 2024 |
|||
|
Broad Commodity Group |
Price change m/m (June-2024/May-2024) |
Price change y/y (June-2024/June-2023) |
Reason |
|
Transport |
(0.2%) |
7.7% |
The m/m decrease recorded in the transport Index was mainly attributable to the decline in the prices of diesel and petrol by 3.4% and 1.6% per litre respectively. |
|
Food and non-alcoholic beverages |
0.7% |
5.6% |
The m/m increase was mainly driven by the increase in prices of commodities such as cabbages, spinach and Sukuma wikiby 14.8%, 11.3%, and 10.7%, respectively. However, the increase was weighed down by decrease in prices of oranges, sugar and maize flour-sifted by 2.5%, 2.4%, and 2.0%, respectively |
|
Housing, water, electricity, gas and other fuels |
0.4% |
3.1% |
The m/m performance was mainly driven by the increase in prices of Electricity of 50kWh and 200kWh by 3.4% and 2.9% respectively. However, the price of gas/LPG and kerosene dropped by 0.2% and 3.4% respectively. |
|
Overall Inflation |
0.4% |
4.6% |
The m/m decrease was mainly attributable to the 0.2% decrease in transport. |
Notably, June’s overall headline inflation was back on the decline after increasing marginally in May 2024. This resumes the declining trend seen in the three consecutive months up to April 2024. Furthermore, it has remained within the Central Bank of Kenya (CBK) target range of 2.5% to 7.5% for the twelfth consecutive month. The decrease in headline inflation in June 2024 comes amid the decline in the prices for Super Petrol, Diesel and Kerosene which decreased by Kshs 3.0, Kshs 6.1 and Kshs 5.7 each respectively, and will retail at Kshs 189.8, Kshs. 173.1 and Kshs. 163.1 per litre respectively, for the period between 15th June 2024 to 14th July 2024. The chart below shows the inflation rates for the past 5 years:
Going forward, we expect inflation to remain within the CBK’s preferred range of 2.5%-7.5%, mainly on the back of a strengthened currency, tight monetary policy and reduced fuel prices. The risk, however, lies in the fuel prices which despite their decline in June 2024, still remain elevated compared to historical levels.. Key to note is that the Monetary Policy Committee maintained the Central Bank Rate at 13.0% in its June 2024 meeting, with the aim of anchoring the inflation rates further. In our view, the rate will be pegged on whether the shilling will sustain its appreciation against the dollar, resulting in a decline in the import bill and costs passed to consumers through hiked consumer prices. Additionally, favourable weather conditions may also contribute to stabilizing food prices, further supporting lower inflation rates.
The Kenyan Shilling:
The Kenyan Shilling appreciated against the US Dollar by 17.2% in H1’2024, to close at Kshs 129.5, from Kshs 156.5 as at the end of FY’2023, mainly attributable to the February buyback of the June maturity Eurobond, which alleviated the credit risk on the country, coupled with the infrastructure bond issue which attracted foreign investors as well as panic selling of dollars by investors which increased dollar supply in the market. During the week, the Kenya Shilling depreciated against the US Dollar by 0.8% to close at 129.5, from 128.6 the previous week, partly attributable to the last maturity payment of the June Eurobond.
We expect the shilling to be supported by:
- Diaspora remittances standing at a cumulative USD 4,509.8 mn in the 12 months to May 2024, 12.8% higher than the USD 3,997.3 mn recorded over the same period in 2023, which has continued to cushion the shilling against further depreciation. In the May 2024 diaspora remittances figures, North America remained the largest source of remittances to Kenya accounting for 56.0% in the period, and,
- High Forex reserves currently at USD 7.8 bn (equivalent to 4.1-months of import cover), which is above the statutory requirement of maintaining at least 4.0-months of import cover, albeit lower than EAC region’s convergence criteria of 4.5-months of import cover. Notably, the reserves were boosted by the USD 1.2 bn inflow under Development Policy Operations (DPO) from the World Bank in the previous week, with part of it being used to settle the last payment of the June maturity Eurobond, and,
- The tourism inflow receipts which came in at USD 352.5 bn in 2023, a 31.5% increase from USD 268.1 bn inflow receipts recorded in 2022, and owing to tourist arrivals that improved by 27.2% to 2.1 mn in the 12 months to March 2024, from 1.6 mn recorded during a similar period in 2023.
The shilling is however expected to remain under pressure in 2024 as a result of:
- An ever-present current account deficit which came at 4.0% of GDP in FY’2023 from 5.1% recorded in FY’2022,
- The need for government debt servicing, continues to put pressure on forex reserves given that 67.3% of Kenya’s external debt was US Dollar denominated as of December 2023, and,
Monetary Policy:
The Monetary Policy Committee (MPC) met three times in H1’2024 and for the first time since October 2012, the Central Bank Rate was set at 13.0% in the first sitting in February 2024, owing to the sustained depreciation of the Kenyan Shilling and elevated inflationary pressures in the country on the back of high fuel and commodity prices. Additionally, the MPC has retained the CBR at 13.0% during its last two meetings despite a gaining Shilling, eased inflation, and an improved global outlook for growth, owing to continued stickiness in inflation in advanced economies, and persistent geopolitical tensions. Below are some of the Key highlights from the June meeting:
- The overall inflation tightened marginally to 5.1% in May 2024, from 5.0% in April 2023, positioning it at the mid-point of the preferred CBK range of 2.5%-7.5%, mainly driven by the high fuel prices, despite the decrease in fuel inflation. Fuel inflation decreased to 7.8% in May 2024 from 8.3% in April 2024, largely attributable to a downward adjustment in pump prices and lower electricity tariffs. The food inflation increased to 6.2% in May 2024 from 5.6% in April 2024, attributable largely to higher prices of a few vegetables i.e. onions, kales, tomatoes and Irish potatoes, following a decline in supply due to the recent heavy rains and floods in some parts of the country. The increase was however mitigated by a decrease in the prices of a few non-vegetable food items, particularly maize, sugar, and wheat flour. The non-food non-fuel inflation slightly decreased to 3.4% in May 2024 from 3.6% in April 2024. We expect the overall inflation to remain within the CBK’s preferred range of 2.5%-7.5%, mainly on the back of a strengthened currency, tight monetary policy, reduced fuel prices and reduced electricity prices,
- The recently released Economic Survey 2024 for FY’2023 showed continued strong performance of the Kenyan economy, with real GDP growing by 5.6%, from a growth of 4.9% in 2022. This was attributable to a strong rebound in the agriculture sector due to favorable weather conditions that boosted crop and livestock production and a resilient performance of the services sector. Leading indicators of economic activity pointed to continued strong performance in the first quarter of 2024. Despite the recent flooding in some parts of the country, the economy is expected to continue to strengthen in 2024, supported by the resilient services sector, the rebound in agriculture, and the implementation of measures to boost economic activity in priority sectors by the Government.
- Goods exports increased by 2.9% in the 12 months to April 2024, compared to a similar period in 2023, reflecting a rise in exports of agricultural commodities and re-exports. Receipts from tea and fruits and vegetables exports increased by 5.6% and 10.5% respectively, while re-exports grew by 38.1% in the period. Notably, exports increased 15.2% in the first four months of 2024 compared to the same period in 2023. Imports declined by 7.7% in the 12 months to April 2024 compared to a similar period in 2023, mainly reflecting lower imports across all categories except machinery and transport equipment. However, imports increased by 2.2% in the first four months of 2024 compared to the same period in 2023. Tourist arrivals improved by 27.2% in the 12 months to March 2024, compared to a similar period in 2023. Remittances totaled USD 4,457 mn in the 12 months to April 2024 and were 11.9% higher compared to USD 3,985 mn in a similar period in 2023. The current account deficit is estimated at 4.1% of GDP in the 12 months to April 2024, down from 4.8% of GDP in a similar period in 2023, and is projected at 4.0% of GDP in 2024, reflecting improvement in exports of agricultural products, sustained remittances, recovery in imports supported by stable exchange rate and effects of regional trade integration initiatives.
- The CBK foreign exchange reserves, which currently stand at USD 6,979 mn representing 3.6 months of import cover, continue to provide adequate cover and a buffer against any short-term shocks in the foreign exchange market,
- The banking sector remains stable and resilient, with strong liquidity and capital adequacy ratios. The ratio of gross non-performing loans (NPLs) to gross loans increased to 16.1% in April 2024 compared to 15.5% in February 2024. Increases in NPLs were noted in the agriculture, real estate, tourism, restaurant and hotels, trade, and building and construction sectors. Banks have continued to make adequate provisions for the NPLs,
- The CEOs Survey and Market Perceptions Survey conducted ahead of the MPC meeting revealed a positive outlook on business activity for the next year. Participants of the survey expressed concerns about fiscal policies, high interest rates, and the impact of geopolitical uncertainties on the economy. Despite this, they remained optimistic that economic growth would remain resilient and improve in 2024, supported by increased agricultural production, a resilient service sector and stable macroeconomic activity,
- The Survey of the Agriculture Sector revealed an expectation by respondents that the prices of key food items were expected to remain unchanged or increase in the next three months due to an expected rise in food supply due to favorable weather conditions, stable exchange rate, and lower fuel prices,
- Global growth is expected to increase by 0.1% points to 3.2% in 2024 from 3.1% in 2023, attributable to higher-than-expected growth in the United States and high growth in several large and emerging markets, particularly India. Additionally, headline inflation rates have moderated, though some persistence remains in advanced economies. Food inflation has continued to decline due to an improved supply of key food items, particularly sugar and cereals. International oil prices have moderated because of a reduced risk premium from the Middle East conflict and increased supply from non-OPEC+ oil producers.
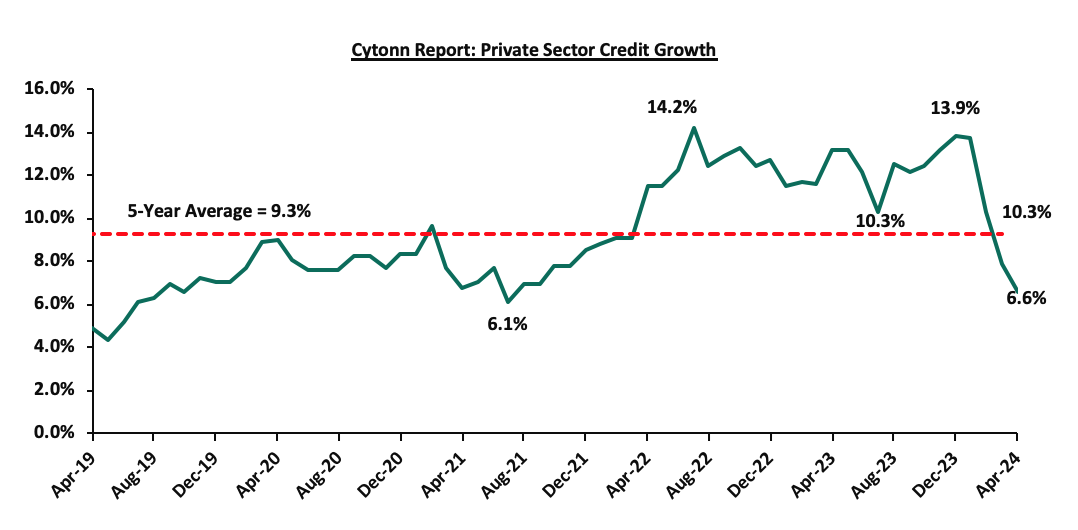
- Growth in private sector credit decreased to 6.6% in April 2024 from 7.9% in March 2024, mainly attributed to exchange rate valuation effects on foreign currency-denominated loans due to the appreciation of the Shilling. In April, local currency loans increased by 14.3%, while foreign currency loans, which make up around 26.0% of total loans, decreased by 14.2%. The chart below shows the movement of the private sector credit growth over the last five years:
- The Committee noted the ongoing implementation of the FY2023/24 Government Budget, as well as the proposed FY2024/25 Budget which are expected to continue to reinforce fiscal consolidation.
- The Committee observed that the new monetary policy implementation framework, adopted on August 9, 2023, has led to better functioning of the interbank market, reduced interest rate spreads with decreased market segmentation and improved monetary policy transmission. To further enhance the effectiveness of this framework, the MPC considered and approved a recommendation to narrow the width of the interest rate corridor around the CBR from the current 250 basis points (bps) to 150 bps. Additionally, the MPC approved a recommendation to adjust the applicable interest rate on the Discount Window from the current 400 bps above the CBR to 300 bps above the CBR.
The MPC noted that its previous measures have successfully reduced overall inflation to the mid-point of the target range of 2.5% - 7.5%, stabilized the exchange rate, and anchored inflationary expectations. The Committee also observed that NFNF inflation has remained persistent in recent months and that interest rates in major economies are expected to stay higher for longer due to persistent inflation. The MPC concluded that the current monetary policy stance will maintain overall inflation around the mid-point of the target range in the short term while ensuring continued exchange rate stability. The MPC will closely monitor the impact of its policy measures, as well as developments in the global and domestic economy, and stands ready to take further action as necessary in line with its mandate. The Committee will meet again in August 2024.
Fiscal Policy:
The total Kenyan budget for the FY’2024/2025 National Budget increased by 7.2% to Kshs 4.0 tn from the Kshs 3.7 tn in FY’2023/2024 while the total revenue inclusive of grants increasing by 15.9% to Kshs 3.4 tn from the Kshs 2.9 tn in FY’2023/2024. The increase is mainly due to an 18.8% increase in ordinary revenue to Kshs 2.8 tn for FY’2024/2025, from the Kshs 2.5 tn in FY’2023/2024 with the increase largely dependent on the effectiveness of the Kenya Revenue Authority in collecting taxes as well as an increase in some of the existing taxes to meet its revenue target. However, there are still concerns about the government's ability to meet its revenue collection targets in FY’2024/2025, on the back of the withdrawal of the Finance Bill 2024 after the president declined to assent to it, which was meant to increase revenue by Kshs 302.0 bn, coupled with a tough operating environment.
For the FY’2023/2024, we do not expect the government to meet its revenue collection target having collected Kshs 1,928.8 bn, equivalent to 78.7% of the revised estimates of Kshs 2,452.1 bn for FY’2023/2024 and 85.8% of the prorated estimates of Kshs 2,247.8 bn in the first eleven months of FY’2023/2024. Notably, the total expenditure amounted to Kshs 3,255.8 bn, equivalent to 85.4% of the revised estimates of Kshs 3,813.3 bn, and 93.1% of the prorated expenditure estimates of Kshs 3,495.5 bn, an indication of modest spending by the government. The total borrowings as at the end of May 2024 amounted to Kshs 1232.2 bn, equivalent to 72.4% of the revised estimates of Kshs 1,701.7 bn and 79.0% of the prorated estimates of Kshs 1,559.9bn.
Going forward, we believe that the withdrawn Finance Bill will force the government to borrow more to finance the fiscal deficit owing to reduced revenue collection. We therefore expect the government to cut on its expenditure, mostly the development expenditure in order to finance the growing debt maturities and the ballooning recurrent expenditure.
Weekly Highlights:
- Withdrawal of the Finance Bill 2024
Following nationwide protests that peaked on Tuesday 25th June 2024, President William Ruto, on Wednesday 26th June 2024 conceded to pressure from the public and declined to sign the controversial Finance Bill 2024 into law.
The proposed raft of tax changes in the Finance Bill 2024 were geared towards expanding the tax base and increasing revenues, with an expectation of raising Kshs 302.0 bn. This revenue was intended to support the government's budget of Kshs 4.0 tn for the fiscal year 2024/2025, and to address a budget deficit of Kshs 597.0 bn. The deficit is planned to be financed through external borrowing of Kshs 333.8 bn and domestic borrowing of Kshs 263.2 bn. Kenya’s total public debt to GDP ratio currently stands at 69.7%, which is higher than the 55.0% preferred by the World Bank and the International Monetary Fund (IMF). Below we highlight some of the key tax proposals contained in the Finance Bill 2024, changes made and the implications of the withdrawal of the Bill:
- Under the Income Tax Act:
- Motor vehicle tax: The Bill proposed a new 2.5% tax on the value of motor vehicles, payable when issuing insurance cover
- Withholding Tax on Goods Supplied to Public Entities: The Bill suggested a withholding tax on goods supplied to public entities by residents and non-residents without a permanent establishment. The rate is 3.0% for resident suppliers and 5.0% for non-residents.
- Taxation of Digital Marketplaces and Content Monetization: The Bill proposed taxing income from digital marketplaces or platforms and digital content monetization at 20.0% for non-residents and 5% for residents.
- Repeal of Digital Service Tax and Introduction of Significant Economic Presence Tax: The Bill sought to repeal the digital service tax (DST) and introduce a significant economic presence tax at 30.0% of deemed taxable profit for non-residents earning income from services provided through digital marketplaces in Kenya.
- Tax Deductibility of Contributions to Medical Funds and Housing Levy: The Bill proposed making contributions to the Social Health Insurance Fund, post-retirement medical fund, and affordable housing levy deductible expenses when calculating taxable income.
- Investment Deduction on Spectrum Licence Purchases: The Bill introduced an investment deduction for capital expenditure on spectrum licenses by telecommunications operators at 10% in equal installments. For licenses purchased before 01 July 2024, the deduction is limited to the unamortized portion over the remaining useful life.
- Tax on Interest Income from Infrastructure Bonds: The Bill proposed taxing interest income from infrastructure bonds for resident persons, while non-residents' interest income remains exempt. Interest from previously listed infrastructure bonds will continue to be exempt.
b. Under the Excise Duty Act:
- Introduction of Excise Duty on Digital Services by Non-Residents: The Bill proposed a 20.0% excise duty on services provided by non-residents through digital platforms in Kenya. This applies to: Telephone and internet data services, fees for money transfer services by banks, money transfer agencies, and other financial service providers, betting, lottery, gaming, and prize competitions, and fees on digital lending.
- Increase of Excise Duty on Money Transfer Services: The Bill suggested raising excise duty from 15.0% to 20.0% on fees for money transfer services provided by banks, money transfer agencies, and other financial service providers, and cellular phone service providers or payment service providers licensed under the National Payment Systems Act, 2011
- Extension of Timeline for Excise Duty Payment by Alcoholic Beverage Manufacturer: The Bill proposed extending the payment timeline for excise duty by licensed alcoholic beverage manufacturers to five working days after removing goods from the stockroom. The previous requirement was to pay within 24 hours.
- Repeal of Automatic Adjustment for Inflation: The Bill proposed removing provisions for the automatic adjustment of excise duty rates on excisable goods for inflation.
c. Under the Value Added Tax (VAT) Act
- VAT on Financial Services: The Bill proposed removing VAT exemptions for several financial services, making them subject to the standard VAT rate of 16.0%. These services include: Issuing credit and debit cards, telegraphic money transfers, foreign exchange transactions, cheque handling and processing, issuing securities for money, debt assignment for consideration, financial services provided on a commission basis
- Increase of VAT Registration Threshold: The Bill proposed raising the threshold for mandatory VAT registration from Kshs 5.0 mn to Kshs 8.0 mn.
- Exemption for Transfer of Business: The Bill proposed exempting the transfer of a business as a going concern from VAT, which is currently taxed at 16.0%.
- VAT on Insurance Premiums: The Bill proposed limiting VAT exemptions to insurance and reinsurance premiums only, subjecting other related services to the standard VAT rate of 16.0%.
- VAT on Betting, Gaming, and Lotteries: The Bill proposed removing the VAT exemption for betting, gaming, and lotteries, making them subject to the standard VAT rate of 16.0%.
- Removal of VAT Exemptions in Tourism: The Bill proposed deleting the following VAT exemptions in the tourism sector: Goods for the construction of tourism facilities and recreational parks of 50 acres or more, locally assembled vehicles for transporting tourists, purchased by tour operators, services for the construction of tourism facilities and recreational parks of 50 acres or more
- Removal of VAT Exemptions in Manufacturing and Construction: The Bill proposed deleting the following VAT exemptions for the manufacturing and construction sectors: Capital goods promoting investment in manufacturing with a value of at least Kshs 2.0 bn, plant, machinery, and equipment for constructing plastics recycling plants, and goods and services for constructing and equipping specialized hospitals with a minimum bed capacity of 50, approved by the Cabinet Secretary for Health
Changes effected to the Finance Bill 2024 included:
- Removal of VAT on Bread: The Finance Committee scrapped the proposed 16.0% VAT on bread following public backlash.
- Excise Duty on Vegetable Oil: The President approved the removal of a proposed 25.0% excise duty on vegetable oil.
- VAT on Sugar Cane Transportation: The State House eliminated the proposed 16.0% VAT on transporting sugar cane to factories, which could have led to higher sugar prices.
- VAT on Financial Services: The Committee removed VAT on financial services and foreign exchange transactions, preventing a potential increase from 15.0% to 40.0% that could have affected forex transactions.
- Mobile Money Transfer Charges: The proposed increase of excise duty on mobile money transfer charges from 15.0% to 20.0% was reversed.
- Motor Vehicle Tax: The proposed annual motor vehicle tax of 2.5% of car value, with a minimum of Kshs 5,000 and a maximum of Kshs 100,000, was removed due to public outcry.
- Housing Fund and Social Health Insurance Levies: These proposed levies were converted to tax-deductible expenses, exempting them from income tax and benefiting employees.
- Eco Levy Adjustments: The Eco Levy will now apply only to imported finished products, not locally manufactured goods, addressing concerns about stifling local manufacturing growth.
- Exemptions on Locally Manufactured Products: The Eco Levy will not apply to locally made products, including sanitary towels, diapers, phones, computers, tyres, and motorcycles.
- VAT Registration Threshold: Small businesses with a turnover of less than Kshs 8.0 mn are exempt from VAT registration, up from the previous threshold of Kshs 5.0 mn.
- eTIMS Exemption: Farmers and small businesses with a turnover below Kshs 1.0 mn are exempt from registering for the electronic Tax Invoice Management System (eTIMS).
- Excise Duty on Imported Agricultural Products: The Committee imposed excise duty on imported table eggs, onions, and potatoes to protect local farmers, scrapping the proposed 16.0% VAT.
- Excise Duty on Alcoholic Beverages: Excise duty will be based on alcohol content rather than volume, encouraging the production of safer and more affordable alcohol.
- Pension Contributions: The exemption threshold for pension contributions was increased from Kshs 20,000 to Kshs 30,000.
- Funding for Junior Secondary School Interns: The budget for recruiting Junior Secondary School interns was increased from Kshs 13.4 bn to Kshs 18.0 bn.
- Teacher Intern Recruitment: Funds have been allocated to hire 20,000 teacher interns, with a policy shift to transition these teachers to permanent and pensionable terms.
The withdrawal of the Finance Bill 2024 in Kenya has significant implications for the country's economy and investment landscape. The withdrawal of the Bill will create a revenue shortfall for the FY2024/2025 budget, and will likely result in Kenya missing the 3.3% fiscal deficit target this year and lead to a possible cut in development expenditure, increased borrowing, higher interest rates, and a potential rise in public debt. Furthermore, after reaching staff-level agreement with the IMF, the proposed tax measures reversal will possibly impede the disbursement of future IMF funds. Uncertainty about the budgetary trajectory and the IMF program would further complicate the government's efforts to increase external funding.
The Finance Bill's withdrawal may affect investor confidence, especially if the market perceives it as a sign of political or economic instability, and could impact both domestic and foreign investment inflows. Investors may adopt a wait-and-see approach, leading to decreased market activity.
Money Markets, T-Bills Primary Auction:
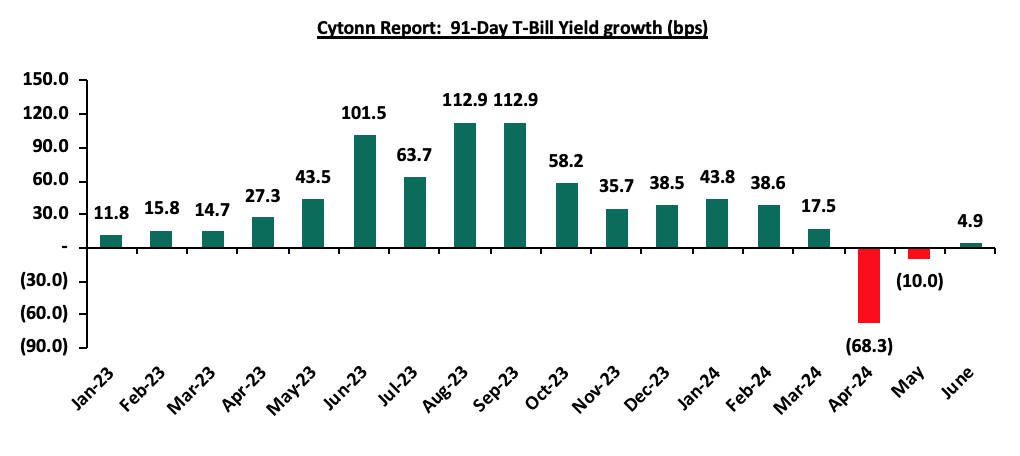
During H1’2024, T-bills were oversubscribed, with the overall subscription rate coming in at 132.6%, up from 121.7% in H1’2023. Investors’ preference for the 91-day paper persisted as they sought to avoid duration risk, with the paper receiving bids worth Kshs 420.6 bn against the offered Kshs 104.0 bn, translating to an oversubscription rate of 404.4%, albeit lower than the oversubscription rate of 481.8% recorded in H1’2023. Overall subscription rates for the 364-day and 182-day papers came in at 80.7% and 75.7%, higher than the 37.9% and 61.3%, respectively, recorded in H1’2023. The average yields on the 364-day, 182-day, and 91-day papers increased by 5.7% points, 6.1% points, and 6.1% points to 16.7%, 16.6%, and 16.2% in H1’2024, respectively, from 11.0%, 10.5%, and 10.2%, respectively, in H1’2023. The upward trajectory in yields is mainly on the back of investors attaching higher risks amid increased credit risk in the country, hence the need to demand higher returns to cushion against the possible loss, and, the government’s desperate need to keep borrowing in the domestic market. The acceptance rate during the period came in at 92.3%, higher than the 91.6% recorded in H1’2023, with the government accepting a total of Kshs 763.5 bn out of the Kshs 827.3 bn worth of bids received. The chart below shows the yield growth rate for the 91-day paper during the year:
During the week, T-bills remained undersubscribed for the third consecutive week, with the overall undersubscription rate coming in at 32.0%, lower than the undersubscription rate of 60.0% recorded the previous week. Investors’ preference for the shorter 91-day paper persisted, with the paper receiving bids worth Kshs 4.4 bn against the offered Kshs 4.0 bn, translating to an oversubscription rate of 109.0%, albeit lower than the oversubscription rate of 148.0% recorded the previous week. The subscription rates for the 182-day and 364-day papers decreased to 14.9% and 18.3% respectively from the 39.3% and 45.5% respectively recorded the previous week. The government accepted a total of Kshs 6.1 bn worth of bids out of Kshs 7.7 bn bids received, translating to an acceptance rate of 78.7%. The yields on the government papers were on an upward trajectory, with the yields on the 364-day, 182-day, and 91-day papers increasing by 3.7 bps, 2.6 bps, and 0.6 bps to 16.79%, 16.76%, and 15.98% respectively from 16.75%, 16.74% and 15.97% respectively recorded the previous week.
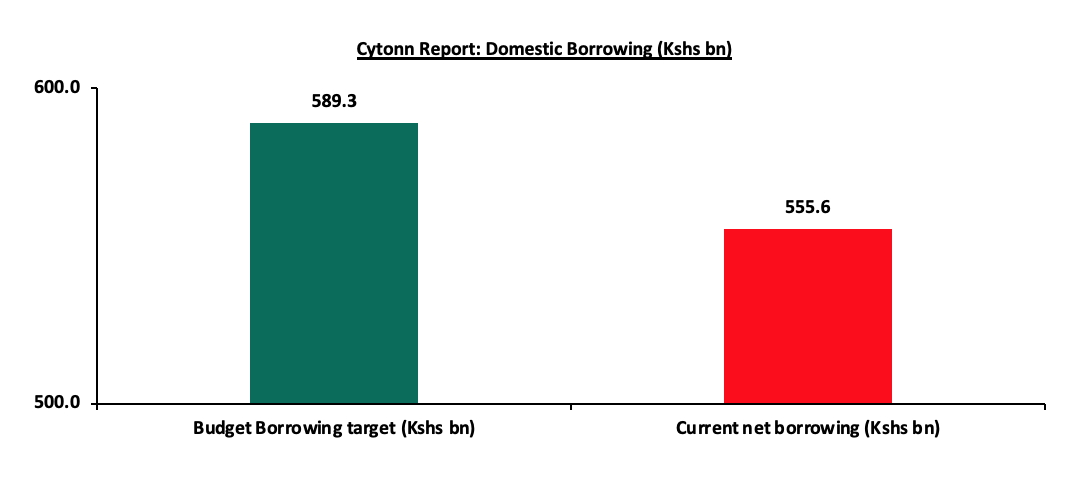
The government closed FY’2023/24, having advertised government securities totalling Kshs 1,914.0 bn. The government accepted bids worth Kshs 2,261.1 bn, of which Kshs 1,472.1 bn and Kshs 789.0 bn were treasury bills and bonds, respectively. Total redemptions in FY’2023/24 amounted to Kshs 1,705.5 bn, with treasury bills accounting for Kshs 1,587.4 bn and bonds accounting for Kshs 124.0 bn. As a result, the government had a domestic borrowing surplus of Kshs 555.6 bn in FY’2023/24, with the government closing the year 5.7% behind its net domestic borrowing target of Kshs 589.3 bn. The chart below shows the government’s domestic borrowing as at the end of FY’2023/24:
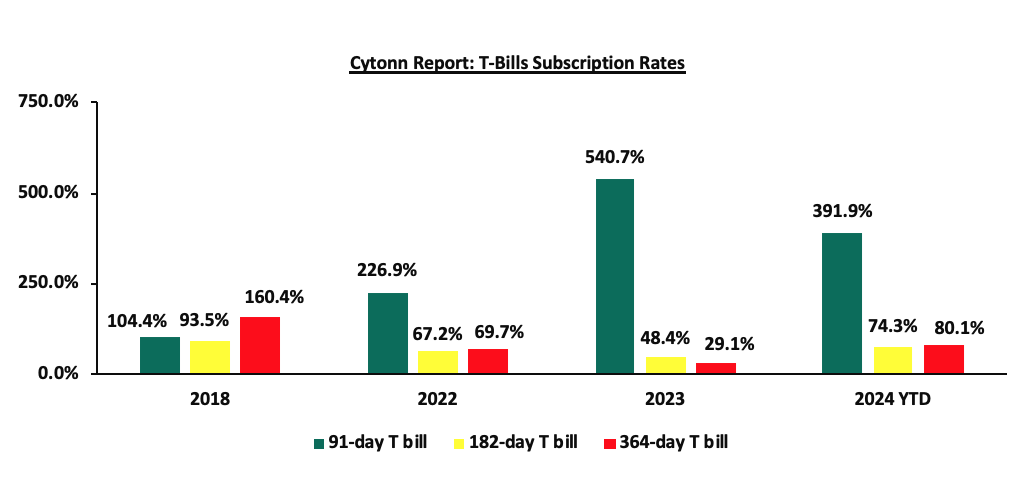
The chart below compares the overall average T-bills subscription rates obtained in 2018, 2022, 2023, and 2024 Year to Date (YTD):
Primary T-Bond Auctions in H1’2024
During H1’2024, the Government issued two new treasury bonds, and one infrastructure bond, reopened five, and issued nine bonds on tap-sale, seeking to raise Kshs 385.0 bn. The bonds were generally oversubscribed, receiving total bids worth Kshs 657.5 bn translating to an overall subscription rate of 170.8%. The government rejected expensive bids and only accepted bids worth Kshs 518.2 bn, out of the Kshs 657.5 bn of bids received, translating to an acceptance rate of 78.8%. The table below provides more details on the bonds issued during the period:
|
Cytonn Report: H1’2024 Kenya Bond Issuances |
|||||||||
|
Issue Date |
Bond Auctioned |
Effective Tenor to Maturity (Years) |
Coupon |
Amount offered (Kshs bn) |
Actual Amount Raised (Kshs bn) |
Total bids received |
Average Accepted Yield |
Subscription Rate |
Acceptance Rate |
|
15/01/2024 |
FXD1/2023/005 (re-opened) |
4.5 |
16.8% |
35.0 |
25.0 |
37.2 |
18.8% |
106.1% |
67.3% |
|
FXD1/2024/003 |
2.9 |
18.4% |
18.4% |
||||||
|
22/01/2024 |
FXD1/2023/005 – Tapsale |
4.5 |
16.8% |
15.0 |
11.8 |
11.9 |
18.8% |
79.1% |
99.1% |
|
FXD1/2024/003 – Tapsale |
2.9 |
18.4% |
18.4% |
||||||
|
19/02/2024 |
IFB/2024/8.5 |
8.5 |
18.5% |
70.0 |
241.0 |
288.7 |
18.5% |
412.4% |
83.5% |
|
11/03/2024 |
FXD1/2024/03 (re-opened) |
2.9 |
18.4% |
40.0 |
34.3 |
43.1 |
18.4% |
107.7% |
79.6% |
|
25/03/2024 |
FXD1/2024/005 (re-opened) |
4.5 |
16.8% |
40.0 |
22.6 |
59.7 |
18.4% |
149.3 |
37.8 |
|
FXD1/2024/010 |
10.0 |
16.0% |
16.5% |
||||||
|
4/4/2024 |
FXD1/2023/005 – Tapsale |
4.5 |
16.8% |
25.0 |
45.8 |
47.8 |
18.4% |
191.2% |
95.9% |
|
FXD1/2024/010 – Tapsale |
10.0 |
16.0% |
16.5% |
||||||
|
22/4/2024 |
FXD1/2023/002-Reopened |
1.4 |
17.0% |
40.0 |
34.8 |
47.2 |
17.0% |
118.0% |
73.7% |
|
06/05/2024 |
FXD1/2024/010-Re-opened |
9.9 |
16.0% |
25.0 |
11.0 |
15.0 |
16.2% |
59.9% |
73.4% |
|
13/05/2024 |
FXD1/2024/010-Tapsale |
9.9 |
16.0% |
15.0 |
7.0 |
7.1 |
16.2% |
47.4% |
98.8% |
|
10/06/2024
|
FXD1/2023/002 - Re-opened |
1.2 |
17.0% |
30.0 |
7.1 |
8.4 |
17.1% |
28.2% |
83.8% |
|
FXD1/2024/003 – Re-opened |
2.6 |
18.4% |
23.8 |
24.8 |
17.6% |
82.7% |
96.0% |
||
|
17/06/2024
|
FXD1/2023/010 – Re-opened |
8.7 |
14.2% |
30.0 |
7.6 |
9.6 |
16.4% |
32.1% |
78.9% |
|
FXD1/2023/005 – Re-opened |
4.1 |
16.8% |
22.6 |
31.9 |
18.2% |
106.5% |
70.7% |
||
|
24/06/2024
|
FXD1/2023/010 – Tapsale |
8.7 |
14.2% |
20.0 |
7.9 |
8.8 |
16.4% |
44.2% |
89.8% |
|
FXD1/2023/005 – Tapsale |
4.1 |
16.8% |
10.8 |
11.2 |
18.2% |
56.1% |
96.3% |
||
|
FXD1/2024/003 – Tapsale |
2.6 |
18.4% |
3.3 |
3.3 |
17.6% |
16.3% |
101.6% |
||
|
FXD1/2023/002 – Tapsale |
1.2 |
17.0% |
1.8 |
1.8 |
17.1% |
9.0% |
99.8% |
||
|
H1'2024 Total |
|
|
385.0 |
518.2 |
657.5 |
|
|
|
|
|
H1’2023 Total |
|
|
375.0 |
442.0 |
477.7 |
|
|
|
|
|
H1'2024 Average |
6.2 |
17.1% |
|
|
|
17.6% |
170.8% |
78.8% |
|
|
H1'2023 Average |
8.1 |
13.8% |
|
|
|
14.2% |
127.4% |
92.5% |
|
In the primary bond market, the government is seeking to raise a total of Kshs 50.0 bn for budgetary support in the month of July by re-opening two bonds and issuing a tap sale. The two fixed coupon treasury bonds issued concurrently include the re-opened FXD1/2024/10 and FXD1/2008/20, with a tenor to maturity of 9.7 years and 3.9 years, respectively and have their coupon rates set at 16.0% and 13.8% respectively. The bonds’ value dates will be 22nd July 2024, with maturity dates of 13th March 2034 and 5th June 2028 for FXD1/2024/10 and FXD1/2008/20 respectively; Given the bonds are trading at 15.0% and 17.7% for the FXD1/2024/10 and FXD1/2008/20 respectively in the secondary bond market, we expect the bidding range to come in at 15.25% - 16.55% and 17.55% - 17.75% respectively. Further, the government is seeking to raise Kshs 20.0 bn through the tap sale of the FXD1/2023/002 bond, with a tenor to maturity of 1.2 years, a coupon rate of 17.0% and a period of sale of Wednesday 26th June 2024 to Thursday 4th July 2024. The bids shall be priced at the average rate of accepted yield for the initial values which stood at 17.1%.
Secondary Bond Market Activity:
- Bond Turnover:
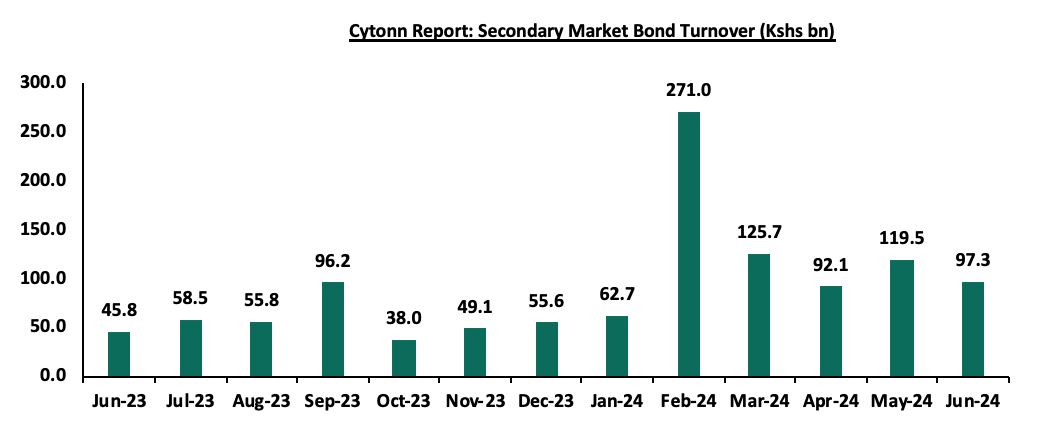
The secondary bond market recorded increased activity, with the turnover increasing significantly by 144.9% to Kshs 768.2 bn from Kshs 313.7 bn in H1’2023, pointing towards increased activities by commercial banks in the secondary bond market. Notably, February recorded outstanding activity in the secondary bond market owing to the infrastructure bond issue which gained traction among investors. Similarly, on a year-on-year basis, the bond turnover increased significantly by 112.0% to Kshs 97.3 in June 2024, from Kshs 45.8 bn worth of treasury bonds transacted over a similar period last year. The chart below shows the bond turnover over the past 12 months;
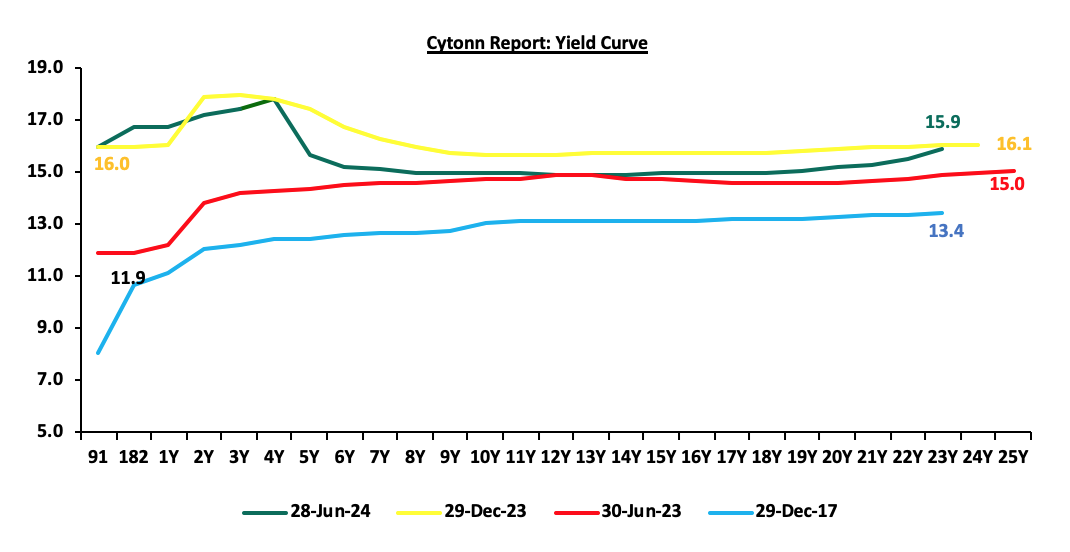
- Yield Curve:
During H1’2024, yields on the government securities were on an upward trajectory compared to the same period in 2023. We observe a humped yield curve for the medium-term bonds in the 3 to 10-year maturity range, an indication of the prevailing uncertainty in the market regarding both medium-term interest rates and inflation. Investors, apprehensive about the economic outlook in the near to medium term, are demanding higher yields for bonds in the 3 to 10-year maturity range to compensate for the perceived risks as they anticipate potential fluctuations in economic conditions in the Kenyan market on the back of the government’s debt sustainability concerns. The chart below shows the yield curve movement during the period:
Money Market Performance
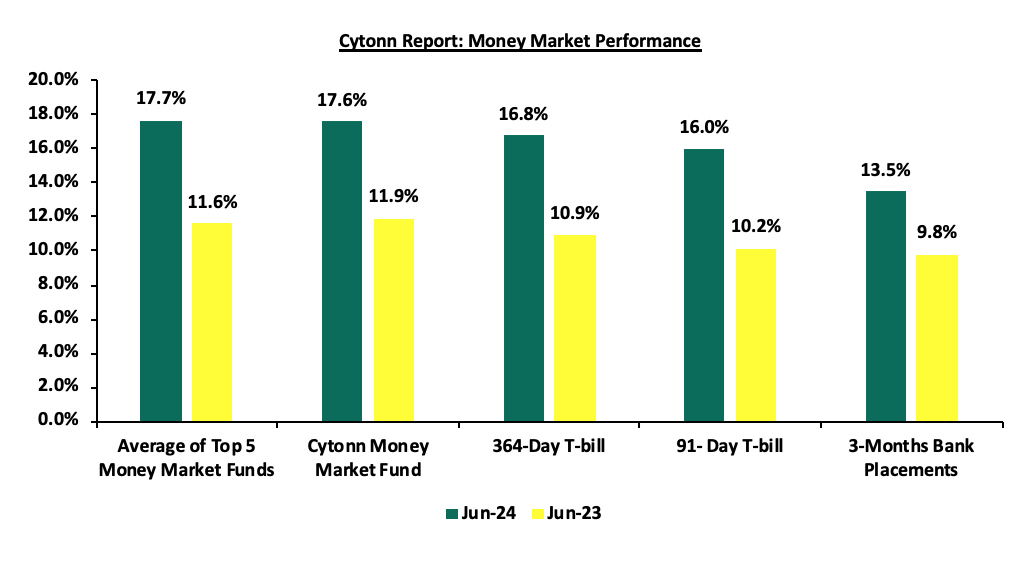
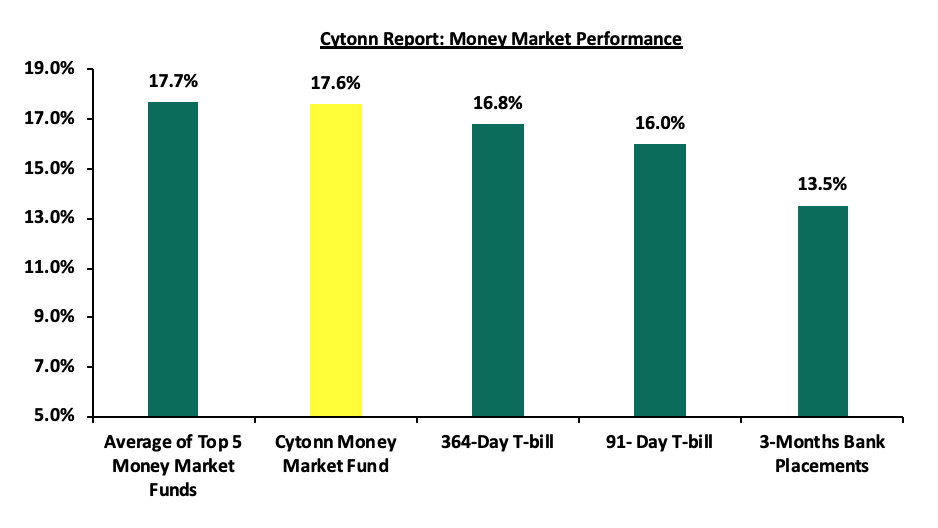
The 3-month bank placements recorded 13.5% at the end of H1’2024, 3.7% points higher than the 9.8% recorded at the end of H1’2023 (based on what we have been offered by various banks). The 91-day T-bill rate increased by 5.8% points to 16.0% at the end of H1’2024 from 10.2% at the end of H1’2023, and the average Top 5 Money Market Funds increased by 6.1% points to 17.7%, from 11.6% at the end of H1’2023. The yield on the Cytonn Money Market (CMMF) increased by 5.7% points to 17.6% at the end of H1’2024, from 11.9% recorded at the end of H1’2023.
During the week, in the money markets, 3-month bank placements ended the week at 13.5% (based on what we have been offered by various banks), and the yields on the government papers were on an upward trajectory, with the yields on the 364-day and 91-day papers increasing by 3.7 bps and 0.6 bps to 16.79% and 15.98% respectively from 16.75% and 15.97% respectively recorded the previous week. The yields on the Cytonn Money Market Fund remained unchanged at the 17.6% recorded the previous week, while the average yields on the Top 5 Money Market Funds increased by 15.4 bps to 17.7% from the 17.5% recorded the previous week.
The table below shows the Money Market Fund Yields for Kenyan Fund Managers as published on 28th June 2024:
|
Cytonn Report: Money Market Fund Yield for Fund Managers as published on 28th June 2024 |
||
|
Rank |
Fund Manager |
Effective Annual Rate |
|
1 |
Etica Money Market Fund |
18.3% |
|
2 |
Lofty-Corban Money Market Fund |
18.3% |
|
3 |
Cytonn Money Market Fund (Dial *809# or download the Cytonn App) |
17.6% |
|
4 |
Arvocap Money Market Fund |
17.1% |
|
5 |
Kuza Money Market fund |
17.1% |
|
6 |
GenAfrica Money Market Fund |
16.7% |
|
7 |
Nabo Africa Money Market Fund |
16.6% |
|
8 |
GenCap Hela Imara Money Market Fund |
15.9% |
|
9 |
Enwealth Money Market Fund |
15.7% |
|
10 |
Co-op Money Market Fund |
15.7% |
|
11 |
Jubilee Money Market Fund |
15.6% |
|
12 |
Apollo Money Market Fund |
15.6% |
|
13 |
KCB Money Market Fund |
15.6% |
|
14 |
Madison Money Market Fund |
15.4% |
|
15 |
Mayfair Money Market Fund |
15.3% |
|
16 |
Mali Money Market Fund |
15.2% |
|
17 |
AA Kenya Shillings Fund |
15.2% |
|
18 |
Sanlam Money Market Fund |
15.1% |
|
19 |
Absa Shilling Money Market Fund |
15.0% |
|
20 |
Orient Kasha Money Market Fund |
14.5% |
|
21 |
Dry Associates Money Market Fund |
14.0% |
|
22 |
Old Mutual Money Market Fund |
13.6% |
|
23 |
CIC Money Market Fund |
13.2% |
|
24 |
ICEA Lion Money Market Fund |
12.3% |
|
25 |
Equity Money Market Fund |
12.0% |
|
26 |
British-American Money Market Fund |
9.7% |
Source: Business Daily
Liquidity:
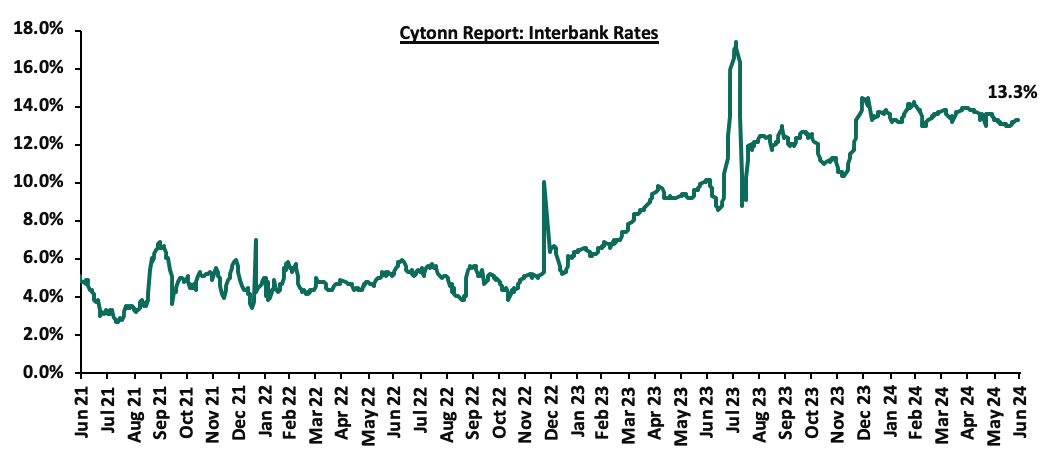
In H1’2024, liquidity in the money markets tightened, as evidenced by the increase in the interbank rate to 13.5%, from 7.8% H1’2023, partly attributable to tax remittances that offset government payments. Additionally, the average volumes traded in the interbank market increased by 8.9% to Kshs 23.0 bn, from Kshs 21.1 bn recorded in H1’2023.
Similarly, during the week, liquidity in the money markets tightened, with the average interbank rate increasing by 19.3 bps to 13.3% from 13.1% recorded the previous week, partly attributable to tax remittances that offset government payments. The average interbank volumes traded decreased by 23.6% to Kshs 20.4 bn from Kshs 26.7 bn recorded the previous week. The chart below shows the interbank rates in the market over the years:
Kenya Eurobonds:
During H1’2024, the yields on Eurobonds recorded mixed performance, with the yield on the 7-Year Eurobond issued in 2019 declining by 0.2% points to 9.9% from 10.1% recorded at the beginning of the year, while the yields on the 13-year Eurobond issued in 2021 gained the most by 1.2% points to 10.8% from 9.5% recorded at the beginning of the year. Similarly, on a year-on-year basis, the yields on all Eurobonds were on a downward trend, save for the 13-year Eurobond issued in 2021 whose yield gained by 0.5% points to 10.8% from 10.3% recorded at the end of H1’2023, while the 7-year Eurobond issued in 2019 declined the most by 1.3% points to 9.9% from 11.3% recorded at the end of H1’2023.
During the week, the yields on Eurobonds were on an upward trajectory, with the yield on the 7-Year Eurobond issued in 2019 increasing the most by 33.5 bps to 9.9% from 9.6% recorded the previous week. The table below shows the summary of the performance of the Kenyan Eurobonds as of 27 June 2024;
|
Cytonn Report: Kenya Eurobonds Performance |
||||||
|
|
2018 |
2019 |
2021 |
2024 |
||
|
Tenor |
10-year issue |
30-year issue |
7-year issue |
12-year issue |
13-year issue |
7-year issue |
|
Amount Issued (USD) |
1.0 bn |
1.0 bn |
0.9 bn |
1.2 bn |
1.0 bn |
1.5 bn |
|
Years to Maturity |
3.7 |
23.7 |
2.9 |
7.9 |
10.0 |
6.6 |
|
Yields at Issue |
7.3% |
8.3% |
7.0% |
7.9% |
6.2% |
10.4% |
|
30-Jun-23 |
11.0% |
11.1% |
11.3% |
11.1% |
10.3% |
|
|
01-Jan-24 |
9.8% |
10.2% |
10.1% |
9.9% |
9.5% |
|
|
03-Jun-24 |
9.2% |
10.1% |
9.0% |
9.7% |
9.8% |
9.7% |
|
20-Jun-24 |
10.1% |
10.8% |
9.6% |
10.5% |
10.5% |
10.5% |
|
21-Jun-24 |
10.2% |
10.9% |
9.7% |
10.7% |
10.6% |
10.7% |
|
24-Jun-24 |
10.1% |
10.8% |
9.5% |
10.7% |
10.6% |
10.7% |
|
25-Jun-24 |
10.3% |
10.9% |
9.8% |
10.8% |
10.7% |
10.8% |
|
26-Jun-24 |
10.3% |
10.9% |
9.8% |
10.8% |
10.8% |
10.8% |
|
27-Jun-24 |
10.3% |
10.9% |
9.9% |
10.8% |
10.8% |
10.7% |
|
Weekly Change |
0.3% |
0.1% |
0.3% |
0.2% |
0.2% |
0.2% |
|
Y/Y Change |
(0.7%) |
(0.1%) |
(1.3%) |
(0.3%) |
0.5% |
- |
|
YTD Change |
0.5% |
0.7% |
(0.2%) |
0.9% |
1.2% |
- |
Source: Central Bank of Kenya (CBK)
H1’2024 Highlights:
- The Energy and Petroleum Regulatory Authority (EPRA) released their monthly statement on the maximum retail fuel prices in Kenya, effective from 15th January 2024 to 14th February 2024. Notably, the maximum allowed price for Super Petrol, Diesel and Kerosene decreased by Kshs 5.0, Kshs 5.0, and Kshs 4.8 respectively and retailed at Kshs 207.4, Kshs 196.5, and Kshs 194.2 per litre respectively from the December 2023 prices of Kshs 212.4, Kshs 201.5 and Kshs 199.1 respectively. Please see our Cytonn Weekly 02/2024,
- The Executive Board of the International Monetary Fund (IMF) concluded the 2023 Article IV consultation with Kenya together with the sixth reviews and augmentations of access of USD 941.2 mn (Kshs 151.3 bn) under the Extended Fund Facility (EFF) and the Extended Credit Facility (ECF) arrangements, and the first review under the 20-month Resilience and Sustainability Facility (RSF) arrangement, approved in July 2023. Please see our Cytonn Weekly 03/2024,
- The National Treasury gazetted the revenue and net expenditures for the sixth month of FY’2023/2024, ending 29th December 202 Total revenue collected as at the end of December 2023 amounted to Kshs 1,092.1 bn, equivalent to 42.4% of the revised estimates of Kshs 2,576.8 bn for FY’2023/2024 and is 84.8% of the prorated estimates of Kshs 1,288.4 bn. December’s 84.8% attainment of the revenue target was a 2.6%-points improvement from the performance in November where the government achieved 82.2% of the revenue targets. Please see our Cytonn Weekly 03/2024,
- Ivory Coast (Côte d’Ivoire) became the first Sub-Saharan Africa (SSA) country to tap into the international capital markets, issuing two bonds with respective maturities of 8.5 years and 12.5 years, maturing on 30th January 2033 and 30th January 2037 respectively. This was the first issue in the SSA region since 2022, when rising global interest rates and geopolitical tensions made foreign currency debt prohibitively expensive for most African borrowers. Notably, the sovereign raised a total of USD 2.6 bn from the two tranches, with the two issues recording an oversubscription of over USD 8.0 bn. The coupon rates for the 8.5-year (maturity 2033) and the 12.5-year (maturity 2037) were fixed at 7.625% and 8.250% respectively, with the coupons being payable semi-annually in arrears. Please see our Cytonn Weekly #04/2024,
- The Monetary Policy Committee met on February 6, 2024, to review the outcome of its previous policy decisions against a backdrop of continued global uncertainties, moderating global oil prices, an improved global growth outlook as well as heightened geopolitical tensions. The MPC decided to raise the CBR rate by 0.5% points to 13.0% from 12.5% on account of inflation remaining sticky in the economy as well as continued pressures on the exchange rate, albeit reduced. Please see our Cytonn Weekly 06/2024,
- Kenya announced it was going through with the earlier announced plan of buying back the 10-year tenor USD 2.0 bn Eurobond issued in 2014. In the announcement, Kenya stated that the buyback plan would be financed by the issuance of a new Eurobond. This followed successful issues by Ivory Coast and Benin which raised USD 2.6 bn and USD 750.0 mn respectively, marking the return of the Sub-Saharan region to the international Eurobonds market after nearly two years of absence. Please see our Cytonn Weekly 06/2024,
- Benin became the second country in the Sub-Saharan Africa (SSA) region to tap into the international capital markets in 2024, issuing their debut dollar bond with a tenor of 14 years and a coupon rate of 8.375%. Notably, the bond was oversubscribed with the overall subscription rate coming in at 666.7% having received bids worth USD 5.0 bn against the offered USD 750.0 mn; Please see our Cytonn Weekly 06/2024,
- The Stanbic Bank released its monthly Purchasing Manager's Index (PMI) highlighting that the index for the month of January 2024 improved slightly, coming in at 49.8, up from 48.8 in December 2023, signalling a modest and softer downturn in operating conditions across Kenya’s business environment; Please see our Cytonn Weekly 06/2024,
- The Energy and Petroleum Regulatory Authority (EPRA) released its monthly statement on the maximum retail fuel prices in Kenya, effective from 15th February 2024 to 14th March 2024. Notably, the maximum allowed price for Super Petrol, Diesel and Kerosene decreased by Kshs 1.0 each, and retailed at Kshs 206.4, Kshs 195.5, and Kshs 193.2 per litre respectively from the January 2024 prices of Kshs 207.4, Kshs 196.5 and Kshs 194.2 respectively; Please see our Cytonn Weekly 07/2024,
- The Government, through the Ministry of National Treasury & Planning announced the successful pricing of a new USD 1.5 bn Eurobond. The new issuance (KENINT 2031) attracted a yield of 10.375% and a coupon rate of 9.75%, in line with our expectations which were informed by the prevailing market conditions, Kenya’s credit ratings, and the unique nature of the buyback and issue plan. Interest payments for the bond are to be paid semi-annually on February 16th and August 16th starting August 2024; Please see our Cytonn Weekly 07/2024,
- The Government, on 15th February 2024, announced the results of the Tender offer of its USD 2.0 bn 10-year tenor Eurobond issued in 2014. The buyback offer received tenders worth 1.5 bn against the offered 1.4 bn, translating to an oversubscription rate of 106.1%, with Kenya accepting bids worth USD 1.4 bn, slightly below the offered USD 1.5 bn. This translated to an acceptance rate of 97.0%; Please see our Cytonn Weekly 07/2024,
- The global ratings agency, S&P Global affirmed Kenya's long-term sovereign credit rating at 'B' with a negative outlook and assigned a 'B' long-term issue rating to the proposed U.S. dollar-denominated Eurobonds. This came in following the buyback of the 10-year tenor USD 2.0 bn Eurobond tenders issued in 2014 and the new issuance of the KENINT 2031 Eurobond priced at USD 1.5 bn. In addition, the global ratings agency, Moody’s announced its revision of the Kenyan banks’ outlook to negative from stable on the back of the high volume of non-performing loans (NPLs), which have thrown a pall over the sector's strong profitability and liquidity. Please see our Cytonn Weekly 07/2024,
- The National Treasury gazetted the revenue and net expenditures for the seventh month of FY’2023/2024, ending 31st January 2024 highlighting that total revenue collected as at the end of January 2024 amounted to Kshs 1,261.0 bn, equivalent to 48.9% of the revised estimates of Kshs 2,576.8 bn for FY’2023/2024 and is 83.9% of the prorated estimates of Kshs 1,503.1 bn; Please see our Cytonn Weekly 07/2024,
- Yields on the Government securities had been on an upward trajectory with the 91-day paper yielding 16.6% from 9.4% in January 2023. Going forward, we anticipate a very modest increase in yields on the government papers before they stabilize in the remaining months of FY’2023/24. The increase will be muted going forward due to the positive investor sentiment brought about by the successful offering of the Eurobond, which helped alleviate the fears of possible default by the government. Please see our Cytonn Weekly 08/2024,
- Stanbic Bank released its monthly Purchasing Manager's Index (PMI)-Kenya highlighting that the index for the month of February 2024 improved, coming in at 51.3, up from 49.8 in January 2024. The index was also at its highest level in over a year, with positive directional influences seen in all five of its sub-components. The upturn of the general business environment was mainly attributable to eased inflationary pressures, appreciating Shilling, and reduced fuel prices. Please see our Cytonn Weekly 10/2024,
- The Energy and Petroleum Regulatory Authority (EPRA) released their monthly statement on the maximum retail fuel prices in Kenya, effective from 15th March 2024 to 14th April 202 Notably, the maximum allowed price for Super Petrol, Diesel and Kerosene decreased by Kshs 7.2, Kshs 5.1, and Kshs 4.5 each respectively, and will retail at Kshs 199.2, Kshs 190.4 and Kshs 188.7 per litre respectively, from the February 2024 prices of Kshs 206.4, Kshs 195.5 and Kshs 193.2 respectively. Please see our Cytonn Weekly 11/2024,
- The National Treasury gazetted the revenue and net expenditures for the eighth month of FY’2023/2024, ending 29th February 2024. Total revenue collected as at the end of February 2024 amounted to Kshs 1,424.9 bn, equivalent to 55.3% of the revised estimates of Kshs 2,576.8 bn for FY’2023/2024, and was 82.9% of the prorated estimates of Kshs 1,717.8 bn. Please see our Cytonn Weekly 11/2024, and,
- Ghanaian authorities and international bondholders were poised to engage in crucial talks that week to navigate the complexities of restructuring approximately USD 13.0 bn of defaulted global debt. This effort marked the start of formal talks to restructure Ghana’s debt to private international bondholders. Please see our Cytonn Weekly 11/2024.
- The Monetary Policy Committee (MPC) met on April 3, 2024, to review the outcome of its previous policy decisions against a backdrop of an improved global outlook for growth and inflation, despite persistent geopolitical tensions. The MPC decided to maintain the CBR at 13.00%, which was in line with our expectations. Please see our Cytonn Weekly #14/2024.
- Stanbic Bank released its monthly Purchasing Manager's Index (PMI) highlighting that the index for the month of March 2024 declined, coming in at 49.7, down from 51.3 in February 2024. Please see our Cytonn Weekly #14/2024.
- The Energy and Petroleum Regulatory Authority (EPRA) released their monthly statement on the maximum retail fuel prices in Kenya, effective from 15th April 2024 to 14th May 2024. Notably, the maximum allowed price for Super Petrol, Diesel and Kerosene decreased by Kshs 5.3, Kshs 10.0, and Kshs 18.7 each respectively, and will retail at Kshs 193.8, Kshs. 180.4 and Kshs 170.0 per litre respectively from the March 2024 prices of Kshs 199.2, Kshs 190.4 and Kshs 188.7 respectively. Please see our Cytonn Weekly #16/2024.
- The National Treasury gazetted the revenue and net expenditures for the ninth month of FY’2023/2024, ending 28th March 2024, highlighting that the total revenue collected as at the end of March 2024 amounted to Kshs 1,589.7 bn, equivalent to 61.7% of the revised estimates of Kshs 2,576.8 bn for FY’2023/2024 and is 82.3% of the prorated estimates of Kshs 1,932.6 bn.
- During the month of April, we released our projection for the the y/y inflation rate for April 2024 to come in at the range of 4% - 5.7% mainly on the back of reduced fuel prices in April, the maintenance of the Central Bank Rate at 13.0% in the latest MPC meeting and reduced electricity prices. Please see our Cytonn Weekly #17/2024.
- During the week, the Kenya National Bureau of Statistics (KNBS) released the year-on-year inflation, highlighting that inflation in April 2024 eased by 0.7% points to 5.0%, from the 5.7% recorded in March 2024. This was according to our expectations of a decline, but below our projections to within a range of 5.3% to 5.6%. Please see our Cytonn Weekly #17/2024.
- Stanbic Bank released its monthly Purchasing Manager's Index (PMI) highlighting that the index for the month of April 2024 improved slightly, coming in at 50.1, fractionally above the 50.0 neutral, up from 49.7 in March 2024, signaling a modest and softer improvement in operating conditions across Kenya. Please see our Cytonn Weekly 19/2024,
- The Energy and Petroleum Regulatory Authority (EPRA) released their monthly statement on the maximum retail fuel prices in Kenya, effective from 15th May 2024 to 14th June 2024. Notably, the maximum allowed price for Super Petrol, Diesel and Kerosene decreased by Kshs 1.0, Kshs 1.2, and Kshs 1.3 each respectively, and will retail at Kshs 192.8, Kshs 179.2 and Kshs 168.7 per litre respectively from the April 2024 prices of Kshs 193.8, Kshs 180.4 and Kshs 170.0 respectively. Please see our Cytonn Weekly 20/2024,
- The National Treasury gazetted the revenue and net expenditures for the tenth month of FY’2023/2024, ending 30th April 2024, highlighting that the total revenue collected as at the end of April 2024 amounted to Kshs 1,830.0 bn, equivalent to 71.0% of the revised estimates of Kshs 2,576.8 bn for FY’2023/2024 and is 85.2% of the prorated estimates of Kshs 2,147.3 bn. Please see our Cytonn Weekly 20/2024,
- The Kenya National Bureau of Statistics (KNBS) released the 2024 Economic Survey, highlighting that the Kenyan economy recorded a 5.6% growth in FY’2023, faster than the 4.9% growth recorded in FY’2022. The main contributor to Kenyan GDP remains to be the Agriculture, fishing and forestry sector which grew by 6.5% in FY’2023 compared to a contraction of 1.5% in FY’2022. All sectors in FY’2023, except Mining and Quarrying, recorded positive growths, with varying magnitudes across activities. Most sectors recorded improved growth compared to FY’2022, with Agriculture, Forestry and Fishing, Accommodation and Food Services and Real Estate Sectors recording the highest growth improvements of 7.9% points, 6.8% points, and 2.8% points, respectively. Please see our Cytonn Weekly 21/2024,
- The Kenya National Bureau of Statistics released the FY’2023 Economic Survey Report highlighting that Kenya’s balance of payments position improved by 46.4% in FY’2023, coming in at a deficit of Kshs 134.8 bn, from a deficit of Kshs 251.5 bn in FY’2022, and a slight deterioration from the Kshs 131.5 bn deficit recorded in Q3’2023. Please see our Cytonn Weekly 21/2024,
- the monetary policy committee met to review the outcome of its previous policy decisions against a backdrop of improved global outlook for growth, continued stickiness in inflation in advanced economies as well as the heightened geopolitical tensions. The MPC decided to maintain the CBR rate at 13.0%, which was in line with our expectation for the MPC to retain the CBR rate at 13.0%. Please see our Cytonn Weekly 23/2024,
- Stanbic Bank released its monthly Purchasing Manager's Index (PMI) highlighting that the index for the month of May 2024 improved slightly, coming in at 51.8, above the 50.0 neutral, up from 50.1 in April 2024, signaling a modest improvement in operating conditions across Kenya. Please see our Cytonn Weekly 23/2024,
- The International Monetary Fund (IMF) team and Kenyan authorities reached a staff-level agreement for the seventh reviews of Kenya’s economic program supported by the IMF’s Extended Fund Facility (EFF) and Extended Credit Facility (ECF), and the second Review under the Resilience Sustainability Facility (RSF). Notably, the discussions considered Kenya’s request for an augmentation under the EFF/ECF arrangement and the RSF, which if approved by the IMF executive board, will lead to a potential total commitment of more than USD 3.6 bn during the program's duration. Furthermore, the IMF team and Kenyan authorities agreed on a set of comprehensive policies and reforms needed to complete the seventh review, entailing corrective measures to safeguard debt sustainability, and fiscal discipline following a slip in FY’2023/24 budget, where the government in expected to miss out on its revenue targets. Please see our Cytonn Weekly 24/2024,
- The Energy and Petroleum Regulatory Authority (EPRA) released their monthly statement on the maximum retail fuel prices in Kenya, effective from 15th June 2024 to 14th July 2024. Notably, the maximum allowed price for Super Petrol, Diesel and Kerosene decreased by Kshs 3.0, Kshs 6.1 and Kshs 5.7 each respectively, and will retail at Kshs 192.8, Kshs. 179.2 and Kshs. 168.7 per litre respectively from the May 2024 prices of Kshs 189.8, Kshs. 173.1 and Kshs. 163.1 respectively. Please see our Cytonn Weekly 24/2024,
- The National Treasury gazetted the revenue and net expenditures for the eleventh month of FY’2023/2024, ending 31st May 2024, highlighting that the total revenue collected as at the end of May 2024 amounted to Kshs 2,025.6 bn, equivalent to 78.6% of the revised estimates of Kshs 2,576.8 bn for FY’2023/2024 and is 85.8% of the prorated estimates of Kshs 2,362.0 bn. Please see our Cytonn Weekly 24/2024,
Rates in the Fixed Income market have been on an upward trend given the continued high demand for cash by the government and the occasional liquidity tightness in the money market. The government closed the year 5.7% behind the total domestic net borrowing target of Kshs 589.3 bn for FY’2023/2024, having a net borrowing position of Kshs 555.6 bn as at the end FY’2023/24, mainly as a result of increasing the net domestic borrowing target to Kshs 589.3 bn from the earlier target of Kshs 474.5 bn. However, we expect a downward readjustment of the yield curve in the short and medium term, with the government looking to increase its external borrowing to maintain the fiscal surplus, hence alleviating pressure in the domestic market. As such, we expect the yield curve to normalize in the medium to long-term and hence investors are expected to shift towards the long-term papers to lock in the high returns.
Market Performance:
During Q2’2024, the equities market was on a downward trajectory, with NSE 20, NSE 25, NSE 10, and NASI declining by 5.5%, 3.8%, 3.3%, and 3.2%, respectively, taking the H1’2024 performance to gains of 22.6%, 19.8%, 19.0% and 9.8% for NSE 10, NSE 25, NASI, and NSE 20 respectively. The equities market performance during the quarter was driven by losses recorded by large caps such as DTB-K Group, Co-operative Bank, and BAT of 15.5%, 15.3%, and 14.7%, respectively. The losses were however mitigated by gains recorded by East African Breweries Limited (EABL), KCB Group, and ABSA Bank of 12.5%, 4.0%, and 0.4% respectively;
Equities turnover declined by 23.2% in H1’2024 to USD 384.2 mn, from USD 453.4 mn in H1’2023. Foreign investors became net buyers in H1’2024 with a net buying position of USD 6.6 mn, from a net selling position of USD 52.0 mn recorded in H1’2023.
During the week, the equities market was on a downward trajectory, with NSE 20, NASI, NSE 10, and NSE 25 declining by 4.3%, 2.9%, 2.6%, and 2.2%, respectively, taking the YTD performance to gains of 22.6%, 19.8%, 19.0% and 9.8% for NSE 10, NSE 25, NASI, and NSE 20 respectively. The equities market performance was mainly driven by losses recorded by large-cap stocks such as KCB Group, Safaricom, and Equity Group of 8.5%, 4.7%, and 2.6%, respectively. The losses were however mitigated by gains recorded by East African Breweries Limited (EABL), NCBA Group, and Stanbic Bank of 2.8%, 0.5%, and 0.4% respectively.
During the week, equities turnover declined by 25.5% to USD 6.9 mn from USD 9.3 mn recorded the previous week, taking the YTD turnover to USD 348.2 mn. Foreign investors became net sellers, with a net selling position of USD 1.1 mn, from a net buying position of USD 1.2 mn recorded the previous week, taking the YTD net selling position to USD 186.8 mn.
The market is currently trading at a price to earnings ratio (P/E) of 5.3x, 55.3% below the historical average of 11.9x, and a dividend yield of 8.0%, 3.5% points above the historical average of 4.5%. Key to note, NASI’s PEG ratio currently stands at 0.7x, an indication that the market is undervalued relative to its future growth. A PEG ratio greater than 1.0x indicates the market may be overvalued while a PEG ratio less than 1.0x indicates that the market is undervalued.
The charts below indicate the historical P/E and dividend yields of the market;
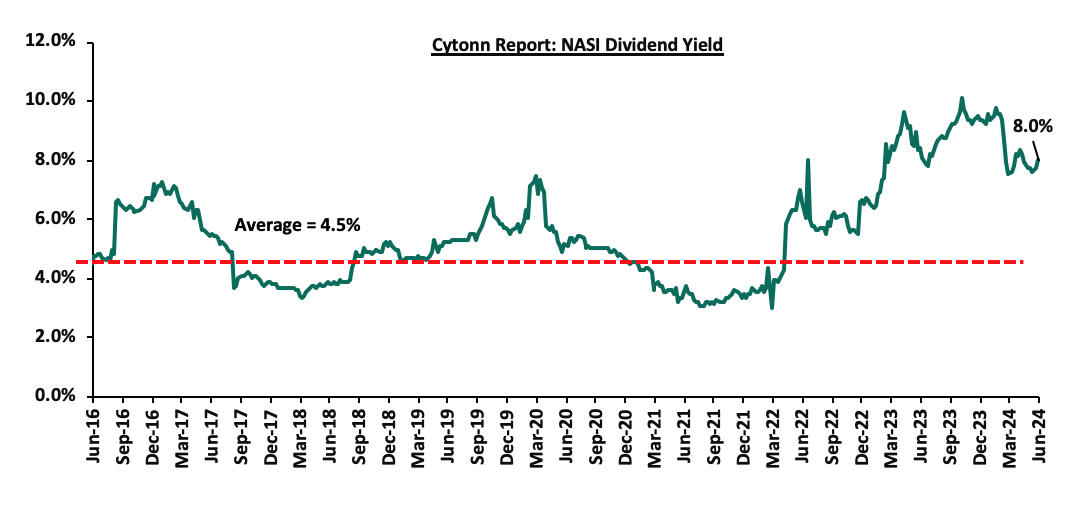
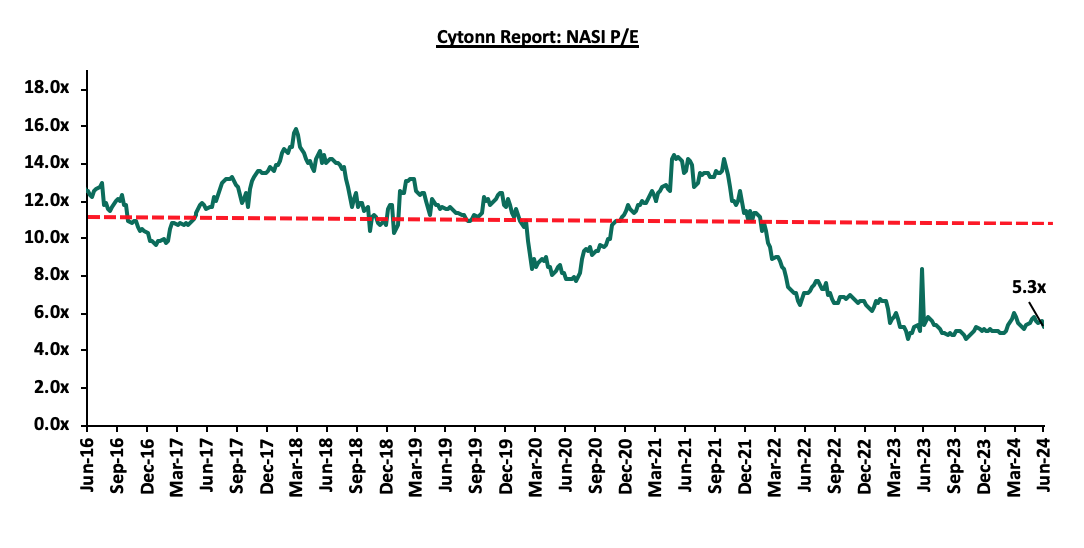
Listed Banks’ FY’2023 and Q1’2024 Performance
During the first half of 2024, the listed banking sector released their FY’2023 and Q1’2024 results, recording y/y earnings growth of 11.4% and 29.8% in their core EPS in FY’2023 and Q1’2024, respectively. For more information, please see our FY’2023 and Q1’2024 Banking Sector Reports.
Kenya Listed Insurance FY’2023 Performance
During the first half of 2024, the listed insurance sector released their FY’2023 results, recording weighted Core EPS growth of 116.0%, compared to a weighted growth of 377.4%, in FY’2022. The sustained growth in earnings was attributable to increased premiums during the period following continued recovery by the sector from the impacts of the COVID-19 pandemic, coupled with higher yields from government papers. For more information, please see our Kenya Listed Insurance FY’2023 Report.
Key Half-Year Highlights:
During the first half of 2023;
- East African Breweries Plc (EABL) released their H1’2024 financial results for the period ending 31st December 2023, recording a 22.1% decline in the Profits After Tax (PAT) to Kshs 6.8 bn in H1’2024, from Kshs 8.7 bn in H1’2023. The decline was mainly attributable to a 10.8% increase in Indirect Taxes to Kshs 52.5 bn in H1’2024, from Kshs 47.4 bn in H1’2023, coupled with the 36.6% increase in operating costs to Kshs 15.5 bn, from Kshs 11.3 bn in H1’2023 that offset the 13.8% growth in Gross Sales to Kshs 119.1 bn in H1'2024 from Kshs 104 bn in H1'2023. For more details, please see our Cytonn Weekly #04/2024,
- British American Tobacco Kenya Plc released their FY’2023 financial results, recording a 19.2% decline in Profits after Tax (PAT) to Kshs 5.6 bn, from Kshs 6.9 bn recorded in FY’2022. The decline in PAT was majorly attributed to the 2.4% decrease in Gross Sales to Kshs 41.2 bn in FY’2023 from Kshs 42.2 bn recorded in FY’2022. The performance was further weighed down by the 5.5% increase in indirect taxes to Kshs 15.7 bn in FY’2023, from Kshs 14.9 bn recorded in FY’2022 mainly driven by the upward revision of excise duty by 10.0% in July 2022 and a further 6.0% increment in October 2022. For more details, please see our Cytonn Weekly #07/2024,
- Kenya Electricity Generating Company released their H1’2023 financial results, recording a 9.2% decline in Profits after Tax (PAT) to Kshs 3.0 bn, from Kshs 3.3 bn recorded in H1’2022. The decline in PAT was majorly attributed to the 16.4% increase in operating expenses to Kshs 10.1 bn from Kshs 8.7 bn, coupled with the 25.7% increase in income tax to Kshs 1.9 bn in H1’2023 from Kshs 1.5 bn recorded in H1’2022. The performance was further weighed down by the 27.2% increase in finance costs to Kshs 1.9 bn in H1’2023, from Kshs 1.5 bn recorded in H1’2022. For more details, please see our Cytonn Monthly - February,
- Bamburi Cement Plc announced the successful completion of the sale of 1.3 mn ordinary shares in Hima Cement Limited, representing 70.0% of the total shares owned by Bamburi Cement Plc through its parent company Himcem Holdings Limited, to Sarrai Group Limited and Rwimi Holdings Limited. This milestone, following the approval by Bamburi’s shareholders in a virtual general meeting held on December 14, 2023, is a bid to divest from fragmented markets and concentrate in countries where it is among the biggest players. For a more detailed analysis, please see the Cytonn Weekly #10/2024,
- KCB Group Plc (KCB) announced that it had entered into a share purchase agreement with Access Bank on March 20, 2024, that would allow Access Bank Plc to acquire 100% shareholding in National Bank of Kenya Limited (NBK) from KCB. Key to note, KCB bank had acquired the National Bank of Kenya back in 2019 in a rescue deal that was supervised by the Central Bank of Kenya. For a more detailed analysis, please see the Cytonn Weekly #12/2024,
- The board of directors of Bamburi Cement Plc announced a profit warning for the FY’2023, anticipating a decrease of at least 25.0% in net earnings compared to 2022. This decline was primarily attributed to one-off settlements of tax liabilities and legal disputes, notably in Hima Cement Limited, impacting the overall financial performance. For more details please see our Cytonn Weekly #14/2024,
- The Central Bank of Kenya (CBK) announced the cancellation of Bank of Kigali's (BoK) authority to operate a Representative Office in Kenya, effective April 2, 2024. BoK, headquartered in Kigali and founded in 1966, opted for the voluntary termination of its Kenya presence as part of a strategic shift towards prioritizing digital service delivery channels. For more details please see our Cytonn Weekly #14/2024,
- Bamburi Cement Plc released their FY’2023 results, reporting a loss for the year of Kshs 0.4 bn, a significant 321.7% decline from the Kshs 0.2 bn profit after tax recorded in FY’2022. Profit from continued operations, however, increased by 160.7% to Kshs 0.7 bn from Kshs 0.3 bn recorded in FY’2022. Turnover increased by 6.3% to Kshs 22.0 bn from Kshs 20.7 bn in FY’2022, while total operating costs increased by 3.9% to Kshs 20.8 bn from Kshs 20.1 bn recorded in FY’2022. For more details please see our Cytonn Weekly #16/2024,
- Liberty Kenya Holdings released their FY’2023 results, having fully implemented the new IFRS 17 reporting system. Liberty Kenya Holdings’ Profit After Tax (PAT) increased by 151.0% to Kshs 0.7 bn, from Kshs 0.3 bn recorded in FY’2022, mainly driven by a 148.6% increase in Net insurance income to Kshs 0.9 bn, from Kshs 0.4 bn in FY’2022, and supported by a 41.6% decrease in Net insurance expenses to Kshs 0.3 bn, from Kshs 0.6 bn in FY’2022. For more details please see our Cytonn Weekly #16/2024,
- Sanlam Kenya Holdings released their FY’2023 results, recording a 52.6% increase in Loss After Tax to Kshs 0.13 bn, from Kshs 0.08 bn recorded in FY’2022. The performance was mainly driven by a significant 417.6% increase in Net Expense from reinsurance contracts held to Kshs 1.2 bn, from Kshs 0.2 bn in FY’2022, coupled with the 16.5% decline in insurance revenue to Kshs 6.9 bn from Kshs 8.3 bn in FY’2022. For more details, please see our Cytonn Weekly #17/2024,
- Stanbic Bank released their Q1’2024 financial results recording a 2.8% increase in Profit After Tax (PAT) to Kshs 4.0 bn, from Kshs 3.9 bn recorded in Q1’2023. The performance was mainly driven by a 19.6% increase in Net-Interest Income to Kshs 6.5 bn in Q1’2024, from Kshs 5.4 bn recorded in Q1’2023, but was weighed down by a 34.0% decrease in Non-Interest Income to Kshs 3.8 bn from Kshs 5.7 bn recorded in Q1’2023; For more details please see our Cytonn Weekly #19/2024,
- Safaricom released their FY’2024 financial results, recording a 16.8% increase in Earnings Before Interest, Taxes, Depreciation, and Amortization (EBITDA) to Kshs 163.3 bn, from Kshs 139.9 bn in FY’2023, while Profit After Tax (PAT) decreased by 18.7% to Kshs 42.7 bn, from Kshs 52.5 bn recorded in FY’2023. The performance was mainly driven by a 12.4% increase in total revenue to Kshs 349.4 bn in FY’2024, from Kshs 310.9 bn recorded in FY’2023. The performance was however weighed down by an 8.8% increase in operating costs to Kshs 186.2 bn in FY’2024, from Kshs 171.0 bn in FY’2023. For more details please see our Cytonn Weekly #19/2024,
- Co-operative Bank released their Q1’2024 Financial results, recording a 7.7% increase in Profit After Tax (PAT) to Kshs 6.6 bn, from Kshs 6.1 bn recorded in Q1’2023. The performance was mainly driven by an 8.6% increase in Net-Interest Income to Kshs 11.7 bn in Q1’2024, from Kshs 10.8 bn recorded in Q1’2023, but was weighed down by a marginal 0.3% decrease in Non-Interest Income to remain relatively unchanged at Kshs 7.1 bn recorded in Q1’2023, For more details please see our Cytonn Weekly #20/2024,
- Equity Group released their Q1’2024 Financial results, recording a 25.2% increase in Profit After Tax (PAT) to Kshs 16.0 bn, from Kshs 12.8 bn recorded in Q1’2023. The performance was mainly driven by a 28.4% increase in net interest income to Kshs 27.8 bn in Q1’2024, from Kshs 21.7 bn recorded in Q1’2023, coupled with a 21.0% increase in net non-interest income to Kshs 22.2 bn, from Kshs 18.4 bn recorded in Q1’2023, For more details please see our Cytonn Weekly #20/2024,
- CIC Group released their FY’2023 results. This was the second time the company was releasing their results under the new IFRS 17 reporting system. CIC’s Profit After Tax (PAT) increased by 817.6% to Kshs 1.4 bn, from Kshs 0.2 bn recorded in FY’2022. The performance was mainly driven by a 22.5% increase in Insurance revenue to Kshs 25.4 bn, from Kshs 20.7 bn in FY’2022, but was weighed down by the 21.2% increase in Insurance Expenses to Kshs 22.5 bn in FY’2023, from Kshs 18.6 bn in FY’2022. For more details please see our Cytonn Weekly #17/2024, and,
- KCB Group released its Q1’2024 financial results, with its Core Earnings per Share (EPS) increasing by 69.0% to Kshs 5.1, from Kshs 3.0 in Q1’2023. HF group released its Q1’2024 financial results, with its Core Earnings per Share (EPS) increasing by 80.4% to Kshs 0.4 bn, from Kshs 0.2 bn in Q1’2023. NCBA Group released its Q1’2024 financial results, with its Core Earnings per Share (EPS) increasing by 4.7% to Kshs 3.2, from Kshs 3.1 in Q1’2023. Lastly, I&M Group released its Q1’2024 financial results, with its Core Earnings per Share (EPS) increasing by 35.4% to Kshs 2.2, from Kshs 1.2 in Q1’2023. For more details please see our Cytonn Weekly #21/2024.
Universe of Coverage:
|
Cytonn Report: Equities Universe of Coverage |
|||||||||
|
Company |
Price as at 21/06/2024 |
Price as at 28/06/2024 |
w/w change |
YTD Change |
Target Price* |
Dividend Yield |
Upside/ Downside** |
P/TBv Multiple |
Recommendation |
|
Jubilee Holdings |
180.0 |
179.0 |
(0.6%) |
(3.2%) |
260.7 |
8.0% |
53.6% |
0.3x |
Buy |
|
Diamond Trust Bank*** |
46.3 |
46.5 |
0.4% |
3.9% |
65.2 |
10.8% |
51.0% |
0.2x |
Buy |
|
Equity Group*** |
43.4 |
42.3 |
(2.6%) |
23.5% |
60.2 |
9.5% |
52.0% |
0.8x |
Buy |
|
Sanlam |
6.0 |
5.9 |
(1.0%) |
(1.0%) |
8.8 |
0.0% |
48.4% |
1.7x |
Buy |
|
NCBA*** |
40.9 |
41.1 |
0.5% |
5.8% |
55.2 |
11.6% |
45.9% |
0.8x |
Buy |
|
Co-op Bank*** |
13.0 |
12.7 |
(2.3%) |
11.9% |
17.2 |
11.8% |
47.2% |
0.6x |
Buy |
|
Stanbic Holdings |
113.8 |
114.3 |
0.4% |
7.8% |
145.3 |
13.4% |
40.6% |
0.8x |
Buy |
|
KCB Group*** |
34.2 |
31.3 |
(8.5%) |
42.4% |
46.7 |
0.0% |
49.3% |
0.5x |
Buy |
|
Standard Chartered*** |
193.8 |
194.0 |
0.1% |
21.1% |
233.1 |
14.9% |
35.1% |
1.3x |
Buy |
|
ABSA Bank*** |
14.0 |
14.0 |
0.4% |
21.2% |
17.3 |
11.1% |
34.6% |
1.1x |
Buy |
|
CIC Group |
2.2 |
2.1 |
(2.3%) |
(7.0%) |
2.8 |
6.1% |
37.6% |
0.7x |
Buy |
|
Kenya Reinsurance |
2.8 |
1.4 |
(49.8%) |
(23.2%) |
3.5 |
21.1% |
167.6% |
0.1x |
Buy |
|
I&M Group*** |
21.5 |
21.6 |
0.5% |
23.5% |
25.5 |
11.8% |
30.2% |
0.4x |
Buy |
|
Britam |
6.0 |
6.0 |
0.7% |
17.5% |
7.5 |
0.0% |
24.2% |
0.8x |
Buy |
|
Liberty Holdings |
5.8 |
5.3 |
(8.9%) |
37.3% |
6.1 |
7.0% |
22.1% |
0.4x |
Buy |
|
HF Group |
4.1 |
4.0 |
(2.2%) |
16.8% |
4.5 |
0.0% |
11.7% |
0.2x |
Accumulate |
|
*Target Price as per Cytonn Analyst estimates **Upside/ (Downside) is adjusted for Dividend Yield ***For Disclosure, these are stocks in which Cytonn and/or its affiliates are invested in |
|||||||||
We are “Neutral” on the Equities markets in the short term due to the current tough operating environment and huge foreign investor outflows, and, “Bullish” in the long term due to current cheap valuations and expected global and local economic recovery. With the market currently being undervalued for its future growth (PEG Ratio at 0.7x), we believe that investors should reposition towards value stocks with strong earnings growth and that are trading at discounts to their intrinsic value. We expect the current foreign investors’ sell-offs to continue weighing down the equities outlook in the short term.
In H1’2024, Kenya’s Real Estate sector recorded notable growth in terms of activity compared to the similar period in 2023, attributable to various factors. Some of the key factors that have continued to shape the performance of the Real Estate sector include;
- The Kenyan government has continued to put its best foot forward towards delivering affordable housing to its citizens. Currently, the AHP pipeline boasts an estimated total of 746,795 housing units under construction by both the government and private sector,
- In general, infrastructure development continues to be a factor supporting the growth of the Real Estate sector through opening up areas for Real Estate investments. The government has continually prioritized infrastructural development in efforts aimed at positioning the country as a regional hub through the implementation of several key projects including, Makupa Bridge, Nairobi Expressway, Nairobi Western and Eastern Bypasses among others. Notable projects expected to be delivered in 2024 include phase two of the Dongo Kundu bypass project,
- Kenya Mortgage Refinance Company (KMRC) has continued to drive the availability and affordability of home loans to Kenyans by providing single-digit fixed rate, and long-term finance to Primary Mortgage Lenders (PMLs) such as banks and SACCOs. As at August 2023, KMRC had disbursed Kshs 7.2 bn to nine PMLs,
- The retail sector has continued to grow, with both local and international retailers such as Naivas, QuickMart, China Square, and Carrefour pursuing aggressive expansion strategies in a bid to increase their dominance in the market, and replace distressed and exited retailers such as Choppies, Nakumatt, Tuskys, and Uchumi. Additionally, the continued entry and expansions witnessed by global retail brands into the country such as Adidas, Puma, Aldo, Micheal Kors among others is expected to further promote the sector’s performance,
- Kenya continues to enjoy recognition as a regional business hub. As a result, foreign entities have continued to open business operations in Kenya, boosting the demand for both commercial and residential Real Estate. Increased business activity has driven up demand for office space, apartments, and housing near business hubs, leading to the development of new projects, increased property values, and job creation in the construction sector,
- With relatively high urbanization and population growth rates of 3.7% p.a and 2.0% p.a, respectively, against the global average of 1.7% p.a and 0.9% p.a, respectively, as at 2023, there is a sustained demand for more housing units in the country, and Real Estate in general,
- The hospitality sector has seen resumed investor confidence evidenced by positive volumes in hotel mergers, expansions, and acquisitions. Furthermore, the number of international arrivals into the country registered a 4.6% year-to-year (y/y) increase to 134,665 persons as of January 2024 from 128,772 arrivals recorded in January 2023. Notably, the Hotel Chain Development Pipelines in Africa 2024 Report ranks Nairobi at 7th position by planned number of hotels and rooms with 31 hotels and 4,268 rooms in the pipeline, and,
- The alternatives market, particularly the rising popularity of purpose-built student residences, health and data centers, and consular housing, presents a promising avenue for the growth of the sector in 2024. These asset classes have positioned the sector to remain resilient in a rapidly evolving economic and technological landscape.
However, some of the challenges impeding the performance of the sector include;
- Rising construction costs which increased by 27.0% in 2023 to an average of Kshs 71,200 per SQM from an average of Kshs 56,075 per SQM recorded in 2022. The rise is primarily due to the hike in prices of key construction materials such as cement, steel, paint, aluminum, and PVC on the back of rising inflation. These higher costs are expected to impede development activities in the sector,
- Existing oversupply of physical space in select sectors. With approximately 5.8 mn SQFT in the NMA commercial office market, approximately 3.0 mn SQFT in the Nairobi Metropolitan Area (NMA) retail market, with the rest of the Kenyan retail market having an oversupply of approximately 1.7 mn SQFT. This has led to prolonged vacancy rates in the respective Real Estate sectoral themes,
- The REITs market in Kenya continues to be subdued owing to various challenges such as the large capital requirements of Kshs 100.0 mn for trustees which limits the role to banks, prolonged approval process for REITs, only a few legal entities capable of incorporating REITs, high minimum investment amounts set at Kshs 5.0 mn which discourage investments and lack of adequate knowledge of the financial asset class by investors,
- Tough micro-economic conditions including rising interest rates have led to expensive borrowing, further dampening demand for mortgages and lending to developers,
- Constrained financing to developers as lenders continue to tighten their lending requirements and demand more collateral from developers as a result of the high credit risk in the real estate sector. This is evidenced by a 26.7% increase in gross Non-Performing Loans (NPLs) in the Real Estate sector reaching Kshs 101.7 mn in Q4’2023, up from Kshs 80.3 mn recorded in Q4’2022, and,
- Underdeveloped capital markets compound difficulties for developers in realizing pools of capital focused on projects, particularly in the private markets, to supplement government efforts in providing housing. Banks in Kenya are the primary source of funding for real estate developers, providing nearly 95.0% of funding as opposed to 40.0% in developed countries. This means that capital markets contribute only 5.0% of Real Estate development funding, compared to 60.0% in developed countries as shown below;
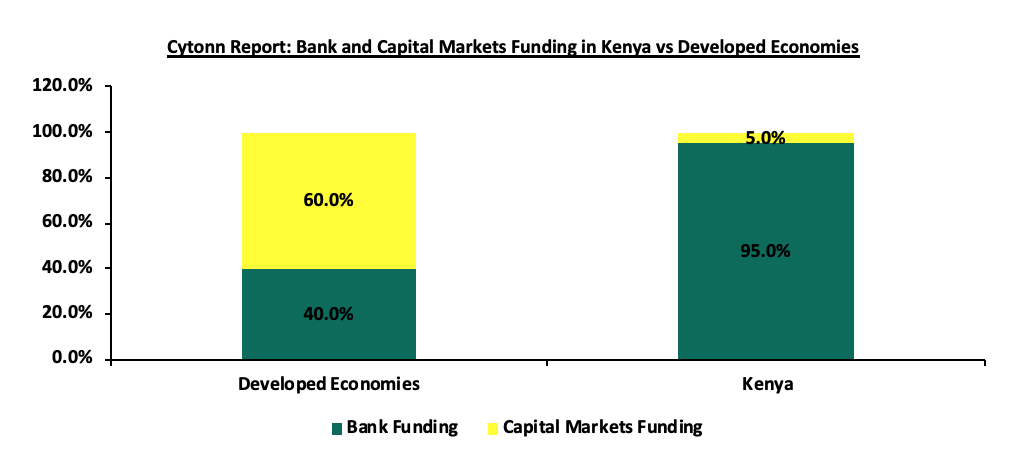
Source: World Bank, Capital Markets Authority (CMA)
Sectoral Market Performance:
- Residential Sector
During H1’2024, the NMA residential sector recorded a slight downturn in performance, with the average total returns coming in at 5.9%, a 0.2%-point decline from 6.1% recorded in H1’2023. The performance was primarily attributed to a decrease in the residential average y/y price appreciation which came in at 0.6% in H1’2024, 0.4%-points lower than the 1.0% appreciation recorded in H1’2023, mainly driven by reduced property transactions during the period under review. On the other hand, the average rental yield came in at 5.4% in H1’2024, recording a 0.3%-points increase from the 5.1% rental yield recorded in H1’2023. The table below shows the NMA residential sector’s performance during H1’2024 and H1’2023;
|
All values in Kshs unless stated otherwise |
||||||||||||
|
Cytonn Report: Nairobi Metropolitan Area (NMA) Residential Sector Summary - H1’2024/H1’2023 |
||||||||||||
|
Segment |
Average of Price per SQM H1'2024 |
Average of Rent per SQM H1'2024 |
Average of Rental Yield H1'2024 |
Average of Price Appreciation H1'2024 |
Average of Total Returns H1'2024 |
Average of Rental Yield H1'2023 |
Average of Price Appreciation H1'2023 |
Average of Total Returns H1'2023 |
y/y change in Rental Yield (% Points) |
y/y change in Price Appreciation (% Points) |
y/y change in Total Returns (% Points) |
|
|
Detached Units |
||||||||||||
|
High End |
209,036 |
851 |
5.1% |
0.4% |
5.5% |
4.6% |
1.2% |
5.8% |
0.5% |
(0.8%) |
(0.3%) |
|
|
Upper Middle |
145,840 |
638 |
5.0% |
0.4% |
5.4% |
4.5% |
1.1% |
5.6% |
0.5% |
(0.7%) |
(0.2%) |
|
|
Lower Middle |
80,919 |
353 |
4.8% |
1.1% |
6.0% |
4.7% |
1.2% |
5.9% |
0.1% |
(0.1%) |
(0.1%) |
|
|
Detached Units Average |
145,265 |
614 |
4.9% |
0.6% |
5.6% |
4.6% |
1.2% |
5.8% |
0.3% |
(0.5%) |
(0.2%) |
|
|
Apartments |
||||||||||||
|
Upper Mid-End |
131,811 |
698 |
5.7% |
0.3% |
6.0% |
5.2% |
0.3% |
5.5% |
0.5% |
0.0% |
0.5% |
|
|
Lower Mid-End Suburbs |
95,189 |
468 |
5.3% |
0.6% |
5.9% |
5.7% |
0.7% |
6.4% |
(0.4%) |
(0.1%) |
(0.5%) |
|
|
Lower Mid-End Satellite Towns |
81,280 |
464 |
6.3% |
0.5% |
6.8% |
5.5% |
1.4% |
6.3% |
0.8% |
(0.9%) |
0.5% |
|
|
Apartments Average |
102,760 |
543 |
5.8% |
0.5% |
6.2% |
5.5% |
0.8% |
6.3% |
(0.3%) |
(0.3%) |
(0.1%) |
|
|
Residential Market Average |
124,012 |
579 |
5.4% |
0.6% |
5.9% |
5.1% |
1.0% |
6.1% |
0.0% |
(0.4%) |
(0.2%) |
|
- Detached Units Performance
The table below shows the NMA residential sector detached units’ performance during H1’2024;
|
All values are in Kshs unless stated otherwise |
||||||||
|
Cytonn Report: Residential Detached Units Summary H1’2024 |
||||||||
|
Area |
Average of Price per SQM H1'2024 |
Average of Rent per SQM H1'2024 |
Average of Occupancy H1'2024 |
Average of Uptake H1'2024 |
Average of Annual Uptake H1'2024 |
Average of Rental Yield H1'2024 |
Average of Price Appreciation H1'2024 |
Total Returns |
|
High End |
||||||||
|
Karen |
195,810 |
771 |
91.9% |
93.4% |
12.3% |
4.5% |
1.1% |
5.7% |
|
Rosslyn |
195,017 |
902 |
92.9% |
98.2% |
11.2% |
5.5% |
0.2% |
5.7% |
|
Runda |
267,283 |
1,043 |
96.9% |
97.8% |
8.9% |
5.4% |
0.2% |
5.6% |
|
Kitisuru |
229,485 |
884 |
91.3% |
95.0% |
10.5% |
5.0% |
0.2% |
5.2% |
|
Lower Kabete |
157,585 |
656 |
97.6% |
90.3% |
10.2% |
4.9% |
0.3% |
5.2% |
|
Average |
209,036 |
851 |
94.1% |
94.9% |
10.6% |
5.1% |
0.4% |
5.5% |
|
Upper Middle |
||||||||
|
Loresho |
151,595 |
807 |
90.6% |
90.6% |
10.6% |
5.7% |
0.2% |
5.9% |
|
Ridgeways |
176,696 |
871 |
87.5% |
88.3% |
9.7% |
5.4% |
0.3% |
5.8% |
|
Redhill & Sigona |
99,472 |
478 |
91.3% |
97.0% |
10.8% |
5.3% |
0.3% |
5.6% |
|
Lavington |
187,111 |
682 |
90.7% |
93.1% |
9.8% |
4.2% |
1.2% |
5.3% |
|
Runda Mumwe |
164,012 |
712 |
91.1% |
96.2% |
0.0% |
5.3% |
0.1% |
5.3% |
|
Langata |
121,539 |
450 |
91.1% |
87.1% |
7.6% |
4.2% |
0.8% |
5.0% |
|
South B/C |
120,456 |
469 |
91.3% |
86.3% |
10.6% |
4.7% |
0.1% |
4.8% |
|
Average |
145,840 |
638 |
90.5% |
91.2% |
8.4% |
5.0% |
0.4% |
5.4% |
|
Lower Middle |
||||||||
|
Thika |
64,075 |
306 |
91.1% |
90.2% |
11.9% |
6.0% |
0.8% |
6.7% |
|
Ngong |
76,947 |
379 |
97.1% |
93.5% |
10.2% |
5.2% |
1.5% |
6.7% |
|
Athi River |
86,338 |
384 |
87.8% |
93.5% |
9.8% |
5.1% |
1.3% |
6.3% |
|
Kitengela |
65,697 |
280 |
90.6% |
90.4% |
10.7% |
5.1% |
1.0% |
6.1% |
|
Ruiru |
64,509 |
339 |
87.5% |
82.8% |
12.0% |
5.4% |
0.6% |
6.0% |
|
Donholm & Komarock |
93,581 |
401 |
87.5% |
88.1% |
9.9% |
4.6% |
1.3% |
5.9% |
|
Syokimau/ Mlolongo |
75,716 |
382 |
89.0% |
91.6% |
11.2% |
4.4% |
1.3% |
5.7% |
|
Rongai |
87,626 |
298 |
96.9% |
95.6% |
11.5% |
4.6% |
0.9% |
5.5% |
|
Juja |
96,942 |
361 |
88.9% |
92.2% |
11.1% |
3.9% |
1.1% |
5.0% |
|
Average |
80,919 |
353 |
90.7% |
91.0% |
10.8% |
4.8% |
1.1% |
6.0% |
|
Detached Grand Average |
145,265 |
614 |
91.8% |
92.4% |
9.9% |
4.9% |
0.6% |
5.6% |
Source: Cytonn Research
The Key take-outs from the table include;
- Average Total Returns - The average total returns came in at 5.6%, translating to 0.2% points decrease from the 5.8% recorded in H1’2023. However, rental yields came in at 4.9%, representing a 0.3%-point increase from the 4.6% recorded in H1’2023. The improved performance is attributable to an increase in selling and rental prices per SQM at Kshs 145,365 and Kshs 614, respectively, from Kshs 133,077 and Kshs 546, respectively recorded in H1’2023,
- Segment Performance- The best performing segment was the lower-middle segment with an average total return of 6.0%, attributable to relatively high rental yields of 4.8%, which is driven by returns from well-performing nodes such as Ngong and Thika which posted relatively high returns at 6.7%, and,
- Nodal Performance – Overall, Ngong and Thika were the best-performing nodes, both offering the highest returns at 6.7%, which is 1.3% points higher than the detached market average of 5.6%, driven by a relatively high year-on-year price appreciation of 1.5% and 0.8% respectively. Ngong is witnessing major development supported by its close proximity to the CBD and enhanced connectivity via Ngong Road. Thika is also experiencing high housing demand due to its accessibility to the CBD and affordability, with the average price per SQM Kshs 64,074, relatively lower compared to the market average of Kshs 80,919 per SQM. Athi River followed with an average total return of 6.3%, which is 0.7 percentage points higher than the detached market average of 5.6%
- Apartments Performance
The table below shows the NMA residential sector apartments’ performance during H1’2024;
|
All values are in Kshs unless stated otherwise |
||||||||
|
Cytonn Report: Residential Apartments Summary H1'2024 |
||||||||
|
Area |
Average of Price per SQM H1'2024 |
Average of Rent per SQM Q1'2024 |
Average of Occupancy H1'2024 |
Average of Uptake H1'2024 |
Average of Annual Uptake H1'2024 |
Average of Rental Yield H1'2024 |
Average of Price Appreciation FY'2023 |
Total Returns |
|
Upper Mid-End |
||||||||
|
Westlands |
166,935 |
993 |
90.2% |
92.1% |
15.7% |
6.4% |
0.4% |
6.8% |
|
Kilimani |
113,708 |
661 |
90.2% |
92.0% |
15.5% |
6.4% |
0.3% |
6.7% |
|
Parklands |
125,887 |
634 |
95.0% |
94.7% |
10.8% |
5.8% |
0.3% |
6.1% |
|
Kileleshwa |
133,779 |
755 |
89.4% |
92.9% |
11.5% |
6.0% |
0.0% |
6.0% |
|
Loresho |
124,054 |
536 |
91.7% |
80.0% |
7.0% |
4.7% |
1.0% |
5.7% |
|
Upperhill |
126,501 |
607 |
88.8% |
90.0% |
11.3% |
5.1% |
0.0% |
5.1% |
|
Average |
131,811 |
698 |
90.9% |
90.3% |
12.0% |
5.7% |
0.3% |
6.0% |
|
Lower Mid-End Suburbs |
||||||||
|
Race Course /Lenana |
101,019 |
605 |
86.4% |
93.2% |
13.6% |
5.9% |
0.5% |
6.4% |
|
South C |
118,617 |
515 |
91.9% |
96.2% |
14.0% |
4.9% |
1.4% |
6.3% |
|
Dagoretti |
90,065 |
432 |
89.3% |
84.8% |
11.7% |
5.8% |
0.1% |
6.0% |
|
South B |
111,549 |
529 |
93.0% |
98.0% |
13.0% |
5.3% |
0.6% |
5.9% |
|
Waiyaki Way |
90,241 |
490 |
91.3% |
85.9% |
13.6% |
5.0% |
0.9% |
5.9% |
|
Donholm & Komarock |
79,537 |
384 |
94.0% |
96.0% |
10.0% |
5.5% |
0.3% |
5.7% |
|
Kahawa West |
74,611 |
378 |
88.3% |
93.8% |
8.1% |
5.1% |
0.6% |
5.7% |
|
Langata |
109,772 |
532 |
91.5% |
89.5% |
10.0% |
5.2% |
0.4% |
5.6% |
|
Imara Daima |
81,289 |
347 |
95.9% |
88.9% |
9.4% |
5.1% |
0.4% |
5.5% |
|
Average |
95,189 |
468 |
91.3% |
91.8% |
11.5% |
5.3% |
0.6% |
5.9% |
|
Lower Mid-End Satellite Towns |
||||||||
|
Ngong |
77,542 |
511 |
89.5% |
89.3% |
12.1% |
7.8% |
0.9% |
8.7% |
|
Athi River |
60,042 |
393 |
90.6% |
95.3% |
11.3% |
7.2% |
1.1% |
8.3% |
|
Rongai |
55,908 |
329 |
87.0% |
87.4% |
14.6% |
6.4% |
0.5% |
6.9% |
|
Thindigua |
105,983 |
554 |
90.4% |
88.3% |
13.2% |
5.8% |
0.8% |
6.6% |
|
Ruaka |
111,508 |
648 |
90.5% |
90.0% |
12.8% |
6.2% |
0.3% |
6.4% |
|
Syokimau |
68,079 |
340 |
87.5% |
90.8% |
9.8% |
5.4% |
0.9% |
6.3% |
|
Kikuyu |
82,306 |
435 |
92.3% |
95.5% |
15.0% |
5.6% |
0.4% |
6.0% |
|
Ruiru |
88,872 |
502 |
85.2% |
86.4% |
12.4% |
5.8% |
0.8% |
5.0% |
|
Average |
81,280 |
464 |
89.1% |
90.4% |
12.6% |
6.3% |
0.5% |
6.8% |
|
Apartment Grand Average |
102,760 |
543 |
90.4% |
90.8% |
12.0% |
5.8% |
0.5% |
6.2% |
Source: Cytonn Research
The key take-outs from the table include;
- Average Total Returns – The average total return came in at 6.2%, 0.1% points decrease from 6.3% registered in H1’2023. In H1’2024 the average selling and rental prices remained stable at Kshs 102,760 per SQM and Kshs 543 per SQM respectively, from Kshs 114,336 per SQM and Kshs 533 per SQM recorded in H1’2023 respectively. Average rental yields came in at 5.8%, 0.3% higher than the 5.5% recorded in H1’2023 driven by a 4.4% increase in occupancy to 90.4% in H1’2024, from 86.0% recorded in H1’2023,
- Segment Performance – The best performing segment was the lower mid-end satellite towns with average total return of 6.8%, attributed to average rental yield of 6.3% and relatively high price appreciation of 0.5%. The segment's performance is boosted by nodes such as Ngong and Athi River, which have become highly attractive for investment, and,
- Nodal Performance – Ngong was the best performing node with total average returns of 8.7%, attributable to a relatively high rental yield of 7.8% and y/y price appreciation of 0.9%. The nodes performance is attributable to enhanced accessibility by the Ngong Road, presence of Malls such as Ngong Milele Mall, enhanced proximity to Ngong Hills and Amboseli National Park makes gives the area more ambience and makes it more attractive to set up a residential property. On the other hand, Athi River and Rongai followed closely, offering investors average total returns of 8.3% and 6.9% respectively, compared to the apartments market average of 6.2%.
For more notable highlights during the H1’2024 please see our Q1’2024 Markets Review report
Our outlook for the NMA residential sector remains NEUTRAL, as we foresee increased activity from industry participants. The sector is expected to benefit from: i) housing demand fuelled by population growth and high urbanization rates, and ii) government infrastructure development projects, iii) government initiatives, particularly the Affordable Housing Agenda which is being rolled out countrywide. However, growth in the sector remains hindered by rising construction costs, a challenging macroeconomic climate, and limited financing options for developers.
- Commercial Office Sector
The table below highlights the performance of the Nairobi Metropolitan Area (NMA) Commercial Office sector over time;
|
Cytonn Report: Nairobi Metropolitan Area (NMA) Commercial Office Returns Over Time |
|||||||
|
Year |
Q1'2023 |
H1'2023 |
Q3'2023 |
FY'2023 |
Q1'2024 |
H1'2024 |
∆ H1'2023/H1'2024 |
|
Occupancy % |
79.8% |
80.8% |
79.9% |
80.3% |
80.1% |
80.1% |
(0.6%) |
|
Asking Rents (Kshs/SQFT) |
97 |
98 |
100 |
103 |
103 |
103 |
4.5% |
|
Average Prices (Kshs/SQFT) |
12,238 |
12,238 |
12,265 |
12,673 |
12,665 |
12,677 |
3.5% |
Source: Cytonn Research
The key take-outs from the table include
- Average Asking Rents – In H1’2024, average asking rents per SQFT in the NMA increased by 4.5% to Kshs 103 from Kshs 98 in H1’2023. We attribute this increase to the rise in supply of Grade A offices in the market during the review period. New Grade A offices added to the pipeline during this period include CCI Kenya Call Centre Offices in Tatu City, Karen Green, The Cube, and the Piano, thereby driving up the asking prices for commercial office spaces. Additionally, landlords remained cautious and monitored the performance of the Kenyan currency, anchoring rent prices in dollar terms, which increased asking rents, particularly in FY’2023. This strategy may slow down as the Kenyan Shilling continues to perform well against major currencies, including the US dollar,
- Average Occupancy Rate – In H1’2024, commercial office occupancy showed a slight decrease of 0.6% points to 80.1% from 80.8% recorded in H1’2023. This decrease can be attributed to the increased supply of new office spaces in the market. Additionally, the shift towards serviced offices, which are now seen as more convenient compared to traditional commercial offices, has contributed to this trend. On a quarter-on-quarter basis, occupancy remained stable at 80.1%, reflecting limited activity in the segment, especially in Q2’2024, and,
- Average Rental Yield – The average rental yield remained stable on q/q basis. On a y/y basis the performances declined slightly due to a slight decrease in occupancy.
For submarket performance, Westlands emerged as the top performer, achieving an average rental yield of 8.5% in FY’2023, surpassing the market average of 7.7%. Gigiri and Karen also performed strongly, with rental yields of 8.2% and 8.0%, respectively. This performance can be attributed to several factors: (i) a high concentration of Grade A offices, (ii) robust infrastructure developments such as roads, (iii) proximity to residential areas, (iv) increasing demand for high-quality offices driven by embassies, international organizations, and multinational companies, and (v) availability of after-work amenities like hotels and quality social venues. In contrast, Mombasa Road was the least performing node with an average rental yield of 6.0% in Q1’2024, 1.7% points lower than the market average of 7.7%. This lower performance can be attributed to: i) its reputation as an industrial center, which diminishes its appeal to office businesses aiming to attract clients, ii) the general perception that the area is less ideal for businesses, (iii) intense competition from other neighbourhoods such as the CBD and Upperhill, and (iv) offices of relatively lower quality, which are perceived as less attractive and thus command lower rents, as evidenced by a 72.2% occupancy rate compared to the market average of 80.1%. The table below displays the performance of sub-markets in the Nairobi Metropolitan Area (NMA);
|
All Values are in Kshs unless stated otherwise |
||||||||||||
|
Cytonn Report: NMA Commercial Office Submarket Performance H1'2024 |
||||||||||||
|
Area |
Price/SQFT H1'2024 |
Rent/SQFT H1'2024 |
Occupancy H1'2024 |
Rental Yields H1'2024 |
Price/SQFT H1'2023 |
Rent/SQFT H1'2023 |
Occupancy H1'2023 |
Rental Yields H1'2023 |
∆ in Rent |
∆ in Occupancy (% points) |
∆ in Rental Yields (% points) |
|
|
Westlands |
12,495 |
118 |
76.3% |
8.5% |
12032 |
110 |
78.2% |
8.6% |
7.9% |
(1.9%) |
(0.1%) |
|
|
Gigiri |
15,000 |
128 |
80.2% |
8.2% |
13,500 |
118 |
81.8% |
8.7% |
8.5% |
(1.6%) |
(0.5%) |
|
|
Karen |
14,254 |
118 |
80.5% |
8.0% |
13,431 |
118 |
83.5% |
8.8% |
(0.1%) |
(3.0%) |
(0.8%) |
|
|
Kilimani |
13,051 |
100 |
83.2% |
7.8% |
12,260 |
93 |
84.6% |
8.0% |
7.2% |
(1.4%) |
(0.2%) |
|
|
Parklands |
11,875 |
92 |
84.0% |
7.8% |
11,662 |
93 |
83.6% |
8.1% |
(1.7%) |
0.3% |
(0.3%) |
|
|
Nairobi CBD |
12,147 |
92 |
85.6% |
7.8% |
11,971 |
87 |
85.0% |
7.6% |
5.2% |
0.6% |
0.2% |
|
|
Upperhill |
13,014 |
100 |
73.2% |
6.3% |
12,605 |
97 |
78.8% |
7.3% |
3.6% |
(5.6%) |
(0.9%) |
|
|
Thika Road |
12,571 |
79 |
80.4% |
6.0% |
12,571 |
79 |
80.1% |
6.0% |
0.0% |
0.3% |
0.0% |
|
|
Mombasa Road |
11,325 |
79 |
72.2% |
6.0% |
11,325 |
71 |
67.9% |
5.2% |
10.1% |
4.3% |
0.8% |
|
|
Average |
12,677 |
103 |
80.1% |
7.7% |
12,238 |
98 |
80.8% |
7.9% |
4.5% |
(0.6%) |
(0.2%) |
|
Source: Cytonn Research
Notable highlights in H1’2024 include (please see our Q1’2024 Markets Review report);
- Two Rivers International Finance & Innovation Centre (TRIFIC) announced that it has secured an investment of Kshs 6.0 bn from Vantage Capital; an African mezzanine finance investor. The funding will be utilized to fit out its first office tower, the TRIFIC North Tower, occupying 14,975 SQM in the Two Rivers. Additionally, Kenya’s National Social Security Fund (NSSF) and Tanzania’s Ministry of Foreign Affairs, in a joint real estate investment, launched the construction of Twin Towers in Upper Hill, Nairobi. Each tower will consist of 22 floors and will accommodate commercial offices and residential spaces. For more information, please see our Cytonn Weekly #25/2024
Our outlook for the NMA commercial office sector remains NEUTRAL, influenced by several factors: i) the growing presence of multinational corporations in the country, which is expected to boost occupancy rates, ii) the increasing popularity of co-working spaces, and iii) a decrease in new developments in 2023, which we believe will help mitigate the current oversupply issue. However, the sector’s performance will be constrained by the persistent oversupply of office space, totaling 5.8 mn SQFT in the NMA. Investment opportunities are notable in Westlands, Gigiri, and Karen, as these areas offer relatively higher returns compared to the market average
- Retail Sector
The table below shows the performance of the retail sector performance in Nairobi Metropolitan Area from Q1’2023 to H1’2024;
|
(All values in Kshs unless stated otherwise) |
|||||||
|
Cytonn Report: Summary of Retail Sector Performance in Nairobi Metropolitan Area Q1’2023 - H1’2024 |
|||||||
|
Item |
Q1’2023 |
H1’2023 |
Q3'2023 |
FY'2023 |
Q1’2024 |
H1’2024 |
Y/Y 2024 ∆ |
|
Average Asking Rents (Kshs/SQFT) |
176 |
177 |
182 |
182 |
180 |
185 |
4.7% |
|
Average Occupancy (%) |
78.0% |
79.2% |
78.7% |
79.8% |
79.3% |
79.5% |
0.2% |
|
Average Rental Yields |
8.0% |
8.2% |
8.2% |
8.3% |
8.1% |
7.9% |
(0.2%) |
Source: Cytonn Research
The key take-outs from the table include;
- Average Occupancy Rate – During H1’2024, the retail sector experienced a slight increase in average occupancy rates, rising by 0.2% points to reach 79.5%, up from 79.2% in the same period of 2023. This growth can be attributed to several key factors: i) active expansion efforts by both domestic and international retailers, including Naivas, Jaza Stores, QuickMart, Carrefour, China Square, and Panda Mart, ii) emergence of new shopping complexes such as Business Bay Square (BBS) Mall in Eastleigh, which has attracted numerous smaller retailers, filling essential retail spaces, iii) sustained demand for consumer goods and services, driven by favorable demographic trends, iv) adaptation to changing market dynamics, with initiatives like Jaza Stores and Carrefour facilitating online purchases through platforms like WhatsApp, meeting evolving consumer preferences, v) continuous infrastructure development that has not only enhanced existing retail spaces but also opened up new areas for retail growth, expanding the sector's reach,
- Asking Rents – In H1’2024, average rental rates per square foot saw a significant rise, increasing by 4.7% to Kshs 185, up from Kshs 177 in H1’2023. Several key factors contributed to this sharp increase: i) the introduction of high-end retail spaces like the Global Trade Centre (GTC) mall and Business Bay Square (BBS) Mall, which commanded higher rents due to their superior offerings, ii) continued demand for premium retail spaces in strategic areas within the Nairobi Metropolitan Area (NMA), including Karen, Kilimani, Westlands, and along Kiambu and Limuru roads. These areas, known for their quality offerings, attracted local and foreign businesses seeking proximity to multinational organizations and embassies, catering to an international clientele, iii) the entry of renowned global brands like Adidas, Puma, Michael Kors, and Aldo into the Kenyan market, competing for prime retail spaces and driving up rental rates, iv) property owners in sought-after locations opting for rental transactions quoted in dollars amidst the depreciation of the Kenyan currency against the dollar in 2023. This shift to dollar-denominated rents significantly contributed to the increase in rental prices across these regions, driven by the combination of foreign business interest and currency dynamics, and,
- Average Rental Yield- The average rental yield for the NMA retail sector declined slightly by 0.2%-points to 7.9% in H1’2024, from 8.2% in H1’2023, as a result of almost similar increases in rental rates and sale prices. However, while rental rates rose by 4.7%, the sale prices increased by 4.1% to Kshs 21,381 from Kshs 20,543 in H1’2023.
In terms of sub-market performance, Kilimani, Karen, and Kiambu Road & Limuru Road displayed impressive average rental yields of 9.7%, 9.3%, and 9.0%, respectively, surpassing the overall market average of 7.9%. This robust performance was primarily driven by the increased demand for retail offerings in these locations, the presence of premium retail spaces commanding higher rents, and the provision of quality infrastructure services that enhance attractiveness for both tenants and customers. Conversely, retail spaces in Eastlands reported the lowest average rental yield at 6.4%, influenced by several factors: i) rental rates in Eastlands were significantly below the market average of Kshs 180 per SQFT, standing at Kshs 146 per SQFT due to the prevalence of lower-quality spaces in the region, ii) inadequate infrastructure across most towns within the region, hindering accessibility and sustainability for retail spaces, and, iii) the prevalence of informal retail spaces and service stations, offering competitive rates and diverse amenities, intensified market competition and impacted demand. Despite the lower yields, Eastlands experienced a significant 14.5% increase in rental rates, rising from Kshs 128 in H1’2023, far exceeding the market average growth rate of 4.7%. This surge was driven by the addition of prime high-quality spaces commanding premium rents, such as the Business Bay Square (BBS) Mall. BBS Mall, the largest mall in East and Central Africa, offers 130,000 SQM of modern, high-quality spaces, significantly contributing to the region's retail landscape.
Furthermore, a significant shift in occupancy rates has been observed in Eastlands, with a 2.1% increase compared to the market average of 0.2%. This notable rise is primarily driven by changing consumer preferences and a growing population in these areas, encouraging retailers to expand their presence beyond the city center and explore opportunities in Eastlands. This strategic expansion aims to offer convenience to local residents in the most accessible manner possible. The surge in occupancy rates is supported by rental rates in Eastlands, which are below market averages at Kshs 146, compared to the market average of Kshs 185. This intentional pricing adjustment is a strategic move to attract a broader clientele by offering more affordable options. This strategy is particularly effective given the increased demand for consumer goods, diverse services, and entertainment facilities in these rapidly developing locales. The following table illustrates the submarket performance of nodes within the Nairobi Metropolitan Area (NMA) in H1’2024;
|
(All values in Kshs unless stated otherwise) |
|||||||||
|
Cytonn Report: Nairobi Metropolitan Area Retail Market Performance H1’2024 |
|||||||||
|
Area |
Rent Kshs/SQFT H1’2024 |
Occupancy% H1’2024 |
Rental Yield H1’2024 |
Rent Kshs/SQFT H1’2023 |
Occupancy% H1’2023 |
Rental Yield H1’2023 |
∆ in Rental Rates |
∆ in Occupancy (% points) |
H1’2024 ∆ in Rental Yield (% points) |
|
Westlands |
239 |
79.4% |
7.1% |
216 |
77.6% |
9.1% |
10.6% |
1.8% |
(2.0%) |
|
Karen |
218 |
84.0% |
9.3% |
217 |
82.4% |
9.7% |
0.8% |
1.6% |
(0.4%) |
|
Kilimani |
198 |
81.2% |
9.7% |
190 |
84.7% |
10.1% |
3.8% |
(3.5%) |
(0.4%) |
|
Ngong Road |
175 |
81.5% |
7.5% |
170 |
81.0% |
7.8% |
2.7% |
0.5% |
(0.4%) |
|
Kiambu road & Limuru Road |
205 |
75.2% |
9.0% |
202 |
74.0% |
8.7% |
1.4% |
1.2% |
0.2% |
|
Thika Road |
187 |
79.3% |
7.4% |
165 |
80.7% |
7.5% |
13.0% |
(1.3%) |
(0.1%) |
|
Eastlands |
146 |
77.7% |
6.4% |
128 |
75.6% |
6.0% |
14.5% |
2.1% |
0.4% |
|
Mombasa road |
169 |
79.6% |
8.2% |
156 |
79.9% |
7.5% |
8.3% |
(0.3%) |
0.6% |
|
Satellite towns |
139 |
79.0% |
6.8% |
138 |
78.8% |
6.8% |
0.9% |
0.2% |
0.0% |
|
Average |
185 |
79.5% |
7.9% |
177 |
79.2% |
8.2% |
4.7% |
0.2% |
-0.2% |
Source: Cytonn Research
For notable highlights during the quarter; please see our Cytonn Weekly #25/2024, Cytonn Monthly – April 2024, Cytonn Markets Review – Q1’2024, and, Cytonn Monthly - February 2024.
We maintain a NEUTRAL outlook on the retail sector’s performance, which is anticipated to be influenced by several key drivers: i) continued aggressive expansion by both local and foreign retailers seeking to secure new and existing spaces to capitalize on evolving consumer preferences and market dynamics, ii) ongoing improvements in public infrastructure, including road and railway projects, are expected to enhance accessibility to new areas for retail investments, stimulating further growth opportunities, and, iii) positive demographic trends, characterized by a growing population, are anticipated to underpin increasing demand for retail goods and services. However, the sector's growth momentum may face headwinds from certain negative factors, including: i) existing oversupply, with approximately 3.0 mn SQFT of retail space in the Nairobi Metropolitan Area (NMA) and an additional 1.7 mn SQFT across the Kenyan retail sector, posing challenges in achieving optimal occupancy rates and rental yields, ii) rising adoption of e-commerce by retailers is diminishing the traditional demand for physical retail spaces, requiring innovative approaches to adapt to changing consumer shopping behaviors, and, iii) limited access to and high costs of financing from financial institutions for retail developments, combined with the need for small and medium-sized enterprises (SMEs) to invest in technological advancements to improve operational efficiency and market competitiveness.
- Hospitality Sector
During H1’2024, Industry Reports related to the Hospitality sector were released as follows;
|
Cytonn Report: Released Industry Report related to Hospitality Sector H1’2024 |
||
|
# |
Report |
Key Take-outs |
|
1 |
Leading Economic Indicators (LEI) February and March 2024 Reports by Kenya National Bureau of Statistics (KNBS) |
|
|
2 |
2024 Economic Survey by Kenya Bureau of Statistics |
|
|
3 |
Quarterly Economic Review Q4’2023 Report by the Central Bank of Kenya (CBK) |
|
Source; Cytonn Research
For more highlights in the hospitality sector during the quarter, please see our Cytonn Markets Review – Q1’2024.
We maintain a NEUTRAL outlook for the hospitality sector in the upcoming quarter, with several factors expected to provide support: i) intensive marketing efforts aimed at promoting Kenya’s tourism market, which are anticipated to result in improved tourist arrivals, bolstering occupancy rates for hospitality establishments, ii) positive accolades accorded to Kenya’s tourism industry on the international stage, enhancing the country's reputation as a preferred tourist destination and attracting more visitors, iii) collaborative partnerships within the tourism sector aimed at fostering growth and innovation, leveraging synergies to capitalize on emerging opportunities, iv) supportive events and initiatives within the hospitality sector aimed at boosting tourism activity and enhancing guest experiences, v) commencement of direct flights from Dubai to Mombasa by FlyDubai, which is expected to increase accessibility and attract tourists from key markets, and vi) increased promotion of local tourism initiatives by the Ministry of Tourism under its Tourism Strategy 2021-2025, emphasizing domestic tourism as a key priority for stimulating sectoral growth. However, the sector may face challenges stemming from: i) cautionary statements issued by foreign governments such as China and Canada in December 2023, which may impact international tourist arrivals and dampen demand for hospitality services, and ii) difficulty in accessing finance, as lenders may demand more collateral to mitigate elevated credit risk, potentially limiting investment in hospitality infrastructure and expansion projects.
- Industrial Sector
Notable highlights in the quarter include;
- President Ruto's visit to the U.S. resulted in the signing of an agreement between G42 and Microsoft to build a data center worth Kshs 131.0 bn (USD 1.0 bn) at the KenGen Green Park in Olkaria. The data center will run on 100.0% renewable geothermal power from the Olkaria Geothermal fields in Naivasha, Nakuru County. G42, in collaboration with other partners, will design and construct the state-of-the-art facility, which will provide access to Microsoft Azure through a new East Africa Cloud Region. For more information, please see our Cytonn Weekly #21/2024.
We maintain a POSITIVE outlook for the sector. Going forward, we expect the sector to continue on an upward trajectory driven by: i) the rising demand for data centers in the country, ii) an increasing demand for cold rooms, especially in the Nairobi Metropolitan Area, iii) demand for quality warehouses due to the growing e-commerce business in the country, iv) support from the government, as evidenced by the establishment of Special Economic Zones (SEZ) and Export Processing Zones (EPZ), v) increased development activities by industry players such as ALP Africa Logistics, vi) Kenya’s continued recognition as a regional hub, hence attracting international investors, and, vii) efforts by the government to support agricultural and horticultural products in the international market.
- Infrastructure
During the week, President William Ruto signed the Appropriations Bill 2024 into law. This bill ensures that only critical spending is financed and capped at 15.0% of allocated funds until the Supplementary Appropriations Bill 2024 is processed. This decision comes in light of the President's earlier dissent on the Finance Bill 2024, which has significant implications for infrastructure projects across Kenya.
Key allocation and cuts highlights;
- State Department for Roads: The State Department for Roads received an allocation of Kshs 199.4 bn, which is significant but comes with a substantial budget cut of Kshs1 bn taking it to Kshs 184.3 bn. This reduction necessitates the rationalization of ongoing road projects, meaning that some projects may face delays or even be halted. The prioritization will likely focus on critical road projects that are essential for connectivity and economic activities. However, the delay in other projects could affect transportation efficiency, regional connectivity, and overall economic development, especially in underserved areas,
- Energy, Petroleum & Mining: The sector has been allocated Kshs 6 bn, with a significant cut of Kshs 21.8 bn taking it to Kshs 80.9 bn. The most affected area is the Last Mile Connectivity project, which saw a Kshs 14.5 bn reduction. This project aimed to connect 280,000 households across 32 counties to the electricity grid. The budget cut will slow down these electrification efforts, impacting economic development and the quality of life for many Kenyans. Delayed access to reliable electricity hampers growth in rural areas, affecting small businesses and households that rely on consistent power supply,
-
Housing: The housing sector's allocation stands at Kshs 85.5 bn from Kshs 87.6 bn after a Kshs 2.1 bn reduction. This cut will slow down the development of affordable housing units, exacerbating the housing deficit in the country. The reduction will affect the pace at which new housing projects can be completed, making it challenging to meet the growing demand for affordable homes. This slowdown could also impact the real estate market's stability and growth, as well as the broader economic benefits associated with increased housing development. Below is a summary table showing the current allocations and budgetary adjustments for FY’24/25.
|
Cytonn Report: Summary of Current Allocations and Budgetary Adjustments for FY’2024/2025 |
||||
|
Sector |
Initial Allocation (Kshs bn) |
Current Allocation (Kshs bn) |
Budget Cut (Kshs bn) |
Percentage Cut |
|
State Department for Roads |
199.4 |
184.3 |
15.1 |
7.6% |
|
Energy, Petroleum & Mining |
102.6 |
80.9 |
21.8 |
21.2% |
|
Housing |
87.6 |
85.5 |
2.1 |
2.4% |
For notable highlights during H1’2024 please see our Cytonn Monthly - May 2024, Cytonn Markets Review – Q1’2024, Cytonn Monthly - February 2024 and Cytonn Monthly - January 2024.
We anticipate that Kenya's infrastructure sector will continue to play a pivotal role in driving economic activities, bolstered by the government's dedication to: i) constructing and rehabilitating critical infrastructure such as roads, bridges, railways, airports, and affordable housing units, ii) enhancing diplomatic ties and partnerships with neighboring countries to promote mutual development, and iii) increasing efforts to attract regional and international investors, thereby positioning Kenya competitively within the East African region, particularly through improved railway connections and port infrastructure. Upon completion, these projects are expected to open new areas for real estate investment across various subsectors, creating new opportunities and stimulating demand for properties, goods, and services. However, recent budgetary adjustments, including cuts to major infrastructural sectors such as roads, energy, and housing, may slow the progress of these initiatives and impact their potential benefits. While prioritization of essential projects will help mitigate some impacts, reduced funding will likely slow economic growth, limit job creation, and impact the quality of life for many Kenyans. The overall infrastructure development will depend heavily on the efficient allocation of limited funds and strategic adjustments in the forthcoming Supplementary Appropriations Bill. These budgetary shifts may impact the pace and scope of infrastructure development, potentially affecting the real estate sector's growth trajectory in the near term.
- Land Sector
The average selling prices for land in the Nairobi Metropolitan Area (NMA) in H1’2024 recorded a capital appreciation of 3.9% to Kshs 132.7 mn, from Kshs 128.6 mn recorded in H1’2023. The performance was supported by;
- Growing demand for housing which is driven by positive demographics such as high population and urbanization, which currently stands at 1.9% and 3.7%, which is relatively higher than the global averages of 0.9% and 1.6% respectively,
- Limited supply of land especially in urban areas which has contributed to rising land prices
- Heightened construction activity, especially in the residential sector, driven by the government’s affordable housing agenda, which in turn boosts demand for land,
- As the government continues to roll out its infrastructural projects, providing key amenities such as tarmac roads, sewer lines, water supply, and electricity connectivity, these factors are driving up land values and stimulating market growth,
- Rising middle-income class population with more disposable income to invest
- Land continues to be highly valued as security by middle-class families, who place significant importance on owning land and are willing to invest large amounts of capital to acquire it, thereby driving the market, and,
- Growth in popularity of satellite towns by investors and buyers which provide affordable land options in comparison to the suburbs and key commercial zones,
Overall Performance:
During the period under review, land in the high-rise residential areas posted the highest year-on-year capital appreciation. This was mainly due to several factors: i) accessibility of these areas via major road networks such as the Thika Super Highway, Waiyaki Way, and Mombasa Road, ii) their close proximity to the CBD, which attracted the large population working in the CBD and its environs, as well as the rising population in the Nairobi Metropolitan Area, creating demand for housing in these areas, and iii) the affordability of land prices, attracting both buyers and investors. Notably, average land prices per acre in low-rise areas posted the least movement due to their high prices and stiff competition from lands in the commercial zones.The table below shows the overall performance of the sector across all land sub-sectors during H1’2024;
|
All values are in Kenya Shillings unless stated otherwise |
|||
|
Cytonn Report: Summary of the Performance Across All regions H1’2023 |
|||
|
|
H1'2023 |
H1'2024 |
Annualized Capital Appreciation |
|
Nairobi Middle End Suburbs- High Rise Residential Areas |
76.1 mn |
80.4 mn |
5.3% |
|
Un-serviced land - Satellite Towns |
15.4 mn |
16.3 mn |
5.3% |
|
Serviced Land - Satelllite Towns |
18.4 mn |
19.2 mn |
4.5% |
|
Nairobi Suburbs- Commercial Areas |
397.4 mn |
411.5 mn |
3.6% |
|
Nairobi High End Suburbs (Low and High Rise Areas) |
135.5 mn |
136.2 mn |
0.6% |
|
Average |
128.6 mn |
132.7 mn |
3.9% |
Source: Cytonn Research
Sub-markets Performance – For the unserviced satellite towns, Juja, Rongai, and Limuru were the best-performing nodes with annualized capital appreciation of 7.2%, 5.6%, and 5.4%, respectively. This performance can be mainly attributed to several factors: i) their close proximity to major transport corridors, ii) closeness to amenities such as malls, iii) relatively affordable land compared to other satellite areas, iv) a growing middle-class population pushing demand for housing, and v) a concentration of tertiary learning institutions, which creates a need for student housing. Low-rise areas experienced a slight movement in performance due to stiff competition from commercial zones, as developers are turning to commercial zones to develop high-rise projects. Additionally, land in low-rise areas is relatively higher than the market average, with the average asking price per acre at Kshs 136.2 mn, compared to the market average of Kshs 132.7 mn. The table below shows NMA’s land performance by submarkets in H1’2024;
|
Price in Kshs per Acre |
|||
|
Cytonn Report: Nairobi Metropolitan Area Land Performance By Submarkets – H1’2024 |
|||
|
Location |
Price H1'2023 |
Price H1'2024 |
Capital Appreciation |
|
Nairobi Middle End Suburbs – High Rise Residential Areas |
|||
|
Dagoretti |
85.6 mn |
91.1 mn |
6.0% |
|
Embakasi |
71.5 mn |
75.8 mn |
5.6% |
|
Kasarani |
74.4 mn |
74.4 mn |
4.2% |
|
Average |
76.1 mn |
80.4 mn |
5.3% |
|
Satellite Towns - Serviced Land |
|||
|
Juja |
14.4 mn |
15.5 mn |
7.2% |
|
Rongai |
17.3 mn |
18.3 mn |
5.6% |
|
Limuru |
23.5 mn |
24.8 mn |
5.4% |
|
Utawala |
16.7 mn |
17.4 mn |
4.3% |
|
Athi River |
5.2 mn |
5.3 mn |
1.8% |
|
Average |
15.4 mn |
16.3 mn |
5.3% |
|
Satellite Towns - Serviced Land |
|||
|
Athi River |
14.4 mn |
17.4 mn |
21.1% |
|
Syokimau |
17.2 mn |
18.5 mn |
7.6% |
|
Ruiru & Juja |
28.1 mn |
29.0 mn |
3.0% |
|
Ruai |
12.5 mn |
12.4 mn |
(0.7%) |
|
Rongai |
19.8 mn |
18.9 mn |
(4.8%) |
|
Average |
18.4 mn |
19.2 mn |
4.5% |
|
Nairobi Suburbs - Commercial Zones |
|||
|
Kilimani |
375.9 mn |
414.3 mn |
10.2% |
|
Westlands |
413.2 mn |
433.2 mn |
4.8% |
|
Upperhill |
458.2 mn |
471.4 mn |
2.9% |
|
Riverside |
342.1 mn |
327.1 mn |
(4.4%) |
|
Average |
397.4 mn |
411.5 mn |
3.6% |
|
Nairobi High End Suburbs (Low- and High-Rise Areas) |
|||
|
Kileleshwa |
301.9 mn |
316.8 mn |
4.9% |
|
Runda |
87.9 mn |
89.7 mn |
2.0% |
|
Ridgeways |
87.0 mn |
86.4 mn |
(0.7%) |
|
Karen |
64.5 mn |
63.6 mn |
(1.4%) |
|
Kitisuru |
95.0 mn |
92.5 mn |
(2.6%) |
|
Spring Valley |
176.5 mn |
168.3 mn |
(4.7%) |
|
Average |
135.5 mn |
136.2 mn |
0.6% |
Source: Cytonn Research
We maintain a positive outlook for the land sector in the Nairobi Metropolitan Area (NMA), considering it a dependable investment opportunity. We expect the sector's performance to be driven by several factors: (i) demand for land driven by positive demographics, (ii) government efforts to streamline land transactions through innovative solutions such as Ardhi Sasa, (iii) active participation by players in the land selling and buying segment, (iv) the launch of infrastructure development projects opening up satellite towns ,and, (v) government involvement in the Affordable Housing Program (AHP).
- Statutory Review
During the week, President William Ruto declined to sign the Finance Bill 2024. This decision came in response to widespread public outcry and intense opposition from various stakeholders. The President's refusal to assent to the bill has substantial implications for numerous sectors, particularly the real estate industry, which was poised for significant changes under the proposed legislation.
Clauses Impacting the Real Estate Sector:
- Affordable Housing Relief: The bill proposed a personal relief termed as "affordable housing relief" for resident individuals participating in approved affordable housing schemes. This relief aimed to reduce the tax burden on individuals saving for or purchasing homes within these schemes. Without this relief, individuals may find it less financially advantageous to participate in affordable housing schemes, potentially slowing the uptake of such programs. The lack of tax incentives could deter potential homeowners from entering the market, thereby impacting the overall goal of increasing affordable housing availability,
- Corporate Tax Incentives for Developers: A reduced corporate tax rate of 15.0% was proposed for companies constructing at least 400 residential units annually. This clause was intended to incentivize large-scale residential development. Developers will not benefit from the reduced corporate tax rate, which could have provided significant cost savings and encouraged more extensive development projects. The absence of this incentive may result in fewer large-scale residential projects, slowing the expansion of housing supply and potentially keeping property prices higher due to limited new stock,
- Restrictions on Selling Affordable Housing Units: The bill aimed to remove the existing restrictions on the resale of affordable housing units, which require prior written consent from the relevant Board. These restrictions are designed to prevent speculative buying and ensure that affordable housing remains accessible to the intended beneficiaries. Since the bill was not passed, the existing restrictions on selling affordable housing units remain in place. This means that homeowners must still obtain written consent from the relevant Board before selling their units. While this helps prevent speculative flipping and keeps units affordable for low-income buyers, it may also deter potential investors who prefer fewer resale restrictions,
- Tax Relief on Housing Fund Contributions: Employees contributing to the Affordable Housing Fund were to benefit from tax relief of up to 15.0% of their contributions, not exceeding Kshs 108,000 per annum. This was aimed at encouraging more employees to contribute to the fund, thereby increasing resources available for affordable housing projects. The lack of this tax relief could reduce the attractiveness of contributing to the Affordable Housing Fund, and,
- Excise Duty on Imported Building Materials: The bill proposed excise duties on certain imported building materials, such as wooden furniture and parts of furniture, which were to attract a 3.0% duty on the customs value. This was intended to promote local manufacturing by making imported materials more expensive. Without the imposition of these excise duties, the cost of imported building materials remains lower, which could benefit developers by reducing construction costs. However, this may also mean less protection for local manufacturers who might face stiff competition from cheaper imported goods. The lower construction costs could encourage continued investment in new projects and potentially lead to more competitive pricing in the housing market.
We expect that the real estate sector will benefit from continued lower than was proposed construction costs due to the absence of new excise duties on imported building materials, maintaining competitive pricing and encouraging ongoing investment. However, the lack of immediate tax incentives may slow the pace of large-scale residential projects, although stable costs and market flexibility could support ongoing development activities. Speculative buying and selling of affordable housing units will continue being curbed with the resale restrictions. Participation in affordable housing schemes may see moderate growth due to the absence of specific tax reliefs.
For highlights during the quarter, please see our Cytonn Monthly – May 2024 and Cytonn Monthly – April 2024.
- Real Estate Investments Trusts (REITs)
In the Unquoted Securities Platform, Acorn D-REIT and I-REIT traded at Kshs 24.5 and Kshs 22.0 per unit, respectively, as of 14th June 2024. The performance represented a 22.5% and 10.0% gain for the D-REIT and I-REIT, respectively, from the Kshs 20.0 inception price. The volumes traded for the D-REIT and I-REIT came in at 12.3 mn and 30.7 mn shares, respectively, with a turnover of Kshs 257.5 mn and Kshs 633.8 mn, respectively, since inception in February 2021.
Notable highlights during H1’2024 included;
- Property developer Acorn Holdings announced its decision to exercise the early redemption of its green bond, with an outstanding balance of Kshs 1.9 bn. The green bond, initially launched in 2019, successfully raised Kshs 5.7 bn through multiple transactions to develop Acorn's branded student hostels. The bond, which carries a fixed interest rate of 12.25%, was designed with provisions for early redemption to de-risk it compared to traditional corporate bonds. For more information, please see our Cytonn Monthly – May 2024,
REITs offer various advantages such as tax breaks, diversified asset portfolios, and consistent long-term returns. However, the ongoing decline in the performance of Kenyan REITs and their efforts to restructure their portfolios are impeding significant investments that were previously made. Additionally, there are several general challenges including: i) limited understanding of the investment vehicle among investors, ii) protracted approval procedures for establishing REITs, iii) high minimum capital requirements of Kshs 100.0 mn for trustees, and iv) minimum investment thresholds set at Kshs 5.0 mn, which continue to constrain the performance of the Kenyan REITs market.
Real Estate Performance Summary and Outlook
Below is a summary of the sectorial performance in H1’2024 and investment opportunities:
|
Theme |
Cytonn Report: Thematic Performance and Outlook H1’2024 |
Outlook |
|
Residential |
|
Neutral |
|
||
|
Commercial Office |
|
Neutral |
|
||
|
Retail |
|
Neutral |
|
||
|
Hospitality |
|
Neutral |
|
Land |
|
Positive |
Disclaimer: The views expressed in this publication are those of the writers where particulars are not warranted. This publication, which is in compliance with Section 2 of the Capital Markets Authority Act Cap 485A, is meant for general information only and is not a warranty, representation, advice or solicitation of any nature. Readers are advised in all circumstances to seek the advice of a registered investment advisor.

- Talk to us
- Kenya
- P.O Box 20695 - 00200, Nairobi, Kenya
- Cell +254709101200
- Tel +254709101200
- WhatsApp +254741676635
- United States
- +254709101200
- DOWNLOAD OUR APP
-


- Kenya
- 8th Floor, Pinetree Plaza, Kaburu Drive, Ngong Road, Nairobi, Kenya
- USA
- Suite 1150, 1775 Eye Street NW, USA, Washington DC 20006, USA
- Investments
- High Yield
- Private Equity
- Real Estate
- Real Estate
- RiverRun Estates
- Cytonn Towers
- The Ridge
- Taraji Heights
- The Alma