Cytonn Weekly #42/2020
By Research Team, Oct 18, 2020
Executive Summary
Fixed Income
During the week, T-bills were oversubscribed, with the overall subscription rate coming in at 131.6%, up from 110.0% the previous week, supported by the favorable liquidity conditions in the money markets. The highest subscription rate was in the 91-day paper, which came in at 215.2%, up from 186.5% recorded the previous week. The subscription for the 182-day paper increased to 71.0% from 39.3% and that for the 365-day paper rose to 158.9% from 150.1% recorded the previous week. T-Bonds were also oversubscribed with the total subscription rate coming in at 138.3%, as the government received bids worth Kshs 69.1 bn, higher than the Kshs 50.0 bn offered. During the week, the Energy and Petroleum Regulatory Authority (EPRA) released their monthly statement on the Maximum Retail Prices for petroleum products in Kenya for the period 15th October 2020 to 14th November 2020. Petrol prices increased by 1.4% to Kshs 107.3 per litre, diesel prices decreased by 1.4% to Kshs 92.9 per litre, while kerosene prices remained unchanged at Kshs 87.3 per litre. Also, KNBS released the Q2’2020 GDP Growth rates, where the economy contracted by (5.7%) against a 5.3% growth in Q2’2019 as the effects of the Covid-19 pandemic weighed down various sectors. The Quarterly Balance of Payments Report for Q2’2020 was also released showing that Kenya’s current account deficit contracted by 39.9% during Q2’2020, coming in at Kshs 82.2 bn, from Kshs 136.9 bn in Q2’2019, equivalent to 7.0% of GDP from the 10.9% of GDP. The decline was mainly driven by an 84.8% decline in the services trade balance (the difference between the imports and exports of services) to Kshs 5.8 bn, from Kshs 38.4 bn;
Equities
During the week, the equities market was on a downward trajectory, with NASI, NSE 25 and NSE 20 declining by 0.3%, 0.4% and 1.4%, respectively, taking their YTD performance to losses of 15.8%, 21.3% and 30.8%, for the NASI, NSE 25 and NSE 20, respectively. The performance was mainly driven by declines recorded by banking stocks such as KCB Group, Standard Chartered Bank (SCBK) and Diamond Trust Bank (DTB-K), which declined by 2.4%, 2.3% and 1.2%, respectively. The losses were however mitigated by gains recorded on other banking stocks such as NCBA Group, ABSA and Co-operative Bank of 1.5%, 2.3% and 2.6%, respectively. In a Gazette Notice released on 9th October 2020, the Competition Authority of Kenya authorised the proposed transfer of various listed assets, including outstanding deposit balance amounting to Kshs 3.2 bn, loans and security portfolios together with all rights, titles from Imperial Bank Limited (IBL) to KCB Bank Kenya Limited;
Real Estate
During the week, KNBS released the Quarterly Gross Domestic Product Report - Second Quarter, 2020 highlighting that growth in real estate and construction activities in Q2’2020 came in at 2.2% and 3.9%, respectively. In the residential sector, Centum Investments handed over the first 96 units in two of its master-planned developments, Awali in Kwale and Pearl Marina Estates in Uganda. In the retail sector, Naivas supermarket announced plans to open 4 more retail chains to be located at Lifestyle Mall in Nairobi’s CBD, Rongai, and two other undisclosed locations;
- Weekly Rates:
- Cytonn Money Market Fund closed the week at a yield of 10.6%. To invest or withdraw, just dial *809#;
- Cytonn High Yield Fund closed the week at a yield of 13.7% p.a. To invest, email us at sales@cytonn.com and to withdraw the interest you just dial *809#
- For an exclusive tour of Cytonn’s real estate developments, visit: Sharp Investor's Tour and for more information, email us at sales@cytonn.com;
- We continue to offer Wealth Management Training daily, from 9:00 am to 11:00 am, through our Cytonn Foundation. The training aims to grow financial literacy among the general public. To register for any of our Wealth Management Training, click here;
- For Pension Scheme Trustees and members, we shall be having different industry players talk about matters affecting Pension Schemes and the pensions industry at large. Join us every Wednesday from 9:00 am to 11:00 am for in-depth discussions on matters pension;
- If interested in our Private Wealth Management Training for your employees or investment group, please get in touch with us through wmt@cytonn.com;
- For recent news about the company, see our news section here;
- We have 10 investment-ready projects, offering attractive development and buyer targeted returns. See further details here: Summary of Investment-ready Projects.
Money Markets, T-Bills & T-Bonds Primary Auction:
During the week, T-bills were oversubscribed, with the overall subscription rate coming in at 131.6%, up from 110.0% the previous week, supported by the favorable liquidity conditions in the money markets. The highest subscription rate was in the 91-day paper, which came in at 215.2%, up from 186.5% recorded the previous week. The subscription for the 182-day paper increased to 71.0% from 39.3% while that of the 365-day paper rose to 158.9% from 150.1% recorded the previous week. The yields on the 91-day, 182-day and 364-day papers remained unchanged at 6.5%, 6.9% and 7.8%, respectively. The acceptance rate increased to 94.9%, from 93.9% recorded the previous week, with the government accepting bids worth Kshs 30.0 bn out of the Kshs 31.6 bn worth of bids received.
Additionally, there was high demand for this month’s bond offers, with the overall subscription rate for the two bonds coming in at 138.3%, partly supported by the favorable liquidity in the market, and financial institutions bias towards the fixed income market in this period of economic uncertainty. The Central Bank of Kenya had re-opened 2 bonds the FXD1/2011/20 and FXD1/2018/25 with coupons of 10.0% and 13.4% and effective tenors of 10.6 years and 22.7 years, respectively. The government received bids worth Kshs 69.1 bn, higher than the Kshs 50.0 bn offered and accepted only Kshs 60 bn. Investors preferred the longer-term paper i.e. FXD1/2018/25, which received bids worth Kshs 46.0 bn, representing 66.5% of the total bids received. The weighted average rate of accepted bids for the two bonds came in at 12.0% and 13.5%, for FXD1/2011/20 and FXD1/2018/25, respectively. The government rejected high bids only accepting Kshs 60.0 bn out of the Kshs 69.1 bn worth of bids received, translating to an acceptance rate of 86.8%.
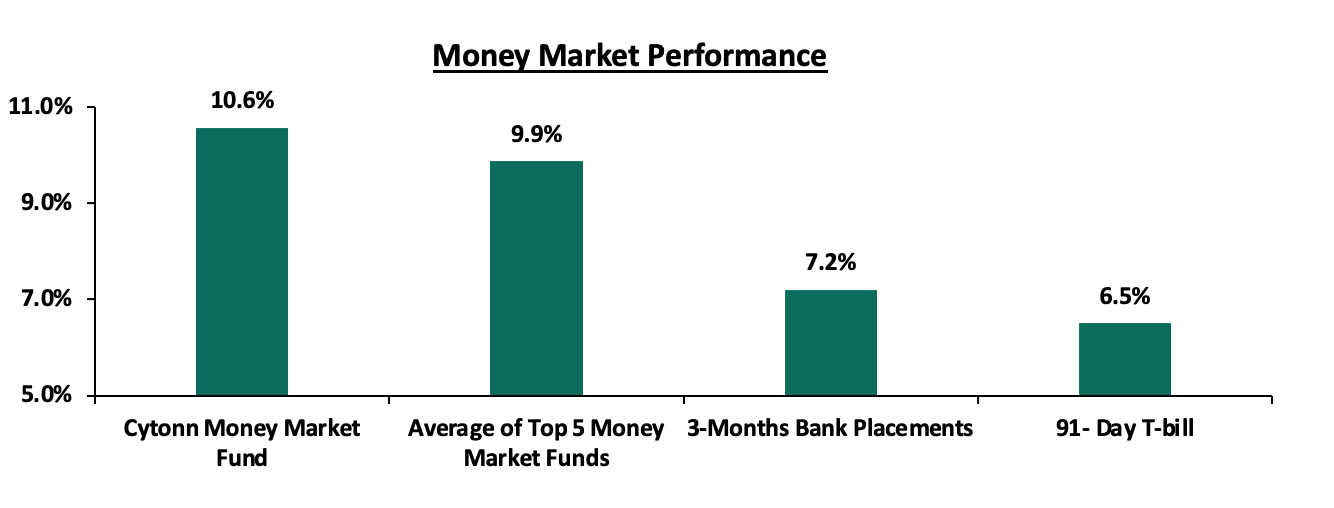
In the money markets, 3-month bank placements ended the week at 7.2% (based on what we have been offered by various banks), while the yield on the 91-day remained unchanged at 6.5% pa. The average yield of the Top 5 Money Market Funds decreased by 0.2% points to 9.9% % from 10.1% recorded the previous week. The yield on the Cytonn Money Market decreased by 0.3% points to close at 10.6%, from the 10.9% recorded the previous week.
Liquidity:
The money markets remained liquid during the week, with the average interbank rate remaining unchanged at 2.4%, mainly supported by government payments which offset tax receipts. The average interbank volumes also were Kshs 8.0 bn the same as the previous week. According to the Central Bank of Kenya, commercial banks’ excess reserves came in at Kshs 14.8 bn in relation to the 4.25% Cash Reserve Ratio.
Kenya Eurobonds:
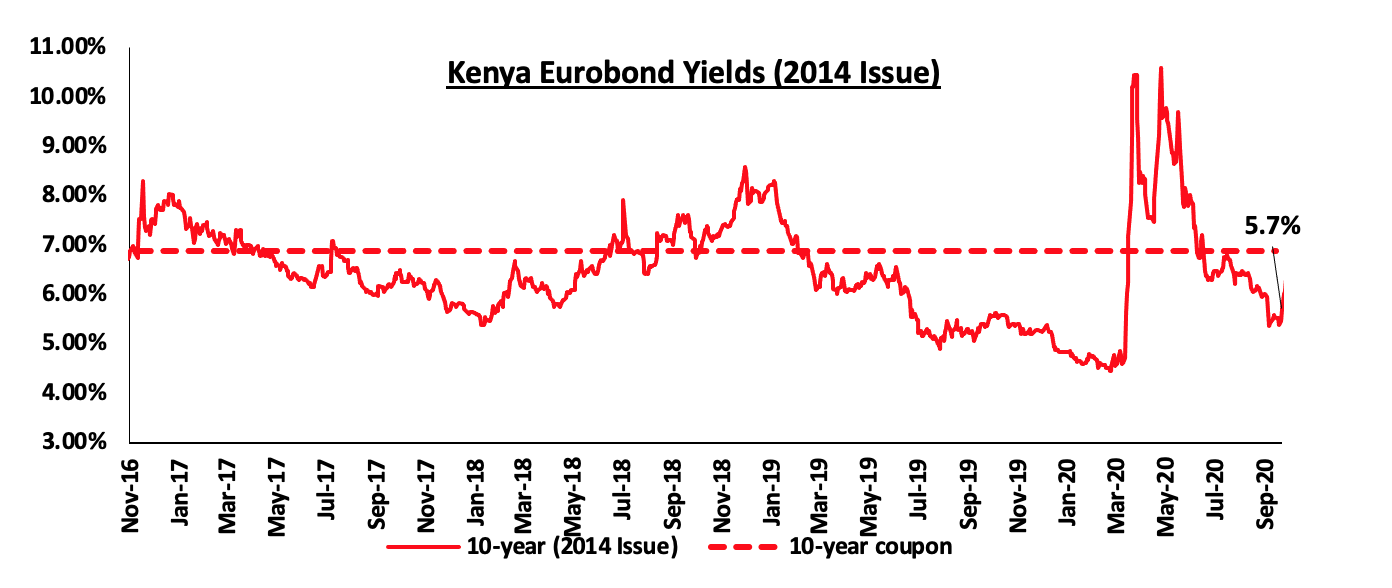
During the week, the yields on all Eurobonds increased, pointing to the perception of increased risk by foreign investors on the country’s outlook, due to the dismal Q2’2020 economic growth numbers released during the week. According to Reuters, the yield on the 10-year Eurobond issued in June 2014 increased by 0.1% points to 5.7%, from 5.6% recorded the previous week.
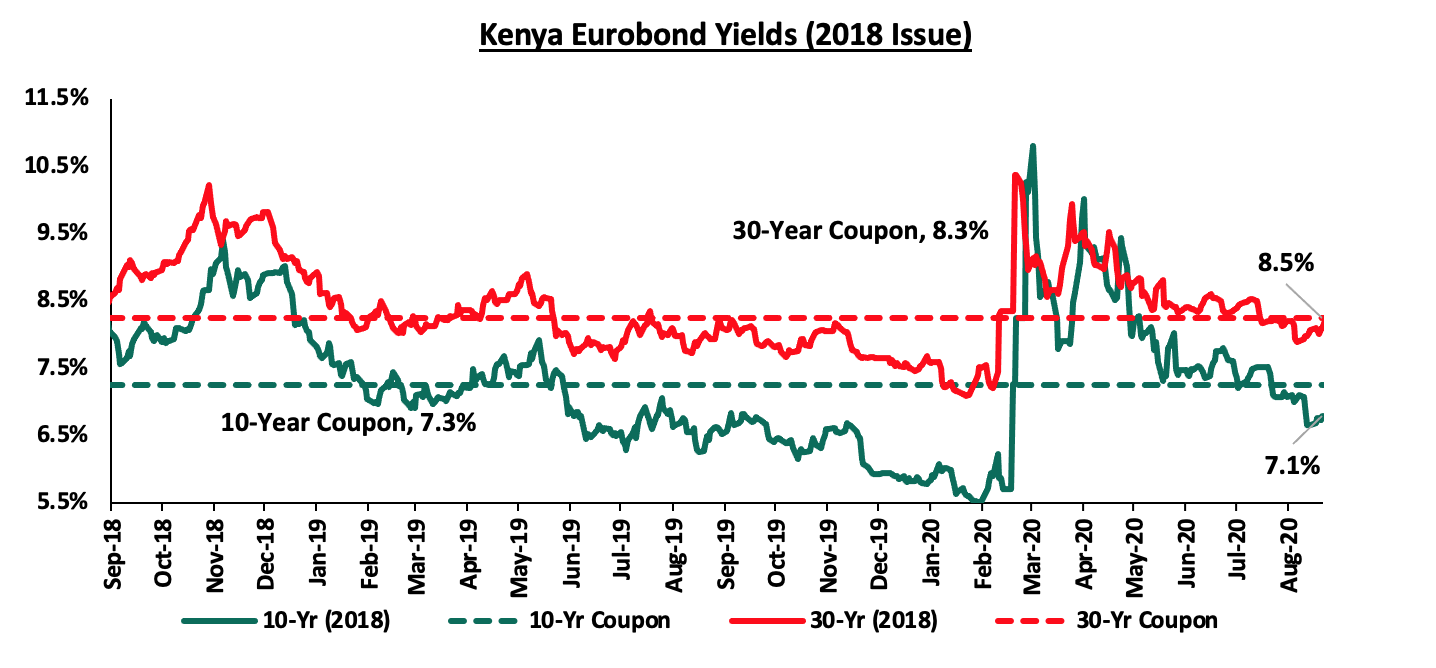
During the week, the yields on the 10-year and 30-year Eurobonds both increased by 0.3% and 0.2% to close at 7.1% and 8.5%, from the 6.8% and 8.3% recorded the previous week.
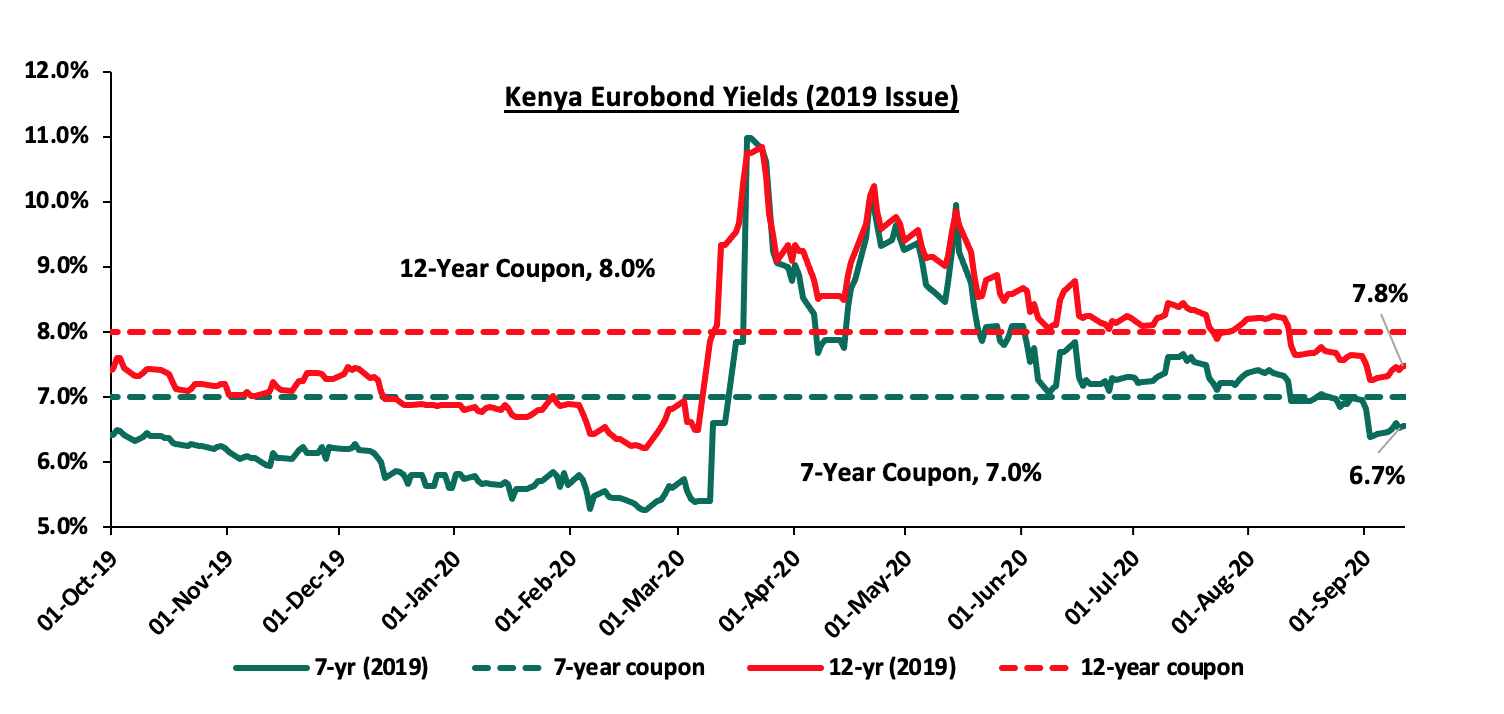
During the week, the yields on the 2019 dual-tranche Eurobond issue increased. The 7-years Eurobond increased by 0.3% points to 6.7%, from 6.4%, while the 12-year increased by 0.2% points to close at 7.8%, from the 7.6% recorded the previous week.
Kenya Shilling:
During the week, the Kenyan shilling depreciated marginally against the US dollar to Kshs 108.6 from 108.5, mainly attributable to the dollar demands from energy and merchandise importers exceeding the supply from tourism, remittances and exporters. On a YTD basis, the shilling has depreciated by 7.2% against the dollar, in comparison to the 0.5% appreciation in 2019.
In the short term, the shilling is expected to be supported by:
- The high Forex reserves which are currently at USD 8.3 bn (equivalent to 5.0 - months of import cover), which is above the statutory requirement of maintaining at least 4.0 - months of import cover, and the EAC region’s convergence criteria of 4.5-months of import cover.
- Improving current account position as it reduced by 39.9% during Q2’2020 to Kshs 82.2 bn, from Kshs 136.9 bn in Q2’2019, equivalent to 7.0% of GDP down from 10.9% of GDP recorded in Q2’2019.
Weekly Highlight:
During the week, the Energy and Petroleum Regulatory Authority (EPRA) released their monthly statement on the Maximum Retail Prices in Kenya for the period 15th October 2020 to 14th November 2020.
Below are the key take-outs from the statement:
- Petrol prices have increased by 1.4% to Kshs 107.3 per litre from Kshs 105.4 per litre previously, while diesel prices have decreased marginally by 1.4% to Kshs 92.9 per litre from Kshs 94.5 per litre. Kerosene prices remained unchanged.
- The changes in prices have been attributed to:
- An increase in the average landed cost of imported super petrol by 1.1% to USD 331.7 per cubic meter in September 2020 from USD 327.7 per cubic meter in August 2020,
- Average landed costs for diesel decreased by 5.4% to USD 312.0 per cubic meter from USD 329.9 in August 2020,
- Landed costs for kerosene remained unchanged at USD 282.1 per cubic meter recorded in August 2020,
- A 7.4% decrease in Free on Board (FOB) price of Murban crude oil lifted in September 2020 to USD 42.4 per barrel from USD 45.7 per barrel in August 2020.
- The Kenyan shilling depreciation by 0.6% against the dollar to close at Kshs 108.6 in September 2020, from Kshs 107.9 in August 2020.
We expect a slight decline in the transport index component of the total consumer price index (CPI) as a result of the 5.4% decline in diesel prices, as well as the unchanged price of kerosene.
GDP growth
During the week, Kenya National Bureau of Statistics (KNBS), released the Quarterly GDP Q2’2020 GDP growth rates where Kenya’s economy contracted during the second quarter of 2020 compared to the corresponding quarter in 2019. The economy recorded a contraction of (5.7%) in Q2’2020, from a growth of 5.3% in Q2’2019, this was the first contraction since the third quarter of 2001 when the country recorded a contraction of (2.5%).
The table below shows the weighted sectoral contribution to the overall GDP growth:
|
Sector |
Contribution Q2'2019 |
Contribution Q2'2020 |
Q2'2019 Growth |
Q2'2020 Growth |
Weighted Growth Rate Q2'2019 |
Weighted Growth Rate Q2'2020 |
Variance |
|
Agriculture and Forestry |
22.8% |
25.7% |
2.9% |
6.4% |
0.7% |
1.6% |
3.5% |
|
Taxes on Products |
10.9% |
9.9% |
4.0% |
(14.2%) |
0.4% |
(1.4%) |
(18.3%) |
|
Manufacturing |
9.7% |
9.9% |
4.0% |
(3.9%) |
0.4% |
(0.4%) |
(7.9%) |
|
Real estate |
8.3% |
9.0% |
6.0% |
2.2% |
0.5% |
0.2% |
(3.8%) |
|
Wholesale and retail trade |
7.3% |
7.3% |
7.8% |
(6.9%) |
0.6% |
(0.5%) |
(14.7%) |
|
Education |
6.8% |
3.2% |
6.0% |
(56.2%) |
0.4% |
(1.8%) |
(62.1%) |
|
Transport and Storage |
6.9% |
6.5% |
7.6% |
(11.6%) |
0.5% |
(0.7%) |
(19.1%) |
|
Financial & Insurance |
6.0% |
6.5% |
7.8% |
1.7% |
0.5% |
0.1% |
(6.2%) |
|
Construction |
5.5% |
6.1% |
7.2% |
3.9% |
0.4% |
0.2% |
(3.3%) |
|
Information and Communication |
3.5% |
3.9% |
7.8% |
4.3% |
0.3% |
0.2% |
(3.6%) |
|
Public administration |
4.4% |
4.9% |
7.5% |
6.9% |
0.3% |
0.3% |
(0.6%) |
|
Electricity and Water Supply |
2.9% |
3.0% |
7.3% |
(0.6%) |
0.2% |
(0.0%) |
(7.9%) |
|
Professional admin |
2.2% |
2.0% |
4.2% |
(15.7%) |
0.1% |
(0.3%) |
(20.0%) |
|
Health |
1.8% |
2.1% |
6.2% |
10.3% |
0.1% |
0.2% |
4.1% |
|
Accommodation & Food Services |
1.0% |
0.2% |
12.1% |
(83.3%) |
0.1% |
(0.2%) |
(95.4%) |
|
Other services |
1.2% |
1.2% |
5.6% |
(8.5%) |
0.1% |
(0.1%) |
(14.1%) |
|
Mining and quarrying |
0.9% |
1.1% |
5.0% |
10.0% |
0.0% |
0.1% |
5.0% |
|
Financial Services Indirectly Measured |
(2.1%) |
(2.4%) |
7.3% |
4.0% |
(0.2%) |
0.1% |
(3.3%) |
|
GDP at Market Prices |
100.0% |
100.0% |
5.3% |
(5.7%) |
5.3% |
(5.7%) |
(11.0%) |
Our key take-outs include:
- The biggest gainers in terms of sectoral contribution to GDP were Agriculture, real estate and construction sectors, where agriculture increased by 2.9% points to 25.7% from 22.8% in Q2’ 2019 while real estate and construction sectors increased by 0.7% points and 0.6% points, respectively from 8.3% and 5.5% recorded in Q2’ 2019. Education was the biggest loser since it decreased by 3.7% points to 3.2% in Q2’2020 from 6.9% in Q2’2019. We attribute the decline to the decreased activity in the sector due to the coronavirus pandemic as the government implemented social distance measures and schools were closed for the whole quarter,
- The overall performance was cushioned by growths in Agriculture, Forestry and Fishing activities which grew by 6.4%; Financial and Insurance activities, 1.7%; Construction, 3.9%; Real Estate Activities, 2.2% and Mining and Quarrying activities, 10.0%.
- Accommodation & tourism and the Education sectors were the hardest hit, declining by 83.3% and 56.2% respectively.
For a detailed analysis on this see our Q2’2020 GDP Growth rate note.
The Kenya National Bureau of Statistics released the Quarterly Balance of Payments report for Q2’2020. Kenya’s current account deficit contracted by 39.9% in Q2’2020, to Kshs 82.2 bn, from Kshs 136.9 bn in Q2’2019, equivalent to 7.0% of GDP from the 10.9% of GDP recorded in Q2’2019.
The table below shows the year on year changes in the Balance of payments.
|
Q2’2020 Current Account Balance |
|||
|
Item |
Q2’ 2019 |
Q2’2020 |
% Change |
|
Merchandise Trade Balance |
(277.8) |
(187.4) |
(32.5%) |
|
Service Trade Balance |
38.4 |
5.8 |
(84.8%) |
|
Primary Income Balance |
(46.2) |
(33.5) |
(27.4%) |
|
Secondary Income (Transfers) Balance |
148.7 |
132.9 |
(10.7%) |
|
Current Account Balance |
(136.9) |
(82.2) |
(39.9%) |
|
GDP at Current Prices (Q2’2020 Quarterly GDP Report by KNBS) |
1,252.2 |
1,181.9 |
(5.6%) |
|
Current Account Balance as a % of GDP |
(10.9%) |
(7.0%) |
4.0% |
Key take-outs from the table include:
- The merchandise trade deficit (a scenario where imports are greater than exports of goods) declined by 32.5% to Kshs 187.4 bn, from Kshs 277.8 bn in Q2’2019, driven by a 23.2% decline in merchandise imports to Kshs 326.5 bn, from Kshs 425.0 bn in Q2’2019, coupled with the 5.5% decline in merchandise exports to Kshs 139.2 bn from Kshs 147.2 bn recorded in a similar period in 2019. The decline in the merchandise exports was mainly on account of a 6.1% decline in the value of horticulture exports to Kshs 28.2 bn from Kshs 30.1 bn. Notably, earnings from tea during the quarter improved by 38.9% to Kshs 34.8 bn from Kshs 25.1 bn in Q2’2019. Earning from coffee during the quarter also improved by 9.2% to Kshs 7.8 bn from Kshs 7.2 bn in Q1’2019,
- Service Trade Balance (the difference between the imports and exports of services) recorded an 84.8% decline in Q2’2020 to Kshs 5.8 bn from Kshs 38.4 bn recorded in Q2’2020. Receipts from international trade services declined by 36.4% to Kshs 89.7 bn in Q2’2020 from Kshs 141.0 bn mainly on the back of the sluggish performance recorded in the exports of international travel and transport services. The travel restrictions put in place due to the pandemic saw the total number of visitors arriving through Jomo Kenyatta International Airport (JKIA) and Moi International Airport (MIA) in Q2’2020 decline by 99.5% to 1.8 mn people from 341.3 mn people in Q2’2019,
- Secondary income/transfers surplus (The transactions recorded in the secondary income account pertain to those current transfers between residents and non-residents that directly affect the level of gross national disposable income and thus influence the economy’s ability to consume goods and services) declined by 10.7% to Kshs 132.9 bn, from Kshs 148.7 bn in Q2’2019. Despite this, diaspora remittances recorded a 0.7% increase to Kshs 81.4 bn, from Kshs 80.8 bn recorded in Q2’2019,
Kenya’s Balance of payment deficit declined in Q2’2020 to Kshs 44.0 bn from Kshs 93.8 bn in Q2’2019, translating to a balance of payments deficit equivalent to 3.7% of GDP in Q2’2020 from a deficit equivalent to 7.5% of GDP recorded in Q2’2019. This was mainly due to the 36.7% decline in the Financial Account balance.
We expect relative stability in the business environment in the coming quarter given the easing of the lockdown measures by Kenya’s trading partners as well as continued support from the tea, coffee and horticulture exports due to the normalized demand in Kenya’s export. For more information, see our Q2’2020 Balance of Payments Note.
Rates in the fixed income market have remained relatively stable due to the high liquidity in the money markets, coupled with the discipline by the Central Bank as they reject expensive bids. The government is 64.6 % ahead of its prorated borrowing target of Kshs 130.9 bn having borrowed Kshs 215.2bn. In our view, the government will not be able to meet their revenue collection targets of Kshs 1.9 tn for FY’2020/2021 because of the current subdued economic performance in the country brought about by the spread of COVID-19, and therefore leading to a larger budget deficit than the projected 7.5% of GDP, ultimately creating uncertainty in the interest rate environment as additional borrowing from the domestic market may be required to plug the deficit. Owing to this uncertain environment, our view is that investors should be biased towards short-term to medium-term fixed income securities to reduce duration risk.
Market Performance
During the week, the equities market was on a downward trajectory, with NASI, NSE 25 and NSE 20 declining by 0.3%, 0.4% and 1.4%, respectively, taking their YTD performance to losses of 15.8%, 21.3%, and 30.8%, for NASI, NSE 25 and NSE 20, respectively. The performance was mainly driven by declines recorded by banking stocks such as KCB Group, Standard Chartered Bank (SCBK) and Diamond Trust Bank (DTB-K), which declined by 2.4%, 2.3% and 1.2%, respectively. The losses were however mitigated by gains recorded in other banking stocks such as NCBA Group, ABSA and Co-operative Bank of 1.5%, 2.3% and 2.6%, respectively.
Equities turnover increased by 11.2% during the week to USD 12.1 mn, from USD 10.9 mn recorded the previous week, taking the YTD turnover to USD 1.2 bn. Foreign investors remained net sellers during the week, with a net selling position of USD 4.0 mn, from a net selling position of USD 2.0 mn recorded the previous week, taking the YTD net selling position to USD 263.2 mn.
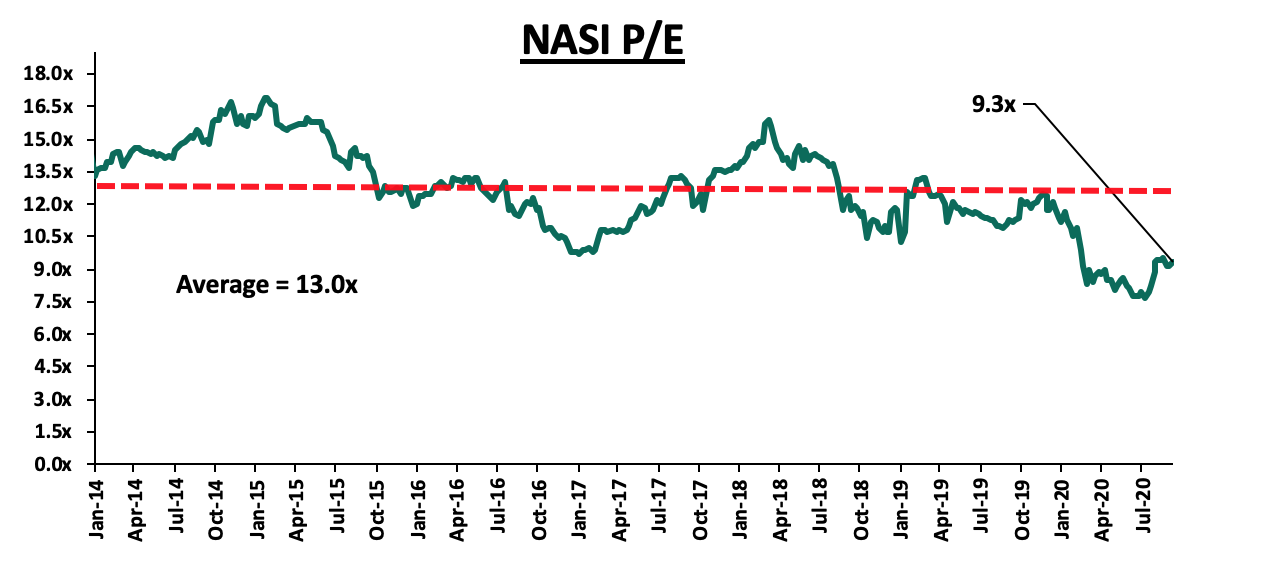
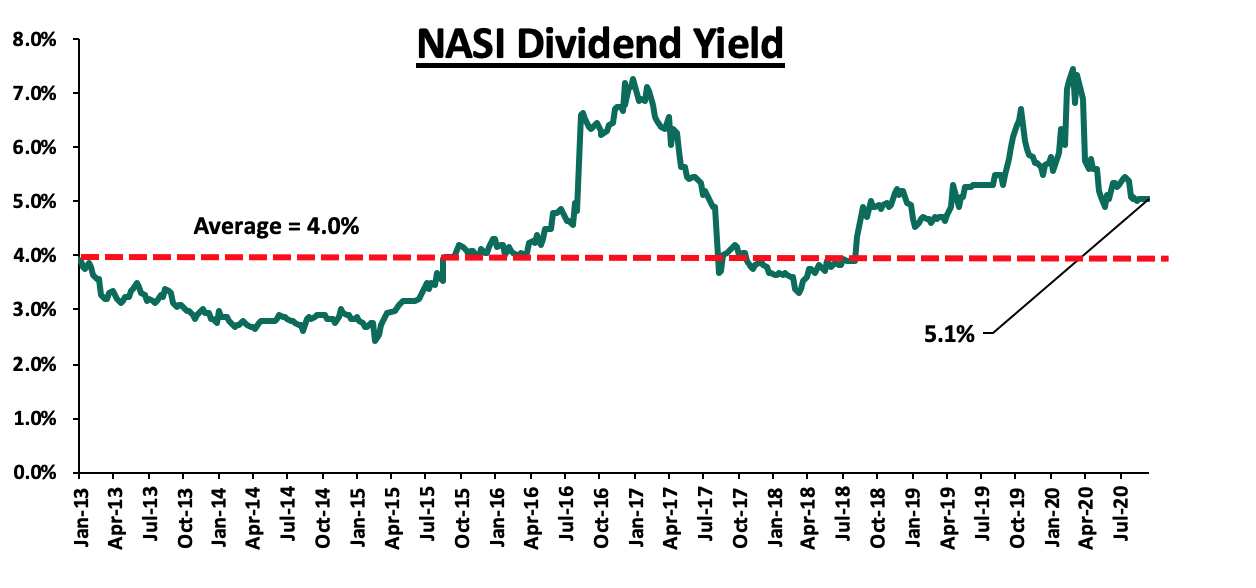
The market is currently trading at a price to earnings ratio (P/E) of 9.3x, 28.2% below the 11-year historical average of 13.0x. The average dividend yield is currently at 5.1%, 0.1% points above the 5.0% recorded the previous week and 1.1% points above the historical average of 4.0%.
With the market trading at valuations below the historical average, we believe there are pockets of value in the market for investors with higher risk tolerance and are willing to wait out the pandemic. The current P/E valuation of 9.3x is 21.0% above the most recent valuation trough of 7.7x experienced in the first week of August 2020. The charts below indicate the historical P/E and dividend yields of the market.
Weekly Highlight
In a Gazette Notice released on 9th October 2020, the Competition Authority of Kenya authorised the proposed transfer of various assets, including outstanding deposit balance amounting to Kshs 3.2 bn, loans and security portfolios together with all rights, titles from Imperial Bank Limited (IBL) to KCB Bank Kenya Limited. To offer validity to this commercial contract, KCB had earlier indicated that it would pay Kshs 10.8 for the acquisition of part of the Imperial Bank’s business. This move mirrors that of Mauritius’ SBM Holdings, which occurred on 10th May 2017, paying Kshs 100 for the take-over of Kenya Fidelity Commercial Bank (FCB).
The above is in line with our earlier analysis of the transaction in our Cytonn Weekly #21/2020 report, on 22nd May 2020, following the approval by the Central Bank of Kenya on 4th May 2020 and the approval by the National Treasury and Planning on 14th May 2020, the Central Bank of Kenya (CBK) had announced the acquisition of assets valued at Kshs 3.2 bn and assumption of liabilities of the same value of Imperial Bank (Kenya) Limited (In Receivership) (IBLIR) by KCB Bank Kenya Limited effective 2nd June 2020. CBK had indicated that from 2nd June 2020, IBLs customers would be paid a total of Kshs 3.2 bn for 4 years. The payments commenced on 3rd September 2020 following approvals by IBLR receiver-manager, the Kenya Deposit Insurance Corporation (KDIC). Key to note, Imperial Bank had been placed under receivership (a process that can assist creditors to recover funds in default and can help troubled companies to avoid bankruptcy) on 13th October 2015 by CBK due to the inappropriate Banking practices noted by the Authority such as the misrepresentation of their financial statements.
Additionally, this move marks the resolution of IBL matters and as such, we believe that continued bank consolidation efforts in Kenya, as highlighted in our H1’2020 Banking Report, will lead to a stable banking sector, as consolidation continues to eliminate weaker banks.
Universe of Coverage:
|
Company |
Price at 09/10/2020 |
Price at 16/10/2020 |
w/w change |
YTD Change |
Year Open |
Target Price* |
Dividend Yield |
Upside/ Downside** |
P/TBv Multiple |
Recommendation |
|
Diamond Trust Bank*** |
63.8 |
63.0 |
(1.2%) |
(42.2%) |
109.0 |
119.4 |
4.3% |
93.8% |
0.3x |
Buy |
|
Kenya Reinsurance |
2.4 |
2.2 |
(5.1%) |
(26.1%) |
3.0 |
4.0 |
4.9% |
83.5% |
0.2x |
Buy |
|
Sanlam |
12.0 |
12.7 |
5.8% |
(26.2%) |
17.2 |
18.4 |
0.0% |
44.9% |
1.2x |
Buy |
|
I&M Holdings*** |
43.6 |
43.5 |
(0.2%) |
(19.4%) |
54.0 |
57.8 |
5.9% |
38.7% |
0.7x |
Buy |
|
NCBA*** |
22.6 |
23.0 |
1.5% |
(37.7%) |
36.9 |
30.7 |
1.1% |
34.9% |
0.6x |
Buy |
|
KCB Group*** |
38.1 |
37.2 |
(2.4%) |
(31.1%) |
54.0 |
46.4 |
9.4% |
34.1% |
0.8x |
Buy |
|
Equity Group*** |
34.9 |
35.0 |
0.1% |
(34.7%) |
53.5 |
44.5 |
5.7% |
33.0% |
0.9x |
Buy |
|
Standard Chartered*** |
161.5 |
157.8 |
(2.3%) |
(22.1%) |
202.5 |
197.2 |
7.9% |
32.9% |
1.2x |
Buy |
|
Co-op Bank*** |
11.5 |
11.8 |
2.6% |
(27.8%) |
16.4 |
14.2 |
8.5% |
28.8% |
0.8x |
Buy |
|
ABSA Bank*** |
9.4 |
9.6 |
2.3% |
(27.9%) |
13.4 |
10.8 |
11.4% |
23.7% |
1.2x |
Buy |
|
Liberty Holdings |
7.3 |
8.0 |
9.3% |
(22.7%) |
10.4 |
9.8 |
0.0% |
22.5% |
0.6x |
Buy |
|
Stanbic Holdings |
83.8 |
77.0 |
(8.1%) |
(29.5%) |
109.3 |
84.9 |
9.2% |
19.4% |
0.6x |
Accumulate |
|
Britam |
7.8 |
7.5 |
(3.4%) |
(16.7%) |
9.0 |
8.6 |
3.3% |
18.0% |
0.8x |
Accumulate |
|
Jubilee Holdings |
270.0 |
275.0 |
1.9% |
(21.7%) |
351.0 |
313.8 |
3.3% |
17.4% |
0.5x |
Accumulate |
|
HF Group |
4.0 |
3.6 |
(9.3%) |
(43.8%) |
6.5 |
4.1 |
0.0% |
12.9% |
0.2x |
Accumulate |
|
CIC Group |
2.4 |
2.2 |
(6.3%) |
(16.4%) |
2.7 |
2.1 |
0.0% |
(6.3%) |
0.7x |
Sell |
|
*Target Price as per Cytonn Analyst estimates **Upside/ (Downside) is adjusted for Dividend Yield ***For Disclosure, these are banks in which Cytonn and/ or its affiliates are invested in |
||||||||||
We are “Neutral” on equities for investors because, despite the sustained price declines, which have seen the market P/E decline to below its historical average presenting investors with attractive valuations in the market, the economic outlook remains grim.
I. Industry Reports
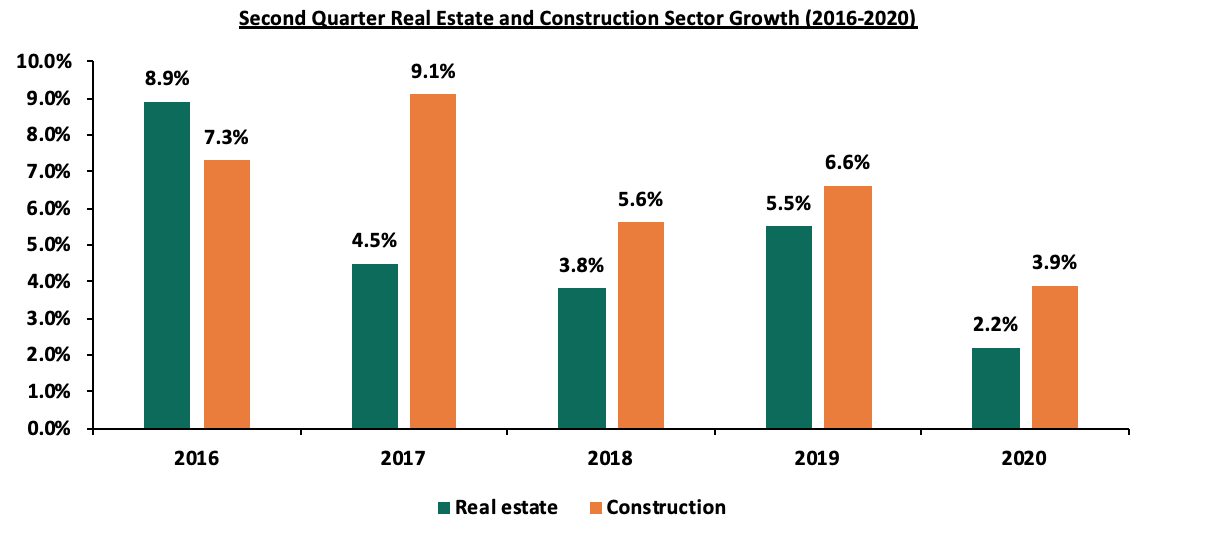
During the week, the Kenya National Bureau of Statistics (KNBS), released the Quarterly Gross Domestic Product Report-Q2’ 2020, highlighting that growth in real estate and construction activities in Q2’2020 came in at 2.2% and 3.9%, respectively. It is key to note the sectoral contribution to GDP in Q2’2020 stood at 9.2% and 6.2%, for the real estate and construction sector, respectively, compared to 8.3% and 5.5% in a similar period in 2019.
Cement consumption rose by 6.0% to 1.54 mn metric tonnes from 1.45 mn metric tonnes recorded during the same period in 2019. Credit advance to the construction sector also grew by 6.0% compared to a 5.6% contraction in the second quarter of 2019.
We believe the continued growth in the real estate sector has been supported by the existing housing deficit which according to National Housing Corporation is at around 2.0 mn and the increased value of building approvals which stood at Kshs 154.5 bn as at May 2020.
The chart below shows the sectors’ five-year performance:
Source: Kenya National Bureau of Statistics
The dismal growth in Q2’2020 was mainly attributable to;
- Constrained financing to developers due to the increased perceived risk levels,
- Business restructuring with some firms downsizing hence reducing occupancies and overall rental yields, and,
- Travel restrictions, attributed to the COVID-19 pandemic that led to a near cessation of international flights in a bid to minimize the spread of the virus which mainly affected the performance of the hospitality sector. The travel restrictions saw the total number of visitors arriving through Jomo Kenyatta International Airport (JKIA) and Moi International Airport (MIA) drop by 99.5% and 99.9% respectively, as highlighted in the chart below:
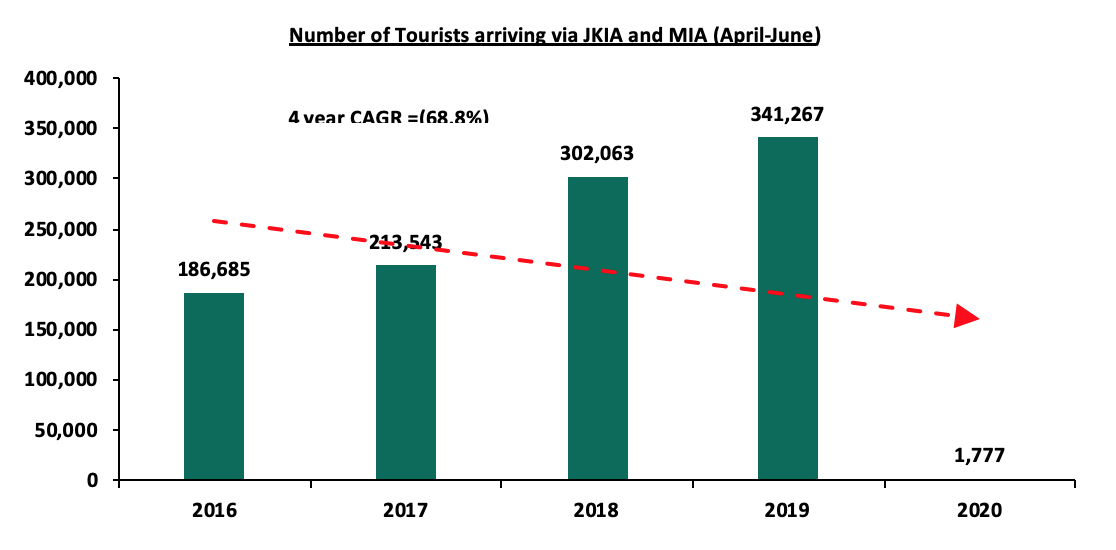
Source: Kenya National Bureau of Statistics
II. Residential Sector
During the week, Centum Investments handed over the first 96 units in two of its master-planned developments, Awali and Pearl Marina Estates. The company handed over 74 out of 152 maisonettes and bungalows in Awali Estate at Vipingo Ridge in Kilifi valued at Kshs 1.2 bn, and 22 villas in Uganda’s Pearl Marina properties in Entebbe.
The table below gives a summary of the unit types, sizes and prices for the development;
|
Centum’s Master-Planned Developments |
||||
|
Development |
Typology |
Unit Size (SQM) |
Unit Price (Kshs) |
Price per SQM |
|
Awali Estate |
2 bdr (Bungalow) |
155 |
13.0 mn |
83,871 |
|
2 bdr (Maisonette) |
210 |
17.0 mn |
80,952 |
|
|
Pearl Marina |
1 bdr |
50 |
4.2 mn |
84,000 |
|
2 bdr |
80 |
5.9 mn |
73,750 |
|
|
3 bdr |
100 |
7.2 mn |
72,000 |
|
|
3 bdr |
150 |
14.0 mn |
93,333 |
|
|
3 bdr (Townhouse) |
220 |
22.5 mn |
102,273 |
|
|
4 bdr (Villa) |
300 |
33.3 mn |
111,000 |
|
Sources: Online Research
Coastal regions attractiveness to real estate investors is supported by; i) tourist activities boosting the hotel industry and demand for luxury residences, ii) infrastructural developments leading to opening up of the area, and, iii) positive demographics having grown from 0.5 mn in 2009 to 1.5 mn in 2019 according to KNBS data. According to the Mombasa Real Estate Investment Opportunity August 2018 report, the average price of a 92 SQM 2-bedroom unit was Kshs 14.3 mn, bringing the average price per SQM to Kshs 136,324, while Awali Estate offers a 155 SQM 2-bedroom bungalow at Kshs 13.0 mn and a 210 SQM 2-bedroom maisonette at Kshs 17.0 mn bringing the price per SQM to Kshs 83,871 and Kshs 80,952, respectively showing that the Awali Estate is offering relatively cheap units.
In our view, the plethora of amenities coupled with the relatively cheaper price of the houses in the master-planned communities will continue to make them attractive. We expect to witness more developments coming up supported by investors’ search for higher returns and the growing middle class with increased disposable income.
III. Retail Sector
During the week, Naivas supermarket, a local retail chain, announced plans to open 4 more retail stores to be located at Lifestyle Mall in Nairobi’s CBD, Rongai, and two other undisclosed locations. The space at Lifestyle Mall was previously occupied by the troubled Nakumatt Supermarket. This will bring the total number of the retailer’s outlets to 70 following the recent opening of its 66th outlet at The Waterfront Mall in Karen on 12th October 2020. The move by the retail giant to increase its footprint is supported by; i) changing tastes and preferences of consumers, ii) positive demographics with Kenya’s current urbanization and population growth rates at 4.0% and 2.2% against a global average of 1.9% and 1.1%, respectively, according to the World Bank, iii) availability of prime retail space left out by struggling retailers, and, iv) growing middle class with higher purchasing power.
The table below shows the summary of the number of stores of the key local and international retail supermarket chains in Kenya;
|
Main Local and International Retail Supermarket Chains |
|||||
|
Name of Retailer |
Current number of branches |
Number of branches opened in 2020 |
Closed branches |
Branches expected to be opened |
Projected total number of branches |
|
QuickMart |
32 |
3 |
0 |
0 |
32 |
|
Carrefour |
8 |
1 |
0 |
3 |
11 |
|
Game Stores |
3 |
1 |
0 |
0 |
3 |
|
Naivas Supermarket |
66 |
5 |
0 |
4 |
70 |
|
Chandarana Foodplus |
20 |
1 |
0 |
0 |
20 |
|
Tuskys |
64 |
1 |
8 |
0 |
56 |
|
Uchumi |
37 |
0 |
33 |
0 |
4 |
|
Shoprite |
4 |
0 |
4 |
0 |
0 |
|
Nakumatt |
65 |
0 |
65 |
0 |
0 |
|
Choppies |
15 |
0 |
13 |
0 |
2 |
|
Total |
314 |
12 |
123 |
7 |
198 |
Source: Online research
In terms of performance, according to Cytonn Q3’2020 Markets Review, the retail sector recorded an average rental yield of 7.4%, a 0.4% points decline from 7.8% in FY’2019. The decline in performance is attributable to; i) exit by some retailers to cushion themselves against the impact of the COVID-19 pandemic, ii) growing focus on e-commerce thus reduced demand for physical space, and, iii) reduced consumer spending power attributed to the tough economic environment. Going forward, we expect the sector’s performance to be cushioned by the continued expansion of both local and international retailers taking up space left behind by struggling brands.
The real estate sector is expected to record positive activities supported by investor interest in master-planned communities and the expansion of local retailers.
Disclaimer: The views expressed in this publication are those of the writers where particulars are not warranted. This publication, which is in compliance with Section 2 of the Capital Markets Authority Act Cap 485A, is meant for general information only and is not a warranty, representation, advice or solicitation of any nature. Readers are advised in all circumstances to seek the advice of a registered investment advisor.

- Talk to us
- Kenya
- P.O Box 20695 - 00200, Nairobi, Kenya
- Cell +254709101200
- Tel +254709101200
- WhatsApp +254741676635
- United States
- +254709101200
- DOWNLOAD OUR APP
-


- Kenya
- 8th Floor, Pinetree Plaza, Kaburu Drive, Ngong Road, Nairobi, Kenya
- USA
- Suite 1150, 1775 Eye Street NW, USA, Washington DC 20006, USA
- Investments
- High Yield
- Private Equity
- Real Estate
- Real Estate
- RiverRun Estates
- Cytonn Towers
- The Ridge
- Taraji Heights
- The Alma