Investing in Unit Trust Funds, & Cytonn Weekly #20/2019
By Research Team, May 19, 2019
Executive Summary
Fixed Income
T-bills remained undersubscribed during the week, with the overall subscription rate increasing to 92.3%, from 57.9% recorded the previous week. The improved subscription was attributable to improved liquidity in the market following the end of the monthly Cash Reserve Requirement (CRR) cycle. During the week, Kenya issued its 3rd Eurobond raising USD 2.1bn (Kshs 210.0 bn) through a dual-tranche of 7 and 12-year tenors, with the value date set on 15th May 2019. The Eurobond will be listed on the London Stock Exchange (LSE). The issue was 4.5x oversubscribed, attracting orders worth USD 9.5 bn. According to the Energy and Petroleum Regulatory Authority, petrol prices have increased by 5.1% to Kshs 112.0 from Kshs 106.6 per litre previously, while diesel and kerosene prices have increased by 2.2% and 2.3% to Kshs 104.4 and Kshs 104.6 per litre, respectively, from Kshs 102.1 and Kshs 102.2 per litre, previously, with the new prices effective from 15th May 2019 to 14th June 2019;
Equities
During the week, the equities market was on a downward trend with NASI, NSE 20 and NSE 25 declining by 6.5%, 3.3% and 6.6%, respectively, taking their YTD performance to gains / (losses) of 2.0%, (5.9%) and (0.7%), for NASI, NSE 20 and NSE 25, respectively. NIC Group released their Q1’2019 financial results, with core earnings per share declining by 4.3% to Kshs 1.3, from Kshs 1.4 in Q1’2018;
Private Equity
In the financial services sector, Mauritius based Bank One, in which Kenyan banking group I&M Holdings has a 50.0% stake, is set to receive a USD 37.5 mn (Kshs 3.8 bn) loan from the International Finance Corporation (IFC). The bank intends to use this loan to strengthen its long-term funding position and to expand its lending operations to Small and Medium Enterprises (SMEs). In fundraising, Leapfrog Investments, an emerging markets-focused private equity firm, has announced the close of its third Impact Fund at USD 700.0 mn (Kshs 70.0 bn), surpassing its initial target of USD 600 mn (Kshs 60.0 bn), and bringing the total capital raised by the investment firm so far to USD 1.6 billion (Kshs 160.0 bn). This fund will invest in healthcare and financial services companies in Asia and Africa;
Real Estate
During the week, the Ministry of Housing, under the Civil Servants Housing Scheme Fund (CSHSF), proposed: (i) a reduction of mortgage deposits by public servants from 10.0% to 5.0% of the property value, and (ii) allowance to pay mortgage loans up to 5-years after the retirement age of 60-years, with the proposals aimed at making home loans more accessible to low income state workers. UN-Habitat announced that it had finalized on plans to build approximately 8,000 units in Mavoko Sub County, in support of the affordable housing initiative under the Kenyan Government’s Big 4 Agenda, while Housing Finance handed over 248 housing units to owners under its Shika Nyumba Campaign;
Focus of the Week
Everyone has financial goals that are unique to them and their financial needs. Personal finance is about meeting personal financial goals, whether it’s having enough for short-term financial needs, owning a home, buying a car, funding education, planning for retirement etc. There are various tools and avenues used for the purpose of financial planning. In this week’s focus note, we focus on unit trusts, and provide our view on the merits involved in investing in a unit trust, and why one should consider investing in unit trusts.
- Cytonn Asset Managers Limited, CAML, the regulated affiliate of Cytonn Investments, has received approval from the Retirement Benefits Authority, RBA, to set up two scheme funds, which will be operational soon, namely:
- Cytonn Personal Retirement Benefits Scheme, which will enable individuals who are not part of a retirement scheme, such as self-employed individuals, to make contributions towards their retirement. SMEs without a company scheme can also facilitate the registration of employees into the Scheme, and,
- Cytonn Income Drawdown Fund, which will enable individuals, upon retirement, to invest their pension funds and draw them down during their retirement.
- Interested in learning about real estate investments in a relaxing environment? Be sure to stop by our stand at the Capital Centre next weekend, on the 25th and 26th May from 9:00 am - 6:00 pm and start your investments journey;
- Following the recent approval by Retirement Benefits Authority (RBA), for Cytonn Asset Managers to manage pension funds, we are looking for business development consultants and agents with networks in the pensions industry to build our pensions business at very attractive commissions. If interested in being an agent or know someone who can be an agent, kindly contact us at pensions@cytonn.com;
- Following the completion and handover of Amara Ridge in Karen, we have now launched our next Karen project, dubbed Applewood, a Kshs 2.5 bn residential development located in Miotoni, Karen. This signature development shall comprise luxury homes, each sitting on 1/2 acre. We invite you to the exhibition of Applewood which is ongoing at the Amara Ridge Clubhouse (Location pin: https://goo.gl/maps/B3GVnu8pHyn) or at the Applewood Sales Centre on Miotoni Road (Location pin: https://goo.gl/maps/ZfABuGjFo1z) from 9:00 am to 5:00 pm daily. Call 0709 101 000 or email resales@cytonn.com to reserve a villa! See Video here;
- We continue to hold weekly workshops and site visits on how to build wealth through real estate investments. The weekly workshops and site visits target both investors looking to invest in real estate directly and those interested in high yield investment products to familiarize themselves with how we support our high yields. Watch progress videos and pictures of The Alma, Amara Ridge, and The Ridge;
- We continue to see very strong interest in our weekly Private Wealth Management Training (largely covering financial planning and structured products). The training is at no cost and is open only to pre-screened participants. We also continue to see institutions and investment groups interested in the training for their teams. Cytonn Foundation, under its financial literacy pillar, runs the Wealth Management Training. If interested in our Private Wealth Management Training for your employees or investment group, please get in touch with us through wmt@cytonn.com. To view the Wealth Management Training topics, click here;
- For recent news about the company, see our news section here;
- We have 10 investment-ready projects, offering attractive development and buyer targeted returns. See further details here: Summary of Investment-Ready Projects;
T-Bills & T-Bonds Primary Auction:
T-bills remained undersubscribed during the week, with the overall subscription rate increasing to 92.3%, from 57.9% recorded the previous week. The improved subscription was attributable to improved liquidity in the market following the end of the monthly Cash Reserve Requirement (CRR) cycle. The yields on the 91-day, 182-day and 364-day papers declined by 3.6 bps, 8.3 bps and 0.4 bps to 7.2%, 7.8% and 9.3%, respectively. The acceptance rate declined to 75.0% from 99.9% recorded the previous week, with the government accepting a total of Kshs 16.6 bn of the Kshs 22.1 bn worth of bids received. Investors’ participation was skewed towards the longer dated paper, with the 364-day recording improved subscription to 193.0%, from 59.7%, the previous week, while the subscription rates for the 91-day and 182-day papers declined to 49.8% and 8.0%, from 88.0% and 44.1% recorded the previous week, respectively.
Liquidity:
During the week, the average interbank rate declined to 5.7%, from 6.4% recorded the previous week, pointing to improved liquidity conditions in the money market, following the end of the monthly Cash Reserve Requirement (CRR) cycle and supported by government payments, which offset tax remittances by banks. The average volumes traded in the interbank market rose by 46.8% to Kshs 20.0 bn, from Kshs 13.6 bn the previous week.
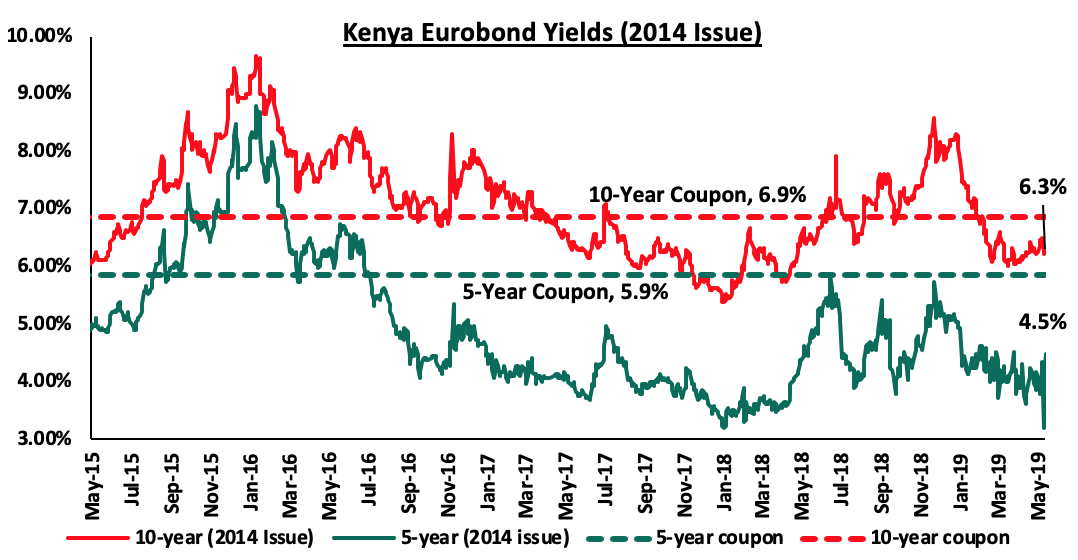
Kenya Eurobonds:
According to Bloomberg, the yield on the 10-year Eurobond issued in 2014 declined by 0.1% points to 6.3% from 6.4% the previous week, while that of the 5-year rose by 0.3% points to 4.5% from 4.2% the previous week. Key to note is that these bonds have 1.3-months and 5.1-years to maturity for the 5-year and 10-year, respectively.
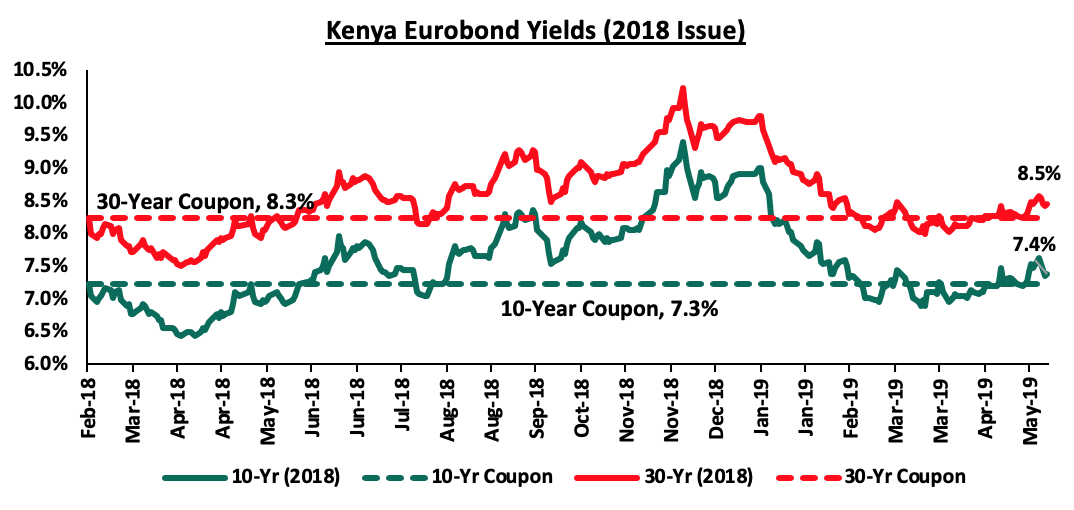
For the February 2018 Eurobond issue, yields on the 10-year Eurobond declined by 0.1% points to 7.4% from 7.5%, recorded the previous week while the yield on the 30-year Eurobond remained unchanged at 8.5% from the previous week. Since the issue date, the yields on both the 10-year Eurobond has increased by 0.1% points while the yields on the 30-year Eurobond has increased by 0.2% points.
The Kenya Shilling:
During the week, the Kenya Shilling remained stable against the US Dollar to close at Kshs 101.1, unchanged from the previous week, supported by inflows from investors buying government securities that matched dollar demand from merchandise importers. The Kenya Shilling has appreciated by 0.7% year to date in addition to the 1.3% appreciation in 2018, and in our view, the shilling should remain relatively stable to the dollar in the short term, supported by:
- The narrowing of the current account deficit with preliminary data on balance of payments indicating continued narrowing to 4.7% of GDP in the 12-months to February 2019, from 5.5% recorded in February 2018. The decline has been attributed to improved agriculture exports, increased diaspora remittances, strong receipts from tourism, and lower food and SGR-related equipment relative to 2017,
- Improving diaspora remittances, which have increased cumulatively by 3.8% in Q1’2019 to USD 665.6 mn, from USD 641.5 mn recorded in a similar period of review in 2018. The rise is due to:
- Increased uptake of financial products by the diaspora due to financial services firms, particularly banks, targeting the diaspora, and,
- New partnerships between international money remittance providers and local commercial banks making the process more convenient,
- CBK’s supportive activities in the money market, such as repurchase agreements and selling of dollars, and,
- High levels of forex reserves, currently at USD 8.0 bn (equivalent to 5.2-months of import cover), above the statutory requirement of maintaining at least 4-months of import cover, and the EAC Region’s convergence criteria of 4.5-months of import cover.
Highlights of the Week
During the week, Kenya issued its 3rd Eurobond, raising USD 2.1bn (Kshs 210.0 bn) through a dual-tranche Eurobond of 7-year and 12-year tenors, value dated 15th May 2019. A longer-term issuance would have been more preferable, though it comes at a trade-off on the yields as investors would demand a higher risk premium to compensate for the risk in tandem with the repayment period of the loan. The Eurobond will be listed on the London Stock Exchange (LSE). The issue was 4.5x oversubscribed attracting orders worth USD 9.5 bn. The Eurobond was priced at 7.0% for the 7-year tenor and 8.0% for the 12-year tenor with the proceeds expected to go towards:
- Refinancing the obligations outstanding from the USD 750.0 mn Eurobond issued in 2014, which is due on 24th June, 2019, and,
- Financing development infrastructure projects as well as the general budgetary expenditure.
The additional funds obtained from the Eurobond will add to the public debt burden, which stood at Kshs 5.4 tn as at March 2019, according to the latest data released by the CBK. As at the end of 2018 the debt to GDP ratio stood at 57.5%. We expect the new issue to drive the debt to GDP ratio to “around” 60.0%, which continues to raise concern mainly driven by the inability of KRA to meet the set revenue collection targets. As at the end of March, ordinary revenue hit Kshs 1.1 tn against a target of Kshs 1.4 tn. The performance of the issue was commendable considering the current market conditions, with the International Monetary Fund (IMF) having withdrawn their stand-by credit facility in 2018, coupled with the downgrading of Kenya’s growth prospects by both the IMF and the World Bank. Key to note is that, unlike the previous issues, with expected bullet payments on the maturity date, both the 7-year and the 12-year tenors are sinkable which means that the repayment of the principal will be amortized equally, at USD 300 mn and USD 400 mn, respectively, per year in the last three years to maturity, as opposed to a full repayment of the principal on redemption. This is commendable as it will avoid a spike in repayments in one particular year. The pricing is also fairly favourable, in comparison to the coupon on similar tenor bonds issued by Nigeria on 23rd November 2018, priced at 7.6% and 8.7% for the 7-year and 12-year Bond. Nigeria and Kenya have a similar B+ Long-Term Foreign-Currency Issuer Default Rating (IDR) with a Stable Outlook. Concerns however remain on the use of the proceeds. For a country to be able to refinance its debt obligations, funds ought to be directed to projects whose economic rate of return is higher than the cost of debt. The debt is however expected to repay maturing obligations as well as fund infrastructure projects whose economic rate of return continue to be in contention. The maturity profile of the debt also raises concerns as it’s relatively short, which raises maturity concentration risk as the country will be in a continuous state of maturing obligations between 2024 and 2028 since:
- The 10-year Eurobond issued in 2014 will be maturing in 2024,
- There will be the yearly repayments of USD 300.0 mn for the 7-year Eurobond issued in 2019 will be maturing in May 2027, whose repayments, are set to start in 2025, and,
- The 10-year Eurobond issued in 2018 will be maturing in 2028.
The Energy and Petroleum Regulatory Authority released their monthly statement on the maximum retail fuel prices in Kenya effective from 15th May 2019 to 14th June 2019. Below are the key take-outs from the statement:
- Petrol prices have increased by 5.1% to Kshs 112.0 from Kshs 106.6 per litre previously, and,
- Diesel and kerosene prices have increased by 2.2% and 2.3% to Kshs 104.4 and Kshs 104.6 per litre, respectively, from Kshs 102.1 and Kshs 102.2 per litre, previously.
The changes in prices are attributable to:
- An increase in the average landing cost of imported super petrol by 11.4% to USD 691.3 per ton in April 2019, from USD 620.5 per ton in March 2019, diesel increasing by 2.8% to USD 641.7 per ton from USD 624.5 per ton and Kerosene increasing by 2.0% to USD 675.8 per ton, from USD 662.6 per ton,
- The Free on Board (FOB) price of Murban crude oil lifted in April 2019 also increased by 6.5% to USD 73.1, from USD 68.6 per barrel in March 2019, and,
- The mean monthly US Dollar to Kenya Shilling exchange rate also depreciated by 0.7% to Kshs 101.1 in April, from Kshs 100.5 in March.
Consequently, we expect a rise in the transport index, which carries a weighting of 8.7% in the total consumer price index (CPI), due to the increased petrol and diesel prices. We shall publish our inflation projections in next week’s report.
Rates in the fixed income market have remained relatively stable as the government rejects expensive bids as they are currently 18.0% ahead of its domestic borrowing target for the current financial year, having borrowed Kshs 330.6 bn against a pro-rated target of Kshs 280.3 bn. A budget deficit is likely to result from depressed revenue collection, creating uncertainty in the interest rate environment as additional borrowing from the domestic market goes to plug the deficit. Despite this, we do not expect upward pressure on interest rates due to increased demand for government securities, driven by improved liquidity in the market owing to the relatively high debt maturities. Our view is that investors should be biased towards medium-term fixed income instruments to reduce duration risk associated with long-term debt, coupled with the relatively flat yield curve on the long-end due to saturation of long-term bonds.
Market Performance
During the week, the equities market was on a downward trend with NASI, NSE 20 and NSE 25 declining by 6.5%, 3.3% and 6.6%, respectively, taking their YTD performance to gains / (losses) of 2.0%, (5.9%) and (0.7%), for NASI, NSE 20 and NSE 25, respectively. The performance of NASI was driven by declines in large cap stocks such as KCB Group, Equity Group, Standard Chartered Bank Kenya (SCBK), Safaricom and Co-operative Bank, which declined by 10.4%, 6.5%, 6.1%, 5.6% and 4.0%, respectively.
Equities turnover rose by 75.7% during the week to USD 32.3 mn, from USD 18.4 mn the previous week, taking the YTD turnover to USD 604.6 mn. Foreign investors turned net buyers for the week, with a net buying position of USD 3.8 mn, from a net selling position of USD 0.5 mn last week.
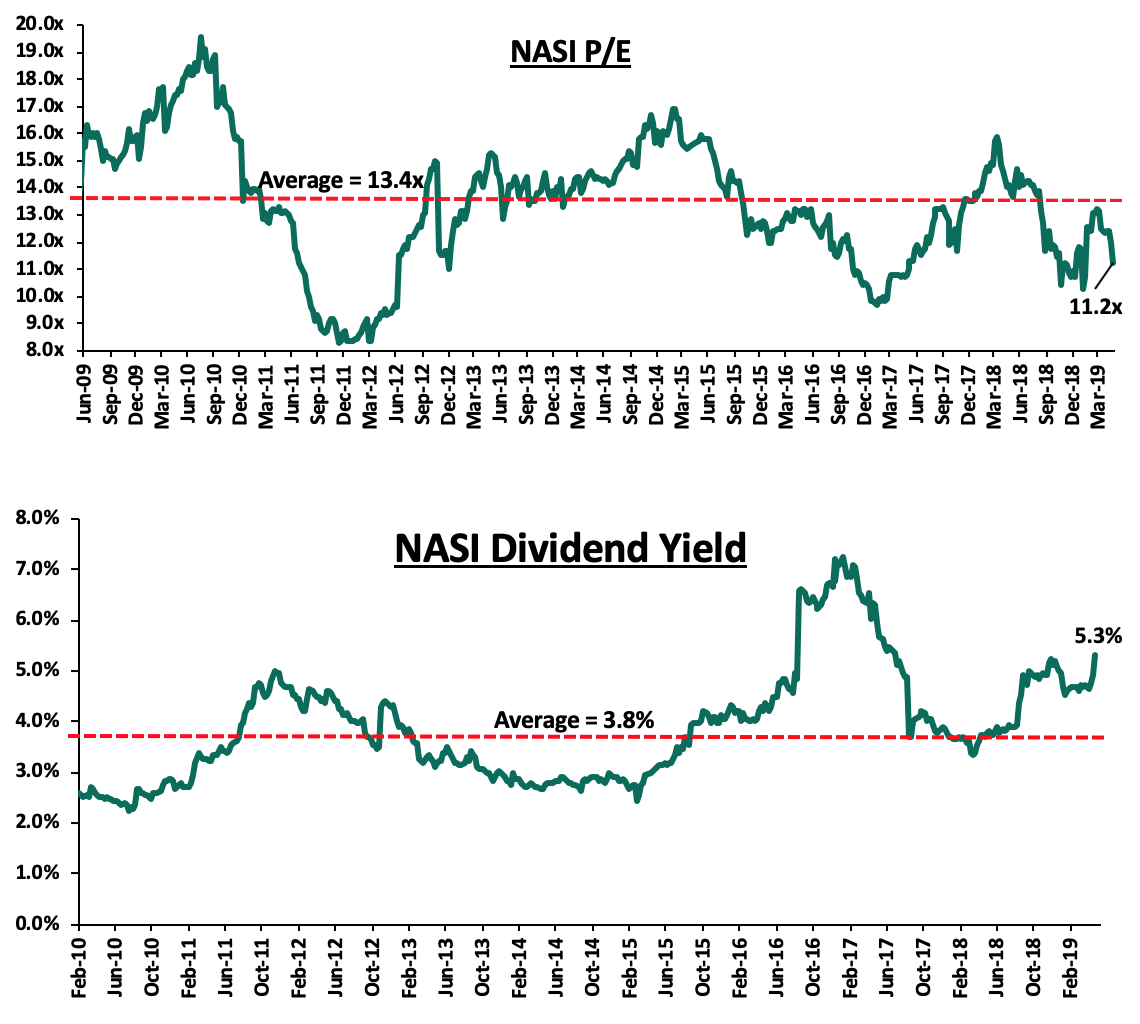
The market is currently trading at a price to earnings ratio (P/E) of 11.2x, 16.0% below the historical average of 13.4x, and a dividend yield of 5.3%, above the historical average of 3.8%. With the market trading at valuations below the historical average, we believe there is value in the market. The current P/E valuation of 11.2x is 15.7% above the most recent trough valuation of 9.7x experienced in the first week of February 2017, and 35.2% above the previous trough valuation of 8.3x experienced in December 2011. The charts below indicate the historical P/E and dividend yields of the market.
Earnings Releases
NIC Group released their Q1’2019 financial results:
NIC Group released their financial results with core earnings per share declining by 4.3% to Kshs 1.3, from Kshs 1.4 in Q1’2018, contrary to our projections of a 1.2% increase to Kshs 1.4. The performance was driven by an 8.8% increase in total operating income to Kshs 3.8 bn, from Kshs 3.5 bn in Q1’2018, which was outpaced by the 16.8% increase in total operating expenses to Kshs 2.5 bn, from Kshs 2.1 bn in Q1’2018. The variance in core earnings per share growth against our expectations was largely due to the faster 16.8% rise in total operating expenses to Kshs 2.5 bn, from Kshs 2.1 bn in Q1’2018, which was not in line with our expectation of a 11.2% increase to Kshs 2.4 bn.
- Total operating income rose by 8.8% to Kshs 3.8 bn, from Kshs 3.5 bn in Q1’2018. This was driven by a 9.4% increase in Net Interest Income (NII) to Kshs 2.7 bn, from Kshs 2.5 bn in Q1’2018, coupled with a 7.2% increase in Non-Funded Income (NFI) to Kshs 1.1 bn, from Kshs 1.0 bn in Q1’2018,
- Interest income rose by 1.3% to Kshs 4.73 bn, from Kshs 4.66 bn in Q1’2018. This was driven by a 7.6% growth in interest income from government securities to Kshs 1.7 bn, from Kshs 1.6 bn in Q1’2018. The increase in interest income was however weighed down by the 40.3% decline in interest income from placement assets to Kshs 16.7 mn from Kshs 27.9 mn in Q1’2018, and the 1.6% decline in interest income from loans to Kshs 2.99 bn from Kshs 3.04 bn in Q1’2018. The yield on interest-earning assets however declined to 10.6%, from 11.2% in Q1’2018, attributed to a decline in yields on government securities as well as a decline in lending rates due to the 100 bps Central Bank Rate (CBR) cut in 2018,
- Interest expense declined by 7.9% to Kshs 2.0 bn, from Kshs 2.2 bn in Q1’2018, largely due to the 8.1% decline in the interest expense on customer deposits to Kshs 1.6 bn, from Kshs 1.8 bn in Q1’2018, coupled with a 37.8% decline in interest expense on placement liabilities to Kshs 53.3 mn bn from Kshs 85.7 mn in Q1’2018. However, other interest expenses rose by 1.4% to Kshs 0.324 bn from Kshs 0.320 bn in Q1’2018. The cost of funds thus declined to 5.1%, from 5.4% in Q1’2018. The Net Interest Margin (NIM) declined to 5.9%, from 6.3% in Q1’2018,
- Non-Funded Income rose by 7.2% to Kshs 1.1 bn from Kshs 1.0 bn in Q1’2018. The increase was mainly driven by the 6.2% increase in total fees and commissions to Kshs 0.60 bn, from Kshs 0.56 bn in Q1’2018, with fees and commissions on loans income improving as a result of increased lending activity by the bank during the period under review. The improvement in NFI was also supported by the 17.5% growth in other income to Kshs 0.21 bn, from Kshs 0.18 bn in Q1’2018, and a 2.8% growth in forex trading income to Kshs 0.31 bn, from Kshs 0.30 bn in Q1’2018. The revenue mix shifted to 71:29 from 70:30 funded to non-funded income owing to the slightly faster increase in NII,
- Total operating expenses rose by 16.8% to Kshs 2.5 bn, from Kshs 2.1 bn in Q1’2018, largely driven by a 21.4% increase in Loan Loss Provisions (LLP) to Kshs 0.7 bn from Kshs 0.6 bn in Q1’2018, coupled with an 11.5% increase in staff costs to Kshs 0.9 bn, from Kshs 0.8 bn in Q1’2018, and a 19.1% increase in other operating expenses to Kshs 0.9 bn, from Kshs 0.8 bn in Q1’2018,
- The Cost to Income Ratio (CIR) deteriorated to 65.2%, from 60.7% in Q1’2018. Without LLP, the cost to income ratio deteriorated to 47.6%, from 45.0% in Q1’2018,
- Profit before tax decreased by 3.7% to Kshs 1.3 bn, up from Kshs 1.4 bn in Q1’2018. Profit after tax declined by 4.3% to Kshs 0.9 bn in Q1’2019, from Kshs 1.0 bn in Q1’2018, with the difference in growth attributable to the marginal increase in the effective tax rate to 30.3%, from 29.8% in Q1’2018,
- The balance sheet recorded an expansion as total assets increased by 6.9% to Kshs 213.6 bn, from Kshs 199.8 bn in Q1’2018. Growth was supported by a 2.1% increase in the loan book to Kshs 118.3 bn, from Kshs 115.9 bn, coupled with a 10.3% increase in government securities to Kshs 60.4 bn, from Kshs 54.8 bn in Q1’2018,
- Total liabilities rose by 5.1% to Kshs 176.3 bn from Kshs 167.8 bn in Q1’2018, driven by a 5.0% increase in customer deposits to Kshs 151.1 bn from Kshs 143.9 bn in Q1’2018. Deposits per branch increased by 25.4% to Kshs 3.7 bn from Kshs 2.9 bn in Q1’2018, as the number of branches declined to 41, from 49 as at Q1’2018,
- Borrowings declined by 10.9% to Kshs 14.9 bn, from Kshs 16.8 bn in Q1’2018,
- The faster growth in deposits compared to the loan growth led to a decline in the loan to deposit ratio to 78.3%, from 80.5% in Q1’2018,
- Gross Non-Performing Loans (NPLs) increased by 9.4% to Kshs 17.4 bn in Q1’2019, from Kshs 15.4 bn in Q1’2018. The NPL ratio thus deteriorated to 13.9% in Q1’2019 from 11.9% in Q1’2018. General Loan Loss Provisions decreased by 26.7% to Kshs 4.5 bn, from Kshs 6.1 bn in Q1’2018, and consequently the NPL coverage deteriorated to 40.8% in Q1’2019, from 48.0% in Q1’2018,
- Shareholders’ funds increased by 17.2% to Kshs 37.0 bn in Q1’2019 from Kshs 31.6 bn in Q1’2018, supported by a 15.7% increase in retained earnings to Kshs 29.9 bn, from Kshs 25.9 bn in Q1’2018,
- NIC Group remains sufficiently capitalized with a core capital to risk-weighted assets ratio of 19.7%, 9.2% points above the statutory requirement. In addition, the total capital to risk-weighted assets ratio came in at 21.3%, exceeding the statutory requirement by 6.8% points. Adjusting for IFRS 9, the core capital to risk weighted assets stood at 20.9%, while total capital to risk-weighted assets came in at 22.5%, and,
- The bank currently has a Return on Average Assets (ROaA) of 2.0%, and a Return on Average Equity (ROaE) of 12.2%.
Key Take-Outs:
- The bank’s performance was largely weighed down by rising operational inefficiencies, as the rise in total operating expenses outpaced the rise in total operating income. The bank recorded significant increments in provisioning expenses, as the asset quality deteriorated with NPL ratio rising to 13.9% from 11.9% in Q1’2018, and,
- The bank’s cost of funds declined to 5.1% from 5.4% in Q1’2018. This may largely be due to the removal of the 70.0% of the Central Bank Rate (CBR) floor on interest paid to deposits, in the Finance Act 2018. However, the cost of funds remains way above the market average of 3.7%, implying that funding for NIC Group still remains relatively expensive compared to the market. We however expect this to improve going forward, as the merger with CBA is likely to make it easier for NIC to mobilize cheaper funding, aided by CBA’s large customer base, increased scale and market reach with a combined entity, and digital banking platforms, which will likely improve Net Interest Margins and consequently generating higher Net Interest Income.
For more information, please see our NIC Group Q1’2019 Earnings Note
The table below highlights the performance of the banks that have released so far, showing the performance using several metrics, and the key take-outs of the performance.
|
Bank |
Core EPS Growth |
Interest Income Growth |
Interest Expense Growth |
Net Interest Income Growth |
Net Interest Margin |
Non-funded income Growth |
NFI to Total Operating Income |
Growth in Total Fee and Commissions |
Deposit Growth |
Growth in Govt Securities |
Cost to Income |
Loan to Deposit ratio |
Loan Growth |
Cost of Funds |
Return on average equity |
|
Stanbic Bank |
N/A |
12.9% |
2.2% |
19.3% |
4.9% |
17.7% |
49.0% |
61.5% |
29.0% |
(8.8%) |
53.0% |
75.9% |
12.6% |
3.2% |
14.3% |
|
Equity |
4.9% |
6.5% |
7.4% |
6.3% |
8.6% |
6.9% |
40.8% |
3.2% |
12.1% |
13.0% |
49.8% |
71.3% |
12.7% |
2.6% |
22.8% |
|
NIC Group |
(4.3%) |
1.3% |
(7.9%) |
9.4% |
5.9% |
7.2% |
29.1% |
6.2% |
5.0% |
10.3% |
65.2% |
78.3% |
2.1% |
5.1% |
12.2% |
|
Q1’2019 Mkt cap Weighted Average |
0.5% |
5.0% |
0.3% |
9.1% |
7.1% |
8.2% |
36.7% |
11.0% |
10.9% |
9.4% |
56.7% |
74.8% |
8.2% |
3.7% |
17.4% |
|
Q1’2018 Mkt cap Weighted Average |
14.4% |
9.3% |
11.4% |
8.1% |
8.1% |
9.5% |
37.1% |
12.2% |
9.4% |
25.0% |
56.6% |
76.8% |
6.1% |
3.6% |
17.6% |
Key takeaways from the table above include:
- Three banks have released their Q1’2019 financial results, recording a 0.5% average increase in core Earnings Per Share (EPS), compared to a growth of 14.4% in Q1’2018 for the entire banking sector, and consequently, the Return on Average Equity (RoAE) has declined to 17.4%, from 17.6% in Q1’2018,
- The banks that have released results have recorded better deposit growth, which came in at 10.9%, faster than the 9.4% growth recorded in Q1’2018. Despite the faster deposit growth, interest expenses rose marginally by 0.3%, indicating that banks have been mobilizing relatively cheaper deposits. Furthermore, in September 2018, an implementation of the Finance Act 2018 saw the removal of the minimum interest rate payable on deposits, which stood at 70.0% of the Central Bank Rate (CBR). This helped mitigate high increments in interest expense, despite the relatively faster deposit growth,
- Average loan growth came in at 8.2%, which was faster than the 6.1% recorded in Q1’2018, indicating that there was an improvement in credit extension, with banks targeting select segments such as corporate entities and Small and Medium Enterprises (SMEs). Government securities on the other hand recorded a growth of 9.4% y/y, which was faster compared to the loans, albeit slower than 25.0% recorded in Q1’2018. This highlights banks’ continued preference towards investing in government securities, which offer better risk-adjusted returns. Interest income increased by 5.0%, compared to a growth of 9.3% recorded in Q1’2018. The slower growth in interest income despite the increased allocations to both loans and government securities may be attributable to the decline in yields on loans owing to the 100-bps decline in the CBR, and the decline in yields on government securities, and consequently, the Net Interest Margin (NIM) has thus declined to 7.1% from 8.1% in Q1’2018, and,
- Non-Funded Income grew by 8.2% y/y, slower than 9.5% recorded in Q1’2018. The growth in NFI was weighed down as total fee and commission income grew by 11.0%, slower than the 12.2% growth recorded in Q1’2018. The fee and commission income were also subdued by the implementation of the Effective Interest Rate (EIR) model under IFRS 9 in 2018, which requires banks to amortize the fees and commissions on loans, over the tenor of the loan. A faster growth in Net Interest Income (NII) led to a decline in the contribution of NFI to total operating income, to 36.7% from 37.1% in Q1’2018.
Weekly Highlights
During the week, NIC Group and Commercial Bank of Africa (CBA) announced the leadership of the combined entity, upon the completion of the proposed merger between the two banks. Mr. John Gachora, who is currently the Group Managing Director of NIC Group will become the Group Managing Director and Chief Executive Officer of the combined entity, while Isaac Awuondo who is currently the Group Managing Director of CBA will become Chairman of the Kenyan banking subsidiary, and will maintain direct oversight over the Digital Business. The appointments are in line with our expectations, which we highlighted in our Cytonn January 2019 Monthly Report. The merger proposal has already been ratified by the shareholders of both companies, with the Competition Authority of Kenya (CAK) also approving the transaction during the week, highlighting that it was unlikely to lessen the competition in the relevant product market for retail and corporate banking services in Kenya. With digital banking being a core aspect in the merger, a separate digital banking unit will be created, and it will be overseen by its own distinct board. We note that the transaction has been progressing with some of the requisite approvals being granted. Pending approvals include that of the Central Bank of Kenya (CBK). Both banks are preparing for a merger on the day to day operations, with an Integration Management Office having been set up and a detailed integration work plan developed. We expect the merger to be completed with the set-out timelines, with the merged entity set to commence operations in August 2019.
During the week, KCB Group released a circular to its shareholders detailing the merger guidelines and expected timelines. The transaction details were as we had highlighted in our Kenya Listed Banks FY’2018 Report & Cytonn Weekly #16/2019. If successful, the transaction will see KCB Group significantly increase its balance sheet, with management highlighting that they expected to reach the Kshs 1.0 tn mark by the end of 2022. The circular also highlighted that in a bid to streamline the operations of the group, there may be job cuts, as the bank removes overlapping roles, reduce the associated expenses and consequently improve the overall efficiency. A successful completion of the merger is however contingent on the granting of the approvals from various regulatory bodies, with only The Capital Markets Authority (CMA) granting approval so far, and the acceptance of the offer by the Board of Directors of National Bank of Kenya (NBK). KCB Group expects to complete the transaction by 8th October 2019, with NBK expected to be de-listed, and remain as a separate subsidiary of KCB. We continue to expect activity on the consolidation front as the larger players look to consolidate their market positions, while smaller players that are struggling to operate under the current operating environment will also likely move to form strategic partnerships through mergers or outright sale. We thus maintain our view that the sector would be more stable with fewer, well capitalized players able to withstand any systemic shocks.
Universe of Coverage
Below is a summary of our SSA universe of coverage:
|
Banks |
Price as at 10/05/2019 |
Price as at 17/05/2019 |
w/w change |
YTD Change |
Target Price* |
Dividend Yield |
Upside/Downside** |
P/TBv Multiple |
Recommendation |
|
Diamond Trust Bank |
122.0 |
121.0 |
(0.8%) |
(22.7%) |
241.5 |
2.1% |
101.7% |
0.6x |
Buy |
|
UBA Bank |
6.5 |
6.0 |
(7.7%) |
(22.1%) |
10.7 |
14.2% |
92.5% |
0.4x |
Buy |
|
Zenith Bank |
20.0 |
19.6 |
(2.0%) |
(15.0%) |
33.3 |
13.8% |
83.8% |
0.9x |
Buy |
|
KCB Group*** |
40.5 |
36.3 |
(10.4%) |
(3.1%) |
60.0 |
9.6% |
74.9% |
1.2x |
Buy |
|
CRDB |
125.0 |
120.0 |
(4.0%) |
(20.0%) |
207.7 |
0.0% |
73.1% |
0.4x |
Buy |
|
CAL Bank |
0.9 |
0.8 |
(5.7%) |
(16.3%) |
1.4 |
0.0% |
70.7% |
0.7x |
Buy |
|
Equity Group |
39.0 |
36.4 |
(6.5%) |
4.4% |
58.1 |
5.5% |
65.1% |
1.6x |
Buy |
|
Co-operative Bank |
12.4 |
11.9 |
(4.0%) |
(16.8%) |
18.5 |
8.4% |
63.9% |
1.0x |
Buy |
|
GCB Bank |
4.5 |
5.0 |
11.3% |
8.9% |
7.7 |
7.6% |
61.7% |
1.2x |
Buy |
|
Ecobank |
6.7 |
6.8 |
1.2% |
(9.3%) |
10.7 |
0.0% |
57.8% |
1.5x |
Buy |
|
NIC Group |
30.5 |
31.6 |
3.6% |
13.7% |
48.8 |
3.2% |
57.6% |
0.8x |
Buy |
|
Access Bank |
7.1 |
6.5 |
(9.2%) |
(5.1%) |
9.5 |
6.2% |
53.5% |
0.4x |
Buy |
|
I&M Holdings |
119.0 |
60.0 |
(49.6%) |
(29.4%) |
83.9 |
5.8% |
45.6% |
0.6x |
Buy |
|
Barclays Bank |
10.7 |
10.5 |
(1.4%) |
(4.1%) |
13.1 |
10.5% |
35.2% |
1.4x |
Buy |
|
National Bank |
4.4 |
3.9 |
(9.4%) |
(25.9%) |
5.2 |
0.0% |
32.0% |
0.3x |
Buy |
|
Guaranty Trust Bank |
32.0 |
30.6 |
(4.4%) |
(11.2%) |
37.1 |
7.8% |
29.1% |
1.9x |
Buy |
|
Stanbic Bank Uganda |
30.0 |
30.0 |
0.0% |
(3.2%) |
36.3 |
3.9% |
24.8% |
2.1x |
Buy |
|
Stanbic Holdings |
103.0 |
97.5 |
(5.3%) |
7.4% |
115.6 |
6.0% |
24.6% |
0.9x |
Buy |
|
Standard Chartered |
193.0 |
181.3 |
(6.1%) |
(6.8%) |
203.8 |
6.9% |
19.3% |
1.5x |
Accumulate |
|
SBM Holdings |
5.9 |
5.9 |
0.0% |
(1.3%) |
6.6 |
5.1% |
16.7% |
0.8x |
Accumulate |
|
Union Bank Plc |
7.0 |
7.0 |
0.0% |
25.0% |
8.2 |
0.0% |
16.4% |
0.7x |
Accumulate |
|
Bank of Kigali |
274.0 |
274.0 |
0.0% |
(8.7%) |
299.9 |
5.1% |
14.5% |
1.5x |
Accumulate |
|
Bank of Baroda |
129.0 |
129.0 |
0.0% |
(7.9%) |
130.6 |
1.9% |
3.2% |
1.1x |
Lighten |
|
FBN Holdings |
7.3 |
7.0 |
(3.4%) |
(11.9%) |
6.6 |
3.6% |
(1.7%) |
0.4x |
Sell |
|
Ecobank Transnational |
10.3 |
10.0 |
(2.9%) |
(41.2%) |
9.3 |
0.0% |
(7.2%) |
0.4x |
Sell |
|
Standard Chartered |
19.0 |
21.8 |
14.7% |
3.8% |
19.5 |
0.0% |
(10.7%) |
2.7x |
Sell |
|
Stanbic IBTC Holdings |
46.0 |
44.1 |
(4.2%) |
(8.1%) |
37.0 |
1.4% |
(14.6%) |
2.3x |
Sell |
|
HF Group |
4.4 |
4.4 |
0.0% |
(20.6%) |
2.9 |
8.0% |
(26.1%) |
0.2x |
Sell |
*Target Price as per Cytonn Analyst estimates
**Upside / (Downside) is adjusted for Dividend Yield
***Banks in which Cytonn and/or its affiliates holds a stake.
****Stock prices indicated in respective country currencies
We are “Positive” on equities for investors as the sustained price declines has seen the market P/E decline to below its historical average. We expect increased market activity, and possibly increased inflows from foreign investors, as they take advantage of the attractive valuations, to support the positive performance.
Mauritius based Bank One, in which Kenyan banking group I&M Holdings has a 50.0% stake, is set to receive a USD 37.5 mn (Kshs 3.8 bn) loan from the International Finance Corporation (IFC), with an undisclosed tenor. The loan will be classified as senior debt, therefore ranking higher than other Bank One’s obligations. The bank intends to use this loan to strengthen its long-term funding position and to expand its lending operations to SMEs in Mauritius that fit their lending criteria; that is, SMEs with 10 to 300 employees and annual sales of Kshs 10.0 mn to Kshs 1.5 bn. Financial inclusion is one of IFC’s priorities and it has continued to support financial institutions and financial services providers across Sub-Saharan Africa to advance financial inclusion and increase access to finance for underserved markets as access to finance remains a major constraint for many SMEs, with many banks opting to lend to well-established firms presumed to be less risky and thus curtailing the growth of SMEs, with a report done by IFC indicating that over 200 million SMEs in Africa lack access to credit necessary to grow and prosper. In Kenya IFC has issued loans to several banks including;
- A Kshs 15.5 bn loan issued in February 2018 to Co-operative Bank with a tenor of 7-years, and
- A Kshs 1.0 bn loan issued to I&M Holdings in January 2018, with an undisclosed tenor.
For banks, access to loans from international institutions has been instrumental to their survival as it has helped them bridge the asset-liability mismatch by tenor due to the relatively long-term nature of loans and short-term nature of deposits.
In fundraising, Leapfrog Investments, an emerging markets-focused private equity firm, has announced the close of its third Impact Fund (Fund III) at USD 700.0 mn (Kshs 70.0 bn), surpassing its USD 600.0 mn (Kshs 60.0 bn) target by 16.7%, with the funds being used to invest in healthcare and financial services companies in Asia and Africa. This close brings the total capital raised by the investment firm so far to USD 1.6 bn (Kshs 160.0 bn), with its first fund having closed at USD 135 mn (Kshs 13.5 bn) in 2010 and the second fund closing at USD 400 mn (Kshs 40.0 bn) in 2014; the firm also manages USD 350 mn (Kshs 35.0 bn) for Prudential Financial Incorporation, targeting investments in life insurance companies in Ghana, Kenya and Nigeria. Fund III was led by US-based Prudential Financial and other institutional investors in participation including, pensions and asset managers, development financiers, foundations and family offices. Leapfrog invests in healthcare and financial services companies in Asia and Africa that target emerging consumers defined as low income, by World Bank standards, with less than USD 10 (Kshs 1,000) per day in the household, with its priority countries being Kenya, Nigeria, Ghana, South Africa, India, Indonesia, Philippines and Sri Lanka. In Kenya, Leapfrog has invested in several businesses in the private sector including;
- Kshs 2.2 bn injection into Kenya’s Goodlife Pharmacy in 2016, acquiring a majority stake in the pharmacy, and,
- Kshs 1.6 bn injection in Resolution Insurance in 2014, followed by an additional Kshs 1.1 bn investment in 2016 into the same company, making Leapfrog the majority shareholder.
The continued investment into the private sector by international organizations and this has enhanced regional integration by enabling companies expand across borders.
We maintain a positive outlook on private equity investments in Africa as evidenced by the increasing investor interest, which is attributed to; (i) economic growth, which is projected to improve in Africa’s most developed PE markets, (ii) attractive valuations in Sub Saharan Africa’s private markets compared to its public markets, and (iii) attractive valuations in Sub Saharan Africa’s markets compared to global markets. Going forward, the increasing investor interest, stable macro-economic and political environment will continue to boost deal flow into African markets.
- Residential Sector
During the week, the Ministry of Housing, under the Civil Servants Housing Scheme Fund (CSHSF), proposed:
-
- The reduction of mortgage deposits by public servants from 10.0% to 5.0% of the property value, and,
- An allowance to pay mortgage loans up to 5-years after the retirement age of 60-years.
The Civil Servants Housing Scheme Fund (CSHSF) was established in 2004, with the aim of providing housing loan facilities to civil servants for the purpose of either purchasing or constructing a residential house and developing housing units for sale or rental by civil servants. Since inception, the scheme has facilitated more than 3,000 civil servants to access housing, through housing finance loans or purchase of houses constructed through the scheme. The scheme has partnered with two mortgage finance institutions, Home and Loan of KCB and Housing Finance with the aim of granting housing loans to civil servants. One of the major challenges that has faced the scheme is the high interest rates and short-term repayment periods, which have put off potential home-buyers. The incentives tabled before parliament aim at making home loans more accessible to low income state workers. This follows the continued government focus on enhancing home ownership in Kenya, through the affordable housing initiative under the Kenyan Government’s Big 4 Agenda. Some of the other government initiatives in line with the same include;
- The formation of the Kenya Mortgage Refinancing Company (KMRC) whose main function is enhancing mortgage affordability by enabling long-term loans; see Cytonn’s KMRC Note for more details on the same, and,
- The establishment of the National Housing Development Fund (NHDF), which includes a 1.5% housing levy on employee’s basic salaries towards a fund with the contribution expected to act as a saving for employees.
The above Kenyan Government initiatives are aimed at meeting the huge existing housing deficit, which stands at 2.0 mn units and growing by 200,000 units p.a., according to National Housing Corporation, Kenya. This has been fueled by:
- Inaccessibility and unaffordability of off-take financing/mortgages in Kenya mainly due to low income levels that cannot service a mortgage, as according to data from the Kenya National Bureau of Statistics, 74.5% of employees in the formal sector earn less than Kshs 50,000 per month, in addition to 83.4% of total employment being in the informal sector with relatively unpredictable incomes and limited job security and thus they are unable to afford a house,
- Escalating property prices attributed to increased demand for housing and limited supply,
- Inadequate and high costs of funds, evidenced by reduced credit advancement to the private sector due to tightened underwriting standards, in addition to the high actual cost of credit averaging at 18.0%, which then raises the cost of development, thus making development expensive, and,
- Inadequate infrastructural development.
In our view, if successfully endorsed, the incentives will enhance housing uptake, through encouraging more public servants to take up housing units, given the reduced burden of the deposit amount and the increased period of repayment, which means the borrower is able to pay smaller installments thus making the mortgage more affordable.
The UN-Habitat, a United Nations agency, announced that it had finalized on plans to build approximately 8,000 units in Mavoko Sub-County, in support of the affordable housing project under the Big 4 Agenda. The project, which will sit on a 55-acre parcel of land, will be launched in five-months’ time and is aimed at resettling slum dwellers from the Nairobi Metropolitan Area. Other project details among them unit sizes are yet to be disclosed, but social housing units within the project are set to cost between Kshs 0.5 mn and 0.7 mn. Delivering of the units will be done at the lowest possible price that will be achieved through the use of various building technologies while maintaining high quality. The project is a step towards the achievement of the affordable housing initiative and adds to the count of other affordable housing projects set to be constructed in Mavoko area such as the 30,000 housing units project by National Social Security Fund (NSSF). Another project undertaken by the UN agency under their slum prevention programme is the relocation of 1,200 households from Soweto East to a decanting site in Lang’ata in 2010. Some of the key challenges that have continued to cripple the implementation of such projects include;
- Resistance where families refuse to be relocated because they do not want to pay higher rent than they pay in areas such as Kibera and fear of projects failure to deliver promised units,
- Unit allocation issues where some of the households are not included in the lists of beneficiaries thus fail to acquire units,
- Purchase of the units by high income earners and letting at higher rental charges hence locking out the target tenants, and
- Lack of proper analysis and consideration of the residents’ economic activities as well as the needs of the vulnerable (physically challenged) resulting in resistance.
For such a project to be successful, we recommend that adoption of participatory processes in slum upgrading so that the community can embrace and support it, in addition to implementation of a strategic unit allocation plan to ensure targeted beneficiaries acquire the units. For the Mavoko housing project, we expect the above factors will be considered and hence provide the much-needed affordable housing units for the low and middle-income earners, in addition to encouraging more organizations and private developers to take part in the provision of affordable housing.
During the week, Housing Finance handed over 248 housing units to owners under its Shika Nyumba Campaign. The fully sold out development, called Richland Pointe is located along Kamiti Road and is a joint venture with Richland Development Limited, a local real estate consultant firm. The houses valued at Kshs 1.9 bn, comprise of 2-bedroom units of 95 SQM and 3-bedroom apartments of 125 SQM, selling at approximately Kshs 82,737 per SQM, for Kshs 8.5 mn and Kshs 9.5 mn, respectively. The project, which started construction in 2016, is an example of a successful joint venture arrangement, where Richland Dam Estate Limited provided land where the project sits on, whilst Housing Finance provided equity equivalent to the land. The benefits of such a partnership include;
- An increased capital base as the partners make contributions (land and/or equity) into the project,
- Development expertise as the developer in a joint venture provides development expertise in terms of concept development, design, project management and oversees the project to completion,
- Access to market distribution channels especially while partnering with a reputable brand as it ensures the real estate product reaches its suited market and thus faster exit, and,
- Shared risks and gains as a partnership enables spreading of economic and other market risks that might result from undertaking any worthy real estate investment, and that would otherwise be borne alone.
The Richland Pointe project signifies the continued involvement of strategic partners in the provision of housing in Kenya, fuelled by;
- Huge demand for housing, particularly decent, affordable housing for the middle-income segment of the market,
- Relatively high returns attracting developers, and,
- Availability of development land in the satellite towns such as Ruiru in Kiambu County.
We therefore expect the above factors to continue resulting in increased development activities in the residential sector, with the market recording partnerships among both the public and private sector players.
Other highlights during the week;
- Vitafoam Products, a factory-cum retailer, opened a showroom at the Two Rivers Mall, along Kiambu Road. The company, which makes mattresses and cushions, has taken up 2,200 square feet on the first floor of the mall. This will mark the company’s third showroom in Kenya, with others being situated along Mombasa Road and Muthithi Road in Westlands. The expansion of the retailer, signifies the continued expansion of local retailers, resulting in a growing demand for retail space. This is evidenced by growing occupancy rates in some submarkets such as Kiambu Road, which recorded 0.3% points increase from 69.5% in 2018 to 69.8% in Q1’2019.
We expect the real estate sector to continue recording increased activities especially in the residential sector, fueled by the continued focus on provision of affordable housing for the middle-income segment of the market, by both the government and other strategic partners such as United Nations agency, UN- Habitat.
Everyone has financial goals that are unique to them and their financial needs. Personal finance is about meeting personal financial goals, whether it’s having enough for short-term financial needs, owning a home, buying a car, funding education, planning for retirement etc. There are various avenues of investments. In this week’s focus note, we focus on investing in Unit Trusts, also referred to as Mutual Funds. To cover this topic, we shall address the following:
- What a unit trust is and what investments products it offers,
- The structure of unit trusts,
- Industry analysis on the growth of the assets under management,
- Conclusion: Under this we give our view based on the merits of investing in a unit trust and why one should consider unit trusts for investment.
Section I: What is a unit trust and what investments products does it offer?
A unit trust is defined as an investment scheme that pools money together from many investors who share the same financial objective to be managed by a professional fund manager who invest the pooled money in a portfolio of securities such as shares, bonds and other money market instruments or other authorized securities to achieve the objectives of the trust. The pooled money in the unit trust fund earns income in the form of dividends, interest income and/or capital gains, depending on the asset class the funds are invested in.
Investors in a unit trust fund are usually issued with units, which act as a share of the entire fund’s underlying portfolio of securities, in exchange for the amounts invested. To compute the underlying value of assets of the unit trust, one multiplies the total number of units issued by the unit price. The price of each unit, in most instances, is made public in most jurisdictions.
Investors in unit trusts have a variety to choose from as they offer different investment vehicles/funds which have different risk exposures as investors have different risk appetites. The most common funds include:
- Money Market Fund: Under this type of fund, money is invested in liquid interest-bearing securities that have a maturity of less than 12-months. These securities include bank deposits, and other short-term money market instruments including short- dated treasury bills and commercial papers. The Fund is best suited for investors who require a low risk investment that offers capital stability, liquidity and a high-income yield. The Fund is a good safe haven for investors who wish to switch from a higher risk portfolio to a low risk, high interest portfolio, especially during times of high stock market volatility,
- Equity Fund: The objective of this type of Fund is to offer superior returns over the medium to longer term by maximizing capital gains through investing in listed securities. This fund is designed for investors seeking medium to long term capital growth in their portfolios and who want to gain exposure to equity investments. The Fund is suited to investors who want to invest their money over a period of at least 3 years and beyond. The Fund has a medium to high risk profile. Due to the volatile nature of the stock markets, risk is usually reduced through holding a diversified portfolio of shares across different sectors,
- Fixed Income Fund: The main objective of this Fund is to achieve a reasonable level of current income as well as maximum stability of the capital invested. Funds are invested in interest-bearing securities that include, treasury bills, treasury bonds, preference shares, corporate bonds, loan stock, approved securities, notes and liquid assets and any other securities that are consistent with the portfolio’s investment policy.The Fund is suitable for investors who are seeking a regular income from their investment, including those who intend to secure a safe haven for their investments in times of stock market instability, and,
- Balanced Fund: The investment objective of a Balanced Fund is to offer investors a reasonable level of current income and long term capital growth. This would be achieved by investing in a diversified spread of equities and fixed income securities. The Fund is suited to investors who seek to invest in a balanced portfolio offering exposure to all sectors of the market. It is also suitable for pension schemes, treasury portfolios of institutional clients, co-operatives and high-net worth individuals amongst others. The Fund is a medium risk fund and has a medium risk profile.
Section II: The Structure of Unit Trusts
Unit trusts in Kenya are regulated by the Capital Markets Authority (CMA). A unit trust is required to have a fund manager, a custodian and trustees with the roles of the three parties prescribed under the Capital Markets (Collective Investment Schemes) regulations, 2001. The roles of the different parties are as summarized below:
- Fund Manager: The role of the fund manager is to provide investment advice as well as investing the unit trust’s funds in the approved asset classes and ensure overall good performance of investments. Other main duties as prescribed by CMA include:
- Formulating a prudent investment policy and investing the scheme’s assets in accordance with the scheme’s investment policy as well as reinvesting any income of the scheme fund which is not required for immediate payments;
- Ensuring that the shares or units in the collective investment scheme are priced in accordance with the information memorandum;
- Publishing daily the price of shares, or yield on units in at least two daily newspapers of national circulation, published in the English language; and
- Interaction with investors in the fund, including onboarding them as clients, receiving withdrawals and investment instructions, and notifying members of any material happening, e.g. Annual General Meetings.
- Trustee: The core mandate of a trustee is to play the oversight function in respect to the fund manager. They are responsible for management of the scheme and act in the best interests of the beneficiaries. For a company to be appointed as a trustee it is required to be either a bank or financial institution approved for that purpose by the Capital Markets Authority (CMA). Some of the main functions of a trustee as prescribed under the Capital Markets (Collective Investment Schemes) regulations, 2001 include, but are not limited to:
- To ensure that the custodian takes into custody all the collective investment scheme portfolio and holds it in trust for the unit holders;
- To take all steps and execute all documents which are necessary to secure acquisitions or disposals of assets properly made by the fund manager; and
- To collect any income due to be paid to the scheme and or claim any repayment of tax and direct any income received in trust for the holders to the custodian.
- Custodian: The role of the custodian is to ensure safe custody of all assets of the unit trust. Similar to the trustee a custodian of a collective investment scheme must be a bank or a financial institution approved by the CMA. The core functions of the custodian as prescribed by the CMA include, but are not limited to:
- To receive and keep in safe custody title documents, securities and cash amounts of the collective investment scheme;
- Opening an account in the name of the collective investment scheme for the exclusive benefit of such collective investment scheme; and
- Transferring, exchanging or delivering in the required form and manner securities held by the custodian upon receipt of proper instructions from the fund manager, trustee or board of directors.
Due to the structure set in place by CMA as discussed above, unit trusts are relatively a safe investment vehicle. For instance, all assets, including investments and money awaiting investment, are held by the custodian for safekeeping on behalf of the unit trust, and thus the fund manager does not directly take clients’ funds into its bank accounts. This ring-fences the client’s funds from company funds. Payments as well can only be made once the custodian receives instructions from the unit trust’s authorized signatories.
Section III: Industry analysis on the returns, profitability growth of the assets under management
The number of unit trust schemes licensed by the Capital Markets Authority currently stands at twenty-six (26). As per our analysis on the 2018 performance by unit trust fund managers, total assets under management (“AUM”) held by Unit Trust Fund Managers stood at Kshs 58.0 bn in 2018 with Money Market funds remaining the most popular product with a market share of 84.3%. The below summarizes the distribution of the various funds as at close of 2018:
|
No |
Product |
FY'2018 |
FY'2018 Market Share |
|
1 |
Money Market Funds |
48,895.5 |
84.3% |
|
2 |
Equity Funds |
4,797.9 |
8.3% |
|
3 |
Balanced Funds |
1,947.8 |
3.4% |
|
4 |
Other Funds |
2,383.1 |
4.1% |
|
|
Total |
58,024.3 |
100.0% |
Industry statistics indicate that Money market funds AUM has recorded an 8-year compounded annual growth rate of 19.3% to Kshs 48.9 bn in 2018 up from Kshs 11.9 bn recorded in 2011, showing that Money Market Funds are growing faster than the overall market at 12.2%. We are of the view that this acceleration in performance has largely been driven by:
- Increased awareness and sensitization on unit trusts and the benefits accrued, which has been facilitated by improved distribution networks across all firms, coupled with technological advancements which has eased access of information as well as improving efficiency,
- A rise in the number of new entrants with market players rising from 12 in 2011 to 26 as at the end of 2018. This has led to a wider range of choice for investors based on their risk profile in order to align their expectations with the objectives of the various market players,
- The performance by unit trust funds has also picked up, following the repeal of the floor rate on deposits, in September 2018, which has seen bank deposits rates decline making money market funds more attractive to investors,
- The sustenance of a favorable regulatory framework cemented by structures put in place by the Capital Markets Authority which have served to ensure that collective schemes are relatively safe havens for investors fund and thus enhancing their popularity and acceptance,
- Entry level has been made affordable with the minimum investment amounts shrinking from levels of as high as Kshs 1.0 mn in early 2000’s to as low as Kshs 5,000 currently, making investing in collective schemes accessible even to retail investors.
The table below summarizes the top five money market funds in terms of average effective annual yield declared in 2018:
|
No. |
Money Market Fund |
2018 Average Effective Annual Yield p.a. |
|
1 |
Cytonn Money Market Fund |
11.5% |
|
2 |
Nabo Africa KES Money Market Fund |
10.2% |
|
3 |
CIC Money Market Fund |
10.1% |
|
4 |
Madisson Money Market Fund |
9.9% |
|
5 |
Zimele Money Market Fund |
9.9% |
Section IV: Conclusion
There are various pros in support of investing in a Unit Trust, which include:
- Professional Fund Management: Unit trusts are run by investment managers who have successfully made investment decisions through a wide variety of market conditions over a long period and thus have the expertise to screen for high yielding investments opportunities in the market, coupled with other support functions such as operations which process the day to day transactions to ensure efficiency.
- Security of Fund: Unit trusts are well regulated through the Capital Markets Authority and controlled by the Collective investment Schemes Act, which prohibits investment managers from taking certain risks. They also come with safeguards as each unit trust fund is compelled by law to appoint a trustee who looks after all the cash, shares or bonds that the fund owns which means that if anything happens to the unit trust company or the asset manager the investments will not be affected.
- Transparency and Effective Communication: Unit trusts are required to publish their daily and effective annual yields on the daily newspapers, and thus an investor can therefore always confirm the value of their investment as well as benchmark the performance against other unit trusts. It is also mandatory for the scheme to issue monthly statements showing an investor’s investments position.
- Excellent Returns: History has shown that average returns from unit trust companies compare very favorably with returns from more traditional investment products. Unit trusts have also proven themselves as an excellent way of beating inflation.
- Easy Access to the Investment: Funds invested in unit trust investments can easily be redeemable either the full or partial investment based on the prevailing unit price.
- Diversification: Unit trust Funds ensure diversification of risk through investing in a variety of asset classes. Through this they provide an avenue for small scale investors to get exposure to a wide range of investments which would otherwise require one to have a lot of capital in order to access. Due to this nature, unit trusts have universally been identified as the small investor’s answer to achieving wide investment diversification without the need of huge and prohibitive sums of money, while still offering a safe haven for the less sophisticated and less capitalized, conservative individuals as the market becomes sophisticated and more volatile as the funds are managed by qualified fund managers who screen for viable investment opportunities.
Like any other investment security, unit trusts are also subject to market/investment risks as the various investment vehicles/funds have different risk exposures based on the different risk appetites. For instance, the fixed income fund mainly focuses on investing in Treasury bills and Treasury bonds, which are guaranteed by the government through the Central Bank of Kenya where the risk of default is low and thus the returns are fixed and less volatile. On the other hand, investments in an equity fund, where the funds are invested in shares of companies listed in a Securities Exchange may be exposed to market risk, this is however usually reduced through diversification. Investors are therefore advised to choose the fund to invest in based on their risk profile as well as the desired tenor of investment in order to align their expectations with the objectives of the fund. The fund’s investment objective and strategy, investment limits, its current portfolio and any commentary on its recent performance should serve as guide to an investor of the risk level of the fund.
In conclusion, with markets becoming more sophisticated, unit trusts present an avenue for investment where:
- You can invest as much amounts that you are comfortable with;
- You stand to earn potentially higher returns that are inflation beating at moderate risks;
- You stand to meet your financial aspirations in a structured manner which is also enhanced by the availability of different funds that help you achieve your financial objectives with the possibility of switching between funds to manage your risk exposure; and,
- Lastly, it instills financial self-discipline in the long run through pursuing a systematic Regular Investment Plan.
Disclaimer: The views expressed in this publication are those of the writers where particulars are not warranted. This publication, which is in compliance with Section 2 of the Capital Markets Authority Act Cap 485A, is meant for general information only and is not a warranty, representation, advice or solicitation of any nature. Readers are advised in all circumstances to seek the advice of a registered investment advisor.

- Talk to us
- Kenya
- P.O Box 20695 - 00200, Nairobi, Kenya
- Cell +254709101200
- Tel +254709101200
- WhatsApp +254741676635
- United States
- +254709101200
- DOWNLOAD OUR APP
-


- Kenya
- 8th Floor, Pinetree Plaza, Kaburu Drive, Ngong Road, Nairobi, Kenya
- USA
- Suite 1150, 1775 Eye Street NW, USA, Washington DC 20006, USA
- Investments
- High Yield
- Private Equity
- Real Estate
- Real Estate
- RiverRun Estates
- Cytonn Towers
- The Ridge
- Taraji Heights
- The Alma