Investment Risk Analysis, & Cytonn Weekly #34/2022
By Research Team, Aug 28, 2022
Executive Summary
Fixed Income
During the week, T-bills remained undersubscribed, with the overall subscription rate coming in at 80.9%, down from the 82.1% recorded the previous week. Investors’ preference for the shorter 91-day paper persisted, with the paper receiving bids worth Kshs 10.8 bn against the offered Kshs 4.0 bn, translating to a subscription rate of 270.4%, down from the 294.3% recorded the previous week. The subscription rate for the 182-day paper declined to 41.6% from 68.0% while that of the 364-day paper increased to 44.4% from 11.4% recorded the previous week. The yields on the government papers were on an upward trajectory with the yields on the on 364-day, 182-day and 91-day papers increasing by 0.1 bps, 4.0 bps and 9.8 bps to 9.9%, 9.5% and 8.8%, respectively. In the Primary Bond Market, the government re-opened two bonds namely; FXD1/2022/010 and FXD1/2022/015 with effective tenors of 9.6 years and 14.5 years respectively, in a bid to raise Kshs 50.0 bn for budgetary support. The period of sale for the bonds runs from 25th August to 13th September 2022;
We are projecting the y/y inflation rate for August 2022 to fall within the range of 8.4%-8.8%, with a bias towards an increase from the 8.3% recorded in July;
Equities
During the week, the equities market was on a downward trajectory with NASI, NSE 20 and NSE 25 declining by 5.7%, 1.7% and 3.4%, respectively, taking their YTD performance to losses of 17.5%, 8.6% and 13.0%, for NASI, NSE 20 and NSE 25, respectively. The equities market performance was mainly driven by losses recorded by large-cap stocks such as Safaricom and Bamburi of 10.2% and 8.0% respectively while KCB Group and ABSA Bank both declined by 5.3%. The losses were however mitigated by gains recorded by stocks such as NCBA which gained by 10.7%, while Diamond Trust Bank (DTB-K) and Equity Group both gained by 2.5%.
During the week, NCBA Group, Co-operative Bank, Equity Group, KCB Group, Diamond Trust Bank, and ABSA Bank released their H1’2022 financial results H1’2022 financial results, indicating an increase in Core Earnings per share of 66.9%, 55.7%, 36.1%, 28.4%, 25.6% and 13.0%, respectively;
Real Estate
During the week, the National Housing Cooperation (NHC) announced that it is seeking to raise Kshs 7.0 bn through the International Finance Corporation (IFC) under the Public Private Partnership model, to fund the construction of 3,500 housing units in Machakos County. In the commercial office sector, Little, a technology company, announced plans to construct a commercial office building in Lavington, amidst its increasing operations that has necessitated more expansion. In the retail sector, Safaricom PLC announced plans to shut down its retail outlet at Two Rivers Mall, by 31st August 2022. In the hospitality sector, the Competition Authority of Kenya (CAK) approved the sale of 680 Hotel in Nairobi’s city center to Maanzoni Lodges, and Crowne Plaza Hotel in Upper Hill to Kasada Hospitality Fund. In the infrastructure sector, the Kenya National Highway Authority (KeNHA) announced plans to construct two segments of the Eldoret-Juba road, at an estimated cost of Kshs 22.6 bn. In the Nairobi Stock Exchange, Fahari I-REIT closed the week trading at an average price of Kshs 7.1 per share;
Focus of the Week
All investments have a certain degree of risk owing to market conditions and the nature of specific businesses. In times of high uncertainty investment risk tend to increase and decline during times of low uncertainty. Currently, the global economy is hailed by increased uncertainty emanating from elevated inflationary pressures, persistent supply chain bottlenecks, resurgence of COVID-19 infections and the prevailing geopolitical pressures. Closer home, Kenya has not been exempted with the uncertainty evidenced by increased investor sell-offs in the Nairobi Securities Exchange, rising yields and the undersubscription of government securities. As such, we turn this week’s focus to investment risk analysis where we will shed light on the types of investments risks and analyse the various ways investment risk can be managed, as this will ensure that investment returns are well aligned with risk expectations;
Investment Updates:
- Weekly Rates:
- Cytonn Money Market Fund closed the week at a yield of 10.57%. To invest, dial *809# or download the Cytonn App from Google Playstore here or from the Appstore here;
- Cytonn High Yield Fund closed the week at a yield of 13.89% p.a. To invest, email us at sales@cytonn.com and to withdraw the interest, dial *809# or download the Cytonn App from Google Playstore here or from the Appstore here;
- We continue to offer Wealth Management Training every Wednesday and every third Saturday of the month, from 9:00 am to 11:00 am, through our Cytonn Foundation. The training aims to grow financial literacy among the general public. To register for any of our Wealth Management Trainings, click here;
- If interested in our Private Wealth Management Training for your employees or investment group, please get in touch with us through wmt@cytonn.com;
- Any CHYS and CPN investors still looking to convert are welcome to consider one of the five projects currently available for assignment, click here for the latest term sheet;
- Cytonn Insurance Agency acts as an intermediary for those looking to secure their assets and loved ones’ future through insurance namely; Motor, Medical, Life, Property, WIBA, Credit and Fire and Burglary insurance covers. For assistance, get in touch with us through insuranceagency@cytonn.com;
- Cytonnaire Savings and Credit Co-operative Society Limited (SACCO) provides a savings and investments avenue to help you in your financial planning journey. To enjoy competitive investment returns, kindly get in touch with us through clientservices@cytonn.com;
Real Estate Updates:
- For an exclusive tour of Cytonn’s real estate developments, visit: Sharp Investor's Tour, and for more information, email us at sales@cytonn.com;
- Phase 3 of The Alma is now ready for occupation and the show house is open daily. To rent please email properties@cytonn.com;
- We have 8 investment-ready projects, offering attractive development and buyer targeted returns; See further details here: Summary of Investment-ready Projects;
- For Third Party Real Estate Consultancy Services, email us at rdo@cytonn.com;
- For recent news about the group, see our news section here;
Hospitality Updates:
- We currently have promotions for Staycations. Visit cysuites.com/offers for details or email us at sales@cysuites.com;
Money Markets, T-Bills Primary Auction:
During the week, T-bills remained undersubscribed, with the overall subscription rate coming in at 80.9%, down from the 82.1% recorded the previous week. Investors’ preference for the shorter 91-day paper persisted, with the paper receiving bids worth Kshs 10.8 bn against the offered Kshs 4.0 bn, translating to a subscription rate of 270.4%, down from the 294.3% recorded the previous week. The subscription rate for the 182-day paper declined to 41.6% from 68.0% while that of the 364-day paper increased to 44.4% from 11.4% recorded the previous week. The yields on the government papers were on an upward trajectory with the yields on the 364-day, 182-day and 91-day papers increasing by 0.1 bps, 4.0 bps and 9.8 bps to 9.9%, 9.5% and 8.8%, respectively. The government rejected expensive bids accepting only bids worth Kshs 15.0 bn, out of the Kshs 19.4 bn worth of bids received, translating to an acceptance rate of 77.3%.
In the Primary Bond Market, the government re-opened two bonds namely; FXD1/2022/10 and FXD1/2022/15 with effective tenors of 9.6 years and 14.5 years respectively, in a bid to raise Kshs 50.0 bn for budgetary support. The coupon rates for the bonds are 13.5% and 13.9% for FXD1/2022/10 and FXD1/2022/15, respectively. We expect the bonds to be undersubscribed as investors continue to attach a higher risk premium on the country due to the increased perceived risks arising from increasing inflationary pressures and local currency depreciation. The bonds are currently trading in the secondary market at yields of 13.6% and 13.9%, for FXD1/2022/10 and FXD1/2022/15, respectively. As such, our recommended bidding ranges for the two bonds is 13.6%-14.1% for FXD1/2022/10 and 13.9% -14.4% for FXD1/2022/15. The period of sale for the bonds runs from 25th August 2022 to 13th September 2022.
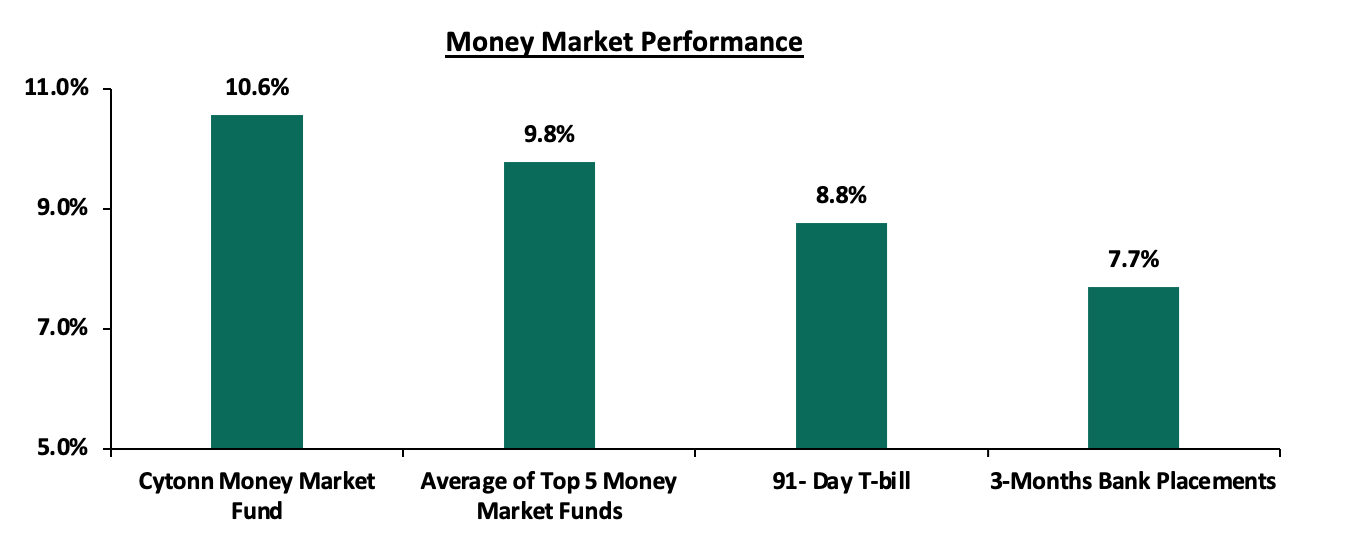
In the money markets, 3-month bank placements ended the week at 7.7% (based on what we have been offered by various banks), while the yield on the 91-day T-bill increased by 9.8 bps to 8.8%. The average yield of the Top 5 Money Market Funds increased by 10.0 bps to 9.8% while the Cytonn Money Market Fund remained relatively unchanged at 10.6%, as was recorded last week. The table below shows the Money Market Fund Yields for Kenyan Fund Managers as published on 26th August 2022:
|
Money Market Fund Yield for Fund Managers as published on 26th August 2022 |
||
|
Rank |
Fund Manager |
Effective Annual Rate |
|
1 |
Cytonn Money Market Fund |
10.6% |
|
2 |
Zimele Money Market Fund |
9.9% |
|
3 |
Sanlam Money Market Fund |
9.6% |
|
4 |
Nabo Africa Money Market Fund |
9.5% |
|
5 |
Dry Associates Money Market Fund |
9.4% |
|
6 |
Apollo Money Market Fund |
9.3% |
|
7 |
Old Mutual Money Market Fund |
9.3% |
|
8 |
NCBA Money Market Fund |
9.3% |
|
9 |
Co-op Money Market Fund |
9.2% |
|
10 |
Madison Money Market Fund |
9.1% |
|
11 |
CIC Money Market Fund |
9.0% |
|
12 |
GenCap Hela Imara Money Market Fund |
8.8% |
|
13 |
ICEA Lion Money Market Fund |
8.7% |
|
14 |
Orient Kasha Money Market Fund |
8.4% |
|
15 |
AA Kenya Shillings Fund |
8.0% |
|
16 |
British-American Money Market Fund |
7.5% |
Source: Business Daily
Liquidity:
During the week, liquidity in the money markets eased, with the average interbank rate declining to 5.1% from 5.6% recorded the previous week, partly attributable to government payments that offset tax remittances. The average interbank volumes traded increased by 3.0% to Kshs 22.0 bn from Kshs 21.4 bn recorded the previous week.
Kenya Eurobonds:
During the week, the yields on the Eurobonds recorded mixed performance with the yields on the 7-year Eurobond issued in 2019 increasing the highest by 0.3% points to 14.2%, from 13.9% recorded the previous week. The yield on the 10-year Eurobond issued in 2014 was the largest decliner having declined by 0.4% points to 14.6%, from 15.0% recorded the previous week. The table below shows the summary of the performance of the Kenyan Eurobonds as of 25th August 2022;
|
Kenya Eurobonds Performance |
||||||
|
|
2014 |
2018 |
2019 |
2021 |
||
|
Date |
10-year issue |
10-year issue |
30-year issue |
7-year issue |
12-year issue |
12-year issue |
|
3-Jan-22 |
4.4% |
8.1% |
8.1% |
5.6% |
6.7% |
6.6% |
|
29-Jul-22 |
16.2% |
14.9% |
13.3% |
16.3% |
14.0% |
13.3% |
|
19-Aug-22 |
15.0% |
12.7% |
12.0% |
13.9% |
12.6% |
11.1% |
|
22-Aug-22 |
15.3% |
12.9% |
12.0% |
14.5% |
12.8% |
11.4% |
|
23-Aug-22 |
15.4% |
13.3% |
12.2% |
14.6% |
13.0% |
12.3% |
|
24-Aug-22 |
14.8% |
13.0% |
12.1% |
14.3% |
12.8% |
11.3% |
|
25-Aug-22 |
14.6% |
12.9% |
12.0% |
14.2% |
12.7% |
11.0% |
|
Weekly Change |
(0.4%) |
0.2% |
0.1% |
0.3% |
0.1% |
(0.1%) |
|
MTD Change |
(1.6%) |
(2.0%) |
(1.2%) |
(2.1%) |
(1.3%) |
(2.2%) |
|
YTD Change |
10.2% |
4.8% |
3.9% |
8.6% |
6.0% |
4.4% |
Source: Central Bank of Kenya (CBK)
Kenya Shilling:
During the week, the Kenyan shilling continued to depreciate against the US dollar to close the week at Kshs 119.9, a 0.3% depreciation from Kshs 119.6 recorded the previous week, partly attributable to increased dollar demand from the oil and energy sectors against a slower supply of hard currency. On a year to date basis, the shilling has depreciated by 6.0% against the dollar, higher than the 3.6% depreciation recorded in 2021. We expect the shilling to remain under pressure in 2022 as a result of:
- High global crude oil prices on the back of persistent supply chain bottlenecks coupled with high demand as most economies gradually recover,
- An ever-present current account deficit due to an imbalance between imports and exports, with Kenya’s current account deficit estimated at 5.3% of GDP in the 12 months to May 2022 compared to the 5.0% within a similar period in 2021. The wider deficit reflects a higher import bill, particularly for petroleum products, with the imports for Q1’2022 increasing by 14.5%, 5.7% points higher than the 8.8% increase in exports, and,
- The aggressively growing government debt, with Kenya’s public debt having increased at a 10-year CAGR of 18.2% to Kshs 8.6 tn in May 2022, from Kshs 1.6 tn in May 2012 thus putting pressure on forex reserves to service some of the public debt. It is worth noting that the average GDP growth over the same period has been 3.9%, indicating that the increase in debt is not translating into GDP growth.
The shilling is however expected to be supported by:
- Sufficient Forex reserves currently at USD 7.6 bn (equivalent to 4.4-months of import cover), which is above the statutory requirement of maintaining at least 4.0-months of import cover, and the EAC region’s convergence criteria of 4.5-months of import cover, and,
- Sufficient diaspora remittances evidenced by a 6.6% increase to USD 3,995.0 mn cumulative remittances as of July 2022, compared to USD 3,442.0 mn recorded over the same period in 2021, which has continued to cushion the shilling against a faster depreciation.
Weekly Highlight:
August 2022 inflation projections
We are projecting the y/y inflation rate for August 2022 to fall within the range of 8.4%-8.8%, with a bias towards an increase from the 8.3% recorded in July. The key drivers include:
- High fuel prices - Fuel prices for the period 15th August 2022 to 14th September 2022 remained unchanged at 159.1 per litre for Super Petrol, Kshs 140.0 per litre for Diesel and Kshs 127.9 per litre for Kerosene. However, we note that this is the highest fuel prices have ever been in Kenya and given that fuel is a major input to most sectors, we expect the high prices to weigh on the inflation basket in the short term,
- Increasing food prices - This was evidenced by the 15.3% y/y increase in the prices of food & non-alcoholic beverages as of July 2022 due to increased costs of production and erratic weather conditions. Given that the index constitutes 32.9% of the inflation basket, we expect the prevailing high food prices to exert pressure on the inflation rate, and,
- Lower Electricity Prices - The price of electricity reduced by 15.7% in January 2022 marking the first phase of compliance with President Uhuru Kenyatta’s directive to cut the cost of electricity by 30.0% in order to reduce the cost of living. The reduction in electricity costs has continued to mitigate a steeper increase in the prices of goods given the lower production costs.
Going forward, we expect the inflation rate to remain elevated on the back of high fuel and food prices as concerns remain high on the inflated import bill and widening trade deficit. Should the supply chain constraints persist, we expect an even higher import bill, resulting from increased landed costs of fuel given that Kenya is a net importer. Consequently, inflationary pressures will remain elevated owing primarily to the fact that fuel remains a substantial input cost. However, the Monetary Policy Committee's (MPC) decision to keep the Central Bank Rate (CBR) at 7.5% rather than reduce it in July 2022 is expected to anchor inflation and relatively reduce the high cost of living.
Rates in the Fixed Income market have remained relatively high due to the relatively heightened perceived risk by investors. As it is still early in the financial year, the government is 10.8% behind its prorated borrowing target of Kshs 91.1 bn having borrowed Kshs 81.2 bn of the Kshs 581.7 bn borrowing target for the FY’2022/2023. We expect sustained gradual economic recovery as evidenced by the revenue collections of Kshs 2.0 tn in the FY’2021/2022, equivalent to a 2.8% outperformance. Despite the performance, we believe that the projected budget deficit of 6.2% for the FY’2022/2023 is relatively ambitious given the downside risks of a deteriorating business environment occasioned by high inflationary pressures. We however expect the support from the IMF and World Bank to finance some of the government projects and thus help maintain a stable interest rate environment since the government is not desperate for cash. Owing to this, our view is that investors should be biased towards short-term fixed-income securities to reduce duration risk.
Markets Performance
During the week, the equities market was on a downward trajectory with NASI, NSE 20 and NSE 25 declining by 5.7%, 1.7% and 3.4%, respectively, taking their YTD performance to losses of 17.5%, 8.6% and 13.0%, for NASI, NSE 20 and NSE 25, respectively. The equities market performance was mainly driven by losses recorded by large-cap stocks such as Safaricom and Bamburi of 10.2% and 8.0% respectively while KCB Group and ABSA Bank both declined by 5.3%. The losses were however mitigated by gains recorded by stocks such as NCBA which gained by 10.7%, while Diamond Trust Bank (DTB-K) and Equity Group both gained by 2.5%.
During the week, equities turnover declined by 29.5% to USD 6.3 mn, from USD 9.0 mn recorded the previous week, taking the YTD turnover to USD 571.6 mn. Additionally, foreign investors turned net sellers, with a net selling position of USD 2.0 mn, from a net buying position of USD 0.2 mn recorded the previous week, taking the YTD net selling position to USD 141.3 mn.
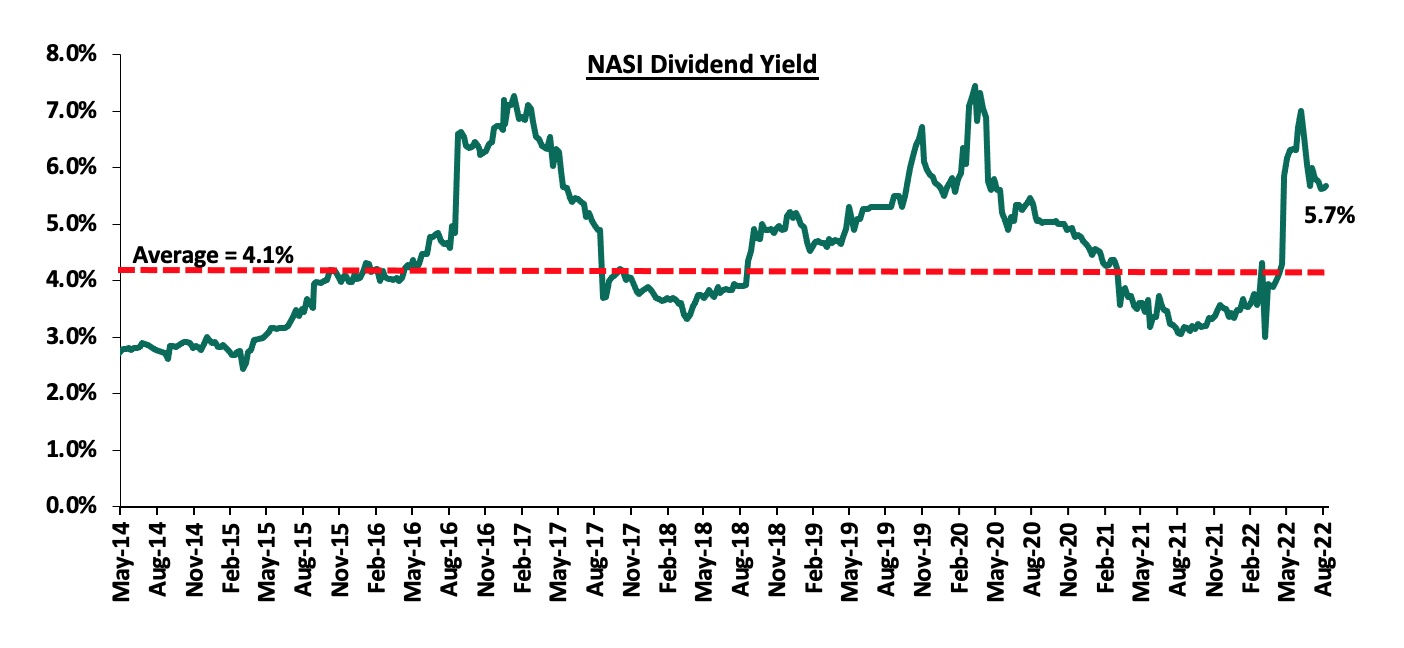
The market is currently trading at a price to earnings ratio (P/E) of 7.3x, 42.3% below the historical average of 12.7x, and a dividend yield of 5.7%, 1.6% points above the historical average of 4.1%. Key to note, NASI’s PEG ratio currently stands at 0.9x, an indication that the market is undervalued valued relative to its future growth. A PEG ratio greater than 1.0x indicates the market may be overvalued while a PEG ratio less than 1.0x indicates that the market is undervalued. The charts below indicate the historical P/E and dividend yields of the market: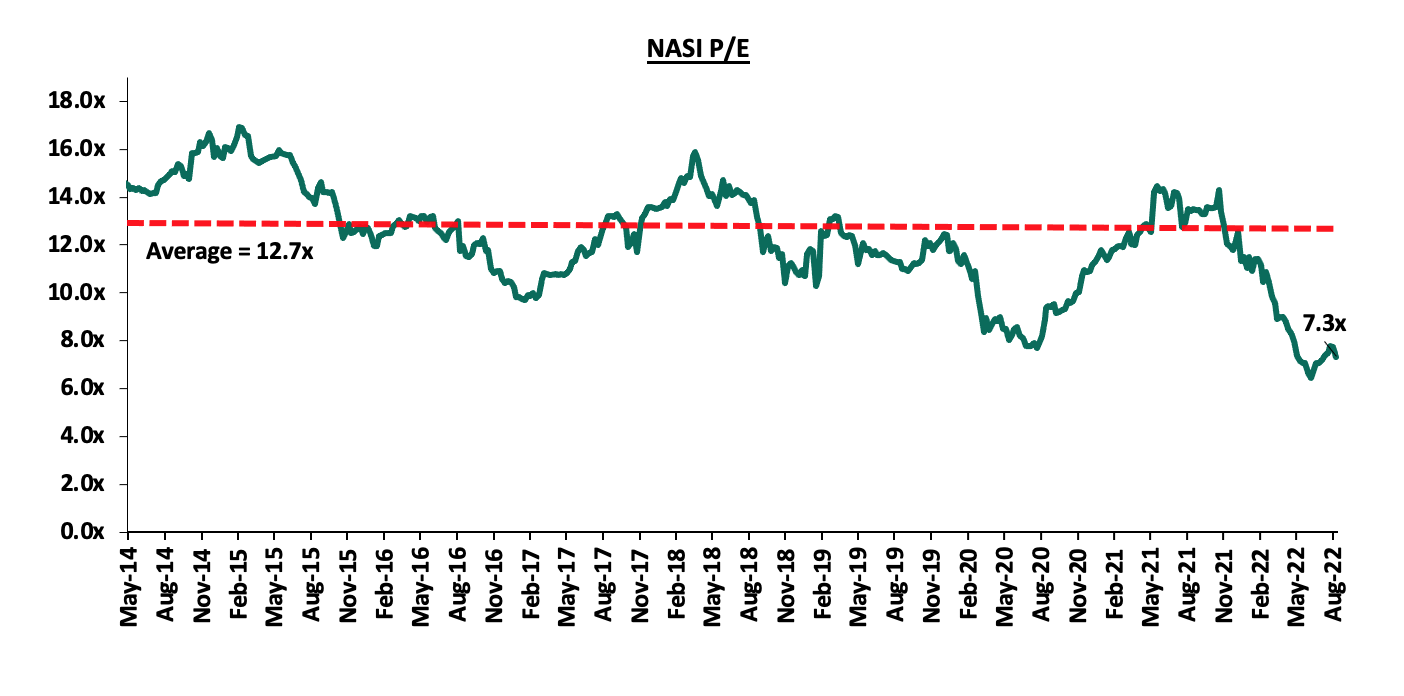
Weekly Highlight:
Earnings Release
During the week, Equity Group, KCB Group, ABSA Bank, Co-operative Bank, NCBA Group and Diamond Trust Bank (DTB-K), released their H1’2022 financial results. Below is a summary of their performance;
- Equity Group Holdings Plc
Balance Sheet Items
H1’2021 (Kshs bn)
H1’2022 (Kshs bn)
y/y change
Government Securities
202.6
236.8
16.9%
Net Loans and Advances
504.8
650.6
28.9%
Total Assets
1,119.7
1,333.9
19.1%
Customer Deposits
819.7
970.9
18.5%
Deposits per Branch
2.7
2.8
5.7%
Total Liabilities
964.7
1,183.5
22.7%
Shareholders’ Funds
148.2
143.7
(3.0%)
Balance Sheet Ratios
H1’2021
H1’2022
% points y/y change
Loan to Deposit Ratio
61.6%
67.0%
5.4%
Return on average equity
21.4%
31.9%
10.5%
Return on average assets
3.1%
3.8%
0.7%
Income Statement
H1’2021 (Kshs bn)
H1’2022 (Kshs bn)
y/y change
Net Interest Income
31.2
39.8
27.8%
Net non-Interest Income
20.8
25.8
24.4%
Total Operating income
51.9
65.6
26.4%
Loan Loss provision
(2.9)
(4.1)
40.3%
Total Operating expenses
(28.1)
(34.7)
23.6%
Profit before tax
23.8
30.9
29.7%
Profit after tax
17.9
24.4
36.1%
Core EPS
4.8
6.5
36.1%
Income Statement Ratios
H1’2021
H1’2022
% points y/y change
Yield from interest-earning assets
10.3%
10.0%
(0.3%)
Cost of funding
2.9%
2.8%
(0.1%)
Cost of risk
5.6%
6.2%
0.6%
Net Interest Margin
7.6%
7.3%
(0.3%)
Net Interest Income as % of operating income
60.0%
60.6%
0.6%
Non-Funded Income as a % of operating income
40.0%
39.4%
(0.6%)
Cost to Income Ratio
54.1%
52.9%
(1.2%)
Cost to Income Ratio without LLP
48.5%
46.7%
(1.8%)
Cost to Assets
2.7%
2.5%
(0.2%)
Capital Adequacy Ratios
H1’2021
H1’2022
% Points Change
Core Capital/Total Liabilities
15.8%
17.0%
1.2%
Minimum Statutory ratio
8.0%
8.0%
0.0%
Excess
7.8%
9.0%
1.2%
Core Capital/Total Risk Weighted Assets
14.0%
15.5%
1.5%
Minimum Statutory ratio
10.5%
10.5%
0.0%
Excess
3.5%
5.0%
1.5%
Total Capital/Total Risk Weighted Assets
17.5%
20.2%
2.7%
Minimum Statutory ratio
14.5%
14.5%
0.0%
Excess
3.0%
5.7%
2.7%
Liquidity Ratio
62.4%
53.2%
(9.2%)
Minimum Statutory ratio
20.0%
20.0%
0.0%
Excess
42.4%
33.2%
(9.2%)
Adjusted core capital/ total deposit liabilities
15.8%
17.1%
1.3%
Adjusted core capital/ total risk weighted assets
14.1%
15.5%
1.4%
Adjusted total capital/ total risk weighted assets
17.6%
20.2%
2.6%
Key take-outs from the earnings release include;
- Earnings Growth - Core earnings per share increased by 36.1% to Kshs 6.5 in H1’2022, from Kshs 4.8 recorded in H1’2021, higher than our projections of a 4.2% increase to Kshs 5.0. The performance was driven by a 26.4% growth in total operating income to Kshs 65.6 bn, from Kshs 51.9 bn in H1’2021, faster than the 23.6% growth in total operating expenses to Kshs 34.7 bn, from Kshs 28.1 bn in H1’2021,
- The Group’s diversification strategy deemed profitable – The Group’s geographical diversification strategy has continued to emerge as a net positive, with the bank’s various subsidiaries in Uganda, DRC, Rwanda, Tanzania, and South Sudan cumulatively contributing 28.0% to the bank’s total profitability and 40.0% to the group’s total asset base. Cumulatively, the group’s subsidiaries, excluding Equity Bank Kenya Ltd, recorded an 85.7% growth in their Profit after Tax (PAT) to Kshs 6.6 bn, from Kshs 3.5 bn in H1’2021, with the Equity BCDC in DRC recording a 447.0% growth in PAT to Kshs 1.6 bn from Kshs 0.4 bn in H1’2021, mainly driven by favorable operating business environment coupled with low banking penetration which providing more opportunities for profitability. However, concerns remain high on the high NPL levels in the group’s Tanzanian subsidiary of 23.8% and we expect the group to improve its credit assessment in the country to bring down the high NPL ratio, and,
- Asset quality improves - the group’s asset quality improved as evidenced by the 2.6% points decline in the NPL ratio to 8.8% in H1’2022, from 11.4% recorded in H1’2021, attributable to the 1.9% decline in Gross Non-Performing Loans (NPLs) coupled with a 26.7% growth in gross loans. The main sectors that contributed to the Non-Performing Loans were MSMEs and Agriculture, which contributed 20.9% and 7.1%, respectively. The group’s Tanzanian subsidiary recorded the highest NPL ratio, coming in at 23.8% in H1’2022, with Equity Bank Kenya recording an NPL ratio of 8.4% in H1’2022.
For a comprehensive analysis, please see our Equity Group Holdings Plc’s H1’2022 Earnings Note
- KCB Group Plc
Balance Sheet Items
H1’2021
H1’2022
y/y change
Net Loans and Advances
607.0
730.3
20.3%
Government Securities
213.0
277.8
30.4%
Total Assets
1,022.2
1,210.1
18.4%
Customer Deposits
786.0
908.6
15.6%
Deposits per Branch
2.2
1.8
(17.3%)
Total Liabilities
869.2
1,028.4
18.3%
Shareholders’ Funds
152.9
179.1
17.1%
Balance Sheet Ratios
H1’2021
H1’2022
% point change
Loan to Deposit Ratio
77.2%
80.4%
3.2%
Return on average equity
19.2%
23.2%
4.0%
Return on average assets
2.8%
3.5%
0.7%
Income Statement
H1’2021
H1’2022
y/y change
Net Interest Income
36.4
40.6
11.5%
Net non-Interest Income
14.8
19.2
29.9%
Total Operating income
51.2
59.8
16.8%
Loan Loss provision
(6.6)
(4.3)
(34.4%)
Total Operating expenses
(29.3)
(31.6)
8.0%
Profit before tax
21.9
28.2
28.6%
Profit after tax
15.3
19.6
28.4%
Core EPS
4.8
6.1
28.4%
Income Statement Ratios
H1’2021
H1’2022
% point change
Yield from interest-earning assets
11.2%
11.3%
0.1%
Cost of funding
2.6%
3.0%
0.4%
Net Interest Spread
8.6%
8.3%
(0.3%)
Net Interest Margin
8.7%
8.5%
(0.2%)
Cost of Risk
12.9%
7.2%
(5.7%)
Net Interest Income as % of operating income
71.1%
67.9%
(3.2%)
Non-Funded Income as a % of operating income
28.9%
32.1%
3.2%
Cost to Income Ratio
57.2%
52.9%
(4.3%)
Capital Adequacy Ratios
H1’2021
H1’2022
% points change
Core Capital/Total Liabilities
19.0%
17.3%
(1.7%)
Minimum Statutory ratio
8.0%
8.0%
-
Excess
11.0%
9.3%
(1.7%)
Core Capital/Total Risk Weighted Assets
18.6%
17.7%
(0.9%)
Minimum Statutory ratio
10.5%
10.5%
-
Excess
8.1%
7.2%
(0.9%)
Total Capital/Total Risk Weighted Assets
21.9%
21.6%
(0.3%)
Minimum Statutory ratio
14.5%
14.5%
-
Excess
7.4%
7.1%
(0.3%)
Liquidity Ratio
40.1%
39.0%
(1.1%)
Minimum Statutory ratio
20.0%
20.0%
-
Excess
20.1%
19.0%
(1.1%)
Key take-outs from the earnings release include;
- Earnings Growth - Core earnings per share rose by 28.4% to Kshs 6.1, from Kshs 4.8 in H1’2021, higher than our expectations of a 22.9% increase to Kshs 5.9, with the variance stemming from the 11.5% increase in total operating income, which was higher than our projection of a 6.6% increase. The performance was driven by the 16.8% growth in total operating income to Kshs 59.8 bn, from Kshs 51.2 bn in H1’2021, which outpaced the 8.0% growth in total operating expenses to Kshs 31.6 bn, from Kshs 29.3 bn in H1’2021,
- Deterioration of the Asset Quality - The group’s asset quality deteriorated, with the NPL ratio increasing to 21.4% in H1’2022, from 14.4% in H1’2021, attributable to the 50.1% exposure to corporate loans, which has been impacted by delayed recovery from COVID-19, increased inflationary pressures and pending government bills, which have increased by 40.4% y/y. Additionally, increase in NPLs have been recorded from sectors such as building and construction, manufacturing, as well as the hospitality sectors. Key to note, the group’s asset quality was weighed down by the high NPL ratio from NBK which came in at 33.9%, despite having recorded an improvement y/y, from 37.3% in H1’2021. On the other hand, KCB-K was the only subsidiary that recorded an increase in the NPL ratio to 22.8%, from 11.9% in H1’2021, attributable to a reclassification of 9 large accounts to non-performing loans. On a q/q basis, KCB’s Asset quality also deteriorated by 4.5% points to 21.4%, from 16.9% recorded in Q1’2022,
- Reduced Provisioning – Despite the 81.2% increase in Gross non-performing loans, the NPL coverage declined to 45.8% in H1’2022 from 61.6% in H1’2021, attributable to the faster growth in Gross non-performing loans, which outpaced the 39.1% growth in general Loan Loss Provisions. With the slow recovery in some sectors locally and the high NPL ratios in some of the group’s subsidiaries, we expected the group to provision more to cater for the prevailing credit risk,
- Deterioration in efficiency levels - The cost to income ratio without LLP deteriorated to 45.7% from 44.3% in H1’2021, an indication of reduced efficiency. Key to note, the cost to income ratio deteriorated by 1.2% points on a q/q basis to 45.7% from 44.5% recorded in Q1’2022, and,
- Reduced Lending – H1’2022 was characterized by a faster 30.4% growth in government securities which outpaced the 20.3% growth in loans, mainly due to the bank’s cautious lending given the deterioration in the Group’s asset quality.
For a comprehensive analysis, please see our KCB Group Plc’s H1’2022 Earnings Note
- ABSA Bank Kenya Plc
|
Balance Sheet Items |
H1’2021 |
H1’2022 |
y/y change |
|
Government Securities |
121.3 |
120.8 |
(0.4%) |
|
Net Loans and Advances |
218.9 |
261.5 |
19.5% |
|
Total Assets |
398.2 |
445.3 |
11.8% |
|
Customer Deposits |
263.9 |
281.7 |
6.7% |
|
Deposits per Branch |
3.1 |
3.4 |
8.0% |
|
Total Liabilities |
346.2 |
389.0 |
12.4% |
|
Shareholder's Funds |
52.0 |
56.2 |
8.2% |
|
Balance sheet ratios |
H1’2021 |
H1’2022 |
% point change |
|
Loan to Deposit Ratio |
82.9% |
92.9% |
10.0% |
|
Return on average equity |
19.3% |
21.4% |
2.1% |
|
Return on average assets |
2.3% |
2.7% |
0.4% |
|
Income Statement Items |
H1’2021 |
H1’2022 |
y/y change |
|
Net Interest Income |
12.0 |
14.4 |
20.3% |
|
Net non-Interest Income |
5.8 |
6.5 |
10.8% |
|
Total Operating income |
17.8 |
20.9 |
17.2% |
|
Loan Loss provision |
(1.9) |
(3.0) |
52.2% |
|
Total Operating expenses |
(9.9) |
(11.8) |
19.2% |
|
Profit before tax |
7.9 |
9.1 |
14.7% |
|
Profit after tax |
5.6 |
6.3 |
13.0% |
|
Core EPS |
1.0 |
1.2 |
13.0% |
|
Income statement ratios |
H1’2021 |
H1’2022 |
% point change |
|
Yield from interest-earning assets |
9.2% |
9.7% |
0.5% |
|
Cost of funding |
2.8% |
2.7% |
(0.1%) |
|
Net Interest Margin |
7.0% |
7.6% |
0.6% |
|
Cost to Income |
55.5% |
56.4% |
0.9% |
|
Cost to Assets |
2.0% |
2.0% |
0.0% |
|
Net Interest Income as % of operating income |
67.2% |
69.0% |
1.8% |
|
Non-Funded Income as a % of operating income |
32.8% |
31.0% |
(1.8%) |
|
Capital Adequacy Ratios |
H1’2021 |
H1’2022 |
% Points change |
|
Core Capital/Total Liabilities |
17.7% |
18.1% |
0.4% |
|
Minimum Statutory ratio |
8.0% |
8.0% |
0.0% |
|
Excess |
9.7% |
10.1% |
0.4% |
|
Core Capital/Total Risk Weighted Assets |
14.7% |
14.0% |
(0.7%) |
|
Minimum Statutory ratio |
10.5% |
10.5% |
0.0% |
|
Excess |
4.2% |
3.5% |
(0.7%) |
|
Total Capital/Total Risk Weighted Assets |
17.3% |
16.4% |
(0.9%) |
|
Minimum Statutory ratio |
14.5% |
14.5% |
0.0% |
|
Excess |
2.8% |
1.9% |
(0.9%) |
|
Liquidity Ratio |
38.1% |
30.3% |
(7.8%) |
|
Minimum Statutory ratio |
20.0% |
20.0% |
0.0% |
|
Excess |
18.1% |
10.3% |
(7.8%) |
|
Adjusted Core Capital/Total Liabilities |
17.8% |
18.2% |
0.4% |
|
Adjusted Core Capital/Total RWA |
14.8% |
14.0% |
(0.8%) |
|
Adjusted Total Capital/Total RWA |
17.4% |
16.5% |
(0.9%) |
Key take-outs from the earnings release include;
- Earnings Growth - Core earnings per share increased by 13.0% to Kshs 1.2 in H1’2022, from Kshs 1.0 in H1’2021, driven by a 17.2% increase in total operating income to Kshs 20.9 bn, from Kshs 17.8 bn recorded in H1’2021. However, the growth was weighed down by the 19.2% increase in total operating expenses, to Kshs 11.8 bn, from Kshs 9.9 bn recorded in H1’2021,
- Improvement in Asset Quality - The bank’s asset quality improved, with the NPL ratio decreasing to 7.1% in H1’2022, from 7.9% in H1’2021, owing to the faster 19.5% growth in Gross Loans, compared to the relatively slower 7.9% increase in Gross Non-Performing Loans (NPLs). We note that the NPL ratio has continued to decline having reduced by 0.5% points from 7.6% recorded in Q1’2022 mainly attributable to the improving business environment,
- Modest Provisioning – As the NPLs increase, the group has continued to increase its provisioning levels with the NPL coverage coming in at 78.5% in H1’2022, an increase from the 76.2% and 70.9% recorded in in Q1’H1’2021, respectively. This points towards modest provisioning by the bank amidst the tough operating environment on the back of the elevated cost of living, and,
- Interim Dividend - The Board of Directors recommended an interim Dividend Per Share (DPS) of Kshs 0.2, translating to a total dividend payout of Kshs 1.1 bn. At the current price of Kshs 11.7, this translates to a dividend yield of 1.7%.
For a comprehensive analysis, please see our ABSA Bank Kenya Plc’s H1’2022 Earnings Note
- Co-operative Bank of Kenya Limited
|
Balance Sheet Items (Kshs bn) |
H1’2021 |
H1’2022 |
y/y change |
|
Government Securities |
182.0 |
183.2 |
0.7% |
|
Net Loans and Advances |
301.2 |
330.1 |
9.6% |
|
Total Assets |
573.0 |
603.9 |
5.4% |
|
Customer Deposits |
407.7 |
423.0 |
3.8% |
|
Deposits per Branch |
2.3 |
2.4 |
3.2% |
|
Total Liabilities |
480.4 |
506.9 |
5.5% |
|
Shareholders’ Funds |
92.6 |
96.7 |
4.4% |
|
Balance Sheet Ratios |
H1’2021 |
H1’2022 |
% points y/y change |
|
Loan to Deposit Ratio |
73.9% |
78.0% |
4.1% |
|
Return on average equity |
12.7% |
21.8% |
9.1% |
|
Return on average assets |
2.0% |
3.5% |
1.5% |
|
Income Statement (Kshs bn) |
H1’2021 |
H1’2022 |
y/y change |
|
Net Interest Income |
18.8 |
21.1 |
11.8% |
|
Non-Interest Income |
10.3 |
13.3 |
28.8% |
|
Total Operating income |
29.2 |
34.4 |
17.8% |
|
Loan Loss provision |
(4.2) |
(3.3) |
(19.6%) |
|
Total Operating expenses |
(18.7) |
(19.2) |
2.5% |
|
Profit before tax |
10.5 |
15.3 |
45.2% |
|
Profit after tax |
7.4 |
11.5 |
55.7% |
|
Earnings per share (Kshs) |
1.1 |
1.7 |
55.7% |
|
Income Statement Ratios |
H1’2021 |
H1’2022 |
% points y/y change |
|
Yield from interest-earning assets |
11.7% |
11.4% |
(0.3%) |
|
Cost of funding |
3.1% |
3.2% |
0.1% |
|
Net Interest Spread |
8.5% |
8.2% |
(0.3%) |
|
Net Interest Income as % of Total Income |
64.6% |
61.3% |
(3.3%) |
|
Non-Funded Income as a % of Total Income |
35.4% |
38.7% |
3.3% |
|
Cost to Income |
64.1% |
55.8% |
(8.3%) |
|
Cost to Income Ratio without provisions |
49.9% |
46.0% |
(3.9%) |
|
Cost to Assets |
2.5% |
2.6% |
0.1% |
|
Net Interest Margin |
8.6% |
8.4% |
(0.2%) |
|
Capital Adequacy Ratios |
H1’2021 |
H1’2022 |
% points change |
|
Core Capital/Total deposit Liabilities |
18.2% |
19.7% |
1.5% |
|
Minimum Statutory ratio |
8.0% |
8.0% |
0.0% |
|
Excess |
10.2% |
11.7% |
1.5% |
|
Core Capital/Total Risk Weighted Assets |
15.3% |
15.5% |
0.2% |
|
Minimum Statutory ratio |
10.5% |
10.5% |
0.0% |
|
Excess |
4.8% |
5.0% |
0.2% |
|
Total Capital/Total Risk Weighted Assets |
17.0% |
16.6% |
(0.4%) |
|
Minimum Statutory ratio |
14.5% |
14.5% |
0.0% |
|
Excess |
2.5% |
2.1% |
(0.4%) |
|
Liquidity Ratio |
55.7% |
50.8% |
(4.9%) |
|
Minimum Statutory ratio |
20.0% |
20.0% |
0.0% |
|
Excess |
35.7% |
30.8% |
(4.9%) |
|
Adjusted Core Capital/Total Deposit Liabilities |
15.6% |
15.6% |
0.0% |
|
Adjusted Core Capital/Total Risk Weighted Assets |
13.1% |
12.2% |
(0.9%) |
|
Adjusted Total Capital/Total Risk Weighted Assets |
14.8% |
13.4% |
(1.4%) |
Key take-outs from the earnings release include;
- Earnings Growth - Core earnings per share increased by 55.7% to Kshs 1.7 in H1’2022, from Kshs 1.1 in H1’2021, higher than our projections of 12.9% increase to Kshs 1.2 bn. The performance was driven by a 17.8% increase in total operating income to Kshs 34.4 bn in H1’2022, from Kshs 29.2 bn in H1’2021, which outpaced the 2.5% increase in the total operating expenses to Kshs 19.2 bn in H1’2022, from Kshs 18.7 bn in H1’2021, and,
- Improvement in Asset Quality – the group’s asset quality improved, with the NPL ratio reducing to 14.1% in H1’2022, from 15.2% in H1’2021, owing to the 9.1% growth in gross loans to Kshs 363.8 bn, from Kshs 333.5 bn in H1’2021, which outpaced the 0.7% increase in gross non-performing loans. The improved asset quality was attributable to the continued economic recovery which has seen more business pick up and more people going back to their jobs given that the group’s loan book constituted 50.1% personal consumer loans as of Q1’2022. The group has also embarked on proactive credit management strategies that have seen increased loan repayments.
For a comprehensive analysis, please see our Co-operative Banks of Kenya Limited’s H1’2022 Earnings Note
- NCBA Group
|
Balance Sheet Items |
H1'2021 |
H1'2022 |
y/y change |
|
Net Loans and Advances |
239.6 |
250.5 |
4.5% |
|
Government Securities |
173.9 |
203.4 |
17.0% |
|
Total Assets |
542.6 |
604.3 |
11.4% |
|
Customer Deposits |
437.3 |
468.5 |
7.1% |
|
Deposits per Branch |
4.6 |
4.5 |
(1.1%) |
|
Total Liabilities |
468.2 |
524.0 |
11.9% |
|
Shareholders’ Funds |
74.3 |
80.2 |
8.0% |
|
Balance Sheet Ratios |
H1'2021 |
H1’2022 |
y/y change |
|
Loan to Deposit Ratio |
54.8% |
53.5% |
(1.3%) |
|
Return on average equity |
11.1% |
18.2% |
7.1% |
|
Return on average assets |
1.5% |
2.5% |
1.0% |
|
Income Statement(Kshs bns) |
H1’2021 |
H1’2022 |
y/y change |
|
Net Interest Income |
13.4 |
14.8 |
10.2% |
|
Net non-Interest Income |
10.7 |
14.2 |
32.5% |
|
Total Operating income |
24.1 |
29.0 |
20.1% |
|
Loan Loss provision |
5.9 |
5.6 |
(6.1%) |
|
Total Operating expenses |
16.3 |
17.1 |
4.6% |
|
Profit before tax |
7.4 |
11.2 |
50.8% |
|
Profit after tax |
4.7 |
7.8 |
66.9% |
|
Core EPS |
2.8 |
4.7 |
66.9% |
|
Income Statement Ratios |
H1’2021 |
H1’2022 |
y/y change |
|
Yield from interest-earning assets |
10.4% |
10.3% |
(0.1%) |
|
Cost of funding |
4.18% |
4.33% |
0.1% |
|
Net Interest Spread |
6.2% |
6.0% |
(0.2%) |
|
Net Interest Margin |
6.2% |
6.0% |
(0.2%) |
|
Cost of Risk |
24.5% |
19.2% |
(5.4%) |
|
Net Interest Income as % of operating income |
55.6% |
51.1% |
(4.6%) |
|
Non-Funded Income as a % of operating income |
44.4% |
48.9% |
4.6% |
|
Cost to Income Ratio |
67.7% |
58.9% |
(8.7%) |
|
Cost to Income Ratio without LLP |
43.1% |
39.8% |
(3.4%) |
|
Capital Adequacy Ratios |
H1’2021 |
H1’2022 |
% points change |
|
Core Capital/Total Liabilities |
16.8% |
17.1% |
0.3% |
|
Minimum Statutory ratio |
8.0% |
8.0% |
- |
|
Excess |
8.8% |
9.1% |
0.3% |
|
Core Capital/Total Risk Weighted Assets |
19.2% |
21.8% |
2.6% |
|
Minimum Statutory ratio |
10.5% |
10.5% |
- |
|
Excess |
8.7% |
11.3% |
2.6% |
|
Total Capital/Total Risk Weighted Assets |
19.4% |
21.8% |
2.4% |
|
Minimum Statutory ratio |
14.5% |
14.5% |
- |
|
Excess |
4.9% |
7.3% |
2.4% |
|
Liquidity Ratio |
60.3% |
58.0% |
(2.3%) |
|
Minimum Statutory ratio |
20.0% |
20.0% |
- |
|
Excess |
40.3% |
38.0% |
(2.3%) |
|
Adjusted Core Capital/Total Liabilities |
17.0% |
17.7% |
0.7% |
|
Adjusted Core Capital/Total RWA |
19.4% |
19.9% |
0.5% |
|
Adjusted Total Capital/Total RWA |
19.6% |
19.9% |
0.3% |
Key take-outs from the earnings release include;
- Earnings Growth - Core earnings per share rose by 66.9% to Kshs 4.7, from Kshs 2.8 in H1’2021, lower than our expectation of a 38.8% growth, driven by the 20.1% growth in total operating income to Kshs 29.0 bn, from Kshs 24.1 bn in H1’2021. However, the performance was weighed down by the 4.6% increase in total operating expenses to Kshs 17.1 bn, from 16.3 bn in H1’2021,
- Improved Asset quality: The group’s asset quality improved, as evidenced by the decline in NPL ratio to 13.5%, from 16.7% in H1’2021 driven by the 18.1% decline in NPLs to Kshs 36.9 bn from Kshs 45.0 bn. The improvement in the group’s asset quality is attributable to the 1.3% growth in gross loans coupled with the 18.1% decline in Gross Non-Performing Loans (NPLs). The 1.3% growth in gross loans is as a result of resumption in lending by the bank following an improvement in the business environment. Notably, the NPL ratio increased by 1.3% points from the 14.7% that was recorded in FY’2021. We expect NPLs to continue declining in the short term as the sectors recover in tandem with the economy as a whole. Risks however lie on the downside given the persistent high inflation, high government pending bills and geopolitical risks worsened by the Russian-Ukraine conflict,
- Improved Operating Efficiency - The bank’s operating efficiency improved as evidenced by the decline in cost to income ratio to 58.9%, from 67.7% in H1’2021, which indicates reduced operational costs and improved operational efficiency attributable to faster 20.1% increase in total operating income as compared to the 4.6% increase in the total operating expenses, and,
- Interim Dividend - The Board of Directors recommended an interim Dividend Per Share (DPS) of Kshs 2.0, translating to a total dividend payout of Kshs 0.4 bn. At the current price of Kshs 28.6, this translates to a dividend yield of 7.0%.
For a comprehensive analysis, please see our NCBA Group’s H1’2022 Earnings Note
- Diamond Trust Bank Kenya
|
Balance Sheet Items |
H1’2021 |
H1’2022 |
y/y change |
|
Government Securities |
134.8 |
129.0 |
(4.3%) |
|
Net Loans and Advances |
204.3 |
233.6 |
14.3% |
|
Total Assets |
429.6 |
485.0 |
12.9% |
|
Customer Deposits |
313.8 |
346.5 |
10.4% |
|
Deposits per Branch |
2.3 |
2.7 |
14.7% |
|
Total Liabilities |
357.4 |
408.4 |
14.3% |
|
Shareholders’ Funds |
65.4 |
68.9 |
5.4% |
|
Balance Sheet Ratios |
H1’2021 |
H1’2022 |
% Points change |
|
Loan to Deposit Ratio |
65.1% |
67.4% |
2.3% |
|
Return on average equity |
6.4% |
7.8% |
1.4% |
|
Return on average assets |
1.0% |
1.1% |
0.1% |
|
Income Statement |
H1’2021 |
H1’2022 |
y/y change |
|
Net Interest Income |
9.8 |
11.1 |
13.3% |
|
Net non-Interest Income |
3.3 |
3.9 |
17.8% |
|
Total Operating income |
13.1 |
15.0 |
14.5% |
|
Loan Loss provision |
2.3 |
2.4 |
5.2% |
|
Total Operating expenses |
8.3 |
9.4 |
13.4% |
|
Profit before tax |
4.88 |
5.62 |
15.2% |
|
Profit after tax |
3.2 |
4.0 |
25.6% |
|
Core EPS |
11.27 |
14.15 |
25.6% |
|
Income Statement Ratios |
H1’2021 |
H1’2022 |
% points change |
|
Yield from interest-earning assets |
8.7% |
8.8% |
0.1% |
|
Cost of funding |
2.1% |
2.1% |
- |
|
Net Interest Spread |
6.6% |
6.8% |
0.2% |
|
Net Interest Income as % of operating income |
74.7% |
74.0% |
(0.7%) |
|
Non-Funded Income as a % of operating income |
25.3% |
26.0% |
0.7% |
|
Cost to Income Ratio (CIR) |
62.9% |
62.3% |
(0.6%) |
|
CIR without provisions |
45.3% |
46.1% |
0.8% |
|
Cost to Assets |
4.9% |
4.6% |
(0.3%) |
|
Net Interest Margin |
5.0% |
5.2% |
0.2% |
|
Capital Adequacy Ratios |
H1’2021 |
H1’2022 |
% Points Change |
|
Core Capital/Total Liabilities |
22.5% |
21.7% |
(0.8%) |
|
Minimum Statutory ratio |
8.0% |
8.0% |
0.0% |
|
Excess |
14.5% |
13.7% |
(0.8%) |
|
Core Capital/Total Risk Weighted Assets |
21.3% |
20.0% |
(1.3%) |
|
Minimum Statutory ratio |
10.5% |
10.5% |
0.0% |
|
Excess |
10.8% |
9.5% |
(1.3%) |
|
Total Capital/Total Risk Weighted Assets |
22.8% |
21.2% |
(1.6%) |
|
Minimum Statutory ratio |
14.5% |
14.5% |
0.0% |
|
Excess |
8.3% |
7.6% |
(0.7%) |
|
Liquidity Ratio |
60.3% |
58.9% |
(1.4%) |
|
Minimum Statutory ratio |
20.0% |
20.0% |
0.0% |
|
Excess |
40.3% |
38.9% |
(1.4%) |
|
Adjusted Core Capital/Total Liabilities |
22.9% |
21.7% |
(1.2%) |
|
Adjusted Core Capital/Total RWA |
21.7% |
20.0% |
(1.7%) |
|
Adjusted Total Capital/Total RWA |
23.2% |
21.2% |
(2.0%) |
Key take-outs from the earnings release include;
- Earnings Growth - The bank’s core earnings per share increased by 25.6% to Kshs 14.2, from Kshs 11.3 in H1’2021, lower than our expectations of a 39.6% increase. The bank’s performance was driven by the 14.5% increase in total operating income to Kshs 15.0 bn, from Kshs 13.1 bn in H1’2021, which outpaced the 13.4% increase in total operating expenses to Kshs 9.4 bn from Kshs 8.3 bn in H1’2021,
- Deteriorating Asset Quality - The bank’s asset quality deteriorated, with the NPL ratio increasing to 12.8% from 10.4% recorded in H1’2021, due to the faster 43.0% growth in gross NPLs which outpaced the 16.0% growth in gross loans. The increased NPLs can be attributed to the fact that the bank lends mostly to the trade, real estate, manufacturing and tourism sectors which are yet to recover from the pandemic effects. The four sectors contributed a total of 87.1% of their NPLs as of December 2021. However, it is worth noting that the group’s loan book continues to expand gradually having grown by 14.3% compared to the 9.2% growth in Q1’2022, an indication of a gradual resumption to lending on the back of an improving business environment, and,
- Increasing Operating Expenses - The bank’s operating efficiency declined as evidenced by the increase in cost to income ratio without LLP to 46.1%, from 45.3% in H1’2022. This can be attributed to the continued increase in staff costs, having increased by 1% in H1’2021 as the Group embarks on expanding its network and focusing on branch transformation. We expect staff costs and other operating expenses to increase further as the bank is set to open 17 more branches in Kenya by the end of 2022. In the long term, we expect to see the move to give back to the group as per the strategy.
For a comprehensive analysis, please see our Diamond Trust Bank Kenya’s H1’2022 Earnings Note
Asset Quality
The table below is a summary of the asset quality for the listed banks
|
Bank |
H1'2021 NPL Ratio** |
H1'2022 NPL Ratio* |
H1'2021 NPL Coverage** |
H1'2022 NPL Coverage* |
% point change in NPL Ratio |
% point change in NPL Coverage |
|
ABSA Bank Kenya |
7.9% |
7.1% |
70.9% |
78.5% |
(0.8%) |
7.6% |
|
Equity Group |
11.4% |
8.8% |
63.2% |
64.1% |
(2.6%) |
0.9% |
|
I&M Holdings |
10.4% |
9.4% |
67.2% |
59.2% |
(1.0%) |
(8.0%) |
|
Stanbic Bank |
9.5% |
10.4% |
51.2% |
56.0% |
0.9% |
4.8% |
|
Diamond Trust Bank |
10.4% |
12.8% |
41.8% |
44.2% |
2.4% |
2.4% |
|
NCBA Group |
16.7% |
13.5% |
68.0% |
62.8% |
(3.2%) |
(5.2%) |
|
Co-operative Bank |
15.2% |
14.1% |
63.5% |
65.8% |
(1.1%) |
2.3% |
|
SCBK |
15.4% |
15.4% |
81.4% |
83.9% |
0.0% |
2.5% |
|
KCB Group |
14.4% |
21.4% |
61.6% |
45.8% |
7.0% |
(15.8%) |
|
Mkt Weighted Average |
12.6% |
13.0% |
64.5% |
62.3% |
0.4% |
(2.2%) |
|
*Market cap weighted as at 26/8/2022 **Market cap weighted as at 09/09/2021 |
||||||
Key take-outs from the table include;
- Asset quality for the listed banks deteriorated during the period, with the weighted average NPL ratio increasing by 0.4% points to a market cap weighted average of 13.0%, from an average of 12.6% for the listed banking sector in H1’2021, and,
- NPL Coverage for the listed banks declined to a market cap weighted average of 62.3% in H1’2022, from 64.5% recorded in H1’2021, as the banks reduced their provisioning following reduced risks with some sectors such as tourism, agriculture and manufacturing continue to record gradual recovery.
Summary Performance
The table below highlights the performance of the listed banks, showing the performance using several metrics, and the key take-outs of the performance;
|
Cytonn Investments Summary Quarter 2, 2022 - Listed Banks Performance Summary |
|||||||||||||
|
Bank |
Core EPS Growth |
Interest Income Growth |
Interest Expense Growth |
Net Interest Income Growth |
Net Interest Margin |
Non-Funded Income Growth |
NFI to Total Operating Income |
Growth in Total Fees & Commissions |
Deposit Growth |
Growth in Government Securities |
Loan to Deposit Ratio |
Loan Growth |
Return on Average Equity |
|
NCBA |
66.9% |
10.9% |
12.0% |
10.2% |
6.0% |
32.5% |
48.9% |
(2.2%) |
7.1% |
17.0% |
53.5% |
4.5% |
17.3% |
|
Co-op |
55.7% |
10.0% |
5.5% |
11.8% |
8.4% |
28.8% |
38.7% |
36.8% |
3.8% |
0.7% |
78.0% |
9.6% |
21.8% |
|
Stanbic |
36.9% |
14.8% |
(2.2%) |
20.9% |
5.4% |
25.1% |
45.1% |
11.1% |
(0.7%) |
(36.1%) |
94.5% |
17.5% |
20.1% |
|
Equity |
36.1% |
28.6% |
30.9% |
27.8% |
7.3% |
24.4% |
39.4% |
28.5% |
18.5% |
16.9% |
67.0% |
28.9% |
31.9% |
|
KCB Group |
28.4% |
15.7% |
30.3% |
11.5% |
8.5% |
29.9% |
32.1% |
24.4% |
15.6% |
30.4% |
80.4% |
20.3% |
23.2% |
|
DTB-K |
25.6% |
12.5% |
11.4% |
13.3% |
5.2% |
17.8% |
26.0% |
9.4% |
10.4% |
(4.3%) |
67.4% |
14.3% |
7.8% |
|
I&M |
15.9% |
19.3% |
20.2% |
18.7% |
6.4% |
28.2% |
32.5% |
30.1% |
13.2% |
17.2% |
73.8% |
13.0% |
13.3% |
|
ABSA |
13.0% |
21.3% |
25.1% |
20.3% |
7.6% |
10.8% |
31.0% |
(10.0%) |
6.7% |
(0.4%) |
92.9% |
19.5% |
21.4% |
|
SCBK |
10.9% |
4.4% |
(21.4%) |
9.9% |
6.4% |
10.9% |
35.6% |
(6.2%) |
3.1% |
2.1% |
44.8% |
(1.3%) |
17.7% |
|
H1'22 Mkt Weighted Average* |
33.5% |
18.2% |
18.7% |
17.9% |
7.3% |
24.2% |
37.1% |
18.2% |
11.4% |
11.2% |
72.8% |
18.0% |
23.5% |
|
H1'21 Mkt Weighted Average** |
136.0% |
15.0% |
10.8% |
17.6% |
7.4% |
19.2% |
35.6% |
16.6% |
18.4% |
12.4% |
68.8% |
11.7% |
16.9% |
|
*Market cap weighted as at 26/08/2022 |
|||||||||||||
|
**Market cap weighted as at 09/09/2021 |
|||||||||||||
Key takeaways from the table above include:
- The listed banks recorded a 33.5% weighted average growth in core Earnings per Share (EPS), compared to a weighted average increase of 136.0% in H1’2021 for the listed banking sector,
- The Banks have recorded a weighted average deposit growth of 11.4%, slower than the 18.4% growth recorded in H1’2021, an indication of reduced investment risk in the business environment,
- Interest income grew by 18.2%, compared to a growth of 15.0% recorded in H1’2021 while the weighted average Yield on Interest Earning Assets (YIEA) declined to 9.8%, from the 9.9% recorded in H1’2021 for the listed banking sector. On the other hand, the Net Interest Margin (NIM) now stands at 7.3%, 0.1% points lower than the 7.4% recorded in H1’2021 for the whole listed banking sector, and,
- Non-Funded Income grew by 24.2%, compared to the 19.2% growth recorded in H1’2022.
Universe of coverage:
|
Company |
Price as at 19/08/2022 |
Price as at 26/08/2022 |
w/w change |
YTD Change |
Target Price* |
Dividend Yield |
Upside/ Downside** |
P/TBv Multiple |
Recommendation |
|
Kenya Reinsurance |
2.2 |
2.1 |
(3.2%) |
(8.7%) |
3.2 |
4.6% |
56.7% |
0.2x |
Buy |
|
Jubilee Holdings |
252.3 |
258.0 |
2.3% |
(18.5%) |
379.4 |
5.6% |
52.6% |
0.5x |
Buy |
|
I&M Group*** |
17.0 |
17.2 |
1.2% |
(19.9%) |
22.3 |
8.8% |
38.9% |
0.5x |
Buy |
|
Sanlam |
11.7 |
11.5 |
(1.3%) |
(0.4%) |
15.9 |
0.0% |
38.3% |
1.2x |
Buy |
|
KCB Group*** |
43.3 |
41.0 |
(5.3%) |
(10.1%) |
52.2 |
6.9% |
34.4% |
0.8x |
Buy |
|
Diamond Trust Bank*** |
50.3 |
51.5 |
2.5% |
(13.4%) |
62.4 |
6.0% |
27.1% |
0.2x |
Buy |
|
ABSA Bank*** |
12.6 |
12.1 |
(4.4%) |
(7.3%) |
14.1 |
7.9% |
24.9% |
0.9x |
Buy |
|
Co-op Bank*** |
99.0 |
99.0 |
0.0% |
13.8% |
109.8 |
9.1% |
20.0% |
0.9x |
Buy |
|
Stanbic Holdings |
6.1 |
6.4 |
5.2% |
(14.8%) |
7.7 |
0.0% |
19.6% |
1.1x |
Accumulate |
|
Britam |
12.4 |
11.7 |
(5.3%) |
(0.4%) |
13.6 |
1.6% |
17.9% |
1.2x |
Accumulate |
|
Equity Group*** |
48.0 |
49.2 |
2.5% |
(6.7%) |
54.4 |
6.3% |
16.8% |
1.3x |
Accumulate |
|
NCBA*** |
138.3 |
136.0 |
(1.6%) |
4.6% |
137.0 |
10.1% |
10.9% |
1.1x |
Accumulate |
|
Standard Chartered*** |
25.8 |
28.6 |
10.7% |
12.2% |
29.1 |
7.8% |
9.7% |
0.7x |
Hold |
|
Liberty Holdings |
7.2 |
7.1 |
(0.8%) |
1.1% |
7.8 |
0.0% |
9.2% |
0.5x |
Hold |
|
CIC Group |
2.1 |
2.1 |
4.4% |
(1.4%) |
2.1 |
0.0% |
(1.9%) |
0.7x |
Sell |
|
HF Group |
3.6 |
3.4 |
(6.7%) |
(11.6%) |
2.8 |
0.0% |
(16.7%) |
0.2x |
Sell |
|
Target Price as per Cytonn Analyst estimates **Upside/ (Downside) is adjusted for Dividend Yield ***For Disclosure, these are stocks in which Cytonn and/or its affiliates are invested in |
|||||||||
We are “Neutral” on the Equities markets in the short term due to the current adverse operating environment and huge foreign investor outflows, and, “Bullish” in the long term due to current cheap valuations and expected global and local economic recovery.
With the market currently trading at a lower value to its future growth (PEG Ratio at 0.9x), we believe that investors should reposition towards value stocks with strong earnings growth and that are trading at discounts to their intrinsic value. We expect the current high foreign investors sell-offs, the upcoming Kenyan general elections and the slow vaccine rollout to continue weighing down the economic outlook in the short term.
- Residential Sector
During the week, the National Housing Cooperation (NHC) announced that it is seeking to raise Kshs 7.0 bn through the International Finance Corporation (IFC) under the Public Private Partnership (PPP) model, to fund the construction of 3,500 housing units in Athi River, Machakos County. The housing units are part of the Kshs 20.0 bn Stoni Athi Waterfront City project, consisting of 10,500 units to be developed on a 150 acres piece of land. The affordable housing project consists of one, two and three bedroom units targeting the low, middle, and high-income earners as highlighted in our Cytonn Monthly November 2021. IFC will finance the development of the units to completion upon which, the private investors will recoup all their capital through monthly rent collections within a period of 15 to 20 years. Thereafter, full ownership of the development units will be transferred back to the NHC.
With the PPP model, we expect the project to be fast tracked through the long term funding, as affordable housing projects have been stalled primarily due to inadequate funding. Currently, the government has delivered approximately 3,000 housing units, way lower than its target of 500,000 units by December 2022. Consequently, Kenya’s housing deficit continues to grow at a rate of 200,000 units p.a, and currently standing at 2.0 mn units. Some of the affordable housing projects in the pipeline include; i) Pangani affordable housing project, ii) River Estate project, and, iii) Park Road project, among others. Additionally, the involvement of the private sector is expected to boost investment confidence in the initiative which has been gaining traction despite its challenges, evidenced by the 330,324 applicants registered in the Boma Yangu portal.
- Commercial Office Sector
During the week, Little, a technology company, announced plans to construct a commercial office building in Lavington, using commercial mortgage loans. The construction cost for the project is estimated to come in between Kshs 597.9 mn and Kshs 717.4 mn, and will begin in 2023 on an undisclosed size of land that the company owns along Kabasarian Avenue. The technology firm began its operations in 2016 as a taxi-hailing service provider and is currently based in Craft Silicon Campus building in Westlands, along with its parent company, Craft Silicon Limited. However, Little is seeking to establish its own identity through the upcoming development that will also accommodate its increasing operations that has necessitated more expansion, in addition to minimizing congestion at its current location. Besides taxi hailing services that it began with, Little App currently runs other operations such as food deliveries, entertainment services, and health care services.
The commercial office sector continues to show signs of recovery evidenced by the various expansion activities witnessed in the sector. Going forward, we expect the move to continue driving performance of the sector by providing more affordable commercial space for expanding businesses. However, we note that office spaces continue to exceed demand with a current oversupply of 6.7 mn SQFT. As such, we expect the trend to shape the sector as more firms continue to adopt remote working strategies. This will see the occupancy levels decline and consequently see a decline in the rental yields as property owners lower their rents to attract tenants.
- Retail Sector
During the week, Safaricom PLC announced plans to shut down its retail outlet at Two Rivers Mall, by 31st August 2022, as it plans to streamline its operations with the existing oversupply of retail spaces in the country that has reduced the footfall in shopping malls. The outlet was opened in 2017 in order to serve the surrounding neighborhoods such as Ruaka, Redhill, Kabuku, and Limuru, given the congestion that was being experienced at its Village Market Outlet. The Nairobi Metropolitan Area is faced with a mall oversupply of 3.0 mn SQFT, weighing on the country’s current oversupply of 2.2 mn SQFT. With the exit of the retailer, we expect the existing oversupply to increase, hence reducing malls footfall even further. Consequently, the performance of the mall and Limuru Road where Two Rivers is located is expected to slightly decline as a result of declined occupancy rates which currently average at 73.3%, 2.6% points lower than the market average of 75.9%, as shown in the table below;
|
Nairobi Metropolitan Area Retail Sector Performance H1’2022 |
|||
|
Area |
Rent Kshs /SQFT 2022 |
Occupancy% 2022 |
Rental Yield 2022 |
|
Kilimani |
182 |
85.0% |
9.7% |
|
Westlands |
215 |
72.9% |
9.0% |
|
Karen |
205 |
78.6% |
8.9% |
|
Kiambu/ Limuru Road |
187 |
73.3% |
8.1% |
|
Ngong Road |
169 |
78.0% |
7.5% |
|
Mombasa Road |
150 |
78.5% |
7.3% |
|
Thika Road |
165 |
74.8% |
7.3% |
|
Satellite Towns |
138 |
70.7% |
6.0% |
|
Eastlands |
133 |
74.2% |
5.9% |
|
Average |
173 |
75.9% |
7.8% |
Source: Cytonn Research 2022
Despite the increasing investor confidence and aggressive expansion that has been witnessed in the retail sector, we expect the oversupply of mall spaces to continue weighing down the overall performance of the sector.
- Hospitality Sector
During the week, the Competition Authority of Kenya (CAK) approved the sale of 680 Hotel in Nairobi’s city center to Maanzoni Lodges, and Crowne Plaza Hotel in Upper Hill to Kasada Hospitality Fund. This comes one month after the two hotels were acquired by the respective buyers for a total of Kshs 5.0 bn; 680 Hotel valued at Kshs 1.2 bn, and Crowne Plaza valued at Kshs 4.6 bn, as per our Cytonn Monthly July 2022 report. According to the report, Kasada’s acquisition of Crowne Plaza was mainly driven by its interest to get a taste of the Kenyan hospitality market, coupled by the recovery of the industry. On the other hand, Maanzoni’s acquisition decision was mainly on the back of its interest to expand its operations beyond Machakos County.
- Infrastructure Sector
During the week, the Kenya National Highway Authority (KeNHA) announced plans to construct two segments of the Eldoret-Juba road, at an estimated cost of Kshs 22.6 bn. Financing of the project sections will be jointly done by the Government of Kenya and the African Development Bank (AfDB). The sections to be constructed will be as follows;
- A 55.0 Km road between Lesseru in Uasin Gishu County and Kitale in Transzoia County at an estimated cost of Kshs 6.6 bn, and,
- A 142.0 Km road between Morpus in West Pokot County and Lokichar in Turkana County at an estimated cost Kshs 16.0 bn.
The project forms part of the 945.0 km road linking Tanzania, Kenya and South Sudan with the section of the corridor within Kenya amounting to approximately 900 Km. The section begins from Isebania, at the Kenya-Tanzania border, and ends at Nakadok, at the Kenya - South Sudan border. The project aims to;
- Enhance transport connectivity within the Eastern African region by linking Tanzania, Kenya, and South Sudan which is a landlocked country,
- Promote tourism activities through enhanced accessibility to the surrounding tourism destination areas,
- Boost property investments through property developments and capital appreciations for the existing properties,and,
- Stimulate economic activities and development in the surrounding areas and regions.
The Government of Kenya continues to instigate numerous infrastructure projects particularly roads, with an aim of further opening up the country for economic growth, as well as making it a regional trade hub. Some of the projects in the pipeline currently include; i) Athi River Machakos Turn Off, ii) Western By Pass, iii) Gatukuyu Matara Road, iv) Ngong-Suswa road project, and, v) Gatundu Muthaiga project among many others. We expect a similar trend to continue shaping the performance of the sector through various strategies like; project partnerships, annual budget allocations, and, issuing of bonds to raise funds for construction.
- Real Estate Investment Trusts (REITs)
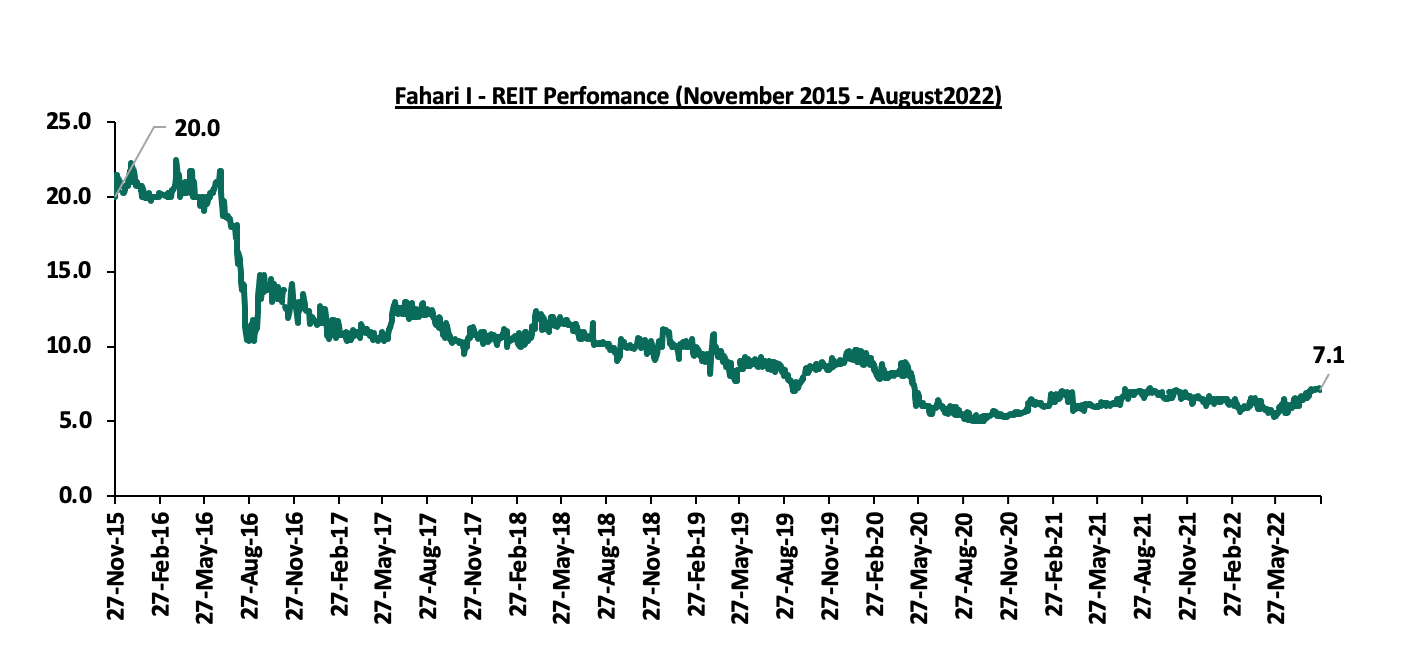
In the Nairobi Stock Exchange, ILAM Fahari I - REIT closed the week trading at an average price of Kshs 7.1 per share. The performance represents a 10.9% Year-to-Date (YTD) increase from Kshs 6.4 per share. On an Inception-to-Date (ITD) basis, the REIT’s performance continues to be weighed down having recorded a 64.5% decline from Kshs 20.0. The graph below shows Fahari I-REIT’s performance from November 2015 to August 2022:
The performance of Kenya’s Real Estate sector is expected to be boosted by the increasing investor confidence in the market, the slow but rising expansion in the office market, as well as the construction activities in the residential and infrastructure sectors. However, the existing oversupply of mall space in the retail sector, financial constraints, and investor’s minimal appetite for the Kenyan REIT instrument is expected to continue weighing down the overall investments in the property market.
All investments have a certain degree of risk owing to market conditions and the nature of specific businesses. In times of high uncertainty, investment risk tends to increase and decline during times of low uncertainty. Currently, the global economy is hailed by increased uncertainty emanating from elevated inflationary pressures, persistent supply chain bottlenecks, resurgence of COVID-19 infections and the prevailing geopolitical pressures. Closer home, Kenya has not been exempted with the uncertainty evidenced by increased investor sell-offs in the Nairobi Securities Exchange, increasing yields and the undersubscription of government securities. The uncertainty has also been reflected in the business environment characterized by slow activity with the average purchasing managers index (PMI) coming in at 48.8, in the first seven months of 2022. In light of the developments, we shift our focus to investment risks analysis in Kenya where we will discuss the types of investments risk and look at how investors can manage such risks so as to maximize returns while minimizing loses.
We shall cover the topic as follows;
- Introduction,
- Types of Investment Risks,
- Investment Risks Management Strategies,
- Advantages and Disadvantages of Investment Risk Management, and,
- Conclusion
Section I: Introduction
An investment refers to the acquisition of an asset or an instrument with the objective of generating income or increasing value over time. An investment risk on the other hand refers to the degree of uncertainty with regards to realizing the returns as projected by an investor. Key to note, the level of investment risks varies depending on the type of investments made and the higher the risk, the higher the return. The fixed income asset class is considered as a low risk investment as they act as a safe haven for investors during periods of increased economic uncertainties. The equities asset class on the other hand is regarded as a high-risk investment due to their sensitivity to market fluctuations. As such, investors are required to consider various factors when investing to ensure that they maximize their returns while avoiding unnecessary losses. Some of the factors include;
- Expected Returns – When investing, it is essential to consider the expected return and whether it aligns with an investor’s expectations. The returns can be in the form of interest, dividend or capital gain or loss. It will also be essential to understand one’s risk profile to ensure that an investor carries the risk they can tolerate,
- Liquidity – Refers to how quickly an investment can be converted or exchanged to money through the sale of an instrument or redemption of a matured security. The choice of investment is guided by investors’ financial needs as it determines how soon they require their money back,
- Volatility – An investor should understand the pace of fluctuations that an investment endures. The level of volatility will determine the nature of risks involved since the higher the rate of fluctuations, the higher the risk of profit or losses,
- Time Horizon – Prior to investing, one should understand the duration to hold an investment before redemption or selling. However, time horizons depend on the nature of instruments such as equity instruments, debt instruments and also age profile, and,
- Risk Return Analysis – When making investment decisions, it is essential to understand what type of risks an investment attracts. Investments in traditional instruments such as gold, fixed deposits and bonds have lower risks but with lower returns compared to listed securities.
Section II: Types of Investment Risks
Investment risks are broadly categorized into two; Systematic and Unsystematic risks as follows;
- Systematic risks - These are market related risk which an investor cannot mitigate through diversification of the portfolio. Systematic risks are mainly caused by factors that are external to an individual or organization and are inter-related to macro-economic indicators such as inflation, Gross Domestic Product (GDP), exchange rate variability and interest rates. The various types of systematic risks include:
- Inflation/Purchasing Power Risk – Inflation refers to persistent and sustained increase in general price levels which consequently reduces the purchasing power of money. Inflation risk is, thus, the potential of reduction in the actual worth of an investment and its return owing to inflation. It mostly affects fixed income securities as their income is fixed on nominal terms,
- Reinvestment Risk – Refers to the potential of loss attributable to reinvesting investment proceeds at a lower rate than the rate of the initial investments. It mostly impacts long term investments, equities, and the zero-coupon bonds,
- Interest Rate Risk – The risk arises as a result of changing interest rates in the market. Any change in the interest rate as a result of market forces alters the return on investments, mostly fixed income securities as bond prices for instance, are inversely related to the prevailing market interest rates, and,
- Exchange Rate Risk – This is the risk arising from the fluctuation in the value of foreign currency with respect to the local currency. Exchange rate risk affects only the securities of companies or individuals with foreign exchange transactions or exposures, which altars the actual worth of such an investment.
- Unsystematic risks – Refers to risks unique to a particular company, individual or industry and can be reduced to a certain extent by diversification. Unsystematic risks mostly arise from the management, location, or the financial obligations of the investor. The various subdivisions of unsystematic risks include;
- Liquidity Risk – this is the possibility of not being able to convert an investment into ready cash when need arises or the difficulty of finding a buyer in the market when one needs to liquidate their investments,
- Financial Risks – Refers to the uncertainty in the expected returns as a result of changes in the financial structure of a company. Only risk-free assets give returns equal to the expected returns. An example of this risk is when a firm has no capacity to meets its business obligations hence unable to pay dividends or even interest,
- Political Risk– This refers to risks arising from changes in the legislations, trade barriers, or any other political decision that could have negative impact on the projected rate of return from an investment,
- Business Risk- This is the uncertainty in the returns of an investment due to volatility in a firm’s operating income,
- Legal Risk – Refers to the potential of a loss emanating from insufficient knowledge or misunderstanding of how the law applies to your investment, and,
- Investment Manager Risk – It is the risk linked with ineffectiveness and inefficiency of an investment manager to manage risks prudently.
Section III: Investment Risk Management Strategies
As an investor, it is essential to take steps towards minimizing investment risks to realize the expected return. Investors should be cautious by applying prudent investment risk management strategies to ascertain that losses do not exceed an investor’s acceptable boundaries. The right strategy should enable an investor to understand the risk tolerance and create a portfolio with investments in line with an investor’s goal. Below are some of the risk management strategies that investors can apply in their investment portfolios;
- Understanding one’s risk tolerance – Risk tolerance measures the degree of loss an investor is willing to withstand. It is determined by a number of factors such as age of the investor and the financial obligations. Once investors understand their risk tolerance, they can decide on which asset classes to invest in, according to the best risk-return value for managing the investment risk,
- Maintain sufficient liquidity in the portfolio – Sufficient liquid assets in the portfolio are important as this ensures the existing investments deliver optimal-long term returns and benefit from periodic market corrections. It will also protect against liquidity risk in the investment market. Additionally, one can maintain sufficient liquidity in the portfolio by setting aside an emergency fund which falls within 6-8 months of expenses,
- Hedging – Refers to minimizing risks by buying a security to offset a potential loss on another investment. Hedging strategy does not guarantee that investments will not lose value at all, however, it mitigates losses by gains recorded in another investment. The most common form of hedging is a derivative or a contract which is valued through an underlying asset,
- Diversification – The strategy involves investing in more than one asset class to reduce the investment risks to provide optimal returns. A suitable investment mix can have asset classes such as Equity, Debt, Real Estate, Mutual Funds, Gold, among others. It is also advisable to have a combination of asset classes that are inversely correlated with each other such as gold and equity to bring out portfolio balance. Investors can also reduce the overall risk by diversifying investments under the same asset class,
- Invest for a long horizon – It is prudent to stay longer in the market to take advantage of compounding. A longer investment horizon ensures that the portfolio is not affected by small market corrections and will also reduce the overall investment risk. However, this strategy is only suitable for investments such as in stocks and bonds. Key to note, investors should select an investment horizon that is in line with their financial obligations,
- Undertake due diligence – As an investor, it is essential to carry out comprehensive research before making an investment decision. When investing for long term purposes, it is vital to understand the performance of the management and look into key ratios. Detailed analysis helps in forecasting the performance of an investment in the future,
- Continuous monitoring – An investor should always monitor the performance of their portfolio regularly and undertake periodic reviews. Typically, portfolio reviews should be done once in six months to look into asset classes that are prone to short term volatility such as equities. Long-term investors have the advantage of overlooking short-term shocks in investments and only alter an investment if it shows poor performance over an extended duration, and,
- Establish a maximum loss plan – This is a method that investors apply to cautiously manage asset allocation in their portfolio. It protects investors from making bad decisions based on emotions about market movements. The strategy calculates a personal maximum loss limit and uses the percentage to establish appropriate asset allocation for an individual investor. The calculation is usually based on historic market numbers and personal feelings about market losses and investors will have the leeway to adjust the prices depending on what is happening in the market.
Section IV: Advantages and Disadvantages of Investment Risk Management
Advantages
Investment risk management is important as it protects investors against extreme and unnecessary losses. Some of the benefits of risk management include;
- Helps in spreading risks – Risk management through diversification is beneficial as it helps spread out risks and provides better opportunities of making money and protect investors from panic selling as it will be impossible to sell all your assets in case the market is crushing,
- Longer investment horizon offers compounding returns – Investing in a long-term investment horizon is advantageous since the longer your investment duration the more time you have to correct the ups and downs in the market by recovering the losses. Having a clear investment horizon is essential in managing risk by deciding on which assets to invest in depending on the risk tolerance level and financial needs,
- Making conscious decisions – Undertaking proper research enables an investor to understand the nature of investments from all angles to avoid being blinded by unforeseen events. As a result, an investor will make conscious decisions from an informed point and avoid confirmation bias, and,
- Avoiding Catastrophic losses – Investment risk management prepares investors for the different types of shocks in the market as they are able to see and adjust the small shocks that continuously affects the market. Additionally, risk analysis prepares investors to foresee potential catastrophic events that causes catastrophic losses and how to respond in such situations.
Disadvantages
Despite the benefits that come along with investment risk management, there exists shortcomings arising from the same. This include;
- Time Consuming Process - The process of managing investment risk is usually a complex process. It involves technical analysis and data collection and requires a lot of accuracy. As such, the process will require a lot of time,
- Expensive - The process of risk management involves technical analysis and data collection which is usually expensive hence an investor needs to set aside enough finances for the process,
- Certain risks depend on external factors - Not all risks are manageable as some are usually dependent upon external factors which an investor cannot control,
- Accuracy of determining investment risks relies on various variables - The process of determining accurately an investment risk will rely on a variety of factors such as the strength of the model being used, the viability of the assumptions, and the quality of data used in the analysis
- Tying up money in long term investment – Risk management by investing in longer time horizon has a downside of tying an investor’s money for a long duration thus missing on other viable short-term investments opportunities. Further, investing in long-term duration is not a guarantee that investments will perform better by correcting market volatilities. Such strategy requires patience and continuous monitoring, and,
- Being too cautious – In some instances, investors may be paralyzed by analysis as one may overthink an investment hence fail to make the right decision. Failure to strike a balance between being too risky and too risk averse may make investors to talk themselves out of profitable investments.
Conclusion
Investing in an uncertain business environment is not a welcome idea for most investors as most of them tend to hold their funds and wait for periods with low uncertainty. This is despite the fact that there may be profitable opportunities through the various investment channels available, with the main challenge being fear of making losses. In our view, investors should implement investment risk management strategies, consult with financial advisors if necessary, and conduct due diligence to capitalize on the various seasons, whether they are uncertain economic times or periods of a stable economic environment. This will ensure that investors do not waste opportunities or incur unnecessary losses given that the current economy is constantly affected by unprecedented phenomena.
Disclaimer: The views expressed in this publication are those of the writers where particulars are not warranted. This publication, which is in compliance with Section 2 of the Capital Markets Authority Act Cap 485A, is meant for general information only and is not a warranty, representation, advice or solicitation of any nature. Readers are advised in all circumstances to seek the advice of a registered investment advisor.

- Talk to us
- Kenya
- P.O Box 20695 - 00200, Nairobi, Kenya
- Cell +254709101200
- Tel +254709101200
- WhatsApp +254741676635
- United States
- +254709101200
- DOWNLOAD OUR APP
-


- Kenya
- 8th Floor, Pinetree Plaza, Kaburu Drive, Ngong Road, Nairobi, Kenya
- USA
- Suite 1150, 1775 Eye Street NW, USA, Washington DC 20006, USA
- Investments
- High Yield
- Private Equity
- Real Estate
- Real Estate
- RiverRun Estates
- Cytonn Towers
- The Ridge
- Taraji Heights
- The Alma