Unit Trust Funds Performance, Q1’2022, & Cytonn Monthly, July 2022
By Cytonn Research, Jul 31, 2022
Executive Summary
Fixed Income
During the month of July, T-bills remained undersubscribed, with the overall subscription rate coming in at 97.4%, down from 79.2% recorded in June 2022. The increase in the subscription rate was partly attributable to investors preference for the shorter dated papers as they sought to avoid duration risk. The overall subscription rates for the 91-day and 182-day papers increased to 278.1% and 74.8% from 142.3% and 58.6%, respectively, while that of the 364-day paper declined to 47.6% from 74.4% recorded in June 2022. In the primary bond market, the government bonds for the month of July were undersubscribed with the average subscription rate coming in at 29.3%, lower than the 90.1% average subscription rate for the month of June 2022;
The Monetary Policy Committee (MPC) met on July 27th 2022 and maintained the Central Bank Rate (CBR) at 7.5%, we had expected a 0.25% increase. Additionally, the National Treasury gazetted the revenue and net expenditures for the FY’2021/2022, highlighting that the total revenue collected as at the end of June 2022 amounted to Kshs 1,939.2 bn, equivalent to 104.7% of the revised estimates of Kshs 1,851.5 bn. Also during the week, the Kenya National Bureau of Statistics (KNBS) released the y/y inflation for the month of July 2022 highlighting that the inflation rate increased to 8.3%, from the 7.9% recorded in June 2022;
Equities
During the month of July, the equities market was on an upward trajectory, with NASI, NSE 20 and NSE 25 gaining by 13.3%, 5.5% and 10.9%, respectively. The equities market performance was driven by gains recorded by large cap stocks such as Safaricom, EABL, Equity Group and Co-operative Bank of 20.0%, 13.1%, 11.6% and 9.2%, respectively. The gains were however weighed down by losses recorded by stocks such as Bamburi and Diamond Trust Bank (DTB-K) which declined by 3.6% and 1.9%, respectively;
Real Estate
During the month, three industry reports were released namely; the Q1’2022 Gross Domestic Product report by the Kenya National Bureau of Statistics, the House Price Index Q2'2022 and Land Price Index Q2'2022 by Hass Consult which highlighted that the average q/q and y/y house selling prices increased by 3.3% and 10.5%, respectively, in Q2’2022. Similarly, the average y/y selling prices for land in the Nairobi suburbs and satellite towns appreciated by 0.9% and 10.5%, respectively. In the residential sector, the Kenya Mortgage Refinance Company (KMRC) announced plans to disburse approximately Kshs 7.7 bn to Primary Mortgage Lenders (PMLs), for onward lending to potential home buyers in the country by December 2022. Additionally, pension funds administrator CPF announced plans to construct affordable housing units in Laikipia, Nakuru, Nairobi and, Mombasa Counties;
In the hospitality sector, private equity firm Actis Limited, completed the purchase of three hotels it acquired from South Africa City Lodge Hotel Group in July 2021 namely; Fairview Hotel in Nairobi, City Lodge Hotel in Two Rivers, and, Town Lodge Hotel in Upperhill, at a cost of Kshs 1.0 bn. Additionally, Kasada Hospitality Fund, a Qatar private equity firm, purchased Crowne Plaza Hotel located in Nairobi’s Upperhill District, at a cost of Kshs 4.6 bn. Also, Maanzoni Lodge, a Machakos based hotel entity, purchased Nairobi’s 680-Hotel for an estimated Kshs 1.2 bn;
In the infrastructure sector, the Kenya National Highway Authority (KENHA) suspended construction works of the 8.0 Km Kisumu-Kakamega Highway project due to financial constraints. Additionally, the National Government launched the tarmacking of the 18.0 km Adiedo – Namba Karabok road project in Homabay County. For the Real Estate Investment Trusts (REITs), Acorn Holdings released their H1’2022 financial results highlighting that the I-REIT recorded a 29.2% increase in the net earnings to Kshs 192.0 mn, from Kshs 148.6 mn in H1’2021, whereas the D-REIT recorded a 7.8% decline in the net earnings to Kshs 105.3 mn, from Kshs 114.2 mn in H1’2021. Also, ILAM Fahari I-REIT closed the month trading at an average price of Kshs 6.5 per share;
Focus of the Week
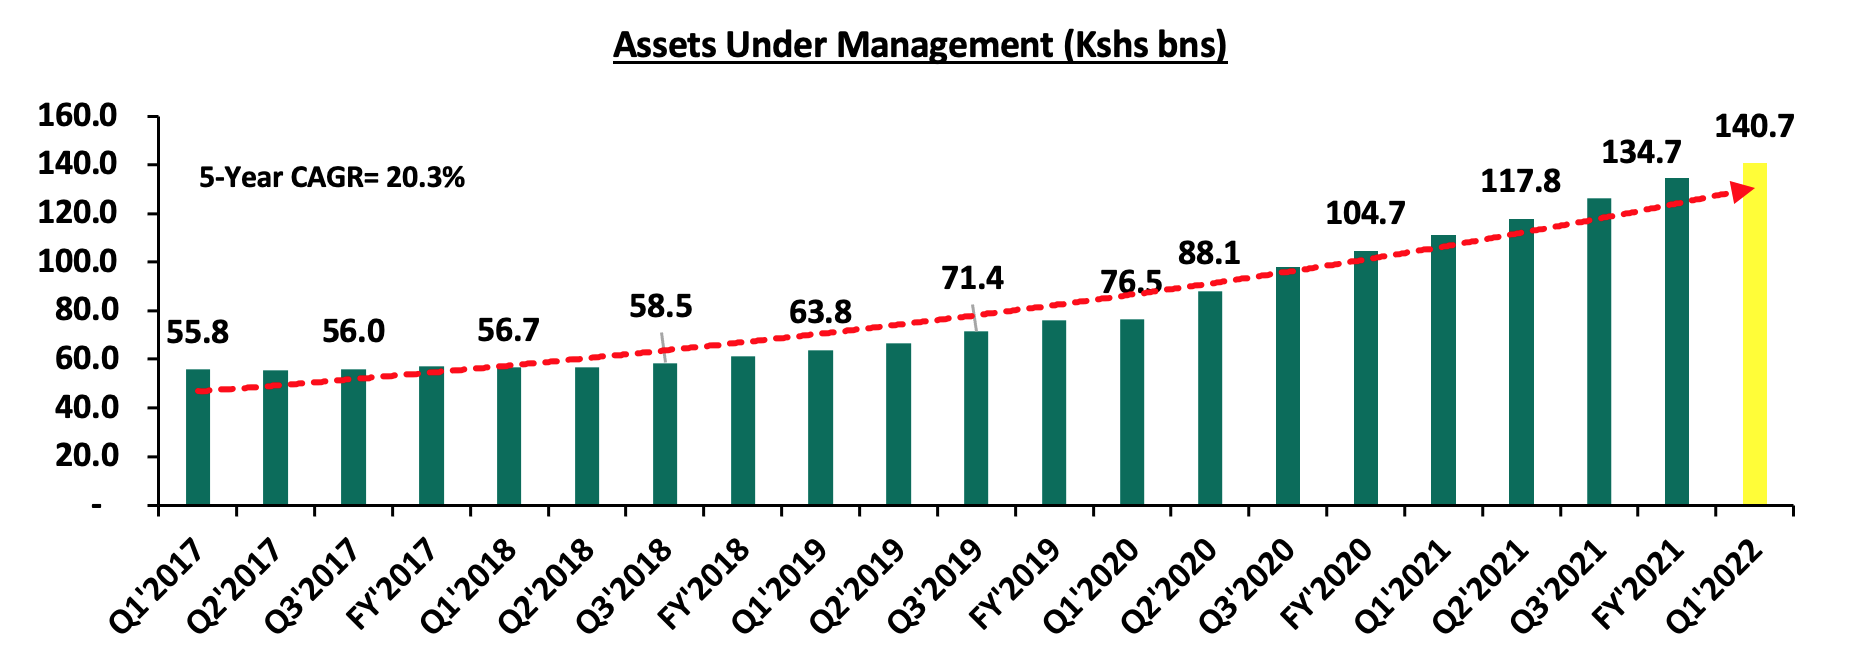
Following the release of the Capital Markets Authority (CMA) Quarterly Statistical Bulletin-Q2’2022, we examine the performance of Unit Trust Funds. During the period of review, Unit Trusts’ Assets under Management grew by 4.5% to Kshs 140.7 bn as at the end of Q1’2022, from Kshs 134.7 bn recorded in FY’2021. Additionally, as at the end of Q1’2022, there were 30 approved Collective Investment Schemes, making up 111 funds in total;
Investment Updates:
- Weekly Rates:
- Cytonn Money Market Fund closed the week at a yield of 10.57%. To invest, dial *809# or download the Cytonn App from Google Playstore here or from the Appstore here;
- Cytonn High Yield Fund closed the week at a yield of 13.93% p.a. To invest, email us at sales@cytonn.com and to withdraw the interest, dial *809# or download the Cytonn App from Google Playstore here or from the Appstore here;
- We continue to offer Wealth Management Training every Wednesday and every third Saturday of the month, from 9:00 am to 11:00 am, through our Cytonn Foundation. The training aims to grow financial literacy among the general public. To register for any of our Wealth Management Trainings, click here;
- If interested in our Private Wealth Management Training for your employees or investment group, please get in touch with us through wmt@cytonn.com;
- Any CHYS and CPN investors still looking to convert are welcome to consider one of the five projects currently available for assignment, click here for the latest term sheet;
- Cytonn Insurance Agency acts as an intermediary for those looking to secure their assets and loved ones’ future through insurance namely; Motor, Medical, Life, Property, WIBA, Credit and Fire and Burglary insurance covers. For assistance, get in touch with us through insuranceagency@cytonn.com;
- Cytonnaire Savings and Credit Co-operative Society Limited (SACCO) provides a savings and investments avenue to help you in your financial planning journey. To enjoy competitive investment returns, kindly get in touch with us through clientservices@cytonn.com;
Real Estate Updates:
- For an exclusive tour of Cytonn’s real estate developments, visit: Sharp Investor's Tour, and for more information, email us at sales@cytonn.com;
- Phase 3 of The Alma is now ready for occupation and the show house is open daily. To rent please email properties@cytonn.com;
- We have 8 investment-ready projects, offering attractive development and buyer targeted returns; See further details here: Summary of Investment-ready Projects;
- For Third Party Real Estate Consultancy Services, email us at rdo@cytonn.com;
- For recent news about the group, see our news section here;
Hospitality Updates:
- We currently have promotions for Staycations. Visit cysuites.com/offers for details or email us at sales@cysuites.com;
Money Markets, T-Bills Primary Auction:
During the month of July, T-bills remained undersubscribed, with the overall subscription rate coming in at 97.4%, down from 79.2% recorded in June 2022. The increase in the subscription rate was partly attributable to investors preference for the shorter dated papers as they sought to avoid duration risk. The overall subscription rates for the 91-day and 182-day papers increased to 278.1% and 74.8% from 142.3% and 58.6%, respectively, while that of the 364-day paper declined to 47.6% from 74.4% recorded in June 2022. The average yields on the 364-day, 182-day and 91-day papers increased by 2.4 bps, 21.9 bps and 30.5 bps to 10.0%, 9.3% and 8.2%, respectively. For the month of July, the government continued to reject expensive bids, accepting a total of Kshs 88.1 bn out of the Kshs 93.5 bn worth of bids received, translating to an acceptance rate of 94.3%.
During the week, T-bills were undersubscribed, with the overall subscription rate coming in at 82.1%, a decline from the 144.1% recorded the previous week. The decrease in the subscription rate was partly attributable to the tightened liquidity in the money market with the average interbank rates increasing to 5.4% from 5.3% recorded the previous week. Investors’ preference for the shorter 91-day paper persisted, with the paper receiving bids worth Kshs 14.1 bn against the offered Kshs 4.0 bn, translating to a subscription rate of 351.9%, down from the 388.4% recorded the previous week. The subscription rate for the 182-day and 364-day papers declined to 32.5% and 23.8% from 146.5% and 44.0%, respectively, recorded the previous week. The yields on the government papers recorded mixed performance, with the yields on the 91-day paper increasing by 7.7 bps to 8.4%, while the yields on the 364-day and 182-day papers declined by 2.2 bps and 0.1 bps to 9.9% and 9.4%, respectively. The government rejected expensive bids, accepting a total of Kshs 18.3 bn worth of bids out of the Kshs 19.7 bn worth of bids received, translating to an acceptance rate of 92.9%.
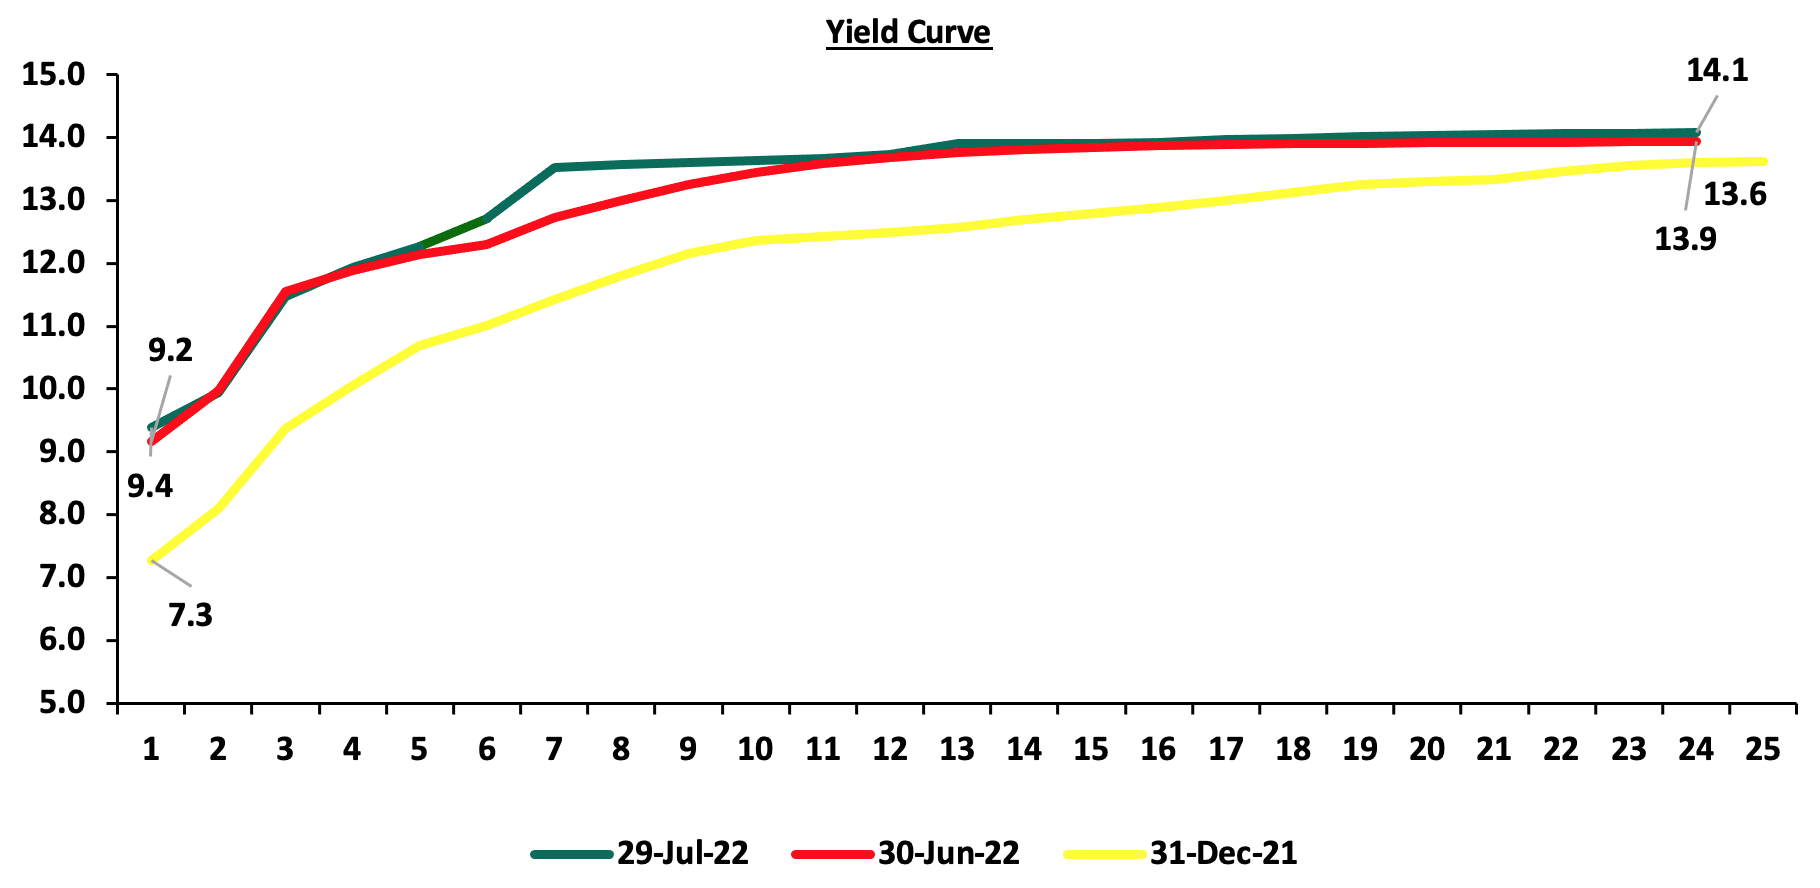
In the primary bond market, the government released the auction results for the two bonds, FXD2/2013/15 and FXD2/2018/15, that were issued for the month of July in a bid to raise Kshs 40.0 bn for budgetary support. The bonds were undersubscribed, receiving bids worth Kshs 10.6 bn against the offered Kshs 40.0 bn, translating to a subscription rate of 26.4%. The government also released the tap sale results for the infrastructure bond; IFB1/2022/018 issued to raise Kshs 20.0 bn for funding infrastructure projects. The bond was also undersubscribed, receiving bids worth Kshs 6.4 bn, translating to a subscription rate of 32.1%. The average tenor for the July bonds came in at 16.0 years higher than June’s 12.0 years average tenor. The weighted average rate of accepted bids for the July bonds was 13.6%, 0.4% points higher than the 13.2% average rate for the June bonds, reflective of the increasing perceived risk as we approach the August elections. The table below provides more details on the bonds issued during the month of July:
|
Issue Date |
Bond Auctioned |
Effective Tenor to Maturity (Years) |
Coupon |
Amount offered (Kshs bn) |
Actual Amount Raised (Kshs bn) |
Total bids received |
Average Accepted Yield |
Subscription Rate |
Acceptance Rate |
|
11/07/2022 |
IFB1/2022/018 - Tap Sale |
18.0 |
13.7% |
20.00 |
6.4 |
6.4 |
13.7% |
32.1% |
100.0% |
|
25/07/2022 |
FXD2/2013/15 |
15.0 |
12.0% |
40.0 |
9.3 |
10.6 |
13.2% |
26.4% |
88.0% |
|
FXD2/2018/15 |
15.0 |
12.8% |
13.9% |
||||||
|
July 2022 Average |
16.0 |
12.8% |
30.0 |
7.9 |
8.5 |
13.6% |
29.3% |
94.0% |
|
|
June 2022 Average |
12.0 |
13.2% |
50.0 |
46.7 |
48.0 |
13.2% |
90.1% |
98.3% |
|
Secondary Bond Market:
In the month of July 2022, the yields on government securities in the secondary market were on an upward trajectory, with the FTSE NSE bond index remaining relatively unchanged at Kshs 94.7, as recorded in June 2022, bringing the YTD performance to a decline of 1.4%. The chart below shows the yield curve movement during the period:
The secondary bond turnover declined by 5.6% to Kshs 60.9 bn, from Kshs 64.5 bn recorded in June 2022, pointing towards decreased activity by commercial banks in the secondary bonds market. On a year on year basis, the bonds turnover declined by 1.4% to Kshs 910.0 bn, from Kshs 923.2 bn worth of treasury bonds transacted over a similar period last year.
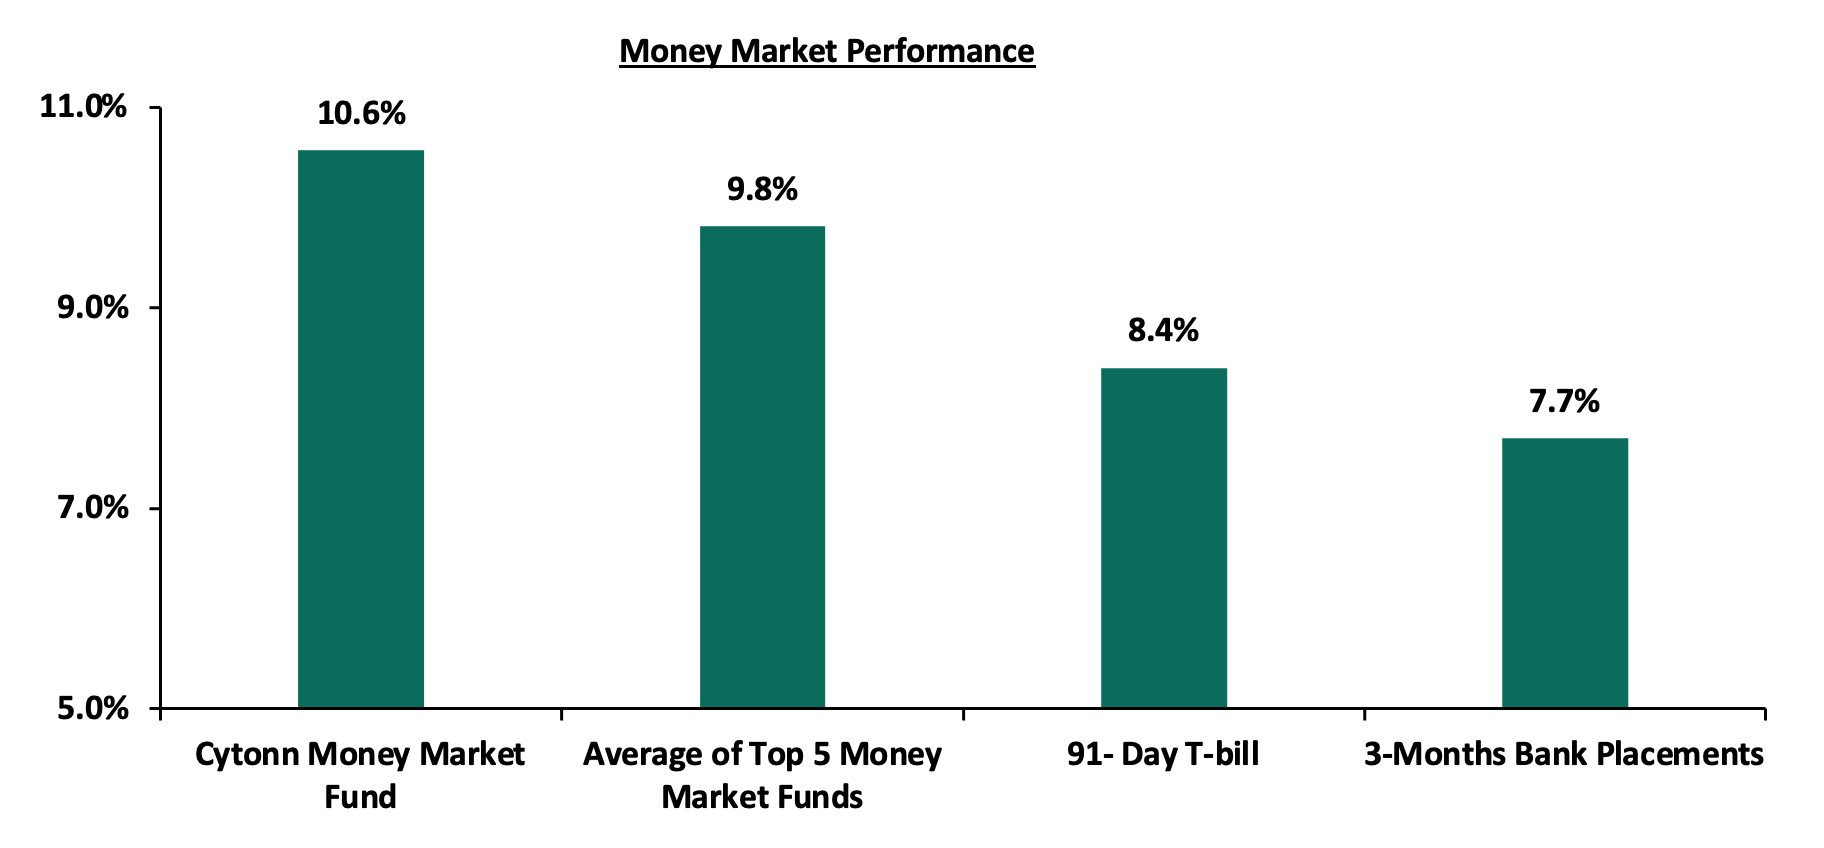
In the money markets, 3-month bank placements ended the week at 7.7% (based on what we have been offered by various banks), while the yield on the 91-day T-bill increased by 7.7 bps to 8.4%. The average yield of the Top 5 Money Market Funds remained relatively unchanged at 9.8%, as was recorded last week while yield of Cytonn Money Market Fund increased by 10.0 bps to 10.6% from 10.5% recorded the previous week.
The table below shows the Money Market Fund Yields for Kenyan Fund Managers as published on 29th July 2022:
|
Money Market Fund Yield for Fund Managers as published on 29th July 2022 |
||
|
Rank |
Fund Manager |
Effective Annual Rate |
|
1 |
Cytonn Money Market Fund |
10.6% |
|
2 |
Nabo Africa Money Market Fund |
9.9% |
|
3 |
Zimele Money Market Fund |
9.9% |
|
4 |
Sanlam Money Market Fund |
9.4% |
|
5 |
Madison Money Market Fund |
9.3% |
|
6 |
NCBA Money Market Fund |
9.1% |
|
7 |
Dry Associates Money Market Fund |
9.1% |
|
8 |
Old Mutual Money Market Fund |
9.0% |
|
9 |
CIC Money Market Fund |
9.0% |
|
10 |
Co-op Money Market Fund |
8.9% |
|
11 |
GenCap Hela Imara Money Market Fund |
8.7% |
|
12 |
Apollo Money Market Fund |
8.7% |
|
13 |
ICEA Lion Money Market Fund |
8.6% |
|
14 |
Orient Kasha Money Market Fund |
8.5% |
|
15 |
AA Kenya Shillings Fund |
7.9% |
|
16 |
British-American Money Market Fund |
7.5% |
Source: Business Daily
Liquidity:
Liquidity in the money markets tightened in the month of July 2022, with the average interbank rate increasing to 5.5%, from 5.1%, recorded in June 2022. During the week, liquidity in the money markets tightened, with the average interbank rate increasing to 5.4% from 5.3% recorded the previous week, partly attributable to tax remittances that offset government payments. The average interbank volumes traded decreased by 23.5% to Kshs 22.6 bn from Kshs 29.5 bn recorded the previous week.
Kenya Eurobonds:
During the month, the yields on the Eurobonds recorded mixed performance with most on upward trajectory partly attributable to investors attaching higher risk premium on the country due to perceived higher risks arising from increasing inflationary pressures and local currency depreciation as well as the upcoming August elections. The yield on the 7-year Eurobond issued in 2019 was the largest gainer increasing by 0.9% points to 17.0% from 16.1%, recorded in June 2022 while the yield on the 10-year Eurobond issued in 2014 was the only decliner decreasing by 0.1% points to 16.9%, from 17.0%, recorded in June 2022.
During the week, the yields on Eurobonds were on a downward trajectory, an indication of easing risk concerns over the economy by investors despite the prevailing risks surrounding the high inflation and the upcoming August elections. The yield on the 10-year Eurobond issued in 2014 recorded the highest decline having declined by 1.4% points to 16.9%, from 18.3%, recorded the previous week. The table below shows the summary of the performance of the Kenyan Eurobonds as of 28th July 2022;
|
Kenya Eurobond Performance |
||||||
|
|
2014 |
2018 |
2019 |
2021 |
||
|
Date |
10-year issue |
10-year issue |
30-year issue |
7-year issue |
12-year issue |
12-year issue |
|
03-Jan-22 |
4.4% |
8.1% |
8.1% |
5.6% |
6.7% |
6.6% |
|
30-Jun-22 |
17.0% |
14.7% |
13.7% |
16.1% |
13.8% |
12.7% |
|
22-Jul-22 |
18.3% |
15.4% |
14.1% |
17.5% |
14.5% |
13.8% |
|
25-Jul-22 |
16.9% |
15.2% |
13.6% |
16.6% |
14.3% |
13.3% |
|
26-Jul-22 |
16.3% |
15.0% |
13.8% |
16.9% |
14.1% |
13.4% |
|
27-Jul-22 |
16.8% |
15.2% |
13.9% |
17.6% |
14.3% |
13.6% |
|
28-Jul-22 |
16.9% |
15.3% |
14.0% |
17.0% |
14.4% |
13.5% |
|
Weekly Change |
(1.4%) |
(0.1%) |
(0.1%) |
(0.5%) |
(0.1%) |
(0.3%) |
|
M/M Change |
(0.1%) |
0.6% |
0.3% |
0.9% |
0.6% |
0.8% |
|
YTD Change |
12.5% |
7.2% |
5.9% |
11.4% |
7.7% |
6.9% |
Source: Central Bank of Kenya (CBK)
Kenya Shilling:
During the month, the Kenya Shilling depreciated by 0.8% against the US Dollar, to close the month at Kshs 118.8, from Kshs 117.8 recorded at the end of June 2022, driven by the increased dollar demand from oil and merchandise importers on the back of increased global oil prices against slower recovery in exports against slower supply of hard currency.
During the week, the Kenyan shilling depreciated by 0.2% against the US dollar to close the week at Kshs 118.8, from Kshs 118.6 recorded the previous week, partly attributable to increased dollar demand from the oil and energy sectors against a slower supply of hard currency. On a year to date basis, the shilling has depreciated by 5.0% against the dollar, higher than the 3.6% depreciation recorded in 2021. We expect the shilling to remain under pressure in 2022 as a result of:
- High global crude oil prices on the back of persistent supply chain bottlenecks further exacerbated by the Russian-Ukrainian geopolitical pressures at a time when demand is picking up with the easing of COVID-19 restrictions and as economies continue to recover. Key to note, risks abound the recovery following the resurgence of COVID-19 infections in the country and the country’s trading partners,
- Increased demand from merchandise traders as they beef up their hard currency positions in anticipation for increased demand as economies gradually recover,
- An ever-present current account deficit due to an imbalance between imports and exports, with Kenya’s current account deficit estimated to come in at 5.3% of GDP in the 12 months to June 2022 compared to the 5.2% for a similar period in 2021. The wider deficit reflects a higher import bill, particularly for petroleum products, with the imports for Q1’2022 increasing by 14.5%, 5.7% points higher than the 8.8% increase in exports, and,
- The aggressively growing government debt, with Kenya’s public debt having increased at a 10-year CAGR of 18.2% to Kshs 8.6 tn in May 2022, from Kshs 1.6 tn in May 2012 thus putting pressure on forex reserves to service some of the public debt. It is worth noting that the average GDP growth over the same period has been 3.9%, an indicator that the increase in debt is not translating into GDP growth.
The shilling is however expected to be supported by:
- High Forex reserves currently at USD 7.7 bn (equivalent to 4.5-months of import cover), which is above the statutory requirement of maintaining at least 4.0-months of import cover, and the EAC region’s convergence criteria of 4.5-months of import cover. In addition, the reserves were boosted by the USD 750.0 mn World Bank loan facility received in March 2022 and are expected to be boosted further by the USD 235.6 mn funding from the International Monetary Fund (IMF), and,
- Improving diaspora remittances evidenced by a 6.6% y/y increase to USD 326.1 mn as of June 2022, from USD 305.9 mn recorded over the same period in 2021, which has continued to cushion the shilling against a faster depreciation. In the recently released June 2022 diaspora remittances figures, North America remained the largest source of remittances to Kenya accounting for 59.1% in the period, followed by Europe at 18.2% while the rest of the world accounted for 22.7% of the total.
Weekly Highlights:
- May 2022 MPC Meeting
The Monetary Policy Committee (MPC) met on July 27th 2022 to review the outcome of its previous policy decisions and recent economic developments, and to decide on the direction of the Central Bank Rate (CBR). The MPC maintained the CBR at 7.5%, against our expectations of a 25.0 bps increase to 7.75%. Below are some of the key highlights from the meeting:
- The overall inflation rose to 7.9% in June 2022 from 7.1% in May mainly because of increase in food and oil prices which rose by 13.8% and 10.0% in June from 12.4% and 9.0% in May, respectively. However, these increases were moderated by measures implemented by government to stabilize fuel prices, lower electricity tariffs, and subsidies on fertilizer. The domestic prices will be further moderated by the subsidy on retail prices of sifted maize flour, and the reduction on LPG gas. Therefore, inflation is expected to ease slightly in the coming month,
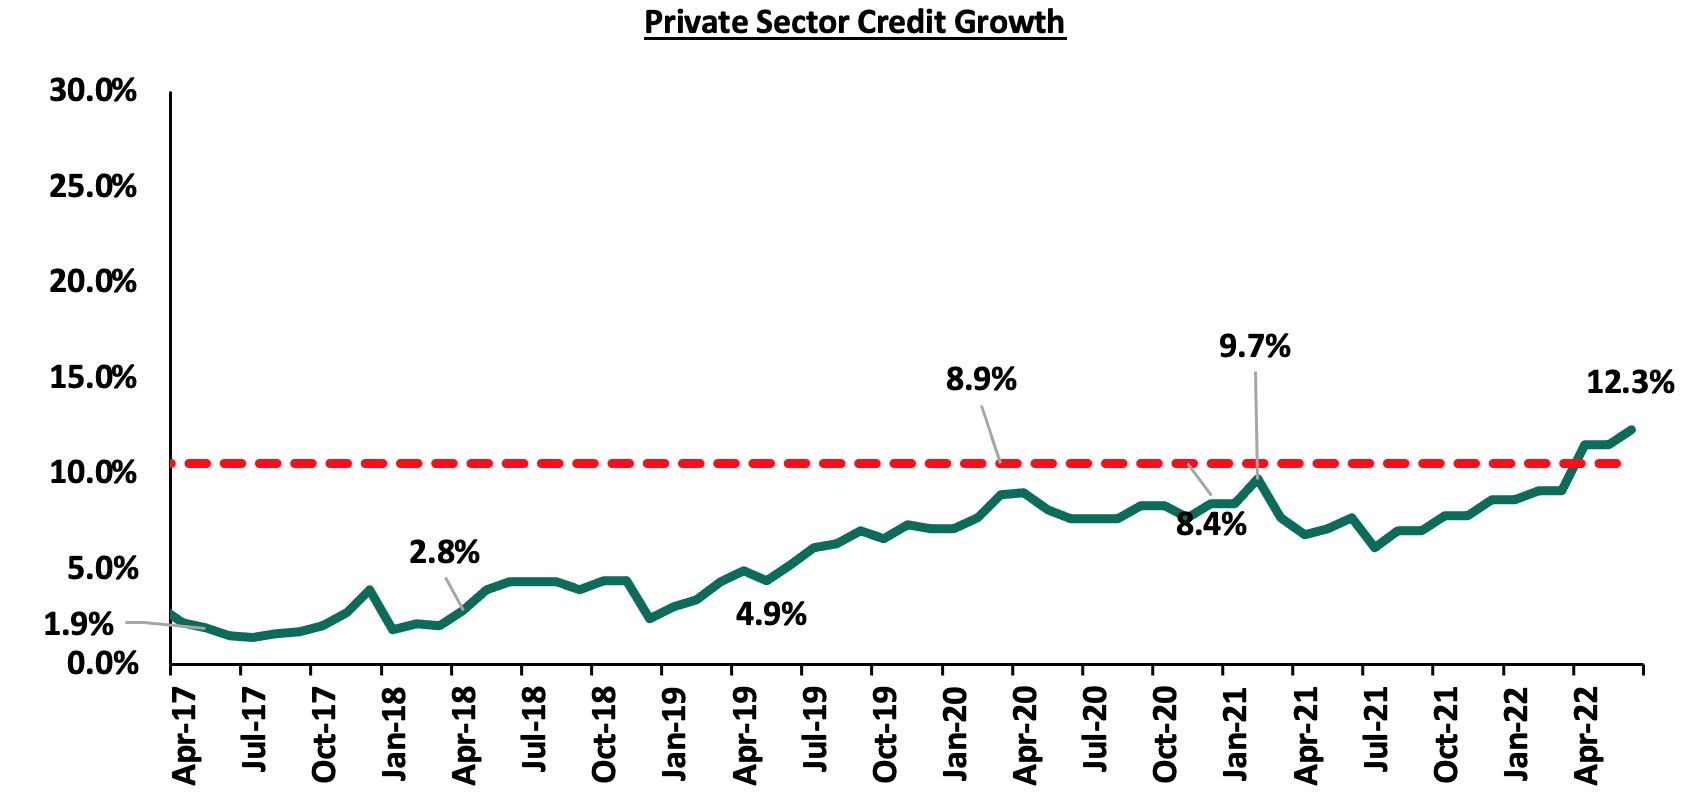
- Private sector credit growth continues to recover, having grown by 12.3% in June 2022 as compared to 7.7% over the same period in 2021. The key sectors that experienced increased lending include transport and communication (22.2%), manufacturing (15.2%) consumer durables, (14.7%) and trade (11.6%). the chart below shows the movement of the private sector credit growth over the last five years:
- The recently released GDP data by Kenya National Bureau of Statistics (KNBS) on the Q1’ 2022 Gross Domestic Product Report, indicate that the Kenyan economy recorded a 6.8% growth in Q1’2022, up from the 2.7% growth recorded in Q1’2021 indicating continued economic recovery. The growth was mainly driven by strong activity in transport and storage, wholesale and retail trade, construction, information and communication, and accommodation and food services,
- The CBK foreign exchange reserves, which currently stand at USD 7.4 mn (4.47 months of import cover), continue to provide adequate cover and a buffer against any short-term shocks in the foreign exchange market,
- The current account deficit to GDP is estimated at 5.3% in the 12 months to June 2022, a 1.0% point higher than the 5.2% that was recorded in a similar period in 2021. Exports of goods remained strong, growing by 11.2% in the 12 months to June 2022 compared to similar period in 2021. Receipts from exports of manufactured and tea goods increased by 22.8% and 6.0%, respectively, while horticulture exports declined by 8.5% in the period of review, and,
- The Committee noted the steady implementation of the FY2021/22 Government Budget, particularly the strong revenue collection for FY’2021/2022 with the total revenues collected amounting to Kshs 2.0 tn, having out-performed the target by 2.8%, reflect enhanced tax collection efforts and increased economic activity. The Economic Stimulus Programme in the FY2022/23 Government Budget is expected to continue to enhance revenue collection and continue supporting economic activity in the country.
The MPC concluded that the tightening monetary policy in May 2022 together with the fiscal measures undertaken were timely and are still being transmitted to support the economy. The committee noted that the international commodity prices, especially oil has begun to moderate and are expected to ease domestic inflationary pressures in the near term. Therefore, the MPC decided to retain the Central Bank Rate (CBR) at 7.5% as they continue to monitor the impact of the previous measures. The Committee will meet again in September 2022, but remains ready to re-convene earlier if necessary.
- Revenue and Net Exchequer for FY’2021/2022
The National Treasury gazetted the revenue and net expenditures for the FY’2021/2022, ended 30th June 2022. Below is a summary of the performance:
|
FY'2021/2022 Budget Outturn - As at 30th June 2022 |
|||||
|
Amounts in Kshs billions unless stated otherwise |
|||||
|
Item |
12-months Original Estimates |
Revised Estimates |
Actual Receipts/Release |
Percentage Achieved of the Revised Estimates |
% achieved of the Orignial Estimates |
|
Opening Balance |
|
|
21.3 |
|
|
|
Tax Revenue |
1,707.4 |
1,784.4 |
1,839.5 |
103.1% |
107.7% |
|
Non-Tax Revenue |
68.2 |
67.1 |
78.4 |
116.9% |
115.0% |
|
Total Revenue |
1,775.6 |
1,851.5 |
1,939.2 |
104.7% |
109.2% |
|
External Loans & Grants |
379.7 |
421.2 |
877.0 |
208.2% |
231.0% |
|
Domestic Borrowings |
1,008.4 |
1,022.0 |
783.5 |
76.7% |
77.7% |
|
Other Domestic Financing |
29.3 |
40.1 |
23.2 |
57.8% |
79.1% |
|
Total Financing |
1,417.4 |
1,483.3 |
1,683.7 |
113.5% |
118.8% |
|
Recurrent Exchequer issues |
1,106.6 |
1,231.2 |
1,205.9 |
97.9% |
109.0% |
|
CFS Exchequer Issues |
1,327.2 |
1,309.5 |
1,191.1 |
91.0% |
89.7% |
|
Development Expenditure & Net Lending |
389.2 |
424.2 |
341.0 |
80.4% |
87.6% |
|
County Governments + Contingencies |
370.0 |
370.0 |
340.4 |
92.0% |
92.0% |
|
Total Expenditure |
3,193.0 |
3,334.8 |
3,078.4 |
92.3% |
96.4% |
|
Fiscal Deficit excluding Grants |
(1,417.4) |
(1,483.3) |
(1,139.2) |
76.8% |
80.4% |
|
Fiscal Deficit(excluding grants) as % of GDP |
8.1% |
8.1% |
9.4% |
|
|
|
Total Borrowing |
1,388.1 |
1,443.2 |
1,660.6 |
115.1% |
119.6% |
|
GDP Estimate |
12,098.2 |
12,098.2 |
12,098.2 |
|
|
The key take-outs from the report include:
- Total revenue collected as at the end of FY’2021/2022 amounted to Kshs 1,939.2 bn, equivalent to 104.7% of the revised estimates of Kshs 1,851.5 bn and is 109.2% of the original estimates of Kshs 1,775.6 bn. Notably, the performance is an improvement from the 95.0% performance recorded in the first 11 months to June 2022, which was despite the deterioration of the business environment seen during the month of June. Cumulatively, tax revenues amounted to Kshs 1,839.5 bn, equivalent to 103.1% of the original estimates of Kshs 1,707.4 bn,
- Total financing amounted to Kshs 1,683.7 bn, equivalent to 113.5% of the revised estimates of Kshs 1,483.3 bn and is 118.8% of the original estimates of Kshs 1,417.4 bn. Additionally, domestic borrowing amounted to Kshs 783.5 bn, equivalent to 76.7% of the revised estimates of Kshs 1,022.0 bn, and is 77.7% of the original estimates of Kshs 1,008.4 bn,
- The total expenditure amounted to Kshs 3,078.4 bn, equivalent to 92.3% of the revised estimates of Kshs 3,334.8 bn and is 96.4% of the original estimates of Kshs 3,193.0 bn. Additionally, the net disbursements to recurrent expenditures came in at Kshs 1,205.9 bn, equivalent to 97.9% of the revised estimate of Kshs 1,231.2 bn and is 109.0% of the original estimates of Kshs 1,106.6 bn, and development expenditure amounted to Kshs 341.0 bn, equivalent to 80.4% of the revised estimates of Kshs 424.2 bn, and is 87.6% of the original estimates of Kshs 389.2 bn,
- Consolidated Fund Services (CFS) Exchequer issues lagged behind their revised targets of Kshs 1,309.5 bn after amounting to Kshs 1,191.1 bn, equivalent to 91.0% and is 89.7% of the original estimates of Kshs 1,327.2 bn. The cumulative public debt servicing cost amounted to Kshs 1,042.2 bn which is 90.5% of the revised estimates of Kshs 1,151.3 bn, and is 89.1% of the original estimates of Kshs 1,169.2 bn, and,
- Total Borrowings as at the end of June 2022 amounted to Kshs 1,660.6 bn, equivalent to 115.1% of the revised estimates of Kshs 1,443.2 bn and is 119.6% of the original estimates of Kshs 1,388.1 bn. The cumulative domestic borrowing target of Kshs 1.0 tn comprises of adjusted Net domestic borrowings of Kshs 678.1 bn and Internal Debt Redemptions (Roll-overs) of Kshs 343.9 bn.
In FY’2021/2022, the total revenue collected came in at Kshs 1,939.2 bn, equivalent to 104.7% of the revised estimate of Kshs 1,851.5 bn and was 109.2% of the original estimates of Kshs 1,775.6 bn. Notably, this was the second time, the KRA surpassed its revenue collection target in eight years albeit the challenges posed by the inflationary and currency depreciation pressures that have resulted in a deteriorated business environment. The performance is mainly attributable to (i) enhanced compliance enforcement efforts and the implementation of new tax measures, focused on ensuring that that non-compliant taxpayers pay their due taxes, (ii) introduction of new taxes such as digital services tax, minimum tax and voluntary tax disclosure as KRA bid to expand sources of revenue, and, (iii) employment of technological strategies to assist seal revenue loopholes. Going forward, we expect the government in collaboration with the KRA to ensure that revenues collected meet the targets in an effort to reduce the fiscal deficit. However, the key concerns still remain the inflationary pressures, resurgence of COVID-19 infections and the upcoming elections which could have a negative effect on the economic environment.
- July 2022 Inflation
The y/y inflation for the month of July 2022 increased to 8.3%, from the 7.9% recorded in June 2022, higher than our expectations. The increase was mainly attributable to the increase in the y/y Food and non-alcoholic beverages, household equipment, transport as well as housing, water, electricity, gas and other fuels, which increased by 15.3%, 7.9%, 7.0% and 5.6%, respectively. Food and non-alcoholic beverages index the increased month on month by 1.1%. The table below shows a summary of both the year on year and month on month commodity groups’ performance:
|
Major Inflation Changes – July 2022 |
|||
|
Broad Commodity Group |
Price change m/m (July-22/June -22) |
Price change y/y (July-22/ June-22 |
Reason |
|
Food & Non-Alcoholic Beverages |
1.1% |
15.3% |
The m/m increase was mainly contributed by increase in prices of carrots, maize grain, non-aromatic white rice and beans. The increase was however mitigated by a decline in prices of onions-leeks and potatoes |
|
Housing, Water, Electricity, Gas and other Fuel |
0.3% |
5.6% |
The m/m increase was as a result of increase in prices of house rent-single rooms among other things. The increase were however mitigated by a decline in the price of gas |
|
Transport Cost |
0.1% |
7.0% |
The m/m increase was as a result of high fuel prices of petrol and diesel at Kshs 150.1 per litre and Kshs 131.0 per litre, respectively |
|
Overall Inflation |
0.7% |
8.3% |
The m/m increase was driven by a 1.1% increase in food & non-alcoholic beverages coupled with a 0.3% increase in housing, water, electricity, gas and other fuel |
Going forward, we expect the inflation pressures to remain elevated but to ease marginally supported by the current fiscal stance by the Monetary Policy Committee, having increased the Central Bank Rate to 7.5% from 7.0% and the fiscal measures by the government whose impact are still transmitting through the economy. Additionally, the international commodity prices, especially oil has begun to moderate and are expected to ease domestic inflationary pressures in the near term. However, concerns remain high on the sustainability of the fuel subsidy program by the National Treasury as it stands the risk of being depleted, as the compensation amounts continue to increase, further mounting pressure on the termination of the program.
Rates in the Fixed Income market have remained relatively stable due to the relatively ample liquidity in the money market. As is it early in the financial year, the government is 30.5% behind its prorated borrowing target of Kshs 46.3 bn having borrowed Kshs 32.2 bn of the Kshs 581.7 bn borrowing target for the FY’2022/2023. We expect sustained gradual economic recovery as evidenced by the revenue collections of Kshs 2.0 tn during the FY’2021/2022, which was equivalent to 102.8% of the prorated revenue collection target. Additionally, despite the projected high budget deficit of 8.1% and the affirmation of the `B+’ rating with negative outlook by Fitch Ratings, we believe that the support from the IMF and World Bank will mean that the interest rate environment will remain stable since the government is not desperate for cash. Owing to this, our view is that investors should be biased towards short-term fixed-income securities to reduce duration risk.
Market Performance:
During the month of July, the equities market was on an upward trajectory, with NASI, NSE 20 and NSE 25 gaining by 13.3%, 5.5% and 10.9%, respectively. The equities market performance was driven by gains recorded by large cap stocks such as Safaricom, EABL, Equity Group and Co-operative Bank of 20.0%, 13.1%, 11.6% and 9.2%, respectively. The gains were however weighed down by losses recorded by stocks such as Bamburi and Diamond Trust Bank (DTB-K) which declined by 3.6% and 1.9%, respectively.
During the week, the equities market was also on an upward trajectory with NASI, NSE 20 and NSE 25 gaining by 3.3%, 1.5% and 3.9%, respectively, taking their YTD performance to losses of 15.6%, 11.1% and 12.8%, for NASI, NSE 20 and NSE 25, respectively. The equities market performance was mainly driven by gains recorded by large-cap stocks such as EABL, KCB Group, Equity Group and Co-operative Bank of 8.2%, 6.9%, 6.7% and 5.8%, respectively. The gains were however weighed down by losses recorded by other large cap stocks such as BAT and Bamburi which declined by 1.1% and 0.7%, respectively.
Equities turnover declined by 14.1% during the month to USD 67.6 mn, from USD 78.7 mn recorded in June 2022. Foreign investors remained net sellers during the month, with a net selling position of USD 25.1 mn, compared to June’s net selling position of USD 40.6 mn.
During the week, equities turnover declined by 26.4% to USD 11.4 mn, from USD 15.4 mn recorded the previous week, taking the YTD turnover to USD 533.6 mn. Foreign investors remained net sellers, with a net selling position of USD 6.4 mn, from a net selling position of USD 5.3 mn recorded the previous week, taking the YTD net selling position to USD 131.0 mn.
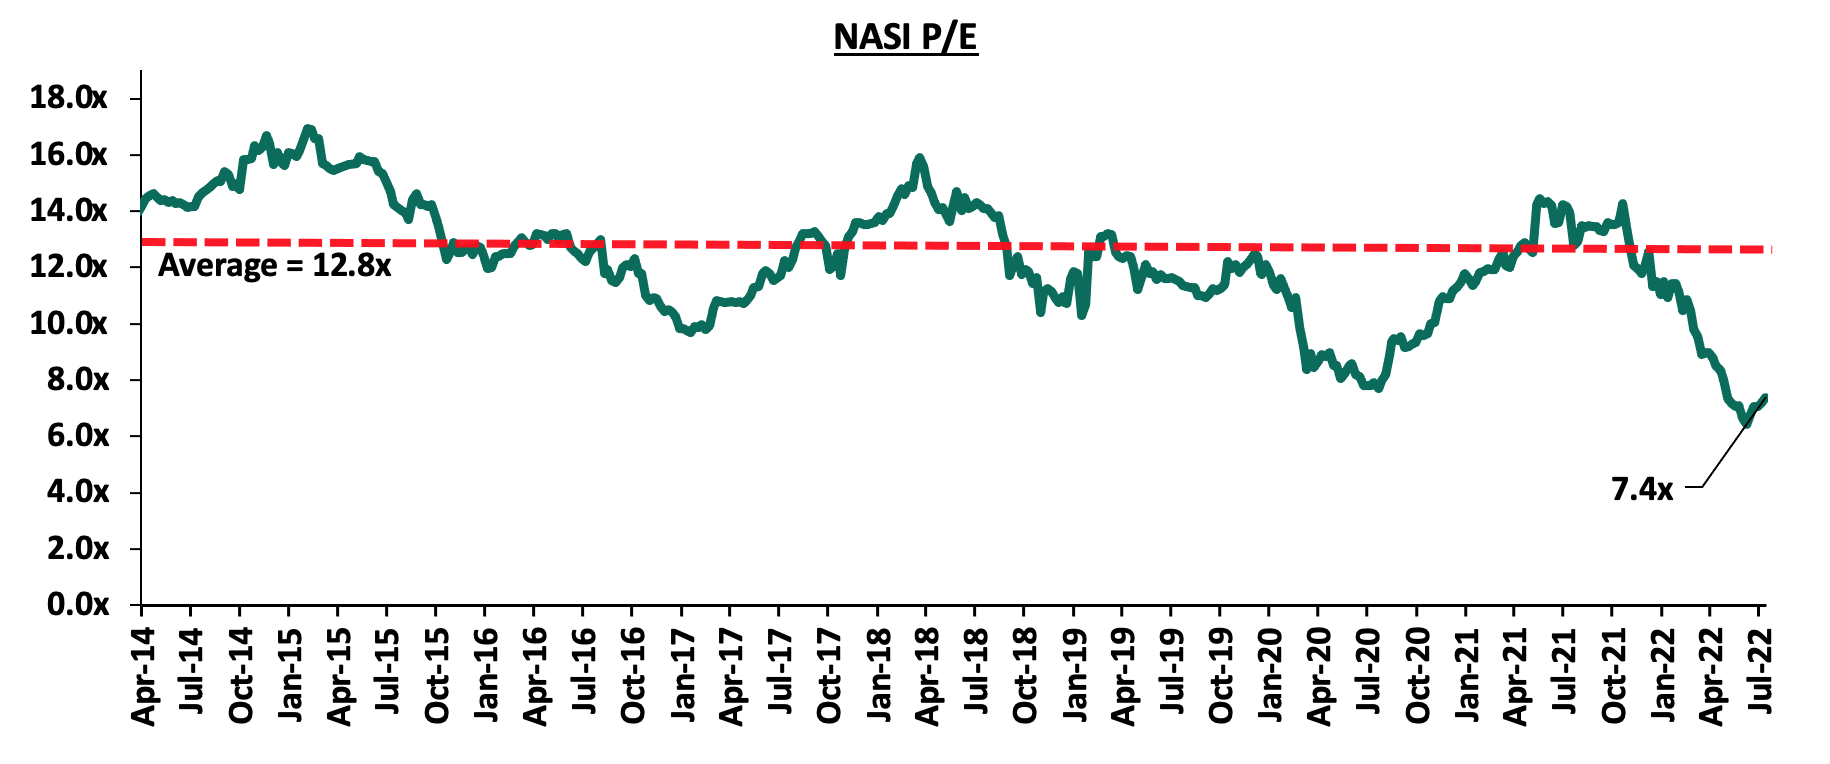
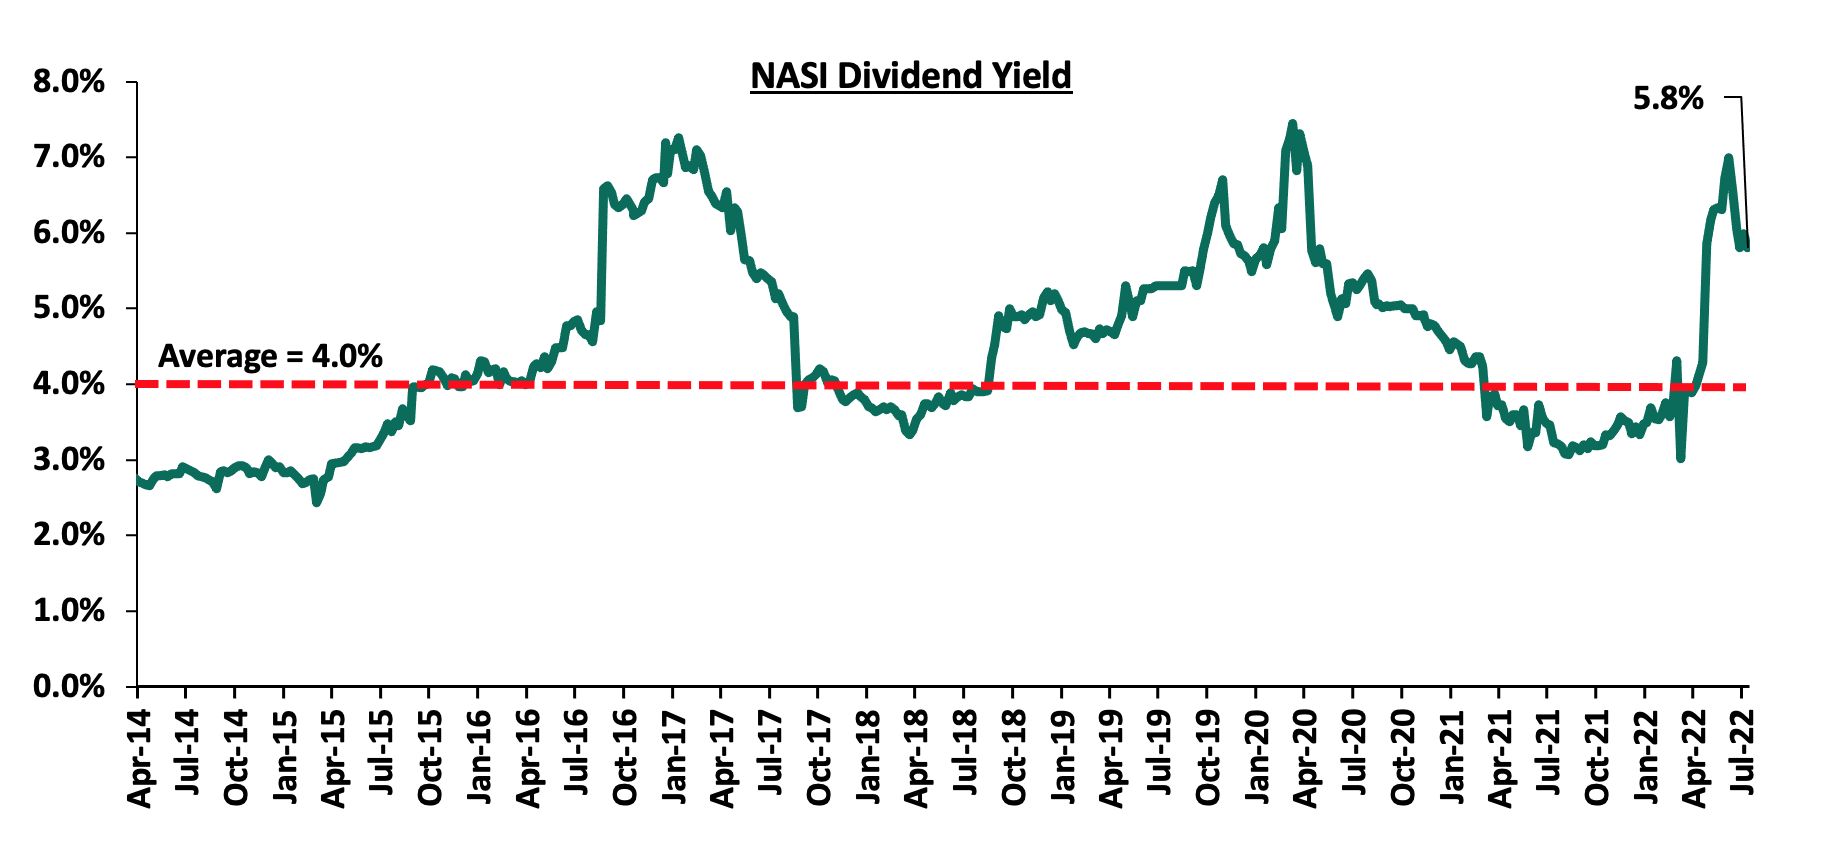
The market is currently trading at a price to earnings ratio (P/E) of 7.4x, 42.1% below the historical average of 12.8x, and a dividend yield of 5.8%, 1.8% points above the historical average of 4.0%. Key to note, NASI’s PEG ratio currently stands at 0.9x, an indication that the market is undervalued relative to its future growth. A PEG ratio greater than 1.0x indicates the market may be overvalued while a PEG ratio less than 1.0x indicates that the market is undervalued. The charts below indicate the historical P/E and dividend yields of the market:
Universe of coverage:
|
Company |
Price as at 22/07/2022 |
Price as at 29/07/2022 |
w/w change |
m/m change |
YTD Change |
Year Open 2022 |
Target Price* |
Dividend Yield |
Upside/ Downside** |
P/TBv Multiple |
Recommendation |
|
Kenya Reinsurance |
2.1 |
2.0 |
(2.4%) |
0.5% |
(12.7%) |
2.3 |
3.2 |
5.0% |
63.9% |
0.2x |
Buy |
|
Jubilee Holdings |
249.0 |
248.8 |
(0.1%) |
(4.1%) |
(21.5%) |
316.8 |
379.4 |
5.6% |
58.2% |
0.5x |
Buy |
|
I&M Group*** |
17.1 |
17.0 |
(0.3%) |
0.0% |
(20.6%) |
21.4 |
22.3 |
8.8% |
40.0% |
0.5x |
Buy |
|
Liberty Holdings |
5.5 |
5.6 |
1.8% |
3.7% |
(20.7%) |
7.1 |
7.8 |
0.0% |
39.3% |
0.4x |
Buy |
|
KCB Group*** |
38.5 |
41.2 |
6.9% |
6.5% |
(9.7%) |
45.6 |
52.2 |
7.3% |
34.1% |
0.8x |
Buy |
|
Diamond Trust Bank*** |
49.1 |
49.0 |
(0.1%) |
(1.9%) |
(17.6%) |
59.5 |
62.4 |
6.1% |
33.5% |
0.2x |
Buy |
|
ABSA Bank*** |
10.5 |
11.1 |
5.7% |
5.7% |
(6.0%) |
11.8 |
13.6 |
10.0% |
33.0% |
1.1x |
Buy |
|
Sanlam |
11.6 |
12.0 |
3.4% |
0.0% |
3.9% |
11.6 |
15.9 |
0.0% |
32.5% |
1.3x |
Buy |
|
NCBA*** |
24.5 |
25.0 |
1.8% |
5.7% |
(2.0%) |
25.5 |
29.1 |
12.0% |
28.7% |
0.6x |
Buy |
|
Co-op Bank*** |
11.3 |
11.9 |
5.8% |
9.2% |
(8.5%) |
13.0 |
14.1 |
8.4% |
26.9% |
0.9x |
Buy |
|
Britam |
6.0 |
6.1 |
1.3% |
8.6% |
(19.6%) |
7.6 |
7.7 |
0.0% |
26.6% |
1.0x |
Buy |
|
Stanbic Holdings |
106.0 |
95.5 |
(9.9%) |
(3.3%) |
9.8% |
87.0 |
109.8 |
9.4% |
24.4% |
0.9x |
Buy |
|
Equity Group*** |
45.0 |
48.0 |
6.7% |
11.6% |
(9.0%) |
52.8 |
54.4 |
6.3% |
19.6% |
1.2x |
Accumulate |
|
Standard Chartered*** |
132.0 |
133.0 |
0.8% |
6.6% |
2.3% |
130.0 |
137.0 |
10.5% |
13.5% |
1.0x |
Accumulate |
|
CIC Group |
2.0 |
2.0 |
1.0% |
(2.9%) |
(6.0%) |
2.2 |
2.1 |
0.0% |
2.9% |
0.7x |
Lighten |
|
HF Group |
3.4 |
3.3 |
(1.8%) |
3.1% |
(12.4%) |
3.8 |
2.8 |
0.0% |
(15.9%) |
0.2x |
Sell |
|
Target Price as per Cytonn Analyst estimates **Upside/ (Downside) is adjusted for Dividend Yield ***For Disclosure, these are stocks in which Cytonn and/or its affiliates are invested in |
|||||||||||
We are “Neutral” on the Equities markets in the short term due to the current adverse operating environment and huge foreign investor outflows, and, “Bullish” in the long term due to current cheap valuations and expected global and local economic recovery.
With the market currently trading at a discount to its future growth (PEG Ratio at 0.9x), we believe that investors should reposition towards value stocks with strong earnings growth and that are trading at discounts to their intrinsic value. We expect the current high foreign investors sell-offs, the upcoming Kenyan general elections and the slow vaccine rollout to continue weighing down the economic outlook in the short term.
- Industry Report
During the week, Hass Consult, a Real Estate Development and Consulting firm, released their House Price Index Q2'2022, a report highlighting the performance of Nairobi Metropolitan Area’s (NMA) Real Estate residential sector. The following were the key take outs;
- The average q/q selling prices for houses increased by 3.3% in Q2’2022, while on a y/y basis, the average selling prices appreciated by 10.5%, mainly driven by an increase in market interest rates and the overall construction costs of materials,
- In the Nairobi Suburbs, Lang’ata was the best performing node having recorded a capital appreciation of 5.3% q/q and 12.5% y/y attributed to increased demand, whereas apartments in Kileleshwa recorded the highest y/y price correction of 9.1%, following reduced uptake as clients preferred renting of apartments in the area rather than buying,
- In the satellite towns, houses in Ongata Rongai recorded the highest q/q and y/y price appreciation of 3.4% and 13.0%, respectively, driven by increased demand resulting from affordability of housing units in the area. On the other hand, apartments in Kiambu realized the highest y/y price correction at 5.2% resulting from tenants preference to buying of the units rather than renting,
- The overall asking rents in the NMA slightly increased by 1.1% q/q and 2.4% y/y, driven by an increase in the overall demand for rental units. Apartments recorded the highest increase in asking rents of 2.0% q/q compared to detached units at 0.5% q/q, as majority of tenants prefer renting of apartments due to affordability,
- In the Nairobi suburbs, houses in Ridgeways realized the highest y/y rent appreciations of 6.1%, with demand being driven by the serenity of the area, ample amenities and infrastructure such as the Ridgeways Mall and Kiambu road among many others, ample security further enhanced by the area’s posh neighbourhood estates such as Garden Estate and Muthaiga. On the other hand, houses in Gigiri realized the highest rental rates decline of 6.8% as a result of a declined demand for rental units, and,
- For the satellite towns, apartments in Kitengela realized the highest rental rate increase by 16.4% y/y due to increased demand resulting from affordability of the units, whereas houses in Ongata Rongai recorded the highest rental rates decline of 2.6% q/q as a result of people preferring to buy the housing units rather than renting them.
The findings of the report are in line with our Cytonn H1’2022 Markets Review, which highlighted that the average y/y price appreciation for houses in the NMA increased by 0.9% driven by an increase in property transactions, as well as the construction costs.
Hass Consult also released the Land Price Index Q2'2022, a report highlighting the performance of Real Estate land sector in the Nairobi Metropolitan Area (NMA). Notably, land prices in satellite towns rose to an all time high in Q2’2022 on renewed demand and emerging opportunities. Key take outs from the report include;
- The average q/q and y/y selling prices for land in the Nairobi suburbs appreciated by 0.2% and 0.9%, respectively, whereas the average q/q and y/y selling prices for land in the satellite towns of Nairobi increased by 4.1% and 10.5%, respectively,
- Spring Valley was the best performing node in the Nairobi suburbs with a q/q and y/y price appreciation of 3.4% and 13.4%, respectively, attributed to increased demand for land in the area that resulted from; adequate infrastructure such as the Mwanzi Road, serene and quiet environment, ample security, affluent neighbourhood as it’s also surrounded by areas such as Kitisuru and Parklands, and, nearness to amenities such as Westgate Shopping Mall. On the other hand, Runda recorded the highest y/y price correction of 3.3% due to a declined demand, and,
- For satellite towns, Juja was the best performing node with a q/q and y/y capital appreciation of 6.4% and 20.9%, respectively, attributed to increased demand for development land particularly for student housing facilities as the area is largely inhabited by students from institutions such as the Jomo Kenyatta University of Agriculture and Technology. On the other hand, Limuru was the only node with a price correction y/y, which came in at 6.6% driven by low demand for land in the area, given that it is relatively far from Nairobi.
The findings of the report are also in line with our Cytonn H1’2022 Markets Review, which highlighted that the average selling prices for land in the NMA appreciated by 3.1%. This was mainly attributed to; i) high population and urbanization growth rates driving demand for land, ii) improved development of infrastructure such as roads, railways, water and sewer lines, and, iii) increased construction activities particularly in the residential and infrastructure sectors thus fueling demand for land.
Other notable industry report released during the month include:
|
# |
Theme |
Report |
Key Take-outs |
|
1 |
General Real Estate |
Q1’2022 Gross Domestic Product by the Kenya National Bureau of Statistics (KNBS) |
|
We expect Kenya’s property market to continue recording development activities in its various sectors driven by; rapid construction activities particularly in the residential and infrastructure sectors, aggressive expansion in the retail sector, increasing investor confidence in the hospitality sector, and, improving demand for development land. Conversely, oversupply in select Real Estate sectors, coupled with the high construction costs, is expected to weigh down the optimum performance of the sector.
- Residential Sector
- KMRC to disburse approximately Kshs 7.7 bn to PMLs by December 2022
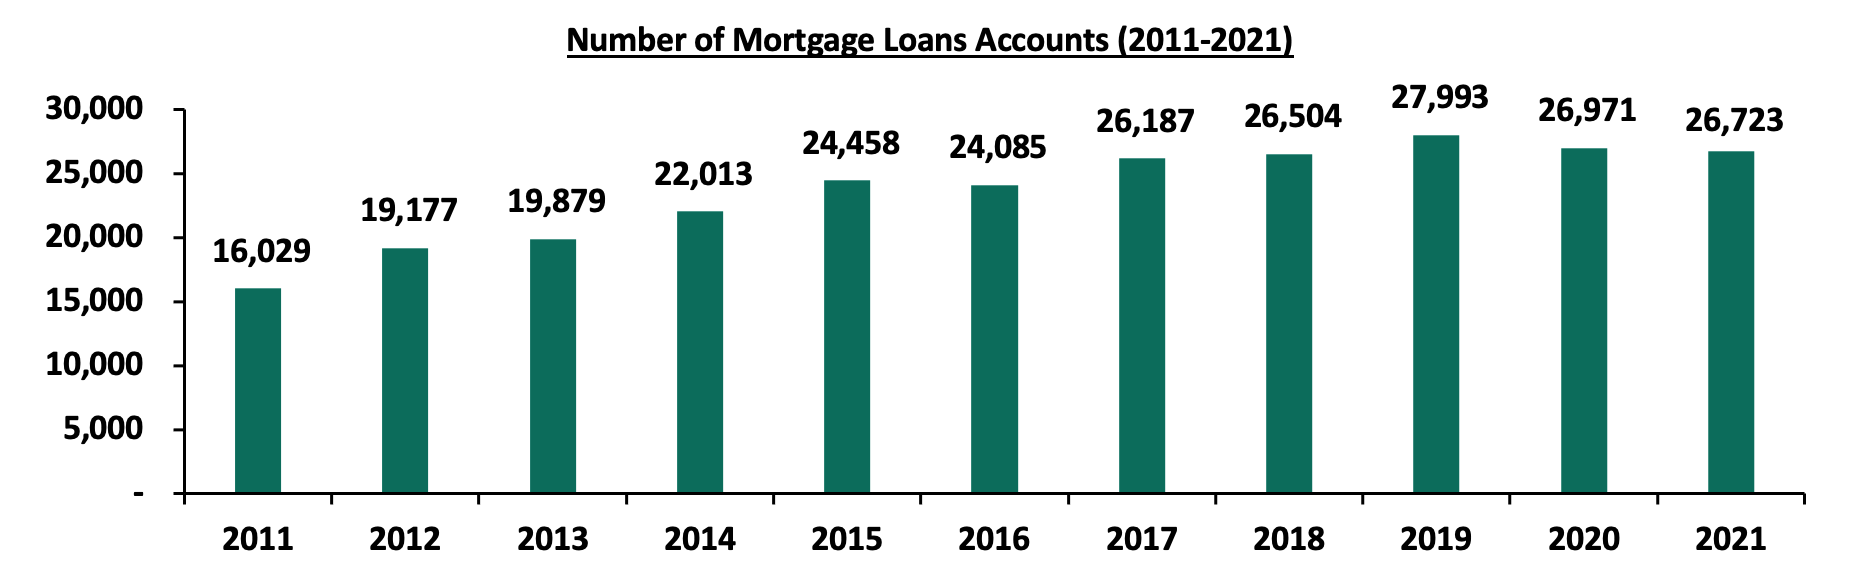
During the week, the Kenya Mortgage Refinance Company (KMRC) announced plans to disburse approximately Kshs 7.7 bn to Primary Mortgage Lenders (PMLs), for onward lending to potential home buyers in the country by December 2022. This will be a 479.9% increase from the Kshs 1.3 bn that was disbursed to PMLs by December 2021, signifying the expected capital boost to mortgage lenders which include banks, microfinance institutions and Savings and Credit Cooperatives (SACCOs). Given the average mortgage size of Kshs 2.3 mn as at 2021, this will translate to approximately Kshs 3,169.0 mortgages in 2022. Moreover, this comes five months after KMRC got approval from the Capital Markets Authority (CMA) to roll out a Kshs 10.5 bn Medium Term Note (MTN) program in January 2022, an indication of the refinancer’s remarkable efforts to provide home loans to prospective house buyers in Kenya. In light of this, the first tranche of the MTN recorded an oversubscription of 478.6%, attributable to the attractive returns offered by the note at 12.5%. KMRC will disburse the Kshs 7.7 bn to the PMLs at a 5.0% rate, for onward lending to homebuyers. Upon lending the whole amount to the potential home buyers, it will increase their loan accounts that declined by 0.9% to 26,723 in 2021, from the 26,971 number of accounts that were realized in 2020, according to the Central Bank of Kenya’s Bank Supervision Annual Report 2021. The graph below shows the number of mortgage loan accounts in Kenya over the last 11 years;
Source; Central Bank of Kenya
The anticipated increase in mortgage uptake is expected to boost home ownership rates in Kenya which is currently at 21.3% in urban areas as at 2021, compared to other African countries such as South Africa and Ghana at 53.0% and 47.2%, respectively. This is in addition to KMRC’s aggressive efforts to provide affordable home loans to Kenyans through various strategies such as debt sourcing and issuing of corporate bonds.
- County Pension Fund (CPF) to Construct Affordable Housing Units in Four Counties
During the week, pension funds administrator CPF announced plans to construct affordable housing units in Laikipia, Nakuru, Nairobi and, Mombasa Counties. CPF which currently own assets worth Kshs 5.2 bn in its Individual Pension Plan (IPP) portfolio and Kshs 33.9 bn in its Local Authorities Pensions Trust (LAPTRUST) portfolio as at FY’2021, is looking to increase its investment portfolio into the Real Estate market, and is currently in talks with the respective four county governments, in order to construct the housing units. Other development project by the pension funds administrator include the Kshs 3.8 bn old Anderson-Ofafa affordable housing project in Kisumu consisting of 1,394 units, which is currently on hold due inadequate funds driven by the increased construction costs.
Notably during the month, property developer Mi Vida Homes announced plans to break ground of 800 affordable housing units project worth more than Kshs 2.0 bn in Nairobi’s Riruta area, by end of the year. The project which will sit on a six-acre piece of land off Ngong Road, and will consist of studios, one-bedroom, two-bedroom, and three-bedroom units, with prices ranging between Kshs 2.0 mn and Kshs 6.0 mn each. For more information, see Cytonn Weekly #27/2022.
We expect the residential sector to record improved performance as a result of KMRC’s remarkable efforts to provide affordable home loans to potential buyers, coupled with the increasing construction activities particularly the affordable housing projects which continue to gain traction in the country, evidenced by the numerous projects rolled out such as; i) River Estate project in Ngara, ii) Pangani Housing project, iii) Athi River Waterfront project, and, iv) Starehe housing projects, among many others. Despite this, financial constraints continue to be a major challenge when delivering the projects, further fueled by the increasing construction costs thus leading to the projects stalling.
- Retail Sector
During the month, Java House, an international restaurant chain, announced plans to open five new outlets in the country by October 2022. The new outlets will be distributed as follows: two at Nairobi’s Jomo Kenyatta International Airport, one at Mombasa’s Moi International Airport, one in Nairobi’s Eastleigh area, and, one in Machakos town. For more information, see Cytonn Weekly #27/2022.
We expect the retail sector to record improvement in performance attributed to; i) the rapid expansion drive by local and international retailers, ii) positive demographics evidenced by Kenya’s relatively high urbanization and population growth rates of 4.0% p.a and 2.2% p.a, respectively, against the global average of 1.8% p.a and 1.0% p.a, respectively, as at 2020, and, iii) infrastructural developments opening areas for investments and accessibility. However, factors such as e-commerce driving down the need for retail spaces, and, oversupply of retail space currently at 1.7 mn SQFT in Kenya and 3.0 mn SQFT in NMA, continues to weigh down the overall performance of the sector.
- Hospitality Sector
- Actis Limited Concludes Purchase of South African City Lodge Hotels in Kenya and Tanzania
During the week, private equity firm Actis Limited, completed the purchase of three hotels it acquired from South Africa City Lodge Hotel Group in July 2021 namely; the 127-room Fairview Hotel in Nairobi, the 171-room City Lodge Hotel in Two Rivers, and, the 84-room Town Lodge Hotel in Upperhill, at a cost of Kshs 1.0 bn. As highlighted in our Cytonn Monthly July 2021, the three hotels were to be sold to Actis Limited following losses generated particularly by City and Town Lodge hotels, coupled with the need by the hotel group to raise funds to be used in repayment of its existing debt. Based on plans by the hotel group to also exit the East African market amidst losses generated by its units, the private equity firm purchased the 148-room City Lodge Hotel in Dar es Salaam as well at a cost of Kshs 7.3 mn, as part of the transaction.
- Kasada Hospitality Fund Purchases Crowne Plaza Hotel Worth Kshs 4.6 bn in Upperhill District
During the week, Kasada Hospitality Fund, a Qatar private equity firm purchased Crowne Plaza Hotel located in Nairobi’s Upperhill District, at a cost of Kshs 4.6 bn. The hotel brand which was officially opened in 2010 under the Intercontinental Hotels Group, was put up for sale in 2020 in a bid to raise funds to offset its existing banks debts. This comes at a time when the hospitality sector was particularly hit hard by the onset of the pandemic resulting to losses for various hotels including Crowne Plaza. Key to note, the decision by Kasada to buy the hotel is mainly driven by its interest to get a taste of the Kenyan hospitality market, coupled by the recovery of the industry as a result of the eased pandemic restrictions such as the travel bans and lockdowns, that have led to increased tourism activities and an overall improved performance of the hospitality sector.
- Maanzoni Lodges Purchase 680 Hotel in Nairobi’s CBD at an estimated cost of Kshs 1.2 bn
During the week, Maanzoni Lodges, a Machakos based hotel entity, purchased Nairobi’s 680-Hotel for an estimated Kshs 1.2 bn. The 120-room hotel located in Nairobi’s Central Business District was part of the Sentrim Hotel portfolio, and will now join the Maanzoni franchise which has since wanted to expand its operations beyond Machakos County. The three-star 680 Hotel therefore provides an investment opportunity for Maanzoni which is looking to operate the property both as a hotel, and for office spaces. This comes after Sentrim laid plans to have all the eight hotels in its portfolio sold in 2018 due to undisclosed reasons, with the other seven hotels to be sold being; Boulevard Hotel in Nairobi, Castle Royal Hotel in Mombasa, Elementaita Lodge, Samburu Lodge, Sentrim Tsavo, Sentrim Amboseli and Sentrim Mara, which are all currently in the last stages of purchase.
Notably during the month, the global five-star hotel Fairmont Mount Kenya Safari Club located in Nanyuki, resumed activities having been closed for more than two years, following the onset of Covid-19 pandemic that resulted to cash flow challenges. For more information, see Cytonn Weekly #27/2022.
The above aforementioned three transactions clearly depict the improving investor appetite and confidence in Kenya’s hospitality sector, which was one of the worst hit economic sectors by the COVID-19 pandemic. Despite some of the hotels such as Norfolk, Fairmont, and Radisson Blu, resuming operations, others have had to change equity in order to raise funds to repay their debts. The recovery of the sector evidenced by KNBS’ Q1’2022 Gross Domestic Product report which highlighted that the hospitality sector grew by 56.2% in Q1’2022, compared to a (14.1%) negative growth that was recorded in Q1’2020, has therefore driven the increased investor confidence leading to various hotels also expanding. We expect the trend to continue shaping the performance of the sector with some of the factors expected to boost the performance being; i) continuous roll out of the COVID – 19 vaccines boosting confidence in the sector, ii) rapid marketing of the tourism sector under the Magical Kenya Platform, and, Kenya Tourism Board, iii) annual world rally championship program boosting hotel and serviced apartments occupancies, iv) recognition of Kenya as a regional hub thereby attracting foreign investments, and, v) Positive accolades such as the 28th World Travel Awards winners, where Nairobi was voted as Africa’s leading business travel destination.
- Infrastructure
- (KENHA) suspended construction works of the 8.0 Km Kisumu-Kakamega Highway
During the week, the Kenya National Highway Authority (KENHA) suspended construction works of the 8.0 Km Kisumu-Kakamega Highway project due to financial constraints. Construction of the Kshs 2.6 bn dual carriageway project which was jointly being financed by the National Government and the World Bank began in October 2012, with SBI International Holdings AG (Kenya) as the contractor. The project however stalled as a result of delayed payments thus making the contractor withdraw from the project in September 2019, but was awarded to China Railway No.10 Engineering Group in November 2021. However, the project was suspended again despite the project’s progress coming in at 96.4%, due to outstanding payments to the contractor.
- Revamping of the 18.0 km Adiedo – Namba Karabok Road in Homabay County Commences
During the week, the National Government launched the tarmacking of the 18.0 km Adiedo – Namba Karabok road project in Homabay County. The construction project worth Kshs 1.0 bn will begin from from Adiedo trading center in Karachuonyo, to Namba Karabok junction in Kasipul constituency and is expected to take two years. Additionally, the project will be financed by the Government, with the construction being done by the China Civil Engineering Construction Corporation. Upon its completion, the project is expected to; i) enhance transport services, ii) promote trade activities in the surrounding areas, and, iii) promote Real Estate investments by opening areas for investment opportunities, as well as boosting the prices for existing properties.
Other notable highlights during the month include;
- The national government through KeNHA awarded three Chinese firms a project tender worth Kshs 15.9 bn, to rehabilitate the Kisumu-Chemelil-Muhoroni road. For more information, see Cytonn Weekly #27/2022,
- The national government through the Kenya National Highway Authority (KeNHA) announced plans to revamp the Thika-Garissa highway into a dual carriageway, at an estimated cost of Kshs 5.5 bn. For more information, see Cytonn Weekly #27/2022,
- The Northern Corridor Transit and Transport Coordination Authority (NCTTCA), an intergovernmental body comprised of Kenya, Uganda, Rwanda, Burundi, South Sudan and the Democratic Republic of Congo (DRC), announced plans to open up additional transit routes within East Africa. For more information, see Cytonn Weekly #28/2022,
- The African Development bank (AfDB) approved USD 150.0 mn (Kshs 17.7 bn) to be used in the rehabilitation of the Nairobi – Nakuru – Mau Summit Highway totaling 232.8 km. This represents 9.8% funding of the Kshs 180.0 bn worth Public Private Partnership (PPP) project between the National Government through the Kenya National Highway Authority (KeNHA), and, a consortium made up of Vinci Highways SAS, Meridian Infrastructure Africa Fund, and, Vinci Concessions SAS. For more information, see Cytonn Weekly #29/2022, and,
- President Uhuru Kenyatta commissioned the rehabilitation of the Nairobi-Suguta-Maralal Road worth Kshs 1.1 bn. The historic road project will be financed by the Government of Kenya and is expected to change the face of Samburu County. For more information, see Cytonn Weekly #29/2022.
Infrastructure developments which are key elements required by an economy to grow, require massive capital in order to implement all through to conclusion, but financial constraints continue to be a major challenge incurred during the projects development. Despite this, the sector has continued to record rapid developments particularly the development of road projects aimed at improving the country’s overall economy and transport network. This has been mainly driven by Government’s continuous aggressive efforts to initiate and implement the projects through various strategies, with other ongoing projects being; i) Nairobi Commuter Rail project, ii) Standard Gauge Railway phase 2A, and, iii) Nairobi Western Bypass, among many others. We expect the trend to continue shaping the performance of the sector with some of the strategies that the Government has employed in order to realize its objective being; i) floating of infrastructure bonds in order to raise funds for construction, ii) project partnerships such as Public Private Partnerships and Joint Ventures, iii) debt financing, and, iv) yearly budgetary allocations, with the sector having been allocated Kshs 212.5 bn in the FY’2022/2023 Budget Statement, a 16.4% increase from the Kshs 182.5 bn allocated in FY’2021/22.
- Real Estate Investment Trusts (REITs)
During the week, Acorn Holdings released their H1’2022 financial results highlighting that the D-REIT recorded a 7.8% decline in the net earnings to Kshs 105.3 mn, from Kshs 114.2 mn in H1’2021, whereas the I-REIT recorded a 29.2% increase in the net earnings to Kshs 192.0 mn, from Kshs 148.6 mn in H1’2021. Below is a summary of the Acorn’s D-REIT ad I-REIT H1’2022 performances:
Figures in Kshs mn Unless Stated Otherwise
|
Income Statement |
||||||
|
|
Acorn I - REIT |
Acorn D - REIT |
||||
|
H1’2021 |
H1’2022 |
Change |
H1’2021 |
H1’2022 |
Change |
|
|
Rental Income |
136.6 |
185.8 |
36.0% |
11.0 |
138.9 |
1,159.4% |
|
Income from Other Sources |
8.4 |
5.0 |
(40.7%) |
- |
- |
- |
|
Operating Expenses |
83.4 |
115.4 |
38.5% |
151.3 |
274.5 |
81.4% |
|
Profit Before Tax |
148.6 |
192.0 |
29.2% |
114.2 |
105.3 |
(7.8%) |
|
Basic EPS |
0.89 |
0.86 |
(3.4%) |
0.53 |
0.49 |
(7.8%) |
Figures in Kshs bn Unless Stated Otherwise
|
Balance Sheet |
||||||
|
|
Acorn I - REIT |
Acorn D - REIT |
||||
|
H1’2021 |
H1’2022 |
Change |
H1’2021 |
H1’2022 |
Change |
|
|
Total Assets |
3.9 |
4.9 |
25.4% |
6.4 |
9.7 |
51.3% |
|
Total Equity |
3.4 |
4.7 |
38.7% |
4.2 |
5.6 |
31.3% |
|
Total Liabilities |
0.5 |
0.1 |
(70.8%) |
2.2 |
4.1 |
90.4% |
Ratios summary for the D-REIT and the I-REIT
|
Ratios Summary |
||||||
|
|
Acorn I - REIT |
Acorn D - REIT |
||||
|
H1’2021 |
H1’2022 |
% Points Change |
H1’2021 |
H1’2022 |
% Points Change |
|
|
ROA |
3.8% |
4.0% |
0.1% |
0.3% |
1.4% |
1.2% |
|
ROE |
4.4% |
4.1% |
(0.3%) |
2.7% |
1.9% |
(0.8%) |
|
Debt Ratio |
12.1% |
2.8% |
(9.3%) |
33.8% |
42.5% |
8.7% |
|
PBT Margin |
87.3% |
73.9% |
(13.4%) |
624.7% |
75.6% |
(567.1%) |
|
H1’2022 Rental Yield |
4.1% |
4.2% |
0.1% |
0.2% |
1.5% |
1.3% |
|
Annualized Rental Yield |
8.4% |
8.6% |
0.2% |
1.1% |
9.3% |
8.2% |
|
Distribution Per Unit |
0.38 |
0.29 |
(23.0) |
- |
- |
- |
|
Payout Ratio |
42.3% |
33.7% |
(8.6%) |
- |
- |
- |
The key take-outs include:
- The basic earnings per unit for the Acorn D – REIT declined by 7.8% to Kshs 0.49 in H1’2022 from Kshs 0.53 in H1’2021. This was mainly driven by an 81.4% increase in the total expenses to Kshs 274.5 mn, from Kshs 151.3 mn in H1’2021, coupled with a 7.8% decline in the overall net earnings to Kshs 105.3 mn, from Kshs 114.2 mn in H1’2021. For the I – REIT, the basic earnings per unit declined slightly by 3.4% to Kshs 0.86, from Kshs 0.89 in H1’2021 mainly as a result of a 38.5% increase in the operating expenses which came in at Kshs 115.4 mn, from Kshs 83.4 mn in H1’2021,
- The rental income for both the D-REIT and I-REIT increased by 1,159.4% and 36.0% to Kshs 138.9 mn and Kshs 185.8 mn in H1’2022, respectively, from Kshs 11.0 mn and Kshs 136.6 mn in H1’2021, respectively. The D-REIT rental income increase was mainly driven by the launch of the 832 – bed Qwetu Hurlingham project in January 2022, and currently has an occupancy rate of 65.0%, whereas the I – REIT rental growth was driven by the rental income from its current properties,
- The annualized rental yield for the D-REIT and I-REIT increased by 8.2% points and 0.2% points to 9.3% and 8.6%, respectively, in H1’2022 from 1.1% and 8.4%, respectively, in H1’2021, following an increase in the rental income,
- The total operating expenses for the D-REIT increased by 81.4% to Kshs 274.5 mn in H1’2022 from Kshs 151.3 mn in H1’2021. This was driven by an increase in the administrative expenses, and finance costs which came in at Kshs 53.2 mn and Kshs 128.3 mn in H1’2022, respectively, from Kshs 20.0 mn and Kshs 49.7 mn, respectively, in H1’2021. For the I – REIT, the total expenses came in at Kshs 115.4 mn in H1’2022, 38.5% increase from Kshs 83.4 mn in H1’2021. This mainly driven by an increase in the fund operating expenses, property expenses, and administrative expenses which came in at Kshs 47.8 mn, Kshs 33.1 mn, and Kshs 32.8 mn, respectively, in H1’2022, from Kshs 34.5 mn, Kshs 21.2 mn, and Kshsh 26.0 mn, respectively, in H1’2021,
- Total assets for the D-REIT and I-REIT increased by 51.3% and 25.4% to Kshs 9.7 bn and Kshs 4.9 bn in H1’2022, respectively, from Kshs 6.4 bn and Kshsh 3.9 bn, respectively, in H1’2021. The increase in assets was mainly on the back of increased investment property with the D-REIT’s coming in at Kshs 9.3 bn from Kshs 6.1 bn in H1’2021, whereas the I-REIT’s investment property came in at Kshs 4.4 bn from Kshs 3.3 bn in H1’2021, and,
- For Acorn I-REIT, the Board of Trustees approved the payment of a final dividend of Kshs 64.0 mn which is equates to Kshs 0.29 per unit, to be paid by September 2022. The I-REIT recorded a payout ratio of of 33.7% in H1’2022, from 42.3% in H1’2021. For the D-REIT, there were no dividends proposed to be paid out, as there have been no exits from the ASA D-REIT.
The chart below shows the comparison of Acorn REIT yield performance versus other yields;
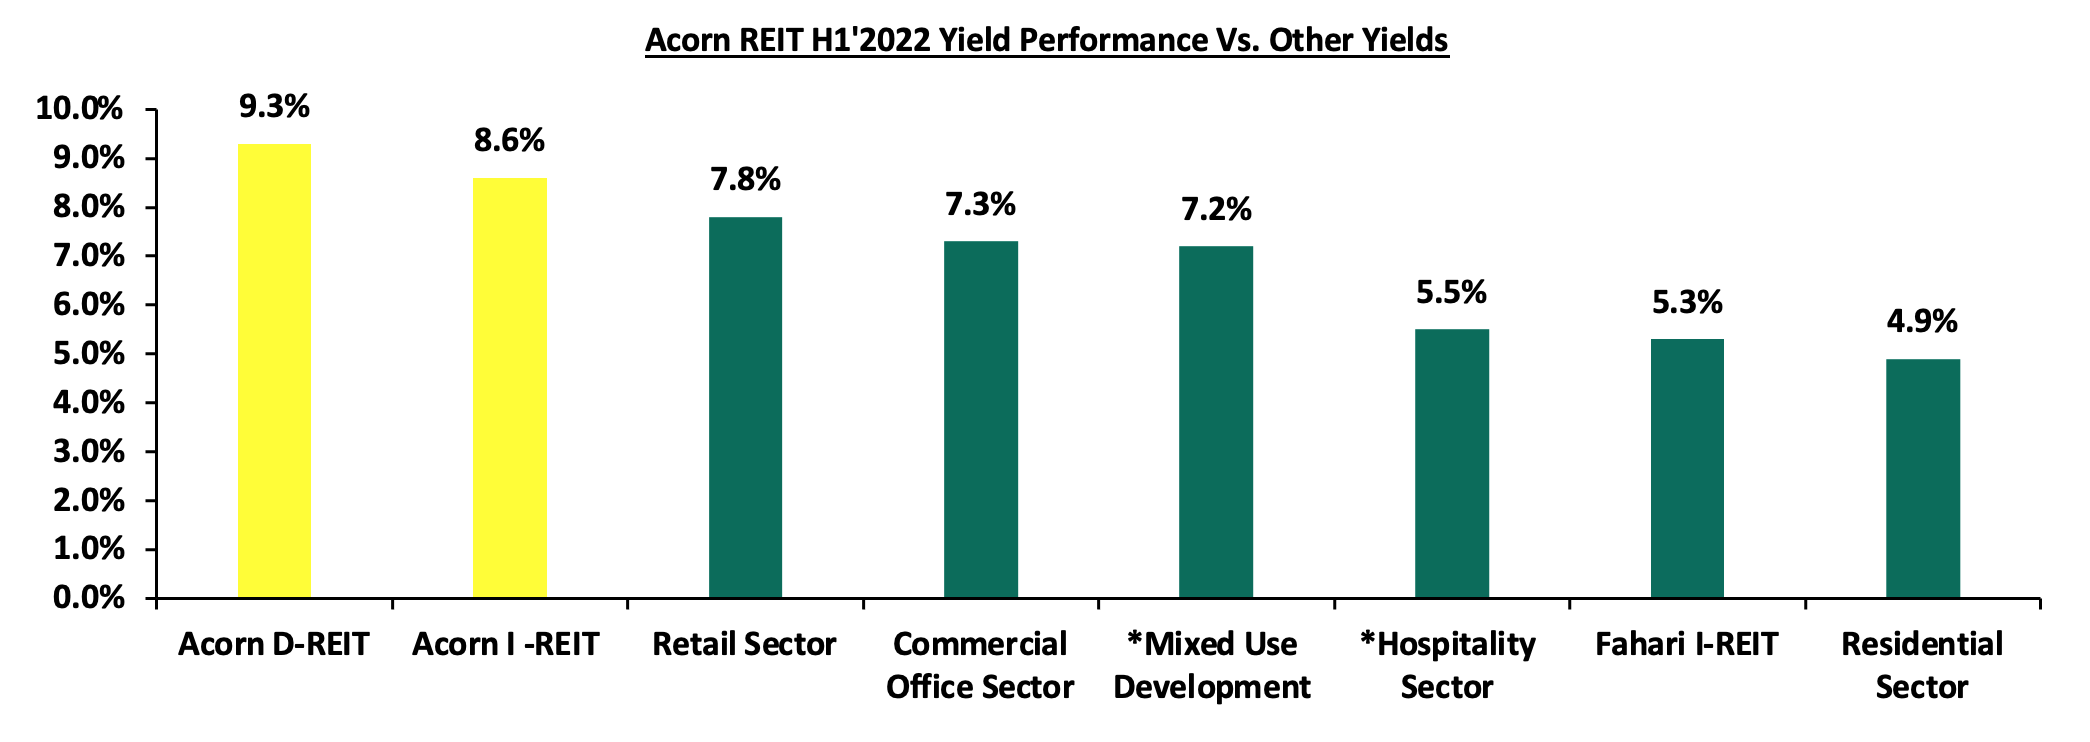
Source: Cytonn Research, *Yield as at FY’2021
For more information, see our Acorn Holdings H1’2022 Earnings Note.
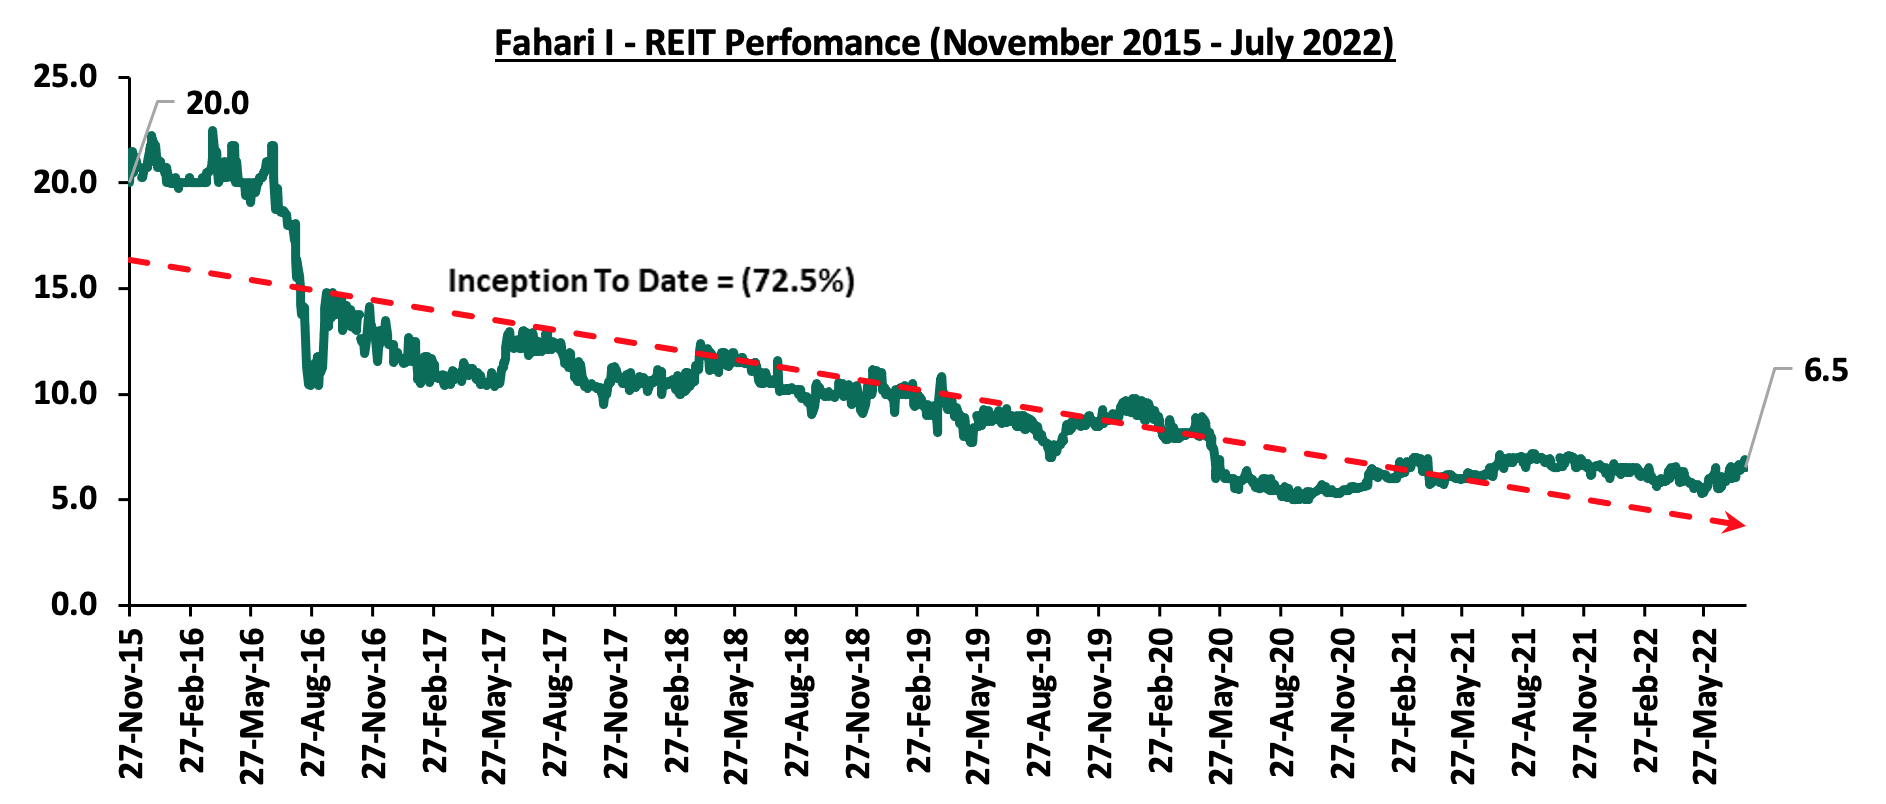
In the Nairobi Stock Exchange, Fahari I-REIT closed the month trading at an average price of Kshs 6.5 per share, representing an 8.3% and 1.6% Month-to-Date (MTD) and Year-to-Date (YTD) increase from Kshs 6.0 and Kshs 6.4 per share, respectively. On an Inception-to-Date (ITD) basis, the REIT’s performance continues to be weighed down having realized a 72.5% decline from Kshs 20.0 per share. The graph below shows Fahari I-REIT’s performance from November 2015 to July 2022:
Other notable highlights include;
- ICEA Lion Management announced that its listed Property fund, Fahari I-REIT’s restructuring proposal is under review by the Capital Market’s Authority’s (CMA), awaiting approval. For more information, see Cytonn Weekly #28/2022,
- ILAM Fahari I-REIT released its H1’2022 results highlighting a 104.1% increase in the net earnings to Kshs 86.2 mn, from the 42.4 mn that was recorded in H1’2021. For more information, see Cytonn Weekly #29/2022, and,
- Property fund manager ILAM Fahari I-REIT announced plans to sell some of its assets in an aim to increase its returns from its property investments. The expected sale transaction is part of its proposed restructuring plans which is currently awaiting approval by the Capital Markets Authority (CMA). For more information, see Cytonn Weekly #29/2022.
The Kenyan Real Estate market is expected to be on an upward trajectory driven by; i) increased construction activities in the residential and infrastructure sectors, ii) efforts by the government to provide mortgages through the KMRC, iii) aggressive expansion by local and international retailers, and, v) improving investor confidence in the hospitality sector. However, the performance of the sector is expected to be weighed down by the inadequate investor appetite in REITs, oversupply in select Real Estate sectors, and the high construction costs.
Unit Trust Funds (UTFs) are Collective Investment Schemes that pool funds from different investors and are managed by professional fund managers. The fund managers invest the pooled funds in a portfolio of securities with the aim of generating returns to meet the specific objectives of the fund. Following the release of the Capital Markets Authority (CMA) Quarterly Statistical Bulletin-Q2’2022, we analyze the performance of Unit Trust Funds, as the total Assets Under Management (AUM) have been steadily increasing and they are among the most popular investment options in the Kenyan market. We will further analyze the performance of Money Market Funds, a product under Unit Trust Funds. In our previous focus on Unit Trust Funds, we looked at the FY’2021 Unit Trust Funds Performance by Fund Managers. In this topical, we focus on the Q1’2022 performance of Unit Trust Funds where we shall analyze the following:
- Performance of the Unit Trust Funds Industry,
- Performance of Money Market Funds,
- Comparing Unit Trust Funds AUM Growth with other Markets, and,
- Recommendations
Section I: Performance of the Unit Trust Funds Industry
Unit Trust Funds are investment schemes that pool funds from investors and are managed by professional Fund Managers. The fund manager invests the pooled funds with the aim of generating returns in line with the specific objectives of the fund. The Unit Trust Funds earn returns in the form of dividends, interest income, rent and/or capital gains depending on the underlying security. The main types of Unit Trust Funds include:
- Money Market Funds – These funds invest in fixed income securities such as fixed deposits, treasury bills and bonds, commercial papers, etc. They are very liquid, have stable returns, and, they are suitable for risk averse investors,
- Equity Funds – These are funds which largely invest in listed securities and seek to offer superior returns over the medium to long-term by maximizing capital gains and dividend income. The funds invest in various sectors to reduce concentration risk and maintain some portion of the fund’s cash in liquid fixed income investments to maintain liquidity and pay investors if need be without losing value,
- Balanced Funds – These are funds whose investments are diversified across the Equities and the Fixed Income markets. Balanced Funds offer investors long-term growth as well as reasonable levels of stability of income,
- Fixed Income Funds – These are funds which invest in interest-bearing securities, which include treasury bills, treasury bonds, preference shares, corporate bonds, loan stock, approved securities, notes and liquid assets consistent with the portfolio’s investment objective, and,
- Sector Specific Funds – These funds that invest primarily in a particular sector or industry. The funds provide a greater measure of diversification within a given sector than may be otherwise possible for the other funds. They are specifically approved by the Capital Markets Authority as they are not invested as per the set rules and regulations.
As per the Capital Markets Authority (CMA) Quarterly Statistical Bulletin-Q2’2022, the industry’s overall Assets under Management (AUM) grew by 4.5% to Kshs 140.7 bn as at the end of Q1’2022, from Kshs 134.7 bn as at the end of FY’2021. Assets under Management of the Unit Trust Funds have grown at a 5-year CAGR of 20.3% to Kshs 140.7 bn in Q1’2022, from Kshs 55.8 bn recorded in Q1’2017. The chart below shows the growth in Unit Trust Funds’ AUM;
Source: Capital Markets Authority Quarterly Statistical bulletins
The growth can be largely attributed to:
- Low Investments minimums: Majority of the Unit Trust Funds Collective Investment Schemes’ (CIS) in the market require a relatively low initial investment ranging between Kshs 100.0 - Kshs 10,000.0. This has in turn made them attractive to retail and individual investors, boosting their growth,
- Increased Investor Knowledge: There has been a drive towards investor education on the various products offered by trust funds which has meant that more people are aware and have a deeper understanding of the investment subject. As a result, their confidence has been boosted resulting to increased uptake,
- Diversified product offering: Unit Trust Funds are also advantageous in terms of providing investors with access to a wider range of investment securities through pooling of funds. This allows investors the opportunity of diversifying their portfolios which would have not been accessible if they invested on their own,
- Efficiency and ease of access to cash/High Liquidity: Funds invested in UTFs are invested as portfolios with different assets and the fund managers always maintain a cash buffer. Unit trusts are highly liquid, as it is easy to sell and buy units without depending on demand and supply at the time of investment or exit, and,
- Adoption of Fintech: Digitization and automation within the industry has enhanced liquidity, enabling investors to receive their funds within 3 to 5 working days if they are withdrawing to their bank accounts, and immediate access to funds when withdrawing via M-PESA. According to the Central Bank of Kenya, more and more individuals are transacting through mobile money services as evidenced by continuous increase in the total number of registered mobile money accounts which has grown at a 5-year CAGR of 15.4% to to 70.0 mn in May 2022, from 34.2 mn recorded in May 2017. Fintech has increased the efficiency of processing both payments and investments for fund managers and made Collective Investment Schemes more accessible to retail investors.
According to the Capital Markets Authority, as at the end of Q1’2022, there were 30 approved Collective Investment Schemes in Kenya, making up 111 funds in total. Out of the 30 however, only 20 were active while 10 were inactive. The table below outlines the performance of the Collective Investment Schemes comparing Q1’2022 and FY’2021:
|
Assets Under Management (AUM) for the Approved Collective Investment Schemes |
||||||
|
No. |
Collective Investment Schemes |
FY’2021 AUM (Kshs mns) |
FY’2021 Market Share |
Q1’2022 AUM (Kshs mns) |
Q1’2022 Market Share |
AUM Growth FY'2021 –Q1'2022 |
|
1 |
CIC Asset Managers |
56,278.4 |
41.8% |
56,919.1 |
40.5% |
1.1% |
|
2 |
NCBA Unit Trust Scheme |
18,003.0 |
13.4% |
19,757.2 |
14.0% |
9.7% |
|
3 |
BRITAM |
14,573.3 |
10.8% |
14,527.8 |
10.3% |
(0.3%) |
|
4 |
ICEA Lion |
13,350.7 |
9.9% |
13,669.2 |
9.7% |
2.4% |
|
5 |
Sanlam Investments |
8,610.7 |
6.4% |
10,205.1 |
7.3% |
18.5% |
|
6 |
Old Mutual |
6,655.0 |
4.9% |
6,713.2 |
4.8% |
0.9% |
|
7 |
Co-op Trust Investment Services Limited |
2,801.0 |
2.1% |
3,294.8 |
2.3% |
17.6% |
|
8 |
Dry Associates |
3,054.4 |
2.3% |
3,215.7 |
2.3% |
5.3% |
|
9 |
Madison Asset Managers |
2,660.2 |
2.0% |
2,794.6 |
2.0% |
5.1% |
|
10 |
Nabo Capital (Centum) |
2,398.3 |
1.8% |
2,719.6 |
1.9% |
13.4% |
|
11 |
Zimele Asset Managers |
1,992.5 |
1.5% |
2,165.8 |
1.5% |
8.7% |
|
12 |
African Alliance Kenya |
1,788.4 |
1.3% |
1,822.1 |
1.3% |
1.9% |
|
13 |
Cytonn Asset Managers |
704.2 |
0.5% |
725.7 |
0.5% |
3.1% |
|
14 |
Apollo Asset Managers |
716.3 |
0.5% |
719.2 |
0.5% |
0.4% |
|
15 |
Genghis Capital |
558.5 |
0.4% |
593.5 |
0.4% |
6.3% |
|
16 |
ABSA Unit Trust Scheme |
- |
0.0% |
287.1 |
0.2% |
- |
|
17 |
Orient Collective Investment Scheme |
245.8 |
0.2% |
257.4 |
0.2% |
4.7% |
|
18 |
Equity Investment Bank |
246.4 |
0.2% |
249.6 |
0.2% |
1.3% |
|
19 |
Amana Capital |
30.7 |
0.0% |
29.5 |
0.0% |
(4.1%) |
|
20 |
Wanafunzi Investments |
0.6 |
0.0% |
0.7 |
0.0% |
10.5% |
|
21 |
Genghis Specialized Funds |
- |
- |
- |
- |
- |
|
22 |
Standard Investments Bank |
- |
- |
- |
- |
- |
|
23 |
Diaspora Unit Trust Scheme |
- |
- |
- |
- |
- |
|
24 |
Dyer and Blair Unit Trust Scheme |
- |
- |
- |
- |
- |
|
25 |
Jaza Unit Trust Fund |
- |
- |
- |
- |
- |
|
26 |
Masaru Unit Trust Fund |
- |
- |
- |
- |
- |
|
27 |
Adam Unit Trust Fund |
- |
- |
- |
- |
- |
|
28 |
First Ethical Opportunities Fund |
- |
- |
- |
- |
- |
|
29 |
Natbank Unit Trust Scheme |
- |
- |
- |
- |
- |
|
30 |
GenAfrica Unit Trust Scheme |
- |
- |
- |
- |
- |
|
|
Total |
134,668.5 |
100.0% |
140,667.0 |
100.0% |
4.5% |
Source: Capital Markets Authority: Quarterly Statistical Bulletin, Q2’2022
Key take outs from the above table include:
- Assets Under Management: CIC Unit Trust Scheme remained the largest overall Unit Trust Fund with an AUM of Kshs 56.9 bn in Q1’2022, from an AUM of Kshs 56.3 bn in FY’2021, translating to a 1.1% AUM growth,
- Market Share: CIC Unit Trust Scheme remained the largest overall Unit Trust with a market share of 40.5%, a 1.3% points decline from 41.8% in FY’2021. Key to note, the 1.3% points decline in market share was the highest recorded in Q1’2022,
- Growth: In terms of AUM growth, Sanlam Investments recorded the strongest growth of 18.5%, with its AUM increasing to Kshs 10.2 bn, from Kshs 8.6 bn in FY’2021 while Amana Unit Trust Fund recorded the largest decline, with its AUM declining by 4.1% to Kshs 29.5 mn in Q1’2022, from Kshs 30.7 mn in FY’2021. Notably, the decline was slower than the 77.3% decline recorded in FY’2021, pointing towards improving investor confidence,
- GenAfrica Unit Trust Scheme, Natbank Unit Trust Scheme, First Ethical Opportunities Fund, Adam Unit Trust Fund, Masaru Unit Trust Fund, Jaza Unit Trust Fund, Dyer and Blair Unit Trust Scheme, Diaspora Unit Trust Scheme, Standard Investments Bank, and Genghis Specialized Fund remained inactive as at the end of Q1’2022.
Section II: Performance of Money Market Funds
Money Market Funds (MMFs) in the recent past have gained popularity in Kenya driven by the higher returns they offer compared to the returns on bank deposits and treasury bills. According to the Central Bank of Kenya data, the average deposit rate remained unchanged at 6.5% in Q1’2022, as was recorded at the end of FY’2021. During the period under review, the 91-Day T-bill and the average deposit rate continued to offer lower yields at 7.3% and 6.5%, respectively, compared to the average MMF yields of 8.9%.
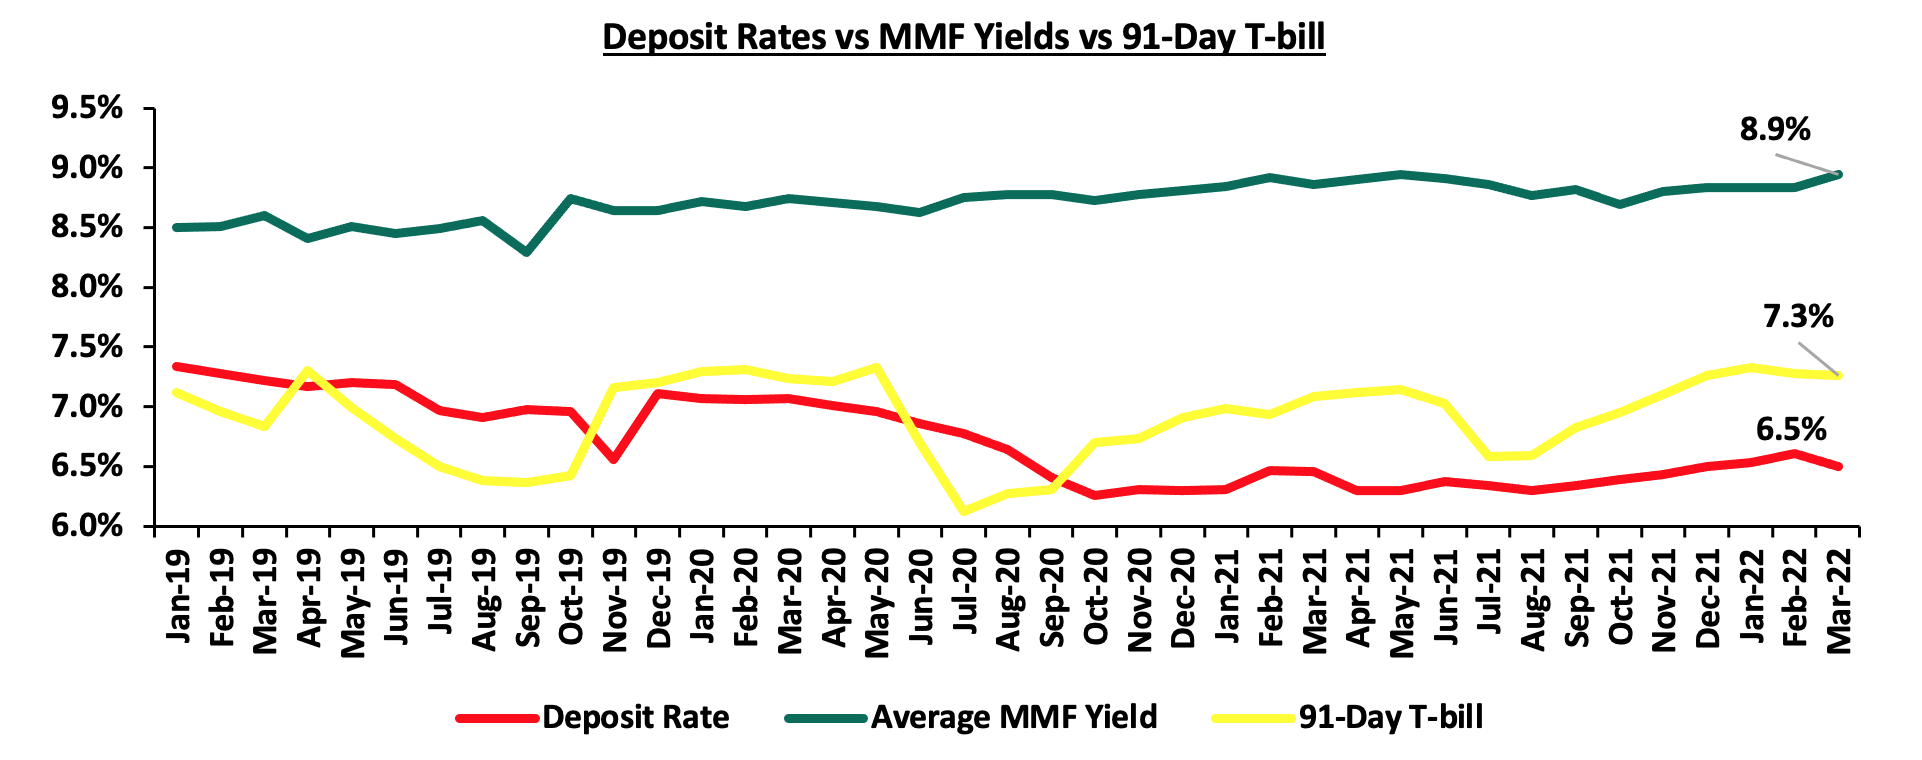
Source: Central Bank of Kenya, Cytonn Research
As per the regulations, funds in MMFs should be invested in liquid interest-bearing securities which include bank deposits, fixed income securities listed on the Nairobi Securities Exchange (NSE) and securities issued by the Government of Kenya. The fund is best suited for investors who require a low-risk investment that offers capital stability, liquidity, and require a high-income yield. The fund is also a good safe haven for investors who wish to switch from a higher risk portfolio to a low risk portfolio, especially in times of uncertainty.
Top Five Money Market Funds by Yields
During the period under review, the following Money Market Funds had the highest average effective annual yield declared, with the Cytonn Money Market Fund having the highest effective annual yield at 10.5% against the industry average of 8.9%.
|
Top 5 Money Market Fund Yield in Q1'2022 |
||
|
Rank |
Money Market Fund |
Effective Annual Rate (Average Q1'2022) |
|
1 |
Cytonn Money Market Fund |
10.5% |
|
2 |
Zimele Money Market Fund |
9.9% |
|
3 |
Nabo Africa Money Market Fund |
9.7% |
|
4 |
Sanlam Money Market Fund |
9.5% |
|
5 |
Madison Money Market Fund |
9.3% |
|
|
Industry average |
8.9% |
Source: Cytonn Research
Section III: Comparison between Unit Trust Funds AUM Growth and other Markets
Unit Trust Funds’ assets recorded a q/q growth of 4.5% in Q1’2022, while the listed bank deposits recorded a growth of 9.5% over the same period. For both the Unit Trust Funds and bank deposits, this was slower than the growth recorded as at the end of Q1’2021 of 6.1% and 21.8%, respectively as the economy was still in the early stages of recovery. The chart below highlights the Unit Trust Funds AUM growth vs bank deposits growth over the last five years;
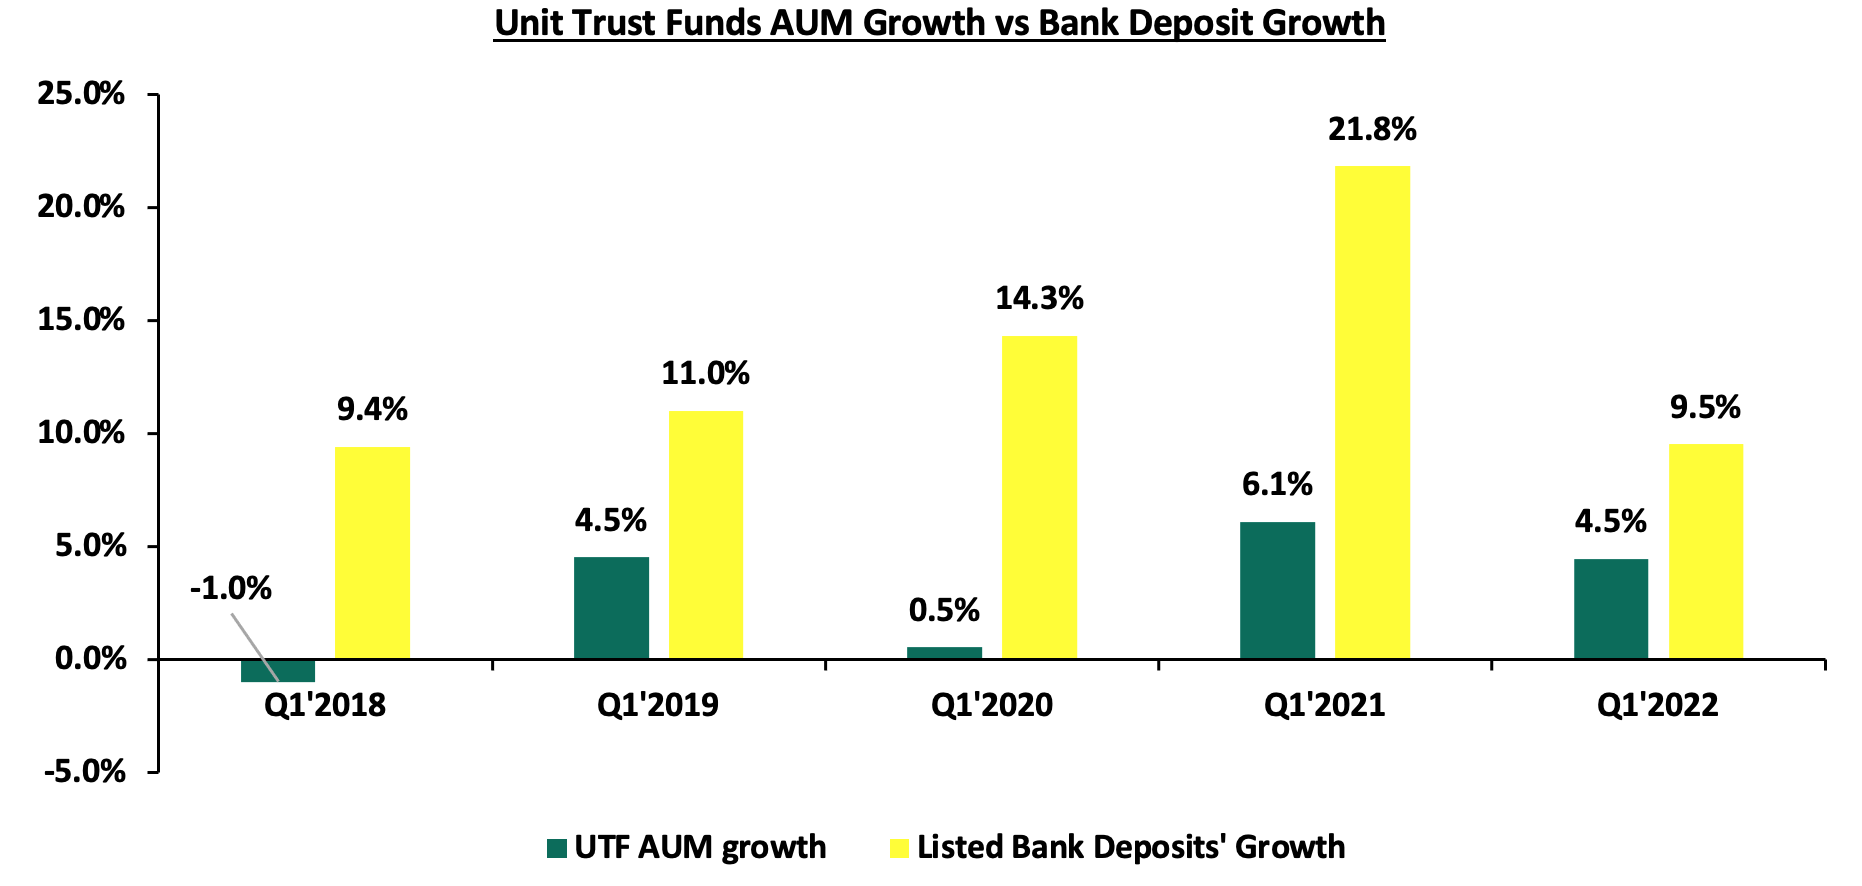
Source: Cytonn Research
Unit Trust Funds’(UTF) growth of 4.5% was outpaced by the listed banking sector’s deposit growth of 9.5% in Q1’2022. We note that the 4.5% growth rate was slower than the 6.1% growth recorded in Q1’2021, an indication of a relative slowdown in our capital markets with the faster growth of bank deposits pointing towards a constrained capital markets. According to the World Bank data, in well-functioning economies, businesses rely on bank funding for a mere 40.0%, with the larger percentage of 60.0% coming from the Capital markets. Closer home, the World Bank noted that businesses in Kenya relied on banks for 99.0% of their funding while less than 1.0% come from the capital markets. Notably, our Mutual Funds/UTFs to GDP ratio at 1.1% is still very low compared to an average of 56.3% amongst select global markets, indicating that we still have room to improve and enhance our capital markets. The chart below shows some countries’ mutual funds as a percentage of GDP:
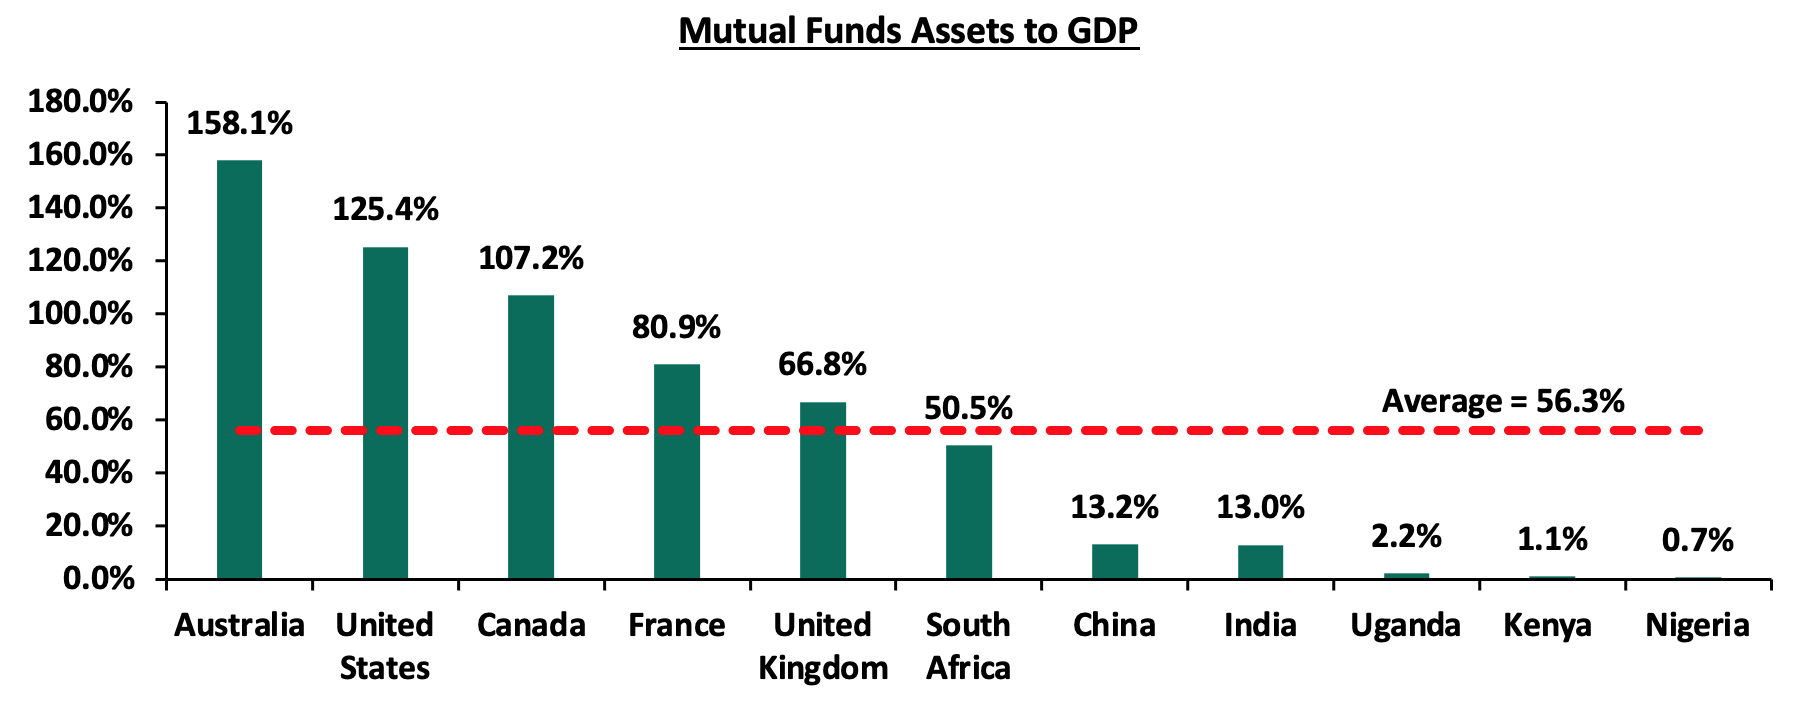
Source: World Bank Data
Over the past 5 years, the UTFs AUM has grown at a CAGR of 20.3% to Kshs 140.7 bn in Q1’2022, from Kshs 55.8 bn recorded in Q1’2017. However, even at Kshs 140.7 bn, the industry is dwarfed by asset gatherers such as bank deposits at Kshs 4.4 tn and the pension industry at Kshs 1.5 tn as of the end of 2021. Below is a graph showing the sizes of different saving channels and capital market products in Kenya as at December 2021:
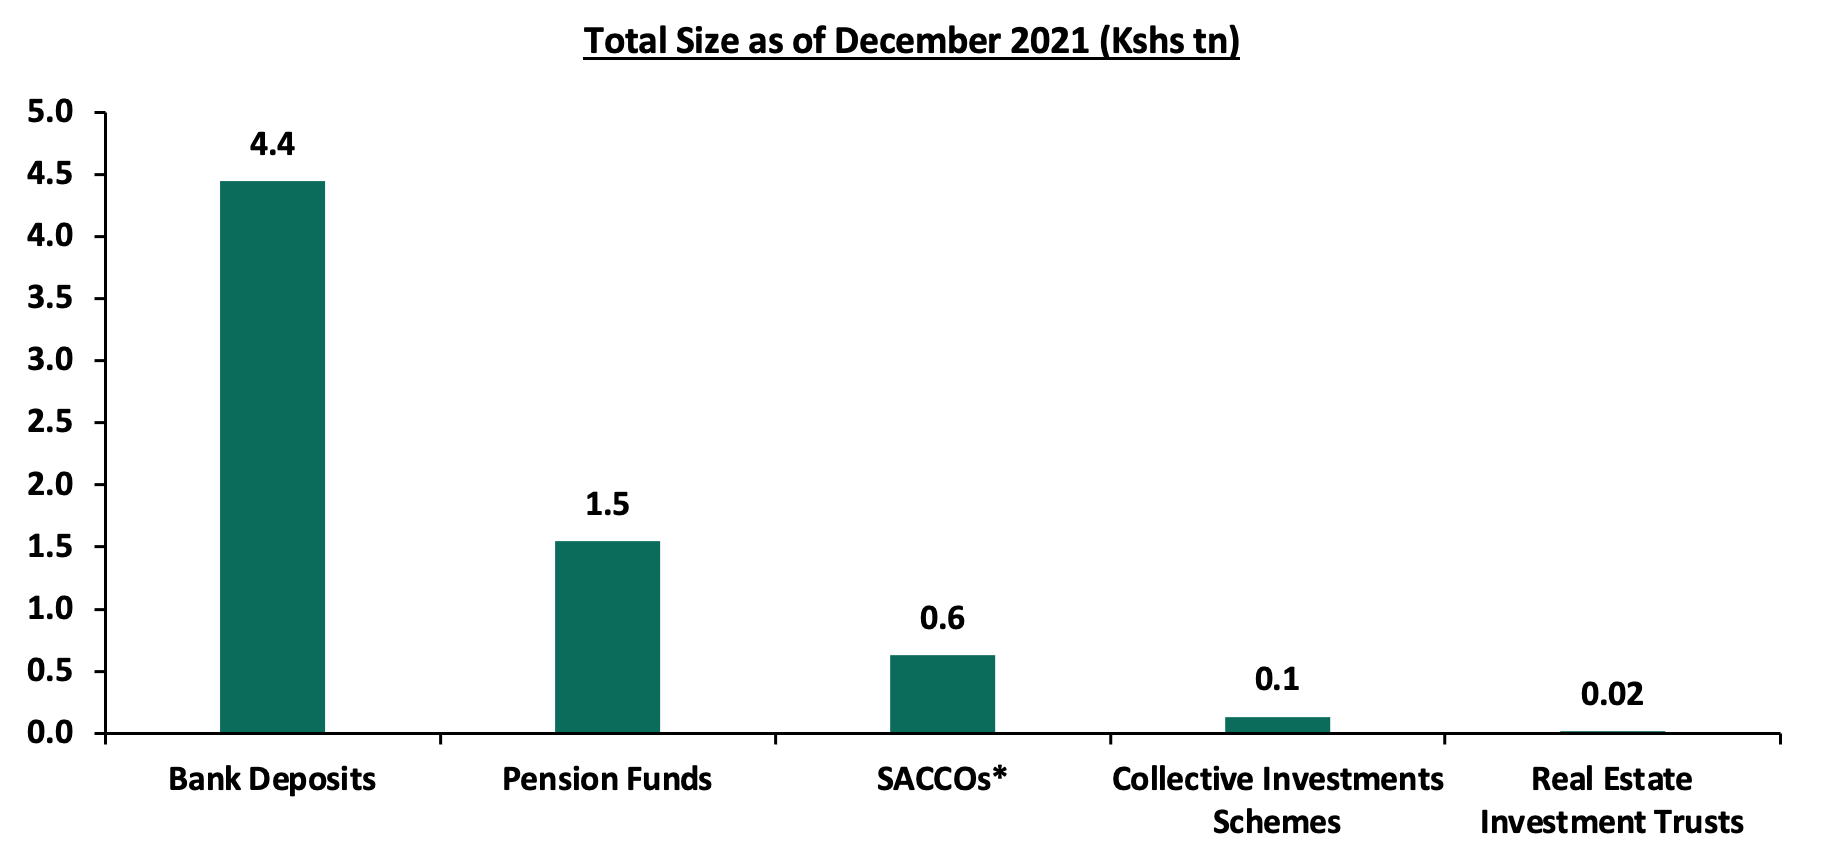
*Data as of December 2020
Source: CMA, RBA, CBK, SASRA Annual Reports and REITs Financial Statements
On a REITs to Market Cap Ratio, Kenya still has a lot of room for improvement. The listed REITs capitalization as a percentage of total market cap in Kenya stands at a paltry 0.1%, as compared to 2.2% in the US and 1.6% in South Africa, as of 29th July 2022. Below is a graph showing comparison of Kenya’s REITs to Market Cap Ratio to that of United States (US) and South Africa:
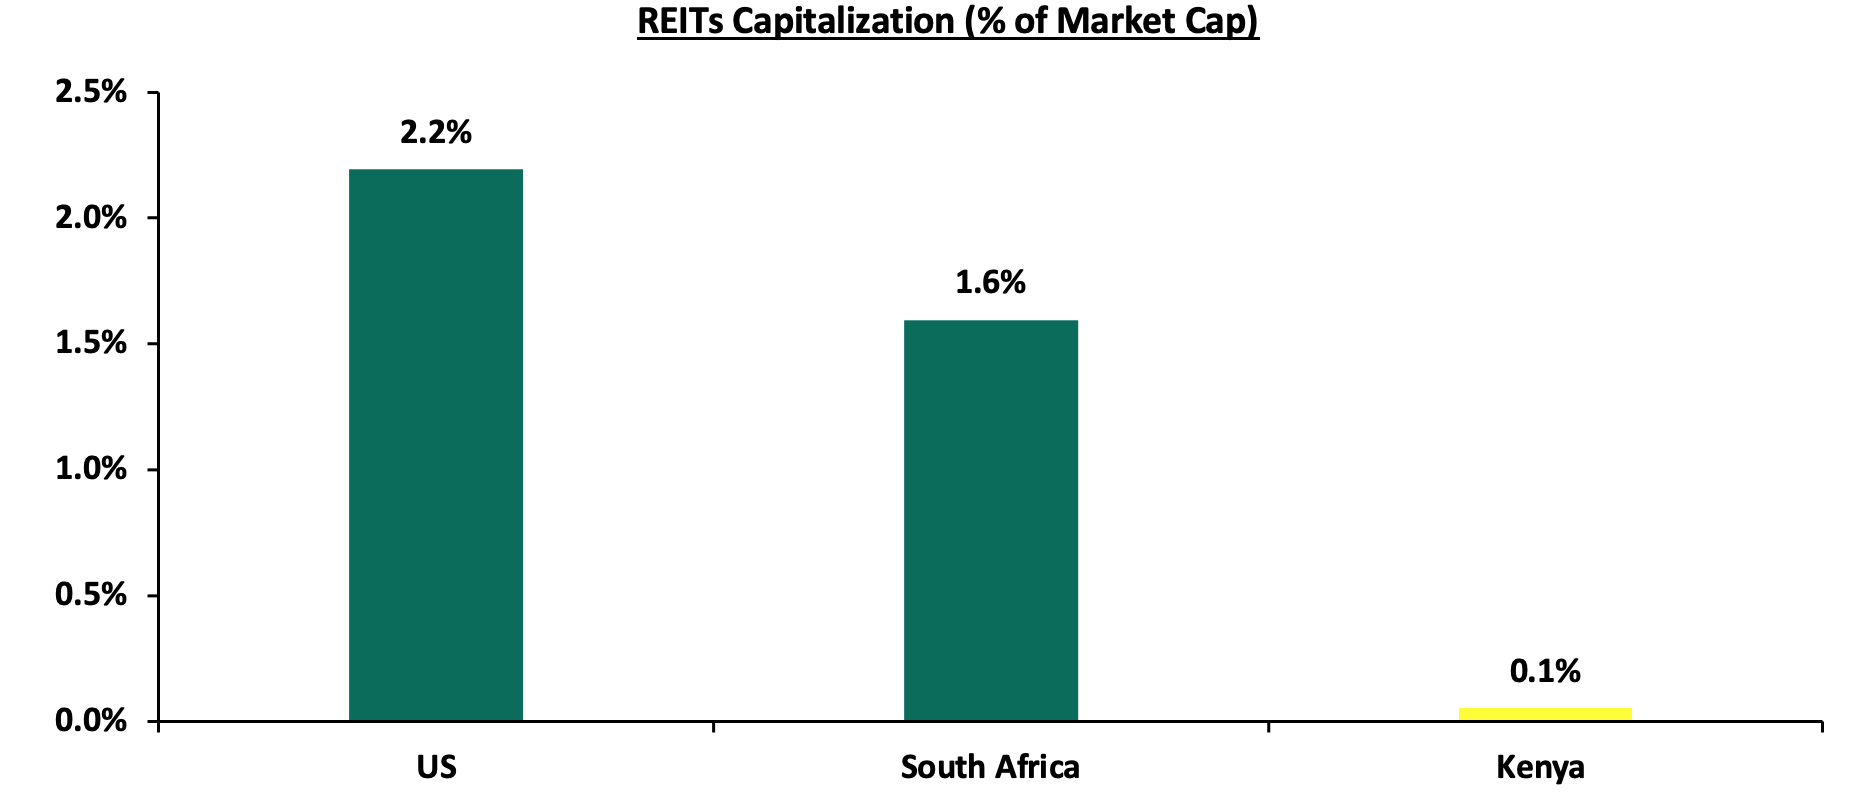
Source: Online research, Nairobi Securities Exchange (NSE)
Section IV: Recommendations
In order to improve our Capital Markets and stimulate its growth, we recommend the following actions:
- Reduce the minimum investments to reasonable amounts: Currently, the minimum investment for sector specific funds is Kshs 1.0 mn, while that for Development REITS is currently at Kshs 5.0 mn. The high minimum initial and top up investments amounts are unreasonably high and as such, put off potential investors. According to the Kenya National Bureau of Statistics, 74.4% of all employees in the formal sector earn a median gross income of Kshs 50,000 or below per month. It therefore locks out a lot of potential investors. Additionally, these high amounts discriminate against most retail investors, giving them fewer investment choices. This is the key reason why the listed REITS to Market cap ratio for Kenya remains at 0.05% compared to South Africa’s at 1.5% and US at 3.0%,
- Allow for sector funds: Under the current capital markets regulations, UTFs are required to diversify. Consequently, one has to seek special dispensation in the form of sector funds such as a financial services fund, a technology fund or a Real Estate UTF fund. Regulations allowing unit holders to invest in sector funds would go a long way in expanding the scope of unit holders interested in investing,
- Eliminate conflicts of interest in the governance of capital markets and allow different services such as the opening up of Trustees to non-financial institutions: The capital markets regulations should foster a governance structure that is more responsive to both market participants and market growth. Specifically, restricting Trustees of Unit Trust Schemes to Banks only limits choices, especially given that banking markets and capital markets are in competition,
- Provide Support to Fund Managers: We are of the opinion that the regulator, CMA, needs to integrate market stabilization tools as part of the regulations/Act that will help Fund Managers meet fund obligations especially during times of distress such as mass withdrawals. We do commend and appreciate the regulator on its role in protecting investor interests. However, since Fund Managers also play a key role in the capital markets, the regulator should also be able to protect the brand image of various fund managers in the industry. This can be achieved by working together with industry players to resolve matters rather than alienating and publicly ostracizing industry players facing challenges as this may not particularly be in investors’ interest,
- Create increased competition in the market by encouraging different players to set up shop: Increased competition in capital markets will not only push Unit Trust Fund managers to provide higher returns for investors but will also eliminate conflicts of interest in markets and enhance the provision of innovative products and services, and,
- Improve fund transparency to provide investors with more information: Each Unit Trust Fund should be required to publish their portfolio holdings on a quarterly basis and make the information available to the public so as to enhance transparency for investors. Enhanced accountability by providing investors with more information will help both investors and prospects make better informed decisions and subsequently improve investor confidence.
In May 2022, the Capital Markets Authority (CMA) publicized the Draft Capital Markets Public Offers Listing and Disclosures Regulations 2022, meant to replace the Public Offers Listing and Disclosures Regulations 2002, which have been in place since 2002, with the only amendments done in 2016. The main aim of the Draft Regulations is to provide a more enabling environment in Kenya’s Capital Markets in order to spur more listings in the Nairobi Securities Exchange. As highlighted in our Cytonn weekly#18/2022, we expect more corporates to take advantage and seek capital markets funding through IPOs, which will further help to increase the percentage of funding for business by the Capital Markets. Additionally, In June 2022, the Capital Markets Authority (CMA) published the final draft regulations; Capital Markets (Collective Investment Schemes) Regulations 2022 and the Capital Markets (Alternative Investment Funds) Regulations 2022. The proposed regulations seek to update the current Collective Investment Scheme and Alternative Investment Funds Regulations given the change in market dynamics as well as address emerging issues.
We believe that for continued growth of the capital markets, there is a need to leverage more on innovation and digitization. The use of technology as a distribution channel for mutual fund products opens up the funds to the retail segment, which is characterized by strong demand among retail clients for convenient and innovative products. The regulators should promote and facilitate growth and diversification of UTFs, instead of impeding their expansion, which will enhance growth of capital markets and encourage entry of new players into the market.
Disclaimer: The views expressed in this publication are those of the writers where particulars are not warranted. This publication, which is in compliance with Section 2 of the Capital Markets Authority Act Cap 485A, is meant for general information only and is not a warranty, representation, advice or solicitation of any nature. Readers are advised in all circumstances to seek the advice of a registered investment advisor.

- Talk to us
- Kenya
- P.O Box 20695 - 00200, Nairobi, Kenya
- Cell +254709101200
- Tel +254709101200
- WhatsApp +254741676635
- United States
- +254709101200
- DOWNLOAD OUR APP
-


- Kenya
- 8th Floor, Pinetree Plaza, Kaburu Drive, Ngong Road, Nairobi, Kenya
- USA
- Suite 1150, 1775 Eye Street NW, USA, Washington DC 20006, USA
- Investments
- High Yield
- Private Equity
- Real Estate
- Real Estate
- RiverRun Estates
- Cytonn Towers
- The Ridge
- Taraji Heights
- The Alma