Kenya’s Cost of Credit, & Cytonn Monthly – January 2022
By Research Team, Feb 6, 2022
Executive Summary
Fixed Income
During the month of January, T-bills were oversubscribed, with the overall subscription rate coming in at 120.1%, an increase from the 61.5% recorded in December 2021, partly attributable to the ample liquidity in the money market partly attributable to government payments which offset tax remittances, with the average interbank rate declining to 4.5%, from the 5.1% recorded in December 2021. Overall subscription rates for the 182-day and 364-day papers increased to 94.3% and 160.2%, from 50.2% and 56.4%, respectively, recorded in December 2021. The subscription rate for the 91-day paper on the other hand declined to 84.3%, from the 102.3% recorded in December 2021. The yields on the 91-day, 182-day and 364-day papers increased by 7.1 bps, 8.9 bps and 31.6 bps to 7.3%, 8.1% and 9.5%, respectively. In the Primary Bond Market, the government issued a new 19-year Infrastructure bond, IFB1/2022/19, whose bid closure date is 15th February 2022. Key to note, the bond’s coupon rate will be market determined.
The inflation rate for the month of January 2022 declined to 5.4%, from the 5.7% recorded in December 2021, driven by the 0.8% decline in the housing, water, electricity, gas and other fuels index. During the week, the National Treasury presented the Supplementary Budget for the fiscal year 2021/22 to the National Assembly. The treasury is seeking to increase the gross total budget by 3.3% to Kshs 3,377.8 bn, from the previous estimates of Kshs 3,269.2 bn. The increase in the supplementary budget is mainly on account of a 12.3% increase in funds allocated towards the Ministry of Health to Kshs 136.0 bn from the original estimates of Kshs 121.1 bn as the government amps up its fight against COVID-19, coupled with a 3.7% increase in the infrastructure budget to Kshs 202.5 bn from the earlier approved Kshs 195.2 bn;
Equities
During the month of January, the equities market was on a downward trajectory, with NASI, NSE 20 and NSE 25 declining by 1.9%, 0.7% and 1.7%, respectively. The equities market performance was driven by losses recorded by large cap stocks such as Equity, Safaricom, Diamond Trust Bank (DTB-K) and KCB of 4.3%, 2.8%, 2.1% and 1.0%, respectively. The losses were however mitigated by gains recorded by BAT, Standard Chartered Bank, Bamburi and NCBA which gained by 6.0%, 2.9%, 2.4% and 1.6%, respectively.
During the month, Equity Group Holdings (EGH), announced the completion of the incorporation of a subsidiary, Equity Group Insurance Holdings Limited, a non-operating insurance holding company and issuance of a life insurance license to Equity Life Assurance Kenya (ELAK) Limited. ELAK, which is fully owned by Equity Group Insurance Holdings Limited, will conduct and undertake long-term insurance business in Kenya;
Real Estate
During the month of January, five industry reports were released, namely; Quarterly Economic Review July-September 2021 by the Central Bank of Kenya (CBK), Leading Economic Indicators, November 2021 and Q3'2021 GDP Report by the Kenya National Bureau of Statistics (KNBS). Additionally, Hass Consult released their House Price Index Q4’2021, highlighting that the average selling prices for properties within the Nairobi Metropolitan Area (NMA) recorded a q/q increase of 3.0% and a y/y increase of 3.1%. Hass Consult also released the Land Price Index Q4’2021, highlighting that the overall asking prices for land within the NMA increased by 0.9% on a quarterly basis and 3.9% on a y/y basis;
In the retail sector, QuickMart Supermarket, a local retail chain opened a new outlet at OBC Kitengela Mall, bringing its total operating stores to 48. Additionally, Optica Limited, a local eye-wear retailer opened a new outlet at Viashla center in Ruiru Kamakis, bringing the total number of outlets to 54. In the infrastructure sector, the national government through the Kenya Railways Corporation announced plans to revamp select dilapidated railway lines in the country namely; i) 217.0Km Nakuru-Kisumu Meter Gauge Railway (MGR), ii) 77.8Km Gilgil-Nyahururu MGR line, and, iii) 69.1Km Kisumu-Butere railway line, at a cost of Kshs 4.5 bn. For listed Real Estate, ILAM Fahari I-Reit closed the week trading at an average price of Kshs 6.3 per share, and, Acorn DREIT closed the week trading at Kshs 20.2 while the I-REIT closed at Kshs 20.6 per unit.;
Focus of the Week
According to the Central Bank of Kenya (CBK) the private sector credit growth declined in 2021 coming in at an average of 7.8%, in comparison to the 8.0% recorded in 2020 partly due to the cautious lending strategy adopted by banks during the COVID-19 operating environment. High cost of credit remains one of the main challenges that hinders credit growth with the big banks charging a higher cost of credit in comparison to smaller banks reflecting their strong pricing power based on a wide distribution network, multiple services and well established brands. On the other hand, small banks have to compete for customers by offering relatively cheaper credit in order to grow their loan book.
Investment Updates:
- Weekly Rates:
- Cytonn Money Market Fund closed the week at a yield of 10.30%. To invest, just dial *809#;
- Cytonn High Yield Fund closed the week at a yield of 13.73% p.a. To invest, email us at sales@cytonn.com and to withdraw the interest you just dial *809#;
- We continue to offer Wealth Management Training every Wednesday and every third Saturday of the month, from 9:00 am to 11:00 am, through our Cytonn Foundation. The training aims to grow financial literacy among the general public. To register for any of our Wealth Management Trainings, click here;
- If interested in our Private Wealth Management Training for your employees or investment group, please get in touch with us through wmt@cytonn.com;
- Any CHYS and CPN investors still looking to convert are welcome to consider one of the five projects currently available for conversion, click here for the latest conversion term sheet;
- Cytonn Insurance Agency acts as an intermediary for those looking to secure their assets and loved ones’ future through insurance namely; Motor, Medical, Life, Property, WIBA, Credit and Fire and Burglary insurance covers. For assistance, get in touch with us through insuranceagency@cytonn.com;
- Cytonnaire Savings and Credit Co-operative Society Limited (SACCO) provides a savings and investments avenue to help you in your financial planning journey. To enjoy competitive investment returns, kindly get in touch with us through clientservices@cytonn.com;
Real Estate Updates:
- For an exclusive tour of Cytonn’s real estate developments, visit: Sharp Investor's Tour, and for more information, email us at sales@cytonn.com;
- Phase 3 of The Alma is now ready for occupation. To rent please email properties@cytonn.com;
- We have 8 investment-ready projects, offering attractive development and buyer targeted returns; See further details here: Summary of Investment-ready Projects;
- For recent news about the group, see our news section here;
Hospitality Updates:
- We currently have promotions for Staycations. Visit cysuites.com/offers for details or email us at sales@cysuites.com;
Money Markets, T-Bills & T-Bonds Primary Auction:
During the month of January, T-bills were oversubscribed, with the overall subscription rate coming in at 120.1%, an increase from the 61.5% recorded in December 2021. The increase in the subscription rate is partly attributable to the ample liquidity in the money market partly attributable to government payments which offset tax remittances, with the average interbank rate declining to 4.5%, from the 5.1% recorded in December 2021. The overall subscription rates for the 182-day and 364-day papers increased to 94.3% and 160.2%, from 50.2% and 56.4%, respectively, recorded in December 2021. The subscription rate for the 91-day paper on the other hand declined to 84.3%, from the 102.3% recorded in December 2021. The yields on the 91-day, 182-day and 364-day papers increased by 7.1 bps, 8.9 bps and 31.6 bps to 7.3%, 8.1% and 9.5%, respectively. For the month of January, the government accepted a total of Kshs 106.6 bn out of the Kshs 115.3 bn worth of bids received, translating to a 92.5% acceptance rate.
During the week, T-bills remained oversubscribed, with the overall subscription rate coming in at 115.8%, from 107.9% recorded the previous week, partly attributable to ample liquidity in the money market. The 364-day paper recorded the highest subscription rate, receiving bids worth Kshs 16.2 bn against the offered Kshs 10.0 bn, translating to a subscription rate of 161.7%, a decrease from the 190.6%, recorded the previous week. The continued oversubscription witnessed for the 364-day paper is attributable to investors’ preference for the longer-dated paper which offers higher yields of 9.6% compared to the 7.3% and 8.1% yields offered by the 91-day and 182-day papers, respectively. The subscription rate for the 91-day and 182-day papers, on the other hand, increased to 84.6% and 82.4%, from 37.7% and 53.4%, respectively, recorded the previous week. The yields on the government papers recorded mixed performance, with the yields on the 91-day and 182-day papers declining by 2.6 bps and 1.7 bps to 7.3% and 8.1%, respectively, while the yield on the 364-day paper increased by 5.0 bps to 9.6%. The government continued to reject expensive bids, accepting bids worth Kshs 25.8 bn out of the Kshs 27.8 bn worth of bids received, translating to an acceptance rate of 93.0%.
During the month, the government released the auction results for the three re-opened bonds; FXD1/2020/05, FXD2/2018/10 and FXD1/2021/20. The bonds recorded an oversubscription of 111.3% driven by the ample liquidity in the money market during the month coupled with the attractive yields offered by the bonds. The government was keen on maintaining low rates and thus accepted only Kshs 62.3 bn of the Kshs 66.8 bn worth of bids received, translating to an acceptance rate of 93.6%. The table below provides more details on the bonds issued during the month:
|
Issue Date |
Bond Auctioned |
Effective Tenor to Maturity (Years) |
Coupon |
Amount offered (Kshs bn) |
Actual Amount Raised (Kshs bn) |
Total bids received |
Average Accepted Yield |
Subscription Rate |
Acceptance Rate |
|
20/12/2021 |
FXD1/2020/05 |
3.4 |
11.7% |
30.0 |
27.4 |
28.4 |
11.3% |
94.6% |
96.6% |
|
FXD2/2018/10 |
7.0 |
12.5% |
30.0 |
34.9 |
38.4 |
12.7% |
128.0% |
90.9% |
|
|
FXD1/2021/20 |
19.7 |
13.4% |
13.8% |
||||||
|
January 2022 Average |
10.0 |
12.5% |
30.0 |
31.2 |
33.4 |
12.6% |
111.0% |
93.6% |
|
|
December 2021 Average |
12.2 |
12.7% |
40.0 |
37.8 |
41.2 |
13.0% |
102.9% |
91.9% |
|
For the month of February 2022, the government issued a new 19-year infrastructure bond, IFB1/2022/19 with a tenor of 19 years in a bid to raise Kshs 75.0 bn for funding Infrastructure projects. The period of sale runs from 31st January 2022 to 15th February 2022. Key to note, the bond’s coupon rate will be market-determined. We anticipate an oversubscription and a higher acceptance rate given the ample liquidity in the money market coupled with the attractive tax-free nature of the bond. Our recommended bidding range for the bond is: 12.4%-12.5% within which bonds of a similar tenor are trading.
Secondary Bond Market:
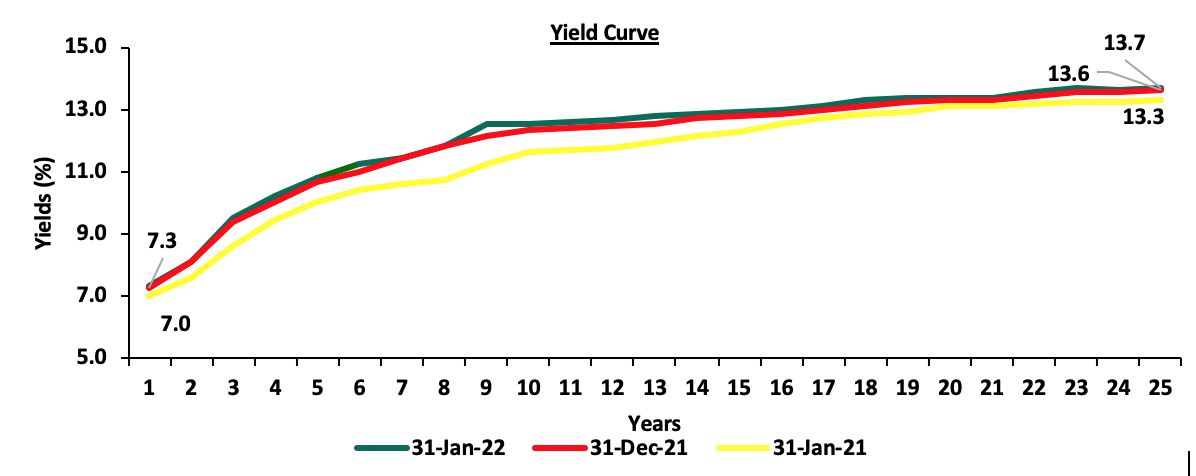
In the month of January 2022, the yields on government securities in the secondary market were on downward trajectory, with the FTSE NSE bond index gaining by 0.3% to close the month at Kshs 96.4, from Kshs 96.1 recorded in December 2021, bringing the YTD performance to a gain of 0.3%. The chart below shows the yield curve movement during the period;
The secondary bond turnover declined by 9.0% to Kshs 46.8 bn, from Kshs 51.4 bn recorded in December 2021. Key to note, this was lowest monthly bond turnover since November 2020 when the turnover was Kshs 46.0 bn, attributable to commercial banks’ reduced activity in the secondary bonds market. In our view, we believe that the improving business environment in the country has seen most banks increase their lending activities to the private sector. On a year on year basis, however, the bonds turnover increased by 33.7% to Kshs 913.2 bn, from Kshs 682.9 bn worth of T-bonds transacted over a similar period last year.
Money Market Performance
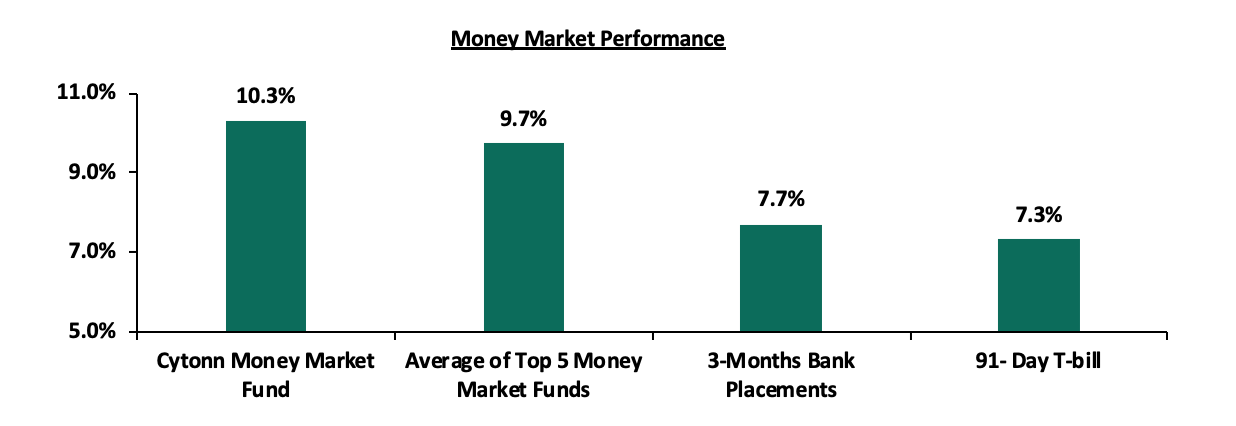
In the money markets, 3-month bank placements ended the week at 7.7% (based on what we have been offered by various banks), while the yield on the 91-day T-bill declined by 2.6 bps to 7.3%. The average yield of the Top 5 Money Market Funds and the yield of the Cytonn Money Market Fund declined to 9.7% and 10.3%, from 9.8% and 10.5%, respectively, as was recorded the previous week.
The table below shows the Money Market Fund Yields for Kenyan Fund Managers as published on 4th February 2022:
|
|
Money Market Fund Yield for Fund Managers as published on 4th February 2022 |
|
|
Rank |
Fund Manager |
Effective Annual Rate |
|
1 |
Cytonn Money Market Fund |
10.30% |
|
2 |
Zimele Money Market Fund |
9.91% |
|
3 |
Nabo Africa Money Market Fund |
9.70% |
|
4 |
Sanlam Money Market Fund |
9.44% |
|
5 |
Madison Money Market Fund |
9.27% |
|
6 |
CIC Money Market Fund |
8.97% |
|
7 |
GenCapHela Imara Money Market Fund |
8.97% |
|
8 |
Apollo Money Market Fund |
8.95% |
|
9 |
Dry Associates Money Market Fund |
8.81% |
|
10 |
Orient Kasha Money Market Fund |
8.70% |
|
11 |
Co-op Money Market Fund |
8.51% |
|
12 |
British-American Money Market Fund |
8.46% |
|
13 |
ICEA Lion Money Market Fund |
8.33% |
|
14 |
NCBA Money Market Fund |
8.33% |
|
15 |
AA Kenya Shillings Fund |
7.59% |
|
16 |
Old Mutual Money Market Fund |
7.18% |
Source: Business Daily
Liquidity:
Liquidity in the money markets eased in the month of January 2022, with the average interbank rate declining to 4.5%, from 5.1% recorded in December 2021, partly attributable to government payments which offset tax remittances. During the week, liquidity in the money markets eased as well, with the average interbank rate reducing to 4.4%, from 4.7% recorded the previous week. The average interbank volumes traded increased by 6.4% to Kshs 11.5 bn, from Kshs 10.8 bn recorded the previous week.
Kenya Eurobonds:
During the month, the yields on the Eurobonds recorded mixed performance, with the 30-year Eurobond issued in 2018, the 12-year Eurobond issued in 2019 and the 12-year Eurobond issued in 2021, all increasing by 0.5% points, to 8.7%, 7.2% and 7.1%, from 8.1%, 6.7% and 6.6%, respectively, recorded in December 2021. Additionally, the yields on the 10-year Eurobond issued in 2018 and the 7-year Eurobond issued in 2019 increased by 0.8% points and 0.7% points, to 6.6% and 6.3%, from 5.8% and 5.6%, respectively, from what was recorded in December 2021. The yield on the 10-year Eurobond issued in 2014 was the only decliner, declining by 0.2% points to 4.2%, from 4.4% recorded in December 2021.
During the week, the yields on all the Eurobonds were on a downward trajectory, with yields on the 10-year bond issued in 2014, the 10-year bond issued in 2018, the 30-year bond issued in 2018, the 7-year and 12-year bonds issued in 2019, and, the 12-year bond issued in 2021 declining marginally by 0.1% points to 4.1%, 6.5%, 8.5%, 6.2%, 7.2% and 7.1%, respectively:
|
Kenya Eurobond Performance |
||||||
|
|
2014 |
2018 |
2019 |
2021 |
||
|
Date |
10-year issue |
10-year issue |
30-year issue |
7-year issue |
12-year issue |
12-year issue |
|
31-Dec-21 |
4.4% |
5.8% |
8.1% |
5.6% |
6.7% |
6.6% |
|
3-Jan-22 |
4.4% |
5.7% |
8.1% |
5.6% |
6.7% |
6.6% |
|
28-Jan-22 |
4.2% |
6.6% |
8.7% |
6.3% |
7.3% |
7.2% |
|
31-Jan-22 |
4.2% |
6.6% |
8.7% |
6.3% |
7.2% |
7.1% |
|
1-Feb-22 |
4.2% |
6.6% |
8.6% |
6.3% |
7.3% |
7.1% |
|
2-Feb-22 |
4.1% |
6.5% |
8.6% |
6.2% |
7.2% |
7.0% |
|
3-Feb-22 |
4.1% |
6.5% |
8.5% |
6.2% |
7.2% |
7.1% |
|
Weekly Change |
(0.1%) |
(0.1%) |
(0.1%) |
(0.1%) |
(0.1%) |
(0.1%) |
|
M/M Change |
(0.2%) |
0.8% |
0.5% |
0.7% |
0.5% |
0.5% |
|
YTD Change |
(0.3%) |
0.8% |
0.4% |
0.6% |
0.5% |
0.5% |
Kenya Shilling:
During the month, the Kenya Shilling depreciated by 0.4% against the US Dollar, to close the month at Kshs 113.6, from Kshs 113.1 recorded at the end of December 2021. Notably, the shilling hit an all-time low during the month of January, driven by the increased dollar demand from oil and merchandise importers on the back of increased global oil prices against slower recovery in the exports and tourism sector.
During the week, the Kenyan shilling remained relatively stable against the US dollar, closing the week at Kshs 113.6, unchanged from the previous week. On a YTD basis, the shilling has depreciated by 0.4% against the dollar, in comparison to the 3.6% depreciation recorded in 2021. We expect the shilling to remain under pressure in 2022 as a result of:
- Increased demand from merchandise traders as they beef up their hard currency positions in anticipation for more trading partners reopening their economies globally,
- Ever present current account deficit due to an imbalance between imports and exports with Kenya’s current account deficit estimated to come in at 5.4% of GDP in 2021, having expanded by 27.4% in Q3’2021 to Kshs 184.6 bn, from Kshs 145.0 bn recorded in Q3’2020. This was attributed to a robust increase in merchandise imports by 39.6% to Kshs 321.8 bn in Q3’2021, from Kshs 230.5 bn in Q3’2020,
- The aggressively growing government debt, with Kenya’s public debt having increased at a 10-year CAGR of 18.2% to Kshs 8.0 tn in August 2021, from Kshs 1.5 tn in July 2011 thus putting pressure on forex reserves to repay some of the public debt, and,
- Rising global crude oil prices on the back of supply constraints at a time when demand is picking up with the easing of COVID-19 restrictions and as economies reopen. Key to note, risks abound this global recovery following the emergence of the new COVID-19 variants. We are of the view that should the variants continue to spread; most nations will respond swiftly by adopting stringent containment measures to curb transmissions.
The shilling is however expected to be supported by:
- High Forex reserves, currently at USD 8.2 bn (equivalent to 5.0-months of import cover), which is above the statutory requirement of maintaining at least 4.0-months of import cover, and the EAC region’s convergence criteria of 4.5-months of import cover. In addition, the reserves were boosted by the USD 1.0 bn proceeds from the Eurobond issued in July 2021 coupled with the USD 972.6 mn IMF disbursement and the USD 130.0 mn World Bank loan financing received in June 2021, and,
- Improving diaspora remittances evidenced by a 17.0% y/y increase to USD 350.6 mn in December 2021, from USD 299.6 mn recorded over the same period in 2020, which has continued to cushion the shilling against further depreciation.
Weekly Highlights:
- January 2022 Inflation
The y/y inflation for the month of January 2022 declined for the fourth consecutive month to 5.4%, from the 5.7% recorded in December 2021, lower than our expectations of 5.6% - 6.0%. On a m/m basis, the inflation rates increased by 0.3%, driven by a 1.1% increase in food & non-alcoholic beverages coupled with a 0.7% increase in furnishings, household equipment and routine household maintenance. Notably, housing, water, electricity, gas and other fuels recorded the largest decline, reducing by 0.8%. This was mainly attributable to a 15.7% decrease in the price of electricity in January 2022 marking the first phase of compliance with President Uhuru Kenyatta’s directive to cut the cost of electricity by 30.0% in order to reduce the cost of living. Additionally, the transport index declined marginally by 0.1% on a m/m basis given that fuel prices remained unchanged at Kshs 129.7 per litre for Super Petrol, Kshs 110.6 per litre for Diesel and Kshs 103.5 per litre for Kerosene during the month. The table below shows a summary of both the year on year and month on month commodity groups’ performance;
|
Major Inflation Changes – January 2022 |
|||
|
Broad Commodity Group |
Price change m/m (January-22/ December-21) |
Price change y/y (January-22/ January-21) |
Reason |
|
Food & Non-Alcoholic Beverages |
1.1% |
8.9% |
The m/m increase was mainly contributed by increase in prices of sifted maize flour, kale, spinach and irish potatoes among other food items. The increase was however mitigated by a decline in prices of mangoes, tomatoes and carrots |
|
Housing, Water, Electricity, Gas and other Fuel |
(0.8%) |
5.1% |
The m/m decrease was mainly attributable to a 15.7% decrease in the price of electricity in January 2022 |
|
Transport Cost |
(0.1%) |
6.8% |
The m/m marginal decline was as a result of unchanged prices for super petrol, diesel and kerosene during the month |
|
Overall Inflation |
0.3% |
5.4% |
The m/m increase was driven by a 1.1% increase in food & non-alcoholic beverages coupled with a 0.7% increase in furnishings, household equipment and routine household maintenance. |
Source: KNBS
Going forward, we expect the inflation rate to remain within the government’s set range of 2.5% - 7.5%. Despite the decline in January’s inflations rates, concerns remain high on the widening trade deficit as global fuel prices continue to rise due to supply bottlenecks. The rising global fuel prices could deplete the fuel subsidy program currently in place and further lead to a depreciation of the local currency.
- Supplementary Budget - FY’2021/22
During the week, the National Treasury presented the Supplementary Budget for the fiscal year 2021/22 to the National Assembly. The treasury is seeking to increase the gross total budget by 3.3% to Kshs 3,377.8 bn, from the previous estimates of Kshs 3,269.2 bn. The increase in the supplementary budget is mainly on account of a 12.3% increase in funds allocated towards the Ministry of Health to Kshs 136.0 bn from the original estimates of Kshs 121.1 bn as the government amps up its fight against COVID-19, coupled with a 3.7% increase in the infrastructure budget to Kshs 202.5 bn from the earlier approved Kshs 195.2 bn.
The table below illustrates the allocation of the Supplementary Budget 2021/22, showing the components of the estimated expenditure:
|
Supplementary Gross Budget 2021/2022 (Kshs billions) |
||||
|
|
Approved Estimates |
Supplementary I Estimates |
Change |
% Change |
|
State Department of ICT |
22.8 |
22.3 |
(0.5) |
(2.3%) |
|
State Department of Vocational & Technical Training |
23.3 |
23.0 |
(0.3) |
(1.2%) |
|
Ministry of Energy |
73.9 |
74.0 |
0.1 |
0.1% |
|
State Department of Interior |
138.6 |
140.3 |
1.7 |
1.2% |
|
State Department of Basic Education |
103.3 |
106.4 |
3.1 |
3.0% |
|
State Department of Infrastructure |
195.2 |
202.5 |
7.3 |
3.7% |
|
State Department of Water Services |
77.6 |
81.8 |
4.2 |
5.4% |
|
Other Ministries & State Departments |
1,141.3 |
1,231.9 |
90.6 |
7.9% |
|
State Department of Agricultural Research |
44.9 |
50.1 |
5.2 |
11.5% |
|
Ministry of Health |
121.1 |
136.0 |
15.0 |
12.3% |
|
Total Expenditure |
1,942.0 |
2,068.3 |
126.3 |
6.5% |
|
Consolidated Fund Services |
1,327.2 |
1,309.5 |
(17.7) |
(1.3%) |
|
Grand Total Supplementary Budget |
3,269.2 |
3,377.8 |
108.5 |
3.3% |
Key highlights in the supplementary budget include;
- The highest notable decline in expenditure was on the State Department of ICT, which saw a 2.3% decline in expenditure to Kshs 22.3 bn, from Kshs 22.8 bn in the previously approved estimates, attributable to a 30.0% decline in the allocation to ICT Infrastructure Connectivity to Kshs 2.5 bn, from the earlier approved estimate of Kshs 3.5 bn,
- The Ministry of Health recorded the highest increase in the supplementary budget allocation; increasing by 12.3% to Kshs 136.0 bn, from Kshs 121.1 bn. The increase in expenditure is mainly attributable mainly to an additional Kshs 14.1 bn set aside to cater for the establishment of Vaccine Form and Finish Facility, Modern Neuropsychiatric National Teaching and Referral Hospital, acquisition of Covid-19 vaccine, construction of new level III hospitals and also due to increased donor commitments. The funds are expected to help the government in combating COVID-19 and curb its spread, through the acquisition of more vaccines. The current vaccination rate for Kenya stands at 12.7%, that is, those who have received at least one dose of the COVID-19 vaccine,
- The State Department for Crop Development and Agricultural Research has seen its budget increased by Kshs 5.2 bn to Kshs 50.1 bn from the approved estimates of Kshs 44.9 bn with an additional Kshs 2.9 bn going towards Land and Crop Development while an additional Kshs 1.1 bn to be used on food security initiatives. The overall increase in the State Department for Crop Development and Agricultural Research represents a 11.5% increase from the original approved estimates,
- The infrastructure docket has seen its budget enhanced by Kshs 7.3 bn to Kshs 202.5 bn from the earlier approved Kshs 195.2 bn. The 3.7% increase is mainly attributable to an additional Kshs 17.4 bn committed towards the Road Maintenance Levy Fund for maintenance of roads. However, the increase was weighed down by Kshs 7.4 bn reduction in the budget allocation towards rehabilitation and construction of roads and bridges. Key to note, some of the road works that shall receive additional funding include the dualling of Nairobi Eastern Bypass, Garissa - Isiolo road and Nairobi- Nakuru Mau Summit road, construction of Makupa Causeway Bridge, and, upgrading of Lamu-Ijara-Garissa Road.
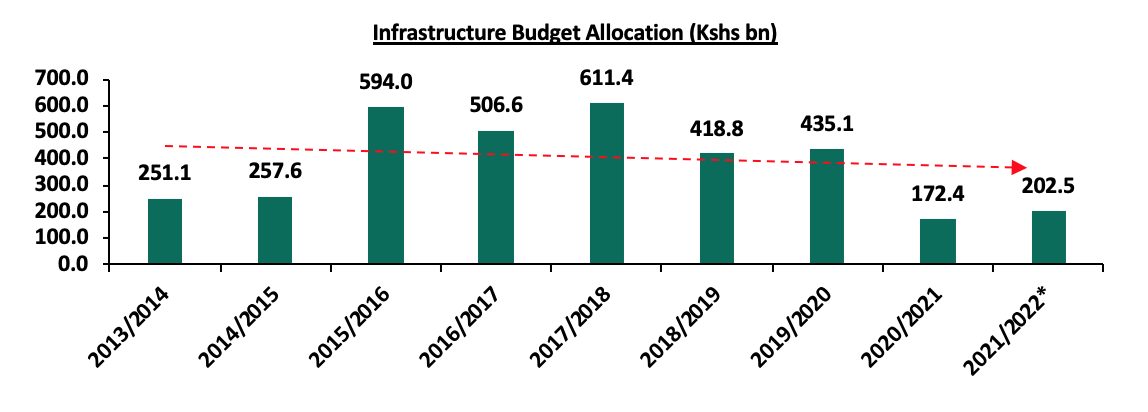
Overall, the budgetary allocation towards Infrastructure still remains lower than pre-COVID years as shown in the graph below, mainly due to the government’s increased allocation towards the fight of COVID-19 including vaccination drives, coupled with expenditure rationalization measures as part of the ongoing fiscal consolidation efforts,
- Consolidated Fund Services has seen a 1.3% decline in the estimates to Kshs 1.31 tn, from the initial Kshs 1.33 tn. This is attributable to a 22.9% decline in external debt redemptions to Kshs 202.1 bn from Kshs 262.1 bn in the previously approved estimate, with a notable decline being in the loan interests owed to Exim Bank of China by Kshs 19.3 bn to Kshs 54.1 bn from Kshs 73.4 bn. The reduction in debt repayments is attributable to the Debt Service Suspension Initiative (DSSI) which allowed Kenya to restructure some of its debts. Debt servicing expenses, on the other hand, increased by 8.0% to Kshs 605.3 bn, from Kshs 506.3 bn driven by Interest on domestic loans incurred in the 2021/22 fiscal year which was revised upwards to Kshs 479.2 bn, from Kshs 421.9 bn.
In our view, the proposal to allocate more funds to the Ministry of Health in order to combat COVID-19 more effectively is commendable given that we are still in the middle of a pandemic. We note that the revised estimates allocated towards the Independent Electoral and Boundaries Commission (IEBC) for conducting of the general elections stands at Kshs 23.2 bn, lower than the Kshs 40.7 bn allocated for the 2017 electoral related activities and the Kshs 24.2 bn allocated for the 2013 elections. The lower allocation may mean that we will see another supplementary budget and more funds assigned to IEBC, especially after the Commission noted that they require Kshs 40.1 bn for the 2022 general elections. Additionally, the increased expenditure estimates means that KRA will be under pressure improve on its revenue collection further despite the 104.3% outperformance recorded as of December 2021.
The approval of the 2021/22 supplementary budget will increase the fiscal deficit to an estimate of 12.9% of GDP, from the earlier estimated deficit of 11.4% of GDP for FY’2021/22. We expect the government to ramp up its revenue collection initiatives in the remaining 5 months of the current year as well as look increasingly to the domestic credit market to plug in the fiscal deficit; this may lead to possible destabilization of the interest rate environment albeit at a minimal level. Key to note, the government announced its intentions to float two Eurobonds by June 2022 for budgetary support – funds which will help the government meet its needs in the short term but make the fiscal consolidation plan harder to achieve in the medium term.
Monthly Highlights:
- The headline Purchasing Manager’s Index (PMI) for the month of December 2021 increased to 53.7, from 53.0 recorded in November 2021, pointing towards solid improvement of business activities and continued growth of new business. Notably, this is the highest PMI recorded since October 2020 when the index was 59.1, and it is attributable to upturn in sales and growth in cash flow on the back of continued economic recovery. Key to note, overall cost pressures in the Kenyan private sector increased sharply in December 2021 due to high input purchasing prices driven by higher taxes and higher raw material prices during the month. For more information, see our Cytonn Weekly #01/2022,
- The Kenya National Bureau of Statistics released the Quarterly Balance of Payments report for Q3’2021 report highlighting that Kenya’s balance of payments improved in Q3’2021, coming in at a deficit of Kshs 34.4 bn, from a deficit of Kshs 103.9 bn in Q3’2020. The improvement was mainly attributable to an 11.9% increase in the stock of gross official reserve to Kshs 1,064.2 bn from Kshs 951.0 bn in Q3’2020. The improvement was however weighed down by a 27.4% expansion of current account balance to Kshs 184.6 bn, from Kshs 145.0 bn in Q3’2020. For more information, see our Cytonn Weekly #01/2022 and our Q3’2021 BOP Note,
- The Kenya National Bureau of Statistics released the Quarterly Gross Domestic Product Report, highlighting that the Kenyan economy recorded a 9.9% growth in Q3’2021, down from a 10.1% growth in Q2’2021 but an increase from the 2.1% contraction recorded in Q3’2020, pointing towards continued economic recovery. Consequently, the average GDP growth rate for the 3 quarters in 2021 is a growth of 6.9%, an increase from the 0.8% contraction recorded during similar periods of review in 2020. For more information, see our Cytonn Weekly #01/2022 and our GDP Note,
- The World Bank released the Global Economic Prospects and the Sub–Saharan Africa outlook highlighting that the Kenyan economy is expected to grow by 5.0% in 2021 and 4.7% in 2022. The global economy is expected to grow by 4.1% in 2022 following an estimated 5.5% growth in 2021. The Sub-Saharan Africa’s economic growth is projected to expand by 3.1% in 2021 and 3.6% in 2022 supported by rising commodity prices as the region’s economic trading partners continue to reopen. For more information, see our Cytonn Weekly #02/2022.
- The National Treasury gazetted the revenue and net expenditures for the first six months of FY’2021/2022, highlighting that the total revenue collected as at the end of December 2021 amounted to Kshs 926.3 bn, equivalent to 52.2% of the original estimates of Kshs 1.8 tn and is 104.3% of the prorated estimates of Kshs 887.8 bn, while the total expenditure amounted to Kshs 1.4 tn, equivalent to 42.7% of the original estimates of Kshs 3.2 tn, and is 85.4% of the prorated expenditure estimates of Kshs 1.6 tn. For more information, see our Cytonn Weekly #02/2022, and,
- The Monetary Policy Committee (MPC) met on 26th January 2022 to review the outcome of its previous policy decisions and recent economic developments, and to decide on the direction of the Central Bank Rate (CBR). The MPC retained the CBR at 7.00%, in line with our expectations, for the twelfth consecutive time, after concluding that the current accommodative monetary policy stance remains appropriate. The Committee will meet again in March 2022, but remains ready to re-convene earlier if necessary. For more information, see our Cytonn Weekly #04/2022.
Rates in the fixed income market have remained relatively stable due to the high liquidity in the money market. The government is 10.1% ahead of its prorated borrowing target of Kshs 446.3 bn having borrowed Kshs 405.2 bn of the Kshs 658.5 bn borrowing target for the FY’2021/2022. We expect a gradual economic recovery as evidenced by the revenue collections of Kshs 926.3 bn in revenues during the first six months of the current fiscal year, which is equivalent to 104.3% of the prorated revenue collection target. However, despite the projected high budget deficit of 11.4% and the lower credit rating from S&P Global to 'B' from 'B+', we believe that the support from the IMF and World Bank will mean that the interest rate environment will remain stable since the government is not desperate for cash.
Markets Performance
During the month of January, the equities market was on a downwards trajectory, with NASI, NSE 20 and NSE 25 declining by 1.9%, 0.7% and 1.7%, respectively. The equities market performance was driven by losses recorded by large cap stocks such as Equity, Safaricom, Diamond Trust Bank (DTB-K) and KCB of 4.3%, 2.8%, 2.1% and 1.0%, respectively. The losses were however mitigated by gains recorded by BAT, Standard Chartered Bank, Bamburi and NCBA which gained by 6.0%, 2.9%, 2.4% and 1.6%, respectively.
During the week, the equities market was on an upward trajectory, with NASI, NSE 20 and NSE 25 gaining by 3.7%, 1.4% and 3.2%, respectively, taking their YTD performance to losses of 0.1% and 0.7% for NASI and NSE 20, respectively, while NSE 25 gained marginally by 0.04%. The equities market performance was driven by gains recorded by large cap stocks such as Equity Group, Safaricom, KCB, Bamburi, and Standard Chartered Bank of 5.5%, 5.0%, 4.9%, 3.6%, and 3.2%, respectively. The gains were however weighed by losses recorded by stocks such as Stanbic Holdings of 5.2%.
Equities turnover declined by 21.5% during the month to USD 72.7 mn, from USD 92.6 mn recorded in December 2021. Foreign investors remained net sellers during the month, with a net selling position of USD 3.7 mn, compared to December’s net selling position of USD 25.5 mn.
During the week, equities turnover increased by 19.9% to USD 27.7 mn, from USD 23.1 mn recorded the previous week, taking the YTD turnover to USD 95.3 mn. Foreign investors turned net buyers, with a net buying position of USD 4.6 mn, from a net selling position of USD 1.3 mn recorded the previous week, taking the YTD net selling position to USD 0.8 mn.
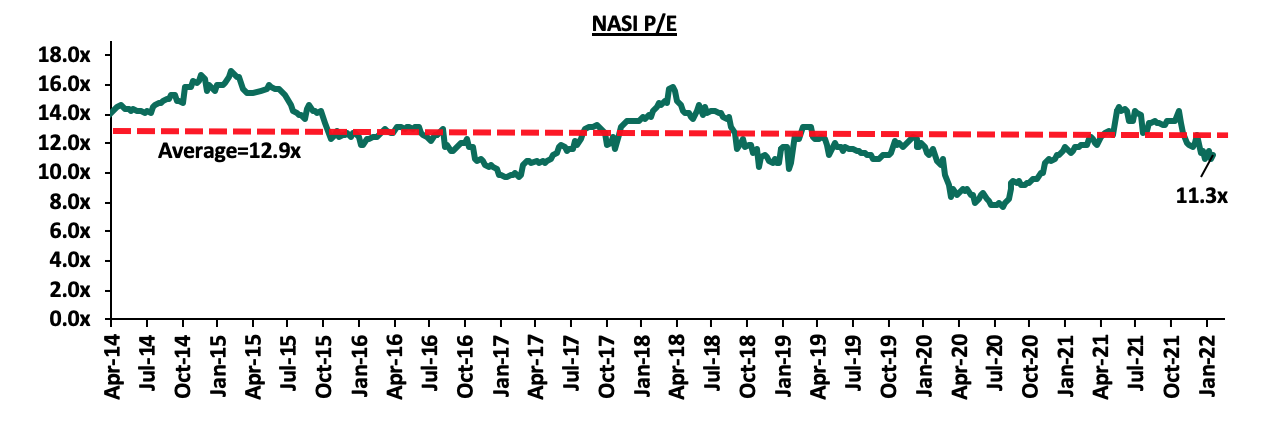
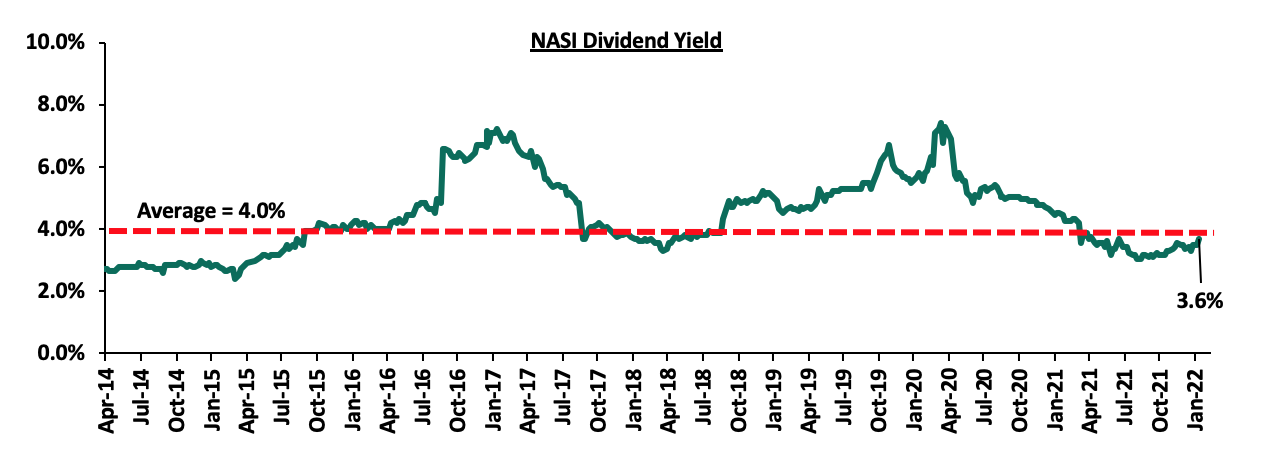
The market is currently trading at a price to earnings ratio (P/E) of 11.3x, 12.4% below the historical average of 12.9x, and a dividend yield of 3.6%, 0.4% points below the historical average of 4.0%. Key to note, NASI’s PEG ratio currently stands at 1.5x, an indication that the market is trading at a premium to its future earnings growth. Basically, a PEG ratio greater than 1.0x indicates the market may be overvalued while a PEG ratio less than 1.0x indicates that the market is undervalued. The current P/E valuation of 11.3x is 46.9% above the most recent trough valuation of 7.7x experienced in the first week of August 2020. The charts below indicate the historical P/E and dividend yields of the market.
Monthly highlights
- The International Finance Corporation (IFC) disclosed that it would disburse USD 165.0 mn (Kshs 18.6 bn) to Equity Bank Kenya Limited in form of a 7-year Tier 2 subordinated loan. This amount is expected to be used to shore up the Bank’s Tier 2 capital and for onward lending to climate smart projects and Small and Medium Enterprises (SMEs) in Kenya. For more information, please see our Cytonn Weekly #01/2022,
- Equity Group Holdings (EGH), announced the completion of the incorporation of a subsidiary, Equity Group Insurance Holdings Limited, a non-operating insurance holding company and issuance of a life insurance license to Equity Life Assurance Kenya (ELAK) Limited. ELAK, which is fully owned by Equity Group Insurance Holdings Limited, will conduct and undertake long-term insurance business in Kenya. This came after EGH obtained the prerequisite approvals from its shareholders and the Central Bank of Kenya (CBK), before subsequent registration and licensing from the Insurance Regulatory Authority (IRA) on 10th January 2022. For more information, please see our Cytonn Weekly #02/2022, and,
- The Central Bank of Kenya (CBK) recently released the Quarterly Economic Review for the period ending 30th September 2021, highlighting that the banking sector’s total assets increased by 10.6% to Kshs 5.8 tn, from Kshs 5.3 tn in September 2020. The sector’s Profit before Tax (PBT) increased by 68.2% to Kshs 49.1 bn, from Kshs 29.2 bn recorded in September 2020. For more information, please see our Cytonn Weekly #04/2022.
Universe of coverage:
|
Company |
Price as at 28/01/2022 |
Price as at 04/02/2022 |
w/w change |
m/m change |
YTD Change |
Year Open 2022 |
Target Price* |
Dividend Yield |
Upside/ Downside** |
P/TBv Multiple |
Recommendation |
|
Kenya Reinsurance |
2.2 |
2.2 |
0.0% |
(1.7%) |
(3.1%) |
2.3 |
3.3 |
9.0% |
58.4% |
0.2x |
Buy |
|
Jubilee Holdings |
302.3 |
300.0 |
(0.7%) |
(4.2%) |
(5.3%) |
316.8 |
371.5 |
3.0% |
26.8% |
0.5x |
Buy |
|
I&M Group*** |
21.0 |
21.1 |
0.2% |
(0.5%) |
(1.6%) |
21.4 |
24.4 |
10.7% |
26.5% |
0.6x |
Buy |
|
Sanlam |
9.7 |
9.7 |
0.4% |
(15.7%) |
(15.7%) |
11.6 |
12.1 |
0.0% |
24.3% |
1.0x |
Buy |
|
Britam |
7.0 |
7.1 |
0.6% |
(5.1%) |
(6.6%) |
7.6 |
8.3 |
0.0% |
18.2% |
1.2x |
Accumulate |
|
Stanbic Holdings |
92.0 |
87.3 |
(5.2%) |
3.2% |
0.3% |
87.0 |
94.7 |
4.4% |
12.9% |
0.8x |
Accumulate |
|
Liberty Holdings |
7.0 |
6.9 |
(1.4%) |
(4.9%) |
(2.3%) |
7.1 |
7.8 |
0.0% |
12.7% |
0.5x |
Accumulate |
|
KCB Group*** |
44.8 |
47.0 |
4.9% |
(1.0%) |
3.2% |
45.6 |
51.4 |
2.1% |
11.4% |
1.0x |
Accumulate |
|
Standard Chartered*** |
131.8 |
136.0 |
3.2% |
2.9% |
4.6% |
130.0 |
137.7 |
7.7% |
9.0% |
1.1x |
Hold |
|
NCBA*** |
25.4 |
25.8 |
1.4% |
1.6% |
1.2% |
25.5 |
26.4 |
5.8% |
8.3% |
0.6x |
Hold |
|
Co-op Bank*** |
13.0 |
13.0 |
0.4% |
0.0% |
0.0% |
13.0 |
13.1 |
7.7% |
8.2% |
1.0x |
Hold |
|
Equity Group*** |
50.3 |
53.0 |
5.5% |
(4.3%) |
0.5% |
52.8 |
56.6 |
0.0% |
6.8% |
1.4x |
Hold |
|
Diamond Trust Bank*** |
58.5 |
60.0 |
2.6% |
(2.1%) |
0.8% |
59.5 |
61.8 |
0.0% |
3.0% |
0.3x |
Lighten |
|
ABSA Bank*** |
11.8 |
11.9 |
1.3% |
0.0% |
1.3% |
11.8 |
11.9 |
0.0% |
0.1% |
1.2x |
Lighten |
|
CIC Group |
2.2 |
2.3 |
0.4% |
(1.8%) |
3.7% |
2.2 |
2.0 |
0.0% |
(9.2%) |
0.8x |
Sell |
|
HF Group |
3.6 |
3.6 |
0.3% |
(12.1%) |
(5.5%) |
3.8 |
3.0 |
0.0% |
(17.7%) |
0.2x |
Sell |
|
*Target Price as per Cytonn Analyst estimates **Upside/ (Downside) is adjusted for Dividend Yield ***For Disclosure, these are stocks in which Cytonn and/or its affiliates are invested in |
|||||||||||
We are “Neutral” on the Equities markets in the short term. With the market currently trading at a premium to its future growth (PEG Ratio at 1.5x), we believe that investors should reposition towards value stocks with strong earnings growth and that are trading at discounts to their intrinsic value. We expect the discovery of new COVID-19 variants, the upcoming Kenyan general elections and the slow vaccine rollout to continue weighing down the economic outlook. On the upside, we believe that the relaxation of the lockdown measures in the country will lead to improved investor sentiments in the economy.
- Industry Reports
During the week, Hass Consult, a Real Estate development and consulting firm, released the House Price Index Q4’2021, a report highlighting the residential market performance of various nodes in the Nairobi Metropolitan Area (NMA). The following were the key take outs from the report;
- The average selling prices for properties within the NMA recorded a q/q increase of 3.0% and a y/y increase of 3.1%, respectively, mainly driven by the improved performance of the detached units which realized a 4.9% q/q and 5.9% y/y increase in their selling prices,
- Westlands was the best performing node in the Nairobi suburbs recording a q/q capital appreciation of 3.0%, mainly attributed to adequate infrastructure and amenities, presence of high end income earners with the capability to purchase the properties, and its nearness to the Nairobi CBD. On the other hand, Runda recorded the highest price correction of 0.9% due to declined demand emanating from high prices which prompted people to look for affordable alternatives. For satellite towns, Ngong recorded the highest q/q price appreciation at 3.5% as a result of affordability and increased infrastructure developments such as Ngong Road, whereas Tigoni realized the highest price correction of 1.9% as a result of a declined demand for housing units, and,
- Average asking rents recorded a 0.2% q/q growth, with Ridgeways being the best performing node within the Nairobi suburbs with a 2.5% q/q rent increase attributed to its serene location and availability of good infrastructure, whereas the rental rates in Gigiri recorded a 1.9% decline as more focus is on buying of properties. The selling prices in Gigiri increased by 5.5% on a q/q basis. For satellite towns, Ruiru realized the highest q/q increase in rents at 3.1%, attributed to increased demand resulting from improving infrastructure developments, coupled with the presence of growing middle income earners in the area, whereas Kitengela realized a 2.2% q/q rent decline as a result of declined demand for rental units.
The findings of the report are in line with our Cytonn Annual Markets Review 2021 which highlighted that the average selling prices for houses within the Nairobi Metropolitan Area appreciated by 1.6% to Kshs 119,494 per SQM in 2021, from Kshs 116,774 per SQM in 2020. Average total return to investors came in at 6.1%, an increase from the 4.7% recorded in FY’2020. On a q/q basis, the average total returns improved by 0.6% points from the 5.5% recorded in Q3’2021. The overall improvement in performance was attributed to a general improvement in Real Estate transactions fueled by increased demand, coupled with improved investor confidence in the residential market.
Hass Consult also released the Land Price Index Q4’2021, a report highlighting the performance of the Land Sector in the Nairobi Metropolitan Area. Key take outs from the report include;
- Overall asking prices for land within the NMA increased by 0.9% on a q/q basis and 3.9% on a y/y basis as result of increased demand fueled by increased infrastructure developments opening up areas for investments, as well as positive demographic with Kenya’s urbanization and population growth rates currently being at 4.0% p.a and 2.3% p.a, respectively, against the global average of 1.8% p.a and 1.0% p.a, respectively according to the World Bank,
- Satellite towns recorded the highest capital appreciation on both q/q and y/y basis at 1.4% and 6.7%, respectively, mainly attributed to their affordability thus driving demand. Kiserian was the best performing node with a q/q price appreciation of 5.2% and a 19.0% y/y increase, as a result of its low entry point compared to its peers such as Rongai, and in turn making it more attractive to speculators, and,
- Land prices of Nairobi suburbs recorded capital appreciations of 0.3% on a q/q basis and 1.2% on a y/y basis. Spring Valley was the best performing node with a price increase of 5.6% over the quarter and 10.0% over the year, mainly attributed to its good infrastructure driving demand such as Shanzu road.
The findings of the report are in line with our Cytonn Annual Markets Review 2021 which highlighted that the Nairobi Metropolitan Area land sector recorded an average annualized capital appreciation of 2.8% in FY’2021, due to; i) the implementation and conclusion of vast infrastructure projects promoting accessibility and opening up areas for Real Estate investments, ii) efforts by the government to improve land transactions facilitated by the launching of the National Land Information Management System (NLIMS), and, iii) Kenya’s relatively high urbanization and population growth rates of 4.0% p.a and 2.3% p.a, respectively, against the global average of 1.8% p.a and 1.0% p.a, respectively, thus driving increased demand for development land. Satellite towns recorded the highest appreciations at 4.8% over the year as a result of their affordability thus driving demand.
Other notable reports were released during the month were as follows:
|
# |
Theme |
Report |
Key Take-outs |
|
1 |
General Real Estate |
Leading Economic Indicators November 2021 by the Kenya National Bureau of Statistics (KNBS) |
|
|
Quarterly Economic Review July-September 2021 by the Central Bank of Kenya (CBK) |
|
||
|
Q3'2021 GDP Report by the Kenya National Bureau of Statistics (KNBS) |
|
The overall Real Estate sector performance continues to record improved performance supported by; i) increased development activities thereby supporting the overall growth of the sector, ii) increased demand for residential units, iii) increased tourism arrivals thereby boosting performance of hotels and serviced apartments, and, iv) investor confidence in the land sector which has continued to show resilience despite the pandemic. However, we expect financial constraints to continue hindering construction activities in the sector as banks might limit lending capacities to developers as result of the increasing loan default rates, evidenced by the growth in NPLs in the Real Estate sector which recorded a 5-year CAGR of 26.5% to Kshs 69.2 bn in Q3’2021, from Kshs 21.4 bn in Q3’2016.
- Residential Sector
Following the recent approval granted by the Capital Markets Authority (CMA) to Kenya Mortgage Refinance Company (KMRC) to float a Kshs 10.5 bn Medium Term Note (MTN) programme, during the week, KMRC released the Information Memorandum of the MTN. As highlighted in our Cytonn Weekly #02/2022, KMRC aims at raising a total of Kshs 1.4 bn during the first tranche of issuance, which will be disbursed to participating primary mortgage lenders (PMLs), such as banks, microfinance institutions and Savings and Credit Cooperatives (SACCOs) at a 5.0% rate, for onward lending to homebuyers at single digit rates.
The table below shows the particulars of the MTN;
|
Description of Note |
|
|
Issuer |
Kenya Mortgage Refinance Company (KMRC) |
|
Trustee |
Ropat Trust Company Ltd |
|
Aggregate Nominal Amount |
Kshs 10.5 bn |
|
Issue Date |
4th March 2022 |
|
Listing Date |
14th March 2022 |
|
Tranche 1 |
Kshs 1.4 bn |
|
Interest Rates |
12.5% p.a payable semi-annually in arrears |
|
Placing Agent |
NCBA Investment Bank Ltd. |
|
Receiving Bank |
KCB Bank Kenya Ltd. |
|
Specified Denomination |
Kshs 100,000 with integral multiples of Kshs 100,000 thereof |
|
Tenor |
7 years amortizing, with a Weighted Average Life of 4.5 years |
|
Interest on Late Payments |
Initial Interest Rate plus a margin of 2.0% p.a to trade creditors |
|
Credit Rating |
GCR-AA+AA- (Highest certainty of timely payment of obligations) |
|
Default |
In case of default, issuer commences negotiations with any one or more of its creditors with a view to the general readjustment or rescheduling of its indebtedness. N/B; Trade creditors not mentioned |
Source; Kenya Mortgage Refinance Company (KMRC)
Based on the updated information memorandum, KMRC updated their financial statements as at Q3’2021 highlighting that their total operating income came in at Kshs 466.9 mn in Q3’2021, representing a 52.6% increase from the Kshs 221.1 mn realized in FY’2020. Total operating profits came in at Kshs 107.9 mn in Q3’2021, a 28.5% increase from the Kshs 77.2 mn profit recorded in FY’2020 as a result of increased revenues realized in the period of focus, from avenues such as bonds. KMRC is likely to record an increase in the overall borrowings evidenced by the additional draw down that it made in January 2022 worth Kshs 2.3 bn on a national treasury loan facility, and the Kshs 12.3 bn medium term note. As at Q3’2021, total borrowings increased by 79.8% to Kshs 6.7 bn, from Kshs 3.7 bn in 2020. With KMRC offering an interest rate of 12.5% from the MTN and lending at 5.0% rate, this will lead to a negative spread of (7.5%). Despite KMRC indicating that the mix of the concessional loans from the World Bank and the funds from the capital market will sustain their lending model, we doubt that is sustainable and` KMRC will be able to issue bonds at 12.5% and lend at 5.0% for the foreseeable future.
Notable highlights in the sector during the month include;
- The Kenya Mortgage Refinance Company (KMRC), a treasury backed lender, announced that it had made an additional drawdown worth Kshs 2.8 bn on a national treasury loan facility, for onward lending to primary mortgage lenders. For more information, see Cytonn Weekly #04/2022,
- The Country Government of Mombasa announced plan to construct 3,200 housing units in Likoni. This is after 348 residents of Likoni Flats Estate agreed to move out of their dilapidated houses which were constructed in 1973 to allow for the construction of new units. For more information, see Cytonn Weekly #04/2022,
- Mr Charles Hinga, the Principal Secretary for the State Department of Housing and Urban Development, signed a Memorandum of Understanding (MoU) with Seascan Development Limited, a Real Estate developer, to construct 4900 affordable housing units in the project dubbed Mowlem Estate in Nairobi’s Dandora area, at a cost of Kshs 18.0 bn. For more information, see Cytonn 2022 Markets Outlook,
- The Kenya Mortgage Refinance Company, a treasury backed lender, got approval from the Capital Markets Authority (CMA) to roll out a Kshs 10.5 bn medium-term bond programme. The firm aims at raising a total of Kshs 1.4 bn during the first tranche of issuance, which will be disbursed to participating primary mortgage lenders (PMLs), such as banks, microfinance institutions and Savings and Credit Cooperatives (SACCOs) at a 5.0% rate, for onward lending to homebuyers at single digit rates. For more information, see Cytonn Weekly #02/2022,
- The United States Embassy announced plans to lease a 90-unit gated estate in Rosslyn comprising of both apartments and town houses dubbed ‘OBO Kenya Diplomatic Housing’ for its staff. The US Embassy will lease the development for a period of eight years at a cost of Kshs 4.3 bn with the estimated first year’s rental income being Kshs 533.8 mn. For more information, see Cytonn Weekly #1/2022, and,
- The National Environmental Management Authority (NEMA), gazetted the proposed development of three hostel buildings with a capacity to accommodate 4,842 students valued at Kshs 3.6 bn. The project will be overseen by Acorn Holdings, a student housing developer, who incorporated three limited liability partnerships to develop the student accommodation facilities. For more information, see Cytonn Weekly #1/2022.
We expect the residential sector to continue recording more development activities driven by; i) improved investor confidence in the sector, ii) positive demographics driving demand for housing units, iii) efforts by the government to make mortgages available through KMRC, and, iv) increased infrastructure developments opening various areas for investments and accessibility.
- Retail Sector
During the week, QuickMart Supermarket, a local retail chain opened a new outlet at OBC Kitengela Mall, bringing its total operational stores to 48. This also marks the retailer’s first store to be opened this year, and also the first store to be opened in the town which was being served by other retailers such as Naivas and Eastmatt. The move to open the new store in Kitengela is driven by; i) positive demographics, with Kajiado County where Kitengela lies currently having a population growth rate of 4.6% against Kenya’s 2.3%, and, ii) strategic location of the mall along the Nairobi-Namanga road which enhances easy accessibility to the store. In terms of performance, according to our Cytonn Annual Markets Review 2021, satellite towns where Kitengela lies recorded average rents per SQFT of Kshs 142 compared to the market average of Kshs 170 per SQFT, hence supporting the retailer’s decision to open the new store in the area due to affordability.
The table below shows the submarket performance of nodes in the Nairobi Metropolitan Area (NMA):
|
Nairobi Metropolitan Area Retail Market Performance FY’2021 |
|||
|
Area |
Rent Kshs /SQFT FY’2021 |
Occupancy% FY’2021 |
Rental Yield FY’2021 |
|
Westlands |
213 |
78.8% |
10.0% |
|
Karen |
202 |
84.0% |
9.8% |
|
Kilimani |
183 |
86.0% |
9.8% |
|
Ngong Road |
171 |
79.0% |
7.7% |
|
Kiambu road |
180 |
74.2% |
7.7% |
|
Mombasa road |
148 |
75.0% |
6.8% |
|
Thika Road |
161 |
74.0% |
6.7% |
|
Satellite towns |
142 |
69.0% |
6.2% |
|
Eastlands |
133 |
71.6% |
5.6% |
|
Average |
170 |
76.8% |
7.8% |
Source: Cytonn Research 2021
The table below shows the summary of the number of stores of the Key local and international retailer supermarket chains in Kenya;
|
Main Local and International Retail Supermarket Chains |
||||||||||
|
Name of Retailer |
Category |
Highest number of branches that have ever existed as at FY’2018 |
Highest number of branches that have ever existed as at FY’2019 |
Highest number of branches that have ever existed as at FY’2020 |
Highest number of branches that have ever existed as at FY’2021 |
Number of branches opened in 2022 |
Closed branches |
Current number of Branches |
Number of branches expected to be opened |
Projected number of branches FY’2022 |
|
Naivas |
Local |
46 |
61 |
69 |
79 |
0 |
0 |
79 |
1 |
80 |
|
QuickMart |
Local |
10 |
29 |
37 |
47 |
1 |
0 |
48 |
0 |
48 |
|
Chandarana |
Local |
14 |
19 |
20 |
22 |
0 |
0 |
22 |
1 |
23 |
|
Carrefour |
International |
6 |
7 |
9 |
16 |
0 |
0 |
16 |
0 |
16 |
|
Cleanshelf |
Local |
9 |
10 |
11 |
12 |
0 |
0 |
12 |
0 |
12 |
|
Tuskys |
Local |
53 |
64 |
64 |
3 |
0 |
61 |
3 |
0 |
3 |
|
Game Stores |
International |
2 |
2 |
3 |
3 |
0 |
0 |
3 |
0 |
3 |
|
Uchumi |
Local |
37 |
37 |
37 |
2 |
0 |
35 |
2 |
0 |
2 |
|
Choppies |
International |
13 |
15 |
15 |
2 |
0 |
13 |
2 |
0 |
2 |
|
Shoprite |
International |
2 |
4 |
4 |
0 |
0 |
4 |
0 |
0 |
0 |
|
Nakumatt |
Local |
65 |
65 |
65 |
0 |
0 |
65 |
0 |
0 |
0 |
|
Total |
257 |
313 |
334 |
186 |
1 |
178 |
187 |
2 |
189 |
|
Source: Online Search
Additionally, Optica Limited, a local eye-wear retailer opened a new outlet at Viashla center in Ruiru Kamakis. This brings the retailer’s total outlets to 54, in its expansion strategy to reach out its products and services to target customers. The move to open the new outlet in Ruiru is driven by; i) strategic location of the store along the greater Eastern Bypass, ii) availability of prime retail space for uptake, and, iii) demand of eye wear as the public is also adopting prescription sunglasses for vision correction and protection from UV rays. In terms of performance, Thika Road where Ruiru lies recorded average rents per SQFT of Kshs 161 compared to the market average of Kshs 170 per SQFT, according to our Cytonn Annual Markets Review 2021, thus, the retailer is leveraging on affordability of the area.
We expect the retail sector to continue witnessing expansion activities by local and international retailers such as Naivas, QuickMart, Optica, and Carrefour. This will be driven by factors such as; i) positive demographics, ii) infrastructure developments opening up areas for accessibility and investments, as well as, iii) the improved business environment promoting transactions and activities. However, the existing oversupply at 1.7 mn SQFT in the Kenyan retail sector and 3.0 mn SQFT in the NMA retail sector, the growing popularity of e-commerce, and, business uncertainties brought about by the incoming elections, is expected to weigh down the performance of the sector.
- Mixed Use Developments
Notable highlight during the month include;
- CCI Group of companies, a business process outsourcing (BPO) provider, and, nutrition supplements distributor Max International took up approximately 60.0% of the 270,000 SQFT space at Garden City Business Park along Thika Road. CCI and Max International are taking up six-and-a-half floors, and, half-a-floor, respectively, at the business park with East Africa Breweries limited having being the other corporate giant that took up space at the development in November 2019. For more information, see Cytonn Weekly #02/2022.
- Hospitality Sector
Notable highlights during the month include;
- The United Arab Emirate (UAE) retained Kenya in its ‘Red List’ of countries barred from visiting UAE, with other countries such as Ghana, Angola, Uganda, Guinea and Cote d’Ivoire allowed admission to the middle-eastern state in its latest review. For more information, see Cytonn 2022 Markets Outlook. However, key to note is that Kenya is currently not on the red list after having been removed by UAE on 27th January, and,
- The Kenyan government suspended all inbound and transit passenger flights from the United Arabs Emirates (UAE) for seven days effective 10th January. Additionally, the United States of America (USA), raised Kenya’s travel advisory alert from Level One to Level Three, amidst concerns of the increasing COVID-19 infections following the emergence of the Omicron variant. For more information, see Cytonn Weekly #02/2022.
- Infrastructure
During the week, the national government through the Kenya Railways Corporation announced plans to revamp select dilapidated railway lines in the country namely; i) 217.0Km Nakuru-Kisumu Meter Gauge Railway (MGR), ii) 77.8Km Gilgil-Nyahururu MGR line, and, iii) 69.1Km Kisumu-Butere railway line, at a cost of Kshs 4.5 bn. According to Kenya Railways, a total of Kshs 3.0 bn has been set aside to rehabilitate the Nakuru –Kisumu MGR, whereas Kshs 1.0 bn and Kshs 0.5 bn have been set aside to rehabilitate the Gilgil-Nyahuru and Kisumu-Butere lines, respectively. Upon completion of the projects, the three railway lines will;
- Act as main transport shipment points between the Standard Gauge Railway Line, and road for freight traffic destined for areas beyond Naivasha,
- Increase trade activities in the surrounding regions, and,
- Increase property investments in the surrounding regions through eased accessibility, as well as boosting prices for existing properties.
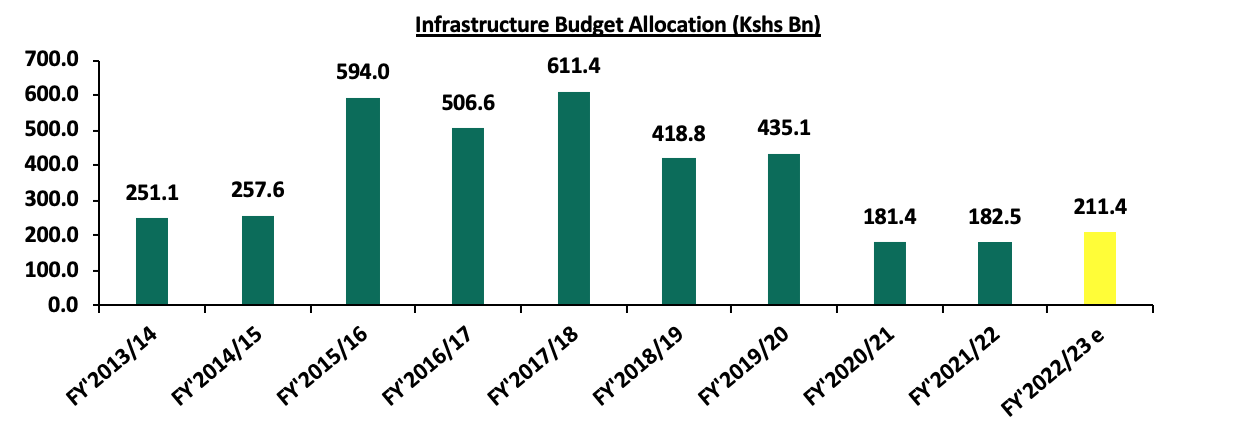
The government through its various entities such as the Kenya National Highways Authority and Kenya Railways Corporation, among others, continue to realize and implement various infrastructure projects in order to better the performance of the economy. Some of the ongoing projects include; i) Nairobi Commuter Rail Project, ii) Nairobi Expressway, and, iii) The Western Bypass, among many others. To achieve this, the government has implemented various measures in order to ensure the continuity and completion of projects such as; i) Public Private Partnerships, ii) issuing of infrastructure bonds, and, iii) priority of projects through budget allocations. In light of this, we expect an increase in the budget allocation for the infrastructure sector to Kshs 211.4 bn in FY’2022/23, 15.8% higher than the Kshs 182.5 bn allocation in FY’2021/22 according to the 2022 Draft Budget Policy Statement. The graph below shows the budget allocation to the infrastructure sector over last nine financial years;
Source: National Treasury of Kenya
Other notable highlights during the month include;
- The national government announced that it has begun the documentation processes for dualing of the 40 Km Mtwapa-Kilifi Road. This will be part of the 460 Km Malindi-Tanga-Bagamoyo East African corridor development project, a transnational highway between Kenya and Tanzania. For more information, see Cytonn Weekly #04/2022, and,
- The government of Kenya through the Kenya Rural Roads Authority (KERRA) announced that it has begun upgrading to Bitumen Standards the Mago-Mululu - Wangulu (E240) & Lusui - Vokoli (E293) Roads. For more information, see Cytonn 2022 Markets Outlook.
We expect continued construction, revamp, and completion of various projects in the infrastructure sector due to government’s aggressive focus to initiate, implement and conclude projects.
- Listed Real Estate
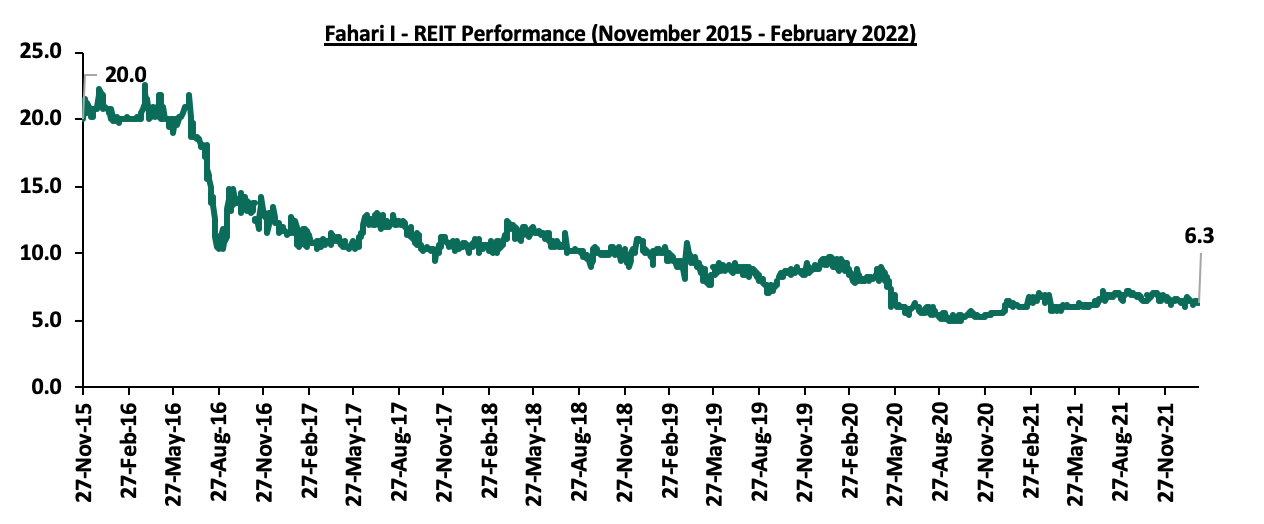
In the Nairobi Stock Exchange, ILAM Fahari I-Reit closed the week trading at an average price of Kshs 6.3 per share. This represented a 3.1% and 1.6% Week-to-Date (WTD) and Year-to-Date (YTD) decline, respectively, from Kshs 6.5 per share and Kshs 6.4 per share, respectively. On Inception-to-Date (ITD) basis, the REIT’s performance continues to be weighed down having realized a 68.5% decline from Kshs 20.0. In the Unquoted Securities Platform, Acorn DREIT closed the week trading at Kshs 20.2 while the I-REIT closed at Kshs 20.6 per unit. This performance represented a 1.0% and 3.0% gain for the DREIT and I-REIT, respectively, from the Kshs 20.0 Inception price. Kenyan REIT market performance continues to be weighed down by; i) a general lack of knowledge on the financing instrument, ii) general lack of interest of the REIT by investors, and, iii) lengthy approval processes to get all the necessary requirements thus discouraging those interested in investing in it. The graph below shows Fahari I-REIT’s performance from November 2015 to February 2022:
We expect the Kenyan Real Estate sector to continue recording increased activities driven by; i) improved economic environment promoting growth of the sector, ii) increased residential development activities, iii) aggressive expansion by local and international retail chains, iv) increased tourism arrivals thereby boosting performance of hotels and serviced apartments, v) more development activities and demand for MUD’s as a result of their convenience, vi) investor confidence in the land sector which has continued to show resilience despite the pandemic, and vii) government’s continued focus on the infrastructure developments that drive property investments. Despite this, the increasing Real Estate NPLs, emergence of new COVID-19 variants, the low of investor appetite in REITs, and, the incoming elections accompanied by uncertainties, is expected to weigh down performance of the sector.
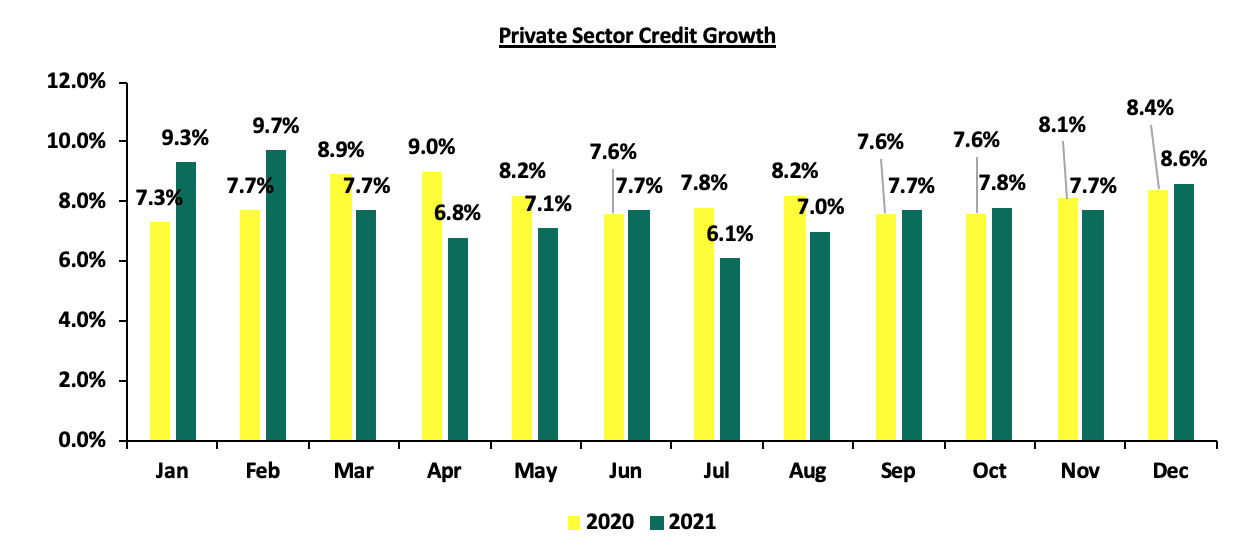
According to the Central Bank of Kenya (CBK), the private sector credit growth declined in 2021 coming in at an average of 7.8%, in comparison to the 8.0% recorded in 2020 partly due to the cautious lending strategy adopted by banks during the COVID-19 operating environment. High cost of credit remains one of the main challenges that hinders credit growth with the big banks charging a higher cost of credit in comparison to smaller banks reflecting their strong pricing power based on a wide distribution network, multiple services and well established brands. On the other hand, small banks have to compete for customers by offering relatively cheaper credit in order to grow their loan book. According to the Kenya Bankers Association cost of credit calculator, ABSA Bank topped the list of most expensive banks charging a total of Kshs 14.3% for a 1.0 mn loan over a period of 1 year as of March 2021. On the other hand, Bank of Baroda ranked as the cheapest bank charging Kshs 6.1% for the same loan purely as interest charges with no additional charges. In this topical, we shall analyze Kenya’s cost of credit amid the pandemic environment and cover the following;
- Introduction to credit in Kenya,
- Accessibility to Credit,
- Effects of interest rate on credit,
- Analysis of the true cost of credit, and,
- Conclusion
Section 1: Introduction to Credit in Kenya
- Introduction
Credit is a contractual agreement between a lender and a borrower where the lender agrees to advance a certain sum of money to the borrower and the borrower, in return, agrees to repay the money at a future date with an interest on the principal amount. Cost of credit on the other hand, refers to all costs related to the issuance of credit, including interest and any fees tied to acquiring credit, usually expressed by the Annual Percentage Rate (APR), a metric that factors in additional costs and fees on the annual interest rate. Credit growth is defined as an increase in loans for the private sector, individuals, and government agencies. When credit becomes more available, consumers can borrow and spend more, while businesses can borrow and invest.
The Kenyan credit market has seen significant growth over the last five years with net domestic credit extended by commercial banks increasing by a 5-year CAGR of 11.0% to Kshs 3.4 tn in Q3’2021, from Kshs 3.1 tn in Q3’2017, mainly supported by increased net lending to the government and the private sector. Despite this growth, it is important to note that Kenya’s private sector credit growth has faced some challenges that have continued to hamper its growth. During the interest rates cap, the private sector credit growth was at its lowest, growing by 3.7%, lower than the 16.0% average growth recorded a year before. In 2020, following the emergence of the COVID 19 pandemic, credit growth remained subdued as most banks shied away from lending to customers on the back of the elevated credit risk. Notably, the average loan growth came in at 11.7%, slower than the 12.8% recorded in FY’2019 and slower than the 26.3% growth in government securities, an indication of banks’ preference of investing in Government securities as opposed to lending due to the elevated credit risk occasioned by the pandemic.
The graph below compares the private sector credit growth in 2020 and 2021:
- Initiatives put in place to promote credit growth
Given the changing economic environment, the Central Bank of Kenya (CBK), in collaboration with other stakeholders, has pursued a variety of initiatives ranging from licensing of new products, regulatory reforms, technological innovations and public education to promote credit growth in Kenya. Some of the initiatives include;
- Retaining the Central Bank Rate (CBR) at 7.00% and lowering the Cash Reserve Ratio to 4.25% - The accommodative monetary policies adopted by the Monetary Policy Committee (MPC) since March 2020, have continued to support the country’s economic growth. The lowering of the CRR to25% from 5.25% injected approximately Kshs 35.2 bn in additional liquidity to commercial banks for onward lending to distressed borrowers and to also supporting lending to the tourism, trade and transport and communication, Real Estate, manufacturing and agriculture sectors. As at the end of 2021, Private sector credit growth had increased to 8.6%, from 8.4% recorded in December 2020,
- Regulatory reforms by the Central Bank of Kenya (CBK) – In 2017, the Banking Act was amended to include heavy penalties wherein commercial banks became subject to incur a penalty of up to a maximum of Kshs 20.0 mn, from the previous Kshs 5.0 mn, for failure to disclose the true cost of credit to consumers. As a result, consumers are now better able to understand the terms of the debt they are taking on, the potential consequences of defaulting, and are able to compare different loan products and make informed credit decisions. Additionally, the Kenya Bankers Association (KBA) in collaboration with the Central Bank of Kenya (CBK) introduced a credit cost calculation website in which commercial banks and micro-finance institutions are required to publish their true cost of credit. This has promoted full disclosure of bank charges and fees to facilitate informed banking decisions by the public,
- Alternative sources for government funding– The Kenyan Government has pursued alternative funding sources such as the Sovereign Bonds and has adopted reforms to improve government spending as evidenced by the Kshs 1.0 bn Kenya Eurobond issued on 17th June, 2021. The government also intends to issue two more Eurobonds by June 2022 to help fund the FY'2021/2022 budget. As such, banking institutions have to increase their lending to the private sector given that the government reduces its borrowing from banks and consequently reduces competition with private sector borrowing, and,
- Introduction of Annual Percentage Rate (APR) for loans – The Kenya Bankers Association rolled out the APR in 2014 which converts all direct costs associated with the loan into a single figure. Consequently, borrowers can use the APR to compare different loan products on a like-for-like basis, based on the total cost of the facility, and make more informed credit decisions.
- Hindrances to Private Sector Credit growth
Despite the initiatives put in place by the government and other stakeholders to promote private sector credit growth, the sector is still not performing as expected mainly due to;
- High cost of credit – In addition to the interest, there are other costs associated to credit that range from bank fees and charges to third party costs, such as legal fees, insurance and government levies. The high costs and associated overheads have to be borne by fewer borrowers hence this poses constraint to private sector credit growth,
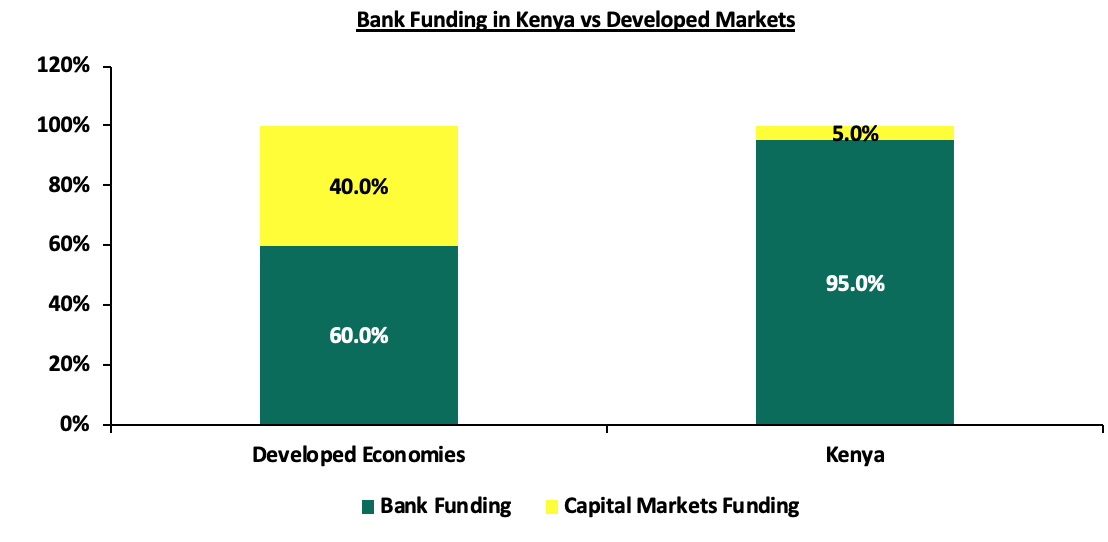
- Lack of alternative sources of funding – According to World Bank data, in more developed markets, both regulated and unregulated capital markets contribute about 60.0% of all business funding and the remaining 40% of capital coming from banks. However, in Kenya businesses funding largely rely on bank funding and according to the Capital Markets Authority Soundness Report Q4’2020, the regulator, CMA, highlighted that funding from the capital markets in Kenya stood at 5.0%, with the banking sector taking up 95.0% of the funding for businesses. This shows that our capital markets remain subdued compared to other economies, and access to funding remains a concern. The upshot is that there is banking dominance in Kenya, which then makes capital hard to access, and when accessed it is expensively priced. The chart below compares bank funding in Kenya and developed markets;
- Low financial literacy which impede informed financial decisions – Borrowers require sufficient financial knowledge to be able to access credit. This enables them to look for the lowest interest rates when comparing loan terms, and hence incur lesser cost of borrowing money. Additionally, financial literacy can assist debtors in determining the best ways to get out of debt, better use of credit and ways of getting out of credit
Section 2: Accessibility to Credit
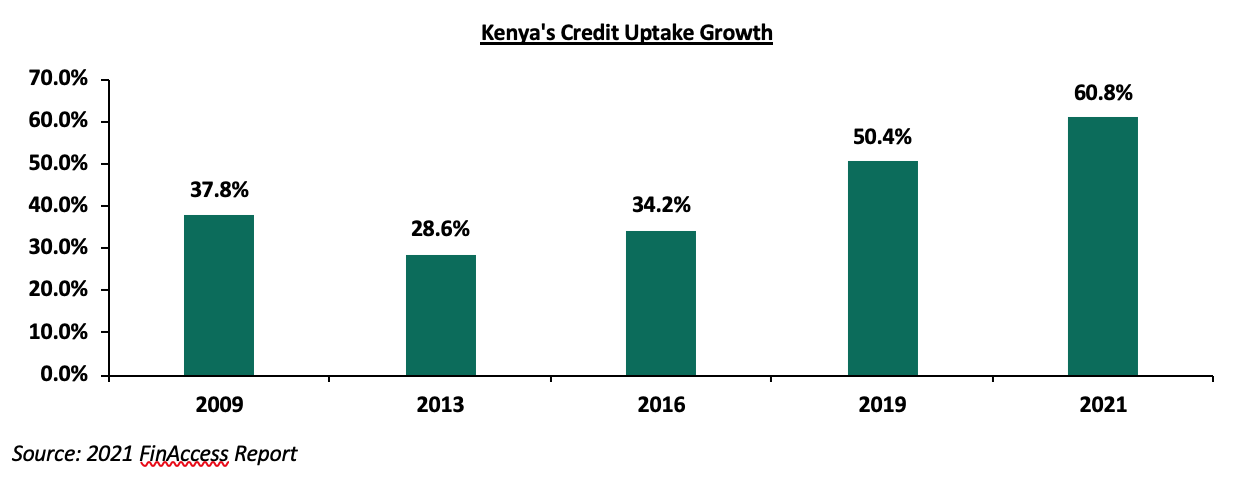
The most common options for credit in Kenya include mobile money, banks, informal groups, insurance, digital apps and microfinance institutions. According to the 2021 FinAccess Report, as of 2021, mobile money was the most used financial platform accounting for 81.4% of users, followed by banking institutions at 44.1%, then informal groups at 28.7%. The usage of digital loan apps declined to 2.1% in 2021, from 8.3% in 2019 mainly due to increased competition from bank-based product innovations, unfair debt collection practices by the Digital Loan Apps, non-listing of borrowers to the Credit Reference Bureaus (CRBs), and anticipated regulation of the Apps by the CBK. Notably, bad or no credit history and negative listing on CRBs remain the biggest hindrance to credit accessibility. The graph below shows the evolution of credit uptake over the last five years;
In December 2021, President Uhuru Kenyatta signed into law the Central Bank of Kenya (CBK) Amendment Act, 2021 which confers the CBK powers to regulate the digital lending services sector and aims to amend the Central Bank of Kenya Act Chapter 491 to provide and allow for the licensing of digital credit service providers, who are currently not regulated. As stated in our Cytonn weekly #49/2021, the act also defines relevant terms for the business of digital credit lending where a digital credit provider is a person licensed by the CBK to carry on digital credit business while a digital credit business is one of providing credit facilities or loan services through a digital channel. Further, the act aims to provide for a fair and non-discriminatory marketplace for access to credit.
With digital lending apps being one of the most easily accessed credit platforms, we expect this move by CBK to increase credit accessibility through;
- Enforcing reporting requirements for digital credit providers – Borrowers will be able to make informed decisions based on the reports given by the digital apps. Additionally, there will be transparency in the pricing of credit given that the digital lending apps will be required to report to their respective borrowers and the CBK information such as; the breakdown of the cost of doing business, type of the loan and risk profile of the customer just like other regulated lending platforms,
- Penalizing any violation or offences – The digital apps, will be subject to penalties under the Central Bank Act regulations that are specific to lending institutions. This will also enhance transparency and consumer protection against unscrupulous digital lenders who have taken advantage of the unregulated space to infringe on various consumer rights and privacy, and,
- Enhancing Credit information sharing – This will play a big role in enabling borrowers to build credit history which they can use to negotiate for better credit terms. Borrowers can also use their positive credit history as an alternative to traditional physical collateral.
Effects of Interests rate on Credit growth
Interest rates constitute an important component when determining the cost of borrowing. When interest rates rise, the cost of credit rises in tandem since financial institutions charge more for credit implying that borrowers will have to use more of their earnings to pay interest on loans. Additionally, borrowers tend to borrow less during periods of high interest rates, which hampers the growth of credit. On the other hand, when interest rates are low, the cost of credit declines and borrowers tend to take out more loans, to fund their businesses and projects, thus promoting the growth of credit in the private sector. Additionally, locking in a lower interest rate implies lower cost of credit in the long run. Borrowers are also able to refinance some of their outstanding loans during a period of sustained low-interest rates hence support in debt stabilization.
In a bid to protect consumers from high cost of credit and not earning any interest on their savings accounts, the Central Bank of Kenya (CBK) introduced the Banking (Amendment) Act 2015 in August 2016, capping lending rates at 4.0% points above the Central Bank Rate (CBR) and deposit rates at 70.0% of the CBR rate. However, despite the positive intention of the amendment, the impact on private sector credit growth was negative as credit growth deteriorated even further as evidenced by;
- The average growth in private sector credit during the 3 years of interest rate capping came in at 3.7%, in comparison to 19.0% 3 years before the capping,
- The average cost of loans by banks went up, as banks charged excessive fees and additional costs on their loans. In return, this discouraged potential borrowers and further subdued growth in the sector, and,
- The total amount of commercial banks loan growth declined, with listed banks recording a loan growth of 6.3% in FY’2016, and 6.1% in FY’2017 compared to 17.0% in FY’2015, before the rate cap was introduced in August 2016. The loan growth further declined to 4.3% in FY’2018 as banks shied away from lending to the private sector.
In order to spur credit growth in the private sector, the government repealed the Banking (Amendment) Act 2015 in November 2019, given that the regulatory framework had proved to be a hindrance to credit growth, evidenced by the continued decline of private sector credit growth. Consequently, there has been significant growth in private sector credit evidenced by;
- The improvement in private sector credit with the average growth rate 3 years after the repeal coming in at 7.8% in comparison to the 3.7% recorded in the 3 years of interest rate capping, and,
- A 12.8% growth in loans extended by listed banks to the private sector in FY’2019 with the growth being accelerated towards the tail end of FY’2019 following the repeal of interest rate cap. For FY’2020, average loan growth came in at 11.7%, higher than the average growth during the interest rate cap but lower than FY’2019 growth rate. The slowdown was largely due to the elevated credit risk occasioned by the pandemic.
The graph below shows the private sector credit growth before (2013 – July 2016), during (August 2016 – October 2019) and (November 2019 – December 2021) after the interest rate cap;
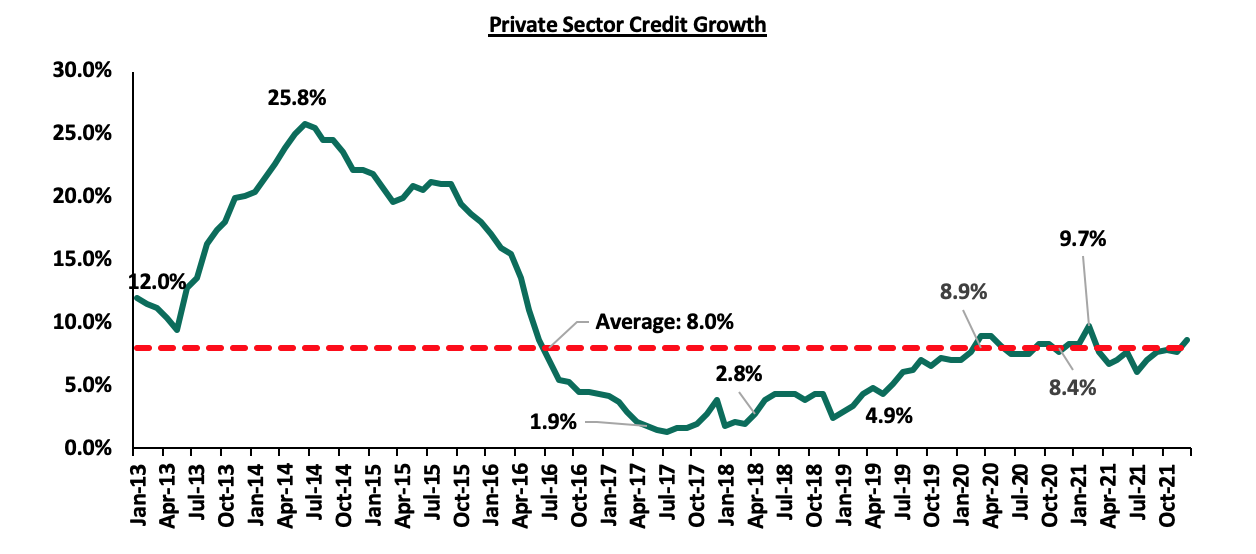
Section 4: Analysis of the True Cost of Credit in Kenya
In an effort to promote transparency and control of the total cost of credit, the CBK and the Kenya Bankers Association (KBA) made public a website called the ‘CostofCredit’ in which banks, both commercial and micro-finance institutions, are required to publish their Annual Percentage Rate (APR), loan repayment schedule and any additional details on their loans. There are various costs associated with a loan in addition to the interest rate component and depending on the type of loan a borrower takes up. These costs include;
- Government Levies: This refers to the excise duty at 20.0% of the Application/ Processing/ Initiation/ Arrangement/ Commitment Fees charged,
- Legal Fees – This refers to the amount charged by the appointed external lawyers in Accordance to the Advocates (Remuneration) (Amendment) Order, 2014. The fees exclude VAT and disbursements, which will be determined after the Lawyers' work is completed,
- Stamp Duty – This is a government levy levied on the sale of property that usually ranges from 1.0% - 4.0% of the property's value,
- Valuation Fees - This is the amount charged by the appointed valuers according to the Land Valuers Licensing (Remuneration) Notice 2013 (as varied or amended). It is usually exclusive of VAT and disbursements as these are cleared after the valuation work is complete, and,
- Insurance - Insurance is charged by the Insurer on the basis of the Option selected by the borrower for the period of the Facility. Insurance includes Mortgage Protection, Credit Life Insurance, Fire Insurance, Property Insurance and Car Insurance, where applicable.
Below is an analysis of the true cost of credit whereby we have ranked the top 15 cheapest and most expensive banks, based on the APR as of 3rd February 2021. We have assumed that an individual has taken up a Kshs 1.0 mn 3-years personal secured loan or a Kshs 1.0 mn 3-years personal unsecured loan under the up-to 5 years category. For mortgage, we assume an individual takes up a Kshs 3.0 mn 10-year mortgage loan for a mortgage worth Kshs 8.6 mn and pays a 10.0% deposit.
|
Personal Loan - Secured |
||||
|
No. |
Bank |
Annual Interest Rate |
Other Charges |
Annual Percentage Rate |
|
1 |
Middle East Bank |
17.0% |
5.9% |
22.9% |
|
2 |
Guaranty Bank |
13.0% |
6.7% |
19.7% |
|
3 |
Kingdom Bank |
16.0% |
2.6% |
18.6% |
|
4 |
Family Bank |
13.0% |
4.3% |
17.3% |
|
5 |
Eco Bank |
13.6% |
3.3% |
17.0% |
|
6 |
Co-operative Bank |
15.6% |
0.9% |
16.5% |
|
6 |
SBM Bank |
13.9% |
2.6% |
16.5% |
|
8 |
KCB Bank |
13.0% |
3.3% |
16.3% |
|
9 |
Bank of Africa |
13.5% |
2.8% |
16.3% |
|
10 |
Development Bank |
13.0% |
3.1% |
16.1% |
|
11 |
Equity Bank |
13.0% |
3.1% |
16.1% |
|
12 |
Stanbic Bank |
13.7% |
2.2% |
15.8% |
|
13 |
Prime Bank |
13.0% |
2.7% |
15.7% |
|
13 |
Paramount Bank |
13.0% |
2.7% |
15.7% |
|
14 |
Diamond Trust Bank |
13.0% |
2.7% |
15.7% |
|
15 |
Mayfair Bank |
13.0% |
2.6% |
15.6% |
|
Top 5 Most expensive Banks |
14.5% |
4.6% |
19.1% |
|
|
Top 5 Cheapest Banks |
12.3% |
0.4% |
12.6% |
|
|
Top 15 Average |
13.8% |
3.2% |
17.0% |
|
Source: www.costofcredit.co.ke
The key take outs from the table include;
- For personal loans, the average APR for the top 5 expensive banks is 19.1% with the average annual rate coming in at 14.5% in comparison to the 12.6% average APR and 12.3% average annual rate for the cheapest banks. The average additional charges for the most expensive banks came in at 4.6%, 4.2% points higher than the 0.4% average additional charges for the cheapest banks. Notably, most of the cheapest banks such as Bank of Baroda do not have additional charges reflecting the banks efforts to steer the growth of their loan books,
- Middle East Bank has the highest APR coming in at 22.9% with the highest annual rate at 17.0% and additional charges of 5.9%,
- The average APR for the top 15 banks stands at 17.0% with the annual average rate standing at 13.8%. Additionally, the average additional charges came in at 3.2%, 1.4% points lower than the average additional charges for the most expensive banks.
|
Personal Loan – Unsecured |
||||
|
No. |
Bank |
Annual Interest Rate |
Other Charges |
Annual Percentage Rate |
|
1 |
Family Bank |
13.0% |
18.8% |
31.8% |
|
2 |
Kingdom Bank |
13.0% |
17.8% |
30.8% |
|
3 |
Middle East Bank |
17.0% |
5.9% |
22.9% |
|
4 |
Guaranty Trust Bank |
13.0% |
6.7% |
19.7% |
|
5 |
Sidian Bank* |
13.0% |
5.8% |
18.8% |
|
6 |
I&M Bank |
18.0% |
0.0% |
18.0% |
|
7 |
Standard Chartered Bank |
14.0% |
3.7% |
17.7% |
|
8 |
ABSA Bank |
13.0% |
4.3% |
17.3% |
|
8 |
Bank of Africa |
14.5% |
2.8% |
17.3% |
|
10 |
Eco Bank |
13.6% |
3.3% |
17.0% |
|
11 |
Prime Bank |
13.0% |
3.7% |
16.7% |
|
12 |
Equity Bank |
13.0% |
3.6% |
16.6% |
|
13 |
Co-operative Bank |
13.0% |
3.5% |
16.5% |
|
13 |
SBM Bank |
13.9% |
2.6% |
16.5% |
|
15 |
KCB Bank |
13.0% |
3.3% |
16.3% |
|
Top 5 Most expensive Banks |
13.8% |
11.0% |
24.8% |
|
|
Top 5 Cheapest Banks |
13.0% |
0.6% |
13.6% |
|
|
Top 15 Average |
13.9% |
5.7% |
19.6% |
|
|
*Period up to 1 year |
||||
Source: www.costofcredit.co.ke
The key take outs from the tables include;
- For personal unsecured loans, the average APR for the top 5 expensive banks is 24.8% with the average annual rate coming in at 13.8% in comparison to the 13.6% average APR and 13.0% average annual rate for the cheapest banks,
- The average additional charges for the most expensive banks stands at 11.0%, 10.4% points higher than the 0.6% average additional charges for the cheapest banks and 6.4% higher than the average additional charges for the most expensive banks offering secured loans. This can be attributed to the additional cost that borrowers incur to compensate the lenders of the perceived credit risk associated with unsecured loans, and,
- Family Bank has the highest APR standing at 31.8% with the highest additional charges at 18.8%.
|
Mortgage |
||||
|
No. |
Bank |
Annual Rate |
Other Charges |
Annual Percentage Rate |
|
1 |
KCB Bank |
13.0% |
28.7% |
41.7% |
|
2 |
Middle East Bank |
17.0% |
16.0% |
33.0% |
|
3 |
Co-operative Bank |
15.6% |
9.2% |
24.8% |
|
4 |
Prime Bank |
13.0% |
7.3% |
20.3% |
|
5 |
Diamond Trust Bank |
13.0% |
7.3% |
20.3% |
|
6 |
National Bank of Kenya |
13.0% |
7.0% |
20.0% |
|
6 |
Paramount Bank |
13.0% |
7.0% |
20.0% |
|
8 |
Guardian Bank |
13.0% |
6.9% |
19.9% |
|
9 |
Victoria Bank |
13.0% |
6.9% |
19.9% |
|
10 |
Equity Bank |
13.0% |
6.8% |
19.8% |
|
11 |
SBM Bank |
13.9% |
5.4% |
19.3% |
|
12 |
ABSA Bank |
12.8% |
6.3% |
19.1% |
|
13 |
Standard Chartered |
12.5% |
6.5% |
19.0% |
|
14 |
Eco Bank |
13.6% |
5.4% |
19.0% |
|
15 |
Family Bank |
13.0% |
5.8% |
18.8% |
|
Top 5 Most expensive Banks |
14.3% |
13.7% |
28.0% |
|
|
Top 5 Cheapest Banks |
12.7% |
4.2% |
16.9% |
|
|
Top 15 Banks Average |
13.5% |
8.8% |
22.3% |
|
Source: www.costofcredit.co.ke
The key take outs from the tables include;
- The average APR for the top 15 banks under the mortgage category stands at 22.3%, 2.7% points higher than the average APR for personal unsecured loans and 5.3% higher than the average APR for personal secured loans,
- For mortgage, the average APR for the top 5 expensive banks is 28.0% with the average annual rate standing at 14.3%, in comparison to the 16.9% average APR and an average annual rate of 12.7% for the cheapest banks,
- The average additional charges for the most expensive banks stands at 13.7%, 2.7% points higher than the 11.0% average additional charges for personal unsecured loans for the most expensive banks, and,
- KCB Bank has the highest APR standing at 41.7% with the highest additional charges at 28.7%.
Section 5: Conclusion
On average, the annual interest rate for Kenyan banks is within a range of 13.0% - 13.5% for the various categories of loans offered. This is approximately 4.0% points higher than South Africa’s average annual rate which stands at 7.5% and 10.2% higher than USA’s 3.3%. However, Kenya’s average annual interest rate is 7.5% lower than Ghana’s average lending rate of 21.0%.
We note that the high cost of credit has been one of the major challenges hindering the growth of the private sector. Additionally, digital lending apps have continued to charge high costs and consequently resulting in borrowers being affiliated with high interest rates leading to a rise in defaults. For instance, the branch app, one of the top player in the digital lending market offers an APR of 22.0% – 229.0%, depending on a consumer’s loan option. On the other hand, M-Shwari, Kenya's first mobile-based savings and loans product, launched in 2012 by Safaricom and NCBA, charges a 7.5% facilitation fee on all credit, regardless of duration, bringing the annualised loan rate to 90.0%. Given these high additional fees charged by lenders, especially for mortgage, the total cost of credit remains relatively high and undermines credit growth as borrowers tend to borrow less.
We believe that more needs to be done in order to spur the private sector credit growth. Below are some of the initiatives that the government can adopt;
- The establishment of a strong consumer protection agency and framework that implements and enforces consumer financial law and ensures that markets for consumer financial products are fair, transparent, and competitive. This will promote robust disclosures on credit costs, free and accessible consumer education, and enforcement of disclosures on borrowings and interest rates, as well as the handling of consumer complaints and concerns. This can be borrowed from the US government which following the financial crisis of 2008, established the Consumer Financial Protection Bureau, a body responsible for consumer protection in the financial sector. Recently, the bureau launched an initiative to reduce the exploitative fees after bank revenue from overdraft and non-sufficient funds (NSF) fees surpassed USD 15.0 bn, in 2019. The website provides a platform for consumers to share their experience and complaints on matters concerning fees for things they believe are covered by the baseline price of a product or service, unexpected fees for a product or service, fees that seem too high for the purported service or fees where it is unclear why they were charged,
- Increase competition to reduce over-reliance on banks - In Kenya, banks account for 95.0% of all funding, while only 5.0% comes from non-bank institutional funding, indicating that the economy is overly reliant on bank lending. The government can balance funding sources by diversifying non-bank funding, allowing borrowers to access more flexible and cost-effective funding options, and,
- Consumer education – The government should come up with ways of educating the public and providing guidelines on financial decisions. This will enable borrowers to acquire knowledge on issues like how to access credit, the use of collateral, and establishing a strong credit history. However, this will also require the adoption of risk based lending by banks where cost of credit varies based on a borrower’s credit history. The move will also increase financial literacy which will help borrowers analyse credit in terms of the costs associated and terms given by the lending institutions. This can be achieved by means such as introducing a website that breaks down the key fundamentals and guidelines on the basic information that consumers need to be able to make informed financial decisions.
In our view, the initiatives already put in place by the government coupled with the above, will go a long way in promoting credit growth in the private sector. As of 2021, the average growth rate for the private sector came in at 7.7% and is expected to remain strong on the back of existing policy measures, including the MSMEs Credit Guarantee Scheme, and continued economic recovery. Given the reduced Gross Non-Performing Loans Ratio for listed banks in Q3’2021 to 12.0%, from 12.4% in Q3’2020, we expect to see banks gradually increase lending to the private sector on the back of an improved business environment. However, risks lie on the downside due to the possibility of elevated credit risk brought about by the emergence of new COVID-19 variants and compounded by the upcoming elections.
Disclaimer: The views expressed in this publication are those of the writers where particulars are not warranted. This publication, which is in compliance with Section 2 of the Capital Markets Authority Act Cap 485A, is meant for general information only and is not a warranty, representation, advice or solicitation of any nature. Readers are advised in all circumstances to seek the advice of a registered investment advisor.

- Talk to us
- Kenya
- P.O Box 20695 - 00200, Nairobi, Kenya
- Cell +254709101200
- Tel +254709101200
- WhatsApp +254741676635
- United States
- +254709101200
- DOWNLOAD OUR APP
-


- Kenya
- 8th Floor, Pinetree Plaza, Kaburu Drive, Ngong Road, Nairobi, Kenya
- USA
- Suite 1150, 1775 Eye Street NW, USA, Washington DC 20006, USA
- Investments
- High Yield
- Private Equity
- Real Estate
- Real Estate
- RiverRun Estates
- Cytonn Towers
- The Ridge
- Taraji Heights
- The Alma