Kenya Listed Banks Q1’2022 Report, & Cytonn Weekly #24/2022
By Cytonn Research, Jun 19, 2022
Executive Summary
Fixed Income
During the week, T-bills remained undersubscribed but the overall subscription rate increased to 80.8%, from 61.3% recorded the previous week. The undersubscription was partly attributable to the tightened liquidity in the money market with the average interbank rates rising to 5.1%, from the 4.8% recorded the previous week. The highest subscription rate was in the 364-day paper which increased to 90.0%, from 74.6% recorded the previous week attributable to high demand for long term government papers by investors. The subscription for the 182-day paper also increased to 73.2 %, from 40.0% recorded the previous week, while the 91-day paper decreased to 76.8% from 81.1% recorded the previous week. The yields on the 364-day government paper increased by 0.9 bps to 10.0%, while the yields on 182-day and 91-day increased by 5.9 bps each to 9.1% and 7.9%, respectively, partly attributable to investors attaching higher risk premium on the country due to perceived higher risks arising from increasing inflationary pressures and local currency depreciation. In the Primary Bond Market, the Central Bank of Kenya re-opened two bonds issued in April 2022 on tap sale; FXD1/2022/03 and FXD1/2022/15, with tenors to maturity of 3.0 years and 15.0 years, coupons of 11.8% and 13.9% respectively. The tap sale seeks to raise Kshs 25.0 bn for budgetary support, with the initial offers having attempted to raise Kshs 40.0 bn and Kshs 30.0 bn respectively;
Also during the week, Energy and Petroleum Regulatory Authority (EPRA) released their monthly statement on the maximum fuel price in Kenya effective 15th June 2022 to 14th July 2022. Notably, Super Petrol, Diesel and Kerosene prices increased by 6.0%, 6.9% and 7.6% to Kshs 159.1 per litre, Kshs 140.0 per litre and Kshs 127.9 per litre, from Kshs 150.1 per litre, Kshs 131.0 per litre and Kshs 118.9, respectively, recorded in the last month. Additionally, the National Treasury gazetted the revenue and net expenditures for the first 11 months of FY’2021/2022, ending 31st May 2022. Total Revenue collected as at the end of May 2022 amounted to Kshs 1,718.7 bn equivalent to 103.7% of the prorated estimates of Kshs 1,657.6 bn and is 95.0% of the FY’2021/2022 revised estimates of Kshs 1,808.3 bn;
Equities
During the week, the equities market was on a downward trajectory, with NASI, NSE 20 and NSE 25 declining by 6.2%, 3.0% and 5.5%, respectively. This week’s performance took the indices’ YTD performance to losses of 27.1%, 15.0% and 23.4% for NASI, NSE 20 and NSE 25 respectively. The equities market performance was driven by losses recorded by large cap stocks such as Safaricom, Equity Group, EABL, ABSA Bank and NCBA Group which declined by 9.0%, 7.6%, 6.4%, 6.1% and 3.0%, respectively. The losses were however mitigated by gains recorded by large cap stocks such as Diamond Trust Bank (DTB-K) of 4.0%, while Co-operative Bank and BAT both gained by 0.9%;
Real Estate
During the week, Housing Finance Group (HFG), a Kenyan financial institution, disclosed in its FY’2021 Annual Report that it had received Kshs 474.9 mn from the Kenya Mortgage Refinance Company (KMRC) for onward lending to potential house buyers in the country. In the hospitality sector, PrideInn Hotels and Resorts, a local hospitality Group, signed a third management agreement with Azure Hospitality Group to manage their hotel at Signature Mall located along Mombasa Road. For Mixed Use Developments, Gateway Real Estate Africa (GREA), a private development company specializing in turnkey construction, began the construction of CCI Group of Companies’ commercial office project in Tatu City, Ruiru constituency. For the listed Real Estate, ILAM Fahari I-REIT closed the week trading at an average price of Kshs 5.5 per share;
Focus of the Week
Following the release of the Q1’2022 results by Kenyan listed banks, this week we analyze the performance of the 10 listed local banks, identify the key factors that influenced their performance, and give our outlook for the banking sector;
Investment Updates:
- Weekly Rates:
- Cytonn Money Market Fund closed the week at a yield of 10.50%. To invest, dial *809#;
- Cytonn High Yield Fund closed the week at a yield of 14.10% p.a. To invest, email us at sales@cytonn.com and to withdraw the interest, dial *809#;
- We continue to offer Wealth Management Training every Wednesday and every third Saturday of the month, from 9:00 am to 11:00 am, through our Cytonn Foundation. The training aims to grow financial literacy among the general public. To register for any of our Wealth Management Trainings, click here;
- If interested in our Private Wealth Management Training for your employees or investment group, please get in touch with us through wmt@cytonn.com;
- Any CHYS and CPN investors still looking to convert are welcome to consider one of the five projects currently available for assignment, click here for the latest term sheet;
- Cytonn Insurance Agency acts as an intermediary for those looking to secure their assets and loved ones’ future through insurance namely; Motor, Medical, Life, Property, WIBA, Credit and Fire and Burglary insurance covers. For assistance, get in touch with us through insuranceagency@cytonn.com;
- Cytonnaire Savings and Credit Co-operative Society Limited (SACCO) provides a savings and investments avenue to help you in your financial planning journey. To enjoy competitive investment returns, kindly get in touch with us through clientservices@cytonn.com;
Real Estate Updates:
- For an exclusive tour of Cytonn’s real estate developments, visit: Sharp Investor's Tour, and for more information, email us at sales@cytonn.com;
- Phase 3 of The Alma is now ready for occupation. To rent please email properties@cytonn.com;
- We have 8 investment-ready projects, offering attractive development and buyer targeted returns; See further details here: Summary of Investment-ready Projects;
- For Third Party Real Estate Consultancy Services, email us at rdo@cytonn.com;
- For recent news about the group, see our news section here;
Hospitality Updates:
- We currently have promotions for Staycations. Visit cysuites.com/offers for details or email us at sales@cysuites.com;
Money Markets, T-Bills Primary Auction:
During the week, T-bills remained undersubscribed but the overall subscription rate increased to 80.8%, from 61.3% recorded the previous week. The undersubscription was partly attributable to the tightened liquidity in the money market with the average interbank rates rising to 5.1%, from the 4.8% recorded the previous week. The highest subscription rate was in the 364-day paper which increased to 90.0%, from 74.6% recorded the previous week attributable to high demand for long term government papers by investors. The subscription for the 182-day paper also increased to 73.2 %, from 40.0% recorded the previous week, while the 91-day paper decreased to 76.8% from 81.1% recorded the previous week. The yields on the 364-day government paper increased by 0.9 bps to 10.0%, while the yields on 182-day and 91-day increased by 5.9 bps each to 9.1% and 7.9%, respectively partly attributable to investors attaching higher risk premium on the country due to perceived higher risks arising from increasing inflationary pressures and local currency depreciation. The government continued to reject expensive bids, accepting a total of Kshs 18.2 bn worth of bids out of Kshs 19.4 bn received, translating to an acceptance rate of 94.0%.
In the Primary Bond Market, the Central Bank of Kenya re-opened two bonds issued in April 2022 on tap sale; FXD1/2022/03 and FXD1/2022/15, with tenors to maturity of 3.0 years and 15.0 years, coupons of 11.8% and 13.9% respectively. The tap sale seeks to raise Kshs 25.0 bn for budgetary support, with the initial offers having attempted to raise Kshs 40.0 bn and Kshs 30.0 bn respectively. The initial offers recorded a mixed performance with the FXD1/2022/03 having being undersubscribed at 85.1%, while FXD1/2022/15 was oversubscribed at 108.5%. Out of the initial Kshs 70.0 bn target amount, the government raised an aggregate of Kshs 60.7 bn from the two bonds. The bonds are currently trading in the secondary market at a rate of 11.9% for FXD1/2022/03 and 14.0% for FXD1/2022/15. The period of sale runs from Tuesday, 14th June 2022 to Thursday, 23rd June 2022 or upon attainment of quantum, whichever comes first.
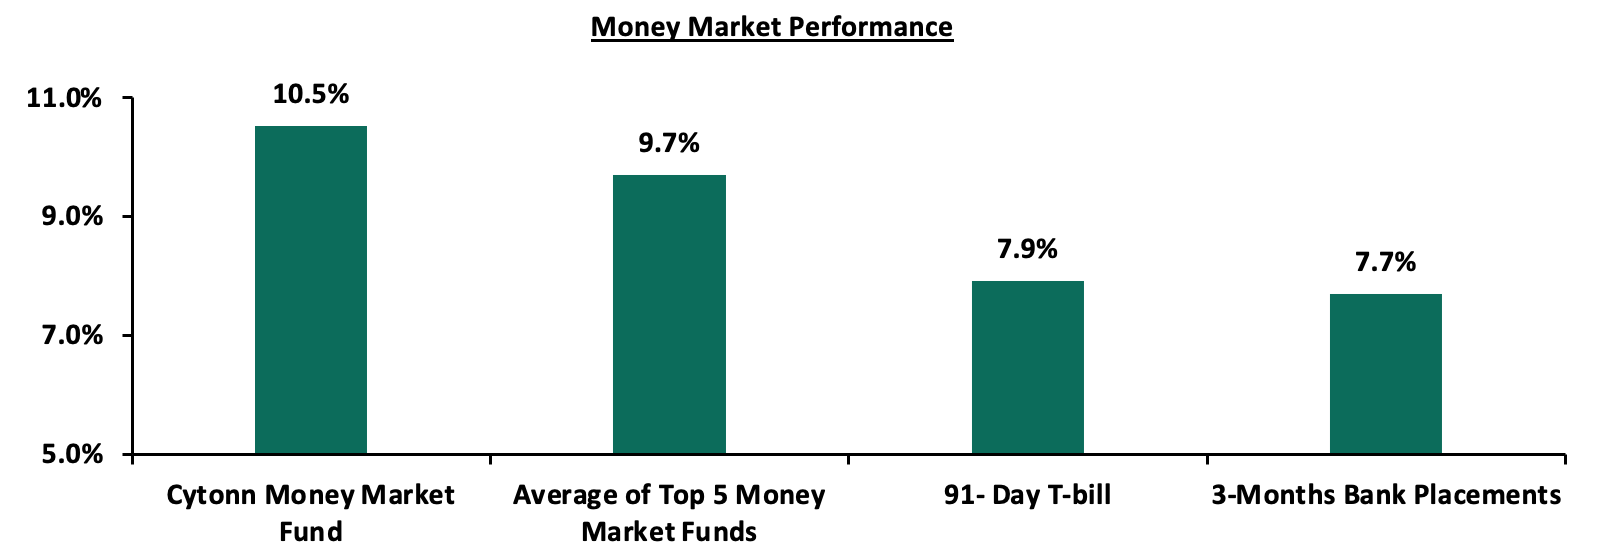
In the money markets, 3-month bank placements ended the week at 7.7% (based on what we have been offered by various banks), while the yield on the 91-day T-bill increased by 5.9 bps to 7.9%. The average yield of the Top 5 Money Market Funds declined to 9.7% from 9.8% last week while the yield on the Cytonn Money Market Fund remained unchanged at 10.5% as was recorded the previous week.
The table below shows the Money Market Fund Yields for Kenyan Fund Managers as published on 17th June 2022:
|
Money Market Fund Yield for Fund Managers as published on 17th June 2022 |
||
|
Rank |
Fund Manager |
Effective Annual Rate |
|
1 |
Cytonn Money Market Fund |
10.5% |
|
2 |
Zimele Money Market Fund |
9.9% |
|
3 |
Sanlam Money Market Fund |
9.4% |
|
4 |
Apollo Money Market Fund |
9.4% |
|
5 |
Madison Money Market Fund |
9.3% |
|
6 |
Nabo Africa Money Market Fund |
9.1% |
|
7 |
CIC Money Market Fund |
9.0% |
|
8 |
Dry Associates Money Market Fund |
9.0% |
|
9 |
Old Mutual Money Market Fund |
8.9% |
|
10 |
Co-op Money Market Fund |
8.9% |
|
11 |
ICEA Lion Money Market Fund |
8.8% |
|
12 |
GenCap Hela Imara Money Market Fund |
8.8% |
|
13 |
Orient Kasha Money Market Fund |
8.5% |
|
14 |
NCBA Money Market Fund |
8.4% |
|
15 |
AA Kenya Shillings Fund |
7.8% |
|
16 |
British-American Money Market Fund |
7.4% |
Source: Business Daily
Liquidity:
During the week, liquidity in the money markets tightened, with the average interbank rate rising to 5.1% from 4.8% recorded the previous week, partly attributable to tax remittances that offset government payments. The average interbank volumes traded declined by 62.2% to Kshs 10.5 bn from Kshs 27.9 bn recorded the previous week.
Kenya Eurobonds:
During the week, the yields on Eurobonds were on an upward trajectory, partly attributable to investors attaching higher risk premium on the country due to perceived higher risks arising from increasing inflationary pressures and local currency depreciation. Yields on the 7-year Eurobond issued in 2019 recorded the highest increase, of 1.3% points to 14.9% from 13.6%, recorded the previous week. The table below shows the summary of the performance of the Kenyan Eurobonds as of 16th June 2022;
|
Kenya Eurobond Performance |
||||||
|
|
2014 |
2018 |
2019 |
2021 |
||
|
Date |
10-year issue |
10-year issue |
30-year issue |
7-year issue |
12-year issue |
12-year issue |
|
03-Jan-22 |
4.4% |
8.1% |
8.1% |
5.6% |
6.7% |
6.6% |
|
31-May-22 |
8.7% |
10.0% |
11.0% |
10.5% |
10.4% |
10.0% |
|
10-Jun-22 |
14.2% |
12.4% |
12.1% |
13.6% |
12.0% |
11.3% |
|
13-Jun-22 |
15.6% |
13.1% |
12.9% |
15.1% |
12.9% |
12.1% |
|
14-Jun-22 |
15.7% |
13.7% |
12.9% |
14.8% |
13.1% |
12.0% |
|
15-Jun-22 |
15.1% |
13.4% |
12.7% |
14.7% |
12.9% |
11.8% |
|
16-Jun-22 |
15.1% |
13.3% |
12.8% |
14.9% |
12.8% |
11.9% |
|
Weekly Change |
0.9% |
0.9% |
0.7% |
1.3% |
0.8% |
0.6% |
|
MTD Change |
7.0% |
3.7% |
1.9% |
4.3% |
2.7% |
2.0% |
|
YTD Change |
10.7% |
5.3% |
4.7% |
9.3% |
6.1% |
5.3% |
Source: Central Bank of Kenya (CBK)
Kenya Shilling:
During the week, the Kenyan shilling depreciated by 0.2% against the US dollar to close the week at Kshs 117.3, from Kshs 117.0 recorded the previous week, partly attributable to increased dollar demand from the oil and energy sectors. Key to note, this is the lowest the Kenyan shilling has ever depreciated against the dollar. On a year-to-date basis, the shilling has depreciated by 3.7% against the dollar, in comparison to the 3.6% depreciation recorded in 2021. We expect the shilling to remain under pressure in 2022 as a result of:
- Rising global crude oil prices on the back of supply constraints and geopolitical pressures at a time when demand is picking up with the easing of COVID-19 restrictions and as economies reopen. Key to note, risks abound the recovery following the emergence of the new COVID-19 variants,
- Increased demand from merchandise traders as they beef up their hard currency positions in anticipation for more trading partners reopening their economies globally,
- An ever-present current account deficit due to an imbalance between imports and exports, with Kenya’s current account deficit estimated to come in at 5.1% of GDP in the 12 months to April 2022 compared to the 4.8% for a similar period in 2021. The wider deficit reflects a higher import bill, particularly for oil, which more than offset increased receipts from agricultural and services exports, and remittances, and,
- The aggressively growing government debt, with Kenya’s public debt having increased at a 10-year CAGR of 18.6% to Kshs 8.2 tn in December 2021, from Kshs 1.5 tn in December 2011 thus putting pressure on forex reserves to service some of the public debt. It is worth noting that the average GDP growth over the same period has been 3.9%, an indicator that the increase in debt is not translating into GDP growth.
The shilling is however expected to be supported by:
- High Forex reserves currently at USD 8.2 bn (equivalent to 4.9-months of import cover), which is above the statutory requirement of maintaining at least 4.0-months of import cover, and the EAC region’s convergence criteria of 4.5-months of import cover. In addition, the reserves were boosted by the USD 750.0 mn World Bank loan facility received in March 2022 and are expected to be boosted further by the expected USD 244.0 mn from the International Monetary Fund (IMF), and,
- Improving diaspora remittances evidenced by an 18.6% y/y increase to USD 355.0 mn as of April 2022, from USD 299.3 mn recorded over the same period in 2021 which has continued to cushion the shilling against further depreciation. In the recently released April 2022 diaspora remittances figures, North America remained the largest source of remittances to Kenya accounting for 61.7% in the period, followed by Europe at 17.2% while the rest of the world accounted for 21.1% of the total.
Weekly Highlights:
- Fuel Prices
During the week, the Energy and Petroleum Regulatory Authority (EPRA) released their monthly statement on the maximum fuel price in Kenya effective 15th June 2022 to 14th July 2022. Notably, Super Petrol, Diesel and Kerosene prices increased by 6.0%, 6.9% and 7.6% to Kshs 159.1 per litre, Kshs 140.0 per litre and Kshs 127.9 per litre, from Kshs 150.1 per litre, Kshs 131.0 per litre and Kshs 118.9, respectively, recorded in the last month. Key to note, the current prices are the highest ever recorded in the country. Below are the key take-outs from the statement:
The performance in fuel prices was attributable to:
- An increase in the average landed costs of Super Petrol by 6.0% to USD 876.1 per cubic meter in May 2022, from USD 826.8 per cubic meter in April 2022,
- An increase in the average landed costs of Diesel by 10.9% to USD 977.4 per cubic meter in May 2022, from USD 899.4 per cubic meter in April 2022,
- An increase in the Free on Board (FOB) price of Murban crude oil in May 2022 by 19.7% to USD 112.5 per barrel, from USD 94.0 per barrel in April 2022, and,
- The depreciation of the Kenyan shilling during the period by 1.0% to Kshs 116.9 in May 2022, from Kshs 115.7 in April 2022
Notably, the average landed costs of Kerosene declined by 0.3% to USD 905.6 per cubic meter in May 2022, from USD 908.7 per cubic meter in April 2022.
However, the fuel prices were supported from further increase by:
- The fuel subsidy program under the Petroleum Development Fund which resulted in subsidies of Kshs 25.6 on Super Petrol per litre, Kshs 48.2 on Diesel per litre and Kshs 42.4 per litre on Kerosene during the month. Without the subsidies, fuel would have traded at Kshs 184.7 per litre for super petrol, Kshs 188.2 per litre for Diesel and Kshs 170.4 per litre for Kerosene, and,
- The removal of suppliers margins since October 2021.
Global fuel prices have recorded a 45.2% increase since the beginning of the year to USD 123.7 per barrel as of 16th May 2022, from USD 85.2 per barrel recorded on 3rd January 2022, driven by persistent supply chain constraints worsened by the geopolitical pressures occasioned by the Russian invasion of Ukraine. These are the highest prices witnessed globally, since 15th March 2012, when prices reached USD 124.3 per barrel. Kenyans have been largely cushioned from the high prices by the fuel subsidy program under the National Treasury. However, we have maintained that the program is unsustainable and will be depleted should the average landed costs of fuel continue to rise. Additionally, the National Treasury has indicated that the subsidies are inefficient and have led to misallocation of resources and crowding out of the public spending on productive sectors. As a result, the government is poised to gradually adjust the fuel prices upwards with a view of eliminating the fuel subsidy. Further, the government has come under increasing pressure from international partners such as the World Bank to cut down the subsidy program, with the World Bank estimating that the total monthly cost of subsidizing fuel estimated at USD 66.0 mn (Kshs 7.7 bn). The National Treasury has also so far spent Kshs 67.0 bn in the FY’2021/22 on the subsidy program, with an expectation that Kshs 84.0 bn will be spent by end of the FY’2021/2022. This would leave a paltry Kshs 16.0 bn in the Kshs 100.0 bn fund that was meant to cover FY’2021/2022 and FY’2022/2023.
Going forward, we expect the cost of living to remain high given that fuel is a major contributor to Kenya’s headline inflation and fuel prices are a major input cost in majority of Kenya’s sectors such as manufacturing, transport and energy. Consequently, the business environment is expected to deteriorate even further as consumers are likely to cut on spending.
- Revenue and Net Exchequer for FY’2021/2022
The National Treasury gazetted the revenue and net expenditures for the first eleven months of FY’2021/2022, ending 31st May 2022. Below is a summary of the performance:
|
FY'2021/2022 Budget Outturn - As at 31st May 2022 |
||||||
|
Amounts in Kshs billions unless stated otherwise |
||||||
|
Item |
12-months Original Estimates |
Revised Estimates |
Actual Receipts/Release |
Percentage Achieved |
Prorated |
% achieved of prorated |
|
Opening Balance |
|
|
21.3 |
|
|
|
|
Tax Revenue |
1,707.4 |
1,741.1 |
1,637.9 |
94.1% |
1,596.0 |
102.6% |
|
Non-Tax Revenue |
68.2 |
67.1 |
59.5 |
88.6% |
61.5 |
96.6% |
|
Total Revenue |
1,775.6 |
1,808.3 |
1,718.7 |
95.0% |
1,657.6 |
103.7% |
|
External Loans & Grants |
379.7 |
433.2 |
172.2 |
39.7% |
397.1 |
43.4% |
|
Domestic Borrowings |
1,008.4 |
1,008.0 |
783.5 |
77.7% |
924.0 |
84.8% |
|
Other Domestic Financing |
29.3 |
30.4 |
13.2 |
43.6% |
27.9 |
47.5% |
|
Total Financing |
1,417.4 |
1,471.5 |
968.9 |
65.8% |
1,348.9 |
71.8% |
|
Recurrent Exchequer issues |
1,106.6 |
1,179.4 |
1,020.4 |
86.5% |
1,081.1 |
94.4% |
|
CFS Exchequer Issues |
1,327.2 |
1,309.5 |
1,046.6 |
79.9% |
1,200.3 |
87.2% |
|
Development Expenditure & Net Lending |
389.2 |
420.9 |
283.1 |
67.3% |
385.8 |
73.4% |
|
County Governments + Contingencies |
370.0 |
370.0 |
286.5 |
77.4% |
339.2 |
84.5% |
|
Total Expenditure |
3,193.0 |
3,279.8 |
2,636.6 |
80.4% |
3,006.5 |
87.7% |
|
Fiscal Deficit excluding Grants |
(1,417.4) |
(1,471.5) |
(917.9) |
62.4% |
(1,348.9) |
68.0% |
|
Fiscal Deficit(excluding grants) as % of GDP |
8.1% |
8.1% |
7.6% |
|
|
|
|
Total Borrowing |
1,388.1 |
1,441.1 |
955.7 |
66.3% |
1,321.0 |
72.3% |
|
*National Treasury estimates |
||||||
The key take-outs from the report include:
- Total revenue collected as at the end of May 2022 amounted to Kshs 1,718.7 bn, equivalent to 95.0% of the revised estimates of Kshs 1,808.3 bn for FY’2021/2022 and is 103.7% of the prorated estimates of Kshs 1,657.6 bn. Notably, the performance is an improvement from the 100.2% performance recorded in the first ten months to April 2022, which was despite the deterioration of the business environment seen during the month of May as evidenced by the decline in the purchasing managers index (PMI) to 48.2, from 49.5 that was recorded in April 2022. Cumulatively, tax revenues amounted to Kshs 1,637.9 bn, equivalent to 94.1% of the revised estimates of Kshs 1,741.1 bn and 102.6% of the prorated estimates of Kshs 1,450.9 bn,
- Total financing amounted to Kshs 968.9 bn, equivalent to 65.8% of the revised estimates of Kshs 1,471.5 bn and is equivalent to 71.8% of the prorated estimates of Kshs 1,348.9 bn. Additionally, domestic borrowing amounted to Kshs 783.5 bn, equivalent to 77.7% of the original estimates of Kshs 1,008.0 bn and is 84.8% of the prorated estimates of Kshs 924.0 bn,
- The total expenditure amounted to Kshs 2,636.6 bn, equivalent to 80.4% of the revised estimates of Kshs 3,279.8 bn, and is 87.7% of the prorated expenditure estimates of Kshs 3,006.5 bn. Additionally, the net disbursements to recurrent expenditures came in at Kshs 1,020.4 bn, equivalent to 86.5% of the revised estimates and 94.4% of the prorated estimates of Kshs 1,200.3 bn, and development expenditure amounted to Kshs 283.1 bn, equivalent to 67.3% of the revised estimates of Kshs 420.9 bn and is 73.4% of the prorated estimates of Kshs 385.8 bn,
- Consolidated Fund Services (CFS) Exchequer issues lagged behind their targets of Kshs 1,091.2 bn after amounting to Kshs 1,046.6 bn, equivalent to 79.9% of the revised estimates, and are 87.2% of the prorated amount of Kshs 1,200.3 bn. The cumulative public debt servicing cost amounted to Kshs 916.6 bn which is 79.6% of the original estimates of Kshs 1,169.2 bn, and is 85.5% of the prorated estimates of Kshs 1,071.7 bn. Additionally, the Kshs 916.6 bn debt servicing cost is equivalent to 53.3% of the actual revenues collected as at the end of May 2022, and,
- Total Borrowings as at the end of May 2022 amounted to Kshs 955.7 bn, equivalent to 66.3% of the revised estimates of Kshs 1,441.1 bn and are 72.3% of the prorated estimates of Kshs 1,321.0 bn. The cumulative domestic borrowing target of Kshs 1,008.0 bn comprises of adjusted Net domestic borrowings of Kshs 664.0 bn and Internal Debt Redemptions (Roll-overs) of Kshs 343.9 bn.
In the eleven months leading up to May 2022 in the FY’2021/2022, the government has consistently met its revenue collections target, which is commendable, as the government has only met its revenue collection target once in the last 8 years. The improvement is partly due to the economy's sustained recovery following the ease of COVID-19 containment measures and the effectiveness of the KRA in revenue collection. Additionally, the recent tax initiatives such as the adoption of the Finance Act 2021 which led to the upward readjustment of the Excise Duty Tax, Income Tax as well as the Value Added Tax enhanced revenue collection, even though the increased taxes have further burdened taxpayers. With the current fiscal year coming to a close at the end of this month, we expect the government to step up its revenue collection efforts and rely more on the domestic market to close the deficit. As a result, the government's borrowing appetite is expected to remain high as the fiscal year draws to a close. Consequently, we expect sustained gradual increase in government securities’ yields in the short term. However, the key concerns remain the resurgence of new COVID-19 cases both locally and with trading partners globally as well as the rising cost of living which is likely to see a cutback in consumer spending.
Rates in the Fixed Income market have remained stable due to the relatively ample liquidity in the money market. The government is 0.9% ahead of its prorated borrowing target of Kshs 638.5 bn having borrowed Kshs 644.3 bn of the Kshs 664.0 bn borrowing target for the FY’2021/2022. We expect a gradual economic recovery as evidenced by the revenue collections of Kshs 1.7 tn during the first eleven months of the current fiscal year, which was equivalent to 103.7% of the prorated revenue collection target. However, despite the projected high budget deficit of 8.1% and the affirmation of the `B+’ rating with negative outlook by Fitch Ratings, we believe that the support from the IMF and World Bank will mean that the interest rate environment will remain stable since the government is not desperate for cash. Owing to this, our view is that investors should be biased towards short-term fixed-income securities to reduce duration risk.
Markets Performance
During the week, the equities market was on a downward trajectory, with NASI, NSE 20 and NSE 25 declining by 6.2%, 3.0% and 5.5%, respectively. This week’s performance took the indices’ YTD performance to losses of 27.1%, 15.0% and 23.4% for NASI, NSE 20 and NSE 25 respectively. The equities market performance was driven by losses recorded by large cap stocks such as Safaricom, Equity Group, EABL, ABSA Bank and NCBA Group which declined by 9.0%, 7.6%, 6.4%, 6.1% and 3.0%, respectively. The losses were however mitigated by gains recorded by large cap stocks such as Diamond Trust Bank (DTB-K) of 4.0%, while Co-operative Bank and BAT both gained by 0.9%.
During the week, equities turnover increased by 7.5% to USD 18.1 mn, from USD 16.8 mn recorded the previous week, taking the YTD turnover to USD 430.9 mn. Foreign investors remained net sellers, with a net selling position of USD 11.9 mn, from a net selling position of USD 7.1 mn recorded the previous week, taking the YTD net selling position to USD 88.0 mn.
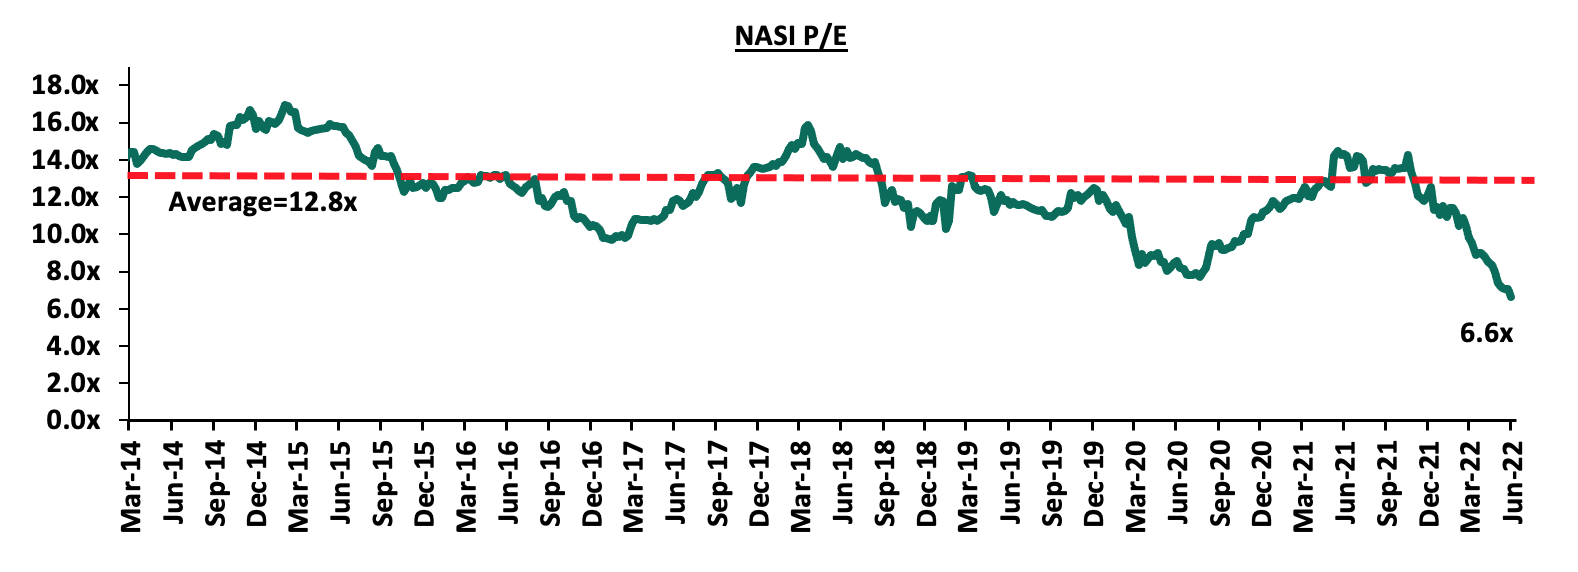
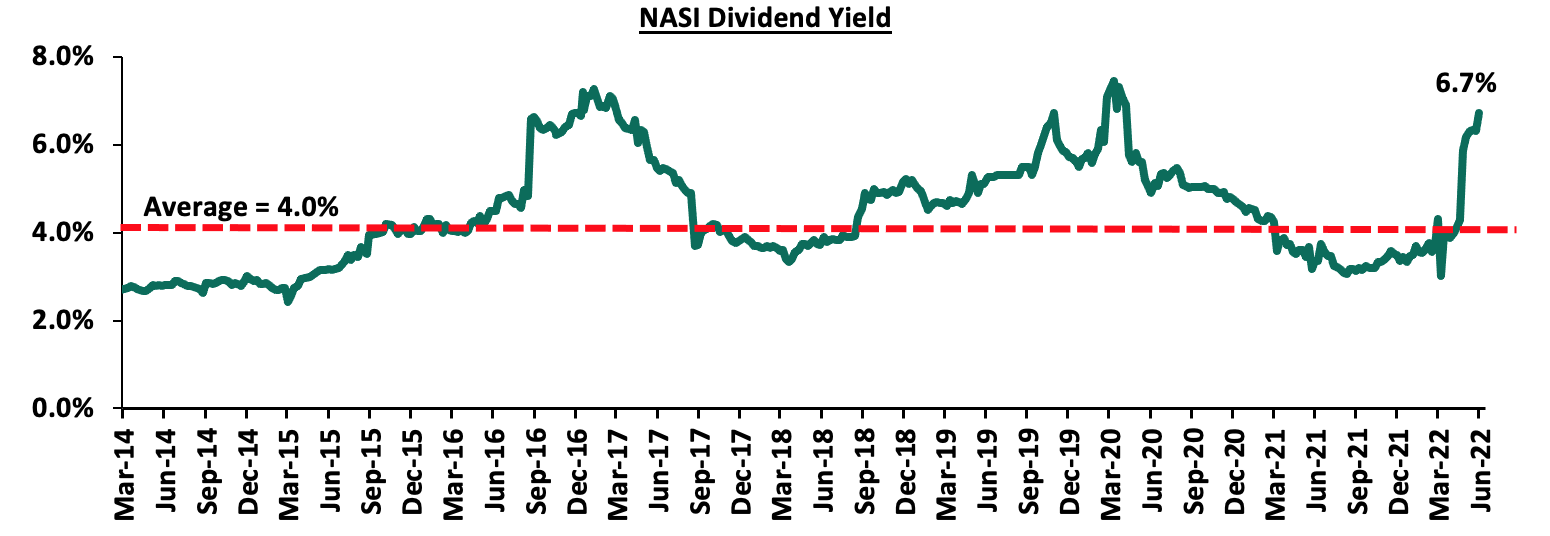
The market is currently trading at a price to earnings ratio (P/E) of 6.6x, 48.1% below the historical average of 12.8x, and a dividend yield of 6.7%, 2.7% points above the historical average of 4.0%. Key to note, NASI’s PEG ratio currently stands at 0.9x, an indication that the market is undervalued relative to its future growth. A PEG ratio greater than 1.0x indicates the market may be overvalued while a PEG ratio less than 1.0x indicates that the market is undervalued. The charts below indicate the historical P/E and dividend yields of the market:
Cytonn coverage:
|
Company |
Price as at 10/06/2022 |
Price as at 17/06/2022 |
w/w change |
YTD Change |
Target Price* |
Dividend Yield |
Upside/ Downside** |
P/TBv Multiple |
Recommendation |
|
Kenya Reinsurance |
2.1 |
2.0 |
(4.2%) |
(11.4%) |
3.2 |
4.9% |
61.5% |
0.2x |
Buy |
|
Liberty Holdings |
5.2 |
5.1 |
(1.5%) |
(27.2%) |
7.8 |
0.0% |
51.8% |
0.4x |
Buy |
|
Jubilee Holdings |
265.0 |
265.0 |
0.0% |
(16.3%) |
379.4 |
5.3% |
48.5% |
0.5x |
Buy |
|
KCB Group*** |
39.0 |
37.9 |
(2.8%) |
(16.8%) |
52.2 |
7.9% |
45.7% |
0.8x |
Buy |
|
Equity Group*** |
43.2 |
39.9 |
(7.6%) |
(24.5%) |
54.4 |
7.5% |
44.1% |
1.0x |
Buy |
|
I&M Group*** |
17.0 |
16.7 |
(1.8%) |
(22.0%) |
22.3 |
9.0% |
42.4% |
0.5x |
Buy |
|
Britam |
6.1 |
5.6 |
(7.9%) |
(26.2%) |
7.7 |
0.0% |
38.0% |
0.9x |
Buy |
|
Co-op Bank*** |
10.9 |
11.0 |
0.9% |
(15.4%) |
14.1 |
9.1% |
37.4% |
0.8x |
Buy |
|
ABSA Bank*** |
11.5 |
10.8 |
(6.1%) |
(8.1%) |
13.6 |
10.2% |
35.8% |
1.1x |
Buy |
|
NCBA*** |
25.2 |
24.5 |
(3.0%) |
(3.9%) |
29.1 |
12.3% |
31.3% |
0.6x |
Buy |
|
Diamond Trust Bank*** |
50.0 |
52.0 |
4.0% |
(12.6%) |
62.4 |
5.8% |
25.7% |
0.2x |
Buy |
|
Sanlam |
13.0 |
13.0 |
0.0% |
12.6% |
15.9 |
0.0% |
22.3% |
1.4x |
Buy |
|
Standard Chartered*** |
123.8 |
123.8 |
0.0% |
(4.8%) |
137.0 |
11.3% |
22.0% |
1.0x |
Buy |
|
Stanbic Holdings |
100.8 |
100.3 |
(0.5%) |
15.2% |
109.8 |
9.0% |
18.5% |
0.9x |
Accumulate |
|
CIC Group |
2.0 |
1.9 |
(6.9%) |
(12.9%) |
2.1 |
0.0% |
11.1% |
0.7x |
Accumulate |
|
HF Group |
3.0 |
3.0 |
1.0% |
(21.1%) |
2.8 |
0.0% |
(5.3%) |
0.2x |
Sell |
|
*Target Price as per Cytonn Analyst estimates **Upside/ (Downside) is adjusted for Dividend Yield ***For Disclosure, these are stocks in which Cytonn and/or its affiliates are invested in |
|||||||||
We are “Neutral” on the Equities markets in the short term due to the current adverse operating environment and huge foreign investor outflows, and, “Bullish” in the long term due to current cheap valuations and expected global and local economic recovery.
With the market currently trading at a discount to its future growth (PEG Ratio at 0.9x), we believe that investors should reposition towards value stocks with strong earnings growth and that are trading at discounts to their intrinsic value. We expect the discovery of new COVID-19 variants, the upcoming Kenyan general elections and the slow vaccine rollout to continue weighing down the economic outlook. On the upside, we believe that the relaxation of COVID-19 containment measures in the country will lead to improved investor sentiments.
- Residential Sector
During the week, Housing Finance Group (HFG), a Kenyan financial institution, disclosed in its FY’2021 Annual Report that it had received Kshs 474.9 mn from the Kenya Mortgage Refinance Company (KMRC) for onward lending to potential house buyers in the country. HFG disclosed that it had borrowed the aforementioned amount at an interest rate of 5.2% per annum until December 2028, therefore representing 11.0% of HFG’s total borrowed funds worth Kshs 4.2 bn, as of December 2021. Moreover, this comes barely two months after Co-operative Bank of Kenya Limited also revealed that it had received Kshs 549.8 mn loan from the KMRC, to finance affordable housing mortgage loans. This is a sign of the mortgage refinancer’s efforts to fulfill its core mandate of providing home loans to Kenyans, with some of its other objectives highlighted in our Kenya Mortgage Refinance Company (KMRC) Progress topical.
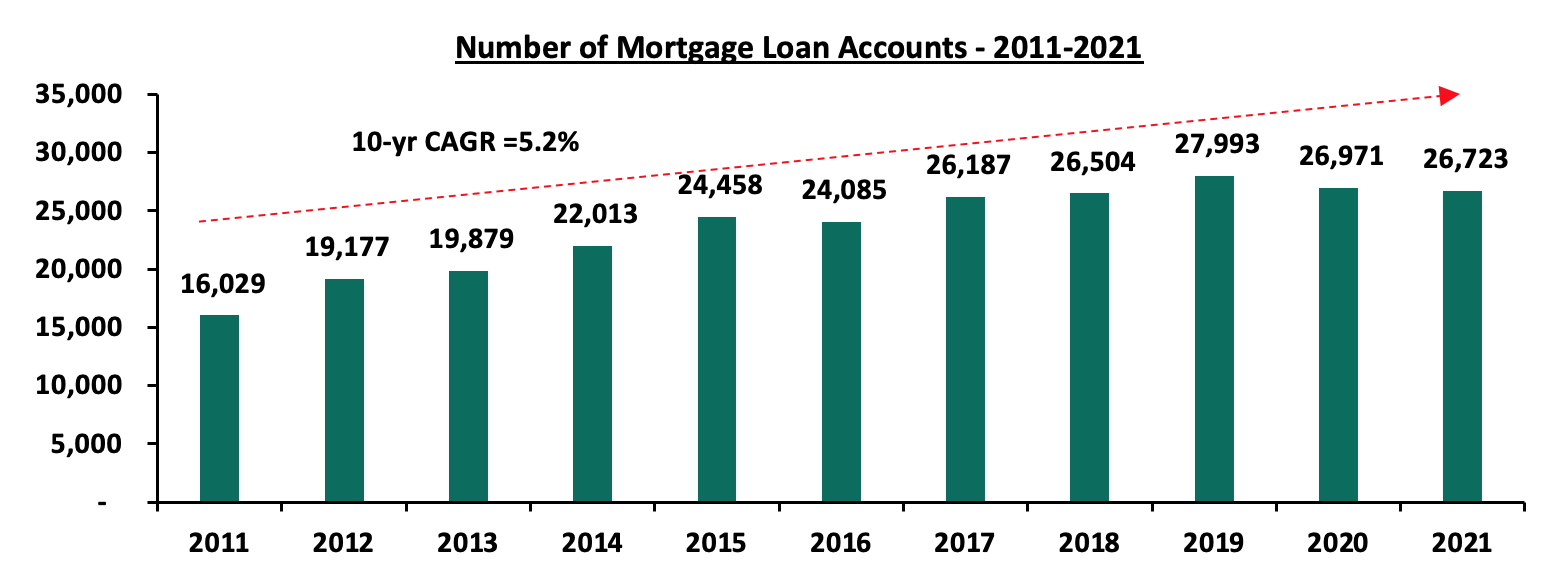
HFG which currently accounts for 2.8% of KMRC’s shares, will lend the amount to home buyers earning less than Kshs 150,000 per month at a 9.5% interest rate, which is 4.4% points lower than the normal market lending rate of 13.9%. In turn, the move by Housing Finance Group is expected to boost mortgage availability and loan accounts which came in at 26,723 in December 2021, a 0.9% decline from the 26,971 realized in December 2020, according to Central Bank of Kenya’s Bank Supervision Annual Report 2021. The graph below shows the number of mortgage loan accounts in Kenya over the last 11 years;
Source: Central Bank of Kenya (CBK)
With regards to the above, the Kenyan mortgage sector performance continues to lag behind evidenced by a 2.2% mortgage to GDP ratio as at 2020, compared to countries such as Namibia and South Africa at 18.9% and 16.2%, respectively, as at 2020 as shown in the graph below;
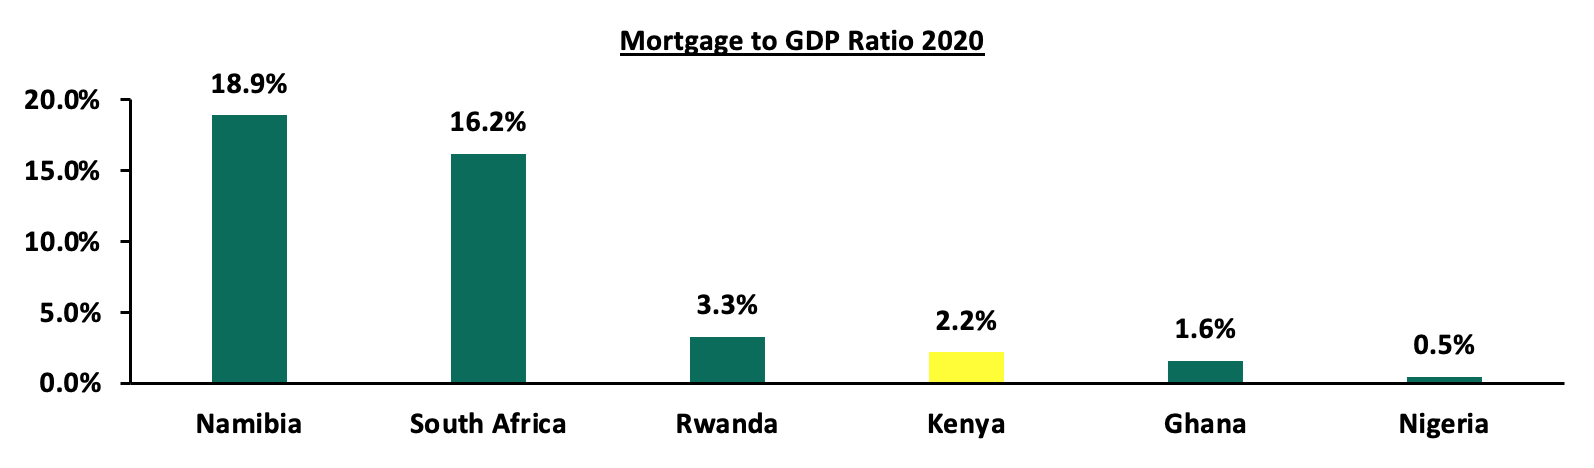
Source: Centre for Affordable Housing Africa
With KMRC’s efforts to boost mortgage availability in the country, we expect an increase in the mortgage uptake thus boost home ownership rates in Kenya which is currently at 21.3% in urban areas as at 2020, compared to other African countries such as South Africa and Ghana at 53.0% and 47.2%, respectively. The graph below shows the home ownership percentages of different countries compared to Kenya;
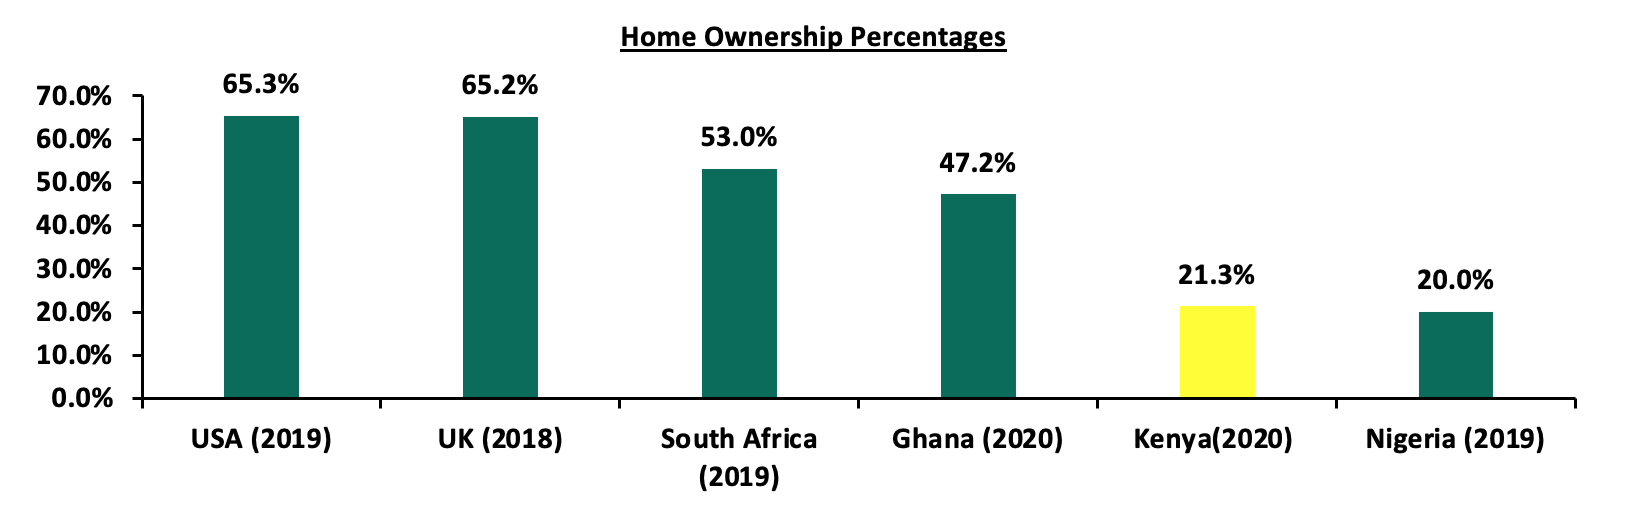
Source: Centre for Affordable Housing Africa
We expect KMRC’s aggressive efforts towards providing affordable home loans to continue driving the uptake for mortgages by potential buyers, as well as boosting the overall mortgage to GDP ratio in the country. However, the increasing cost of construction is expected to trickle down to the overall selling prices for housing units, and in turn weigh down the uptake of mortgages in the country.
- Hospitality Sector
During the week, PrideInn Hotels and Resorts, a local hospitality Group, signed a third management agreement with Azure Hospitality Group to manage their hotel at Signature Mall located along Mombasa Road. The hotel now dubbed PrideInn Plaza consists of 64 rooms, 9 conference halls, a restaurant, a launch, and, a bar, and will be wholly run by PrideInn which signed a management contract with Azure Hotels and Resorts in 2020 to merge operations. This brings PrideInn’s number of operating hotels countrywide to 8, after having also opened a new hotel at the Maasai Mara dubbed PrideInn Mara Camp in Narok County, that it also acquired from Azure Group in May 2022. PrideInn’s expansion drive is part of its plan to increase its footprint in the 47 counties within the country, with some of the factors supporting its new opening being:
- The strategic location of the hotel in a busy mall which enhances a high client base,
- Availability of prime property for uptake, and,
- Presence of adequate infrastructure such as the busy Nairobi-Mombasa Road promoting accessibility to the hotel.
Kenya’s hospitality sector continues to record expansion activities as a result of increasing activities such as tourism, conferences, sports, and leisure activities. In turn, this has led to an improvement in the overall performance of the sector, evidenced by the full operation of hotels and an average bed occupancy in the month of May at 55.0%, 4.0% points higher than 51.0% recorded in the month of April 2022, according the Monetary Policy Committee Hotels Survey-May 2022 by the Central Bank of Kenya (CBK). We expect a similar trend to continue being recorded in the country in order to further boost the performance of the sector. The graph below shows the overall percentage of the number of operating hotels in Kenya between January 2021 to May 2022;
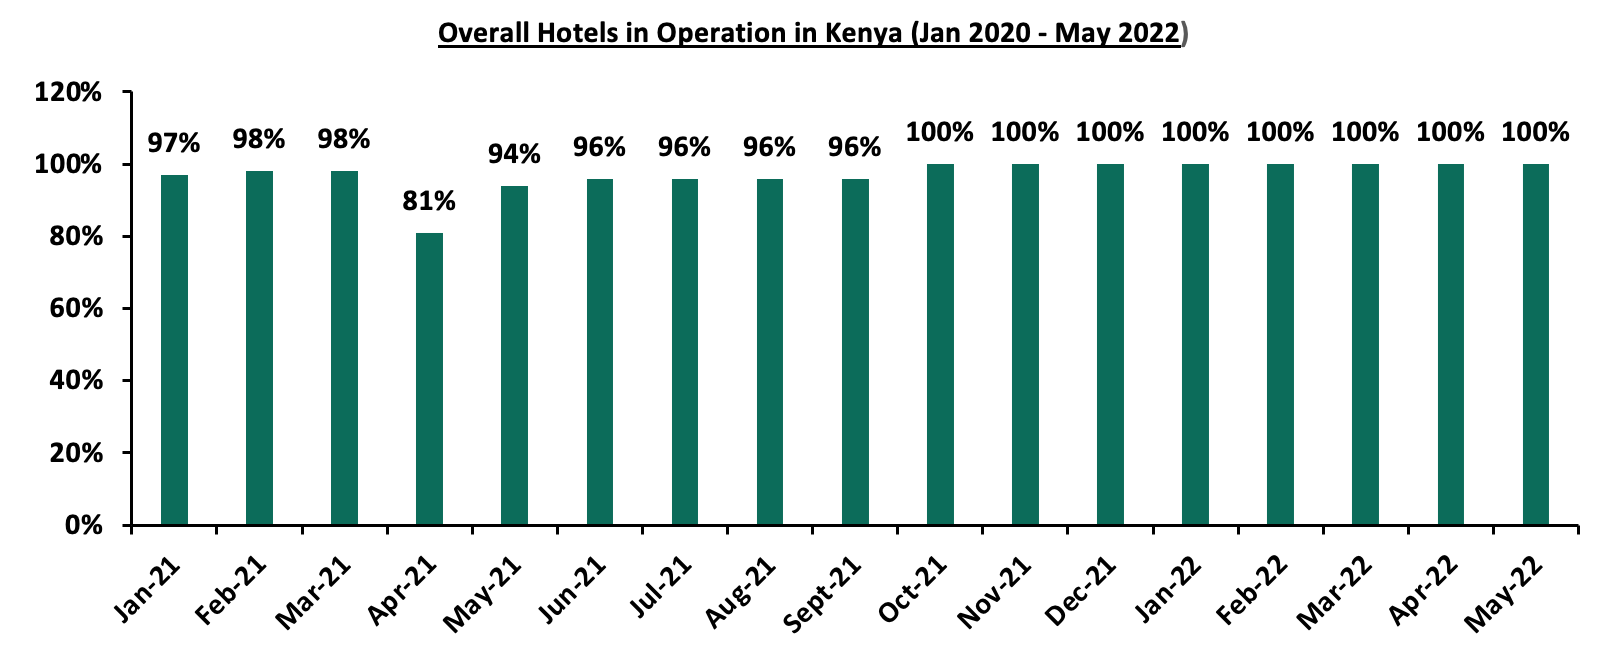
Source: Central Bank of Kenya (CBK)
The graph below highlights the hotel bed occupancy rates in Kenya between January 2021 to May 2022;
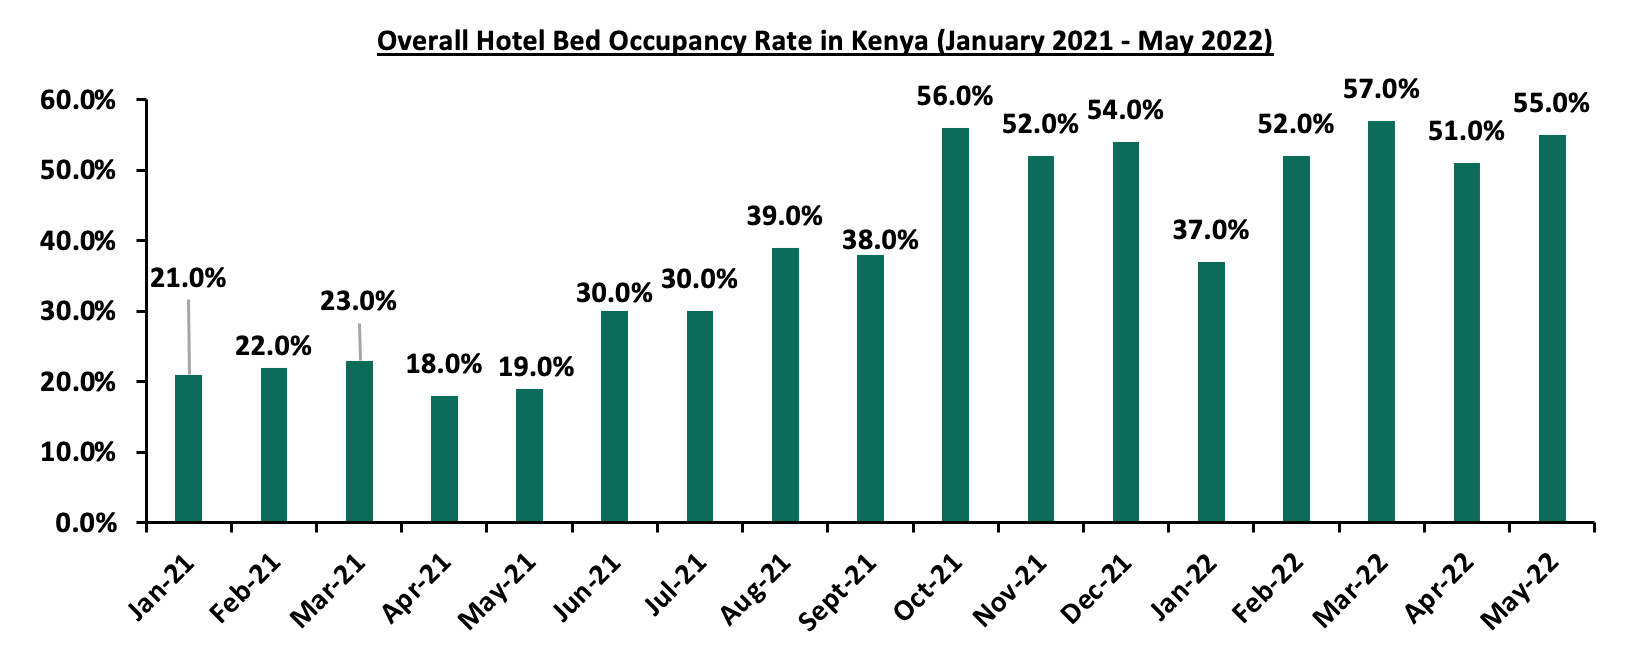
Source: Central Bank of Kenya (CBK)
- Mixed Use Development
During the week, Gateway Real Estate Africa (GREA), a private development company specializing in turnkey construction, began the construction of CCI Group of Companies’ commercial office project in Tatu City, Ruiru constituency. As per our Cytonn Weekly 15/2022, CCI Group which is the largest international contact centre operator in Africa currently have their offices at the Garden City Business Park, whereas they are looking to expand their operations into Tatu City. The purpose-built state of the art office facility will be a five-storey facility consisting of training facilities and a career center, with the construction expected to be completed by December 2023. Additionally, Gateway Real Estate also announced plans to develop a second office tower and a retail center both totaling 24,000 SQM and adjacent to CCI Global, at Tatu City. This signifies the increasing popularity of Mixed-Use Developments resulting from their convenience, and investor’s increasing appetite in Kenya’s Real Estate market, as the development is expected to house the headquarters of GREA, and its parent company, Grit Real Estate Income Group headquarters.
In terms of performance, our Nairobi Metropolitan Area Mixed-Use Developments (MUDs) Report 2021, highlights that MUDs recorded average rental yields of 7.2% in 2021, 0.7% points increase from the respective single-use, retail, commercial office and residential themes with an average yield of 6.5%. This was attributed to the MUDs prime locations, with the mixed-use concept attracting the high and growing middle class seeking the convenience that resulted from incorporating working, shopping and living spaces. The table below shows the thematic comparison of rental yield performance between Single Use Themes and Mixed-Use Developments;
|
Thematic Performance of MUDs in Key Nodes 2021 |
||
|
|
MUD Themes Average |
Single-Use Themes Average |
|
Theme |
Rental Yield 2021 |
Rental Yield 2021 |
|
Retail |
8.4% |
7.8% |
|
Offices |
7.1% |
6.6% |
|
Residential |
6.0% |
5.2% |
|
Average |
7.2% |
6.5% |
|
*Mixed-Use Developments recorded average rental yields of 7.2%, 0.7% points higher than the respective single-use retail, commercial office and residential themes with 6.5% yields in 2021 |
||
Source: Cytonn Research 2021
We expect the Mixed-Use Development sector performance to maintain an upward trajectory, due to their increasing demand resulting from their preference by developers and users. This is so, as they provide a high and diversified revenue stream, better utilization of space, and their convenience as they incorporate a work, live and play lifestyle in a single development.
- Real Estate Investment Trusts (REITS)
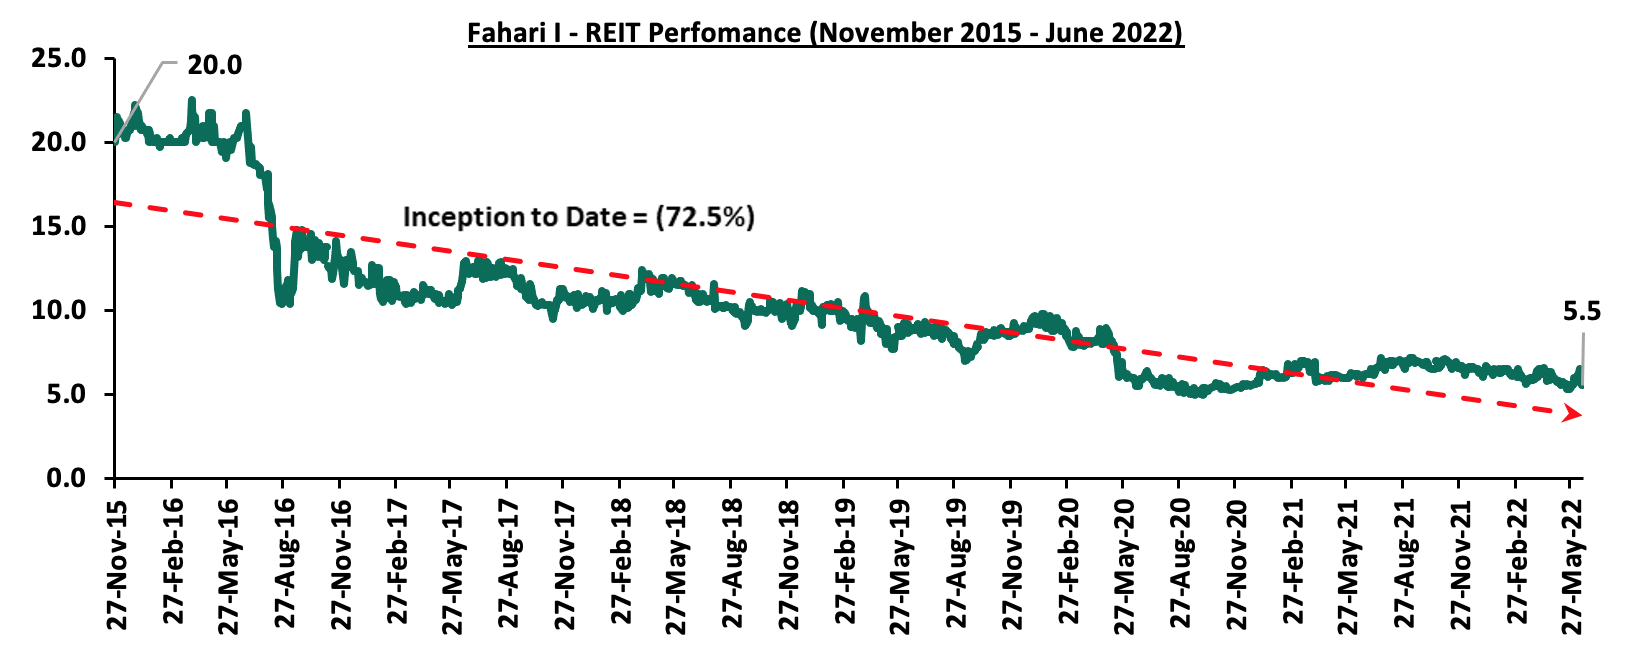
In the Nairobi Stock Exchange, ILAM Fahari I-Reit closed the week trading at an average price of Kshs 5.5 per share. The performance represented an 8.3% and a 14.1% Week-to-Date (WTD) and Year-to-Date (YTD) decline, respectively, from Kshs 6.0 and Kshs 6.4 per share. On an Inception-to-Date (ITD) basis, the REIT’s performance continues to be weighed down having realized a 72.5% decline from Kshs 20.0, respectively. The graph below shows Fahari I-REIT’s performance from November 2015 to 17th June 2022:
We expect Kenya’s property market to continue being shaped by; KMRC’s efforts to provide affordable home loans to potential buyers, increasing expansion drive in the hospitality sector, and the increasing construction activities in the Mixed-Use Development sector. However, setbacks such investor’s minimal appetite for the REIT instrument is expected to continue weighing down the overall investments in REITs.
Following the release of the Q1’2022 results by Kenyan listed banks, the Cytonn Financial Services Research Team undertook an analysis on the financial performance of the listed banks and identified the key factors that shaped the performance of the sector. For the various earnings notes of the various companies, click these links:
- Equity Group Q1’2021 Earnings Note;
- KCB Group Q1’2022 Earnings Note;
- ABSA Bank Kenya Q1’2022 Earnings Note;
- Standard Chartered Bank Kenya Q1’2022 Earnings Note;
- NCBA Group Q1’2022 Earnings Note;
- Cooperative Bank Q1’2022 Earnings Note;
- Diamond Trust Bank Kenya (DTB-K) Q1’2022 Earnings Note;
- I&M Holdings Q1’2022 Earnings Note;
- Stanbic Holdings Q1’2022 Earnings Note;
- HF Group Q1’2022 Earnings Note;
The Core Earnings per Share (EPS) for the listed banks recorded a weighted growth of 37.9% in Q1’2022, from a weighted growth of 28.4% recorded in Q1’2021, mainly attributable to a 21.4% growth in non-funded income coupled with a 17.7% growth in net interest income. Additionally, the Asset Quality for the listed banks improved in Q1’2022, with the gross NPL ratio declining by 1.0% point to 12.5%, from 13.5% in Q1’2021. We however note that despite this improvement in the asset quality, the NPL ratio remains higher than the 10-year average of 8.1%. The listed banks’ management quality also improved, with the Cost to Income ratio improving by 10.4% points to 53.1%, from 63.5% recorded in Q1’2021, as banks continued to reduce their provisioning levels following the improved business environment during the period. Consequently.
The report is themed “Improved Earnings in an Uncertain Business Environment” where we assess the key factors that influenced the performance of the banking sector in Q1’2022, the key trends, the challenges banks faced, and areas that will be crucial for growth and stability of the banking sector going forward. As such, we shall address the following:
- Key Themes that Shaped the Banking Sector Performance in Q1’2022,
- Summary of the Performance of the Listed Banking Sector in Q1’2022,
- The Focus Areas of the Banking Sector Players Going Forward, and,
- Brief Summary and Ranking of the Listed Banks based on the Outcome of Our Analysis.
Section I: Key Themes That Shaped the Banking Sector Performance in Q1’2022
Below, we highlight the key themes that shaped the banking sector in Q1’2022 which include; regulations, regional expansion through mergers and acquisitions, asset quality and capital raising for onward lending:
- Regulation:
- Regulation of Digital Lenders: The Central Bank of Kenya (CBK) enacted the law to regulate digital lenders, granting the bank the authority to license and oversee previously unregulated digital credit providers. The regulations were published on 18th March 2022, and allowed digital lenders a period of six months to acquire licences from CBK. The regulations are aimed at protecting borrowers against the predatory practices of unregulated digital credit providers, particularly their high costs, unethical debt collection practices, and misuse of personal information. We expect the move to streamline the digital lending services sector and weed out unscrupulous digital lenders who have taken advantage of the unregulated space to violate various consumer rights and privacy. Additionally, lenders will be able to acquire licenses to increase their market share and operate in a more favourable environment. For more information see our Cytonn Weekly #49/2021.
- Regional Expansion through Mergers and Acquisitions: Kenyan banks are looking at having an extensive regional reach. In Q1’2022, there were no mergers or acquisitions announced but the following was announced after Q1’2022:
- On 8th June 2022, Centum Investment Company PLC, announced that it had entered into a binding agreement to sell its 83.4% shareholding in Sidian Bank to Access Bank PLC, for a consideration of Kshs 4.3 bn subject to relevant approval from the Central bank of Kenya and the Competition Authority of Kenya. The price consideration from Access Bank translates to a Price to Book Value (P/B) of 1.1x, which is lower than the 8-year acquisitions average P/B of 1.3x, but higher than the current average P/B of the listed banking stocks of 0.9x. For more information, please see our Cytonn Weekly #23/2022. Below is a summary of the deals in the last 9years that have either happened, been announced or expected to be concluded:
|
Acquirer |
Bank Acquired |
Book Value at Acquisition (Kshs bn) |
Transaction Stake |
Transaction Value (Kshs bn) |
P/Bv Multiple |
Date |
|
Access Bank PLC (Nigeria) |
Sidian Bank |
4.9 |
83.4% |
4.3 |
1.1x |
June-22* |
|
KCB Group |
Banque Populaire du Rwanda |
5.3 |
100.0% |
5.6 |
1.1x |
August-21 |
|
I&M Holdings PLC |
Orient Bank Limited Uganda |
3.3 |
90.0% |
3.6 |
1.1x |
April-21 |
|
KCB Group** |
ABC Tanzania |
Unknown |
100% |
0.8 |
0.4x |
Nov-20* |
|
Co-operative Bank |
Jamii Bora Bank |
3.4 |
90.0% |
1 |
0.3x |
Aug-20 |
|
Commercial International Bank |
Mayfair Bank Limited |
1 |
51.0% |
Undisclosed |
N/D |
May-20* |
|
Access Bank PLC (Nigeria) |
Transnational Bank PLC. |
1.9 |
100.0% |
1.4 |
0.7x |
Feb-20* |
|
Equity Group ** |
Banque Commerciale Du Congo |
8.9 |
66.5% |
10.3 |
1.2x |
Nov-19* |
|
KCB Group |
National Bank of Kenya |
7 |
100.0% |
6.6 |
0.9x |
Sep-19 |
|
CBA Group |
NIC Group |
33.5 |
53%:47% |
23 |
0.7x |
Sep-19 |
|
Oiko Credit |
Credit Bank |
3 |
22.8% |
1 |
1.5x |
Aug-19 |
|
CBA Group** |
Jamii Bora Bank |
3.4 |
100.0% |
1.4 |
0.4x |
Jan-19 |
|
AfricInvest Azure |
Prime Bank |
21.2 |
24.2% |
5.1 |
1.0x |
Jan-18 |
|
KCB Group |
Imperial Bank |
Unknown |
Undisclosed |
Undisclosed |
N/A |
Dec-18 |
|
SBM Bank Kenya |
Chase Bank Ltd |
Unknown |
75.0% |
Undisclosed |
N/A |
Aug-18 |
|
DTBK |
Habib Bank Kenya |
2.4 |
100.0% |
1.8 |
0.8x |
Mar-17 |
|
SBM Holdings |
Fidelity Commercial Bank |
1.8 |
100.0% |
2.8 |
1.6x |
Nov-16 |
|
M Bank |
Oriental Commercial Bank |
1.8 |
51.0% |
1.3 |
1.4x |
Jun-16 |
|
I&M Holdings |
Giro Commercial Bank |
3 |
100.0% |
5 |
1.7x |
Jun-16 |
|
Mwalimu SACCO |
Equatorial Commercial Bank |
1.2 |
75.0% |
2.6 |
2.3x |
Mar-15 |
|
Centum |
K-Rep Bank |
2.1 |
66.0% |
2.5 |
1.8x |
Jul-14 |
|
GT Bank |
Fina Bank Group |
3.9 |
70.0% |
8.6 |
3.2x |
Nov-13 |
|
Average |
74.5% |
1.3x |
||||
|
* Announcement Date ** Deals that were dropped |
||||||
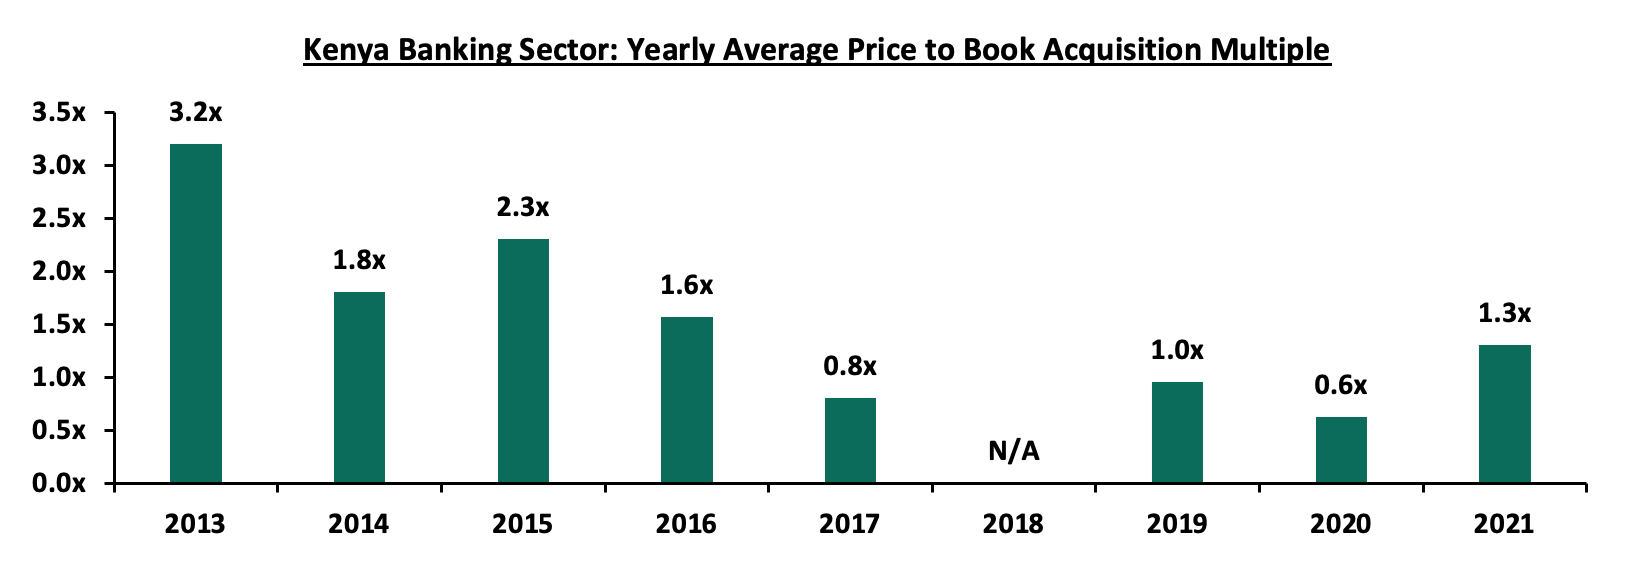
The acquisition valuations for banks have been recovering, with the valuations increasing from the average of 0.6x in 2020 to 1.3x in 2021. This however still remains low compared to historical prices paid as highlighted in the chart below;
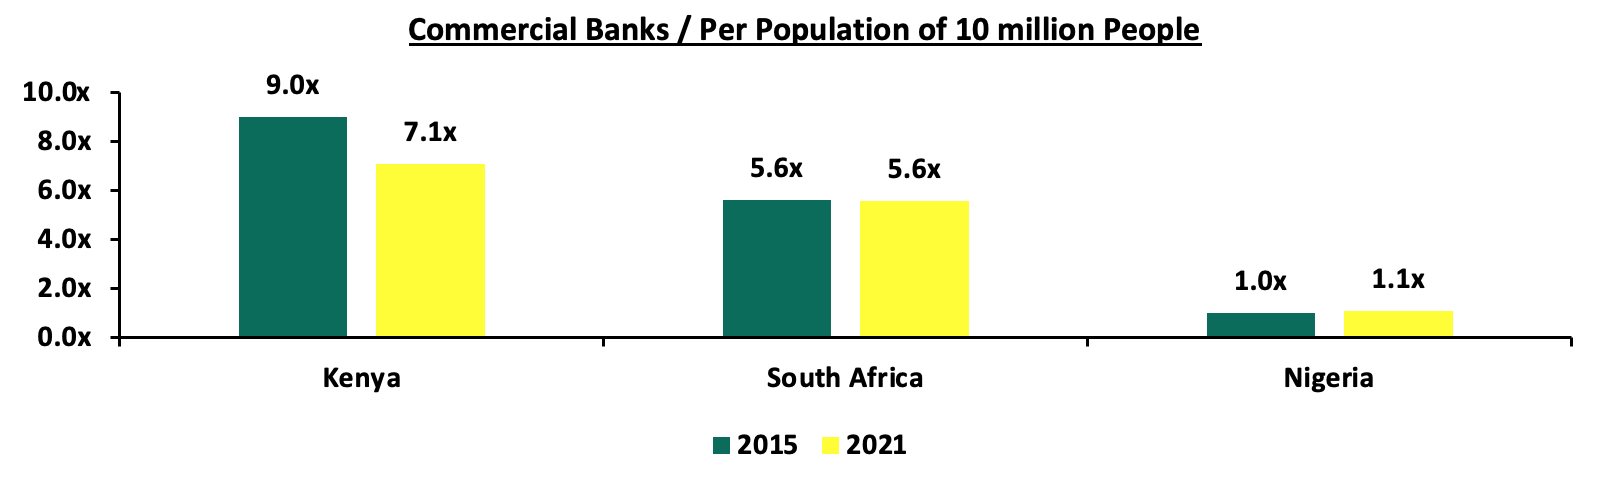
The number of commercial banks in Kenya currently stands at 38, same as in Q1’2022 but lower than the 43 licensed banks in FY’2015. The ratio of the number of banks per 10 million population in Kenya now stands at 7.1x, which is a reduction from 9.0x in FY’2015 demonstrating continued consolidation of the banking sector. However, despite the ratio improving, Kenya still remains overbanked as the number of banks remains relatively high compared to the population. To bring the ratio to 5.5x, we need to reduce the number of banks from the current 38 banks to 30 banks. For more on this see our topical.
Source: World Bank, Central Bank of Kenya, South Africa Reserve Bank, Central Bank of Nigeria,
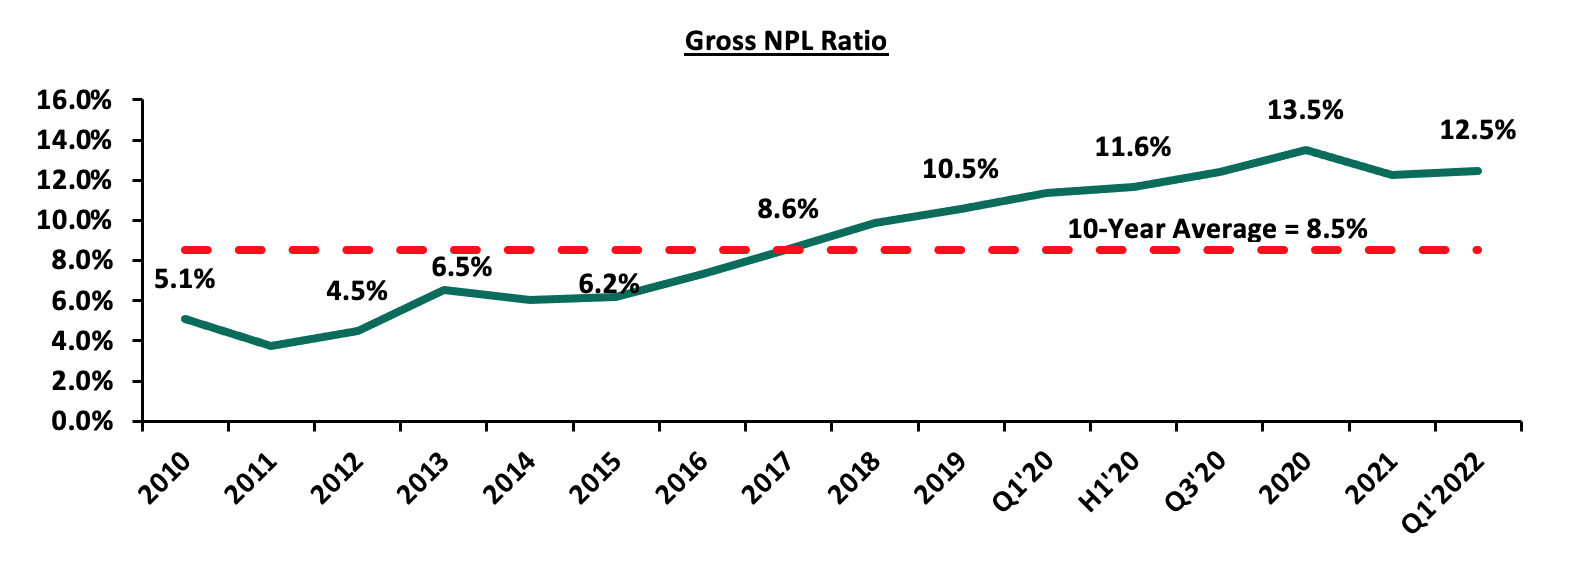
- Asset Quality: Asset quality for listed banks improved in Q1’2022, with the Gross NPL ratio declining by 1.0% points to 12.5%, from 13.5% in Q1’2021. According to the May 2022 MPC Press Release, the NPL ratio for the entire banking sector stood at 14.1% as at April 2022, relatively unchanged from April 2021, with majority of the non-performing loans stemming from sectors like the building and construction sector, manufacturing as well as the transport and communication sectors. Notably, the NPL ratio increased from the 13.1% recorded in December 2022 signalling a deteriorating business environment occasioned by the increased cost of living. We expect credit risk to remain elevated in the short term given the resurgence of COVID-19 infections as well as persistent supply constraints which are expected to continue to weigh on the business environment. The chart below highlights the asset quality trend for the listed banks:
The table below highlights the asset quality for the listed banking sector:
|
|
Q1’2021 NPL Ratio** |
Q1’2022 NPL Ratio* |
% point change in NPL Ratio |
Q1’2021 NPL Coverage** |
Q1’2022 NPL Coverage* |
% point change in NPL Coverage |
|
Absa Bank |
7.5% |
7.6% |
0.1% |
73.4% |
76.2% |
2.8% |
|
Equity Bank |
12.1% |
9.0% |
(3.1%) |
55.5% |
66.0% |
10.5% |
|
I&M Holdings |
11.9% |
10.0% |
(1.9%) |
61.1% |
72.1% |
11.0% |
|
Stanbic Bank |
15.1% |
11.1% |
(4.0%) |
63.9% |
59.1% |
(4.8%) |
|
DTBK |
10.6% |
12.6% |
2.0% |
46.5% |
42.2% |
(4.3%) |
|
Coop Bank |
16.9% |
13.9% |
(3.0%) |
58.4% |
65.3% |
6.9% |
|
SCBK |
16.4% |
15.4% |
(1.0%) |
81.1% |
81.8% |
0.7% |
|
NCBA Group |
14.7% |
16.3% |
1.6% |
65.0% |
72.6% |
7.6% |
|
KCB Group |
14.9% |
16.9% |
2.0% |
61.6% |
52.7% |
(8.9%) |
|
HF Group |
24.7% |
20.5% |
(4.2%) |
64.7% |
76.1% |
11.4% |
|
Mkt Weighted Average |
13.5% |
12.5% |
(1.0%) |
62.0% |
65.1% |
3.1% |
|
*Market cap weighted as at 17/06/2022 |
||||||
|
**Market cap weighted as at 08/06/2021 |
||||||
Key take-outs from the table include;
- Asset quality for the listed banks improved during the period, with the weighted average NPL ratio declining by 1.0% point to a market cap weighted average of 12.5%, from an average of 13.5% for the listed banking sector in Q1’2021. The improvement in asset quality is attributable to the 17.2% growth in loans in Q1’2022, in comparison to the 11.6% growth in Q1’2021, and,
- The NPL coverage rose to 65.1% in Q1’2022, from 62.0% recorded in Q1’2021, in accordance with IFRS 9, where banks are expected to provide both for the incurred and expected credit losses, as the banks increased their provisioning levels to proactively manage risks brought about by the emergence of new COVID-19 variants coupled with the slow recovery of some sectors such as tourism and hospitality, as well as the agriculture and manufacturing sectors. However, it is key to note that KCB Group’s NPL coverage came in at 52.7%, a decline from the 61.6% Q1’2021, despite the increase in the Gross NPL’s by 33.6% y/y to 16.6% from 14.8%, an indication of reduced provisioning.
- Capital Raising: In Q1’2022, listed banks continued to borrow from international institutions to not only strengthen their capital position but also boost their ability to lend to the perceived riskier Micro Small and Medium Sized Enterprises (MSMEs) segment in order to support the small businesses in the tough operating environment occasioned by the COVID-19 pandemic. In the period under review, Equity Group received USD 165.0 mn (Kshs 18.6 bn) facility from the International Finance Corporation (IFC) to Equity Bank Kenya in January 2022 in a bid to raise capital and for onward lending to climate smart projects and Small and Medium Enterprises (SMEs) in Kenya. For more information see our Cytonn Weekly #19/2022.
Section II: Summary of the Performance of the Listed Banking Sector in Q1’2022:
The table below highlights the performance of the banking sector, showing the performance using several metrics, and the key take-outs of the performance;
|
Bank |
Core EPS Growth |
Interest Income Growth |
Interest Expense Growth |
Net Interest Income Growth |
Net Interest Margin |
Non-Funded Income Growth |
NFI to Total Operating Income |
Growth in Total Fees & Commissions |
Deposit Growth |
Growth in Government Securities |
Loan to Deposit Ratio |
Loan Growth |
Return on Average Equity |
|
HF |
117.8% |
1.1% |
(6.5%) |
9.7% |
4.4% |
87.2% |
32.7% |
44.1% |
3.1% |
26.5% |
90.8% |
(2.7%) |
(4.5%) |
|
Coop |
68.9% |
4.1% |
0.3% |
5.5% |
8.3% |
41.7% |
38.2% |
45.2% |
4.3% |
10.4% |
79.0% |
8.8% |
21.6% |
|
KCB |
54.6% |
21.2% |
31.4% |
18.0% |
8.6% |
47.2% |
32.0% |
49.1% |
12.9% |
29.4% |
83.3% |
18.0% |
14.0% |
|
I&M |
43.6% |
20.6% |
20.6% |
20.7% |
6.4% |
20.3% |
29.7% |
28.4% |
17.6% |
21.0% |
70.6% |
13.1% |
19.3% |
|
Equity |
36.0% |
31.1% |
32.6% |
30.6% |
7.2% |
9.7% |
38.1% |
21.7% |
14.0% |
27.9% |
69.2% |
27.8% |
28.7% |
|
Absa |
22.1% |
15.6% |
16.2% |
15.4% |
7.1% |
5.8% |
30.5% |
(10.0%) |
4.8% |
7.9% |
90.0% |
11.2% |
21.2% |
|
NCBA |
20.3% |
10.5% |
14.9% |
7.6% |
5.8% |
15.5% |
46.1% |
0.0% |
7.2% |
22.6% |
52.4% |
0.3% |
22.9% |
|
DTBK |
16.3% |
10.7% |
9.5% |
5.1% |
5.3% |
14.1% |
24.3% |
23.3% |
13.7% |
12.1% |
65.5% |
9.2% |
7.1% |
|
SCBK |
15.6% |
1.8% |
(23.6%) |
7.2% |
6.3% |
0.1% |
33.6% |
(11.0%) |
0.0% |
(1.0%) |
48.3% |
8.7% |
17.4% |
|
Stanbic |
12.0% |
9.5% |
(5.2%) |
16.9% |
6.3% |
9.6% |
44.7% |
1.1% |
3.7% |
(14.6%) |
87.8% |
30.7% |
13.5% |
|
Q1'22 Mkt Weighted Average* |
37.9% |
17.8% |
17.1% |
17.7% |
7.3% |
21.4% |
35.9% |
21.7% |
9.5% |
17.6% |
73.9% |
17.2% |
21.9% |
|
Q1'21 Mkt Weighted Average** |
28.4% |
14.7% |
12.7% |
17.5% |
7.4% |
2.9% |
35.3% |
(2.4%) |
21.8% |
20.3% |
69.2% |
11.0% |
13.8% |
|
*Market cap weighted as at 17/06/2022 |
|||||||||||||
|
**Market cap weighted as at 08/06/2021 |
|||||||||||||
Key takeaways from the table above include:
- The listed banks recorded a 37.9% weighted average growth in core Earnings per Share (EPS), compared to a weighted average increase of 28.4% in Q1’2021 for the listed banking sector,
- The Banks have recorded a weighted average deposit growth of 9.5%, slower than the 21.8% growth recorded in Q1’2021, an indication of reduced investment risk in the business environment,
- Interest income grew by 17.8%, compared to a growth of 14.7% recorded in Q1’2021 while the weighted average Yield on Interest Earning Assets (YIEA) increased to 10.0%, from the 9.5% recorded in Q1’2021 for the listed banking sector. On the other hand, the Net Interest Margin (NIM) now stands at 7.3%, 0.1% points lower than the 7.4% recorded in Q1’2021 for the whole listed banking sector, and,
- Non-Funded Income grew by 21.4%, compared to the 2.9% growth recorded in Q1’2022. This can be attributable to the faster growth in the fees and commission which grew by 21.7% compared to a decline of 2.4% in Q1’2021, following the expiry of the waiver on bank charges.
Section III: Outlook of the banking sector:
The banking sector continued to recover in Q1’2022, as evidenced by the increase in their profitability, with the Core Earnings Per Share (EPS) growing by 37.9%. The increase in EPS is mainly attributable to the reduced provisioning levels by the sector, as the Loan Loss Provisions declined by 13.8% in Q1’2022, in comparison to the 3.9% growth recorded in Q1’2021, coupled with a 21.4% increase in Non-Funded Income as compared to the 2.9% growth in Q1’2021. However, despite the decline in Loan Loss Provisions, we believe that the uncertainty surrounding the August 2022 elections coupled with the resurgence of COVID-19 infections, will see banks continue overprovisioning in the medium term, albeit lower than in 2020. Based on the current operating environment, we believe the future performance of the banking sector will be shaped by the following key factors:
- Growth in Interest income: Going forward, we expect interest income growth to remain a key driver in the industry, evidenced by the 17.8% growth recorded in Q1’2022, higher than the 14.7% growth recorded in Q1’2021. As such, we believe the continued allocation to government securities which are witnessing increases in yields will lead to an increase in overall interest income. The disclosure by banks that most customers that had restructured their loans are now servicing them as normal means that banks are now earning interest on loans restructured at the height of the pandemic. Additionally, we believe that as more banks continue to get approvals for their risk-based lending models, the banks’ loan books will continue to increasing and consequently increase the interest income,
- Revenue Diversification: In Q1’2022, Non-Funded Income recorded a 21.4% weighted average growth, a significant increase from the 2.9% growth recorded in Q1’2021, as more banks sought revenue diversification strategies. The banking sector’s Non-Funded Income to Operating Income slightly increased, coming in at 35.9% in Q1’2022, compared to 35.3% in Q1’2021. There exists an opportunity for the sector to further increase NFI contribution to revenue going forward. The expiry of the waiver on bank charges on 2nd March 2021 is also expected to continue spurring NFI growth in the medium-long term due to the increased adoption of digital channels, which present an avenue for an increase in fees on transactions. According to Central Bank Annual Report 2019/2020, 67.0% of banking transactions were conducted on mobile phones after the onset of the pandemic, compared to 55.0% of transactions before the pandemic. The increase in mobile-banking transactions therefore provides an opportunity for banks to increase their Non-Funded income going forward,
- Provisioning: Loan Loss Provisions recorded a weighted average decline of 13.8% in Q1’2022, compared to a growth of 5.5% in Q1’2021. However, given the resurgence of COVID-19 infections in the country as well as the uncertainties surrounding the upcoming elections which are likely to disrupt the economic environment, we believe that a cautious approach is still required to manage credit risk in the banking sector,
- Cost Rationalization: Most banks have continued to pursue their cost-cutting strategy by riding on the digital revolution wave to improve operational efficiency and the reliability of out-of-branch transactions. Increased adoption of alternative transaction channels such as mobile, internet, and agency banking has resulted in an increase in transactions carried out through alternative channels, limiting branch transactions to high-value transactions and other services such as advisory. This has seen banks reduce front-office operations, thereby cutting the number of staff required and by extension, reducing operating expenses and hence, improving operational efficiency. Increased efficiency has been witnessed across the listed banks with the cost to income ratio having declined by 3.3% points to 53.1% in Q1’2022, from 56.4% in Q1’2021. However, some of the banks such as NCBA and DTB-K have announced plans to open more branches with an aim of increasing their physical presence,
- Regional Expansion and Further Consolidation: With consolidation remaining a key theme going forward, the current environment may provide opportunities for larger banks with a sufficient capital base to expand and take advantage of the market's low valuations, as well as further consolidate out smaller and weaker banks. Notably, majority of the bigger banks have continued to cushion over unsystematic risks specific to the local market by expanding their operations into other African nations. Going forward, we expect banks like NCBA to boost their revenues through regional expansion following the announcement that the Group would venture into the Ghanaian market. Other banks like KCB and Equity Group have been leveraging on expansion and consolidation which has largely contributed to their increased asset base as well as earnings growth, and,
- Integration of Climate-Related Risk Management: Following the release of Guidance on Climate-Related Risk Management by the Central Bank of Kenya (CBK), we expect to see banks channel their long term financing into environmental-friendly assets that are more sustainable and have lower risk of damage loss as a result of climate change. Additionally, banks will focus on lending to companies whose activities do not pose an environmental risk and will ultimately lead to improvement of collateral quality consequently reducing their exposure to unexpected loss and obsolesce. This will lead to reduced non-performing loans and provisioning in the sector.
Section IV: Brief Summary and Ranking of the Listed Banks:
As per our analysis on the banking sector from a franchise value and a future growth opportunity perspective, we carried out a comprehensive ranking of the listed banks. For the franchise value ranking, we included the earnings and growth metrics as well as the operating metrics shown in the table below in order to carry out a comprehensive review of the banks:
|
Bank |
Loan to Deposit Ratio |
Cost to Income (With LLP) |
Return on Average Capital Employed |
Deposits/ Branch (bn) |
Gross NPL Ratio |
NPL Coverage |
Tangible Common Ratio |
Non Funded Income/Revenue |
|
ABSA Bank |
90.0% |
56.6% |
8.0% |
3.2 |
7.6% |
76.2% |
13.4% |
30.5% |
|
NCBA Group |
52.4% |
61.7% |
6.3% |
4.5 |
16.3% |
72.6% |
12.8% |
46.1% |
|
Equity Bank |
69.2% |
51.1% |
10.2% |
2.7 |
9.0% |
66.0% |
12.3% |
38.1% |
|
KCB Group |
83.3% |
51.7% |
8.5% |
1.7 |
16.9% |
52.7% |
15.0% |
32.0% |
|
SCBK |
48.3% |
47.0% |
7.2% |
12.1 |
15.4% |
81.8% |
15.4% |
33.6% |
|
Coop Bank |
79.0% |
53.8% |
7.9% |
2.3 |
13.9% |
65.3% |
16.2% |
38.2% |
|
Stanbic Bank |
87.8% |
56.8% |
6.4% |
9.4 |
11.1% |
59.1% |
14.4% |
44.7% |
|
DTBK |
65.5% |
53.2% |
5.1% |
2.7 |
12.6% |
42.2% |
14.5% |
24.3% |
|
I&M Holdings |
70.6% |
52.0% |
5.4% |
3.6 |
10.0% |
72.1% |
15.1% |
29.7% |
|
HF Group |
90.8% |
94.9% |
0.5% |
1.7 |
20.5% |
76.1% |
13.7% |
32.7% |
|
Weighted Average Q1’2022 |
73.9% |
53.1% |
8.2% |
3.9 |
12.5% |
65.1% |
14.1% |
35.9% |
|
Market cap weighted as at 08/06/2021 |
||||||||
The overall ranking was based on a weighted average ranking of Franchise value (accounting for 60.0%) and intrinsic value (accounting for 40.0%). The Intrinsic Valuation is computed through a combination of valuation techniques, with a weighting of 40.0% on Discounted Cash-flow Methods, 35.0% on Residual Income and 25.0% on Relative Valuation, while the Franchise ranking is based on banks operating metrics, meant to assess efficiency, asset quality, diversification, and profitability, among other metrics. The overall Q1’2022 ranking is as shown in the table below:
|
Bank |
Franchise Value Rank |
Intrinsic Value Rank |
Weighted Rank |
FY'2021 |
Q1’2022 |
|
Equity Group |
1 |
2 |
1.6 |
4 |
1 |
|
KCB Group |
4 |
1 |
2.2 |
3 |
2 |
|
I&M Holdings |
2 |
3 |
2.6 |
1 |
3 |
|
Co-operative Bank |
2 |
6 |
4.4 |
2 |
4 |
|
ABSA |
5 |
4 |
4.4 |
4 |
5 |
|
NCBA Group |
8 |
5 |
6.2 |
8 |
6 |
|
SCBK |
6 |
7 |
6.6 |
6 |
7 |
|
Stanbic Holdings |
7 |
8 |
7.6 |
7 |
8 |
|
Diamond Trust Bank |
10 |
9 |
9.4 |
9 |
9 |
|
HF Group |
9 |
10 |
9.6 |
10 |
10 |
Major Changes from the FY’2021 Ranking are:
- Equity Group’s rank improved to position 1 in Q1’2022 from position 4 in FY’2021 attributable to the improvement in its Net Interest Margin to 7.2%, from the 6.8% recorded in FY’2021, leading to an increase in the bank’s franchise value score, coupled with an improvement in the bank’s Loan to Deposits ratio, which recorded 7.9% points increase to 69.2% from 61.3% recorded in FY’2021,
- I&M Holdings’ rank declined to position 3 in Q1’2022 from position 1 in FY’2021 attributable to a decline in the bank‘s Gross NPL ratio to 10.0%, from the 9.5% recorded in FY’2021, leading to a decline in the bank’s franchise value score, and,
- Co-operative Bank’s rank declined to position 4 in Q1’2022 from position 2 in FY’2021, attributable to a decrease in the bank’s Net Interest Margin to 8.3%, from 8.6% in FY’2021. However, the bank’s Return on Average Equity increased to 19.3%, from 17.3% recorded in FY’2021.
For more information, see our Cytonn Q1’2022 Listed Banking Sector Review
Disclaimer: The views expressed in this publication are those of the writers where particulars are not warranted. This publication, which is in compliance with Section 2 of the Capital Markets Authority Act Cap 485A, is meant for general information only and is not a warranty, representation, advice or solicitation of any nature. Readers are advised in all circumstances to seek the advice of a registered investment advisor.

- Talk to us
- Kenya
- P.O Box 20695 - 00200, Nairobi, Kenya
- Cell +254709101200
- Tel +254709101200
- WhatsApp +254741676635
- United States
- +254709101200
- DOWNLOAD OUR APP
-


- Kenya
- 8th Floor, Pinetree Plaza, Kaburu Drive, Ngong Road, Nairobi, Kenya
- USA
- Suite 1150, 1775 Eye Street NW, USA, Washington DC 20006, USA
- Investments
- High Yield
- Private Equity
- Real Estate
- Real Estate
- RiverRun Estates
- Cytonn Towers
- The Ridge
- Taraji Heights
- The Alma