Kenya Mortgage Refinance Company (KMRC) Progress, & Cytonn Weekly #11/2022
By Research Team, Mar 20, 2022
Executive Summary
Fixed Income
During the week, T-bills were undersubscribed, with the overall subscription rate coming in at 82.8%, down from the 102.1% recorded the previous week. The 364-day paper recorded the highest subscription rate, receiving bids worth Kshs 9.7 bn against the offered Kshs 10.0 bn, translating to a subscription rate of 96.6%, a decline from the 133.9% recorded the previous week. The performance is partly attributable to investors’ preference for the longer-dated paper, which offers a higher yield of 9.8% compared to the 8.1% and 7.3% yields offered by the 182-day and 91-day papers, respectively. The subscription rate for the 182-day paper increased to 82.4%, from 58.1% recorded the previous week while that of the 91-day paper declined to 49.5% from 132.4% recorded the previous week. The government continued rejecting expensive bids, accepting bids worth Kshs 18.8 bn out of the Kshs 19.9 bn worth of bids received, translating to an acceptance rate of 94.8%. In the Primary Bond Market, the Central Bank of Kenya released results for the recently re-opened bonds on tap sale; FXD1/2021/05 FXD1/2020/15 and FXD1/2021/25. The tap sale recorded a subscription rate of 79.0% with the government receiving bids worth Kshs 24.9 bn against the offered Kshs 31.5 bn;
During the week, the Energy and Petroleum Regulatory Authority (EPRA) released their monthly statement on the maximum fuel prices in Kenya effective 15th March 2022 to 14th April 2022 highlighting that super petrol and diesel prices increased by 3.9% and 4.5% to Kshs 134.7 per litre and Kshs 115.6 per litre, respectively, from Kshs 129.7 per litre and Kshs 110.6 per litre recorded last month. The price of Kerosene remained unchanged at Kshs 103.5 per litre, same as recorded in the previous month. Also during the week, the World Bank approved a USD 750 mn (Kshs 80.9 bn) loan facility aimed at accelerating Kenya’s ongoing inclusive and resilient recovery from the COVID-19 pandemic, and, strengthening fiscal sustainability reforms that contribute to greater transparency and the fight against corruption;
Equities
During the week, the equities market was on a downward trajectory, with NASI, NSE 20 and NSE 25 declining by 1.4%, 0.2% and 0.5%, respectively, taking their YTD performance to losses of 6.1%, 2.8% and 4.3% for NASI, NSE 20 and NSE 25, respectively. The equities market performance was driven by losses recorded by large cap stocks such as Bamburi, Safaricom and EABL of 3.1%, 2.8% and 2.3%, respectively. The losses were however mitigated by gains recorded by other large cap stocks such as Standard Chartered Bank (SCBK), Co-operative Bank and ABSA of 6.7%, 3.5% and 2.5%, respectively;
During the week, ABSA Bank, KCB Group, Standard Chartered Bank (SCBK) and Co-operative Bank released their FY’2021 financial results highlighting a 161.2%, 74.3%, 66.2%, and 53.0% increase in their core earnings per share, respectively. As of now, five out of the ten listed banks have released their FY’2021 results;
Real Estate
During the week, the Kakamega County Investment and Development Agency (KCIDA), in collaboration with Pinnie Agency Limited, a private developer, began construction of 3,000 affordable housing units in 5 estates within Kakamega and Mumias towns. Also, Unity Homes, a Kenyan-British housing developer announced plans to launch the construction of its third phase of housing units in Tatu City, Ruiru. Additionally, International Finance Corporation (IFC) announced plans to buy Kshs 4.2 bn worth of bonds in Kenya Mortgage Refinance Company’s Kshs 10.5 bn Medium Term Note Program (MTN). Lastly, South Korea Government granted Kenya Kshs 685.9 mn for the construction of transport infrastructure, planning and security installations at the Konza Technopolis City Project;
In the Retail sector, Naivas supermarket, a local retail chain, opened its 82nd outlet at Katani, along Mombasa Road, taking up 34,299 SQFT worth of space in the area. In the industrial sector, Grit Real Estate Income Group, a Mauritius based Real Estate Investment Company, completed the purchase of Orbit Products Africa, a warehouse and manufacturing facility located in Machakos County, at a cost of Kshs 6.1 bn. For the listed Real Estate, ILAM Fahari I-Reit closed the week trading at an average price of Kshs 5.8 per share;
Focus of the Week
With availability of affordable mortgage finance being one of key challenge towards home ownership in Kenya, the government through the Central Bank of Kenya, established the Kenya Mortgage Refinance Company (KMRC). The company was incorporated in April 2018 as a non- deposit taking financial institution under the supervision of the Central Bank of Kenya with the single purpose of providing long-term funds to primary mortgage lenders (Banks, Micro Finance Banks and SACCOs), in order to increase the availability and affordability of mortgage loans to Kenyans. This week we update progress of KMRC by highlighting their latest initiatives to achieve their objectives and offer recommendations on how to boost finance for refinancing mortgages, based on similar initiatives from other countries.
Investment Updates:
- Weekly Rates:
- Cytonn Money Market Fund closed the week at a yield of 10.43%. To invest, dial *809#;
- Cytonn High Yield Fund closed the week at a yield of 13.93% p.a. To invest, email us at sales@cytonn.com and to withdraw the interest, dial *809#;
- Justin Mwangi, a Senior Investment Analyst, was on a panel on Twitter Spaces to discuss the Performance of the Kenya Shilling and How to Reverse the Depreciation. Listen to Justin here,
- We continue to offer Wealth Management Training every Thursday and every third Saturday of the month, from 9:00 am to 11:00 am, through our Cytonn Foundation. The training aims to grow financial literacy among the general public. To register for any of our Wealth Management Trainings, click here;
- If interested in our Private Wealth Management Training for your employees or investment group, please get in touch with us through wmt@cytonn.com;
- Any CHYS and CPN investors still looking to convert are welcome to consider one of the five projects currently available for conversion, click here for the latest conversion term sheet;
- Cytonn Insurance Agency acts as an intermediary for those looking to secure their assets and loved ones’ future through insurance namely; Motor, Medical, Life, Property, WIBA, Credit and Fire and Burglary insurance covers. For assistance, get in touch with us through insuranceagency@cytonn.com;
- Cytonnaire Savings and Credit Co-operative Society Limited (SACCO) provides a savings and investments avenue to help you in your financial planning journey. To enjoy competitive investment returns, kindly get in touch with us through clientservices@cytonn.com;
Real Estate Updates:
- For an exclusive tour of Cytonn’s real estate developments, visit: Sharp Investor's Tour, and for more information, email us at sales@cytonn.com;
- Phase 3 of The Alma is now ready for occupation. To rent please email properties@cytonn.com;
- We have 8 investment-ready projects, offering attractive development and buyer targeted returns; See further details here: Summary of Investment-ready Projects;
- For recent news about the group, see our news section here;
Hospitality Updates:
- We currently have promotions for Staycations. Visit cysuites.com/offers for details or email us at sales@cysuites.com;
Money Markets, T-Bills & T-Bonds Primary Auction:
During the week, T-bills were undersubscribed, with the overall subscription rate coming in at 82.8%, down from the 102.1% recorded the previous week. The 364-day paper recorded the highest subscription rate, receiving bids worth Kshs 9.7 bn against the offered Kshs 10.0 bn, translating to a subscription rate of 96.6%, a decline from the 133.9% recorded the previous week. The performance is partly attributable to investors’ preference for the longer-dated paper, which offers a higher yield of 9.8% compared to the 8.1% and 7.3% yields offered by the 182-day and 91-day papers, respectively. The subscription rate for the 182-day paper increased to 82.4%, from 58.1% recorded the previous week while that of the 91-day paper declined to 49.5%, from 132.4% recorded the previous week. The yields on the government papers recorded a mixed performance with yields on the 182-day and 91-day papers increasing by 6.1 bps and 4.6 bps to 8.1% and 7.3%, respectively, while yields on the 364-paper declined by 0.8 bps to 9.8%. The government continued rejecting expensive bids, accepting bids worth Kshs 18.8 bn out of the Kshs 19.9 bn worth of bids received, translating to an acceptance rate of 94.8%.
In the Primary Bond Market, the Central Bank of Kenya re-opened the three recently issued bonds on tap sale; FXD1/2021/05 FXD1/2020/15 and FXD1/2021/25, with tenors to maturity of 4.7 years, 12.9 years and 24.2 years, and coupons of 11.3%, 12.8% and 13.9% respectively. The Government sought to raise Kshs 31.5 bn for budgetary support, following an undersubscription of the initial offers, which had a total subscription rate coming in at 81.9%, partly attributable to the tightened liquidity in the money markets during the bonds’ sale period, with the interbank rate averaging 5.6%, in comparison to an average rate of 4.7% in February 2022. The tap sale was undersubscribed, with the overall subscription rate came in at 79.0%, partly attributable to the short bidding period. The government received bids worth Kshs 24.9 bn, lower than the Kshs 31.5 bn offered and continued to reject expensive bids, accepting only Kshs 23.9 bn. This translated to an acceptance rate of 95.9%. The weighted average yields for the three bonds were 12.0% for FXD1/2021/05, 13.7% for FXD1/2020/15 and 14.0% for FXD1/2021/25.
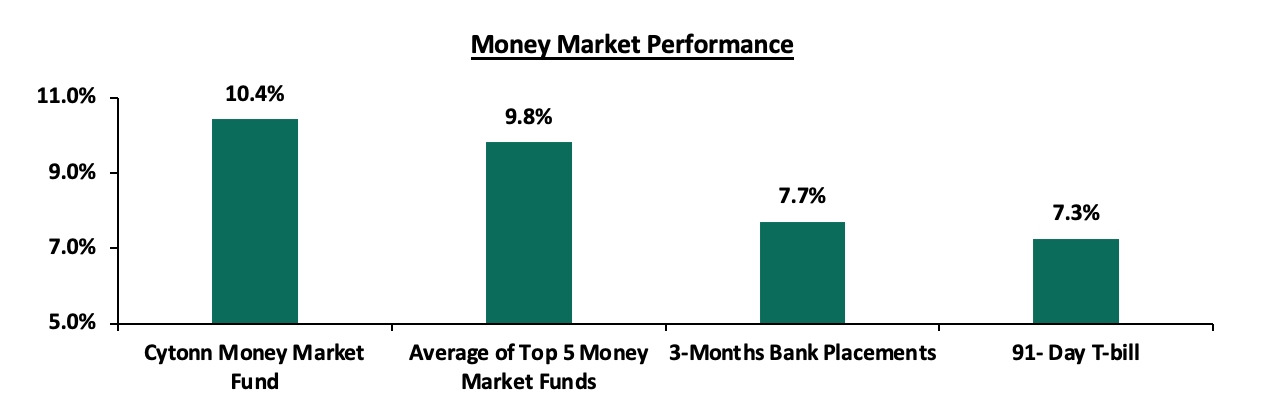
In the money markets, 3-month bank placements ended the week at 7.7% (based on what we have been offered by various banks), while the yield on the 91-day T-bill increased by 4.6 bps to 7.3%. The average yield of the Top 5 Money Market Funds remained unchanged at 9.8%, as was recorded the previous week while the yield on the Cytonn Money Market Fund declined by 0.2% points to 10.4%, from 10.6% recorded the previous week.
The table below shows the Money Market Fund Yields for Kenyan Fund Managers as published on 18th March 2022:
|
Money Market Fund Yield for Fund Managers as published on 18th March 2022 |
||
|
Rank |
Fund Manager |
Effective Annual Rate |
|
1 |
Cytonn Money Market Fund |
10.4% |
|
2 |
Zimele Money Market Fund |
9.9% |
|
3 |
Nabo Africa Money Market Fund |
9.7% |
|
4 |
Sanlam Money Market Fund |
9.7% |
|
5 |
Madison Money Market Fund |
9.4% |
|
6 |
Apollo Money Market Fund |
9.4% |
|
7 |
GenCap Hela Imara Money Market Fund |
9.3% |
|
8 |
Dry Associates Money Market Fund |
9.1% |
|
9 |
CIC Money Market Fund |
9.0% |
|
10 |
Orient Kasha Money Market Fund |
8.7% |
|
11 |
Co-op Money Market Fund |
8.6% |
|
12 |
NCBA Money Market Fund |
8.4% |
|
13 |
ICEA Lion Money Market Fund |
8.3% |
|
14 |
British-American Money Market Fund |
8.3% |
|
15 |
AA Kenya Shillings Fund |
8.2% |
|
16 |
Old Mutual Money Market Fund |
7.4% |
Source: Business Daily
Liquidity:
During the week, liquidity in the money markets eased, with the average interbank rate declining by 0.8% points to 4.3%, from 5.1%, as recorded the previous week, partly attributable to government payments which offset tax remittances. The average interbank volumes traded increased by 40.2% to Kshs 17.2 bn, from Kshs 12.3 bn recorded the previous week.
Kenya Eurobonds:
During the week, the yields on Kenyan Eurobonds were on a downward trajectory, partly attributable to positive investor sentiments, following the approval of a USD 750.0 mn (Kshs 80.9 bn) loan facility from the World Bank to be used for fiscal reforms. Yields on the 30-year bond issued in 2018 and 12-year bond issued in 2021 declined by 0.5% points to 9.4% and 8.4%, respectively. Similarly, yields on the 10-year bond issued in 2014 declined by 0.2% points to 6.5%, while yields on the 7-year bond issued in 2019 and 12-year bond issued in 2019 both declined by 0.7% points to 8.3% and 8.7%, respectively. Yields on the 10-year Eurobond issued in 2018 declined by 0.9% points to 8.2%. Below is a summary of the performance:
|
Kenya Eurobond Performance |
||||||
|
|
2014 |
2018 |
2019 |
2021 |
||
|
Date |
10-year issue |
10-year issue |
30-year issue |
7-year issue |
12-year issue |
12-year issue |
|
3-Jan-22 |
4.4% |
5.8% |
8.1% |
5.6% |
6.7% |
6.6% |
|
1-Mar-22 |
5.3% |
8.2% |
9.7% |
8.2% |
8.2% |
8.5% |
|
11-Mar-22 |
6.7% |
9.1% |
9.9% |
9.0% |
9.4% |
8.9% |
|
14-Mar-22 |
6.7% |
8.9% |
9.8% |
8.8% |
9.2% |
8.8% |
|
15-Mar-22 |
6.4% |
8.7% |
9.7% |
8.4% |
9.0% |
8.5% |
|
16-Mar-22 |
6.5% |
8.2% |
9.4% |
8.3% |
8.7% |
8.4% |
|
17-Mar-22 |
6.5% |
8.2% |
9.4% |
8.3% |
8.7% |
8.4% |
|
Weekly Change |
(0.2%) |
(0.9%) |
(0.5%) |
(0.7%) |
(0.7%) |
(0.5%) |
|
MTD Change |
1.2% |
(0.1%) |
(0.3%) |
0.1% |
0.5% |
(0.1%) |
|
YTD Change |
2.1% |
2.4% |
1.3% |
2.7% |
2.0% |
1.8% |
Source: CBK
Kenya Shilling:
During the week, the Kenyan shilling depreciated by 0.2% against the US dollar, to close the week at Kshs 114.4, from Kshs 114.2 recorded the previous week, partly attributable to increased dollar demand from the oil and energy sectors. Key to note, this is the lowest the Kenyan shilling has ever depreciated against the dollar. On a year to date basis, the shilling has depreciated by 1.1% against the dollar, in comparison to the 3.6% depreciation recorded in 2021. We expect the shilling to remain under pressure in 2022 as a result of:
- Rising global crude oil prices on the back of supply constraints and geopolitical pressures at a time when demand is picking up with the easing of COVID-19 restrictions and as economies reopen. Key to note, risks abound the recovery following the emergence of the new COVID-19 variants,
- Increased demand from merchandise traders as they beef up their hard currency positions in anticipation for more trading partners reopening their economies globally,
- An ever present current account deficit due to an imbalance between imports and exports, with Kenya’s current account deficit estimated to come in at 5.4% of GDP in 2021, having expanded by 44.6% to Kshs 127.6 bn in November 2021, from Kshs 88.3 bn recorded in November 2020, attributable to a robust increase in commercial imports by 37.1% to Kshs 185.9 bn in November 2021, from Kshs 88.3 bn in November 2020, and,
- The aggressively growing government debt, with Kenya’s public debt having increased at a 10-year CAGR of 18.4% to Kshs 8.0 tn in December 2021, from Kshs 1.5 tn in December 2011 thus putting pressure on forex reserves to service some of the public debt.
The shilling is however expected to be supported by:
- High Forex reserves currently at USD 8.0 bn (equivalent to 4.9-months of import cover), which is above the statutory requirement of maintaining at least 4.0-months of import cover, and the EAC region’s convergence criteria of 4.5-months of import cover. In addition, the reserves were boosted by the USD 1.0 bn proceeds from the Eurobond issued in July 2021 coupled with the USD 972.6 mn IMF disbursement, the USD 130.0 mn World Bank loan financing received in June 2021 and USD 750.0 mn which has recently been approved by the World Bank in March 2022, and,
- Improving diaspora remittances evidenced by a 23.5% y/y increase to USD 321.5 mn in February 2022, from USD 260.3 mn recorded over the same period in 2021, which has continued to cushion the shilling against further depreciation.
Weekly Highlights:
- Fuel Prices
During the week, the Energy and Petroleum Regulatory Authority (EPRA) released their monthly statement on the maximum fuel prices in Kenya effective 15th March 2022 to 14th April 2022. Notably, super petrol and diesel prices increased by 3.9% and 4.5% to Kshs 134.7 per litre and Kshs 115.6 per litre, from Kshs 129.7 per litre and Kshs 110.6 per litre, respectively, while the price of Kerosene remained unchanged at Kshs 103.5 per litre. Key to note, this is the first increase in prices for Super Petrol and Diesel since October 2021 and the prices are the highest ever recorded in the country. Below are the key take-outs from the statement:
The performance in fuel prices was attributable to:
- An increase in the average landed costs of Super Petrol by 13.3% to USD 676.4 per cubic meter in February 2022, from USD 596.8 per cubic meter in January 2022,
- An increase in the average landed costs of Diesel by 11.7% to USD 677.3 per cubic meter in February 2022, from USD 606.2 per cubic meter in January 2022,
- An increase in the average landed costs of Kerosene by 15.9% to USD 619.6 per cubic meter in February 2022, from USD 534.4 per cubic meter in January 2022, and,
- The depreciation of the Kenyan shilling during the period by 0.2% to Kshs 113.8 in February 2022, from Kshs 113.6 in January 2022.
However, the fuel prices were supported from further increase by:
- The fuel subsidy program under the Petroleum Development Fund which resulted in subsidies of Kshs 20.4 on Super Petrol, Kshs 27.6 on Diesel and Kshs 26.9 on Kerosene during the month,
- Removal of suppliers margins of Kshs 6.3 on Super Petrol, Kshs 5.5 on Diesel and Kshs 7.7 on Kerosene since October 2021, and,
- The decline in the Free on Board (FOB) price of Murban crude oil in February 2022 by 9.4% to USD 74.4 per barrel, from USD 82.0 per barrel in January 2022.
Since the beginning of the year, global fuel prices have continued to increase, recording a 34.5% rise to USD 105.0 per barrel, from USD 78.0 per barrel recorded on 1st January 2022, driven by persistent supply chain constraints worsened by the geopolitical pressures occasioned by the Russian invasion of Ukraine. Given the continuous increase in the average landed costs of fuel locally, we believe that the fuel subsidy program by the National Treasury stands at risk of being depleted and is unsustainable, as evidenced by the increased compensation amounts which further increase the possibility of depletion. Despite the additional Kshs 24.9 bn for stabilization of oil market prices and the rationalization of Capital expenditure, the National Treasury would have to disburse Kshs 15.0 bn to meet the full subsidy in the period of review. As such, the additional amount to the program would be depleted in two months. Key to note, the compensation amounts for March 2022 increased by 40.3%, 18.3% and 69.4% to Kshs 20.4, Kshs 27.6 and Kshs 26.9 per litre from Kshs 14.5, Kshs 23.3 and Kshs 15.9 for Super Petrol, Diesel and Kerosene, respectively in February 2022. Additionally, the monthly average subsidy for the past six months starting October 2021 is Kshs 14.7 per litre for Super Petrol, Kshs 19.4 per litre for Diesel and Kshs 17.2 per litre for Kerosene. Due to the supply chain constraints in the global fuel markets, we expect the sustained high fuel prices to trickle down to our economy in the near future. With fuel prices being a major input cost in majority of Kenya’s sectors such as manufacturing, transport and energy, we expect the increasing fuel prices to exert upward pressure on the inflation basket with fuel being a major contributor to Kenya’s headline inflation and an elevation in the cost of living.
- Revenue and Net Exchequer for FY’2021/2022
The National Treasury gazetted the revenue and net expenditures for the first eight months of FY’2021/2022, ending 28th February 2022. Below is a summary of the performance:
|
FY'2021/2022 Budget Outturn - As at 28th February 2022 |
|||||
|
Amounts in Kshs billions unless stated otherwise |
|||||
|
Item |
12-months Original Estimates |
Actual Receipts/Release |
Percentage Achieved |
Prorated Estimates |
% achieved of prorated |
|
Opening Balance |
- |
21.3 |
- |
- |
- |
|
Tax Revenue |
1,707.4 |
1,126.4 |
66.0% |
1,138.3 |
99.0% |
|
Non-Tax Revenue |
68.2 |
45.1 |
66.1% |
45.5 |
99.2% |
|
Total Revenue |
1,775.6 |
1,192.8 |
67.2% |
1,183.8 |
100.8% |
|
External Loans & Grants |
379.7 |
50.0 |
13.2% |
253.1 |
19.7% |
|
Domestic Borrowings |
1,008.4 |
631.1 |
62.6% |
672.3 |
93.9% |
|
Other Domestic Financing |
29.3 |
5.5 |
18.8% |
19.5 |
28.2% |
|
Total Financing |
1,417.4 |
686.6 |
48.4% |
944.9 |
72.7% |
|
Recurrent Exchequer issues |
1,106.6 |
709.3 |
64.1% |
737.7 |
96.2% |
|
CFS Exchequer Issues |
1,327.2 |
750.9 |
56.6% |
884.8 |
84.9% |
|
Development Expenditure and Net Lending |
389.2 |
191.8 |
49.3% |
259.5 |
73.9% |
|
County Governments and Contingencies |
370.0 |
193.7 |
52.3% |
246.7 |
78.5% |
|
Total Expenditure |
3,193.0 |
1,845.7 |
57.8% |
2,128.7 |
86.7% |
|
Fiscal Deficit excluding Grants |
(1,417.4) |
(652.9) |
46.1% |
(944.9) |
69.1% |
|
Fiscal Deficit as a % of GDP |
*11.4% |
5.3% |
|||
|
Total Borrowing |
1,388.1 |
681.1 |
49.1% |
925.4 |
73.6% |
|
*Projected Fiscal Deficit as a % of GDP |
|||||
The key take-outs from the report include:
- Total revenue collected as at the end of February 2022 amounted to Kshs 1,192.8 bn, equivalent to 67.2% of the original estimates of Kshs 1,775.6 bn and is 100.8% of the prorated estimates of Kshs 1,183.8 bn. Notably, the performance is a decline from the 103.8% outperformance recorded in the first seven months to January 2021, mainly attributable to a 26.9% decline in the monthly revenue collection to Kshs 117.6 bn in February 2022, as compared to a monthly average of Kshs 160.9 bn in the first seven months to January 2021. Cumulatively, tax revenues amounted to Kshs 1,126.4 bn, equivalent to 66.0% of the original estimates of Kshs 1,707.4 bn and 99.0% of the prorated estimates of Kshs 1,138.3 bn,
- Total financing amounted to Kshs 686.6 bn, equivalent to 48.4% of the original estimates of Kshs 1,417.4 bn and is equivalent to 72.7% of the prorated estimates of Kshs 944.9 bn. Additionally, domestic borrowing amounted to Kshs 631.1 bn, equivalent to 62.6% of the original estimates of Kshs 1,008.4 bn and is 93.9% of the prorated estimates of Kshs 672.3 bn,
- The total expenditure amounted to Kshs 1.845.7 bn, equivalent to 56.5% of the original estimates of Kshs 3,193.0 bn, and is 84.7% of the prorated expenditure estimates of Kshs 2,128.7 bn. Additionally, the net disbursements to recurrent expenditures came in at Kshs 709.3 bn, equivalent to 64.1% of the original estimates and 96.2% of the prorated estimates of Kshs 737.7 bn, and development expenditure amounted to Kshs 191.8 bn, equivalent to 49.3% of the original estimates of Kshs 389.2 bn and is 73.9% of the prorated estimates of Kshs 259.5 bn,
- Consolidated Fund Services (CFS) Exchequer issues lagged behind their targets of Kshs 1,327.2 bn after amounting to Kshs 750.9 bn, equivalent to 56.6% of the original estimates, and are 84.9% of the prorated amount of Kshs 884.8 bn. The cumulative public debt servicing cost amounted to Kshs 667.2 bn which is 57.1% of the original estimates of Kshs 1,169.2 bn, and is 85.6% of the prorated estimates of Kshs 779.4 bn, and,
- Total Borrowings as at the end of February 2022 amounted to Kshs 681.1 bn, equivalent to 49.1% of the original estimates of Kshs 1,388.1 bn and are 73.6% of the prorated estimates of Kshs 925.4 bn. The cumulative domestic borrowing target of Kshs 1.0 tn comprises of adjusted Net domestic borrowings of Kshs 661.6 bn and Internal Debt Redemptions (Roll-overs) of Kshs 346.8 bn.
The revenue performance in the first eight months of the current fiscal year point towards continued economic recovery following the ease of COVID-19 containment measures and the effectiveness of the KRA in revenue collection. We believe that the current measures such as the implementation of the Finance Act 2021 which led to the upward readjustment of the Excise Duty Tax, Income Tax as well as the Value Added Tax will continue playing a big role in expanding the tax base and consequently enhance revenue collection. However, the approval of the 2021/22 supplementary budget will increase the fiscal deficit to an estimate of 12.9% of GDP, from the earlier estimated deficit of 11.4% of GDP for FY’2021/22. We expect the government to ramp up its revenue collection initiatives in the remaining 4 months of the current year as well as look increasingly to the domestic market to plug in the deficit. The emergence of new COVID-19 variants both locally and with trading partners globally continues to pose risks to the economic recovery, should they necessitate imposition of tight containment measures.
- World Bank Loan Facility
During the week, the World Bank approved a USD 750 mn (Kshs 80.9 bn) loan facility aimed at accelerating Kenya’s ongoing inclusive and resilient recovery from the COVID-19 pandemic, coupled with strengthening fiscal sustainability reforms that contribute to greater transparency and the fight against corruption. The loan facility is the second under the Development Policy Operation (DPO) and adds to the USD 750.0 mn issued to the country in June 2021 to provide low-cost budget financing along with support to key policy and institutional reforms. The new loan facility will be offered under concessional terms, and will attract an interest cost of 3.0% p.a. The DPO will organize the multi-sector reforms into three pillars; i) fiscal and debt reforms to make spending more transparent and efficient, and enhance domestic debt market performance, ii) electricity sector and public-private partnership (PPP) reforms to place Kenya on an efficient, green energy path, and boost private infrastructure investment, and, iii) strengthening the governance framework of Kenya’s natural and human capital which includes the environment, land, water and healthcare.
Upon receipt of the USD 750.0 mn (Kshs 80.9 bn), Kenya’s external debt is expected to increase by 1.9% to Kshs 4.3 tn, from Kshs 4.2 tn and the total debt to Kshs 8.1 tn from 8.0 tn, as of December 2021. As a result, the public debt to GDP ratio will increase to by 0.7% points to 66.9%, from 66.2% in December 2021 and will be 16.9% points above the International Monetary Fund (IMF)’s recommended threshold for developing nations, which is capped at 50.0%. We expect that the facility requirements will help to accelerate fiscal reforms in the country that will help to reduce the fiscal deficit, currently at 5.3%, in order to reduce the need for Government borrowing to bridge the gap. Additionally, inflows from the facility will help to shore up and increase the country’s foreign exchange reserves which will provide adequate import cover. However, with the loan facility being US Dollar (USD) denominated, we expect pressure on the shilling especially as the debt servicing period begins. Year to date, the shilling has depreciated by 1.1% against the USD to close at 114.4, from Kshs 113.1 recorded on 3rd January 2021.
Rates in the Fixed Income market have remained stable due to the relatively ample liquidity in the money market. The government is 7.8% ahead of its prorated borrowing target of Kshs 481.2 bn having borrowed Kshs 518.5 bn of the Kshs 658.5 bn borrowing target for the FY’2021/2022. We expect a gradual economic recovery as evidenced by the revenue collections of Kshs 1.2 tn during the first eight months of the current fiscal year, which was equivalent to 100.8% of the prorated revenue collection target. However, despite the projected high budget deficit of 11.4% and the lower credit rating from S&P Global to 'B' from 'B+', we believe that the support from the IMF and World Bank will mean that the interest rate environment will remain stable since the government is not desperate for cash. Owing to this, our view is that investors should be biased towards short-term fixed-income securities to reduce duration risk.
Markets Performance
During the week, the equities market was on a downward trajectory, with NASI, NSE 20 and NSE 25 declining by 1.4%, 0.2% and 0.5%, respectively, taking their YTD performance to losses of 6.1%, 2.8% and 4.3% for NASI, NSE 20 and NSE 25, respectively. The equities market performance was driven by losses recorded by large cap stocks such as Bamburi, Safaricom and EABL of 3.1%, 2.8% and 2.3%, respectively. The losses were however mitigated by gains recorded by other large cap stocks such as Standard Chartered Bank (SCBK), Co-operative Bank and ABSA of 6.7%, 3.5% and 2.5%, respectively.
During the week, equities turnover declined by 37.7% to USD 13.3 mn, from USD 21.4 mn recorded the previous week, taking the YTD turnover to USD 210.9 mn. Foreign investors remained net sellers, with a net selling position of USD 1.7 mn, from a net selling position of USD 3.8 mn recorded the previous week, taking the YTD net selling position to USD 10.9 mn.
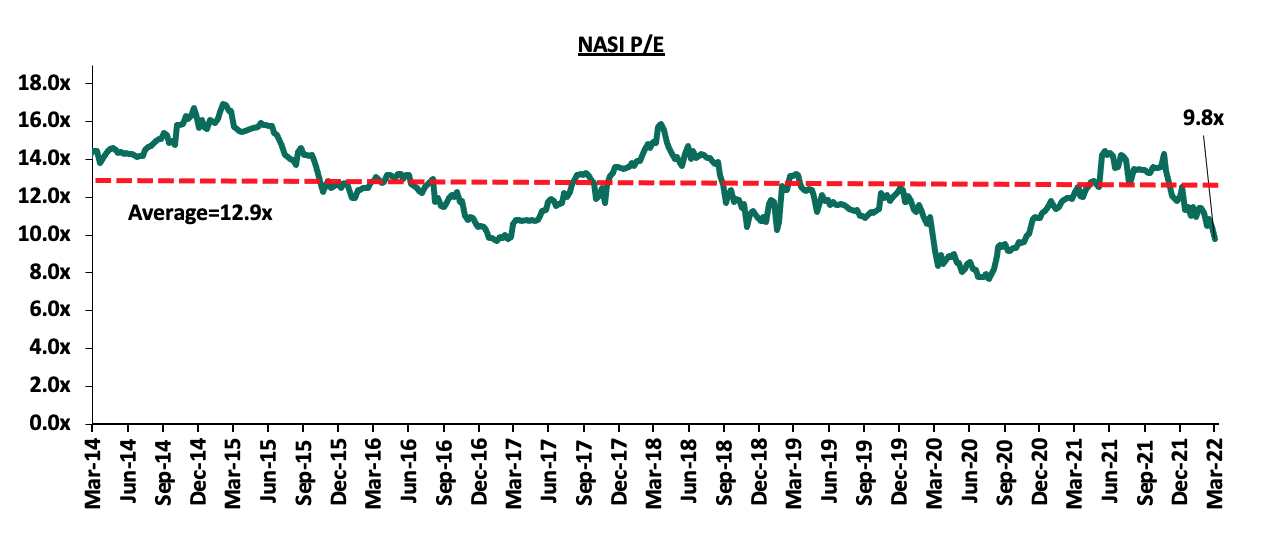
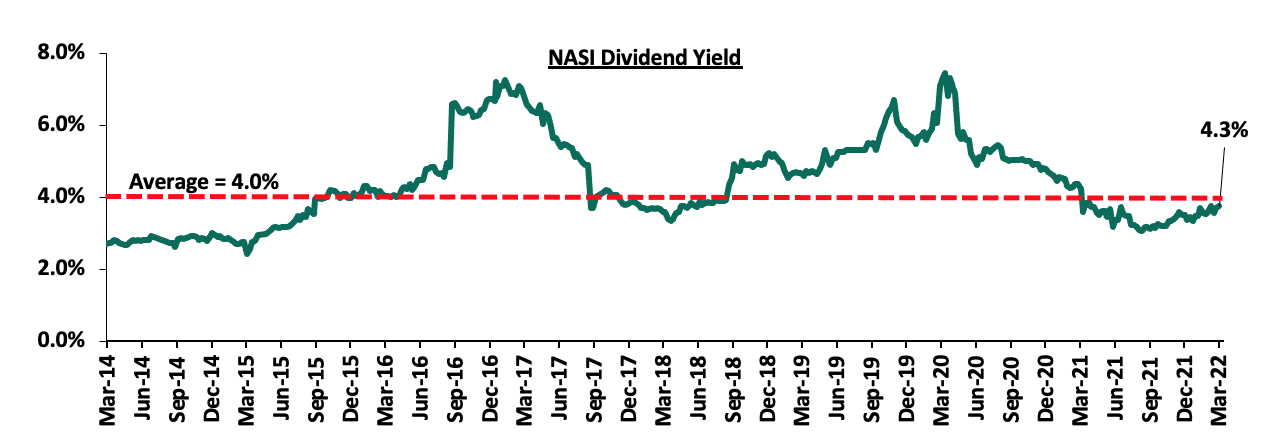
The market is currently trading at a price to earnings ratio (P/E) of 9.8x, 23.9% below the historical average of 12.9x, and a dividend yield of 4.3%, 0.3% points above the historical average of 4.0%. Key to note, NASI’s PEG ratio currently stands at 1.3x, an indication that the market is trading at a premium to its future earnings growth. A PEG ratio greater than 1.0x indicates the market may be overvalued while a PEG ratio less than 1.0x indicates that the market is undervalued. The current P/E valuation of 9.8x is 27.4% above the most recent trough valuation of 7.7x experienced in the first week of August 2020. The charts below indicate the historical P/E and dividend yields of the market:
Weekly Highlight:
Earnings Releases
During the week, ABSA Bank, Standard Chartered Bank (SCBK), KCB Group and Co-operative Bank released their FY’2021 financial results. Below is a summary of their performance;
- KCB Group
|
KCB Group FY’2021 Key Highlights |
|||||
|
Balance Sheet |
|||||
|
Balance Sheet Items |
FY'2020 (Kshs bn) |
FY'2021 (Kshs bn) |
y/y change |
||
|
Net Loans and Advances |
595.3 |
675.5 |
13.5% |
||
|
Government Securities |
208.8 |
270.8 |
29.7% |
||
|
Total Assets |
987.8 |
1,139.7 |
15.4% |
||
|
Customer Deposits |
767.2 |
837.1 |
9.1% |
||
|
Deposits per Branch |
2.1 |
1.7 |
20.4% |
||
|
Total Liabilities |
845.4 |
966.2 |
14.3% |
||
|
Shareholders’ Funds |
142.4 |
171.7 |
20.6% |
||
|
Income Statement |
|||||
|
Income Statement Items |
FY'2020 (Kshs bn) |
FY'2021 (Kshs bn) |
y/y change |
||
|
Net Interest Income |
67.9 |
77.7 |
14.4% |
||
|
Net non-Interest Income |
28.5 |
30.9 |
8.8% |
||
|
Total Operating income |
96.4 |
108.6 |
12.7% |
||
|
Loan Loss provision |
(27.5) |
(13.0) |
(52.8%) |
||
|
Total Operating expenses |
(70.7) |
(60.8) |
(13.9%) |
||
|
Profit before tax |
25.7 |
47.8 |
85.9% |
||
|
Profit after tax |
19.6 |
34.2 |
74.3% |
||
|
Core EPS |
6.10 |
10.63 |
74.3% |
||
|
Key Ratios |
|||||
|
Income Statement Ratios |
FY'2020 |
FY'2021 |
% point change |
||
|
Yield from interest-earning assets |
11.1% |
11.1% |
0.0% |
||
|
Cost of funding |
2.7% |
2.8% |
0.1% |
||
|
Net Interest Margin |
8.5% |
8.4% |
(0.1%) |
||
|
Non-Performing Loans (NPL) Ratio |
14.8% |
16.6% |
1.8% |
||
|
NPL Coverage |
59.8% |
52.9% |
(6.9%) |
||
|
Cost to Income With LLP |
73.3% |
56.0% |
(17.3%) |
||
|
Loan to Deposit Ratio |
77.6% |
80.7% |
3.1% |
||
|
Cost to Income Without LLP |
44.8% |
44.0% |
(0.8%) |
||
|
Return on average equity |
14.4% |
21.8% |
7.4% |
||
|
Return on average assets |
2.1% |
3.2% |
1.1% |
||
|
Equity to Assets |
14.4% |
15.1% |
0.7% |
||
|
Capital Adequacy Ratios |
|||||
|
Ratios |
FY'2020 |
FY'2021 |
% points change |
||
|
Core Capital/Total Liabilities |
18.7% |
18.7% |
0.0% |
||
|
Minimum Statutory ratio |
8.0% |
8.0% |
|
||
|
Excess |
10.7% |
10.7% |
0.0% |
||
|
Core Capital/Total Risk Weighted Assets |
18.2% |
18.0% |
(0.2%) |
||
|
Minimum Statutory ratio |
10.5% |
10.5% |
|
||
|
Excess |
7.7% |
7.5% |
(0.2%) |
||
|
Total Capital/Total Risk Weighted Assets |
21.6% |
22.1% |
0.5% |
||
|
Minimum Statutory ratio |
14.5% |
14.5% |
|
||
|
Excess |
7.1% |
7.6% |
0.5% |
||
Key take-outs from the earnings release include;
- Core earnings per share rose by 74.3% to Kshs 10.6, from Kshs 6.1 in FY’2020, lower than our expectations of a 92.5% increase to Kshs 11.7, with the variance stemming from the 12.7% increase in total operating income, which was lower than our projection of a 16.0% increase. The performance was driven by the 12.7% growth in total operating income to Kshs 108.6 bn, from Kshs 96.4 bn in FY’2020, and a 13.9% decline in total operating expenses to Kshs 60.8 bn, from Kshs 70.7 bn in FY’2020,
- Interest income grew by 15.1% to Kshs 102.2 bn, from Kshs 88.7 bn in FY’2020, mainly driven by a 14.2% increase in interest income from loans and advances, which increased to Kshs 74.0 bn, from Kshs 64.8 bn in FY’2020, coupled with a 14.5% increase in interest income from government securities which increased to Kshs 26.5 bn, from Kshs 23.2 bn in FY’2020,
- The Yield on Interest-Earning Assets (YIEA) rose marginally by 0.02% points to 11.11%, from 11.09% recorded in FY’2020, attributable to the faster 15.1% growth in trailing interest income which slightly outpaced the 14.9% growth in Average Interest Earning Assets (AIEA),
- Interest expense rose by 17.6% to Kshs 24.5 bn, from Kshs 20.8 bn in FY’2020, following a 76.6% rise in Interest expense on deposits and placements to Kshs 3.4 bn, from Kshs 2.0 bn in FY’2020, coupled with an 8.7% increase in interest expense on customer deposits to Kshs 20.5 bn, from Kshs 18.9 bn in FY’2020. Consequently, Cost of funds (COF) increased marginally by 0.1% points to 2.8%, from 2.7% recorded in FY’2020, following a faster 17.6% increase in Trailing interest expense, which outpaced the 12.3% increase in average interest bearing liabilities,
- Net Interest Margin (NIM) therefore declined to 8.4%, from 8.5% in FY’2020 due to the faster 14.9% growth in average interest-earning assets, which outpaced the 14.4% increase in trailing Net Interest Income,
- Total operating expenses decreased by 13.9% to Kshs 60.8 bn, from Kshs 70.7 bn in FY’2020, largely driven by a 52.8% decline in Loan Loss Provisions (LLP) to Kshs 13.0 bn, from Kshs 27.5 bn in FY’2020. The reduced provisioning level was due to declining credit risk on the back of increased business activities in 2021 driven by the gradual economic recovery. Staff costs increased by 20.9% to Kshs 24.7 bn, from Kshs 20.5 bn in FY’2020,
- The balance sheet recorded an expansion as total assets grew by 15.4% to Kshs 1,139.7 bn, from Kshs 987.8 bn in FY’2020. The growth was supported by a 13.5% loan book expansion to Kshs 675.5 bn, from Kshs 595.3 bn in FY’2020, coupled with a 29.7% increase in government securities to Kshs 270.8 bn, from Kshs 208.8 bn in FY’2020. The significant expansion in the balance sheet is also partly attributable to the acquisition of Banque Populaire du Rwanda (BPR) in August 2021. BPR Rwanda contributed Kshs 48.0 bn worth of assets in FY’2021 to the Group,
- Total liabilities rose by 14.3% to Kshs 966.2 bn, from Kshs 845.4 bn in FY’2020, driven by a 125.3% increase in placements due to other banking institutions to Kshs 44.3 bn, from Kshs 19.7 bn in FY’2020. Customer deposits increased as well by 9.1% to Kshs 837.1 bn, from Kshs 767.2 bn, with customer deposits from NBK amounting to Kshs 106.1 bn in FY’2021,
- Deposits per branch decreased by 20.4% to Kshs 1.7 bn, from Kshs 2.1 bn in FY’2020, with the number of branches increasing to 492, from 359 in FY’2020. The group acquired 137 branches in Rwanda following the acquisition of BPR Rwanda during the period in addition to opening 1 branch in South Sudan. The group however closed 5 branches in Kenya during the period,
- Gross non-performing loans increased by 27.2% to Kshs 122.9 bn, from Kshs 96.6 bn in FY’2020. The group’s Asset Quality therefore deteriorated, with the NPL ratio increasing to 16.6% in FY’2021, from 14.8% in FY’2020, attributable to the faster 27.2% growth in Non-Performing loans, which outpaced the 13.5% growth in loans. The deterioration in asset quality was mainly attributable to increased defaults from manufacturing, building and construction and hospitality sectors,
- Loan Loss Provisions (LLP) decreased by 52.8% y/y to Kshs 13.0 bn in FY’2021, from Kshs 27.5 bn in FY’2020. The NPL coverage decreased to 52.9% in FY’2021, from 59.8% in FY’2020, attributable to the faster 27.2% growth in Gross non-performing loans, which outpaced the 13.9% growth in general Loan Loss Provisions, and,
- KCB Group remains sufficiently capitalized with a core capital to risk-weighted assets ratio of 18.0%, 10.7% points above the statutory requirement. In addition, the total capital to risk-weighted assets ratio came in at 22.1%, exceeding the statutory requirement by 7.6% points. Adjusting for IFRS 9, the core capital to risk-weighted assets stood at 18.1%, while total capital to risk-weighted assets came in at 20.3%.
For a comprehensive analysis, please see our KCB Group FY’2021 Earnings Note
- ABSA Bank
|
ABSA Bank FY’2021 Key Highlights |
|||||
|
Balance Sheet |
|||||
|
Balance Sheet Items |
FY’2020 (Kshs bn) |
FY’2021 (Kshs bn) |
y/y change |
||
|
Net Loans and Advances |
126.1 |
132.6 |
5.2% |
||
|
Government Securities |
208.9 |
234.2 |
12.2% |
||
|
Total Assets |
379.4 |
428.7 |
13.0% |
||
|
Customer Deposits |
253.6 |
268.7 |
5.9% |
||
|
Deposits per Branch |
3.0 |
3.2 |
5.9% |
||
|
Total Liabilities |
332.9 |
372.2 |
11.8% |
||
|
Shareholders’ Funds |
46.5 |
56.4 |
21.4% |
||
|
Income Statement |
|||||
|
Income Statement Items |
FY'2020 |
FY'2021 |
y/y change |
||
|
Net Interest Income |
23.4 |
25.3 |
8.0% |
||
|
Net non-Interest Income |
11.1 |
11.7 |
4.7% |
||
|
Total Operating income |
34.5 |
36.9 |
7.0% |
||
|
Loan Loss provision |
(9.0) |
(4.7) |
(47.8%) |
||
|
Total Operating expenses |
(25.7) |
(21.4) |
(16.8%) |
||
|
Profit before tax |
8.8 |
15.5 |
75.7% |
||
|
Profit after tax |
4.2 |
10.9 |
161.2% |
||
|
Core EPS |
0.8 |
2.0 |
161.2% |
||
|
Key Ratios |
|||||
|
Income Statement Ratios |
FY'2020 |
FY'2021 |
% point change |
||
|
Yield from Interest-Earning Assets |
9.5% |
9.0% |
(0.5%) |
||
|
Cost of funding |
3.2% |
2.6% |
(0.6%) |
||
|
Net Interest Margin |
7.1% |
7.0% |
(0.1%) |
||
|
Non-Performing Loans (NPL) Ratio |
7.7% |
7.9% |
0.2% |
||
|
NPL Coverage |
71.1% |
77.7% |
6.6% |
||
|
Cost to Income With LLP |
74.4% |
57.9% |
(16.5%) |
||
|
Loan to Deposit Ratio |
82.3% |
87.2% |
4.9% |
||
|
Cost to Income Without LLP |
48.2% |
45.1% |
(3.1%) |
||
|
Return on average equity |
9.1% |
21.1% |
12.0% |
||
|
Return on average assets |
1.1% |
2.7% |
1.6% |
||
|
Equity to Assets |
12.3% |
13.2% |
0.9% |
||
|
Capital Adequacy Ratios |
|||||
|
Ratios |
FY'2020 |
FY'2021 |
% point change |
||
|
Core Capital/Total Liabilities |
17.3% |
17.9% |
0.6% |
||
|
Minimum Statutory ratio |
8.0% |
8.0% |
0.0% |
||
|
Excess |
9.3% |
9.9% |
0.6% |
||
|
Core Capital/Total Risk Weighted Assets |
14.7% |
14.6% |
(0.1%) |
||
|
Minimum Statutory ratio |
10.5% |
10.5% |
0.0% |
||
|
Excess |
4.2% |
4.1% |
(0.1%) |
||
|
Total Capital/Total Risk Weighted Assets |
17.5% |
17.1% |
(0.4%) |
||
|
Minimum Statutory ratio |
14.5% |
14.5% |
0.0% |
||
|
Excess |
3.0% |
2.6% |
(0.4%) |
||
Key take-outs from the earnings release include;
- Core earnings per share increased by 161.2% to Kshs 2.0 in FY’2021, from Kshs 0.8 in FY’2020, not in line with our expectations of a 184.1% increase to Kshs 2.2. The performance was mainly driven by the lack of exceptional items in FY’2021, associated with the rebranding process and the transition from Barclays to ABSA which came in at Kshs 3.2 bn in FY’2020. Additionally, total operating income increased by 7.0% to Kshs 36.9 bn, from Kshs 34.5 bn recorded in FY’2020, coupled with a 16.8% decline in total operating expenses to Kshs 21.4 bn, from Kshs 25.7 bn recorded in FY’2020. Notably, the improved earnings were supported by a 47.8% decline in Loan Loss Provision (LLP) to Kshs 4.7 bn in FY’2021, from Kshs 9.0 bn in FY’2020 on the back of an improved business operating environment. The variance in core earnings per share increase to Kshs 2.0 against our expectation of Kshs 2.2 was largely due to the 16.8% decline in the total operating expenses to Kshs 21.4 bn in FY’2021, from Kshs 25.7 bn in FY’2020, compared to our 22.1% projected decline,
- Interest income grew by 1.9% to Kshs 32.0 bn in FY’2021, from Kshs 31.4 bn in FY’2020, mainly driven by a 3.6% increase in interest income from loans and advances to Kshs 23.1 bn, from Kshs 22.3 bn in FY’2020, coupled with a 288.3% increase in interest income from deposits and placements with banking institutions to Kshs 0.6 bn, from Kshs 0.2 bn in FY’2020,
- The Yield on Interest-Earning Assets (YIEA) however declined to 9.0%, from 9.5% recorded in FY’2020, attributable to the faster 7.3% growth in average interest earning assets which outpaced the 1.9% growth in trailing interest income,
- Interest expenses declined by 15.9% to Kshs 6.8 bn, from Kshs 8.1 bn in FY’2020, following a 65.5% decline in interest expense on deposits and placement with banking institutions to Kshs 0.7 bn, from Kshs 1.9 bn in FY’2020, coupled with a 28.6% decline in other interest expenses to Kshs 0.1 bn, from Kshs 0.2 bn in FY’2020. However, interest expense from customer deposits increased by 0.2% by Kshs 6.00 bn from Kshs 5.98 bn in FY’2020. The bank was able to mobilize cheaper deposits with the Cost of funds (COF) declining by 0.6% points to 2.6%, from 3.2% in FY’2020, owing to the 15.9% decline in the trailing interest expense coupled with a 6.3% growth in average interest-bearing liabilities. Net Interest Margin (NIM) remained unchanged at 7.0%,
- Total operating expenses declined by 16.8% to Kshs 21.4 bn in FY’2021, from Kshs 25.7 bn in FY’2020, mainly attributable to a 47.8% decline in Loan Loss Provisions (LLPs) to Kshs 4.7 bn in FY’2021, from Kshs 9.0 bn recorded in FY’2020. The reduced provisioning level was due to declining credit risk on the back of increased business activities in 2021 driven by the gradual economic recovery. Staff Costs declined by 3.3% to Kshs 9.4 bn in FY’2021, from Kshs 9.8 bn recorded in FY’2020,
- The balance sheet recorded an expansion as total assets grew by 13.0% to Kshs 428.7 bn in FY’2021, from Kshs 379.4 bn in FY’2020. This growth was largely driven by a 12.2% growth in the loan book to Kshs 234.2 bn, from Kshs 208.9 bn in FY’2020 coupled with a 5.2% increase in investments in government and other securities to Kshs 132.6 bn, from Kshs 126.1 bn in FY’2020. The performance was however weighed down by a 46.8% decline in placements in other banks to Kshs 3.0 bn, from Kshs 5.6 bn recorded in FY’2020,
- Total liabilities rose by 11.8% to Kshs 372.2 bn, from Kshs 332.9 bn in FY’2020, driven by a 5.9% increase in customer deposits to Kshs 268.7 bn, from Kshs 253.6 bn in FY’2020, coupled with a 18.0% increase in placements to Kshs 4.8 bn, from Kshs 4.1 bn in FY’2020,
- Deposits per branch rose by 5.9% to Kshs 3.2 bn, from Kshs 3.0 bn in FY’2020 with the number of branches remaining unchanged at 84,
- Gross Non-Performing Loans (NPLs) increased by 15.9% to Kshs 19.8 bn in FY’2021, from Kshs 17.1 bn recorded in FY’2020. Consequently, the NPL ratio rose to 7.9%, from 7.7% recorded in FY’2020. The asset quality deterioration is attributable to the faster 15.9% growth in Gross Non-Performing Loans (NPLs), compared to the relatively slower 13.0% increase in gross loans. The sectors that contributed to this deterioration are the Hospitality and Tourism sector which recorded a slow recovery in 2021 due to the emergence of new strains which hampered economic growth,
- The NPL coverage increased to 77.7% in FY’2021, from 71.1% in FY’2020, owing to the faster 32.8% increase in General Loan Loss Provisions, which outpaced the 15.9% growth in Gross Non-Performing Loans (NPLs), and,
- Absa Bank Kenya remains sufficiently capitalized with a core capital to risk-weighted assets ratio of 14.6%, 4.1% points above the 10.5% statutory requirement. In addition, the total capital to risk-weighted assets ratio was 17.1%, exceeding the 14.5% statutory requirement by 2.6% points. Adjusting for IFRS 9, the core capital to risk-weighted assets stood at 14.7% while total capital to risk-weighted assets came in at 17.2%.
For a comprehensive analysis, please see our ABSA Bank FY’2021 Earnings Note
- Standard Chartered Bank Kenya
|
Standard Chartered Bank Kenya FY’2021 Key Highlights |
|||
|
Balance Sheet |
|||
|
Balance Sheet Items (Kshs bn) |
FY'2020 (Kshs bns) |
FY'2021 (Kshs bns) |
y/y change |
|
Net loans |
121.5 |
126.0 |
3.7% |
|
Total Assets |
325.6 |
334.9 |
2.8% |
|
Customer Deposits |
256.5 |
265.5 |
3.5% |
|
Deposits per branch |
8.6 |
12.1 |
41.1% |
|
Total Liabilities |
274.7 |
281.7 |
2.5% |
|
Shareholder's Funds |
50.9 |
53.2 |
4.6% |
|
Income Statement |
|||
|
Income Statement (Kshs bn) |
FY'2020 (Kshs bns) |
FY'2021 (Kshs bns) |
y/y change |
|
Net Interest Income |
19.1 |
18.8 |
(1.6%) |
|
Net non-Interest Income |
8.3 |
10.4 |
24.9% |
|
Total Operating income |
27.4 |
29.2 |
6.4% |
|
Loan Loss provision |
3.9 |
2.1 |
(46.4%) |
|
Total Operating expenses |
20.0 |
16.6 |
(17.2%) |
|
Profit before tax |
7.4 |
12.6 |
70.3% |
|
Profit after tax |
5.4 |
9.0 |
66.2% |
|
Core EPS (Kshs) |
14.4 |
24.0 |
66.2% |
|
Key Ratios |
|||
|
Ratios |
FY'2020 |
FY'2021 |
y/y % points change |
|
Yield from interest-earning assets |
8.5% |
7.6% |
(0.9%) |
|
Cost of funding |
1.9% |
1.3% |
(0.6%) |
|
Net Interest Margin |
6.9% |
6.4% |
(0.5%) |
|
Non- Performing Loans (NPL) Ratio |
16.01% |
15.99% |
(0.02%) |
|
NPL Coverage |
80.6% |
84.4% |
3.8% |
|
Cost to Income with LLP |
73.0% |
56.8% |
(16.2%) |
|
Loan to Deposit Ratio |
47.4% |
47.5% |
0.1% |
|
Return on average assets |
11.0% |
17.4% |
6.3% |
|
Return on average equity |
1.7% |
2.7% |
1.0% |
|
Equity to Assets |
15.6% |
15.9% |
0.3% |
|
Capital Adequacy Ratios |
|||
|
Ratios |
FY'2020 |
FY'2021 |
% point change |
|
Core Capital/Total Liabilities |
15.3% |
15.4% |
0.1% |
|
Minimum Statutory ratio |
8.0% |
8.0% |
|
|
Excess |
7.3% |
7.4% |
0.1% |
|
Core Capital/Total Risk Weighted Assets |
15.9% |
15.5% |
(0.3%) |
|
Minimum Statutory ratio |
10.5% |
10.5% |
|
|
Excess |
5.4% |
5.0% |
(0.3%) |
|
Total Capital/Total Risk Weighted Assets |
18.5% |
17.8% |
(0.7%) |
|
Minimum Statutory ratio |
14.5% |
14.5% |
|
|
Excess |
4.0% |
3.3% |
(0.7%) |
Key take-outs from the earnings release include;
- Core earnings per share increased by 66.2% to Kshs 24.0, from Kshs 14.4 recorded in FY’2020, not line with our projections of a 61.2% increase to Kshs 23.3. The performance was driven by a 6.4% increase in total operating income to Kshs 29.2 bn, from Kshs 27.4 bn recorded in FY’2020, coupled with a 17.2% decline in total operating expenses to Kshs 16.6 bn, from Kshs 20.0 bn recorded in FY’2020. The variance in core earnings per share increase to Kshs 24.0 against our expectation of Kshs 23.3 was largely due to the 17.2% decline in the total operating expenses to Kshs 16.6 bn in FY’2021, from Kshs 20.0 bn in FY’2020, compared to our 14.8% projected decline,
- Interest income declined by 6.1% to Kshs 22.3 bn, from Kshs 23.7 bn in FY’2020, driven by a 4.2% decline in interest income from Loans & Advances to Kshs 11.8 bn, from Kshs 12.3 bn in FY’2020, coupled with a 4.3% decline in interest income from Government Securities to Kshs 9.2 bn in FY’2021, from Kshs 9.6 bn in FY’2020. Additionally, Interest income from placements in other banks declined by 9.1% to Kshs 1.4 bn from 1.3 bn in FY’2020,
- The Yield on Interest-Earning Assets (YIEA) declined to 7.6%, from 8.5% in FY’2020, attributable to a 6.1% decline in the trailing interest income, coupled with a 5.0% increase in the average interest earning assets,
- Interest expense declined by 24.7% to Kshs 3.5 bn, from Kshs 4.6 bn in FY’2020, following a 26.0% decline in interest expense on customer deposits to Kshs 3.1 bn, from Kshs 4.2 bn in FY’2020 coupled with a 2.7% decline in other interest expenses from placements to Kshs 80.3 mn from Kshs 82.5 mn in FY’2020. The bank was able to mobilize cheaper deposits with the Cost of funds (CoF) declining by 0.6% points to 1.3%, from 1.9% in FY’2020, owing to the 24.7% decline in trailing interest expense and the 6.0% increase in the average interest-bearing liabilities,
- Total operating expenses declined by 17.2% to Kshs 16.6 bn in FY’2021, from Kshs 20.0 bn in FY’2020, mainly attributable to a 46.4% decline in Loan Loss Provisions (LLPs) to Kshs 2.1 bn in FY’2021, from Kshs 3.9 bn in FY’2020 partly attributable to the improved business environment. Additionally, Staff Costs declined to 18.3% to Kshs 6.3 bn, from Kshs 7.7 bn recorded in FY’2020,
- The balance sheet recorded an expansion as total assets grew by 2.8% to Kshs 334.9 bn in FY’2021, from Kshs 325.6 bn in FY’2020. This growth was largely driven by a 5.9% increase in placements from banking institutions to Kshs 74.4 bn, from Kshs 70.3 bn in FY’2020, coupled with a 3.7% increase in the loan book to Kshs 126.0 bn, from Kshs 121.5 bn recorded in FY’2020. The performance was however weighed down by a 4.2% decline in investments in government and other securities to Kshs 95.6 bn, from Kshs 99.8 bn recorded in FY’2020,
- Total liabilities rose by 2.5% to Kshs 281.7 bn, from Kshs 274.7 bn in FY’2020 driven by a 3.5% increase in Customer deposits to Kshs 265.5 bn, from Kshs 256.5 bn in FY’2020,
- Deposits per branch rose by 41.1% to Kshs 12.1 bn, from Kshs 8.6 bn in FY’2020 with the number of branches reducing to 22 from 30. The reduced number of branches is attributable to cost cutting measures undertaken by Standard Chartered Bank,
- Gross Non-Performing Loans (NPLs) increased by 4.2% to Kshs 23.3 bn in FY’2021, from Kshs 22.3 bn recorded in FY’2020. The NPL ratio however declined marginally to 15.99%, from 16.01% recorded in FY’2020,
- General Loan Loss Provisions increased by 14.0% to Kshs 10.1 bn, from Kshs 8.9 bn in FY’2020. The NPL coverage thus increased to 84.4%, from 80.6% in FY’2020, as the provisions (after adding back interest suspense) increased by 9.2% in FY’2021, outpacing the 4.2% rise in the Gross Non-Performing Loans during the same period. The increase in the NPL Coverage to 84.4% in FY’2021, from 80.6% in FY’2020 suggests sufficient provisioning, and,
- Standard Chartered is currently sufficiently capitalized with a core capital to risk-weighted assets ratio of 15.5%, 5.5% points above the statutory requirement. In addition, the total capital to risk-weighted assets ratio was 17.8%, exceeding the statutory requirement by 3.3% points. Adjusting for IFRS 9, the core capital to risk-weighted assets stood at 15.6% while total capital to risk-weighted assets came in at 17.8%.
For a comprehensive analysis, please see our Standard Chartered Bank Kenya FY’2021 Earnings Note
- Co-operative Bank of Kenya
|
Co-operative Bank FY’2021 Key Highlights |
|||
|
Balance Sheet |
|||
|
Balance Sheet Items |
FY'2020 (Kshs bn) |
FY'2021 (Kshs bn) |
y/y change |
|
Government Securities |
161.9 |
184.1 |
13.7% |
|
Net Loans and Advances |
286.6 |
310.2 |
8.2% |
|
Total Assets |
536.9 |
579.8 |
8.0% |
|
Customer Deposits |
378.6 |
407.7 |
7.7% |
|
Deposits per branch |
2.1 |
2.5 |
14.8% |
|
Total Liabilities |
444.9 |
479.0 |
7.7% |
|
Shareholders’ Funds |
90.7 |
100.2 |
10.5% |
|
Income Statement |
|||
|
Income Statement Items |
FY'2020 (Kshs bn) |
FY'2021 (Kshs bn) |
y/y change |
|
Net Interest Income |
36.3 |
41.0 |
12.9% |
|
Net non-Interest Income |
17.5 |
19.4 |
11.0% |
|
Total Operating income |
53.8 |
60.4 |
12.3% |
|
Loan Loss provision |
(8.1) |
(7.9) |
(2.3%) |
|
Total Operating expenses |
(39.4) |
(38.1) |
(3.3%) |
|
Profit before tax |
14.3 |
22.6 |
58.6% |
|
Profit after tax |
10.8 |
16.5 |
53.0% |
|
Core EPS |
1.6 |
2.4 |
53.0% |
|
Key Ratios |
|||
|
Income statement ratios |
FY’2020 |
FY’2021 |
% point change |
|
Yield from interest-earning assets |
11.4% |
11.5% |
0.1% |
|
Cost of funding |
3.0% |
3.2% |
0.2% |
|
Net Interest Margin |
8.5% |
8.5% |
0.0% |
|
Non-Performing Loans (NPL) Ratio |
18.7% |
14.6% |
(4.1%) |
|
NPL Coverage |
50.3% |
62.6% |
12.3% |
|
Cost to Income With LLP |
73.2% |
63.0% |
(10.2%) |
|
Loan to Deposit Ratio |
75.7% |
76.1% |
0.5% |
|
Cost to Income Without LLP |
58.1% |
49.9% |
(8.2%) |
|
Return on average equity |
12.5% |
17.3% |
4.8% |
|
Return on average assets |
2.2% |
3.0% |
0.8% |
|
Equity to assets |
16.9% |
17.3% |
0.4% |
|
Capital Adequacy Ratios |
FY'2020 |
FY'2021 |
% point change |
|
Core Capital/Total Liabilities |
19.1% |
19.6% |
0.5% |
|
Minimum Statutory ratio |
8.0% |
8.0% |
0.0% |
|
Excess |
11.1% |
11.6% |
0.5% |
|
Core Capital/Total Risk Weighted Assets |
15.4% |
15.6% |
0.2% |
|
Minimum Statutory ratio |
10.5% |
10.5% |
0.0% |
|
Excess |
4.9% |
5.1% |
0.2% |
|
Total Capital/Total Risk Weighted Assets |
16.9% |
17.2% |
0.3% |
|
Minimum Statutory ratio |
14.5% |
14.5% |
0.0% |
|
Excess |
2.4% |
2.7% |
0.3% |
Key take-outs from the earnings release include;
- Core earnings per share increased by 53.0% to Kshs 2.4 in FY’2021, from Kshs 1.7 in FY’2020, better than our projections of a 29.4% increase to Kshs 2.0. The performance was driven by a 12.3% increase in total operating income to Kshs 60.4 bn in FY’2021, from Kshs 53.8 bn in FY’2020, coupled with a 3.3% decline in the total operating expenses to Kshs 38.1 bn in FY’2021, from Kshs 39.4 bn in FY’2020. The variance in our projections can be attributed to our expectation of a 26.3% increase in loans loss provisions to Kshs 10.3 bn, compared to the actual performance which was a decline of 2.3% to Kshs 7.9 bn from Kshs 8.1 bn,
- Interest income rose by 13.9% to Kshs 55.6 bn in FY’2021, from Kshs 48.8 bn in FY’2020 driven by a 26.4% increase in interest income from government securities to Kshs 18.7 bn, from Kshs 14.8 bn in FY’2020, coupled with a 9.0% rise in interest income from loans and advances to Kshs 36.5 bn, from Kshs 33.5 bn in FY’2020,
- The Yield on Interest-Earning Assets increased marginally by 0.1% points to 11.5%, from 11.4% in FY’2020 due to the faster 13.9% growth in trailing interest income, which outpaced the 12.6% growth in the average interest-earning assets,
- Interest expense increased by 17.0% to Kshs 14.6 bn in FY’2021, from Kshs 12.5 bn in FY’2020, largely due to a 21.9% rise in interest expense from customer deposits to Kshs 13.3 bn, from Kshs 10.9 bn in FY’2020. The increase in interest expense was however mitigated by a 19.6% decline in other interest expenses to Kshs 1.1 bn in FY’2021, from Kshs 1.4 bn in FY’2020,
- Net Interest Margin (NIM) remained unchanged at 8.5% in FY’2021, similar to what was recorded in FY’2020,
- Total operating expenses reduced by 3.3% to Kshs 38.1 bn in FY’2021, from Kshs 39.4 bn in FY’2020, largely driven by the 2.3% reduction in Loan Loss Provisions (LLP) to Kshs 7.9 bn, from Kshs 8.1 bn in FY’2020 coupled with a 5.7% decrease in other operating expenses to Kshs 16.8 bn, from Kshs 17.9 bn in FY’2020. The reduced provisioning levels are indicative of the reduced credit risk as a result of the improved business environment. Staff costs decreased by 0.7% to Kshs 13.3 bn, from Kshs 13.4 bn in FY’2020,
- The balance sheet recorded an expansion as total assets grew by 8.0% to Kshs 579.8 bn in FY’2021, from Kshs 536.9 bn in FY’2020, mainly attributable to the 13.7% growth in government securities to Kshs 184.1 bn, from Kshs 161.9 bn recorded in FY’2020, coupled with an 8.2% growth in net loans and advances to Kshs 310.2 bn in FY’2021, from Kshs 286.6 bn in FY’2020. The faster increase in allocation to government securities highlights the bank’s cautious lending strategy considering the relatively lower asset quality, as evidenced by the bank’s NPL ratio of 14.6% in FY’2021 compared to the average 12.0% gross NPL ratio of the listed banking sector in Q3’2021,
- Total liabilities grew by 7.7% to Kshs 479.0 bn, from Kshs 444.9 bn in FY’2020, which was largely attributable to a 7.7% rise in customer deposits to Kshs 407.7 bn in FY’2021, from Kshs 378.6 bn in FY’2020,
- Deposits per branch increased by 14.8% to Kshs 2.5 bn, from Kshs 2.1 bn in FY’2020, with the number of branches reducing to 166 in FY’2021, from 177 recorded in FY’2020,
- Gross Non-Performing Loans (NPLs) decreased by 15.9% to Kshs 49.7 bn in FY’2021, from Kshs 59.1 bn in FY’2020. The NPL ratio reduced to 14.6% in FY’2021, from 18.7% in FY’2020, owing to the 15.9% decline in gross non-performing loans coupled with the 7.9% growth in gross loans. The improved asset quality is attributable to the economic recovery witnessed in Kenya in the year 2021 and improved business environment, which saw significant recovery in sectors such as Transport and Communication. Personal consumer, Trade and Transport and Communication, made up 71.4% of Cooperative Bank’s loan book as of Q3’2021,
- Gross Non-Performing Loans (NPLs) decreased by 15.9% to Kshs 49.7 bn in FY’2021, from Kshs 59.1 bn in FY’2020. The NPL ratio reduced to 14.6% in FY’2021, from 18.7% in FY’2020, owing to the 15.9% decline in gross non-performing loans coupled with the 7.9% growth in gross loans,
- The NPL coverage ratio improved to 62.6% in FY’2021, from 50.3% in FY’2020, due to a 4.7% growth in General Loan Loss Provisions coupled with the 15.9% decline in Gross Non-Performing Loans (NPLs), and,
- Co-operative Bank remains sufficiently capitalized with a core capital to risk-weighted assets ratio of 15.6%, 5.1% points above the statutory requirement of 10.5%. The total capital to risk-weighted assets ratio came in at 17.2%, exceeding the statutory requirement of 14.5% by 2.7% points. Adjusting for IFRS 9, the core capital to risk-weighted assets stood at 12.8%, while total capital to risk-weighted assets came in at 14.3%.
For a comprehensive analysis, please see our Co-operative Bank FY’2021 Earnings Note
Asset Quality
The table below is a summary of the asset quality for the banks that have released
|
|
FY'2020 NPL Ratio** |
FY'2021 NPL Ratio* |
% point change in NPL Ratio |
FY'2020 NPL Coverage** |
FY'2021 NPL Coverage* |
% point change in NPL Coverage |
|
ABSA Bank Kenya |
7.7% |
7.9% |
0.2% |
71.1% |
77.7% |
6.6% |
|
Stanbic Bank |
11.8% |
9.3% |
(2.5%) |
60.6% |
51.8% |
(8.8%) |
|
Co-operative Bank of Kenya |
18.7% |
14.6% |
(4.1%) |
50.3% |
60.6% |
10.3% |
|
Standard Chartered Bank Kenya |
16.0% |
16.0% |
(0.0%) |
80.6% |
84.4% |
3.8% |
|
KCB |
14.8% |
16.6% |
1.8% |
59.8% |
52.9% |
(6.9%) |
|
Mkt Weighted Average |
14.2% |
13.8% |
(0.4%) |
62.8% |
63.1% |
0.3% |
|
*Market cap weighted as at 18/03/2021 |
||||||
|
**Market cap weighted as at 15/04/2020 |
||||||
Key take-outs from the table include;
- Asset quality for the listed banks that have released their FY’2021 results improved during the period, with the weighted average NPL ratio declining by 0.4% points to a market cap weighted average of 13.8%, from an average of 14.2% for the listed banking sector in FY’2020. The improvement in asset quality is attributable to declining credit risk on the back of increased business activities in 2021 driven by the gradual economic recovery,
- NPL Coverage for the listed banks increased to a market cap weighted average of 63.1% in FY’2021, from 62.8% recorded in FY’2020, as the banks increased their provisioning levels to proactively manage risks brought about by the emergence of new COVID-19 variants coupled with the slow recovery of some sectors such as tourism and hospitality and,
- KCB Group recorded a decline in their NPL coverage despite the NPL ratio rising, which would suggest modest provisioning. Given the slow recovery in some sectors locally and the high NPL ratios in some of the group’s subsidiaries, we expected the group to provision more to cater for the prevailing credit risk. Key to note, If KCB’s NPL Coverage remained at the 59.8% level recorded in 2020, the bank would have had an additional provisioning of Kshs 8.4 bn, which would have reduced the earnings per share from the reported Kshs 10.6 to Kshs 8.6.
Summary Performance
The table below highlights the performance of the banks that have released so far, showing the performance using several metrics, and the key take-outs of the performance;
|
Bank |
Core EPS Growth |
Interest Income Growth |
Interest Expense Growth |
Net Interest Income Growth |
Net Interest Margin |
Non-Funded Income Growth |
NFI to Total Operating Income |
Growth in Total Fees & Commissions |
Deposit Growth |
Growth in Government Securities |
Loan to Deposit Ratio |
Loan Growth |
Return on Average Equity |
|
ABSA |
161.2% |
1.9% |
15.9% |
8.0% |
7.1% |
4.7% |
31.6% |
11.6% |
5.9% |
5.2% |
87.2% |
12.2% |
21.1% |
|
KCB |
74.3% |
15.1% |
17.6% |
14.4% |
8.4% |
8.8% |
28.0% |
9.0% |
9.1% |
29.7% |
80.7% |
13.5% |
21.8% |
|
SCBK |
66.2% |
(6.1%) |
(24.7%) |
(1.6%) |
6.4% |
24.9% |
35.5% |
19.9% |
3.5% |
(4.2%) |
47.5% |
3.7% |
17.4% |
|
Co-op |
53.0% |
13.9% |
17.0% |
12.9% |
8.0% |
11.0% |
32.1% |
18.1% |
7.7% |
13.7% |
76.1% |
8.2% |
17.3% |
|
Stanbic |
43.2% |
1.6% |
15.2% |
12.2% |
6.2% |
4.2% |
42.6% |
(8.5%) |
(5.8%) |
(17.4%) |
83.0% |
11.2% |
14.0% |
|
FY'21 Mkt Weighted Average* |
81.0% |
8.2% |
11.1% |
10.5% |
7.6% |
10.3% |
32.0% |
11.0% |
5.9% |
12.5% |
76.5% |
10.6% |
19.3% |
|
FY'20 Mkt Weighted Average** |
(26.8%) |
16.7% |
12.5% |
18.9% |
7.3% |
6.4% |
35.4% |
(2.1%) |
22.3% |
26.3% |
69.8% |
11.7% |
13.2% |
|
*Market cap weighted as at 18/03/2021 |
|||||||||||||
|
**Market cap weighted as at 15/04/2020 |
|||||||||||||
Key takeaways from the table above include:
- The listed banks that have released recorded an 81.0% weighted average growth in core Earnings per Share (EPS), compared to a weighted average decline of 26.8% in FY’2020 for the listed banking sector. The performance is however largely skewed by the strong performance from ABSA Bank,
- The Banks have recorded a weighted average deposit growth of 5.9%, slower than the 22.3% growth recorded in FY’2020,
- Interest expense grew at a slower pace, by 11.1%, compared to the 12.5% growth in FY’2020. Similarly, cost of funds declined, coming in at a weighted average of 2.6% in FY’2021, from 2.9% in FY’2020, owing to the faster growth in average interest-bearing liabilities, an indication that the listed banks were able to mobilize cheaper deposits,
- Average loan growth came in at 10.6%, 1.1% points lower than the 11.7% growth recorded in FY’2020. Additionally, the loan growth was lower than the 12.5% growth in government securities, an indication that banks are shying away from lending due to uncertainties surrounding the emergence of new COVID-19 variants coupled with the slow recovery of some sectors such as tourism and hospitality,
- Interest income grew by 8.2%, compared to a growth of 16.7% recorded in FY’2020 while the weighted average Yield on Interest Earning Assets (YIEA) increased to 9.9%, from the 9.5% recorded in FY’2020 for the listed banking sector, an indication of the increased allocation to higher-yielding assets by the sector during the period. Consequently, the Net Interest Margin (NIM) now stands at 7.6%, 0.3% points higher than the 7.6% recorded in FY’2020 for the whole listed banking sector, and,
- Non-Funded Income grew by 10.3%, compared to the 6.4% growth recorded in FY’2020. This can be attributable to the faster growth in the fees and commission which grew by 11.0% compared to a decline of 2.1% in FY’2020, following the expiry of the waiver on fees on mobile transactions.
Cytonn Coverage:
|
Company |
Price as at 11/03/2022 |
Price as at 18/03/2022 |
w/w change |
YTD Change |
Year Open 2022 |
Target Price* |
Dividend Yield |
Upside/ Downside** |
P/TBv Multiple |
Recommendation |
|
Kenya Reinsurance |
2.3 |
2.3 |
0.0% |
(0.9%) |
2.3 |
3.2 |
8.8% |
48.8% |
0.2x |
Buy |
|
Jubilee Holdings |
275.0 |
275.3 |
0.1% |
(13.1%) |
316.8 |
381.7 |
3.3% |
42.0% |
0.5x |
Buy |
|
I&M Group*** |
20.8 |
20.7 |
(0.5%) |
(3.3%) |
21.4 |
24.4 |
10.9% |
28.6% |
0.6x |
Buy |
|
KCB Group*** |
44.7 |
44.6 |
(0.2%) |
(2.1%) |
45.6 |
51.4 |
6.7% |
21.9% |
0.9x |
Buy |
|
Liberty Holdings |
6.9 |
6.5 |
(5.2%) |
(7.9%) |
7.1 |
7.7 |
0.0% |
17.8% |
0.5x |
Accumulate |
|
Britam |
7.0 |
6.9 |
(1.4%) |
(9.0%) |
7.6 |
7.9 |
0.0% |
14.5% |
1.1x |
Accumulate |
|
Stanbic Holdings |
100.0 |
100.0 |
0.0% |
14.9% |
87.0 |
105.2 |
9.0% |
14.2% |
0.9x |
Accumulate |
|
NCBA*** |
24.6 |
25.0 |
1.6% |
(2.0%) |
25.5 |
26.4 |
6.0% |
11.8% |
0.6x |
Accumulate |
|
Sanlam |
12.8 |
11.0 |
(13.7%) |
(4.8%) |
11.6 |
12.1 |
0.0% |
9.6% |
1.2x |
Hold |
|
Diamond Trust Bank*** |
56.0 |
56.5 |
0.9% |
(5.0%) |
59.5 |
61.8 |
0.0% |
9.3% |
0.2x |
Hold |
|
Equity Group*** |
51.3 |
52.0 |
1.5% |
(1.4%) |
52.8 |
56.6 |
0.0% |
8.9% |
1.3x |
Hold |
|
Standard Chartered*** |
131.0 |
139.8 |
6.7% |
7.5% |
130.0 |
137.7 |
10.0% |
8.6% |
1.1x |
Hold |
|
Co-op Bank*** |
12.9 |
13.3 |
3.5% |
2.3% |
13.0 |
13.1 |
7.5% |
5.7% |
1.0x |
Hold |
|
ABSA Bank*** |
12.1 |
12.4 |
2.5% |
5.5% |
11.8 |
11.9 |
8.9% |
4.9% |
1.2x |
Lighten |
|
HF Group |
3.5 |
3.1 |
(10.4%) |
(18.7%) |
3.8 |
3.0 |
0.0% |
(4.4%) |
0.2x |
Sell |
|
CIC Group |
2.0 |
2.1 |
1.5% |
(4.6%) |
2.2 |
1.9 |
0.0% |
(9.0%) |
0.7x |
Sell |
|
*Target Price as per Cytonn Analyst estimates **Upside/ (Downside) is adjusted for Dividend Yield ***For Disclosure, these are stocks in which Cytonn and/or its affiliates are invested in |
||||||||||
We are “Neutral” on the Equities markets in the short term. With the market currently trading at a premium to its future growth (PEG Ratio at 1.3x), we believe that investors should reposition towards value stocks with strong earnings growth and that are trading at discounts to their intrinsic value. We expect the discovery of new COVID-19 variants, the upcoming Kenyan general elections and the slow vaccine rollout to continue weighing down the economic outlook. On the upside, we believe that the relaxation of COVID-19 containment measures in the country will lead to improved investor sentiments.
- Residential Sector
- Kakamega County and Unity Homes to Construct Affordable Housing Units
During the week, the Kakamega County Investment and Development Agency (KCIDA), in collaboration with Pinnie Agency Limited, a private developer, began the construction of 3,000 affordable housing units in 5 estates within Kakamega and Mumias towns. The joint venture partnership project worth Kshs 8.0 bn which was initiated on Tuesday 15th March 2022, will be implemented in three phases, with the housing units expected to range between Kshs 1.0 mn and Kshs 3.0 mn.
Also, Unity Homes, a Kenyan-British housing developer announced plans to launch the construction of its third phase of housing units in Tatu City, Ruiru. The Kshs 4.3 bn project which is part of the developer’s commitment to support the government’s Big Four Affordable Housing initiative, will comprise of 1,200 apartments. Moreover, it will mark Unity Home’s fifth project at Tatu City, with the other projects being; Unity Gardens, Unity One, Unity East, and Unity West. In terms of performance, according to Cytonn Annual Markets Review 2021, Ruiru recorded average total returns to investors at 7.8%, 0.5% points higher than the market average of 7.3%, hence the developer is leveraging on the remarkable performance as its basis of development. Other factors driving the investment decision include; i) ease of accessibility facilitated by roads such as the Eastern Bypass, ii) availability of amenities such as the Spur Mall among others, and iii) high demand for housing fuelled by Ruiru’s high population growth rate currently at 4.6%, against Kenya’s 2.3%. The table below shows the market performance of apartments within satellite towns in FY’2021;
|
Lower Mid- End Satellite Towns Apartments Performance-FY’2021 |
||||||||
|
Area |
Average of Price per SQM FY'2021 |
Average of Rent per SQM FY'2021 |
Average of Occupancy FY'2021 |
Average of Uptake 2021 |
Average of Annual Uptake FY'2021 |
Average of Rental Yield FY'2021 |
Average of Price Appreciation |
Total Returns |
|
Rongai |
60,003 |
347 |
86.3% |
74.3% |
16.1% |
6.2% |
2.6% |
8.8% |
|
Ruaka |
107,375 |
588 |
91.9% |
81.7% |
20.2% |
5.6% |
2.9% |
8.5% |
|
Ruiru |
89,260 |
493 |
84.3% |
85.9% |
21.9% |
5.6% |
2.2% |
7.8% |
|
Syokimau |
72,318 |
330 |
89.9% |
83.5% |
12.7% |
5.3% |
1.9% |
7.2% |
|
Ngong |
63,446 |
346 |
73.7% |
76.3% |
12.5% |
5.0% |
2.1% |
7.1% |
|
Kikuyu |
80,656 |
464 |
69.9% |
79.6% |
17.6% |
4.9% |
2.1% |
7.0% |
|
Thindigua |
96,294 |
491 |
84.0% |
92.9% |
14.9% |
5.2% |
1.4% |
6.6% |
|
Athi River |
63,416 |
288 |
91.9% |
91.8% |
13.7% |
5.2% |
1.4% |
6.6% |
|
Kitengela |
60,435 |
261 |
93.2% |
84.0% |
10.1% |
5.0% |
1.6% |
6.6% |
|
Average |
77,023 |
401 |
85.0% |
83.3% |
15.5% |
5.3% |
2.0% |
7.3% |
Source; Cytonn Research
Upon completion of both projects, they are expected to;
- Provide low cost homes to residents targeting affordable developments,
- Curb the housing deficit challenge in the respective areas,
- Improve living standards of residents through easing the accessibility to decent homes, and,
- Improve the overall low home ownership rates in Kenya, which is currently at 21.3% in urban areas as at 2020, compared to other African countries such as South Africa and Ghana at 53.0% and 47.2%, respectively. The graph below shows the home ownership percentages of different countries compared to Kenya;
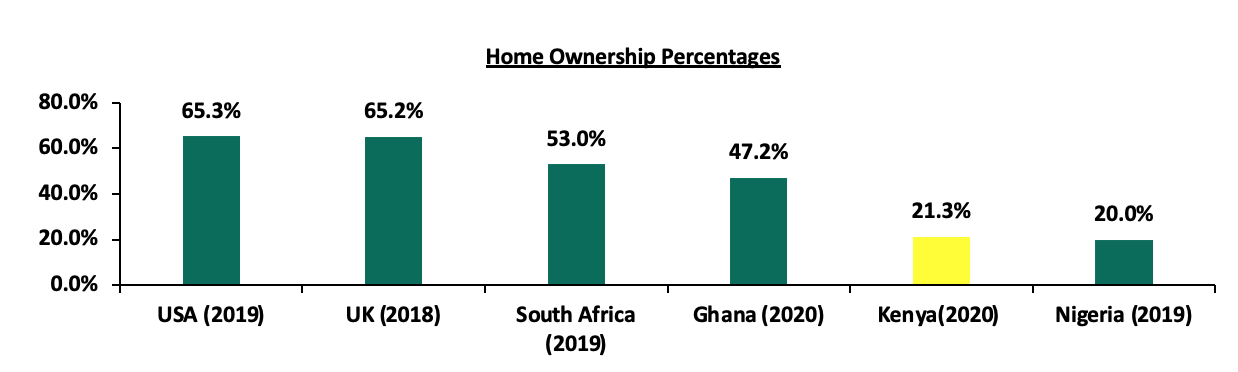
Source: Centre for Affordable Housing Africa, Federal Reserve Ban
As per our topical on Affordable Housing Program in Nairobi Metropolitan Area, Affordable Housing initiative continues to gain traction in Kenya evidenced by government and private developers’ efforts to implement projects through various strategies such as;
- Issuing of corporate bonds e.g. the Kshs 3.9 bn bond for investing in Pangani Affordable Housing,
- Project partnership strategies such as Joint Ventures (JVs) and Public Private Partnerships (PPPs), with some of the projects under the PPP strategy being Pangani affordable housing project, River Estate project in Ngara, and Buxton Estate project in Mombasa, among many others, and,
- Increased budget allocation to the housing sector evidenced by the 33.9% increase in allocation to Kshs 21.8 bn in FY’2021/22, from Kshs 20.4 bn in FY’2020/21.
In light of this, some other key ongoing projects are; i) River Estate in Ngara, ii) Stoni Athi River Waterfront project, and, iii) Starehe project, among many others. Despite these efforts, the program continues to face a couple of setbacks that have caused the projects to stall such as financial constraints fueled by the high construction costs and inadequate infrastructure.
- International Finance Corporation (IFC) to buy Kshs 4.2 bn worth of KMRC’s Kshs 10.5 bn MTN
During the week, the International Finance Corporation (IFC), an international financier, announced plans to buy Kshs 4.2 bn worth of bonds from the Kenya Mortgage Refinance Company’s (KMRC) Kshs 10.5 bn Medium Term Note Program (MTN). This will make IFC an anchor investor to the mortgage lender’s MTN, with a 40.0% stake of the bonds, besides the loan facility that it has with KMRC. IFC owns 11.8% of the KMRC shares, having invested Kshs 213.7 bn in the KMRC during formation. The move by IFC follows the MTN’s first tranche oversubscription by 478.5% totaling to Kshs 8.1 bn in February 2022, as well as its listing on the Nairobi Stock Exchange (NSE) that was done on the 14th March 2022, signifying the financier’s high appetite for the bond.
Kenya Mortgage Refinance Company (KMRC) will disburse the funds to participating primary mortgage lenders (PMLs), such as banks, microfinance institutions and Savings and Credit Cooperatives (SACCOs) at a 5.0% rate, for onward lending to homebuyers at single digit rates. This is expected to boost home ownership in Kenya which continues to remain low at 21.3% in urban areas as at 2020, compared to other African countries such as Ghana with a 47.2% urban home ownership rate in the same period. The low home ownership rate is as a result of; i) high property prices, ii) constrained finances to fund property developments, and, iii) tedious processes and longer transaction timelines incurred while accessing mortgages thus discouraging prospective homeowners.
Given the KMRC average loan limit of Kshs 3.5 mn for areas in and out of the Nairobi Metropolitan Area, IFC’s funding is expected to increase the number of mortgage accounts in Kenya, which recorded a 3.7% decline to 26,971 in December 2020 from 27,993 in December 2019 according to the Central Bank of Kenya- Bank Supervision Annual Report 2020.
The graph below shows the number of mortgage loan accounts in Kenya over the last 10 years;
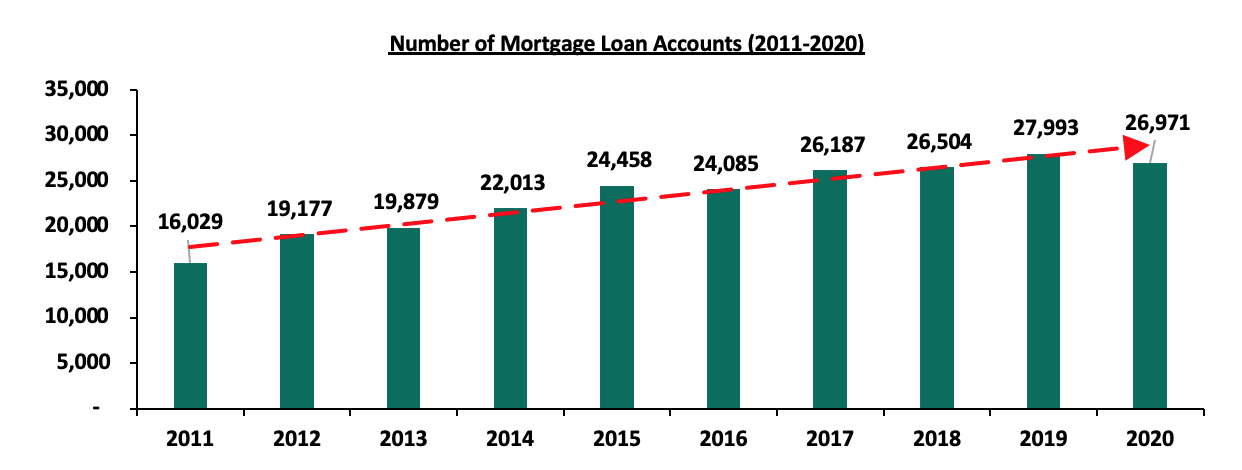
Source: Central Bank of Kenya (CBK)
Based on the above, the Kenya mortgage to GDP ratio continues to lag behind at 2.2% as of 2020, compared to countries such as Namibia and South Africa at 18.9% and 16.2%, respectively as shown in the graph below;
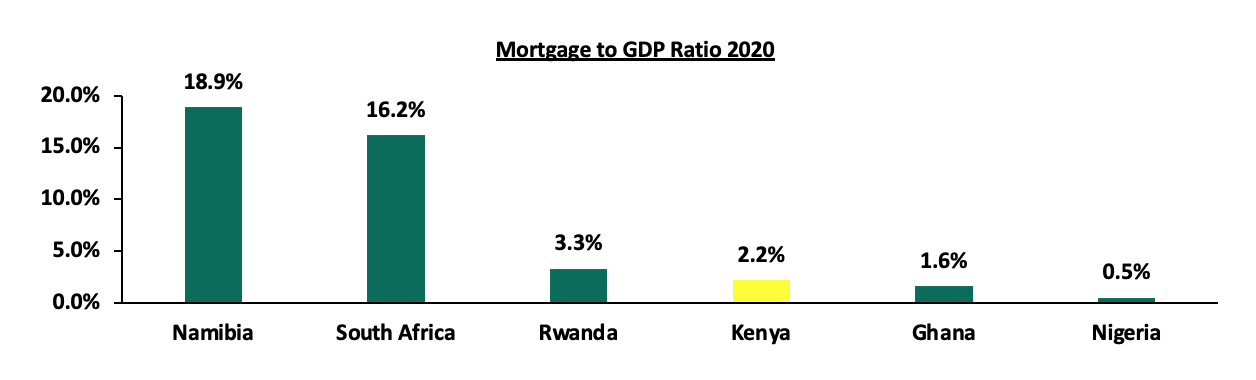
Source: Centre for Affordable Housing Africa
Despite the sluggish performance of the mortgage sector, KMRC has so far performed well by;
- Boosting liquidity to Primary Mortgage Lenders through its debut lending of Kshs 2.8 bn in FY’2020/21 and Kshs 7.0 bn budgeted in FY’2021/22,
- Increasing mortgage uptake in the country by so far refinancing 1,427 mortgages as at 2020 with others under review currently,
- Encouraging mortgage market competition for the benefit of borrowers through low rate lending, and,
- Increasing capital for refinancing with total Kshs 40.0 bn under management by the firm as at June 2021.
However, KMRC is likely to face stiff competition from government instruments offering higher rates as the firm seeks to borrow from the market and lend at low rates. With 20-year bonds attracting an average yield of 13.9%, KMRC would have to offer a premium above this in order to attract investors in the fixed income market, which would consequently lead to a negative spread between the lending rate to Primary Mortgage Lenders at 5% pa and a borrowing rate north of 13% pa. It is therefore not clear how KMRC will borrow from the market and sustain lending at a 5.0% rate. Despite this, the residential sector is expected to improve supported by efforts being made to offer affordable mortgages to a diverse number of clients at bespoke terms.
- South Korea Grants Kenya Kshs 685.9 mn for Konza Technopolis City Project
During the week, South Korea Government granted Kenya Kshs 685.9 mn for the construction of transport infrastructure, planning and security installations at the Konza Technopolis City Project. The 3-year project will be implemented through the Economic Innovation Partnership Program (EIPP), an assistance program between Korea Trade-Investment Promotion Agency (KOTRA) and the Konza Technopolis Development Authority. Under the program, Korea will provide Information Communication Technology (ICT) infrastructure consultations aimed at formulating smart city development strategies, based on their urban development experience. Upon completion, the support will result into the growth of the city project into an innovation hub for Kenya.
Overall, we expect the residential sector to record more construction and development activities supported by government and private sector efforts to provide affordable homes to support the Big 4 Agenda, as well as technology services supporting growth. The efforts by IFC to make mortgages available through the KMRC is also expected promote home ownership rate in Kenya.
- Retail Sector
During the week, Naivas supermarket, a local retail chain, opened its 82nd outlet at Katani, along Mombasa Road, taking up 34,299 SQFT worth of space in the area. This brings the retailer’s total operating stores along Mombasa Road to 3, having opened a new outlet at Imaara Mall barely a month ago. The move to open the new store is driven by;
- Positive demographics,
- Consumer preference resulting from increased demand for goods and services,
- Stiff market competition from its rivals such as QuickMart that has opened 2 branches so far in 2022, and,
- Strategic location of the mall along the busy Mombasa road enhancing ease of accessibility to the store.
In terms of performance, according to our Cytonn Annual Markets Review 2021, Mombasa road where the new outlet lies recorded average rents per SQFT of Kshs 148 compared to the market average of Kshs 170 per SQFT, hence the retailer is leveraging on affordability of retail spaces in the area.
The table below shows the submarket performance of nodes in the Nairobi Metropolitan Area (NMA):
|
Nairobi Metropolitan Area Retail Market Performance FY’2021 |
|||
|
Area |
Rent Kshs /SQFT FY’2021 |
Occupancy % FY’2021 |
Rental Yield FY’2021 |
|
Westlands |
213 |
78.8% |
10.0% |
|
Karen |
202 |
84.0% |
9.8% |
|
Kilimani |
183 |
86.0% |
9.8% |
|
Ngong Road |
171 |
79.0% |
7.7% |
|
Kiambu road |
180 |
74.2% |
7.7% |
|
Mombasa road |
148 |
75.0% |
6.8% |
|
Thika Road |
161 |
74.0% |
6.7% |
|
Satellite towns |
142 |
69.0% |
6.2% |
|
Eastlands |
133 |
71.6% |
5.6% |
|
Average |
170 |
76.8% |
7.8% |
Source: Cytonn Research 2021
The table below shows the summary of the number of stores of the key local and international retailer supermarket chains in Kenya;
|
Main Local and International Retail Supermarket Chains |
||||||||||
|
Name of Retailer |
Category |
Highest number of branches that have ever existed as at FY’2018 |
Highest number of branches that have ever existed as at FY’2019 |
Highest number of branches that have ever existed as at FY’2020 |
Highest number of branches that have ever existed as at FY’2021 |
Number of branches opened in 2022 |
Closed branches |
Current number of Branches |
Number of branches expected to be opened |
Projected number of branches FY’2022 |
|
Naivas |
Local |
46 |
61 |
69 |
79 |
3 |
0 |
82 |
0 |
82 |
|
QuickMart |
Local |
10 |
29 |
37 |
48 |
2 |
0 |
50 |
0 |
50 |
|
Chandarana |
Local |
14 |
19 |
20 |
23 |
1 |
1 |
24 |
4 |
28 |
|
Carrefour |
International |
6 |
7 |
9 |
16 |
0 |
0 |
16 |
0 |
16 |
|
Cleanshelf |
Local |
9 |
10 |
11 |
12 |
0 |
0 |
12 |
0 |
12 |
|
Tuskys |
Local |
53 |
64 |
64 |
3 |
0 |
61 |
3 |
0 |
3 |
|
Game Stores |
International |
2 |
2 |
3 |
3 |
0 |
0 |
3 |
0 |
3 |
|
Uchumi |
Local |
37 |
37 |
37 |
2 |
0 |
35 |
2 |
0 |
2 |
|
Choppies |
International |
13 |
15 |
15 |
0 |
0 |
13 |
0 |
0 |
0 |
|
Shoprite |
International |
2 |
4 |
4 |
0 |
0 |
4 |
0 |
0 |
0 |
|
Nakumatt |
Local |
65 |
65 |
65 |
0 |
0 |
65 |
0 |
0 |
0 |
|
Total |
|
257 |
313 |
334 |
186 |
6 |
179 |
192 |
4 |
196 |
Source: Online Search
We expect the retail sector to continue recording more expansion and development activities mainly due to; i) aggressive expansion of local and international retailers, ii) Kenya being recognized as a regional hub hence attracting retail investments, and, iii) revoked pandemic restrictions enhancing ease of conducting businesses. Despite this, factors such as e-commerce shopping strategy, and the oversupply of retail spaces by 3.0 mn SQFT in the Nairobi Metropolitan Area, are expected to hinder performance of the sector.
- Industrial Sector
During the week, Grit Real Estate Income Group, a Mauritius based Real Estate Investment Company, completed the purchase of Orbit Products Africa, a warehouse and manufacturing facility located in Machakos County, at a cost of Kshs 6.1 bn. This comes after the investment firm entered a Kshs 2.9 bn loan agreement with the International Finance Corporation (IFC) in July 2021, with an aim of acquiring and developing the warehousing and manufacturing facility. The 8-year loan tenure has an interest rate of 5.6% p.a and above the USD six-month libor rate of 1.3% as at 18th March 2022. Grit aims to redevelop and expand the factory which is a contract manufacturer for global firms such as Reckitt Benckiser, Colgate-Palmolive, and Unilever, with the expected completion date set for the fourth quarter of 2023. By this move, it will further increase its exposure into the Kenyan Property market particularly the industrial sector market, after having announced plans to set up 10,142 square meters of modern warehousing space within Mlolongo, in December 2020. Some of the properties that the international company has ownership of in Kenya include;
- 50.0% stake in Naivasha Buffalo Mall,
- A pharmaceutical warehouse along Mombasa Road that it leases out to South Africa’s Imperial Health Sciences Logistics, and,
- 20.0% stake in Gateway Real Estate Africa Ltd (GREA) which is building a housing estate to lease to the staff of the United States embassy in Nairobi for 8 years.
Grit’s decision to invest in Orbit factory signifies a rising demand for warehouse facilities in the country amidst the continuing expansion of the manufacturing. Moreover, the decision to focus on Machakos County is mainly driven by;
- Strategic location with high concentration of industries, as the area is mainly deemed as an industrial area,
- Adequate infrastructural network with the area being served by roads such as the ongoing Nairobi Expressway, and,
- Presence of a Standard Gauge Railway terminus that serves as an offloading point for Nairobi for goods coming from Mombasa.
Therefore we expect Kenya’s industrial sector to continue realizing growth and development activities supported by; i) Kenya being recognized as a regional hub hence attracting investments, ii) expansion of local and international retailers seeking storage space for goods, ii) government focus on the Big 4 Agenda on manufacturing which is expected to influence demand for warehouses used to manufacture products, iii) improvement of infrastructure, for instance Standard Gauge Railway project which is expected to increase the output of Special Economic Zones, and, iv) e-commerce driving demand for warehouse spaces.
- Real Estate Investment Trusts (REITS)
In the Nairobi Stock Exchange, ILAM Fahari I-Reit closed the week trading at an average price of Kshs 5.8 per share. This represented a 1.7% and 9.3% Week-to-Date (WTD) and Year-to-Date (YTD) decline, respectively, from Kshs 5.9 per share and Kshs 6.4 per share, respectively. On Inception-to-Date (ITD) basis, the REIT’s performance continues to be weighed down having realized a 71.0% decline from Kshs 20.0. The Kenyan REIT market performance continues to be weighed down by; i) a general lack of knowledge on the financing instrument, ii) general lack of interest of the REIT by investors, and, iii) lengthy approval processes to get all the necessary requirements thus discouraging those interested in investing in it. The graph below shows Fahari I-REIT’s performance from November 2015 to March 2022:
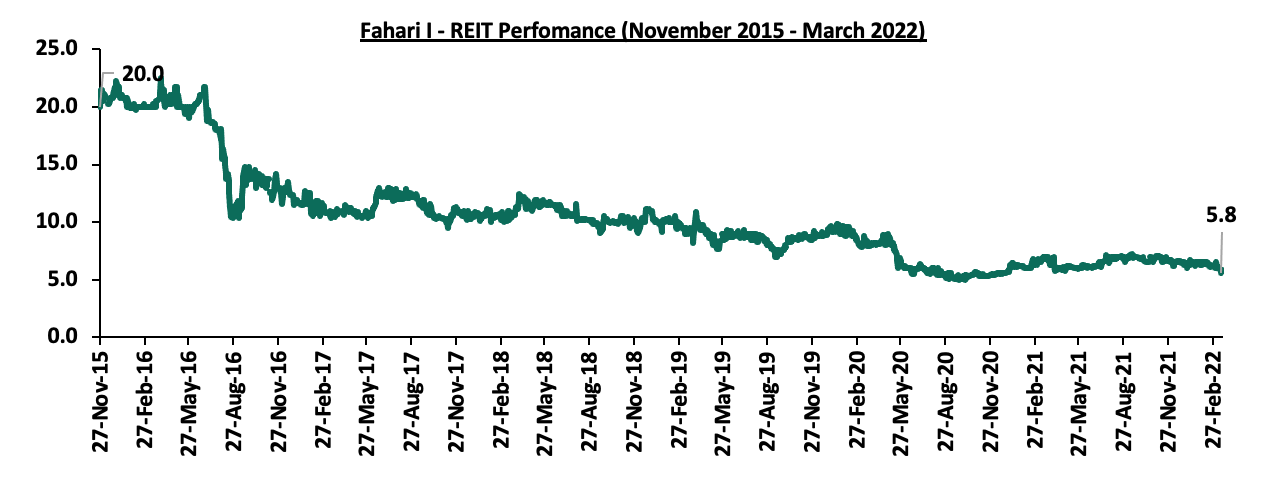
We expect Kenya’s property market to continue recording growth and development activities driven by government and private sector efforts to provide affordable homes, KMRC’s efforts to provide home loans to buyers, aggressive expansion in the retail sector, and Kenya being recognized as a regional hub thus attracting foreign investments. However, investor’s minimal appetite for the REIT instrument is expected to weigh down the overall performance of the property sector.
Housing Pillar of the Government of Kenya’s Big 4 Agenda. It was incorporated in April 2018 as a non- deposit taking financial institution under the supervision of the Central Bank of Kenya with the single purpose of providing long-term funds to primary mortgage lenders (Banks, Micro Finance Banks and SACCOs) in order to increase the availability and affordability of mortgage loans to Kenyans. The company was licensed by the Central Bank of Kenya (CBK) in August 2018 and began operations in September 2020. We have previously covered four topicals on KMRC namely;
- Kenya Mortgage Refinance Company, in April 2018 where we introduced KMRC as a mortgage liquidity facility and demystified the conditions necessary for the KMRC to thrive,
- Kenya Mortgage Refinance Company Update in April 2019, where we reintroduced what mortgage refinance companies are, why they are needed, how they operate, what benefits they give,
- Kenya Mortgage Refinance Company Recap in November 2020, where we drew lessons from Saudi Real Estate Refinance Company, and,
- Kenya Mortgage Refinance Company Update in August 2021, where we benchmarked with the Jordan Mortgage Refinance Company.
This week we update progress of KMRC by highlighting their latest initiatives to achieve their objectives and offer recommendations on how to boost finance for refinancing mortgages, based on similar initiatives from other countries. We shall therefore cover the following topics;
- Overview of the Housing Sector in Kenya,
- Home Financing in Kenya,
- Kenya Mortgage Refinance Company (KMRC) Progress,
- Case Studies and Lessons Learnt,
- Recommendations, and,
- Conclusion
Section I: Overview of the Housing Sector in Kenya
According to the Centre for Affordable Housing, Kenya has a housing supply of approximately 50,000 units annually with only 2.0% percent of this incoming supply targeted for the low income earners. With a housing deficit of 2.0 mn units which continues to grow annually by 200,000 and the low supply rate, the government’s plan of delivering 500,000 units by the end of 2022 is far out of reach. On the other hand, home ownership in Kenya has remained low at 21.3% in urban areas as at 2020, implying that 78.7% of the urban population are renters. The low home ownership rate is attributed to;
- Exclusion of self-employed citizens due to lack of the credit information and not meeting criteria threshold for mortgage products,
- The tough economic times reducing savings and disposable income,
- High property costs,
- The high initial deposits required to access mortgages, and,
- Tight underwriting standards for bank lending due to the increasing number of Non-Performing Loans (NPLS) in the Real Estate sector, which increased by 1.4% to Kshs 69.2 bn in Q3’2021 from Kshs 68.2 bn recorded in Q2’2021 according to The Central Bank of Kenya.
Availability of affordable housing finance continues to be the key challenge towards home ownership in Kenya. This is why the government established the Kenya Mortgage Refinance Company whose main objectives include;
- Provision of secure long-term funding at attractive rates to member institutions to enable them scale up their mortgage lending operations,
- Contributing to the growth of Kenyan capital markets through the issuance of KMRC bonds as a source of sustainable long-term fund,
- Standardization of mortgage practices in Kenya through enhancing capacity building to primary mortgage lenders,
- Facilitating the entry of new mortgage lenders in the market in order to broaden the scope of mortgage issuance and as a result increase competition among the primary lenders,
- Support lowering the cost of funds to primary mortgage lenders, which lead to a lowering of onward mortgage rates, thereby improving affordability and extending the range of potential borrowers, and,
- Facilitating member institutions to extend the mortgage maturity in line with the objective of long-term finance.
Section II: Housing Finance in Kenya
Mortgages have continued to lag behind as a home financing alternative, as evidenced in the Central Bank of Kenya- Bank Supervision Annual Report 2020, which indicated that the residential mortgage market recorded a 3.7% decline in the number of mortgage loans accounts, to 26,971 in December 2020 from 27,993 in December 2019. The overall value of mortgage loans outstanding therefore registered a 2.1% decline from Kshs 237.7 bn in December 2019 to Kshs 232.7 bn in December 2020. The performance decline of the mortgage market was mainly attributed to fewer mortgage loans advanced by banks due to the effects of COVID-19, and, a depressed economy that caused an increase in mortgage defaults as well as a reduction in savings and disposable income. For analysis on home ownership percentages in different countries, the number of mortgage accounts and mortgage to GDP ratios, please see the Real Estate section above.
Despite the number of mortgage accounts decreasing, the average mortgage loan size increased from Kshs 8.5 mn in 2019 to Kshs 8.6 mn in 2020, with the government making efforts to avail relatively affordable mortgage facilities through the Kenya Mortgage and Refinance Company (KMRC) as banks tighten credit standards to the mortgage market in the midst of high loan default rates. The average mortgage loan size increased by a 10-year CAGR of 4.4% as at 2020, while the average loan accounts increased by a 10-year CAGR of 5.3% which is a positive trend. The increase in loan accounts over the ten years is attributable to the combined efforts by the government and the private sector players to avail affordable mortgages with flexible terms in order to accommodate more clients especially in the low and middle income bands thereby boosting home ownership rates. The graph below shows the average mortgage loan size from 2011 to 2020;
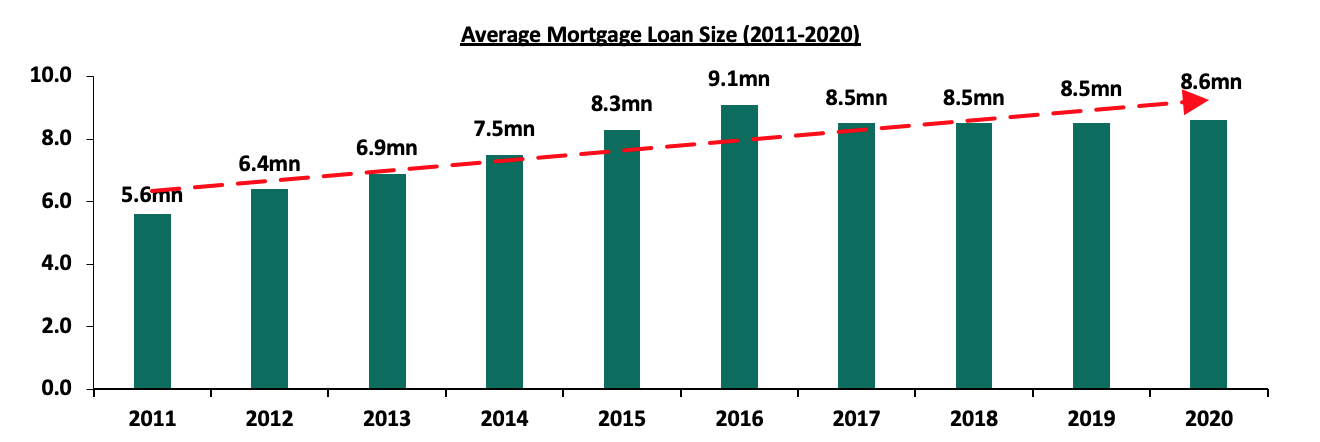
Source: Central Bank of Kenya (CBK)
The KMRC has made strides in boosting mortgage liquidity for Primary Mortgage Lenders (PMLs) in order to boost mortgage uptake in the country and we now highlight the performance of the facility focusing on new developments by the firm and initiatives it is undertaking to achieve its objectives.
Section III: Kenya Mortgage Refinance Company Progress
- Overview and Developments by KMRC
The Kenya Mortgage Refinance Company is a treasury-backed lender, which operates as a non-deposit taking financial institution regulated and supervised by the Central Bank of Kenya. The facility lends to PMLs at an annual interest rate of 5.0%, thus enabling them to write home loans at single digit rates, lower than the market average rate of 13.9%. KMRC has so far raised funds in form of loans, bonds and equity. It has a loan facility worth Kshs 37.3 bn as shown below:
|
# |
Institution |
Amount (Kshs bn) |
|
1 |
World bank |
25.0 |
|
2 |
African Development Bank (AfDB) |
10.0 |
|
3 |
Equity Capital |
2.3 |
|
Total |
37.3 |
Source: KMRC
In terms of products, KMRC offers two key loan products which include;
- Affordable housing loans: These are loans extended to Primary Mortgage Lenders (PMLs) to re-finance mortgage loans capped at Kshs 4.0 mn in Nairobi Metropolitan Area (Nairobi, Kiambu, Machakos & Kajiado) and Kshs 3.0 mn in other parts of the country to individual borrowers whose monthly household income is not more than Kshs 150,000. The loans are issued at a fixed rate of 5.0%, and,
- Marketing housing loans: These are loans extended to Primary Mortgage Lenders to re-finance mortgage loans above the Affordable Housing loans threshold of Kshs 4.0 mn, and income greater than 150,000.
In January 2022 KMRC got approval from the Capital Markets Authority (CMA) to roll out a Kshs 10.5 bn medium-term bond programme. The firm aimed to raise Kshs 1.4 bn during the first tranche of issuance in February 2022. The first tranche issued recorded an oversubscription of 478.6%, attributable to the attractive returns offered by the bond of 12.5%, receiving bids worth Kshs 8.1 bn. KMRC only accepted bids worth Kshs 1.4 bn since the bond did not have a green shoe option. In light of the above, International Finance Corporation (IFC), an international financier, announced plans to buy Kshs 4.2 bn worth bonds from the Medium Term Note Program (MTN). If successful, since the purchase is expected to be on the second tranche, this will make IFC an anchor investor to the mortgage lender’s MTN, with a 40.0% stake of the bond. IFC owns 11.8% of the KMRC shares as at 30th September 2020, having invested Kshs 213.7 mn in the KMRC during formation. Breakdown of KMRC shareholding is as shown below;
|
KMRC Shareholding |
||||
|
Institution |
Amount Contributed (Kshs) |
Total Allotment (Kshs) |
Number of Shares |
% |
|
KCB Bank Kenya ltd |
600,000,000 |
361,675,025 |
3,616,750 |
20.0% |
|
CS National Treasury |
800,000,000 |
458,000,000 |
4,580,000 |
25.3% |
|
IFC |
213,700,000 |
213,700,000 |
2,137,000 |
11.8% |
|
Shelter Afrique |
200,000,000 |
200,000,000 |
2,000,000 |
11.1% |
|
Co-operative Bank |
200,000,000 |
200,000,000 |
2,000,000 |
11.1% |
|
NCBA Bank |
50,000,000 |
50,000,000 |
500,000 |
2.8% |
|
HFC Limited |
50,000,000 |
50,000,000 |
500,000 |
2.8% |
|
Barclays Bank |
50,000,000 |
50,000,000 |
500,000 |
2.8% |
|
DTB Bank |
50,000,000 |
50,000,000 |
500,000 |
2.8% |
|
Harambee Sacco |
25,000,000 |
25,000,000 |
250,000 |
1.4% |
|
Stanbic Bank |
20,000,000 |
20,000,000 |
200,000 |
1.1% |
|
Stima Sacco |
20,000,000 |
20,000,000 |
200,000 |
1.1% |
|
Credit Bank |
10,000,000 |
10,000,000 |
100,000 |
0.6% |
|
Unaitas Saccox |
10,000,000 |
10,000,000 |
100,000 |
0.6% |
|
imarika Sacco |
10,000,000 |
10,000,000 |
100,000 |
0.6% |
|
Kenya Police Sacco |
10,000,000 |
10,000,000 |
100,000 |
0.6% |
|
Imarisha Sacco |
10,000,000 |
10,000,000 |
100,000 |
0.6% |
|
Mwalimu National Sacco |
10,000,000 |
10,000,000 |
100,000 |
0.6% |
|
Bingwa Sacco |
10,000,000 |
10,000,000 |
100,000 |
0.6% |
|
Ukulima Sacco |
10,000,000 |
10,000,000 |
100,000 |
0.6% |
|
Tower Sacco |
10,000,000 |
10,000,000 |
100,000 |
0.6% |
|
Safaricom sacco |
10,000,000 |
10,000,000 |
100,000 |
0.6% |
|
KWFT |
10,000,000 |
10,000,000 |
100,000 |
0.6% |
|
Total |
2,388,700,000 |
1,808,375,125 |
18,083,751 |
100.0% |
Source: Kenya Mortgage Refinance Company (KMRC)
The table below shows the particulars of the MTN;
|
Description of Note |
|
|
Issuer |
Kenya Mortgage Refinance Company (KMRC) |
|
Trustee |
Ropat Trust Company Ltd |
|
Aggregate Nominal Amount |
Kshs 10.5 bn |
|
Issue Date |
4th March 2022 |
|
Listing Date |
14th March 2022 |
|
Tranche 1 |
Kshs 1.4 bn |
|
Interest Rates |
12.5% p.a., payable semi-annually in arrears |
|
Placing Agent |
NCBA Investment Bank Ltd. |
|
Receiving Bank |
KCB Bank Kenya Ltd. |
|
Specified Denomination |
Kshs 100,000 with integral multiples of Kshs 100,000 thereof |
|
Tenor |
7 years amortizing, with a Weighted Average Life of 4.5 years |
|
Interest on Late Payments |
Initial Interest Rate plus a margin of 2.0% p.a. to trade creditors |
|
Credit Rating |
GCR-AA+AA- (Highest certainty of timely payment of obligations) |
|
Default |
In case of default, issuer commences negotiations with any one or more of its creditors with a view to the general readjustment or rescheduling of its indebtedness. N/B; Trade creditors not mentioned |
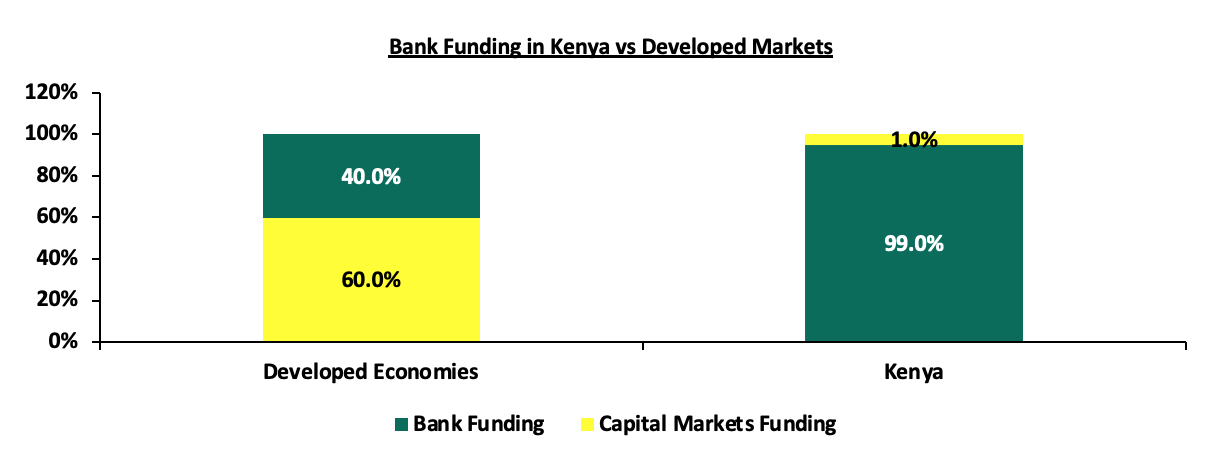
Source: World Bank
- KMRC Achievements
The following are key achievements by KMRC;
-
- Increased Capital to Primary Mortgage Lenders for Refinancing: In December 2020, KMRC made its debut lending of Kshs 2.8 bn to primary mortgage lenders out of the total Kshs 4.5 bn that was available for refinancing. In the FY’2021/22 that began in July 2021, KMRC tripled the lending allocation to Kshs 7.0 bn representing a 153.5% increase,
- Increased Mortgage Uptake in the Country: The lending to primary mortgage lenders at December 2020 refinanced a portfolio of 1,427 mortgages, at single digit interest rates to make them affordable to more clients and increase mortgage uptake,
- Solving the Balance Sheet Mismatch for PMLs to Encourage Long Tenor Mortgages: KMRC is offering the institutions long term financing at a fixed rate of 5.0% which will enable them offer long tenor mortgages with minimal liquidity or interest rate risk concerns to reduce over dependence on deposits while offering loans,
- Spurred Competition in the Mortgage Market for the Benefit of Borrowers: KMRC lending at 5.0% to primary mortgage lenders for onward lending at single digit rates has spurred competition among lending institutions particularly those offering higher interest rates. This has prompted some lending institutions to revise their terms in order to remain competitive. In turn, mortgage borrowers are able to benefit from fair interest rates, and,
- Successful Bond Issuance for Mortgage Funding: The firm got an approval from Capital markets Authority (CMA) to roll out a Kshs 10.5 bond programme. In the first tranche of the issuance, the firm aimed to raise Kshs 1.4 bn and recorded an over subscription of 478.6%. The funds raised through bond issue are incorporated in capital for refinancing to primary mortgage lenders.
- Challenges facing KMRC
Despite the above achievements, KMRC has faced numerous challenges which include;
- High Property Prices: Given the high property prices in the Nairobi Metropolitan area, clients may run out of options for houses. During FY’2021, prices for detached units averaged at Kshs 12.2 mn while that of apartments averaged at Kshs 9.3 mn which are both higher than the KMRC affordable housing loan limits of Kshs 4.0 mn in the NMA region and Kshs 3.0 mn elsewhere. The table below shows the performance of both apartments and detached units in the Nairobi Metropolitan Area (NMA) in FY’2021 assuming an average size of 90-SQM unit;
|
Average Property Prices |
||||||
|
Segment |
Average Unit Size (SQM) |
Average Price per SQM FY'2021 |
Price FY'2021 |
Average Rental Yield FY'2021 |
Average Price Appreciation FY'2021 |
Total Returns |
|
Detached Units |
||||||
|
High End |
90 |
193,715 |
17.4mn |
3.9% |
1.0% |
4.9% |
|
Upper Mid-End |
90 |
142,460 |
12.8mn |
4.2% |
1.8% |
6.0% |
|
Satellite Towns |
90 |
72,067 |
6.5mn |
4.7% |
1.1% |
5.8% |
|
Detached Units Average |
90 |
136,081 |
12.2mn |
4.3% |
1.3% |
5.6% |
|
Apartments |
||||||
|
Upper Mid-End |
90 |
121,504 |
10.9mn |
5.4% |
0.3% |
5.7% |
|
Lower Mid-End |
90 |
110,194 |
9.9mn |
5.2% |
1.9% |
7.1% |
|
Satellite Towns |
90 |
77,023 |
6.9mn |
5.3% |
2.0% |
7.3% |
|
Apartments Average |
90 |
102,907 |
9.3mn |
5.3% |
1.4% |
6.7% |
Source: Cytonn Research 2021
- High Default Rates Leading to a High Number of Non-Performing Loans (NPLs): According to Quarterly Economic Review July-September 2021 by the Central Bank of Kenya (CBK), The Gross Non Performing Loans in the Real Estate sector increased by 1.4% to Kshs 69.2 bn in Q3’2021, from Kshs 68.2 bn recorded in H1’2021. On a YoY basis, the performance represented a 16.6% increase from Kshs 57.7 bn realized in Q3’2020, attributed to increased Real Estate loan default rates. The high number of non-performing loans is expected to reduce loan advances as lenders will cushion themselves from credit risk that would expose them to possible collapse,
- Constrained and Unsustainable Funding Model: The current funding model of KMRC is unclear, some of the government instruments such as the 20-year bond are attracting a return of 13.9% and would seem more attractive to investors. It is therefore not clear how the firm will borrow and maintain lending at a 5.0% rate, and,
- Inability to Meet Criteria Threshold for Mortgage Products: The primary lending institutions have a set of eligibility criteria to meet before they can receive funding from KMRC mostly set under the World Bank and African Development Bank (AfDB) standards as discussed. Most of these requirements have not been met thus limiting the number of primary mortgage lenders for the loans.
Section IV: Case Studies and Lessons Learnt
In our previous topical on Kenya Mortgage Refinance Company Update, and, Kenya Mortgage Refinance Company Recap covered in August 2021 and November 2020, respectively, we provided case studies of the Jordan Mortgage Refinance Company and the Saudi Real Estate Refinancing company, respectively. In this topical, we now look at the lessons and key takeout’s that we can derive from the aforementioned mortgage refinancing companies alongside the Tanzania Mortgage Refinancing Company (TMRC).
|
Institution |
Key takeout’s/ Achievements |
|
Jordan Mortgage Refinancing Company |
|
|
Saudi Real Estate Refinance Company |
|
|
Tanzania Mortgage Refinance Company |
|
Section V: Recommendations
From the above lessons, the following can be implemented to accelerate funding for KMRC;
- Develop a Clear Financing Model: The first tranche of KMRC Medium Term Note (MTN) program recorded an oversubscription of 478.6%, attributable to the attractive returns offered by the bond of 12.5%. This was possible with the firm having raised funds from the World Bank and African Development Bank. However, with the firm tapping into the capital markets, the subsequent bonds offered may face competition from government instruments which are offering higher rates. Some of the government bonds such as the 20-year bond are attracting a return of 13.9% and would seem more attractive to investors. To ensure that it can comfortably lend at single digit rates, KMRC should come up with a comprehensive funding mechanism to prevent a negative spread between the lending rate and the borrowing rate. KMRC could either:
-
- Refinance at cost which would mean no spread for the facility, as well as competition from treasury bonds which is approximately 13.5%-13.9%, possibly leading to undersubscription,
- Refinance lenders’ mortgage portfolios using finance from the World Bank and other shareholders’ equity as they build up on entry to capital market,
- Increase Capital and Investor Confidence through Listing in the Stock Exchange: KMRC should in its long term plans look to list on the Nairobi Stock Exchange (NSE) in order to increase funding and grow investor confidence. JMRC was listed in the Amman Stock Exchange in 2011. After the listing, the net revenue has increased at an 8-year CAGR of 16.2% from USD 13.3 mn (Kshs 1.5 bn) in 2012 to an estimated USD 44.4 mn (Kshs 4.9 bn) as at FY’2020. Listing not only helps improve capital by raising funds from the general public, it also helps build confidence from investors since financials are publicly available and listed companies are viewed to have stronger regulation and scrutiny,
- Increased Transparency: Many market participants have questions about the sustainably of the funding model and sustainability of the 5% lending rate, it would be constructive for KMRC board and management to come out and address this market concern, and,
- Source Funding from International Debt Markets: To accelerate funding, KMRC should in its long tern plans consider issuing bonds in the international market to raise a larger pool of resources to refinance mortgages. Saudi Real Estate Company is currently looking into tapping the international markets for a debut USD 500.0 mn dollar-denominated bond in 2022, to fund the growth of its Real Estate loan book.
Section VI: Conclusion
In conclusion, the efforts by KMRC to avail mortgages to clients at favorable rates is expected to improve mortgage uptake in Kenya thereby driving the home ownership rates. However, there is lack of clarity on the funding model of the company in order to maintain their lending rate of 5.0% given that even the government itself accesses 20-year Treasury bonds at an interest rate of 13.9%. We are of the view that in order to deepen our capital markets and stimulate its growth, these obstacles can be addressed by; i) bridging regulatory framework to allow unit holders to invest in sector funds dedicated to affordable housing, ii) reduce high minimum investments in REITs to reasonable amounts given that the national median income for employed individuals is estimated at around Kshs 50,000., and, iii) eliminate conflicts of interest in the governance of capitals markets to a structure that is more responsive to market participants and market growth. These would help increase house ownership levels, reduce the ever-widening housing supply gap and help diversify sources of capital.
Disclaimer: The views expressed in this publication are those of the writers where particulars are not warranted. This publication, which is in compliance with Section 2 of the Capital Markets Authority Act Cap 485A, is meant for general information only and is not a warranty, representation, advice or solicitation of any nature. Readers are advised in all circumstances to seek the advice of a registered investment advisor.

- Talk to us
- Kenya
- P.O Box 20695 - 00200, Nairobi, Kenya
- Cell +254709101200
- Tel +254709101200
- WhatsApp +254741676635
- United States
- +254709101200
- DOWNLOAD OUR APP
-


- Kenya
- 8th Floor, Pinetree Plaza, Kaburu Drive, Ngong Road, Nairobi, Kenya
- USA
- Suite 1150, 1775 Eye Street NW, USA, Washington DC 20006, USA
- Investments
- High Yield
- Private Equity
- Real Estate
- Real Estate
- RiverRun Estates
- Cytonn Towers
- The Ridge
- Taraji Heights
- The Alma