Kenya Listed Banks Q3’2018 Report, & Cytonn Weekly #48/2018
By Cytonn Research Team, Dec 16, 2018
Executive Summary
Fixed Income
T-bills were under-subscribed during the week for the sixth week running, with the overall subscription rate coming in at 23.8%, down from 46.0% recorded the previous week, attributable to the tight liquidity in the interbank market. The yields on the 91-day, 182-day and 364-day remained unchanged at 7.3%, 8.2%, and 9.6%, respectively. The newly issued 10-year Treasury bond (issue FXD 2/2018/10) was undersubscribed at an overall subscription rate of 72.2%, with the government accepting Kshs 26.2 bn out of the Kshs 28.9 bn worth of bids received, against Kshs 40.0 bn on offer, translating to an acceptance rate of 90.6%;
Equities
During the week, the equities market recorded mixed performances with NSE 20 gaining by 0.8% while NASI and NSE 25 declined by 1.4% and 0.7%, respectively, taking their YTD performance to declines of 24.1%, 15.9% and 13.9%, for NASI, NSE 20 and NSE 25, respectively. Central Bank of Kenya (CBK) accepted a binding offer from KCB Group for the acquisition of Imperial Bank of Kenya (under Receivership). The World Bank announced funding for the creation of an electronic registry that will allow the use of household goods, live animals and office equipment as collateral for commercial loans in a move aimed at boosting access to credit by personal and household credit consumers;
Private Equity
During the week, there was activity in the fundraising space, with Ascent Capital, a private equity firm based in Kenya, seeking to raise USD 120.0 mn (Kshs 12.3 bn) in its second fund, with the funds aimed at being invested in mid-size companies in the East African Region;
Real Estate
During the week, the retail sector witnessed the opening of Waterfront Mall, in Karen, to the public, bringing to the market 200,000 SQFT of lettable retail space and 1,000 parking bays. In infrastructure, Kitengela residents are set to benefit from a commuter train, from Kitengela Town to Nairobi, which is set to begin operating in 2019. In the hospitality sector, Kenya was crowned as the best travel destination in the world by Global Traveler, while Kenya Airways was named the third best airline in Africa, following the conclusion of Global Travel (GT) reader’s survey, in an event held at the Peninsula Beverly Hills, California;
Focus of the Week
Following the release of Q3’2018 results by Kenyan listed banks, we analyse their results to determine which banks are the most attractive and stable for investment from a franchise value, and from a future growth opportunity (intrinsic value) standpoint. The theme for the report is “Deteriorating Asset Quality Dampens on Growth” as we assess what influenced the growth and recovery of the Kenyan banking sector and the factors that that weighed down the growth and our view going forward.
- Cytonn Asset Managers Limited (CAML), the regulated affiliate of Cytonn Investments, has been registered and authorized by the Retirement Benefits Authority (RBA) to manage retirement benefit schemes funds. This comes a few months after the Capital Markets Authority (CMA) licensed CAML in March 2018. Read the full press statement here
- Moses Njuguna, Financial Advisor Manager, was on KBC Channel 1 to discuss the best management of family finances during the holiday season. See Moses here
- Maurice Oduor, Principal Officer, Cytonn Asset Managers, was on KBC Channel 1 to discuss and review the state of the economy for the year 2018. Watch him here
- On Tuesday, 11th December 2018, Cytonn Investments Management Plc opened their Western Kenya Office to serve the Western Kenya Region and tap into the vast real estate investment opportunities the region offers. The office is located in Kisumu Town, on the 3rd Floor of Centre Court Building on Oginga Odinga Street. Read the full Event Note here
- Cytonn Investments held a series of client appreciation engagements for clients in the various regions in the country. The events held in Mombasa on 10thDecember, Kisumu on 11th December, Nakuru on 13th December, and Nyeri on 14th December, sought to appreciate our clients for the continued support as we celebrate the milestones achieved together in 2018. Read the full Event Note here
- The Ridge, a comprehensive lifestyle development at Ridgeways in Nairobi County by Cytonn Real Estate offers a live work play environment. It offers a prime real estate development opportunity. To view show house images click here. The site is open to clients all week long.
- We continue to hold weekly workshops and site visits on how to build wealth through real estate investments. The weekly workshops and site visits target both investors looking to invest in real estate directly and those interested in high yield investment products to familiarize themselves with how we support our high yields. Watch progress videos and pictures of The Alma, Amara Ridge, The Ridge, and Taraji Heights. Key to note is that our cost of capital is priced off the loan markets, where all-in pricing ranges from 16.0% to 20.0%, and our yield on real estate developments ranges from 23.0% to 25.0%, hence our top-line gross spread is about 6.0%. If interested in attending the site visits, kindly register here;
- We continue to see very strong interest in our weekly Private Wealth Management Training (largely covering financial planning and structured products). The training is at no cost and is open only to pre-screened participants. We also continue to see institutions and investment groups interested in the training for their teams. The Wealth Management Training is run by the Cytonn Foundation under its financial literacy pillar. If interested in our Private Wealth Management Training for your employees or investment group, please get in touch with us through wmt@cytonn.com. To view the Wealth Management Training topics, click here;
- For recent news about the company, see our news section here;
- We have 10 investment-ready projects, offering attractive development and buyer targeted returns of around 23.0% to 25.0% p.a. See further details here: Summary of Investment-Ready Projects; and
- We continue to beef up the team with ongoing hires for Financial and Real Estate Advisors for our offices in Nairobi, Nakuru, Kisumu, and Nyeri. Visit the Careers section on our website to apply.
- Cytonn Centre for Affordable Housing (CCFAH) is looking for a 2-acre land parcel for a joint venture or to buy in; Kiambu County (Ruiru, Kikuyu, Lower Kabete), Nairobi County and its environs.
The parcel should be; i) fronting a main road, or not more than 800 metres from the main road, and ii) priced at Kshs 20 mn per acre or below. For more information or leads email us at affordablehousing@cytonn.com
T-Bills & T-Bonds Primary Auction:
T-bills were under-subscribed during the week for the sixth week running, with the overall subscription rate coming in at 23.8%, down from 46.0% recorded the previous week. The under-subscription was attributable to the 10-year tenor bond sale that closed this week, as well as tightened liquidity in the interbank markets, which saw the interbank rate, hit 11.3% as at 14th December 2018, the highest recorded since 30th October 2015. The subscription rate for the 91-day and 182-day papers declined to 23.3% and 16.1%, from 172.8% and 9.9%, recorded the previous week, respectively. Subscription rate for the 364-day paper rose marginally to 31.7%, from 31.5%, recorded the previous week. The yields on the 91-day, 182-day and 364-day remained unchanged at 7.3%, 8.2% and 9.6%, respectively. The acceptance rate declined to 95.0%, from 96.2% recorded the previous week, with the government accepting Kshs 5.4 bn of the Kshs 5.7 bn worth of bids received.
The newly issued 10-year Treasury bond (issue FXD 2/2018/10) was undersubscribed at an overall subscription rate of 72.2%. The yield came in at 12.5%, in line with our expectations. The government accepted Kshs 26.2 bn out of the Kshs 28.9 bn worth of bids received, against Kshs 40.0 bn on offer, translating to an acceptance rate of 90.6%. The issuance of medium to long-term securities have continued having a lacklustre performance, which we attribute to the saturation of long-end offers, leading to a relatively flat yield curve on the long-end.
Liquidity:
The average interbank rate rose to 10.2%, from 7.5% the previous week, hitting a high of 11.3% on 14th December 2018, the highest recorded since 30th October 2015. Average volumes traded in the interbank market rose by 18.1% to Kshs 15.4 bn, from Kshs 13.0 bn the previous week. The higher interbank rate points to tighter liquidity, partly attributed to banks shoring up their reserves to meet the 5.25% cash reserve requirement (CRR), ahead of the end of the CRR cycle on December 14th.
Kenya Eurobonds:
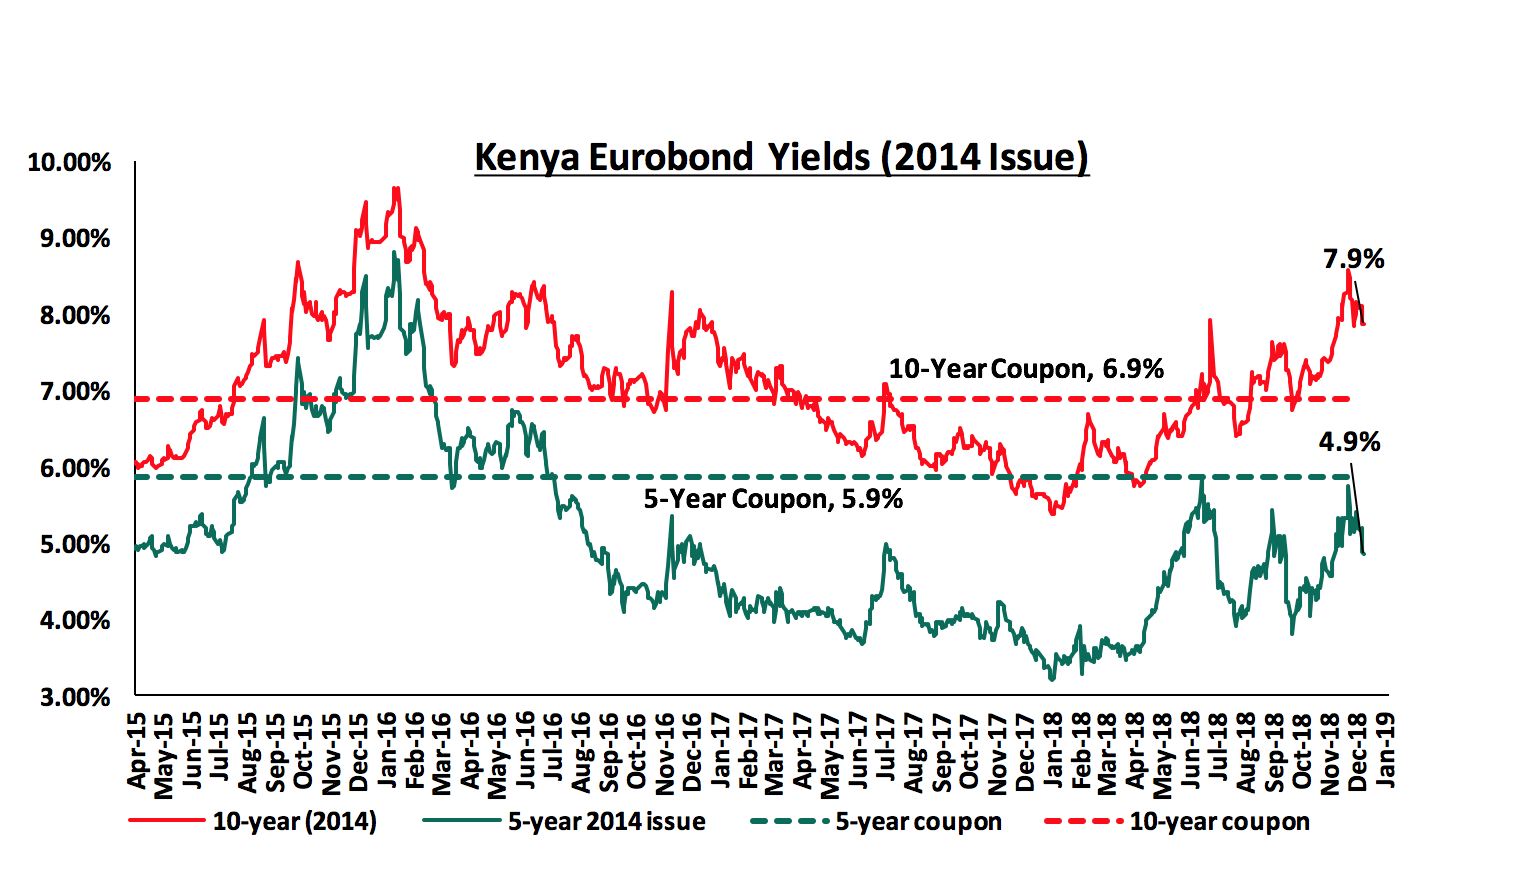
According to Bloomberg, the yields on the 5-year and 10-year Eurobonds issued in 2014 declined by 0.3% and 0.2% points to 4.9% and 7.9%, from 5.2% and 8.1% recorded the previous week, respectively. Since the mid-January 2016 peak, yields on the Kenyan Eurobonds have declined by 1.8% points and 3.9% points for the 10-year and 5-year Eurobonds, respectively, an indication of the relatively stable macroeconomic conditions in the country. Key to note is that these bonds have 0.5-years and 5.5-years to maturity for the 5-year and 10-year, respectively.
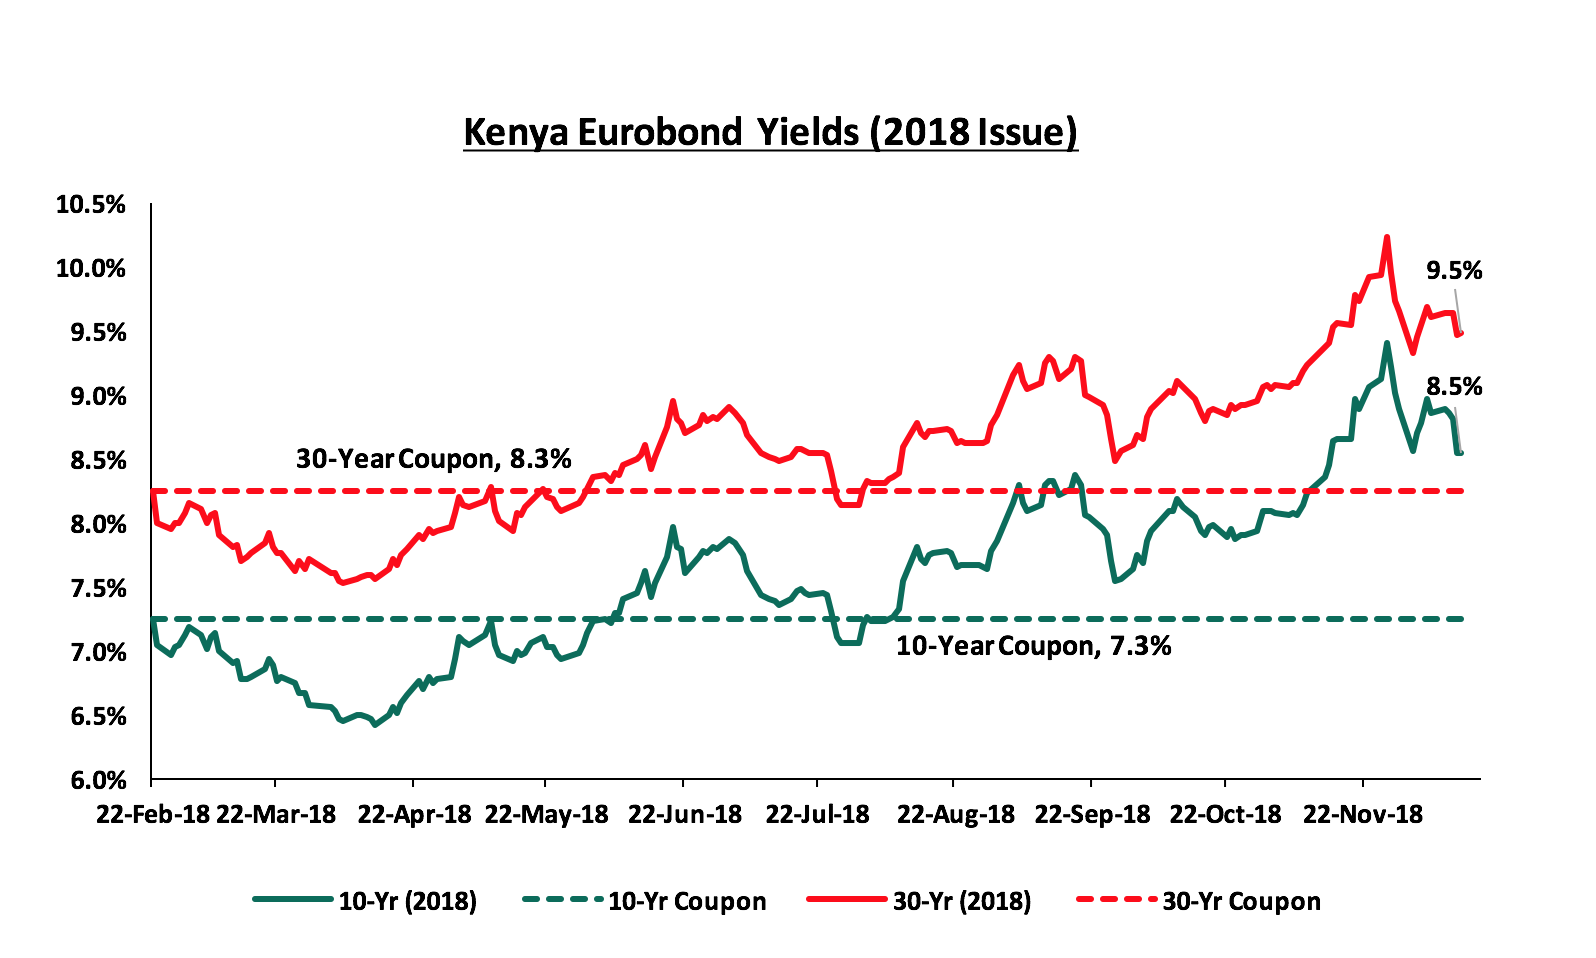
For the February 2018 Eurobond issue, during the week, the yields on both the 10-year and 30-year Eurobonds declined by 0.4% and 0.1% points, to 8.5% and 9.5%, from 8.9% and 9.6%, respectively. Since the issue date, the yields on the 10-year and 30-year Eurobonds have both increased by 1.3% and 1.2% points, respectively.
Key to note however, yields in Eurobonds issued in the Sub-Saharan Region have been on the rise on a year to date basis, signalling higher risk perception by investors. This has partly been attributed to the increment in the Federal Funds Rate twice this year, currently at 2.00% - 2.25%, which has led to market correction in Eurobond yields in the emerging markets in the wake of rising US Treasury yields and a stronger US Dollar.
Kenya Shilling:
During the week, the Kenya Shilling remained stable against the US Dollar to close at Kshs 102.6, unchanged from the previous week, attributed to inflows from remittances and tight liquidity in the money market, which matched the increased demand from oil and other goods importers. The Kenya Shilling has appreciated against the US Dollar by 0.6% year to date, and in our view the shilling should remain relatively stable to the dollar in the short term, supported by:
- The narrowing of the current account deficit to 5.3% in the 12-months to September 2018, from 6.5% in September 2017, attributed to improved agriculture exports, increased diaspora remittances, strong receipts from tourism, and lower food and SGR-related equipment relative to 2017,
- Improving diaspora remittances, which increased by 6.9% m/m growth in diaspora remittances in the month of October 2018 to USD 219.2 mn from USD 205.1 mn recorded in September. The y/y growth came in at 18.2% from USD 185.5 mn recorded in October 2017. Cumulatively, total diaspora remittances rose by 39.5% in the 12 months to October 2018, to USD 2.6 bn, from USD 1.9 bn recorded in a similar period in 2017. This has been attributed to; (a) recovery of the global economy, (b) increased uptake of financial products by the diaspora due to financial services firms, particularly banks, targeting the diaspora, and (c) new partnerships between international money remittance providers and local commercial banks making the process more convenient. For more analysis on this see our October Diaspora Remittances Note,
- CBK’s activities in the money market, such as repurchase agreements and selling of dollars, and,
- High levels of forex reserves, currently at USD 8.0 bn, equivalent to 5.2 months of import cover, compared to the one-year average of 5.1 months and above the EAC region’s convergence criteria of 4.5 months of imports cover.
Highlight of the Week:
Moody’s Investor Service gave an update on Kenya’s B2 (Stable) credit profile in an annual report, "Government of Kenya -- B2 stable, Annual Credit Analysis". According to Moody’s, even though the rating remained unchanged, Kenya's credit profile is constrained by high and rising government debt, as well as subdued government revenue and low institutional strength. The agency’s main concerns are as detailed below:
- Government Debt – Government debt has increased consistently, currently at 52.2% of GDP (beyond the IMF threshold of 50.0%), which was higher than the 47.9% recorded in fiscal years 2016-2018; with Moody’s expecting it to reach 60.0% of GDP by 2020. Kenya's large fiscal and current account deficits of 6.8% and 5.3% of GDP, respectively (compared to the IMF target fiscal deficit of 6.2%), would expose it to tighter external financing conditions, with the possibility of rising interest rates, a risk the government is particularly sensitive to given its large borrowing requirements of about 20.0% of GDP.
- Fiscal Policy - The government's fiscal deficits and failure to honour its commitment to repeal the cap on banks' lending rates, introduced in September 2016, point to low fiscal policy effectiveness and credibility. The fiscal deficit reached more than 8.0% of GDP between fiscal year 2015 and fiscal year 2017, driven by large spending related to infrastructure upgrades. The general election and droughts in 2017 put additional pressure on government spending during the year, while revenue remained subdued. Moody's expects only a gradual narrowing of the fiscal deficit to around 6.5% of GDP in fiscal 2019, which is higher than the government's target of 5.7% in the original budget and the level of 6.1% proposed in the supplementary budget.
- Low Institutional Strength – Moody’s noted that Kenya's low institutional strength stems from its low ranking on the Worldwide Governance Indicators, a report by the World Bank that covers aggregate and individual governance indicators for over 200 countries and territories over the period 1996–2017, for six dimensions of governance, including:
- Voice and accountability, which reflects the extent to which a country’s citizens are able to participate in selecting their government, as well as freedom of expression, freedom of association and a free media. On this dimension, Kenya scored 40.0% points, out of a possible 100.0%,
- Political stability and absence of violence, which assesses the likelihood of occurrence of politically motivated violence, including terrorism. Kenya scored 12.9% on this dimension,
- Government effectiveness, which reflects perceptions on public and civil services, quality of policy formulation and implementation and credibility of government commitment to such policies. Kenya scored 40.9% on this dimension,
- Regulatory quality, which reflects the ability of the government to formulate and implement sound policies and regulations that permit and promote private sector development. On this dimension, Kenya garnered a score of 43.8%,
- Rule of law, reflecting the extent of adherence to rules of society, and in particular, the quality of contract enforcement, property rights, the police and the courts, as well as the likelihood of crime and violence. The score for Kenya on this dimension was 38.0%; and,
- Control of corruption, which reflects the extent to which public power is used for private gain, including both petty and grand forms of corruption. On this dimension, Kenya scored 15.4%.
In summary, Kenya scored dismally on all the dimensions highlighted above, underlining the low institutional strength and necessitating institutional reforms to remedy the poor image. Despite the weaknesses, Moody’s also highlighted Kenya’s credit strengths, including a relatively diversified economy that sustains high growth and has proved resilient to shocks, as well as a sound financial sector. Moody's expects Kenya's growth rate to return to its long-term average of around 6.0% in the medium-term due to recovery in the business environment and investor confidence and the fading effects of the drought. The stable outlook reflects expectation of relatively strong economic growth, balanced by large fiscal deficits and debt. Strong external buffers (with foreign exchange reserves of USD 8.0 bn covering 5.2-months of imports) mitigate the country's vulnerability to a worsening external environment. Kenya would strengthen its credit profile by undertaking fiscal reforms to reduce the fiscal deficit, public debt and liquidity risks, adopting a loose fiscal policy may lead to increase in government debt and, therefore, borrowing and debt-servicing costs. We maintain our view that, in order to reduce our debt levels in line with the IMF sustainable levels, the government should consider achieving:
- Enhanced tax revenue collection growth by increasing the tax base as well as introducing Value Added Tax (VAT) on fuel products,
- Involve private sector in development through Public-Private Partnerships (PPP’s),
- Reduce recurrent expenditure, which accounted for 71.5% in the Q1’2018/2019 budget and improve on development budget absorption rates, and,
- The country should embark on institutional reforms in order to restore trust in the public and private sectors in the provision of goods and services for citizens.
During the week, the Energy Regulatory Commission (ERC) released their monthly statement on the Maximum Retail Prices in Kenya for the period 15th December 2018 to 14th January 2019. Below are the key take-outs from the statement:
- Petrol prices have declined by 3.9% to Kshs 113.5 from Kshs 118.1 per litre previously, while diesel and kerosene prices have decreased by 0.5% and 5.9% to Kshs 112.3 and 105.2 per litre, respectively, from Kshs 112.8 and 111.8 per litre, previously,
- The changes in prices have been attributed to the decrease in average landing costs of imported super petrol by 8.5% to USD 694.2 per ton in November from USD 758.3 per ton in October. Landing costs for diesel and kerosene decreased by 2.6% and 11.1% to USD 722.2 per ton and USD 678.6 per ton in November, respectively, from USD 741.3 per ton and USD 763.5 per ton in October, and,
- The Free on Board (FOB) price of Murban crude oil lifted in November 2018 was posted at USD 68.0 per barrel, a 17.4% decrease from USD 82.3 per barrel in October 2018.
We expect a decline in the transport index, which carries a weighting of 8.7% in the total consumer price index (CPI), due to the decline in petrol and diesel prices. We will release our inflation projection for the month of December 2018 in next week’s report.
Rates in the fixed income market have been on a declining trend, as the government continues to reject expensive bids, as it is currently 15.0% behind its pro-rated domestic borrowing target for the current financial year, having borrowed Kshs 111.0 bn against a pro-rated target of Kshs 130.7 bn. The 2018/19 budget had given a domestic borrowing target of Kshs 271.9 bn, 8.6% lower than the 2017/2018 fiscal year’s target of Kshs 297.6 bn, which may result in reduced pressure on domestic borrowing. With the rate cap still in place, we maintain our expectation of stability in the interest rate environment. With the expectation of a relatively stable interest rate environment, our view is that investors should be biased towards medium-term fixed-income instrument.
Market Performance
During the week, the equities market recorded mixed performances with NSE 20 gaining by 0.8% while NASI and NSE 25 declined by 1.4% and 0.7%, respectively, taking their YTD performance to declines of 24.1%, 15.9% and 13.9%, for NASI, NSE 20 and NSE 25, respectively. The decline in the NASI was driven by declines in large cap stocks such as NIC Group, British American Tobacco (BAT), and Co-operative Bank, which declined by 12.6%, 7.4%, and 2.4%, respectively.
Equities turnover increased by 127.5% during the week to USD 32.4 mn, from USD 14.2 mn the previous week, taking the YTD turnover to USD 1.7 bn. Foreign investors remained net sellers for the week, with a net selling position of USD 6.4 mn, a 129.5% increase from last week’s net selling position of USD 2.8 mn. We expect the market to remain subdued in the near-term as international investors exit the broader emerging markets due to the expectation of rising US interest rates coupled with the strengthening of the US Dollar.
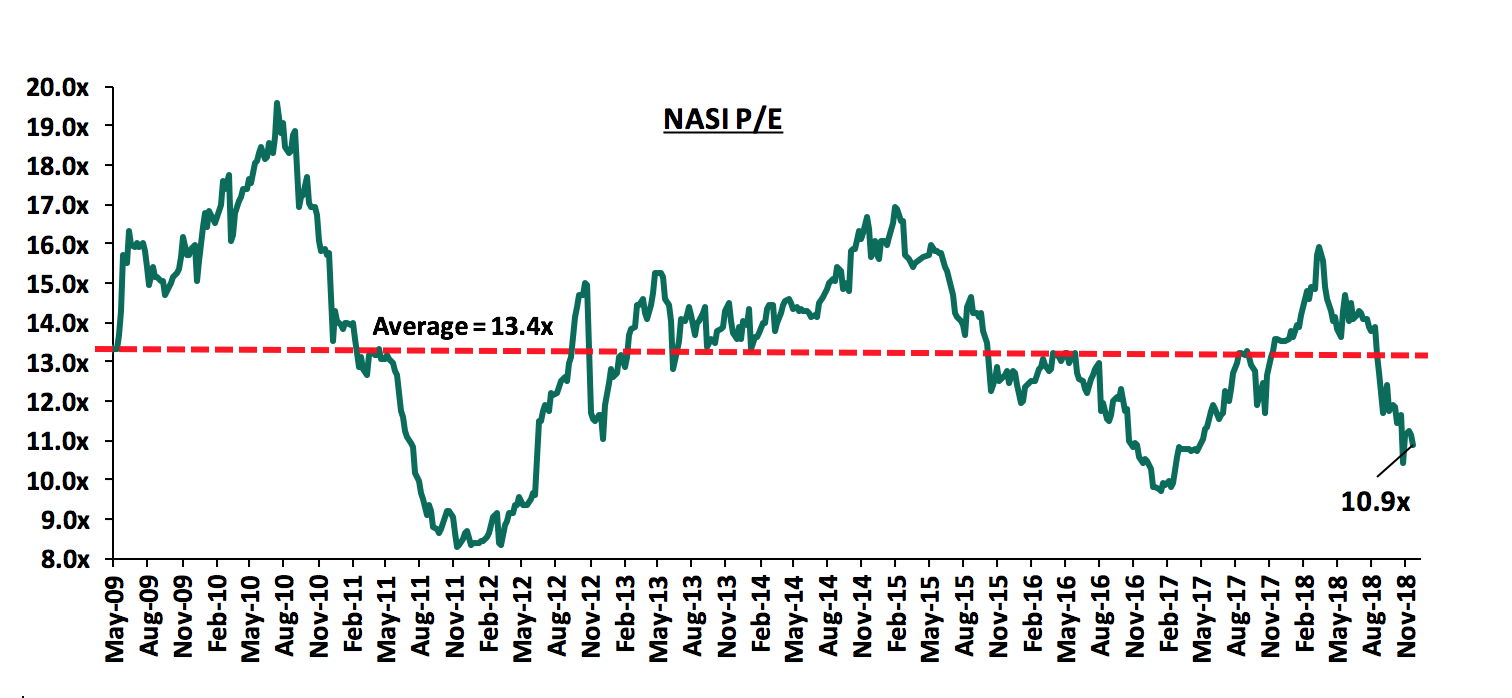
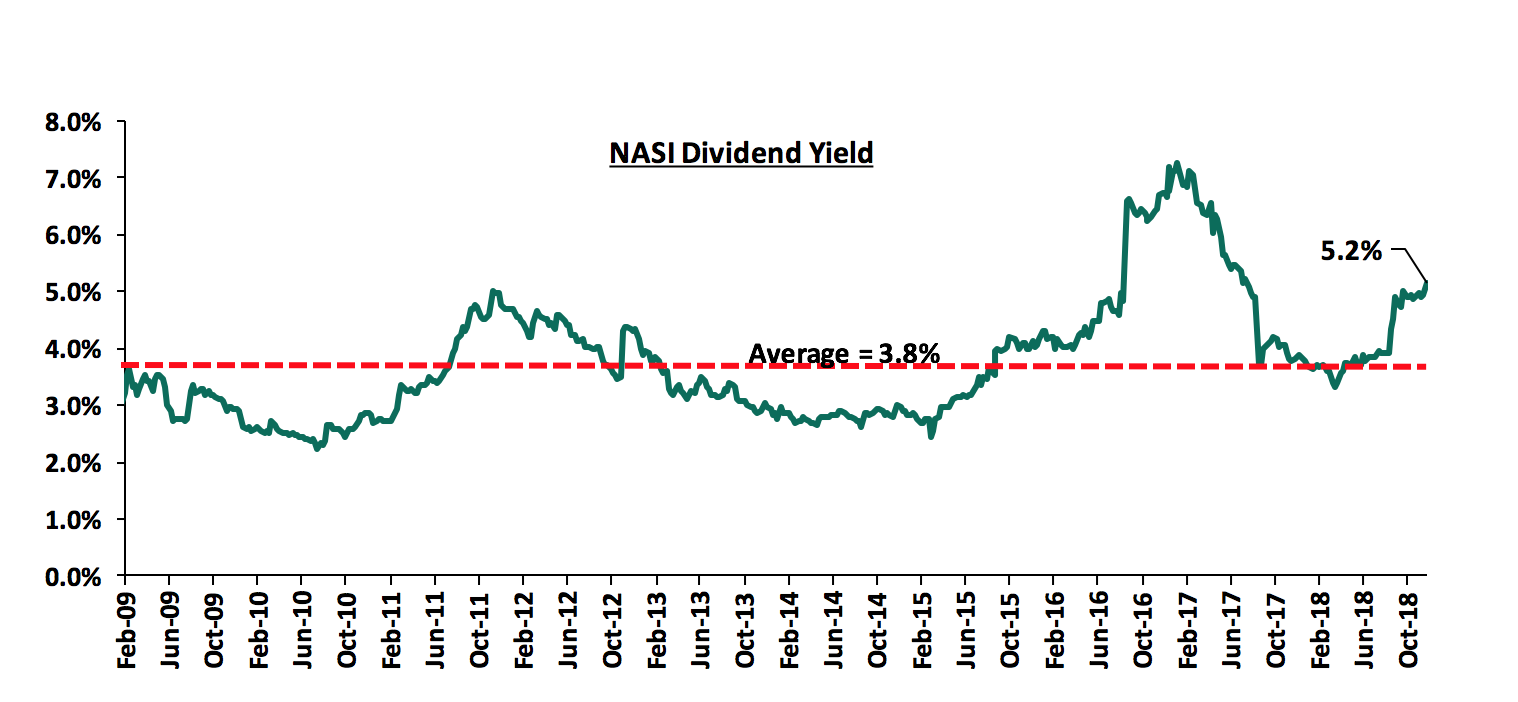
The market is currently trading at a price to earnings ratio (P/E) of 10.9x, 18.9% below the historical average of 13.4x, and a dividend yield of 5.2%, above the historical average of 3.8%. With the market trading at valuations below the historical average, we believe there is value in the market. The current P/E valuation of 10.9x is 11.0% above the most recent trough valuation of 9.7x experienced in the first week of February 2017, and 30.9% above the previous trough valuation of 8.3x experienced in December 2011. The charts below indicate the historical P/E and dividend yields of the market.
Weekly Highlights
Central Bank of Kenya (CBK) accepted a binding offer from KCB Group for the acquisition of Imperial Bank of Kenya (under Receivership). This brings the total deposits recovery to approximately Kshs 20.3 bn. The Kenya Deposit Insurance Corporation (KDIC) was appointed by CBK to assume control of the Imperial Bank in October 2015, following unsound business conditions. At the date of receivership, Imperial Bank held Kshs 58.0 bn in customer deposits with 52,398 deposit accounts, and operations in Kenya and Uganda. The additional 12.7% of eligible depositor balances acquired by KCB brings the total recovered sum to approximately 35.0% of original eligible deposits held. This transaction will be key to recovery of Imperial Bank depositors’ wealth and going forward, we expect voluntary consolidation in the sector, as smaller banks with depleted capital positions and not serving a particular niche are acquired as their performance deteriorates due to the sustained effects of the Banking (Amendment) Act 2015. We note that the industry needs fewer but stronger players to ensure the sector remains stable.
The World Bank announced funding for the creation of an electronic registry that will allow the use of household goods, live animals and office equipment as collateral for commercial loans in a move aimed at boosting access to credit by personal and household credit consumers. The World Bank, through its private investment arm, International Finance Corporation (IFC), has disclosed its efforts with the government and bankers on the development of a collateral registry, which is expected be deployed by June 2020. Kenya passed the Movable Property Security Rights Act in 2017 to help bank customers without common and costly forms of collateral to access credit. The objective of the project is to increase the reach of credit to individual consumers as well as Micro, Small and Medium enterprises (MSMEs), and the IFC intends to use Kshs 24.6 mn to raise awareness among customers, banks and other stakeholders for early adoption of the electronic registry. In the past, movable assets such as household goods and office equipment have been ignored by lenders as loan collaterals owing to lack of a central registry where they could log in their claim on the asset. This meant that ownership of a collateral could easily be transferred without the bank’s knowledge, leaving it exposed in case of a default. Goods listed in the electronic registry, however, will have a unique identification number that will allow tracking of those that have been used to secure bank loans or collateral. With the implementation of a central registry, MSME’s that have become increasingly deprived of credit owing to lack of assets categorised as collateral, will likely be able gain access, as banks will be better placed to track the asset ownerships, thereby aiding in credit risk management, consequently lessening the stringent lending policies adopted by banks towards the secured lending segment with these assets listed in the registry and qualifying as collateral. In our view however, we remain conservative on the short-term effect this will have on loan growth to the private sector. Public education will be necessary in order for the key players (individual consumers, Micro, Small and Medium enterprises) to fully understand the service.
Changes in Corporate Governance
- Carbacid Investments announced the retirement of Hon. J M Wanjigi from the company’s Board of Directors. As his replacement, the company appointed Eng. Edward Achieng Musebe as an Independent Non-Executive Director. There was, however, no change in corporate governance ranking as all metric score remained constant.
- BOC Kenya announced the resignation of Mr. Andy Gouws as a Non-Executive Director of the company. The Board also announced the appointment of Mr. Reuben Chetty as a Non-Executive Director. There was, however, no change in corporate governance ranking as all metric score remained constant.
Universe of Coverage
Below is a summary of our SSA universe of coverage:
|
Banks |
Price as at 7/12/2018 |
Price as at 14/12/2018 |
w/w change |
YTD Change |
Target Price |
Dividend Yield |
Upside/Downside |
P/TBv Multiple |
|||
|
Equity Group |
39.4 |
39.0 |
(1.1%) |
(2.0%) |
65.8 |
5.1% |
72.1% |
1.9x |
|||
|
Ghana Commercial Bank |
4.8 |
4.8 |
(0.4%) |
(5.3%) |
7.7 |
7.9% |
68.8% |
1.1x |
|||
|
KCB Group |
40.0 |
39.4 |
(1.4%) |
(7.8%) |
64.0 |
7.6% |
67.8% |
1.3x |
|||
|
I&M Holdings |
85.0 |
86.0 |
1.2% |
(32.3%) |
138.6 |
4.1% |
67.1% |
0.9x |
|||
|
Diamond Trust Bank |
148.0 |
148.3 |
0.2% |
(22.8%) |
231.0 |
1.8% |
57.8% |
0.9x |
|||
|
HF Group |
4.6 |
5.5 |
19.0% |
(47.1%) |
6.9 |
6.4% |
55.7% |
0.2x |
|||
|
UBA Bank |
7.5 |
7.6 |
0.7% |
(26.7%) |
10.7 |
11.3% |
53.9% |
0.5x |
|||
|
Zenith Bank |
23.6 |
23.0 |
(2.3%) |
(10.3%) |
33.3 |
11.7% |
53.2% |
1.0x |
|||
|
Union Bank Plc |
5.4 |
6.1 |
14.0% |
(21.8%) |
8.2 |
0.0% |
52.3% |
0.6x |
|||
|
Ecobank |
7.5 |
7.5 |
0.0% |
(1.3%) |
10.7 |
0.0% |
43.1% |
1.6x |
|||
|
CAL Bank |
1.0 |
0.9 |
(4.1%) |
(13.0%) |
1.4 |
0.0% |
42.9% |
0.8x |
|||
|
Co-operative Bank |
14.5 |
14.1 |
(2.4%) |
(11.9%) |
19.4 |
5.7% |
39.9% |
1.2x |
|||
|
NIC Bank |
30.0 |
26.6 |
(11.3%) |
(21.2%) |
40.7 |
3.8% |
39.4% |
0.7x |
|||
|
Barclays |
10.8 |
10.8 |
0.5% |
12.5% |
13.9 |
9.3% |
38.6% |
1.5x |
|||
|
CRDB |
150.0 |
150.0 |
0.0% |
(6.3%) |
207.7 |
0.0% |
38.5% |
0.5x |
|||
|
Access Bank |
7.5 |
7.5 |
0.0% |
(28.7%) |
9.5 |
5.4% |
32.9% |
0.5x |
|||
|
Stanbic Bank Uganda |
30.5 |
30.4 |
(0.4%) |
11.5% |
36.3 |
3.9% |
22.8% |
2.2x |
|||
|
Standard Chartered |
194.0 |
194.8 |
0.4% |
(6.4%) |
219.9 |
6.4% |
19.8% |
1.6x |
|||
|
Stanbic Holdings |
91.5 |
92.0 |
0.5% |
13.6% |
102.7 |
2.4% |
14.7% |
0.9x |
|||
|
SBM Holdings |
6.0 |
6.0 |
0.0% |
(20.0%) |
6.6 |
5.0% |
14.3% |
0.9x |
|||
|
Guaranty Trust Bank |
34.9 |
35.0 |
0.3% |
(14.1%) |
37.1 |
6.9% |
13.2% |
2.2x |
|||
|
Bank of Kigali |
290.0 |
279.0 |
(3.8%) |
(7.0%) |
299.9 |
5.0% |
8.4% |
1.5x |
|||
|
Bank of Baroda |
128.5 |
138.0 |
7.4% |
22.1% |
130.6 |
1.8% |
3.5% |
1.2x |
|||
|
Standard Chartered |
20.3 |
20.3 |
0.2% |
(19.6%) |
19.5 |
0.0% |
(3.9%) |
2.5x |
|||
|
FBN Holdings |
7.6 |
7.5 |
(2.0%) |
(15.3%) |
6.6 |
3.4% |
(9.4%) |
0.4x |
|||
|
National Bank |
5.7 |
6.0 |
4.9% |
(35.8%) |
5.0 |
0.0% |
(12.6%) |
0.4x |
|||
|
Stanbic IBTC Holdings |
46.5 |
45.6 |
(2.0%) |
9.8% |
37.0 |
1.3% |
(19.1%) |
2.3x |
|||
|
Ecobank Transnational |
15.5 |
15.0 |
(3.2%) |
(11.8%) |
9.3 |
0.0% |
(40.1%) |
0.5x |
|||
|
*Target Price as per Cytonn Analyst estimates **Upside / (Downside) is adjusted for Dividend Yield ***Banks in which Cytonn and/or its affiliates holds a stake. ****Stock prices indicated in respective country currencies *****The Target price for Kenyan Listed Banks have been revised following our Q3’2018 Banking Report |
|||||||||||
We are “NEUTRAL” on equities for investors with a short investment horizon. However, pockets of value exist, with a number of undervalued sectors like Financial Services, which provide an attractive entry point for medium to long-term investors, and with expectations of higher corporate earnings supported by sectors such as banking sector, we are “POSITIVE” for investors with a long-term investment horizon.
Ascent Capital, a private equity firm based in Kenya, is seeking to raise USD 120.0 mn (Kshs 12.3 bn) in its second fund, targeted to close in Q3’2019. The funds raised are expected to be invested in mid-size companies in the East African region, particularly Rwanda and Tanzania.
Investors expected to invest in the fund include the European Investment Bank, with the EIB looking to inject USD 25.0 mn (Kshs 2.6 bn) into the fund. The fund is also looking to raise capital from Development Finance Institutions (DFI’s) and pension funds, who were among the biggest contributors in their first fund, which closed in 2015. Ascent raised USD 80.0 mn (Kshs 8.2 bn) in its first fund with contributions coming from development finance institutions such as CDC Group Plc, the Netherlands Development Finance Company (FMO), The Norwegian Investment Fund for Developing Countries (Norfund) and the Development Bank of Austria (OeEB), who contributed USD 15.0 mn (Kshs 1.5 bn), USD 8.0 mn (Kshs 0.8 bn), USD 33.0 mn (Kshs 3.4 bn) and USD 5.0 mn (Kshs 0.5 bn), respectively, and pension funds such as the Nation Media Group Pension Fund and the Kenya Power Pension Fund contributing a combined USD 5.0 mn (Kshs 0.5 bn).
Ascent aims to leverage its track record in private equity to get investor buy-in into the second fund, having already invested USD 42.0 mn (Kshs 4.3 bn) of its first fund in various companies in East Africa across financial services, retail, health-care and manufacturing sectors, including Medpharm Holdings Africa Ltd (Kshs 250.0 mn), Auto Springs East Africa Plc, and Kisumu Concrete Products (Kshs 1.4 bn), with majority of the investments falling between the range of USD 2.0 mn (Kshs 205.0 mn) and USD 7.0 mn (Kshs 717.6 mn). Ascent is looking to invest the rest of the funds by the end of Q2’2019, while at the same time exiting from one of the investments in the course of the year. In comparison, the second fund is looking to apply the following criteria in injecting capital;
- Brown-field companies with huge growth potential seeking an average investment of USD 15.0 mn (Kshs 1.5 bn), and,
- Companies in sectors such as education and financial services, with investments in the former looking to be channeled majorly towards private schools that target the middle class. This is considering that these sectors have seen exponential growth over the past few years, thus enabling them support the high returns they seek.
This announcement comes less than a month after (i) Catalyst Principal Partners announcing the close of its second fund, having raised USD 155.0 mn (Kshs 15.9 bn), both locally from pension funds and globally from institutional investors. For more information, see our Cytonn Weekly #43/2018, and (ii) Centum Investment Group announcing its plans to raise between Kshs 40.0 bn and Kshs 50.0 bn in a fresh private equity fund to be largely deployed in mature cash generative businesses and marketable securities such as government securities and equities. For more information, see our Cytonn Monthly – November 2018.
These continued capital-raising initiatives signify the increasing investor interest in the region, with investors looking to tap into the opportunities in the fast-growing private equity industry, considering that the value of private-equity deals in East Africa surged to USD 482.1 mn (Kshs 49.4 bn) in the eight months through August, compared with just USD 19.0 mn (Kshs 1.9 bn) a year earlier, according to I&M Burbidge Capital Ltd.
Despite the recent slowdown in growth, we maintain a positive outlook on private equity investments in Africa as evidenced by the increasing investor interest, which is attributed to; (i) Economic growth, which is projected to improve in Africa’s most developed PE markets, (ii) the attractive valuations in Sub Saharan Africa’s private markets compared to its public markets, and, (iii) the attractive valuations in Sub Saharan Africa’s markets compared to global markets. Going forward, the increasing investor interest, stable macro-economic and political environment will continue to boost deal flow into African markets.
- Retail Sector
During the week, the retail sector witnessed the opening of the Waterfront Mall in Karen to the public. The Kshs 3.0 bn mall located in Karen brings to the market 200,000 SQFT of lettable retail space and 1,000 parking bays, and will have South African retailer Game Stores as the anchor tenant. This is the fourth mall to be opened up in the area, in addition to; The Hub, Karen Crossroads, and Galleria, whose sizes are 322,917 SQFT, 85,035 SQFT and 158,229 SQFT and were opened in 2016, 2005 and 2011, respectively. The continued investment in malls in the area is attributed to the above market average performance of Karen’s retail sector, which according to Cytonn’s Kenya Retail Sector Report 2018, recorded an average rental yield of 10.8%, 1.4% points higher than the market average of 9.4%, with an average occupancy rate of 96.0% compared to the market average at 83.7%. We attribute the performance to the prime location of Karen as a retail centre, with an affluent population with relatively high purchasing power, and less competition in the market compared to low end areas, where malls compete with second tier supermarkets and stalls, thus developers are able to charge premium rents of Kshs 212.8 per SQFT on average, compared to the market average rent of Kshs 178.9 per SQFT.
Looking at it from a Nairobi market perspective, however, we note that increased supply is likely to constrain the performance of the retail sector, where there is already an oversupply of 2.0 mn SQFT of retail space. According to Cytonn Research, the Nairobi retail sector in general recorded reduced performance in 2018, with average rental yields declining by 0.2% points y/y to 9.4% from 9.6% in 2017, and occupancy rates increasing by 3.4% points to 83.7%, from 80.3% in 2017. We expect the supply to negatively affect the performance of the sector. Thus, developers looking to invest in the sector should look into other markets such as Mombasa and Mt. Kenya Regions that have an existing retail space demand of 0.3 mn and 0.2 mn SQFT, and attractive yields at 8.3% and 9.9% and occupancy rates at 96.3% and 84.5%, respectively, boosted by the shifting to County Headquarters, according to Cytonn Research.
Below is a summary of the retail performance in Nairobi Metropolitan Area:
|
Nairobi Metropolitan Area Retail Sector Performance 2018 |
|||
|
Node |
Average Rent/SQFT /Month 2018(Kshs) |
Average Occupancy Rate 2018 |
Rental Yield 2018 |
|
Westlands |
218.8 |
90.2% |
12.4% |
|
Kilimani |
184.1 |
97.5% |
11.8% |
|
Karen |
212.8 |
96.0% |
10.8% |
|
Ngong Road |
170.5 |
94.4% |
10.1% |
|
Thika road |
194.3 |
76.5% |
8.8% |
|
Kiambu Road |
199.9 |
67.0% |
8.7% |
|
Mombasa road |
156.2 |
74.4% |
7.8% |
|
Eastlands |
149.1 |
68.2% |
7.0% |
|
Satellite Towns |
124.5 |
89.3% |
6.6% |
|
Grand Total |
178.9 |
83.7% |
9.4% |
|
· The retail real estate sector in Nairobi has relatively high yields of on average 9.4% compared to other real estate themes such as the residential sector with average rental yields of 5.6% and commercial office sector with average rental yields of 9.2% · The best performing nodes were Westlands and Kilimani with average rental yields of 12.4% and 11.8%, respectively attributed to the fact that they are high end neighbourhoods hosting most of Nairobi’s middle end and high-end population · Karen recorded a relatively high average occupancy rate at 96.0%, compared to the market average of 83.7% |
|||
|
Cytonn Research 2018 |
|||
In addition to the above, other activities recorded in the sector during the week include:
- South African retail chain Shoprite opened its first Kenyan store at Westgate Mall, Nairobi, taking up 50,000 SQFT previously occupied by Nakumatt, who exited the mall following financial troubles. This is part of the retailer’s ambitious plans to open 7 other stores in malls across Kenya, including; the Garden City Mall along Thika Road, the Beacon Mall along Bunyala Roundabout, and the City Mall in Mombasa. We continue to see international retailers coming into Kenya and expanding rapidly demonstrating the attractiveness of the sector. Some of the other retailers who have entered the market in the last 3-years include French retailer, Carrefour, Botswana-based retailer, Choppies and South African retailer, Game.
- KFC, an international food chain, opened its latest outlet in Village Market, Nairobi, bringing its total number of outlets in Kenya to 21, with the most recent outlet being in Lavington, Nairobi. The food chain is among other international retailers seeking to increase their foothold in Kenya, some of which include Burger King, Subway, and Dominos, among others. See Kenya Real Estate Sector Retail Report 2018 for more information.
- Hospitality Sector
During the week, Kenya was crowned as the best travel destination in the world, while Kenya Airways was named the third best airline in Africa, by Global Traveler (GT), a magazine which provides readers with information about premium cabins, airlines and hotels around the world, and also awards various hospitality companies for outstanding performances on annual basis, in an event held at the Peninsula Beverly Hills, California. According to the GT readers’ survey, the unique features that put Kenya on the global map include; the wildlife, safaris and leisure beaches. The best 10 destinations after Kenya were Mexico, Ireland, South Africa, India, Australia, Israel, Hong Kong, Brazil and Spain. For the top ten airlines in Africa, Kenya Airways was ranked third, after South African Airways and Ethiopian Airways, which came in first and second, respectively. We expect that such positive reviews will have a positive impact on the tourism and hospitality sector, as they build international travelers’ confidence in the country. We are, therefore, likely to see increased international arrivals, thus increased demand for hospitality services. According to Kenya National Bureau of Statistics (KNBS), the number of international arrivals to Kenya grew by 8.0%, from 1.3 mn in 2016 to 1.4 mn in 2017, and have grown by 8.3% between January and August 2018, to 685.7 mn compared to 632.9 mn during the same period in 2017. In our view, this was primarily fueled by, among other factors, positive reviews and accolades from travel advisories such as i) Trip Advisor who ranked Nairobi as the 3rd best place to visit in 2018, ii) the ranking of Jomo Kenyatta International Airport (JKIA) as the best airport in Africa and 38th globally according to Worldwide rankings by Airhelp, and iii) issuance of global awards to local hotels for best facilities and service excellence such as DusitD2, a 5-star hotel in Riverside, Nairobi, being ranked the best luxury business hotel in East Africa in 2018, which boosted confidence and continues to attract more visitors into the country, both for business and leisure. Other factors driving the performance of the hospitality sector include; the growing number of travel tourism with holiday travelers accounting for 70.5% of international arrivals over the last 5-years, recognition of Kenya as a regional hub, increased air connectivity and Meetings, Incentives, Conferences and Exhibitions (MICE) Tourism evidenced by the 2.4% increase in local conferences with 3,844 conferences in 2017, from 3,755 recorded in 2016, according to the KNBS Economic Survey 2018. We thus expect the above ranking will result in improved performance of the hospitality sector, for instance the Nairobi Metropolitan Area serviced apartments, which recorded a 7.4% average rental yield and an occupancy rate of 80.0% in 2018, according to Cytonn Research.
- Infrastructural Sector
Kitengela residents are set to benefit from a commuter train, from Kitengela Town to Nairobi starting next year. According to the Principal Secretary, State Department for Housing and Urban Development, Mr. Charles Hinga, a modern railway station was approved by the Cabinet, with the aim of easing the commuters’ movement and boosting trade in the populous town located in Kajiado County, approximately 30 kilometers south of Nairobi. In addition, a road that will be used to move passengers to the new train station on the old Athi River – Kajiado railway line for onward commute to Nairobi will be constructed. The link road will be financed under the Nairobi Metropolitan Services Improvement Plan (NaMSIP), in conjunction with the County Government of Kajiado and the World Bank. The commuter train will use the old meter gauge railway line, to move passengers to the Syokimau Railway Station near the Jomo Kenyatta International Airport onward to the Central Nairobi Railway Terminus, and is expected to enhance accessibility to the town and thus spur increased economic activities in Kitengela. In general, the use of rail transport is still low in Kenya accounting for only 0.5% of the value of output from the transport sector in 2017, compared to roads at 62.9%. The total Nairobi Metropolitan Area railway network coverage is 206 km, and consists of 75 km and 15 railway stations within the Nairobi County, and 131 km and 5 railway stations within Kiambu County. However, the government has intensified efforts to enhance infrastructural development throughout the country, with the railway network being one of the focus sectors. This is evidenced by the significant National Budget allocation to infrastructure, which recorded a 6-year CAGR of 7.7% from 2012 to 2019. For the year 2018/2019, the budget allocation to the same came in at Kshs 418.8 bn, which is 13.6% of the national budget.
Other railway projects in the Nairobi Metropolitan Area include;
|
List of Ongoing and Complete Railway Projects |
||||
|
Railway Projects |
Timeline |
Status |
Length |
Value(Kshs) |
|
Kahawa Railway Station |
20 18 |
Completed |
353 mn |
|
|
Mombasa-Nairobi |
2017 |
Completed |
472 KM |
327 bn |
|
Nairobi Commuter Rail Network |
2018 |
Ongoing |
149 KM |
24 bn |
|
Nairobi – Naivasha SGR Section 2A |
2019 |
Ongoing |
120 KM |
172 bn |
Source: Cytonn Research
Infrastructural improvements such as rail networks enhance an area’s connectivity thus, unlocking the economic potential of a region by opening it up for trade and investment, as it allows for easy transport of labor, goods and services to where they are required. According to Cytonn Research, satellite towns such as Kitengela recorded a 5.3% capital appreciation in Q3’2018, with the land price per acre coming in at Kshs 21.1 mn in Q3’2018 compared to Kshs 20.0 mn recorded in Q2’2018, attributed to the growing demand for development land in the area. We thus expect that the construction of the railway station, and operationalization of the commuter train, will facilitate the opening up of Kitengela town and its environs, thus resulting in increased economic activities and further capital appreciation of real estate property.
We expect increased activities in the real estate sector, fueled by entry of international retailers and expansion of the already existing brands, improved infrastructure and positive reviews of the hospitality services in the country, which continue to enhance confidence in Kenya as a travel destination.
Following the release of Q3’2018 results by Kenyan listed banks, the Cytonn Financial Services Research Team undertook an analysis on the Kenyan Banking Sector to point out any material changes from our H1’2018 Banking Report. In our Q3’2018 Banking Report, we analyze the results of the listed banks in order to determine which banks are the most attractive and stable for investment from a franchise value, and from a future growth opportunity (intrinsic value) perspective.
The report is themed “Deteriorating Asset Quality Dampens on Growth”, as we assess the key factors that influenced the improved performance of the banking sector during the period under review, factors that are dampening growth, and also areas that will be crucial for growth of banks going forward. As a result, we seek to answer the questions, (i) “what influenced the banking sector’s performance?”, and (ii) “what should be the focus areas for the banking sector going forward?” as the sector navigates the relatively tougher operating environment, albeit better compared to a similar period in the previous year. As such, we shall address the following:
- The Key Themes That Shaped the Banking Sector Performance in Q3’2018;
- Summary Performance of the Banking Sector in Q3’2018;
- Focus Areas of the Banking Sector Players Going Forward; and,
- Outcome of our Analysis.
Section I: The Key Themes That Shaped the Banking Sector Performance in Q3’2018:
Below, we highlight the key themes that shaped the banking sector in Q3’2018:
- Consolidation – The banking sector has continued to witness continued consolidation activity, as players in the sector are either acquired or merge together, forming relatively larger and possibly more stable entities, as discussed below:
- In August 2018, State Bank of Mauritius (SBM) Bank Kenya completed the acquisition of certain assets and liabilities of Chase Bank Limited, which was under receivership. Following the agreement between the Central Bank of Kenya (CBK), Kenya Deposit Insurance Corporation (KDIC), and SBM Bank Kenya, 75.0% of the value of all moratorium deposits at Chase Bank will be transferred to SBM Bank Kenya. The remaining 25.0% will remain with Chase Bank. This is a major milestone as this is the first successful instance, in the history of Kenya, of a bank being successfully brought out of receivership. Chase Bank was put under receivership in 2016, with customer deposits in excess of Kshs 100.0 bn. The acquisition saw SBM, which initially had 20 branches, take control of the 60 Chase Bank branches, of which they closed 20 branches, significantly increasing the bank’s foothold in the country to 60. SBM Bank has injected Kshs 2.6 bn in Chase Bank, and is planning to inject a further Kshs 6.0 bn to aid in the revival of the bank. In our view, the deal marks an important milestone in handling of banks under receivership, and consequently, with the acquisition taking place, it points to the continued attractiveness of the Kenyan banking sector, as banks both local and foreign drive their growth inorganically.
- On 11th December 2018, CBK announced the acceptance of a binding offer from KCB Group, for the acquisition of Imperial Bank Kenya Limited (Under Receivership). KCB Group offered its second bid to acquire a stake in Imperial Bank Limited (Under Receivership) (IBLR). IBLR was put under receivership in August 2015, with a loan book of Kshs 41.0 bn and deposits of Kshs 58.0 bn. KCB Group and Diamond Trust Bank (DTB) submitted offers in April, whose details were undisclosed, but were tasked with revising their offers, with DTB declining to participate further. Kenya Deposit Insurance Corporation (KDIC) highlighted that it had received the revised proposal from KCB Group. CBK and KDIC engaged KCB Group in discussions with the aim of maximizing the value for depositors. Consequently, KCB communicated to CBK and KDIC on 7th December, the modification of the terms of the Binding Offer with respect to the release of depositors’ funds and verification of loans. The Binding Offer accepted, includes granting access to 12.7% of eligible depositor balances remaining at IBLR within 14-days of the announcement made on 11th December 2018, subject to account and identity verifications. Combining this with earlier disbursements will result in a total recovery of approximately 35.0% percent of original eligible deposits held at the date of receivership. In addition, the Binding Offer outlines that KCB will complete the loan verification process by March 2019. The loan verification process is expected to result in further recoveries for eligible depositors of IBLR. CBK and KDIC assessed that KCB’s Binding Offer represented a viable proposal for the resolution of IBLR, for the benefit of depositors and the strengthening of the Kenyan financial sector. With the bank edging closer to be brought out of receivership, this would mark the second instance of a bank being brought out of receivership, after that of Chase Bank Limited. This would aid depositors of the bank gain access to their deposits locked in the bank since 2015. This in our view continues to instill confidence in the banking sector’s stability, as well as indicating the safeguarding of depositors’ interest by both the CBK and KDIC. We also note that the enforcement of strict regulations, operating procedures and corporate governance principles is key to avoid similar occurrences in the future.
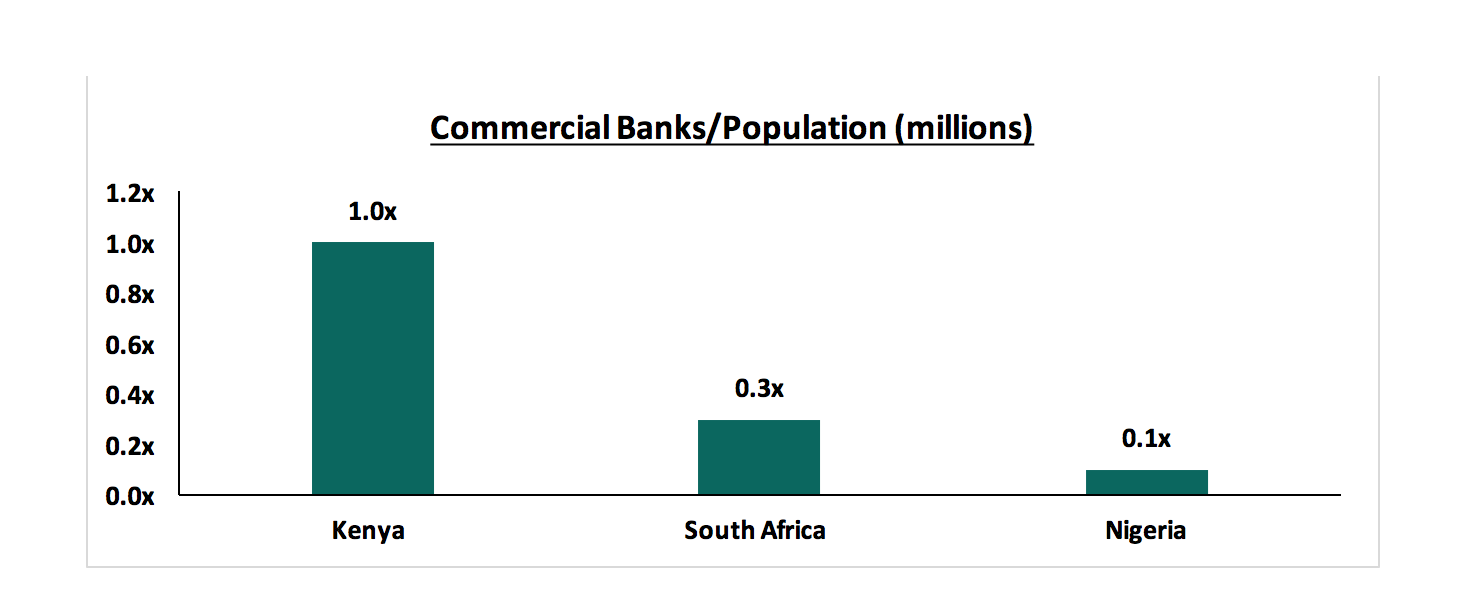
- Commercial Bank of Africa (CBA) and NIC Group issued a joint statement on a possible merger, subject to approval from the relevant regulatory bodies such as Capital Markets Authority (CMA) and the CBK, and other stakeholders. CBA is a Tier I Bank with total assets of Kshs 242.6 bn and deposits of Kshs 191.3 bn, and NIC Group is a Tier II bank with total assets of Kshs 201.8 bn and deposits of Kshs 145.0 bn. As analyzed in our Nairobi Metropolitan Area Serviced Apartments Report - 2018, & Cytonn Weekly #47/2018, a merger of the two banks will result in the second largest commercial bank in Kenya by customer deposits, with a market share of 10.9%, after KCB Group, which controls 14.7%. The potential merger will likely enhance the growth of the new entity in various aspects of banking and wealth management by consolidating CBA’s strength in retail banking given that it has approximately 21.5 mn accounts, and NIC’s corporate banking expertise, with the banking having approximately 116,000 accounts. Furthermore, if CBA is merged into NIC, the new entity will have access to capital from the capital markets. This, in our view, will create a financial entity that combines CBA’s high Non-Funded Income (NFI) generation and NIC’s interest income generation. With a larger balance sheet and high liquidity, the entity will be better positioned to take advantage of the numerous growth opportunities such as undertaking large transactions, and possibly undertaking other acquisitions. Consolidation activity in the banking sector has been gathering pace, with one deal having taken place during the year, and two more in the pipeline. We continue to expect more consolidation in the banking sector, as the relatively weaker banks that probably do not serve a niche become acquired by the larger counterparts who have expertise in deposit gathering, or serve a niche in the market. Consolidation will also likely happen, as entities form strategic partnerships, as they navigate the relatively tougher operating environment that is exacerbated by the stiff competition among the various players in the banking sector. Kenya remains overbanked when compared to other countries as shown in the chart below, and needs to have fewer but strong players, to ensure the sector’s overall stability in the long run.
A summary of the deals that have happened for the last 5 years is summarized in the table below:
|
Acquirer |
Bank Acquired |
Book Value at Acquisition (Kshs bns) |
Transaction Stake |
Transaction Value (Kshs bns) |
P/Bv Multiple |
Date |
|
SBM Bank Kenya |
Chase Bank ltd |
Unknown |
75.0% |
Undisclosed |
N/A |
Aug-18 |
|
DTBK |
Habib Bank Limited Kenya |
2.38 |
100.0% |
1.82 |
0.8x |
Mar-17 |
|
SBM Holdings |
Fidelity Commercial Bank |
1.75 |
100.0% |
2.75 |
1.6x |
Nov-16 |
|
M Bank |
Oriental Commercial Bank |
1.80 |
51.0% |
1.30 |
1.4x |
Jun-16 |
|
I&M Holdings |
Giro Commercial Bank |
2.95 |
100.0% |
5.00 |
1.7x |
Jun-16 |
|
Mwalimu SACCO |
Equatorial Commercial Bank |
1.15 |
75.0% |
2.60 |
2.3x |
Mar-15 |
|
Centum |
K-Rep Bank |
2.08 |
66.0% |
2.50 |
1.8x |
Jul-14 |
|
GT Bank |
Fina Bank Group |
3.86 |
70.0% |
8.60 |
3.2x |
Nov-13 |
|
Average |
|
|
80.3% |
|
1.8x |
|
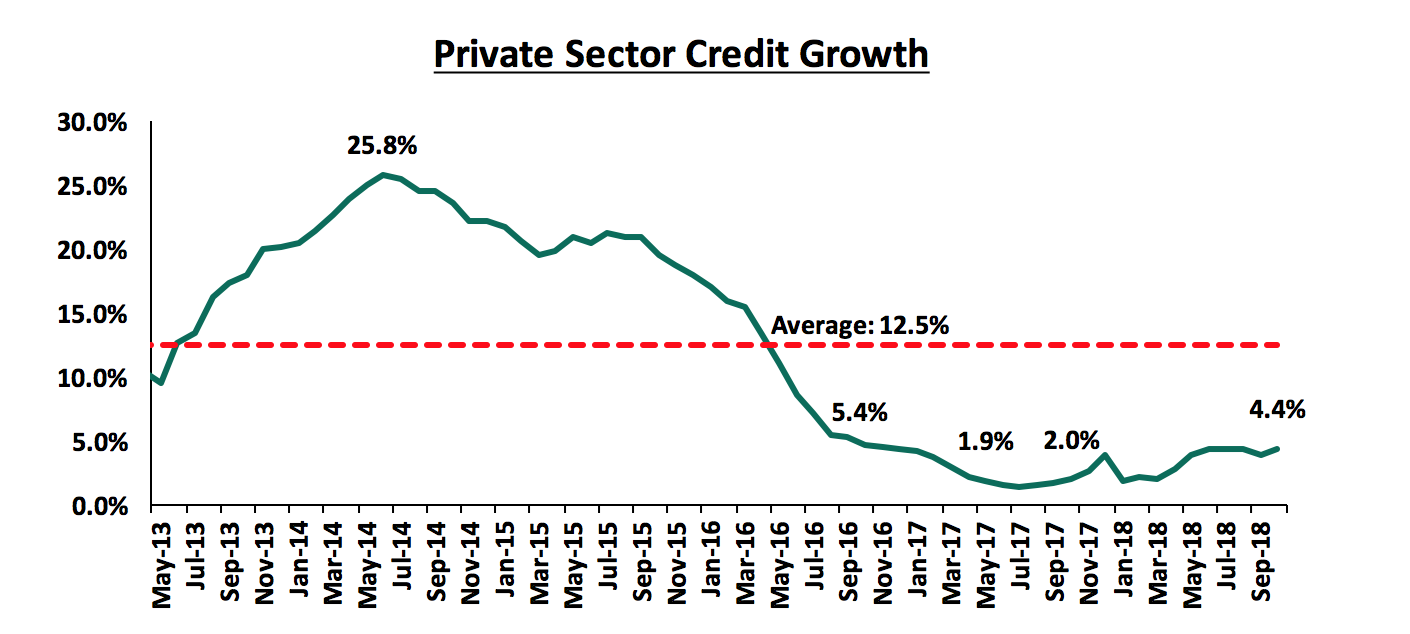
- Asset Quality – The banking sector continued to witness a deterioration in its asset quality over the quarter, with the Gross Non-Performing Loans (NPLs) ratio rising to a weighted average of 9.9%, from 7.8% in Q3’2017, much higher than the 5-year average of 8.4%, owing to the challenging operating environment witnessed in 2017. The effects of the harsh operating environment spilled over to 2018, with the economic recovery from the previous year being slower than anticipated in sectors such as trade and real estate, which resulted in an increase in the number of bad loans. The major sectors touted as leading in asset quality deterioration include tourism, manufacturing, retail, agriculture and real estate, all of which were affected by the tough operating environment experienced last year that was occasioned by a volatile political environment due to the prolonged electioneering period, and a severe prolonged drought that affected the agriculture sector, which remains the largest GDP contributor. Another major reason touted is that of delayed payments by the government, affecting various sectors, with small to mid-sized entities affected the most. Owing to the deteriorating asset quality, banks have adopted stringent lending policies in a bid to curb the relatively high number of NPLs. The stringent lending policies have further contributed to the tightening of credit standards in the economy, with the listed banking sector’s net loan growth coming in at 3.8%, slower than the 6.1% growth experienced in Q3’2017. With reduced deposit intermediation and consequently credit extension largely to the Micro Small and Medium Enterprises (MSME), as shown in the graph below, who make up approximately 80.0% of the private sector, the country’s economic growth will likely be affected in the long run.
- Revenue Diversification – Non-Funded Income’s contribution to banks’ total operating income has continued to rise, as this portion of income contributed 34.5% of total operating income in Q3’2018, as compared to 34.0% in Q3’2017. With compressed margins on interest income due to the Banking (Amendment) Act 2015, the effects of the regulation have been mitigated by ventures into new segments to support and improve the bottom line. Main forays have been made largely into bancassurance and brokerage. Examples of ventures undertaken in 2018 include I&M Holdings completing a full buyout of Youjays Insurance Brokers for an undisclosed amount on 5th April 2018, and KCB Group partnering with Liberty Holdings for the education savings plan dubbed Elimisha in June 5th 2018.
Banks have also been promoting the usage of alternative channels of transactions such as mobile banking, internet banking, and agency banking as they seek to grow their NFI. Notable moves towards the alternative channels segment in 2018 include:
- Housing Finance launching their own mobile banking app dubbed HF Whizz. The app aims to change the way consumers open and access their bank accounts. Users of the app will be able to open an account, access loans, and deposit and transfer cash via their mobile phones,
- Barclays Bank launched its own digital platform, dubbed Timiza, which allows customers to send money to their respective accounts, pay for utilities such as water and electricity, procure micro insurance, and pay for online taxi hailing services. In addition to this, the app grants customers with the access to micro loans of between Kshs 100 and Kshs 150,000 from the platform at interest rates of 1.2% monthly, and a one-off facilitation fee of 5.0%, with the loan repayable after 30-days,
- Equity Group launched its FinTech subsidiary, Finserve, a technological service company, tasked to drive disruptive technology innovation in the financial services segment. Finserve will operate as an autonomous commercial enterprise, delivering technological solutions not just for Equity Group, but also to the entire economy. Finserve houses products like Equitel, Equity Eazzy app, EazzyBiz and EazzyNet. Through Finserve, Equity Group aims to provide an edge in terms of integration with all major global card associations including American Express, Mastercard, Visa, JCB, Dinners, and Union Pay, becoming the single largest aggregator of card payments in the region, in its quest to grow the payment services segment, and the alternative channels in its various regional subsidiaries.
We believe that revenue expansion by product diversification and cost containment is one of the core opportunities for the banking sector, in the quest to achieve sustainable growth in the long run.
- Regulation - Regulation remains a key aspect affecting the banking sector, with the regulatory environment evolving and becoming increasingly tighter. In September 2018, The National Assembly voted to retain the cap on loans in the Finance Act 2018, effectively retaining the 4.0% cap above the Central Bank Rate (CBR) on interest chargeable on loans. However, the 70.0% of the CBR floor on interest payable on deposits was removed, effectively enabling banks to pay lower interest on their deposits. With the removal of the same, banks have adjusted accordingly, with various players indicating a lowering of their interest expense requirements, and a possible improvement in the Net Interest Margin, whose benefits will be fully realized in 2019. Regulation in the sector has increasingly been centered on consumer protection, and promoting prudence in the financial services sector.
Section II: Summary Performance of the Banking Sector in Q3’2018:
The table below highlights the performance of the banking sector, showing the performance using several metrics, and they the key take-outs of the performance.
|
Bank |
Core EPS Growth |
Interest Income Growth |
Interest Expense Growth |
Net Interest Income Growth |
Net Interest Margin |
Non-Funded Income (NFI) Growth |
NFI to Total Operating Income |
Growth in Total Fees & Commissions |
Deposit Growth |
Growth In Govt Securities |
CIR |
Loan Growth |
LDR |
Return on Average Equity |
|
NBK |
303.2% |
(10.5%) |
(11.5%) |
(10.0%) |
6.6% |
(16.3%) |
26.8% |
(18.7%) |
(4.7%) |
3.2% |
91.8% |
(17.1%) |
51.7% |
3.2% |
|
Stanbic Bank |
46.7% |
13.3% |
19.7% |
9.7% |
4.9% |
19.6% |
47.0% |
9.3% |
20.3% |
16.7% |
57.9% |
16.3% |
77.8% |
14.3% |
|
SCBK |
33.9% |
4.8% |
2.1% |
5.9% |
8.5% |
9.7% |
32.6% |
31.2% |
(8.0%) |
(6.1%) |
57.2% |
(2.8%) |
50.6% |
18.6% |
|
KCB Group |
19.7% |
5.1% |
16.0% |
1.8% |
8.5% |
2.6% |
33.1% |
(7.9%) |
6.2% |
15.3% |
52.8% |
3.8% |
82.6% |
21.7% |
|
I&M Holdings |
18.3% |
3.3% |
16.8% |
(4.9%) |
6.7% |
38.4% |
35.1% |
30.1% |
27.6% |
8.0% |
51.7% |
8.6% |
78.1% |
17.2% |
|
DTBK |
10.0% |
3.0% |
3.0% |
2.9% |
6.1% |
6.3% |
21.7% |
7.4% |
6.5% |
17.7% |
56.9% |
0.7% |
70.0% |
13.3% |
|
Co-op Bank |
8.2% |
3.5% |
0.7% |
4.7% |
8.3% |
4.3% |
32.7% |
(29.7%) |
2.5% |
16.9% |
55.1% |
(2.0%) |
85.9% |
17.6% |
|
Equity Group |
8.1% |
8.6% |
13.5% |
7.2% |
8.5% |
(6.7%) |
40.0% |
(1.7%) |
9.1% |
24.1% |
54.6% |
8.6% |
71.7% |
22.2% |
|
Barclays Bank |
2.0% |
7.7% |
30.1% |
2.1% |
9.1% |
14.0% |
30.8% |
5.5% |
9.9% |
29.5% |
65.9% |
6.7% |
81.0% |
16.5% |
|
NIC Group |
(3.3%) |
5.5% |
22.2% |
(5.9%) |
5.8% |
7.2% |
30.9% |
5.7% |
10.3% |
16.2% |
60.6% |
(3.1%) |
79.3% |
12.1% |
|
HF Group |
N/A |
(14.1%) |
(11.7%) |
(17.8%) |
4.6% |
(7.2%) |
25.0% |
(30.9%) |
3.1% |
429.5% |
113.5% |
(11.3%) |
90.7% |
(3.3%) |
|
Weighted Average Q3'2018* |
16.2% |
6.1% |
12.5% |
3.8% |
8.0% |
5.9% |
34.5% |
0.6% |
7.4% |
17.8% |
56.3% |
4.2% |
75.3% |
18.8% |
|
Weighted Average Q3'2017* |
(9.3%) |
(5.8%) |
(0.5%) |
(7.3%) |
8.5% |
10.9% |
33.3% |
10.5% |
13.8% |
10.3% |
59.4% |
6.1% |
77.7% |
17.5% |
|
*Market cap weighted as at 30th November 2018/2017 respectively |
||||||||||||||
Key takeaways from the table above include:
Key take-outs from the table above include:
- Listed banks have recorded a 16.2% average increase in core Earnings per Share (EPS), compared to a decline of 9.3% in Q3’2017. NIC Group and HF Group were the only banks that recorded declines in core EPS, with NIC recording a decline of 3.3%, and HF recording a decline to a loss per share of Kshs 0.9 from a core earnings per share of Kshs 0.5 in Q3’2017. National Bank recorded the highest growth of 303.2% y/y, that was realized after adding back the exceptional items expense of Kshs 0.5 bn incurred in Q3’2018,
- The sector recorded weaker deposit growth, which came in at 7.4%, slower than the 13.8% growth recorded in Q3’2017. Despite the slower deposit growth, interest expenses increased by 12.5%, indicating banks have been mobilizing expensive deposits, as well as taking up borrowed funds from international financial institutions, thereby driving up the interest expense, ,
- Average loan growth was anemic coming in at 4.2%, which was lower than 6.1% recorded in Q3’2017, indicating that there was an even slower credit extension in the economy, due to sustained effects of the interest rate cap. Government securities on the other hand recorded a growth of 17.8% y/y, which was faster compared to the loans, and faster than 10.3% recorded in Q3’2017. This indicates that banks’ continued preference towards investing in government securities, which offer better risk-adjusted returns. Interest income increased by 6.1%, compared to a decline of 5.8% recorded in Q3’2017, as banks adapted to the interest rate cap regime, with increased allocations in government securities. The Net Interest Income (NII) thus grew by 3.8% compared to a decline of 7.3% in Q3’2017,
- The average Net Interest Margin in the banking sector currently stands at 8.0%, down from the 8.5% recorded in Q3’2017, despite the Net Interest Income increasing by 3.8% y/y. The decline was mainly due to the faster 17.8% increase in allocation to relatively lower yielding government securities,
- Non-funded Income grew by 5.9% y/y, slower than 10.9% recorded in Q3’2017. The growth in NFI was weighed down as total fee and commission growth was flat, growing by 0.6%, slower than the 10.5% growth recorded in Q3’2017. The growth in fee and commission income continued to be subdued by the slow loan growth, and,
- The sector continued to improve on its operational efficiency, with the Cost to Income Ratio (CIR) improving to an average of 56.3% from 59.4% in Q3’2017, buoyed by an improvement in operating income, which outpaced the operational expenses increments. Cost containment was also aided by reduced cost of risk demands, owing to lower provisioning levels. It is worth noting that some banks reduced their specific provisioning levels, even after experiencing a deterioration in asset quality. This is largely due to the fact that the first year of implementation of IFRS 9, banks are allowed to pass the effect of asset quality through the balance sheet, hence reducing the specific provisioning demands for the period, even after the implementation of IFRS 9.
Section III: Focus Areas of the Banking Sector Players Going Forward:
In summary, the banking sector had an improvement in performance, largely aided by the improving economic conditions and a more conducive operating environment compared to a similar period last year, which was marred by election jitters. However, the banking sector has been fraught by two main challenges: (i) the deteriorating asset quality brought about by the spillover effects of the challenging operating environment experienced in 2017 and the delayed payments by the Government, and (ii) the capping of interest rates, which has continued to subdue credit extension to the private sector. Instead, banks have been allocating even more of the deposits into government securities, as shown by the strong 17.8%y/y growth in government securities allocation. The increased allocation to relatively lower yielding assets has consequently reduced the Net Interest Margin (NIM) Private sector credit growth has remained subdued, coming in at 4.4% in October 2018, below the 5-year average of 12.4%, further indicating reduced intermediation, which has largely affected the MSMEs who comprise a majority of the private sector. We however note that the sector in general has adapted to operating in the tough environment, posting a 16.2% increase in core EPS. We believe the key factors banks need to consider going forward are asset quality management, continued revenue diversification, efficiency, and downside regulatory compliance risk management, amid tighter regulatory requirements by the CBK. To grow profitability amidst the tighter regulated environment, banks will:
- Continue diversifying their income sources by growing their fee-income businesses, bancassurance, asset management and advisory services,
- Be more prudent in loan disbursement, as well as enhancing their risk assessment framework to improve asset quality, so as to tame any rising financial impairments arising from implementation of IFRS 9, and,
- Improve efficiency by leveraging on mobile and internet banking, for cost reduction especially on staff numbers and revenue expansion from transaction income, with all these strategies aimed at improving their profitability margins.
Section IV: Outcome of our Analysis:
As per our analysis on the banking sector, from a franchise value and from a future growth opportunity perspective, we carried out a comprehensive ranking of the listed banks. For the franchise value ranking, we included the earnings and growth metrics as well as the operating metrics in the table below in order to carry out a comprehensive review of the banks.
|
Listed Banks Operating Metrics |
|||||||||||
|
Bank |
LDR |
CIR |
ROACE |
Deposit/Branch |
Gross NPL Ratio |
NPL Coverage |
Tangible Common Ratio |
Non-Interest Income/Revenue |
|||
|
Equity Group |
71.7% |
54.6% |
22.3% |
1.4 |
8.9% |
38.9% |
15.0% |
40.2% |
|||
|
KCB Group |
82.6% |
52.8% |
21.7% |
2.0 |
7.6% |
60.4% |
15.0% |
33.1% |
|||
|
SCBK |
50.6% |
57.2% |
18.6% |
6.3 |
15.6% |
74.2% |
15.6% |
32.6% |
|||
|
Stanbic Bank |
77.8% |
57.9% |
18.0% |
7.0 |
7.2% |
60.6% |
11.3% |
46.5% |
|||
|
Coop Bank |
85.9% |
55.1% |
17.6% |
1.9 |
11.2% |
36.8% |
17.3% |
32.7% |
|||
|
I&M Holdings |
78.1% |
51.7% |
17.2% |
5.1 |
12.7% |
49.2% |
14.9% |
35.1% |
|||
|
Barclays Bank |
81.0% |
67.6% |
16.5% |
2.5 |
7.7% |
70.5% |
13.0% |
30.8% |
|||
|
DTBK |
70.0% |
56.9% |
13.3% |
2.0 |
7.7% |
72.5% |
13.2% |
21.7% |
|||
|
NIC Group |
79.3% |
60.6% |
12.1% |
3.0 |
13.0% |
51.4% |
15.9% |
30.9% |
|||
|
HF Group |
90.7%* |
113.5% |
10.2% |
1.6 |
18.2% |
42.4% |
15.7% |
25.0% |
|||
|
NBK |
51.7% |
87.5% |
(3.3%) |
1.3 |
47.1% |
57.1% |
5.1% |
26.8% |
|||
|
Weighted Average Q3'2018** |
75.3% |
56.5% |
18.8% |
2.9 |
9.9% |
54.2% |
14.8% |
34.5% |
|||
|
*Loans to Loanable Funds Used, owing to Nature of the business ** Market Capitalization weighted as at 30th November 2018 |
|||||||||||
The overall ranking was based on a weighted average ranking of franchise value (accounting for 40%) and intrinsic value (accounting for 60%). The intrinsic valuation is computed through a combination of valuation techniques, with a weighting of 75.0% on Discounted Cash-flow Methods and 25.0% on Relative Valuation, while the franchise ranking is based on banks’ operating metrics, meant to assess the efficiency, asset quality, diversification, corporate governance and profitability, among other metrics. The overall Q3’2018 ranking is as shown in the table below:
|
Listed Banking Sector Composite Ranking |
|||||
|
Bank |
Franchise Value Total Score |
Intrinsic Value Score |
Weighted Score |
Q3'2018 Rank |
H1'2018 Rank |
|
KCB Group |
43 |
2 |
18.4 |
1 |
1 |
|
Equity Group |
69 |
1 |
28.2 |
2 |
2 |
|
I&M Holdings |
70 |
3 |
29.8 |
3 |
3 |
|
Coop Bank |
69 |
6 |
31.2 |
4 |
4 |
|
DTBK |
79 |
4 |
34.0 |
5 |
5 |
|
Stanbic Holdings |
71 |
10 |
34.4 |
6 |
9 |
|
NIC Group |
80 |
5 |
35.0 |
7 |
8 |
|
SCBK |
74 |
9 |
35.0 |
7 |
7 |
|
Barclays Bank |
81 |
7 |
36.6 |
9 |
6 |
|
HF Group |
102 |
8 |
45.6 |
10 |
11 |
|
NBK |
114 |
11 |
52.2 |
11 |
10 |
Major changes include:
- Stanbic Holdings rose 3 positions to position 6 from position 9 due to an improved franchise value score, with the bank having the lowest NPL ratio of 7.2%, lower than the industry average of 9.9%, the highest deposits per branch of Kshs 7.0 bn of above the industry average of Kshs 2.9 bn, and the highest NFI to total operating income ratio of 46.5%, above the 34.5% industry average,
- NIC Group climbed 1 spot to Position 7 from Position 8 in our H1’2018 Banking Sector Report, owing to improvement in capitalization, with the bank having the second best tangible common ratio at 15.9%, higher than industry average of 14.8%, the third best Price to Tangible Book (P/TBv) of 0.6x, and the third best Corporate Governance score, and,
- Barclays Bank dropped 3 spots to Position 9 from Position 6 in our H1’2018 Banking Sector Report, due to a low franchise value score caused by a high Price-Earnings Growth (PEG) Ratio at 1.4x, a low efficiency due to the high Cost to Income ratio (CIR) of 67.6%, above the 56.3% industry average, ranking 9th, a high P/TBv at 1.4x, and low capitalization with a tangible common ratio of 13.0%, below the 14.8% industry average.
For a comprehensive analysis on the ranking and methodology behind it, see our Cytonn Q3’2018 Banking Sector Report
Disclaimer: The Cytonn Weekly is a market commentary published by Cytonn Asset Managers Limited, “CAML”, CAML is regulated by the Capital Markets Authority. However, the views expressed in this publication are those of the writers where particulars are not warranted. This publication, which is in compliance with Section 2 of the Capital Markets Authority Act Cap 485A, is meant for general information only and is not a warranty, representation, advice or solicitation of any nature. Readers are advised in all circumstances to seek the advice of a registered investment advisor.

- Talk to us
- Kenya
- P.O Box 20695 - 00200, Nairobi, Kenya
- Cell +254709101200
- Tel +254709101200
- WhatsApp +254741676635
- United States
- +254709101200
- DOWNLOAD OUR APP
-


- Kenya
- 8th Floor, Pinetree Plaza, Kaburu Drive, Ngong Road, Nairobi, Kenya
- USA
- Suite 1150, 1775 Eye Street NW, USA, Washington DC 20006, USA
- Investments
- High Yield
- Private Equity
- Real Estate
- Real Estate
- RiverRun Estates
- Cytonn Towers
- The Ridge
- Taraji Heights
- The Alma