Kenya’s Listed Banks Q1'2025 Report, & Cytonn Weekly #24.2025
By Cytonn Research, Jun 15, 2025
Executive Summary
Fixed Income
During the week, T-bills were oversubscribed for the sixth consecutive week, with the overall subscription rate coming in at 237.4%, lower than the subscription rate of 255.9% recorded the previous week. Investors’ preference for the shorter 91-day paper persisted, with the paper receiving bids worth Kshs 14.6 bn against the offered Kshs 4.0 bn, translating to a subscription rate of 364.9%, significantly higher than the oversubscription rate of 197.9%, recorded the previous week. The subscription rate for the 182-day paper decreased to 25.7% from the 104.9% recorded the previous week, while the subscription rate for the 364-day paper decreased to 397.9% from the 430.0% recorded the previous week. Notably, the government accepted only Kshs 17.2 bn worth of bids out of Kshs 57.0 bn bids received, translating to an acceptance rate of 30.2%. The yields on the government papers were on a downward trajectory with the yields on the 364-day paper decreasing the most by 24.9 bps to 9.75% from the 10.00% recorded the previous week while the yields on the 91-day and 182-day papers decreased by 10.3 bps and 4.9 bps to 8.18% and 8.49%, from the 8.28% and 8.54% recorded the previous week;
In the primary bond market, the government is looking to raise Kshs 50.0 bn for budgetary support through the reopened bonds; FXD1/2020/015 and SDB1/2011/030 with fixed coupon rates of 12.8% and 12.0% respectively and tenors to maturity of 9.7 years and 15.7 years respectively. The period of sale for the two bonds opened on Tuesday, 10th June 2025 and will close on 18th June 2025. Our bidding range for FXD1/2020/015 and SDB1/2011/030 is 12.25%-13.00% and 13.25%-14.25% respectively. Key to note, the Savings Development Bond, SDB1/2011/030, was last reopened in September 2014;
The monetary policy committee met on June 10th, 2025, to review the outcome of its previous policy decisions against a backdrop of elevated uncertainties to the global outlook for growth, lower but sticky inflation in advanced economies, heightened trade tensions as well as persistent geopolitical tensions. The MPC decided to lower the CBR rate by 25.0 bps to 9.75%, from 10.00% in April 2025;
During the week, The Energy and Petroleum Regulatory Authority (EPRA) released their monthly statement on the maximum retail fuel prices in Kenya, effective from 15th June 2025 to 14th July 2025. Notably, the maximum allowed price for Super Petrol increased by Kshs 2.7, while Diesel and Kerosene decreased by Kshs 2.0 and Kshs 2.1 respectively. Consequently, Super Petrol, Diesel and Kerosene will now retail at Kshs 177.3, Kshs 162.9 and Kshs 146.9 per litre respectively, from Kshs 174.6, Kshs 164.9 and Kshs 149.0 per litre respectively, representing an increase of 1.5% for Super Petrol, and decreases of 1.2% and 1.4% for Diesel and Kerosene respectively;
Equities
During the week, the equities market was on an upward trajectory, with NASI gaining the most by 9.0% while NSE 10, NSE 25 and NSE 20 gained by 6.0%, 5.2% and 3.1% respectively, taking the YTD performance to gains of 17.8%, 10.8%, 9.5% and 9.1% for NASI, NSE 20, NSE 10 and NSE 25. The equities market performance was driven by gains recorded by large-cap stocks such as Safaricom, Cooperative Bank and Stanbic Bank of 17.1%, 7.7% and 5.7%, respectively.
Additionally, in the regional equities market, the East African Exchanges 20 (EAE 20) share index lost by 4.0 bps, attributable to losses recorded by large cap stocks such as MTN Uganda, I&M Rwanda and Bralirwa Limited of 2.4%, 0.4% and 0.3% respectively. The performance was however supported by gains recorded by large cap stocks such as Safaricom, Tanga Cement Limited and Bank of Baroda Uganda of 19.5%, 12.9% and 8.3% respectively;
Real Estate
Kenya’s Affordable Housing Program, is facing significant financial setbacks due to uncollected rent from government-owned housing units. The state is losing millions in potential revenue, undermining the program’s sustainability and its ability to fund new residential projects, a concern linked to the real estate sector’s reliance on efficient resource management, as discussed in prior conversations about JVs and the housing levy.
During the week, Superior Homes Kenya (SHK) and HFC Kenya, a subsidiary of HF Group, signed an Memorandum of Understanding (MOU) to enhance homeownership accessibility in Kenya. This strategic partnership merges Superior Homes’ expertise in developing master-planned communities with HFC’s innovative financing solutions, offering homebuyers concessional mortgage rates of 9.5%, 20-year loan terms, and expedited loan approvals
During the week, it was noted that Kenya’s commercial banks significantly boosted funding for the building and construction sector by Kshs 19.3 bn equivalent to 11.7% in the first quarter of 2025, signaling a robust resurgence in real estate development. This double-digit growth reflects increased financing for new commercial and residential projects, as well as the resumption of stalled developments across the country.
During the week, the treasury highlighted that Kenya is set to initiate KShs 70.0 bn in Public-Private Partnership (PPP) deals starting July 1, 2025, to address its pressing infrastructure financing needs. These ambitious projects, modelled after large-scale, privately initiated proposals akin to those previously pursued, target critical sectors such as energy, transport, and water, which are foundational to the real estate industry.
On the Unquoted Securities Platform, Acorn D-REIT and I-REIT traded at Kshs 26.7 and Kshs 22.9 per unit, respectively, as per the last updated data on 23rd May 2025. The performance represented a 33.4% and 14.5% gain for the D-REIT and I-REIT, respectively, from the Kshs 20.0 inception price. Additionally, ILAM Fahari I-REIT traded at Kshs 11.0 per share as of 23rd May 2025, representing a 45.0% loss from the Kshs 20.0 inception price. The volume traded to date came in at 1.2 mn shares for the I-REIT, with a turnover of Kshs 1.5 mn since inception in November 2015.
Focus of the Week
Following the release of the Q1’2025 results by Kenyan listed banks, the Cytonn Financial Services Research Team undertook an analysis on the financial performance of the listed banks and identified the key factors that shaped the performance of the sector.
Investment Updates:
- Weekly Rates: Cytonn Money Market Fund closed the week at a yield of 13.5 % p.a. To invest, dial *809# or download the Cytonn App from Google Play store here or from the Appstore here;
- We continue to offer Wealth Management Training every Tuesday, from 7:00 pm to 8:00 pm. The training aims to grow financial literacy among the general public. To register for any of our Wealth Management Trainings, click here;
- If interested in our Private Wealth Management Training for your employees or investment group, please get in touch with us through wmt@cytonn.com;
- Cytonn Insurance Agency acts as an intermediary for those looking to secure their assets and loved ones’ future through insurance namely; Motor, Medical, Life, Property, WIBA, Credit and Fire and Burglary insurance covers. For assistance, get in touch with us through insuranceagency@cytonn.com;
- Cytonn Asset Managers Limited (CAML) continues to offer pension products to meet the needs of both individual clients who want to save for their retirement during their working years and Institutional clients that want to contribute on behalf of their employees to help them build their retirement pot. To more about our pension schemes, kindly get in touch with us through pensions@cytonn.com;
Hospitality Updates:
- We currently have promotions for Staycations. Visit cysuites.com/offers for details or email us at sales@cysuites.com;
Money Markets, T-Bills Primary Auction:
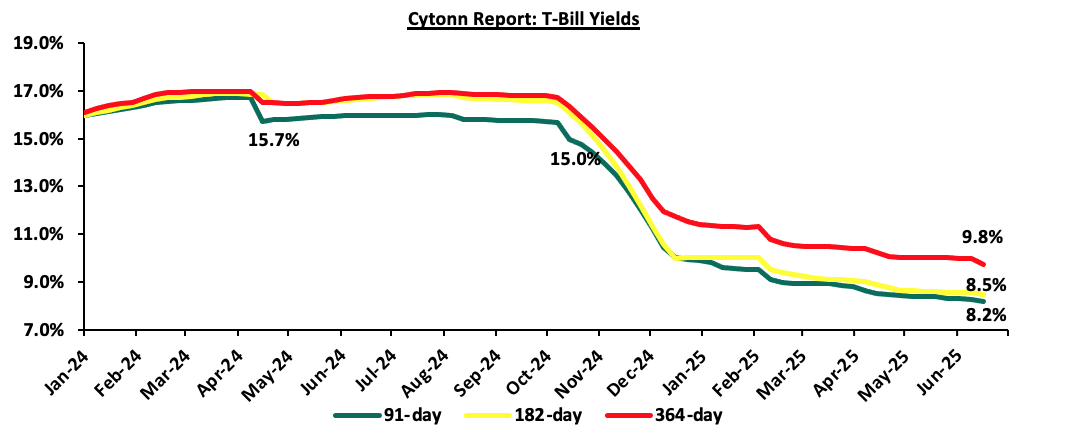
During the week, T-bills were oversubscribed for the sixth consecutive week, with the overall subscription rate coming in at 237.4%, lower than the subscription rate of 255.9% recorded the previous week. Investors’ preference for the shorter 91-day paper persisted, with the paper receiving bids worth Kshs 14.6 bn against the offered Kshs 4.0 bn, translating to a subscription rate of 364.9%, significantly higher than the oversubscription rate of 197.9%, recorded the previous week. The subscription rate for the 182-day paper decreased to 25.7% from the 104.9% recorded the previous week, while the subscription rate for the 364-day paper decreased to 397.9% from the 430.0% recorded the previous week. Notably, the government accepted only Kshs 17.2 bn worth of bids out of Kshs 57.0 bn bids received, translating to an acceptance rate of 30.2%. The yields on the government papers were on a downward trajectory with the yields on the 364-day paper decreasing the most by 24.9 bps to 9.75% from the 10.00% recorded the previous week while the yields on the 91-day and 182-day papers decreased by 10.3 bps and 4.9 bps to 8.18% and 8.49%, from the 8.28% and 8.54% recorded the previous week.
The chart below shows the yield performance of the 91-day, 182-day and 364-day papers over the period;
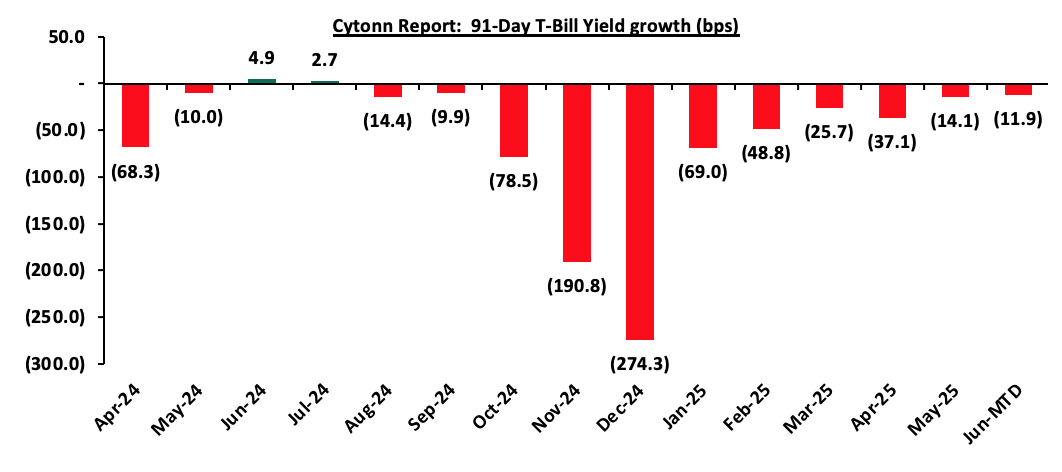
The chart below shows the yield growth for the 91-day T-bill:
The chart below compares the overall average T-bill subscription rates obtained in 2022,2023, 2024 and 2025 Year-to-date (YTD):

In the primary bond market, the government is looking to raise Kshs 50.0 bn in budgetary support through the reopened bonds; FXD1/2020/015 and SDB1/2011/030 with fixed coupon rates of 12.8% and 12.0% respectively and tenors to maturity of 9.7 years and 15.7 years respectively. The period of sale for the two bonds opened on Tuesday, 10th June 2025 and will close on 18th June 2025. Our bidding range for FXD1/2020/015 and SDB1/2011/030 is 12.25%-13.00% and 13.25%-14.25% respectively. Key to note, the Savings Development Bond, SDB1/2011/030, was last reopened in September 2014.
Money Market Performance:
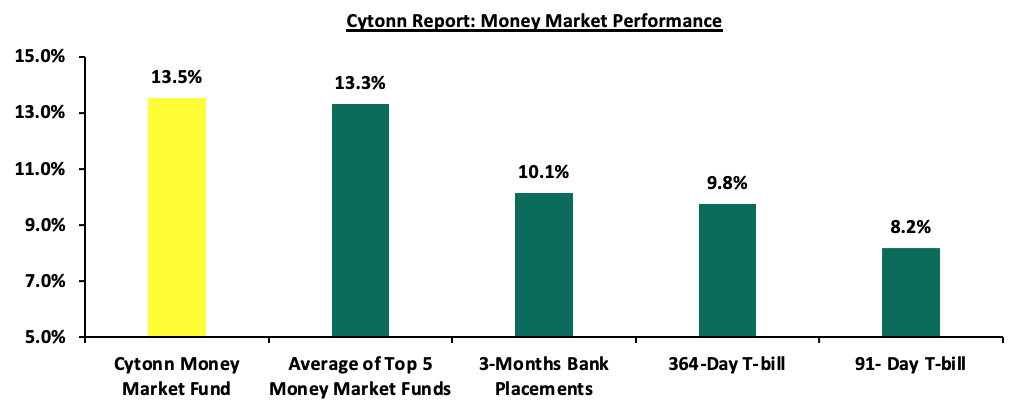
In the money markets, 3-month bank placements ended the week at 10.1% (based on what we have been offered by various banks) and the yields on the government papers were on a downward trajectory with the yields on 364-day and 91-day papers decreasing by 24.9 bps and 10.3 bps respectively to 8.3% and 9.8% from the 8.3% and 10.0% respectively recorded the previous week. The yield on the Cytonn Money Market Fund decreased by 8.0 bps to 13.5% from the 13.6% recorded the previous week, while the average yields on the Top 5 Money Market Funds decreased by 2.6 bps to remain relatively unchanged from the 13.3% recorded the previous week.
The table below shows the Money Market Fund Yields for Kenyan Fund Managers as published on 13th June 2025:
|
Cytonn Report: Money Market Fund Yield for Fund Managers as published on 13th June 2025 |
||
|
Rank |
Fund Manager |
Effective Annual Rate |
|
1. |
Gulfcap Money Market Fund |
13.9% |
|
2. |
Cytonn Money Market Fund ( Dial *809# or download Cytonn App) |
13.5% |
|
3. |
GenAfrica Money Market Fund |
13.1% |
|
4. |
Ndovu Money Market Fund |
13.1% |
|
5. |
Kuza Money Market fund |
13.0% |
|
6. |
Etica Money Market Fund |
12.8% |
|
7. |
Lofty-Corban Money Market Fund |
12.7% |
|
8. |
Orient Kasha Money Market Fund |
12.5% |
|
9 |
Arvocap Money Market Fund |
12.4% |
|
10. |
Enwealth Money Market Fund |
11.7% |
|
11. |
Nabo Africa Money Market Fund |
11.6% |
|
12. |
Old Mutual Money Market Fund |
11.5% |
|
13. |
Madison Money Market Fund |
11.3% |
|
14. |
Jubilee Money Market Fund |
11.2% |
|
15. |
British-American Money Market Fund |
11.2% |
|
16. |
Faulu Money Market Fund |
10.5% |
|
17. |
Dry Associates Money Market Fund |
10.5% |
|
18. |
Sanlam Money Market Fund |
10.4% |
|
19. |
Apollo Money Market Fund |
10.3% |
|
20. |
KCB Money Market Fund |
10.2% |
|
21. |
Absa Shilling Money Market Fund |
10.2% |
|
22. |
Co-op Money Market Fund |
10.0% |
|
23. |
CIC Money Market Fund |
9.9% |
|
24. |
Genghis Money Market Fund |
9.9% |
|
25. |
ICEA Lion Money Market Fund |
9.8% |
|
26. |
Mali Money Market Fund |
9.7% |
|
27. |
Mayfair Money Market Fund |
7.9% |
|
28. |
AA Kenya Shillings Fund |
7.7% |
|
29. |
Stanbic Money Market Fund |
7.2% |
|
30. |
Ziidi Money Market Fund |
7.2% |
|
31. |
Equity Money Market Fund |
5.4% |
Source: Business Daily
Liquidity:
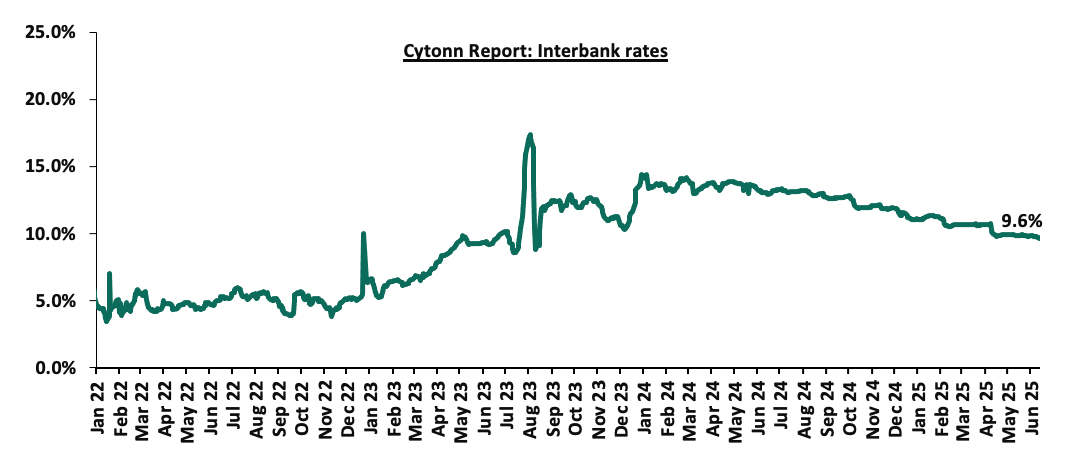
During the week, liquidity in the money markets marginally eased, with the average interbank rate decreasing by 10.6 bps, to 9.7% from the 9.8% recorded the previous week, partly attributable to tax remittances that were offset by government payments. The average interbank volumes traded increased by 121.2% to Kshs 17.5 bn from Kshs 7.9 bn recorded the previous week. The chart below shows the interbank rates in the market over the years:
Kenya Eurobonds:
During the week, the yields on Kenya’s Eurobonds were on a downward trajectory with the yield on the 12-year Eurobond issued in 2019 decreasing the most by 17.1 bps to 9.4% from the 9.6% recorded the previous. The table below shows the summary performance of the Kenyan Eurobonds as of 12th June 2025;
|
Cytonn Report: Kenya Eurobond Performance |
|||||||
|
|
2018 |
2019 |
2021 |
2024 |
2025 |
||
|
Tenor |
10-year issue |
30-year issue |
7-year issue |
12-year issue |
13-year issue |
7-year issue |
11-year issue |
|
Amount Issued (USD) |
1.0 bn |
1.0 bn |
0.9 bn |
1.2 bn |
1.0 bn |
1.5 bn |
1.5 bn |
|
Years to Maturity |
3.0 |
23.0 |
2.2 |
7.2 |
9.3 |
6.0 |
11.0 |
|
Yields at Issue |
7.3% |
8.3% |
7.0% |
7.9% |
6.2% |
10.4% |
9.9% |
|
02-Jan-25 |
9.1% |
10.3% |
8.5% |
10.1% |
10.1% |
10.1% |
|
|
02-Jun-25 |
8.7% |
10.8% |
- |
10.0% |
10.1% |
9.9% |
|
|
05-Jun-25 |
8.3% |
10.5% |
- |
9.6% |
9.7% |
9.4% |
|
|
06-Jun-25 |
8.3% |
10.5% |
- |
9.6% |
9.7% |
9.4% |
|
|
09-Jun-25 |
8.3% |
10.6% |
- |
9.6% |
9.7% |
9.5% |
|
|
10-Jun-25 |
8.2% |
10.5% |
- |
9.6% |
9.7% |
9.5% |
|
|
11-Jun-25 |
8.3% |
10.5% |
- |
9.5% |
9.6% |
9.4% |
|
|
12-Jun-25 |
8.2% |
10.4% |
- |
9.4% |
9.6% |
9.3% |
|
|
Weekly Change |
(0.1%) |
(0.1%) |
- |
(0.2%) |
(0.1%) |
(0.1%) |
- |
|
MTD Change |
(0.5%) |
(0.4%) |
- |
(0.6%) |
(0.5%) |
(0.6%) |
- |
|
YTD Change |
(0.9%) |
0.1% |
- |
(0.6%) |
(0.5%) |
(0.8%) |
- |
Source: Central Bank of Kenya (CBK) and National Treasury
Kenya Shilling:
During the week, the Kenyan Shilling depreciated marginally against the US Dollar by 1.3 bps, to remain relatively unchanged from the Kshs 129.2 recorded the previous week. On a year-to-date basis, the shilling has appreciated by 5.1 bps against the dollar, compared to the 17.4% appreciation recorded in 2024.
We expect the shilling to be supported by:
- Diaspora remittances standing at a cumulative USD 4,997.2 mn in the twelve months to April 2025, 12.1% higher than the USD 4,457.5 mn recorded over the same period in 2024. These has continued to cushion the shilling against further depreciation. In the April 2025 diaspora remittances figures, North America remained the largest source of remittances to Kenya accounting for 59.6% in the period,
- The tourism inflow receipts which came in at Kshs 452.2 bn in 2024, a 19.8% increase from Kshs 377.5 bn inflow receipts recorded in 2023, and owing to tourist arrivals that improved by 8.0% to 2,303,028 in the 12 months to February 2025 from 2,133,612 in the 12 months to February 2024 and,
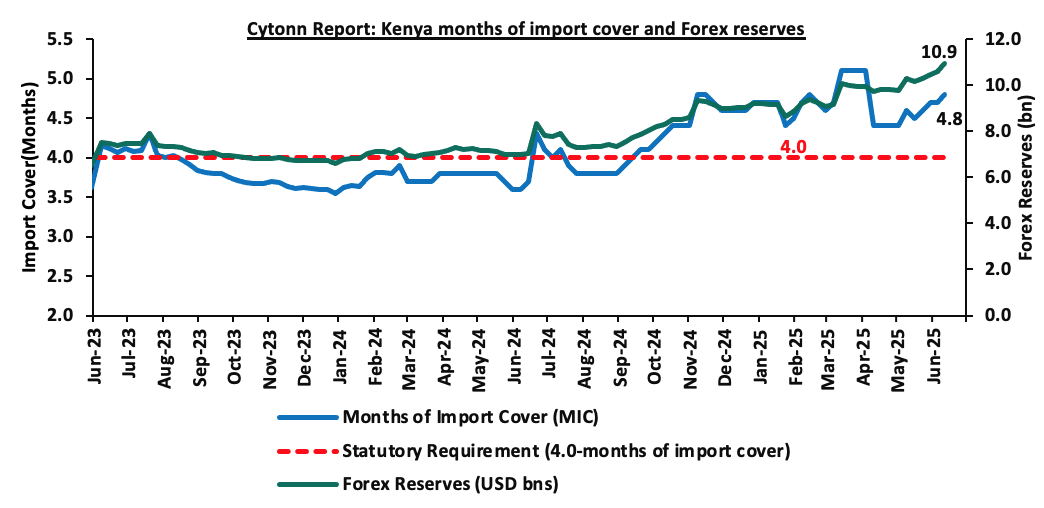
- Improved forex reserves currently at USD 10.9 bn (equivalent to 4.8-months of import cover), which is above the statutory requirement of maintaining at least 4.0-months of import cover and above the EAC region’s convergence criteria of 4.5-months of import cover.
The shilling is however expected to remain under pressure in 2025 as a result of:
- An ever-present current account deficit which came at 3.1% of GDP in the twelve months to February 2025, and,
- The need for government debt servicing, continues to put pressure on forex reserves given that 62.0% of Kenya’s external debt is US Dollar-denominated as of December2024.
Key to note, Kenya’s forex reserves increased by 3.4% during the week, to USD 10.9 bn from USD 10.6 bn recorded in the previous week, equivalent to 4.8 months of import cover), and above the statutory requirement of maintaining at least 4.0-months of import cover and above the EAC region’s convergence criteria of 4.5-months of import cover.
The chart below summarizes the evolution of Kenya's months of import cover over the years:
Weekly Highlights
- Monetary Policy Committee (MPC) June 2025
The monetary policy committee met on June 10th, 2025, to review the outcome of its previous policy decisions against a backdrop of elevated uncertainties to the global outlook for growth, lower but sticky inflation in advanced economies heightened trade tensions as well as persistent geopolitical tensions. The MPC decided to lower the CBR rate by 25.0 bps to 9.75%, from 10.00% in April 2025. Notably, inflation rates remain anchored and remained within the CBK preferred range of 2.5%-7.5% for the twenty third consecutive month, with a decrease of 0.3% points to 3.8% in May 2025, from 4.1% in April 2025. Key to note, the MPC had cut the CBR rate to 10.00% in the previous meeting in April from 10.75% in February 2025, and a cumulative of 325 bps since August 2024. Below are some of the key highlights from the June meeting:
- The overall inflation decreased by 0.3% points to 3.8% in May 2025, from 4.1% in April 2025, remaining below the mid-point of the preferred CBK range of 2.5%-7.5%. Core inflation increased to 2.8% in May 2025, from 2.5% in April, reflecting increasing demand pressures in the economy. This increase was largely attributed to higher prices of processed foods, particularly sugar and maize flour. Conversely, non-core inflation decreased to 6.0% in May 2025, from 8.4% in April, driven by lower prices of food crops, especially vegetables, due to seasonal factors. Lower energy and utilities costs, including reduced electricity and fuel prices, continued to help moderate non-core inflation. Overall inflation is expected to stay below the mid-point of the target range in the near term, supported by low and stable core inflation, an anticipated reduction in energy prices, and a stable exchange rate.
- The recently released Economic Survey 2025, for 2024 showed a slowdown in the performance of the Kenyan economy, with real GDP growing by 4.7%, although slower than the growth of 5.7% recorded in 2023. This was attributable to deceleration in growth in most sectors of the economy. The economy is expected to continue to strengthen in 2025 with real GDP growth projected at 5.2%, from the 4.7% growth recorded in 2024 supported by resilient services sector and agriculture, expected recovery in growth of credit to the private sector and enhanced exports. However, this positive outlook is tempered by potential domestic and external risks.
- The Kenya National Bureau of Statistics (KNBS) updated the balance of payments data to better capture cross-border transactions, especially those involving petroleum imports and re-exports under government-to-government deals. The revisions also include the use of alternative data sources to enhance accuracy in reporting international trade in services, notably travel and financial services. These adjustments refine the recording of regional oil product re-exports and international travel earnings.
- Based on the revised balance of payments data goods exports increased by 3.8% in the 12 months to April 2025, compared to 2024, reflecting a rise in exports of agricultural commodities, especially horticulture and coffee. Goods imports rose by 7.6% reflecting increases in intermediate and capital goods imports. The current account deficit in 12 months to April 2025 is estimated at 1.8% of GDP, down from 2.2% in similar period in 2024, driven by stronger goods exports and robust diaspora remittance inflowsThe current account deficit was fully financed by capital and financial inflows, leading to an overall balance of payments surplus of USD 2,104.0 mn. For 2025, the current account deficit is projected at 1.5% of GDP, up from 1.3% in 2024 and is expected to be fully financed by capital and financial inflows, yielding a balance of payments surplus of USD 1,107.0 mn.
- The CBK foreign exchange reserves, which currently stand at USD 10,946.0 representing 4.8 months of import cover, continue to provide adequate cover and a buffer against any short-term shocks in the foreign exchange market,
- The banking sector remains stable and resilient, with strong liquidity and capital adequacy ratios. The ratio of gross non-performing loans (NPLs) to gross loans increased to 17.6% in April 2025 compared to 17.2% in February 2025. Increases in NPLs were noted in the trade, personal and household, tourism and hotels, and building and construction sectors. Banks have continued to make adequate provisions for the NPLs,
- The CEOs Survey and Market Perceptions Survey conducted ahead of the MPC meeting revealed sustained optimism about business activity and economic growth prospects for the next 12 months. The optimism was attributed to the stable macroeconomic environment reflected in the low inflation rate and stability in the exchange rate, expectations of a decline in interest rates and favorable weather conditions supporting agriculture. Nevertheless, respondents expressed concerns about high cost of doing business and subdued consumer demand,
- The Survey of the Agriculture Sector for May 2025 revealed an expectation for moderate downward pressure on overall headline inflation in the next three months, on account of expected stability in food prices attributed to favorable weather conditions, stability in pump prices and the stable exchange rate,
- Global economic growth showed steady recovery in 2024 coming in at 3.3%. However, the outlook for 2025 is projected to decline to 2.8%, particularly for the United States and China, due to the impact of increased U.S. import tariffs and retaliatory measures imposed by other trading partners, as well as escalating geopolitical risks, particularly ongoing conflicts in the Middle East and the Russia-Ukraine war, which continue to threaten global growth prospects,
- Global headline inflation has eased, though uncertainty persists due to the potential inflationary effects of rising import tariffs. Central banks in advanced economies have continued to cut interest rates, albeit cautiously. International oil prices have declined amid higher production and weak demand mainly from China, yet volatility risks remain elevated due to trade tensions and ongoing geopolitical conflicts. Food inflation has also eased, largely due to lower prices of cereals and sugar, although inflation in edible oil prices remains high.
- Growth in private sector credit stood at 2.0% in May 2025, up from 0.4% in April and a contraction of 2.9% in January 2025, mainly attributed to the dissipation of exchange rate valuation effects on foreign currency-denominated loans due to the appreciation of the Shilling and increased demand attributable to declining lending interest rates. Average commercial banks’ lending rates declined to 15.4% in May from 15.7% in April 2025 and 17.2% in November 2024.
- The Committee acknowledged the ongoing implementation of the FY’2024/25 Supplementary Budget II and the proposed Budget for FY’2025/26. These measures are anticipated to further support fiscal consolidation, which should reduce debt vulnerabilities in the medium-term.
The MPC noted that overall inflation is expected to remain below the midpoint of the 2.5%-5.0% target range in the near term, supported by stable core inflation, low energy prices, and exchange rate stability. Additionally, central banks in major economies have continued to lower interest rates at a cautious pace. The Committee also noted that economic growth slowed in 2024, creating room for further easing of monetary policy to support economic activity while maintaining exchange rate stability. The MPC noted that it will continue to monitor the effects of these policy measures, as well as global and domestic economic developments, and will remain ready to take additional action if necessary. Going forward, we expect the MPC to adopt a more cautious approach to rate adjustments in the coming meetings in a bid to continue supporting the private sector, while also keeping an eye on the effect on the inflation and exchange rate. The next MPC meeting is scheduled for August 2025.
- Fuel Prices effective 15th June 2025 to 14th July 2025
During the week, The Energy and Petroleum Regulatory Authority (EPRA) released their monthly statement on the maximum retail fuel prices in Kenya, effective from 15th June 2025 to 14th July 2025. Notably, the maximum allowed price for Super Petrol increased by Kshs 2.7, while Diesel and Kerosene decreased by Kshs 2.0 and Kshs 2.1 respectively. Consequently, Super Petrol, Diesel and Kerosene will now retail at Kshs 177.3, Kshs 162.9 and Kshs 146.9 per litre respectively, from Kshs 174.6, Kshs 164.9 and Kshs 149.0 per litre respectively, representing an increase of 1.5% for Super Petrol, and decreases of 1.2% and 1.4% for Diesel and Kerosene respectively.
Other key take-outs from the performance include;
- The average landing costs per cubic meter for Super Petrol increased by 0.4% to USD 590.2 from the USD 588.2 recorded in April, while Kerosene and Diesel decreased by 5.1% and 2.4% to USD 569.0 and USD 580.2, and respectively from the USD 599.8 and USD 594.6 respectively recorded in April.
- The Kenyan Shilling remained stable against the US Dollar, appreciating by 20.0 bps to Kshs 129.5 in May from the Kshs 129.8 recorded in April.
We note that fuel prices in the country have stabilized in recent months largely due to the government's efforts to stabilize pump prices through the petroleum pump price stabilization mechanism which expended Kshs 9.9 bn in the FY’2023/24 to cushion the increases applied to the petroleum pump prices, coupled with the appreciation of the Kenyan Shilling against the dollar and other major currencies, as well as a decrease in international fuel prices. Going forward, we expect that fuel prices will stabilize in the coming months as a result of the government's efforts to mitigate the cost of petroleum through the pump price stabilization mechanism and a stable exchange rate. As such, we expect the business environment in the country to improve as fuel is a major input cost, as well as continued stability in inflationary pressures, with the inflation rate expected to remain within the CBK’s preferred target range of 2.5%-7.5% in the short to medium-term.
Rates in the Fixed Income market have been on a downward trend due to high liquidity in the money market which allowed the government to front load most of its borrowing. The government is 71.9% ahead of its prorated net domestic borrowing target of Kshs 574.2 bn, and 65.3% ahead of the total FY’2024/25 net domestic borrowing target of Kshs 597.2 bn, having a net borrowing position of Kshs 987.0 bn (inclusive of T-bills). However, we expect a stabilization of the yield curve in the short and medium term, with the government looking to increase its external borrowing to maintain the fiscal surplus, hence alleviating pressure in the domestic market. As such, we expect the yield curve to stabilize in the short to medium-term and hence investors are expected to shift towards the long-term papers to lock in the high returns
Market Performance
During the week, the equities market was on an upward trajectory, with NASI gaining the most by 9.0% while NSE 10, NSE 25 and NSE 20 gained by 6.0%, 5.2% and 3.1% respectively, taking the YTD performance to gains of 17.8%, 10.8%, 9.5% and 9.1% for NASI, NSE 20, NSE 10 and NSE 25. The equities market performance was driven by gains recorded by large-cap stocks such as Safaricom, Cooperative Bank and Stanbic Bank of 17.1%, 7.7% and 5.7%, respectively.
Additionally, in the regional equities market, the East African Exchanges 20 (EAE 20) share index lost by 4.0, attributable to losses recorded by large cap stocks such as MTN Uganda, I&M Rwanda and Bralirwa Limited of 2.4%, 0.4% and 0.3% respectively. The performance was however supported by gains recorded by large cap stocks such as Safaricom, Tanga Cement Limited and Bank of Baroda Uganda of 19.5%, 12.9% and 8.3% respectively
During the week, equities turnover increased by 350.7% to USD 46.1 mn, from USD 10.2 mn recorded the previous week, taking the YTD total turnover to USD 386.3 mn. Foreign investors became net buyers for first time in two weeks, with a net buying position of USD 2.3 mn, from a net selling position of USD 0.5 mn recorded the previous week, taking the YTD foreign net selling position to USD 31.1 mn, compared to a net selling position of USD 16.9 mn in 2024.
The market is currently trading at a price-to-earnings ratio (P/E) of 5.2x, 54.6% below the historical average of 11.5x. The dividend yield stands at 6.8%, 2.1% points above the historical average of 4.7%. Key to note, NASI’s PEG ratio currently stands at 0.7x, an indication that the market is undervalued relative to its future growth. A PEG ratio greater than 1.0x indicates the market is overvalued while a PEG ratio less than 1.0x indicates that the market is undervalued. The charts below indicate the historical P/E and dividend yields of the market;


Universe of Coverage:
|
Cytonn Report: Equities Universe of Coverage |
||||||||||
|
Company |
Price as at 05/06/2026 |
Price as at 13/06/2025 |
w/w change |
YTD Change |
Year Open 2025 |
Target Price* |
Dividend Yield |
Upside/ Downside** |
P/TBv Multiple |
Recommendation |
|
Standard Chartered Bank |
269.0 |
275.8 |
2.5% |
(3.3%) |
285.3 |
328.8 |
16.7% |
36.0% |
1.6x |
Buy |
|
Diamond Trust Bank |
72.0 |
72.5 |
0.7% |
8.6% |
66.8 |
87.1 |
9.7% |
29.9% |
0.3x |
Buy |
|
Jubilee Holdings |
225.0 |
211.3 |
(6.1%) |
20.9% |
174.8 |
260.7 |
6.0% |
29.4% |
0.3x |
Buy |
|
Stanbic Holdings |
153.0 |
161.8 |
5.7% |
15.7% |
139.8 |
185.3 |
13.6% |
28.1% |
1.0x |
Buy |
|
Equity Group |
45.0 |
45.4 |
0.9% |
(5.5%) |
48.0 |
52.8 |
9.5% |
25.9% |
0.8x |
Buy |
|
Co-op Bank |
15.5 |
16.7 |
7.7% |
(4.3%) |
17.5 |
18.6 |
9.7% |
21.2% |
0.6x |
Buy |
|
ABSA Bank |
18.2 |
18.9 |
4.1% |
0.3% |
18.9 |
21.0 |
9.6% |
20.8% |
1.2x |
Buy |
|
KCB Group |
43.4 |
44.6 |
2.8% |
5.1% |
42.4 |
50.7 |
6.9% |
20.7% |
0.6x |
Buy |
|
NCBA |
54.8 |
56.0 |
2.3% |
9.8% |
51.0 |
60.2 |
10.0% |
17.5% |
0.9x |
Accumulate |
|
I&M Group |
34.0 |
34.0 |
0.1% |
(5.6%) |
36.0 |
36.8 |
8.8% |
17.1% |
0.6x |
Accumulate |
|
CIC Group |
2.7 |
2.9 |
4.8% |
33.6% |
2.1 |
3.1 |
4.8% |
13.2% |
0.8x |
Accumulate |
|
Britam |
7.0 |
7.7 |
10.3% |
32.0% |
5.8 |
7.5 |
0.0% |
(2.3%) |
0.7x |
Sell |
|
*Target Price as per Cytonn Analyst estimates **Upside/ (Downside) is adjusted for Dividend Yield ***Dividend Yield is calculated using FY’2024 Dividends |
||||||||||
We are “Bullish” on the Equities markets in the short term due to current cheap valuations, lower yields on short-term government papers and expected global and local economic recovery, and, “Neutral” in the long term due to persistent foreign investor outflows. With the market currently trading at a discount to its future growth (PEG Ratio at 0.7x), we believe that investors should reposition towards value stocks with strong earnings growth and that are trading at discounts to their intrinsic value. We expect the current high foreign investors sell-offs to continue weighing down the economic outlook in the short term.
- Residential Sector
- Affordable Housing units facing financial setbacks due to uncollected rents
Kenya’s Affordable Housing Program is facing significant financial setbacks due to uncollected rent from government-owned housing units. The state is losing millions in potential revenue, undermining the program’s sustainability and its ability to fund new residential projects, a concern linked to the real estate sector’s reliance on efficient resource management, as discussed in prior conversations about JVs and the housing levy.
The National Housing Corporation (NHC), tasked with managing government housing units, has reported substantial rent arrears from tenants in public housing estates, particularly in urban areas like Nairobi and Mombasa. A 2024 audit revealed that over 30% of tenants in NHC-managed properties, including estates like Ngara and Park Road, have defaulted on rent payments, with arrears totaling over Kshs 500 mn annually. These losses stem from lax enforcement of lease agreements, outdated rent collection systems, and economic pressures on tenants, such as inflation and high living costs, which echo concerns raised about the housing levy’s impact on workers’ disposable income. The Auditor-General highlighted inefficiencies in NHC’s monitoring, noting that some tenants have not paid rent for over two years, a situation exacerbated by the lack of digital payment platforms and inadequate follow-up mechanisms.
This revenue shortfall directly affects the residential sector, as uncollected funds limit the NHC’s ability to maintain existing properties or finance new developments through JVs, such as the Mavoko Affordable Housing Project. The government’s redirection of housing levy funds to non-housing projects, like schools and markets, as previously discussed, further strains resources, reducing capital for residential construction. This could stall projects in pipeline, which rely on stable funding and clear governance to succeed. Real estate experts warn that persistent losses may deter private partners in JVs, who prioritize financial reliability, potentially slowing the delivery of affordable housing units.
To address this, the government is exploring stricter lease enforcement, digital rent collection systems, and partnerships with private firms to improve management. However, without addressing tenant affordability and enhancing transparency, the state risks further losses, undermining public trust and the programme’s goal of delivering 250,000 homes annually.
- Superior Homes and HFC Kenya Signs MOU
During the week, Superior Homes Kenya (SHK) and HFC Kenya, a subsidiary of HF Group, signed a transformative Memorandum of Understanding (MOU) to enhance homeownership accessibility in Kenya. This strategic partnership merges Superior Homes’ expertise in developing master-planned communities with HFC’s innovative financing solutions, offering homebuyers concessional mortgage rates of 9.5%, 20-year loan terms, and expedited loan approvals. The collaboration targets the growing middle and upper-middle-income segments, addressing Kenya’s housing demand while promoting sustainable urban development.
Superior Homes, known for projects like Greenpark Estate in Athi River, brings its reputation for quality, sustainable developments to the partnership. HFC, a leading financial institution, complements this with tailored mortgage products, enabling seamless home acquisition. Ian Henderson, Superior Homes’ Managing Director, described the MOU as a game-changer, emphasizing its role in empowering Kenyans to achieve homeownership. HFC’s Managing Director, highlighted the partnership’s focus on financing end buyers, fostering integrated communities with long-term value.
This MOU significantly impacts Kenya’s real estate sector by addressing a critical financing gap. Affordable mortgage rates and extended repayment periods make homeownership more accessible, potentially increasing demand for residential properties, particularly in urban areas like Nairobi and Mombasa. The partnership encourages structured financing over slow, savings-based construction, stimulating market growth and attracting private developers. By prioritizing sustainability, the collaboration aligns with Kenya’s urban development goals, potentially influencing policy and encouraging more public-private partnerships. However, challenges like high land costs and economic pressures may require ongoing innovation to maintain affordability. This MOU sets a precedent for future collaborations, driving Kenya’s real estate sector toward inclusivity and sustainability.
- Kenyan Banks increased funding to the building and construction sector
During the week, it was noted that Kenya’s commercial banks significantly boosted funding for the building and construction sector by Kshs 19.3 bn, equivalent to 11.7%, in Q1’2025, signalling a robust resurgence in real estate development. This double-digit growth reflects increased financing for new commercial and residential projects, as well as the resumption of stalled developments across the country. The surge in construction loans underscores growing confidence in Kenya’s property market, driven by rising demand for housing and commercial spaces amid urbanization and government-backed initiatives like the Affordable Housing Program.
Data from the Central Bank of Kenya (CBK) indicates that construction loans rose by 11.7% from Kshs 165.2 bn in December 2024 to Kshs 184.5 bn by March 2025. This increase highlights banks’ strategic shift toward real estate, a sector seen as a stable investment despite economic uncertainties like inflation and high interest rates. Major banks, including KCB, Equity, and Co-operative Bank, led the lending spree, targeting developers in Nairobi, Mombasa, and Kisumu, where demand for affordable and mid-tier housing is soaring. The growth also reflects renewed activity in commercial projects, such as office complexes and retail centers, spurred by Kenya’s position as East Africa’s economic hub.
The increase in loans is expected to accelerate project timelines, enabling developers to complete residential estates and mixed-use developments faster. However, challenges persist, including high borrowing costs, with CBK’s benchmark rate at 12.8%, potentially straining developers’ repayment capacity. Additionally, the sector faces risks from land title disputes and regulatory hurdles, necessitating thorough due diligence.
This lending boom positions banks as pivotal players in Kenya’s real estate growth, fostering job creation and infrastructure development. Yet, stakeholders urge banks to balance lending with risk management to avoid defaults, particularly in volatile economic conditions. As construction activity intensifies, the real estate sector is poised for significant expansion, contributing to Kenya’s economic resilience.
- Infrastructure Sector
During the week, the National Treasury highlighted that Kenya is set to initiate KShs 70.0 bn in Public-Private Partnership (PPP) deals starting July 1, 2025, to address its pressing infrastructure financing needs. These ambitious projects, modelled after large-scale, privately initiated proposals akin to those previously pursued, target critical sectors such as energy, transport, and water, which are foundational to the real estate industry. With public debt absorbing over 65.0% of annual tax revenue and public sentiment firmly against new tax measures, the government is increasingly reliant on private sector investment to fund development without exacerbating fiscal pressures. The Treasury has approved 39 PPP projects with a cumulative value of Kshs 1.7 tn, of which 36, worth Kshs 136.0 bn, are already under contract, paving the way for transformative infrastructure advancements.
The implications for real estate are profound, as enhanced infrastructure directly fuels property development and value appreciation. Improved transport networks, including potential upgrades to major hubs like Jomo Kenyatta International Airport, will enhance connectivity, making peripheral areas more attractive for residential and commercial projects. Reliable energy and water systems, critical for large-scale housing estates and industrial parks, will alleviate longstanding bottlenecks, enabling developers to meet growing demand. The construction sector, a cornerstone of real estate, is poised to see heightened activity, potentially stabilizing material costs through increased supply chains and economies of scale.
However, the reliance on privately initiated proposals, which often bypass competitive bidding, raises concerns about transparency and accountability. Past high-profile deals faced public backlash and legal hurdles, leading to cancellations and eroding investor confidence. For real estate stakeholders, this underscores the need for robust governance to ensure project continuity. The World Bank has advocated for competitively sourced PPPs to bolster public trust, a step that could stabilize market sentiment and encourage long-term investment in property markets.
For real estate developers, these PPP deals offer opportunities to collaborate on mixed-use developments integrated with infrastructure projects, but success depends on navigating public scrutiny and regulatory challenges. By harnessing private sector innovation, Kenya aims to close its infrastructure gap, creating a fertile environment for real estate growth. Transparent execution will be critical to sustaining momentum and unlocking the full potential of these initiatives for the property sector and the broader economy.
- Real Estate Investments Trusts (REITs)
On the Unquoted Securities Platform, Acorn D-REIT and I-REIT traded at Kshs 26.7 and Kshs 22.9 per unit, respectively, as per the last updated data on 23rd May 2025. The performance represented a 33.4% and 14.5% gain for the D-REIT and I-REIT, respectively, from the Kshs 20.0 inception price. The volumes traded for the D-REIT and I-REIT came in at Kshs 12.8 mn and Kshs 36.1 mn shares, respectively, with a turnover of Kshs 323.5 mn and Kshs 791.5 mn, respectively, since inception in February 2021. Additionally, ILAM Fahari I-REIT traded at Kshs 11.0 per share as of 23rd May 2025, representing a 45.0% loss from the Kshs 20.0 inception price. The volume traded to date came in at 1.2 mn shares for the I-REIT, with a turnover of Kshs 1.5 mn since inception in November 2015.
REITs offer various benefits, such as tax exemptions, diversified portfolios, and stable long-term profits. However, the ongoing decline in the performance of Kenyan REITs and the restructuring of their business portfolios are hindering significant previous investments. Additional general challenges include:
- Insufficient understanding of the investment instrument among investors leading to a slower uptake of REIT products,
- Lengthy approval processes for REIT creation,
- High minimum capital requirements of Kshs 100.0 mn for REIT trustees compared to Kshs 10.0 mn for pension funds Trustees, essentially limiting the licensed REIT Trustee to banks only
- The rigidity of choice between either a D-REIT or and I-REIT forces managers to form two REITs, rather than having one Hybrid REIT that can allocate between development and income earning properties
- Limiting the type of legal entity that can form a REIT to only a trust company, as opposed to allowing other entities such as partnerships, and companies,
- We need to give time before REITS are required to list – they would be allowed to stay private for a few years before the requirement to list given that not all companies maybe comfortable with listing on day one, and,
- Minimum subscription amounts or offer parcels set at Kshs 0.1 mn for D-REITs and Kshs 5.0 mn for restricted I-REITs. The significant capital requirements still make REITs relatively inaccessible to smaller retail investors compared to other investment vehicles like unit trusts or government bonds, all of which continue to limit the performance of Kenyan REITs.
We expect the performance of Kenya’s Real Estate sector to remain resilient supported by several factors: i) heightened activities from both private and government sectors, ii) an expanding population driving the need for housing, iii) government efforts under the Affordable Housing Program and the incentives advanced to developers aligned with the program, iv) an increase in deals in the commercial office sector likely to boost occupancy, v) increased investment by international and local investors in the retail sector, and vi) increased international arrivals in the country boosting the hospitality and tourism sector. However, challenges such as rising construction costs, an oversupply in select Real Estate classes, strain on infrastructure development, and high capital demands in REITs sector will continue to impede the real estate sector’s optimal performance by restricting developments and investments.
Following the release of the Q1’2025 results by Kenyan listed banks, the Cytonn Financial Services Research Team undertook an analysis on the financial performance of the listed banks and identified the key factors that shaped the performance of the sector. For the earnings notes of the various banks, click the links below:
- Equity Group Q1’2025 Earnings Note
- KCB Group Q1’2025 Earnings Note
- Standard Chartered Bank Kenya Q1’2025 Earnings Note
- ABSA Bank Kenya Q1’2025 Earnings Note
- NCBA Group Q1’2025 Earnings Note
- Co-operative Bank Q1’2025 Earnings Note
- Stanbic Holdings Q1’2025 Earnings Note
- I&M Group Holdings Q1’2025 Earnings Note
- Diamond Trust Bank Kenya Q1’2025 Earnings Note
- HF Group Q1’2025 Earnings Note
The core earnings per share (EPS) for the listed banks recorded a weighted decline of 0.7% in Q1’2025, compared to a weighted growth of 29.8% recorded in Q1’2024, an indication of deteriorated performance mainly on the back of a 11.2% decline in non-funded income in Q1’2025, compared to a growth of 10.9% in Q1’2024, and a a compressed loan book. The decline in non-funded income was majorly attributable to a decline in foreign exchange income due to reduced dollar demand coupled with lower transaction volumes weighing down on fees and commissions income. Notably, the inflation rate in Q1’2025 averaged 3.5%, 2.8% points lower than the 6.3% average in Q1’2024, with the Kenyan Shilling remaining stable at Kshs 129.3 against the dollar, unchanged from end of FY’2024. The performance was however supported by a 7.9% growth in net interest income, however lower than the 22.8% growth in Q1’2024. Similarly, credit risk increased with the asset quality of listed banks deteriorating in Q1’2025, with the weighted average Gross Non-Performing Loan ratio (NPL) increasing by 0.5% points to 14.0%, from 13.5% recorded in Q1’2024. The NPL performance remained 2.4% points above the ten-year average of 11.7%.
The report is themed “Subdued Growth As Profit Margins Tighten” where we assess the key factors that influenced the performance of the banking sector in Q1’2025, the key trends, the challenges banks faced, and areas that will be crucial for growth and stability of the banking sector going forward. As such, we shall address the following:
- Key Themes that Shaped the Banking Sector Performance in Q1’2025,
- Summary of the Performance of the Listed Banking Sector in Q1’2025,
- The Focus Areas of the Banking Sector Players Going Forward, and,
- Brief Summary and Ranking of the Listed Banks based on the outcome of our analysis
Section I: Key Themes That Shaped the Banking Sector Performance in Q1’2025
In this section, we will highlight the main factors influencing the banking sector in Q1’2025. These include regulation, digitization, interest rates, regional expansion through mergers and acquisitions, and asset quality:
- Regulation:
- Higher capital requirements: Following the enactment of The Business Laws (Amendment) Act 2024 the Central Bank of Kenya increased the minimum core capital requirement for commercial banks to Kshs 10.0 bn from the previous Kshs 1.0 bn that had been in effect since 2012. To facilitate compliance, lenders below this threshold were directed to incrementally grow the figure over a 5-year period, required to close 2025 with a minimum core capital of Kshs 3.0 bn, rising to Kshs 5.0 bn by the end of 2026, Kshs 7.0 bn by the end of 2027, Kshs 8.0 bn by the end of 2028 and full compliance at Kshs 10.0 bn by the end of 2029. This substantial increase aims to enhance the financial resilience of banks and ensure that new entrants are well-capitalized to support Kenya's economic development. Consequently, banks have been asked to submit their plans for meeting the Kshs 10.0 bn core capital requirement, not just the first year. To meet the new core capital requirements, these banks may pursue rights issues, equity sales, mergers, or acquisitions. As of end of Q1’2025 26 out of the 38 licensed banks had already met or exceeded the Kshs 3.0 bn threshold, while 12 banks remain below.
- Lifting of moratorium on licensing of new commercial banks: Recently in a significant policy shift, on April 16, 2025, the Central Bank of Kenya (CBK), announced that with effect from July 1, 2025, it will lift the moratorium on licensing of new commercial banks that had been in place since November 2015. The moratorium was introduced in response to governance, risk management, and operational issues within the banking sector, aiming to create room for reforms. Since then, Kenya’s banking sector has seen notable progress, including stronger legal and regulatory frameworks, increased mergers and acquisitions, and the entry of new local and international strategic investors. With the moratorium now lifted, new entrants into Kenya’s banking sector must prove their ability to meet the revised minimum core capital requirement of Kshs 10.0 bn. This move opens the door for investors to apply for greenfield licenses, unlike the previous arrangement where entry was heavily reliant on mergers and acquisitions.
- Risk-based Lending: Over the years, the government has used various policy tools to curb the increasing interest rates and promote access to credit by the private sector. As such, after the repeal of the Interest Cap Law in 2019, the Central Bank of Kenya (CBK) intervened administratively by halting banks from repricing their loans. Instead, banks were required to develop and submit new risk-based lending formulas for approval. The model's primary purpose is to instil fairness and transparency in the credit pricing decisions as it allows Banks to price loans based on a customer’s risk profile. This represents a shift from the traditional practice of rejecting loan applicants solely based on their credit scores. The new credit scoring system primarily targets borrowers with higher risks, many of whom are micro, small, and medium-sized enterprises facing challenges in accessing traditional credit. As of September 2024, all 38 banks in the country had their models approved by the CBK, with Equity Bank being the first commercial bank to implement risk-based lending. However, the approval process of the models has been gradual in a bid to avoid causing distress to customers through high interest rates. Further, the full deployment has been slowed due to inadequate data to analyse the client's risk profile. In April 2025, the Central Bank of Kenya (CBK) released a Consultative Paper on the review of the Risk-Based Credit Pricing Model, inviting public comments by May 2, 2025. The paper attracted over 40 responses from various stakeholders, which CBK is currently reviewing. CBK clarified that the paper does not propose a return to interest rate caps or the abandonment of its interbank rate-based monetary policy framework.
- Digitization: In Q1’2025, digitization continued to be a transformative force in the banking sector, significantly improving how banks operate and deliver services. There has been a significant increase in the adoption of mobile and online banking platforms as customers now prefer to perform banking transactions from the comfort of their homes, leading to a decline in the use of physical branches. For instance, most of the listed banks disclosed that the majority of transactions were conducted through alternative channels, with Equity Group and KCB Group reporting that 85.9% and 99.0% of their transactions, respectively, were done through non-branch channels as of end of Q1’2025,
- Interest Rates: Interest rates were on a downward trajectory during the period under review. Notably, the yields on Kenyan government securities declined during the period under review, with the yield on the 91-day paper averaging 9.2% during the quarter, 7.3% points lower than the average of 16.4% in Q1’2024. The significant declines in rates in Q1’2025 led to a decrease in the listed bank’s interest income growth, softening to a weighted average drop of 1.4% in Q1’2025, from a weighted average growth of 35.3% in Q1’2024. Additionally, interest expense declined by a weighted average of 14.4% in Q1’2025, down from 64.7% growth in Q1’2024, leading to a 7.8% growth in net interest income in Q1’2025,
- Regional Expansion through Mergers and Acquisitions: Kenyan banks are increasingly expanding their regional footprint, with subsidiaries contributing significantly to overall profitability. For instance, Equity Group reported that, regional subsidiaries contributed 51.0% of the Group’s Profit Before Tax (PBT) in Q1’2025, up from 50.0% in the same period last year, demonstrating the growing importance of these subsidiaries to the group’s earnings. Additionally, KCB Group's subsidiaries contributed 36.6% of the group's PBT in Q1’2025. In 2024, there was one acquisition agreement announcement between Access Bank plc and KCB Group.
- On April 14, 2025, the Central Bank of Kenya announced the acquisition of 100.0% shareholding of National Bank of Kenya Limited (NBK) by Access Bank Plc from KCB Group Plc, following CBK’s approval on April 4, 2025 under Section 13 (4) of the Banking Act, and approval by the Cabinet Secretary for the National Treasury and Economic Planning on April 10, 2025, pursuant to Section 9 of the Banking Act. As part of the transaction, CBK, on April 4, 2025, further approved the transfer of certain assets and liabilities of National Bank of Kenya Limited to KCB Bank Kenya Limited pursuant to Section 9 of the Banking Act. The acquisition and completion of the transaction was finalised on 30th May 2025 in accordance with the terms of the Agreement between the parties.
- On March 20, 2024 Access Bank Plc announced that it had entered into a share purchase agreement with KCB Group Plc that would allow Access Bank Plc to acquire 100% shareholding in National Bank of Kenya Limited (NBK) from KCB. Access Bank Plc is a wholly owned subsidiary of Access Holdings Plc listed on the Nigerian Exchange as Access Corporation. Notably, KCB Bank had acquired the National Bank of Kenya back in 2019 in a rescue deal that was supervised by the Central Bank of Kenya. The announcement followed the release of the Q1’2024 results for the KCB group, which revealed a decline in earnings with its Core earnings per share (EPS) declining by 8.3% to Kshs 11.7, from Kshs 12.7 in FY’2022. The transaction represents an important milestone for Access Bank as it moves closer to the achievement of its five-year strategic plan through increased scale in the Kenyan market. In the signed deal, Access Bank will pay multiples of 1.3x the book value of NBK, which stood at Kshs 10.6 bn as of end December 2023. This values the deal at about Kshs 13.3 bn with the actual figure to be announced when the transaction is completed.
- In April 2024, Sidian Bank disclosed that the founders of the bank and other nine individual shareholders relinquished a combined stake of 728,525 shares representing 16.6% stake to Pioneer General Insurance Limited, pioneer Life Investments Limited, Wizro Enterprises Limited, Afrah Limited, and Telesec Africa Limited. The transaction amounted to Kshs 0.8 bn translating to a price to book multiple (p/bv) of 1.0x. This follows an earlier transaction executed on October 2023 when Pioneer General Insurance, Wizpro Enterprise and Afram Limited bought 38.9% stake in the lender following a shareholders’ resolution passed on 20th September 2023 approving the sale.
The following are Mergers and Acquisitions that were completed in 2023:
- On January 30, 2023, the Central Bank of Kenya (CBK) announcedthat Commercial International Bank (Egypt) S.A.E (CIB) had completed the acquisition of an additional 49.0% shareholding of Mayfair CIB Bank Limited (MBL) at Kshs 5.0 bn following the earlier acquisition of 51.0% stake in MBL announced in April 2020. Consequently, MBL is now a fully owned subsidiary of CIB,
- On January 30, 2023, Equity Group Holdings , through Equity Bank Kenya Limited (EBKL) announced that it had completed the acquisition of certain assets and liabilities of the local Bank, Spire Bank Limited after obtaining all the required regulatory approvals. The completion of the acquisition followed the Assets and Liabilities Purchase Agreement, which was announced in September 2022, as highlighted in our Cytonn Weekly #37/2022. As such, Equity Bank Kenya Limited took over Spire Bank’s 12 branches as well as all existing depositors in Spire Bank, other than remaining deposits from its largest shareholder, Mwalimu Sacco. For more information, please see our Cytonn Monthly-January 2023,
- On March 17, 2023, the Central Bank of Kenya (CBK) announced that Premier Bank Limited Somalia (PBLS) had completed the acquisition of 62.5% shareholding of First Community Bank Limited (FCB) effective 27 March 2023. This came after receiving regulatory approvals from the CBK and the Cabinet Secretary for the National Treasury. FCB, which has been in operation since June 2008, is classified as a tier 3 bank in Kenya with 18 branches and a market share of 0.3% as at December 2022. The acquisition by Premier Bank Limited Somalia (PBLS), came at a time when FCB has been struggling to meet regulatory Capital adequacy requirements. For more information, please see our Cytonn Weekly #11/2023,
- On May 22, 2023, the Central Bank of Kenya (CBK) announced that Shorecap III, LP, a Private Equity fund governed by the laws of Mauritius, had acquired a 20.0% stake in Credit Bank Plc. The fund is managed by Equator Capital Partners LLC, and the acquisition took effect from June 15, 2023. While the CBK initially did not reveal the value of the deal, it has since been disclosed that Shorecap III, LP paid Ksh 0.7 billion for the 20.0% stake, valuing the bank at Ksh 3.64 bn. Shorecap III, LP assumed control of 7,289,928 ordinary shares, which make up 20.0% of the Bank’s ordinary shares. The funds helped lift Credit Bank from a regulatory capital breach. For additional details, refer to our Cytonn Weekly #21/2023,
- On December 1, 2023 Equity Group Holdings Plc (EGH) announced that it had successfully completed the acquisition of its Rwandan Subsidiary, Compagnie Générale de Banque (Cogebanque) Plc, marking a significant milestone in its regional expansion strategy. Equity Group now holds 198,250 shares representing 99.1% of the issued share capital of COGEBANQUE, following receipt of all regulatory and corporate approvals, officially making COGEBANQUE its subsidiary. EGH made the announcement it had entered into a binding agreement with the Government of Rwanda, Rwanda Social Security Board, and other investors of Compagnie Generale De Banque (Cogebanque) Plc Limited to acquire a 91.9% stake in the Rwanda based lender on June 14, 2023. Notably, EGH signed a share purchase agreement with the Sellers on July 28, 2023, committing to buy 183,854 shares at a rate of 297,406 Rwandan Francs per share upon completion on December 1, 2023, giving EGH ownership of 99.1% of the issued share capital. Concurrently, EGH proposed to purchase all outstanding shares from the other shareholders of Cogebanque, aiming to own up to 100% of Cogebanque’s issued shares,
Below is a summary of the deals in the last 10 years that have either happened, been announced or expected to be concluded:
|
Cytonn Report: Banking Sector Deals and Acquisitions |
||||||
|
Acquirer |
Bank Acquired |
Book Value at Acquisition (Kshs bn) |
Transaction Stake |
Transaction Value (Kshs bn) |
P/Bv Multiple |
Date |
|
Access Bank PLC (Nigeria) |
National Bank of Kenya |
10.6 |
100.00% |
13.3 |
1.3x |
Apr-25 |
|
Pioneer General Insurance and four other companies |
Sidian Bank |
5.0 |
16.57% |
0.8 |
1.0x |
Apr-24 |
|
Pioneer General Insurance and two other companies |
Sidian Bank |
5.0 |
38.91% |
2.0 |
1.0x |
Oct-23 |
|
Equity Group |
Cogebanque PLC ltd |
5.7 |
91.13% |
6.7 |
1.3x |
Dec-23 |
|
Shorecap III |
Credit Bank Plc |
3.6 |
20.00% |
0.7 |
1.0x |
Jun-23 |
|
Premier Bank Limited |
First Community Bank |
2.8 |
62.50% |
Undisclosed |
N/A |
Mar-23 |
|
KCB Group PLC |
Trust Merchant Bank (TMB) |
12.4 |
85.00% |
15.7 |
1.5x |
Dec-22 |
|
Equity Group |
Spire Bank |
Unknown |
Undisclosed |
Undisclosed |
N/A |
Sep-22* |
|
Access Bank PLC (Nigeria)* |
Sidian Bank |
4.9 |
83.40% |
4.3 |
1.1x |
June-22* |
|
KCB Group |
Banque Populaire du Rwanda |
5.3 |
100.00% |
5.6 |
1.1x |
Aug-21 |
|
I&M Holdings PLC |
Orient Bank Limited Uganda |
3.3 |
90.00% |
3.6 |
1.1x |
Apr-21 |
|
KCB Group** |
ABC Tanzania |
Unknown |
100.00% |
0.8 |
0.4x |
Nov-20* |
|
Co-operative Bank |
Jamii Bora Bank |
3.4 |
90.00% |
1 |
0.3x |
Aug-20 |
|
Commercial International Bank |
Mayfair Bank Limited |
1.0 |
51.00% |
Undisclosed |
N/A |
May-20* |
|
Access Bank PLC (Nigeria) |
Transnational Bank PLC. |
1.9 |
100.00% |
1.4 |
0.7x |
Feb-20* |
|
Equity Group ** |
Banque Commerciale Du Congo |
8.9 |
66.50% |
10.3 |
1.2x |
Nov-19* |
|
KCB Group |
National Bank of Kenya |
7.0 |
100.00% |
6.6 |
0.9x |
Sep-19 |
|
CBA Group |
NIC Group |
33.5 |
53%.47% |
23 |
0.7x |
Sep-19 |
|
Oiko Credit** |
Credit Bank |
3.0 |
22.80% |
1 |
1.5x |
Aug-19 |
|
CBA Group** |
Jamii Bora Bank |
3.4 |
100.00% |
1.4 |
0.4x |
Jan-19 |
|
AfricInvest Azure |
Prime Bank |
21.2 |
24.20% |
5.1 |
1.0x |
Jan-18 |
|
KCB Group |
Imperial Bank |
Unknown |
Undisclosed |
Undisclosed |
N/A |
Dec-18 |
|
SBM Bank Kenya |
Chase Bank Ltd |
Unknown |
75.00% |
Undisclosed |
N/A |
Aug-18 |
|
DTBK |
Habib Bank Kenya |
2.4 |
100.00% |
1.8 |
0.8x |
Mar-17 |
|
SBM Holdings |
Fidelity Commercial Bank |
1.8 |
100.00% |
2.8 |
1.6x |
Nov-16 |
|
M Bank |
Oriental Commercial Bank |
1.8 |
51.00% |
1.3 |
1.4x |
Jun-16 |
|
I&M Holdings |
Giro Commercial Bank |
3.0 |
100.00% |
5 |
1.7x |
Jun-16 |
|
Mwalimu SACCO |
Equatorial Commercial Bank |
1.2 |
75.00% |
2.6 |
2.3x |
Mar-15 |
|
Centum |
K-Rep Bank |
2.1 |
66.00% |
2.5 |
1.8x |
Jul-14 |
|
GT Bank |
Fina Bank Group |
3.9 |
70.00% |
8.6 |
3.2x |
Nov-13 |
|
Average |
|
|
73.3% |
|
1.3x |
|
|
Average: 2013 to 2018 |
|
|
73.5% |
|
1.7x |
|
|
Average: 2019 to 2024 |
|
|
73.2% |
|
1.0x |
|
|
* Announcement Date ** Deals that were dropped |
||||||
In Q1’2025, the average acquisition valuations for banks have remained unchanged at 1.3x, similar to what was recorded in a similar period in 2024. As such, the valuations still remain low compared to historical prices paid, as highlighted in the chart below;
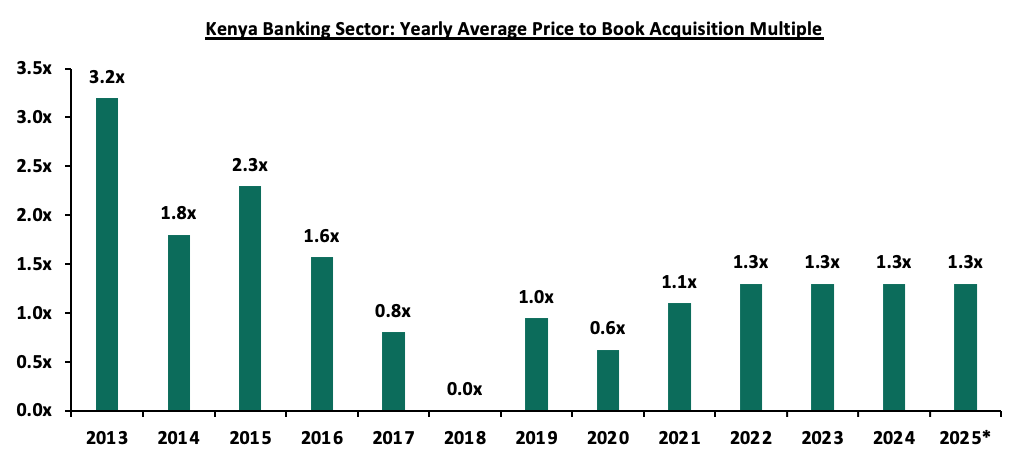
2025* data as of end of Q1’2025
As at the end of Q1’2025, the number of commercial banks in Kenya stood at 38, same as in Q1’2024, but lower than the 43 licensed banks in FY’2015. The ratio of the number of banks per 10 million population in Kenya now stands at 6.6x, which is a reduction from 9.0x in FY’2015, demonstrating continued consolidation in the banking sector. However, despite the ratio improving, Kenya still remains overbanked as the number of banks remains relatively high compared to the African major economies. To bring the ratio to 5.6x, we ought to reduce the number of banks from the current 38 banks to about 30 banks. This is partly expected to be supported by the enactment of The Business Laws (Amendment) Act 2024 that mandated a significant increase in the minimum core capital for banks to Kshs 10.0 bn from the previous Kshs 1.0 bn that had been in effect since 2012. To facilitate compliance, lenders below this threshold were directed to incrementally grow the figure over a 5-year period, required to close 2025 with a minimum core capital of Kshs 3.0 bn, rising to Kshs 5.0 bn by the end of 2026, and full compliance at Kshs 10.0 bn by the end of 2029. The new capital requirement is likely to trigger further mergers and acquisitions (M&As), especially for smaller lenders that may struggle to meet the threshold, potentially reducing the number of banks even further. However, the effect could be muted by the lifting of the moratorium beginning 1st July 2025. The chart below shows the commercial bank ratio per 10 million people across select African nations in comparison to Kenya;
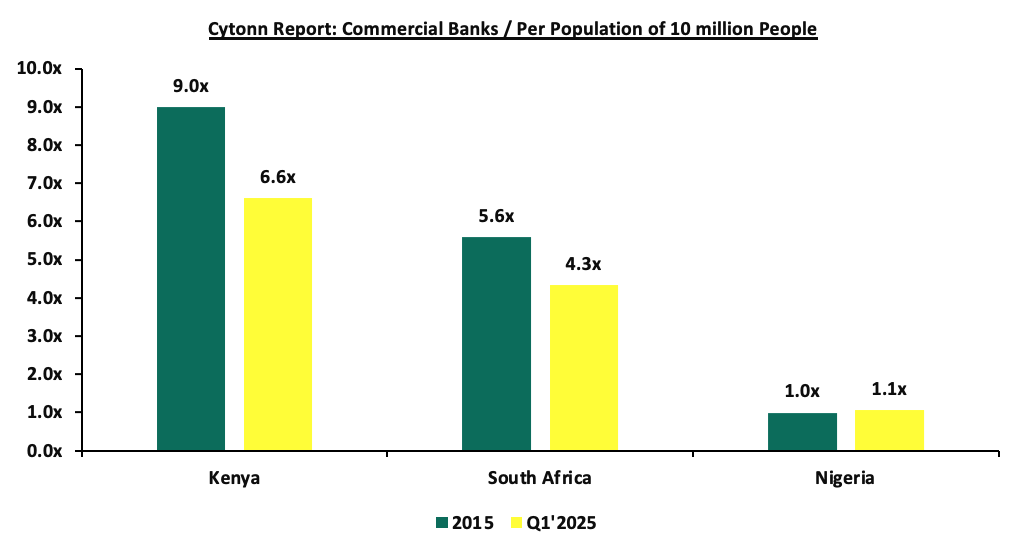
Source: World Bank, Central Bank of Kenya, South Africa Reserve Bank, Central Bank of Nigeria
Additionally, on April 16, 2024, the Central Bank of Kenya (CBK), announced that with effect from July 1, 2025, it will lift the moratorium on licensing of new commercial banks that had been in place since November 2015. The moratorium was introduced in response to governance, risk management, and operational issues within the banking sector, aiming to create room for reforms. Since then, Kenya’s banking sector has seen notable progress, including stronger legal and regulatory frameworks, increased mergers and acquisitions, and the entry of new local and international strategic investors. With the moratorium now lifted, new entrants into Kenya’s banking sector must prove their ability to meet the revised minimum core capital requirement of Kshs 10.0 bn. This move opens the door for investors to apply for greenfield licenses, unlike the previous arrangement where entry was heavily reliant on mergers and acquisitions. Over the past decade, the moratorium contributed to a reduction in the number of banks in Kenya, to 38 currently from 43 in 2015.
- Asset Quality: Asset quality for listed banks deteriorated in Q1’2025, with the weighted average Gross Non-Performing Loan ratio (NPL) increasing by 0.5% points to 14.0%, from 13.5% recorded in Q1’2024. The performance remained 2.4% points above the ten-year average of 11.7%. Notably, 7 out of the 10 listed banks recorded an increase in the NPL ratio on the back of elevated credit risk, with most banks recording a faster growth in gross non-performing loans in comparison to gross loans growth. As such, the gross non-performing loans ratio in the banking industry increased by 1.7% points to 17.4% in March 2025 from 15.7% in March 2024. Additionally, Absa Bank Plc’s NPL ratio rose the most by 2.0% points to 13.1%, from 11.1% in Q1’2024, while KCB Group’s NPL ratio increased by 2.0% points to 19.9%, from 17.9% in Q1’2024. Absa’s asset quality worsened due to a 13.4% rise in Gross Non-Performing Loans to Kshs 44.0 bn in Q1’2025 from Kshs 38.8 bn in Q1’2024, compared to a 4.0% decline in gross loans to Kshs 337.1 bn from Kshs 351.0 bn in Q1’2024. Similarly, KCB Group’s asset quality worsened due to a 13.6% rise in Gross Non-Performing Loans to Kshs 233.3 bn in Q1’2025 from Kshs 205.3 bn in Q1’2024, which outpaced the 2.6% growth in gross loans to Kshs 1,174.8 bn from Kshs 1,144.8 bn in Q1’2024. The chart below highlights the asset quality trend for the listed banks:

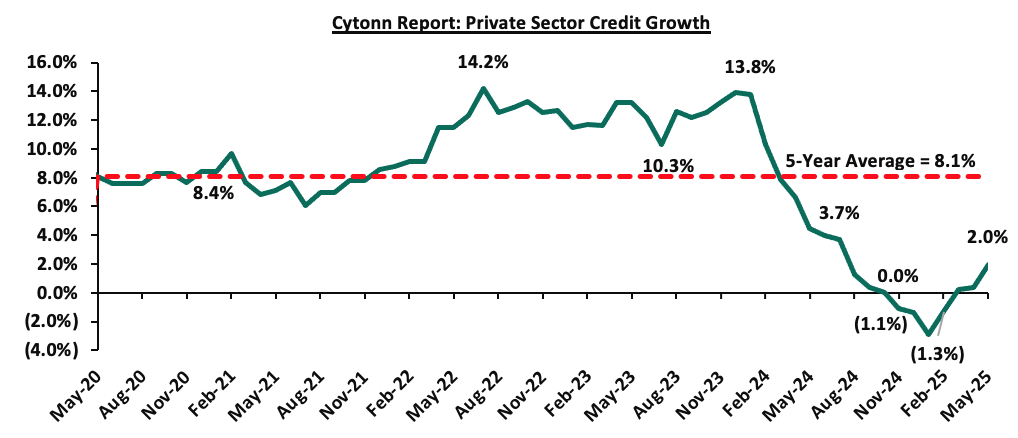
However, the deterioration in listed banks' asset quality was mitigated by an improvement in Diamond Trust Bank Kenya’s asset quality, with the Gross NPL ratio decreasing by 1.7% points to 13.2% in Q1’2025 from 14.9% in Q1’2024. This was attributable to the 4.2% increase in gross loans to Kshs 300.1 bn from Kshs 287.9 bn in Q1’2024, that supported the 7.7% decrease in gross non-performing loans to Kshs 39.7 bn from Kshs 43.0 bn in Q1’2024. Standard Chartered Bank Kenya’s asset quality improved with the Gross NPL ratio decreasing by 1.6% points to 8.3% in Q1’2025 from 9.9% in Q1’2024. This was attributable to the 26.1% decrease in gross non-performing loans to Kshs 12.2 bn from Kshs 16.5 bn in Q1’2024, outpacing the 11.9% decrease in gross loans to Kshs 147.5 bn from Kshs 167.4 bn in Q1’2024. A total of seven out of the ten listed Kenyan banks recorded a deterioration in asset quality, driven by a decline in lending due to elevated credit risk as the recent Central Bank Rate (CBR) cuts translate into the economy following past credit challenges in 2024. In a bid to curb inflation and support the Shilling the Monetary Policy Committee (MPC) had adopted a tight monetary policy stance, raising the Central Bank Rate (CBR) to 13.00% in February 2024 and maintaining it at that rate for its two subsequent sittings up to July 2024. As a result of the high interest rates, the private sector credit growth was severely constrained recording contractions of 1.1% and 1.4% in the months of November and December 2024 respectively. The chart below shows the private sector credit growth:
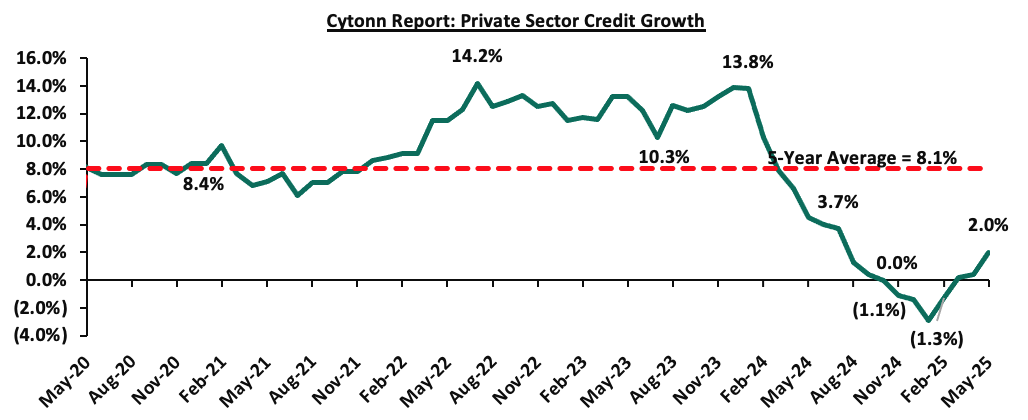
However, the Central Bank of Kenya lowered the Central Bank Rate (CBR) by a cumulative 175 basis points to 11.25% in December 2024 from 13.00% in July 2024 in the year, and further by 150 bps to 9.75% in June 2025, signalling a gradual easing of monetary policy, noting that its previous measures had stabilized the currency and anchored inflation. This reduction in CBR is expected to continue to support credit growth and ease financial pressures on borrowers. Notably, growth in private sector credit grew by 2.0% in May 2025 from 0.4% in April and a contraction of 2.9% in January 2025, mainly attributed to the dissipation of exchange rate valuation effects on foreign currency-denominated loans due to the appreciation of the Shilling and increased demand attributable to declining lending interest rates. Going forward, we expect credit risk to decline gradually but remain at relatively elevated levels compared to previous years, owing to the improved business environment and a stronger and stable Shilling.
The table below highlights the asset quality for the listed banking sector:
|
Cytonn Report: Listed Banks Asset Quality |
||||||
|
|
Q1’2025 NPL Ratio* |
Q1’2024 NPL Ratio** |
% point change in NPL Ratio |
Q1’2025 NPL Coverage* |
Q1’2024 NPL Coverage** |
% point change in NPL Coverage |
|
Absa Bank Kenya |
13.1% |
11.1% |
2.0% |
65.2% |
62.3% |
2.9% |
|
KCB Group |
19.9% |
17.9% |
1.9% |
67.0% |
62.0% |
4.9% |
|
Co-operative Bank of Kenya |
17.1% |
15.9% |
1.2% |
64.2% |
58.6% |
5.6% |
|
HF Group |
25.2% |
24.1% |
1.1% |
72.1% |
74.4% |
(2.3%) |
|
Equity Group |
15.0% |
14.2% |
0.8% |
60.5% |
58.3% |
2.2% |
|
NCBA |
12.2% |
11.7% |
0.4% |
63.0% |
55.7% |
7.2% |
|
I&M Group |
10.9% |
10.8% |
0.1% |
63.6% |
58.3% |
5.3% |
|
Stanbic Holdings |
8.7% |
8.9% |
(0.1%) |
80.8% |
72.3% |
8.5% |
|
Standard Chartered Bank |
8.3% |
9.9% |
(1.6%) |
78.7% |
83.7% |
(5.0%) |
|
Diamond Trust Bank |
13.2% |
14.9% |
(1.7%) |
39.9% |
44.0% |
(4.1%) |
|
Mkt Weighted Average* |
14.0% |
13.5% |
0.5% |
66.3% |
62.7% |
3.6% |
|
*Market cap weighted as at 13/06/2025 |
||||||
|
**Market cap weighted as at 13/06/2024 |
||||||
Key take-outs from the table include;
- Asset quality for the listed banks deteriorated in Q1’2025, with market weighted average NPL increasing by 0.5% points to 14.0% from a 13.5% in Q1’2024. The worsening of asset quality was mainly driven by a deterioration in Absa Group, KCB Group, Coop Bank, HF Group, Equity Group NCBA and I&M Group’s asset quality with their NPL ratio increasing by 2.0%, 1.9%, 1.2%, 1.1%, 0.8%, 0.4% and 0.1% points respectively,
- Absa Group and KCB Group had the highest NPL ratio jumps by 2.0% and 21.9% points respectively to 13.1% and 19.9%, from 11.1% and 17.9% respectively in Q1’2024. Absa Group’s asset quality worsened due to a 13.4% rise in Gross Non-Performing Loans to Kshs 44.0 bn in Q1’2025 from Kshs 38.8 bn in Q1’2024, outpacing a 4.0% decline in gross loans to Kshs 337.1 bn from Kshs 351.0 bn in Q1’2024. Similarly, KCB Group’s asset quality worsened due to a 13.6% rise in Gross non-performing loans to Kshs 233.3 bn in Q1’2025 from Kshs 205.3 bn in Q1’2024, outpacing a 2.6% increase in gross loans to Kshs 1,174.8 bn from Kshs 1,144.8 bn in Q1’2024, and,
- Market weighted average NPL Coverage for the listed banks increased by 3.6% points to 66.3% in Q1’2025, from 62.7% recorded in Q1’2024, majorly on the back of increased NPL coverage recorded by Stanbic Holdings, NCBA Bank Co-op Bank, I&M Group, KCB Group, Absa Group and Equity Group by 8.5%, 7.2%, 5.6%, 5.3%, 4.9%, 2.9% and 2.2% points respectively in Q1’2025. However, the NPL coverage ratio of Standard Chartered Bank Kenya, Diamond Trust Bank Kenya and HF Group decreased by 5.0%, 4.1% and 2.3% points respectively in Q1’2025.
Section II: Summary of the Performance of the Listed Banking Sector in Q1’2025:
The table below highlights the performance of the banking sector, showing the performance using several metrics, and the key take-outs of the performance;
|
Cytonn Report: Kenyan Listed Banks Performance Q1’2025 |
|||||||||||||||
|
Bank |
Core EPS Growth |
Interest Income Growth |
Interest Expense Growth |
Net Interest Income Growth |
Net Interest Margin |
Non-Funded Income Growth |
NFI to Total Operating Income |
Growth in Total Fees & Commissions |
Deposit Growth |
Growth in Government Securities |
Loan to Deposit Ratio |
Loan Growth |
Return on Average Equity |
COF |
YIEA |
|
Diamond Trust Bank Kenya |
23.0% |
0.1% |
(7.2%) |
8.0% |
5.8% |
(18.5%) |
28.3% |
3.4% |
9.0% |
18.6% |
61.3% |
5.7% |
11.5% |
6.5% |
12.0% |
|
I&M Group |
17.9% |
(0.6%) |
(15.1%) |
11.8% |
8.2% |
13.7% |
27.7% |
4.5% |
6.0% |
40.5% |
72.1% |
0.7% |
18.5% |
6.8% |
14.4% |
|
Co-operative Bank of Kenya |
5.3% |
14.4% |
3.3% |
21.7% |
8.3% |
(1.9%) |
32.8% |
6.7% |
9.0% |
20.9% |
73.2% |
1.7% |
18.2% |
6.1% |
13.7% |
|
Absa Bank Kenya |
3.7% |
(7.4%) |
(21.9%) |
(1.1%) |
10.1% |
(11.1%) |
28.6% |
4.1% |
4.6% |
68.0% |
83.1% |
(5.6%) |
25.2% |
4.4% |
13.9% |
|
NCBA Group |
3.4% |
(10.1%) |
(33.5%) |
20.6% |
6.3% |
(4.5%) |
42.5% |
(2.8%) |
(9.6%) |
5.3% |
57.9% |
(10.4%) |
20.5% |
7.0% |
12.8% |
|
KCB Group |
0.4% |
2.2% |
(8.6%) |
8.5% |
8.2% |
(9.8%) |
31.8% |
0.4% |
(4.9%) |
(12.1%) |
71.3% |
0.11% |
23.4% |
4.7% |
12.6% |
|
Equity Group |
(3.9%) |
(2.7%) |
(12.4%) |
2.6% |
7.4% |
(11.8%) |
40.7% |
(1.4%) |
7.0% |
31.2% |
60.8% |
3.3% |
20.8% |
4.3% |
11.5% |
|
Standard Chartered Bank |
(13.5%) |
(2.4%) |
(13.1%) |
(0.8%) |
9.6% |
(29.3%) |
29.2% |
(3.1%) |
(6.8%) |
38.8% |
48.3% |
(10.2%) |
26.8% |
1.8% |
11.2% |
|
Stanbic Holdings |
(16.6%) |
(8.9%) |
(24.6%) |
4.6% |
5.9% |
(27.2%) |
28.9% |
1.2% |
(5.0%) |
89.6% |
72.3% |
(4.6%) |
20.0% |
6.3% |
12.3% |
|
HF Group |
(89.3%) |
18.6% |
(3.7%) |
46.1% |
5.4% |
9.9% |
30.0% |
20.1% |
14.5% |
102.2% |
77.6% |
2.0% |
5.6% |
7.1% |
12.2% |
|
Q1'25 Mkt Weighted Average* |
(0.7%) |
(1.4%) |
(14.4%) |
7.9% |
8.0% |
(11.2%) |
33.6% |
0.9% |
0.6% |
30.2% |
66.5% |
(2.3%) |
21.7% |
5.0% |
12.6% |
|
Q1'24 Mkt Weighted Average** |
29.8% |
35.3% |
64.7% |
22.8% |
8.0% |
10.9% |
38.6% |
10.7% |
14.1% |
3.1% |
68.4% |
7.5% |
21.9% |
4.5% |
12.2% |
|
*Market cap weighted as at 13/06/2025 |
|||||||||||||||
|
**Market cap weighted as at 13/06/2024 |
|||||||||||||||
Key takeaways from the table include:
- The listed banks recorded a 0.7% decline in core Earnings per Share (EPS) in Q1’2025, compared to the weighted average growth of 29.8% in Q1’2024, an an indication of deteriorated performance on the back of a 2% decline in non-funded income in Q1’2025, compared to a growth of 10.9% in Q1’2024.This was majorly attributable to a decline in foreign exchange income due to reduced dollar demand and lower transaction volumes weighing down on fees and commissions income. The performance during the period was mainly weighed down by a 11.2% weighted average decline in non-funded income, but however supported by a 7.9% weighted average growth in net interest income,
- Investments in government securities investments by listed banks increased significantly in Q1’2025, having recorded a market-weighted average growth of 30.2%, from the 3.1% increase recorded in Q1’2024, with 9 of the 10 listed banks recording increases in government securities investments. HF Group and Stanbic Holdings recorded the largest increases of 102.2% and 89.6% respectively. KCB Group however recorded a decrease in government securities investments of 12.1%,
- The listed banks’ Net loans and advances to customers recorded a weighted average decline of 2.3% in Q1’2025, a significant decline from the 7.5% growth recorded in Q1’2024, an indication of decreased lending attributable to the elevated credit risk due to the still relatively high borrowing costs witnessed during the period,
- Interest income recorded a weighted average decline of 1.4% in Q1’2025, compared to 35.3% in Q1’2024. Similarly, interest expenses recorded a market-weighted average decline of 14.4% in Q1’2025 compared to a growth of 64.7% in Q1’2024. Consequently, net interest income recorded a weighted average growth of 7.9% in Q1’2025, albeit lower than the 22.8% growth recorded in Q1’2024, on the back of easing monetary policy leading to lower lending and deposit rates,
- Notably, non-funded income growth softened during the year, as evidenced by non-funded income weighted average decline of 11.2% in Q1’2025 compared to a weighted average growth of 10.9% in Q1’2024. The performance was largely attributable to the decrease in foreign exchange income recorded by the banks during the period as a result of decreased dollar demand in the country. Additionally, listed banks recorded a weighted average growth of 0.3% in total fees and commissions income in Q1’2025 compared to a weighted growth of 10.7% in Q1’2024, and,
- The listed banks recorded a 21.7% weighted average growth on return on average equity (RoaE), 0.2% points lower than the 21.9% growth registered in Q1’2024. However, the entire banking sector’s Return On Equity (ROE) stood at 1% as of March 2025, a 1.1% points increase from the 22.0% recorded in December 2024. On a global level, the Kenyan banking sector continues to record high profitability compared to other economies in the world, as highlighted in the chart below:
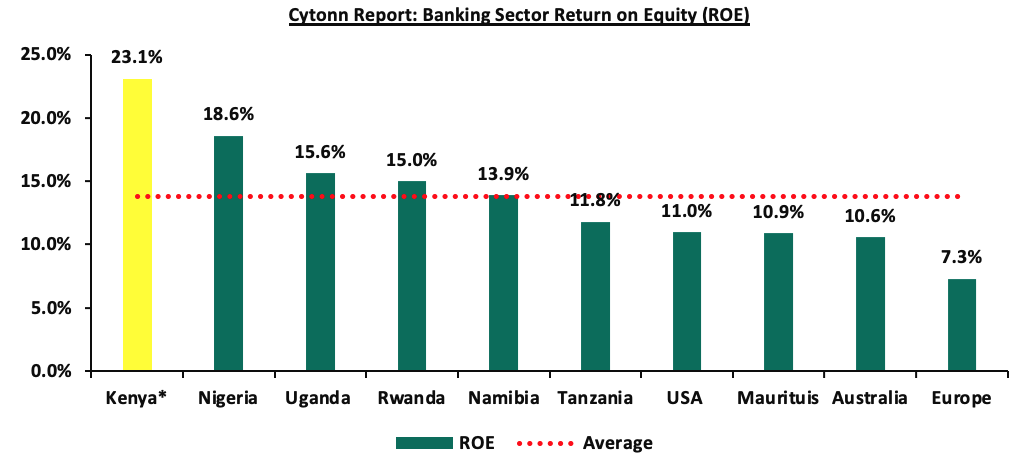
Source: Cytonn research
* Figure as of March 2025
Section III: The Focus Areas of the Banking Sector Players Going Forward:
The banking sector witnessed a decline in profitability during the period under review, with the Core Earnings Per Share (EPS) declining by 0.7%, as a result of an 11.2% decline in non-funded income in Q1’2025, compared to a growth of 10.9% in Q1’2024.This was majorly attributable to a decline in foreign exchange income due to reduced dollar demand and lower transaction volumes weighing down on fees and commissions income. Notably, all 8 of the 10 listed banks recorded a decline in their Non-funded income in Q1’2025. However, while there were expectations of an improved business environment following the continued monetary policy easing as evidenced by a lower Central Bank Rate (CBR), standing at 9.75% as of June 2025 and a stronger and stable Shilling, the broader economic performance has not shown significant improvement. As such, it remains uncertain whether banks will reduce their provisioning levels in the near term. Any changes in provisioning will largely depend on sustained economic performance and ease in credit risk. To note, growth in general provisions for the listed banks recorded a reduced weighted growth of 6.5% in Q1’2025, compared to a growth of 14.5% in Q1’2024. Based on the current operating environment, we believe the future performance of the banking sector will be shaped by the following key factors:
- Growth in Interest income: Going forward, we expect interest income growth to remain a key driver in the banking industry. With the recent easing of monetary policy by the Central Bank of Kenya, which lowered the Central Bank Rate (CBR) by 25 basis points to 9.75% in June 2025, signals a gradual reduction in borrowing costs. This is likely to support an increase in credit uptake, expanding banks' loan books and consequently boosting interest income. Additionally, the continued use of banks' risk-based lending models will enable banks to effectively price their risk, further contributing to the growth of interest income.,
- Revenue Diversification: In Q1’2025, non-funded income (NFI) recorded a 11.2% weighted average decline, slower than the 10.9% weighted growth in Q1’2024, majorly attributable to a decline in foreign exchange income resulting from reduced demand for the USD following the appreciation and the relative stability of the currency. Notably, this deceleration occurred with 8 of the 10 listed Banks recording a decrease in their non-funded income. As a result of the decline in non-funded income (NFI) the weighted average contribution of NFI to total operating income came in at 33.6% in Q1’2025, 5.0% points lower than the 38.6% weighted average growth contribution recorded in Q1’2024 and as such, there still exists an opportunity for the sector to further increase NFI contributions to revenue given the continuous adoption of digitization,
- Growth in Loans and Advances: While 6 of the listed banks experienced minimal positive loan growth, 4 out of the 10 listed banks recorded larger negative growth in loans and advances to customers, resulting in a weighted average decline in loans of 2.3% during the period. However, with the consistent ease in the Central Bank Rate (CBR) recently, borrowing costs are expected to decline. This reduction is anticipated to support credit growth by encouraging increased borrowing by the private sector and easing financial pressures on borrowers. To drive further loan growth, banks must leverage opportunities such as risk-based lending models, improved customer segmentation, and expanding access to credit in underserved sectors, and,
- Regional Expansion and Further Consolidation: Consolidation remains a key theme going forward with the current environment offering opportunities for larger banks with a sufficient capital base to expand and take advantage of the market's low valuations, as well as further consolidate out smaller and weaker banks. Notably, the majority of the bigger banks have continued to cushion over unsystematic risks specific to the local market by expanding their operations into other African nations. Banks such as KCB and Equity Group have been leveraging on expansion and consolidation, which has largely contributed to their increased asset base as well as earnings growth. Additionally, we expect the increased capital requirements imposed on banks to further accelerated consolidation, as only well-capitalized banks are able to meet these thresholds while pursuing expansion opportunities. As such, we expect to see a continued expansion trend aimed at revenue optimization.
Section IV: Brief Summary and Ranking of the Listed Banks:
As per our analysis of the banking sector from a franchise value and a future growth opportunity perspective, we carried out a comprehensive ranking of the listed banks. For the franchise value ranking, we included the earnings and growth metrics as well as the operating metrics shown in the table below in order to carry out a comprehensive review of the banks:
|
Cytonn Report: Listed Banks Earnings, Growth and Operating Metrics Q1’2025 |
||||||||
|
Bank |
Loan to Deposit Ratio |
Cost to Income (With LLP) |
Return on Average Capital Employed |
Deposits/ Branch (bn) |
Gross NPL Ratio |
NPL Coverage |
Tangible Common Ratio |
Non-Funded Income/Revenue |
|
Absa Bank |
83.1% |
44.3% |
25.2% |
4.4 |
13.1% |
65.2% |
17.6% |
28.6% |
|
HF Group |
77.6% |
76.2% |
5.6% |
2.3 |
25.2% |
72.1% |
21.7% |
30.0% |
|
Coop Bank |
73.2% |
55.5% |
18.2% |
2.5 |
17.1% |
64.2% |
19.6% |
32.8% |
|
Stanbic Bank |
72.3% |
57.2% |
20.0% |
11.3 |
8.7% |
80.8% |
15.1% |
28.9% |
|
I&M Holdings |
72.1% |
56.2% |
18.5% |
3.7 |
10.9% |
63.6% |
16.5% |
27.7% |
|
KCB Group |
71.3% |
57.2% |
23.4% |
2.7 |
19.9% |
67.0% |
14.0% |
31.8% |
|
DTBK |
61.3% |
62.0% |
11.5% |
2.9 |
13.2% |
39.9% |
14.3% |
28.3% |
|
Equity Bank |
60.8% |
61.2% |
20.8% |
3.3 |
15.0% |
60.5% |
13.7% |
40.7% |
|
NCBA Group |
57.9% |
60.6% |
20.5% |
4.2 |
12.2% |
63.0% |
16.8% |
42.5% |
|
SCBK |
48.3% |
42.7% |
26.8% |
12.4 |
8.3% |
78.7% |
18.7% |
29.2% |
|
Weighted Average Q1'2025 |
66.5% |
55.0% |
21.7% |
5.0 |
14.0% |
66.3% |
16.2% |
33.6% |
|
Market cap weighted as at 13/06/2025 |
||||||||
The overall ranking was based on a weighted average ranking of Franchise value (accounting for 60.0%) and intrinsic value (accounting for 40.0%). The Intrinsic Valuation is computed through a combination of valuation techniques, with a weighting of 40.0% on Discounted Cash-flow Methods, 35.0% on Residual Income, and 25.0% on Relative Valuation, while the Franchise ranking is based on a bank’s operating metrics, meant to assess efficiency, asset quality, diversification, and profitability, among other metrics. The overall Q1’2025 ranking is as shown in the table below:
|
Cytonn Report: Listed Banks Q1’2025 Rankings |
|||||
|
Bank |
Franchise Value Rank |
Intrinsic Value Rank |
Weighted Rank Score |
Q1’2024 Rank |
Q1’2025 Rank |
|
SCBK |
1 |
2 |
1.4 |
3 |
1 |
|
Absa Bank |
2 |
8 |
4.4 |
1 |
2 |
|
KCB Group |
4 |
5 |
4.4 |
9 |
3 |
|
Coop Bank |
3 |
7 |
4.6 |
5 |
4 |
|
I&M Holdings |
4 |
6 |
4.8 |
6 |
5 |
|
Equity Bank |
8 |
1 |
5.2 |
4 |
6 |
|
Stanbic Bank |
7 |
4 |
5.8 |
2 |
7 |
|
NCBA Group |
4 |
9 |
6.0 |
8 |
8 |
|
DTBK |
10 |
3 |
7.2 |
7 |
9 |
|
HF Group |
9 |
10 |
9.4 |
10 |
10 |
Major Take-outs from the Q1’2025 Ranking are:
- Standard Chartered Bank rose to position 1 in Q1’2025, from a rank of position 3 in Q1’2024, mainly supported by strong franchise value score and intrinsic value score, attributable to increase in the return on average equity by 2.8% points to 26.8% in Q1’2025, from 24.0% in Q1’2024 coupled with an increase in the bank’s Net Interest Margin by 1.0% points to 9.6% in Q1’2025 from 8.6% in Q1’2024,
- KCB Group climbed up 7 places to rank at position 2 in Q1’2025, up from position 9 in Q1’2024 supported by significant improvement in franchise value score. Its performance was driven by 8.5% growth in net interest income to Kshs 33.7 bn from Kshs 31.1 bn. Notably, the bank’s Net Interest Margin increased by 0.9% points to 8.2% in Q1’2025 from 7.4% in Q1’2024,
- Stanbic Bank slid 5 places to rank at position 7 in Q1’2025, down from position 2 in Q1’2024, attributable a decline in franchise value score mainly on the back of 12.5% points increase Cost of income without LLPs to 48.2% in Q1’2025 from the 35.7% recorded in Q1’2024, coupled with the 1.2% points decline in the net interest margin to 5.9% in Q1’2025, from 7.2% in Q1’2024 and the 10.4% points decline in cost-to-income ratio with LLPs to 57.2% in Q1’2025, from 46.8% in Q1’2024.
For more information, see our Cytonn Q1’2025 Listed Banking Sector Review full report.
Disclaimer: The views expressed in this publication are those of the writers where particulars are not warranted. This publication, which is in compliance with Section 2 of the Capital Markets Authority Act Cap 485A, is meant for general information only and is not a warranty, representation, advice, or solicitation of any nature. Readers are advised in all circumstances to seek the advice of a registered investment advisor.

- Talk to us
- Kenya
- P.O Box 20695 - 00200, Nairobi, Kenya
- Cell +254709101200
- Tel +254709101200
- WhatsApp +254741676635
- United States
- +254709101200
- DOWNLOAD OUR APP
-


- Kenya
- 8th Floor, Pinetree Plaza, Kaburu Drive, Ngong Road, Nairobi, Kenya
- USA
- Suite 1150, 1775 Eye Street NW, USA, Washington DC 20006, USA
- Investments
- High Yield
- Private Equity
- Real Estate
- Real Estate
- RiverRun Estates
- Cytonn Towers
- The Ridge
- Taraji Heights
- The Alma