Unit Trust Funds (UTFs) Performance, Q3’2022, & Cytonn Monthly
By Cytonn Research, Feb 5, 2023
Executive Summary
Fixed Income
During the month of January, T-bills were oversubscribed, with the overall average subscription rate coming in at 126.5%, an increase from 77.8% recorded in the month of December 2022. The average subscription rate for the 364-day, 182-day and 91-day papers increased to 42.5%, 92.3% and 422.1% from 22.8%, 33.0% and 327.4%, respectively, recorded in December 2022. The average yields on the government papers were on an upward trajectory, with the average yields on the 364-day, 181-day papers and 91-day papers increasing by 16.6 bps, 8.2 bps and 11.8 bps to 10.4%, 9.9% and 9.5%, from 10.3%, 9.8% and 9.3%, respectively recorded in December 2022. For the month of January, the government accepted a total of Kshs 119.0 bn of the Kshs 121.5 bn worth of bids received, translating to an acceptance rate of 97.9%. The January 2023 bonds were also oversubscribed, with the average subscription rate coming in at 131.7%, up from 47.7% recorded in December 2022. The reopened bonds FXD1/2020/005 and FXD1/2022/015 received bids worth Kshs 41.6 bn against the offered Kshs 50.0 bn, translating to a subscription rate of 83.3%, with the government accepting bids worth Kshs 31.5 bn translating to an acceptance rate of 75.7%. Their subsequent tap sale received bids worth Kshs 18.0 bn against the offered Kshs 10.0 bn, translating to an oversubscription rate of 180.2%, with the government accepting bids worth Kshs 17.6 bn translating to an acceptance rate of 97.8%;
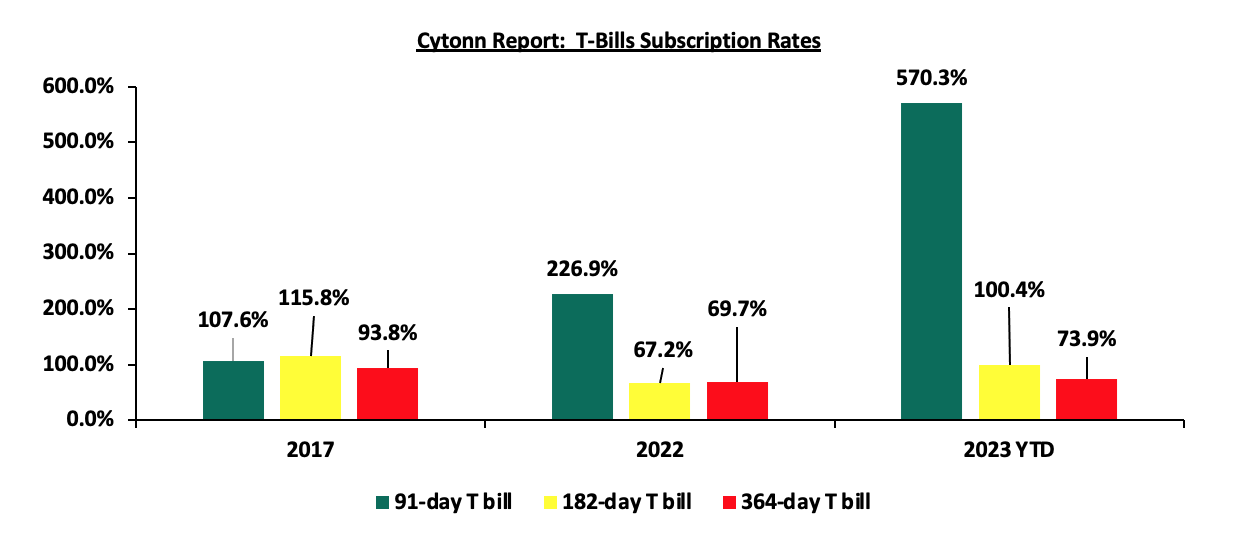
During the week, T-bills remained oversubscribed, with the overall subscription rate coming in at 208.9%, up from the 142.9% recorded the previous week. Investor’s preference for the shorter 91-day paper persisted, with the paper receiving bids worth Kshs 28.7 bn against the offered Kshs 4.0 bn, translating to a subscription rate of 718.6%, up from 458.9% recorded the previous week. The significant oversubscription is partly attributable to the high yields being offered on the shorter dated papers coupled with investors seeking to avoid duration risk. The subscription rates for the 364-day and 182-day papers also increased to 105.3% and 108.5% from 56.8% and 102.6%, respectively, recorded the previous week. The government accepted bids worth Kshs 32.4 bn out of the Kshs 50.1 bn total bids received, translating to an acceptance rate of 64.7%. The yields on the government papers were on an upward trajectory, with the yields on the 364-day paper increasing by 4.6 bps to 10.6%, while 182-day and 91-day papers increasing by 4.3 bps each to 10.0% and 9.6%, respectively;
Additionally, during the week, the Kenya National Bureau of Statistics (KNBS) released the y/y inflation for January 2023, which came at 9.0%, marginally easing from the 9.1% recorded in December 2022. This was against our expectations of an increase within a range of 9.2%-9.6%. Also, the Monetary Policy Committee (MPC) met on January 30th, 2023 to review the outcome of its previous policy decisions and recent economic developments, and to decide on the direction of the Central Bank Rate (CBR). The MPC retained the CBR rate at 8.75%, which was against our expectation of a 25.0 bps increase to 9.0%;
Also, during the week, Stanbic bank released its monthly Purchasing Managers Index (PMI), highlighting that the index for the month of January 2023 came in at 52.0, up from 51.6 recorded in December 2022, pointing towards a sustained improvement in the business environment for a fifth consecutive month. The improvement is largely attributable to rising demand levels, as well as improved operating conditions which boosted business confidence;
Equities
During the month of January, the equities market was on a downward trajectory, with NASI, NSE 20 and NSE 25 declining by 1.2%, 1.1% and 0.6%, respectively. The equities market performance was driven by losses recorded by large cap stocks such as NCBA Group, Bamburi, Safaricom and BAT of 8.8%, 7.9%, 3.1% and 2.2%, respectively. The losses were however mitigated by gains recorded by stocks such as Standard Chartered Bank of Kenya (SCBK), EABL and Co-operative Bank of 10.2%, 5.2% and 1.2%, respectively;
During the week, the equities market recorded mixed performance, with NASI and NSE 25 gaining by 2.5%, and 1.3%, respectively, while NSE 20 declined by 0.6%, taking the YTD performance to gains of 1.5% and 1.3% for NASI and NSE 25, respectively, and a decline of 0.7% for NSE 20. The equities market performance was mainly driven by gains recorded by large cap stocks such as Safaricom and EABL of 5.4% and 3.5%, respectively. The gains were however weighed down by losses recorded by large cap stocks such as NCBA Group, Diamond Trust Bank Kenya (DTB-K), Bamburi and Co-operative Bank of 4.1%, 2.6%, 1.4% and 1.2%, respectively;
During the week, Equity Group Holdings PLc, through Equity Bank Kenya Limited (EBKL) announced that it had completed the acquisition of certain assets and liabilities of Spire Bank Limited after obtaining all the required regulatory approvals. Additionally, the Nairobi Stock Exchange (NSE) amended the trading rules for equity securities to allow block trades, aimed at boosting liquidity in the bourse, after receiving approval from the Capital Markets Authority (CMA);
Real Estate
During the week, Hass Consult, a Real Estate Development and Consulting firm based in Kenya, released its House Price Index Q4’2022 Report, highlighting that the average q/q selling prices for residential houses in the Nairobi Metropolitan Area (NMA) declined by 2.2% in Q4’2022 compared to a 0.8% increase in Q3’2022, while on a y/y basis, the average selling prices appreciated by 4.8% compared to the 3.1% increase that was recorded in Q4’2021. Hass Consult also released its Land Price Index Q4’2022 Report, highlighting that the average q/q and y/y selling prices for land in the Nairobi suburbs slightly increased by 0.2% and 1.2% respectively, compared to 0.4% and 1.2% recorded in Q4’2021. Additionally, Knight Frank, an international Real Estate consultancy and management firm, released the Kenya Market Update H2’2022 Report highlighting that the average selling prices for prime residential properties increased by 0.9% points to 3.8% in Q4’2022 from 2.9% recorded in Q3’2022. In the residential sector, Kenya Mortgage Refinancing Company (KMRC), a state-backed mortgage refinancing company increased the limit of maximum mortgage to be issued to its clients. In Nairobi Metropolitan Area, KMRC increased the limits to Kshs 8.0 mn from Kshs 4.0 mn, and to Kshs 6.0 mn from Kshs 3.0 mn for the rest of the country. Additionally, KMRC increased the Loan To Value Ratio (LTV) to 105.0% from 90.0%, eliminating the 10.0% deposit required to be paid by a home-buyer before accessing the mortgage. In the Real Estate Investment Trusts (REITs) segment, Fahari I-REIT closed the week trading at an average price of Kshs 6.1 per share on the Nairobi Securities Exchange, a 2.5% decline from Kshs 6.3 per share recorded the previous week. On the Unquoted Securities Platform, Acorn D-REIT and I-REIT closed the week ending 27th January 2023 trading at Kshs 23.9 and Kshs 20.9 per unit, respectively, a 19.4% and 4.4% gain for the D-REIT and I-REIT, respectively, from the Kshs 20.0 inception price;
Focus of the Week
Following the release of the Capital Markets Authority (CMA) Quarterly Statistical Bulletin-Q4’2022 we examine the performance of Unit Trust Funds for the period ending 30th September 2022. During the period of review, Unit Trusts Funds’ Assets under Management grew by 7.0% to Kshs 155.9 bn as at the end of Q3’2022, from Kshs 145.8 bn recorded in Q2’2022. Additionally, as at the end of Q3’2022, there were 32 approved Collective Investment Schemes, making up 117 funds in total;
Investment Updates:
- Weekly Rates:
- Cytonn Money Market Fund closed the week at a yield of 10.75% p.a. To invest, dial *809# or download the Cytonn App from Google Playstore here or from the Appstore here;
- Cytonn High Yield Fund closed the week at a yield of 13.75% p.a. To invest, email us at sales@cytonn.com and to withdraw the interest, dial *809# or download the Cytonn App from Google Playstore here or from the Appstore here;
- We continue to offer Wealth Management Training every Wednesday, from 9:00 am to 11:00 am, through our Cytonn Foundation. The training aims to grow financial literacy among the general public. To register for any of our Wealth Management Trainings, click here;
- If interested in our Private Wealth Management Training for your employees or investment group, please get in touch with us through wmt@cytonn.com;
- Any CHYS and CPN investors still looking to convert are welcome to consider one of the five projects currently available for assignment, click here for the latest term sheet;
- Cytonn Insurance Agency acts as an intermediary for those looking to secure their assets and loved ones’ future through insurance namely; Motor, Medical, Life, Property, WIBA, Credit and Fire and Burglary insurance covers. For assistance, get in touch with us through insuranceagency@cytonn.com;
- Cytonnaire Savings and Credit Co-operative Society Limited (SACCO) provides a savings and investments avenue to help you in your financial planning journey. To enjoy competitive investment returns, kindly get in touch with us through clientservices@cytonn.com;
Real Estate Updates:
- For an exclusive tour of Cytonn’s real estate developments, visit: Sharp Investor's Tour, and for more information, email us at sales@cytonn.com;
- Phase 3 of The Alma is now ready for occupation and the show house is open daily. To rent please email properties@cytonn.com;
- We have 8 investment-ready projects, offering attractive development and buyer targeted returns; See further details here: Summary of Investment-ready Projects;
- For Third Party Real Estate Consultancy Services, email us at rdo@cytonn.com;
- For recent news about the group, see our news section here;
Hospitality Updates:
- We currently have promotions for Staycations. Visit cysuites.com/offers for details or email us at sales@cysuites.com;
Money Markets, T-Bills Primary Auction:
During the month of January, T-bills were oversubscribed, with the overall average subscription rate coming in at 126.5%, an increase from 77.8% recorded in the month of December 2022. The average subscription rate for the 364-day, 182-day and 91-day papers increased to 42.5%, 92.3% and 422.1% from 22.8%, 33.0% and 327.4%, respectively, recorded in December 2022. The average yields on the government papers were on an upward trajectory, with the average yields on the 364-day, 181-day papers and 91-day papers increasing by 16.6 bps, 8.2 bps and 11.8 bps to 10.4%, 9.9% and 9.5%, from 10.3%, 9.8% and 9.3%, respectively recorded in December 2022. For the month of January, the government accepted a total of Kshs 119.0 bn of the Kshs 121.5 bn worth of bids received, translating to an acceptance rate of 97.9%.
During the week, T-bills remained oversubscribed, with the overall subscription rate coming in at 208.9%, up from the 142.9% recorded the previous week. Investor’s preference for the shorter 91-day paper persisted, with the paper receiving bids worth Kshs 28.7 bn against the offered Kshs 4.0 bn, translating to a subscription rate of 718.6%, up from 458.9% recorded the previous week. The significant oversubscription is partly attributable to the high yields being offered on the shorter dated papers coupled with investors seeking to avoid duration risk. The subscription rates for the 364-day and 182-day papers also increased to 105.3% and 108.5% from 56.8% and 102.6%, respectively, recorded the previous week. The government accepted bids worth Kshs 32.4 bn out of the Kshs 50.1 bn total bids received, translating to an acceptance rate of 64.7%. The yields on the government papers were on an upward trajectory, with the yields on the 364-day paper increasing by 4.6 bps to 10.6%, while 182-day and 91-day papers increasing by 4.3 bps each to 10.0% and 9.6%, respectively. The chart below compares the overall average T- bills subscription rates obtained in 2017, 2022 and 2023 Year to Date (YTD):
The January 2023 bonds were oversubscribed, with the average subscription rate coming in at 131.7%, up from 47.7% recorded in December 2022. The reopened bonds FXD1/2020/005 and FXD1/2022/015 received bids worth Kshs 41.6 bn against the offered Kshs 50.0 bn, translating to a subscription rate of 83.3% with the government accepting bids worth Kshs 31.5 bn translating to an acceptance rate of 75.7%. Their subsequent tap sale received bids worth Kshs 18.0 bn against the offered Kshs 10.0 bn, translating to an oversubscription rate of 180.2%, with the government accepting bids worth Kshs 17.6 bn translating to an acceptance rate of 97.8%. The table below provides more details on the bonds issued during the month of January 2023:
|
Cytonn Report: Treasury Bonds Issued in January 2023 |
|||||||||
|
Issue Date |
Bond Auctioned |
Effective Tenor to Maturity (Years) |
Coupon |
Amount offered (Kshs bn) |
Actual Amount Raised (Kshs bn) |
Total bids received |
Average Accepted Yield |
Subscription Rate |
Acceptance Rate |
|
16/01/2023 |
FXD1/2020/005 (re-opened) |
2.4 |
11.7% |
50.0 |
31.5 |
41.6 |
12.9% |
83.3% |
75.7% |
|
FXD1/2022/015 (re-opened) |
14.3 |
13.9% |
14.3% |
||||||
|
20/01/2023 |
FXD1/2020/005 - Tapsale |
2.4 |
11.7% |
10.0 |
17.6 |
18.0 |
12.9% |
180.2% |
97.8% |
|
FXD1/2022/015 - Tapsale |
14.3 |
13.9% |
14.2% |
||||||
|
Jan 2023 Average |
|
8.4 |
12.8% |
30.0 |
24.6 |
29.8 |
13.6% |
131.7% |
86.8% |
|
Dec 2022 Average |
|
10.6 |
13.6% |
49.3 |
21.1 |
23.6 |
13.7% |
47.7% |
86.5% |
Source: Central Bank of Kenya (CBK)
Secondary Bond Market:
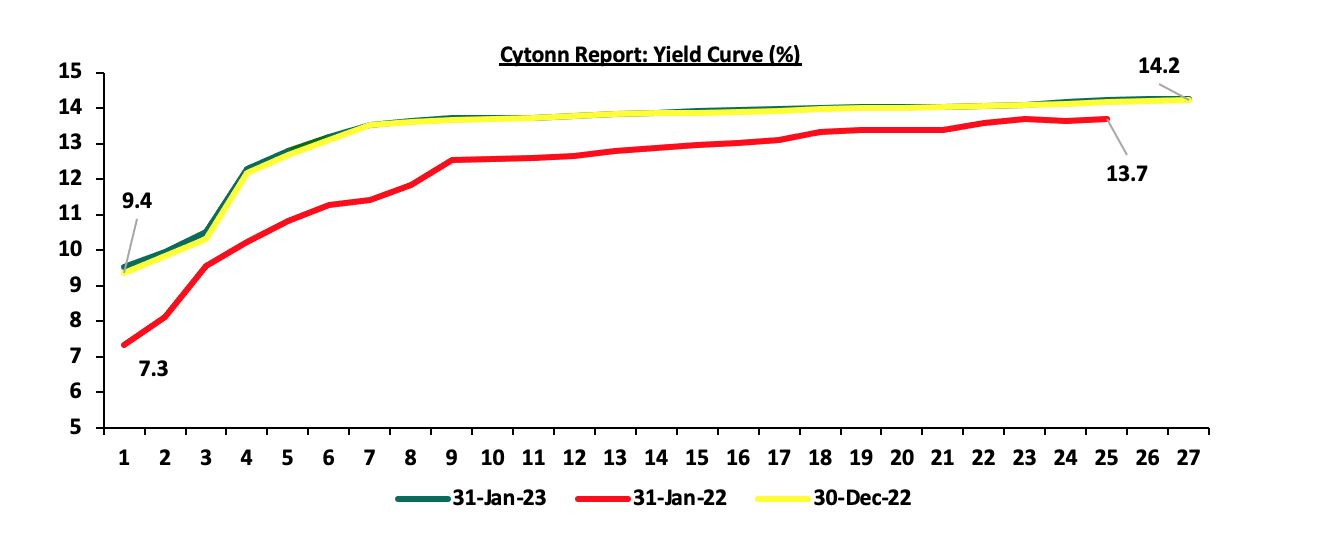
The yields on the government securities increased during the month compared to the same period in 2022 as a result of the elevated inflationary pressures leading to investors attaching higher risk premiums. The chart below shows the yield curve movement during the period:
The secondary bond turnover declined by 8.3% to Kshs 44.0 bn, from Kshs 48.0 bn recorded in December 2022, pointing towards reduced activity by commercial banks in the secondary bonds market, attributable to the higher yields in the primary bond market which are more appealing to investors as well as high coupons on newly issued bonds. On a year on year basis, the bonds turnover declined by 5.9% to Kshs 44.0 bn, from Kshs 46.8 bn worth of treasury bonds transacted over a similar period last year.
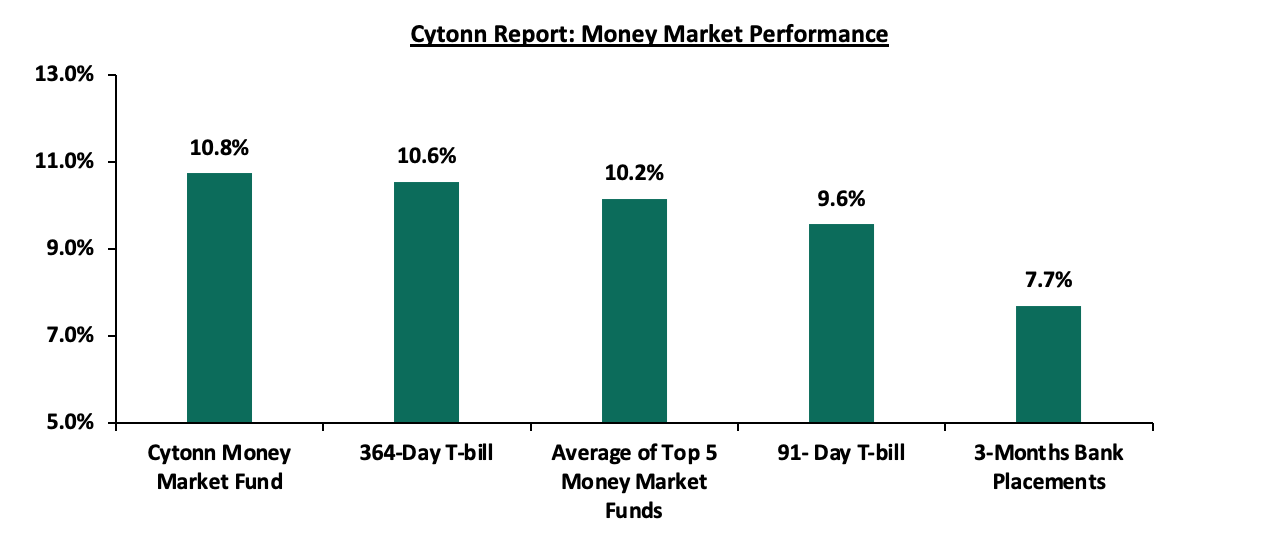
In the money markets, 3-month bank placements ended the week at 7.7% (based on what we have been offered by various banks), while the yield on the 364-day and 91-day T-bill increased by 4.6 and 4.3 bps to 10.6% and 9.6%. The average yield of the Top 5 Money Market Funds and the Cytonn Money Market Fund remained unchanged at 10.2% and 10.8%, respectively
The table below shows the Money Market Fund Yields for Kenyan Fund Managers as published on 3rd February 2023:
|
Cytonn Report: Money Market Fund Yield for Fund Managers as published on 3rd February 2023 |
||
|
Rank |
Fund Manager |
Effective Annual Rate |
|
1 |
Cytonn Money Market Fund (dial *809# or download Cytonn App) |
10.8% |
|
2 |
Apollo Money Market Fund |
10.2% |
|
3 |
GenCap Hela Imara Money Market Fund |
10.1% |
|
4 |
Zimele Money Market Fund |
9.9% |
|
5 |
NCBA Money Market Fund |
9.9% |
|
6 |
Sanlam Money Market Fund |
9.8% |
|
7 |
Kuza Money Market fund |
9.8% |
|
8 |
Nabo Africa Money Market Fund |
9.7% |
|
9 |
Old Mutual Money Market Fund |
9.7% |
|
10 |
Dry Associates Money Market Fund |
9.6% |
|
11 |
Madison Money Market Fund |
9.5% |
|
12 |
AA Kenya Shillings Fund |
9.5% |
|
13 |
Co-op Money Market Fund |
9.3% |
|
14 |
CIC Money Market Fund |
9.2% |
|
15 |
ICEA Lion Money Market Fund |
8.9% |
|
16 |
British-American Money Market Fund |
8.9% |
|
17 |
Orient Kasha Money Market Fund |
8.6% |
|
18 |
Absa Shilling Money Market Fund |
8.2% |
|
19 |
Equity Money Market Fund |
7.7% |
Source: Business Daily
Liquidity:
Liquidity in the money markets tightened in the month of January 2023, with the average interbank rate increasing to 6.0%, from 5.6%, recorded in December 2022. Also during the week, liquidity in the money markets tightened, with the average interbank rate increasing to 6.5% from 6.2% recorded the previous week, partly attributable to tax remittances that offset government payments. The average interbank volumes traded increased by 71.0% to Kshs 27.2 bn from Kshs 15.9 bn recorded the previous week.
Kenya Eurobonds:
During the month, the yields on the Eurobonds were on a downward trajectory. The yield on the 10-year Eurobond issued in 2014 recorded the largest decline, having declined by 1.7% points to 11.2% from 12.9%, recorded in December 2022 partly attributable to increased investor sentiments following International Monetary Fund (IMF) positive reviews as well as the new administration’s pledge on honoring debt payments.
During the week, the yields on Eurobonds recorded mixed performance with the yield on the 7-year Eurobond issued in 2019 recording the largest gain having gained by 0.3% points to 10.1% from 9.8%, recorded the previous week. The table below shows the summary of the performance of the Kenyan Eurobonds as of 2nd February 2023;
|
Cytonn Report: Kenya Eurobonds Performance |
||||||
|
|
2014 |
2018 |
2019 |
2021 |
||
|
Date |
10-year issue |
10-year issue |
30-year issue |
7-year issue |
12-year issue |
12-year issue |
|
Amount Issued (USD bn) |
2.0 |
1.0 |
1.0 |
2.1* |
1.0 |
|
|
Years to Maturity |
1.3 |
5.0 |
25.0 |
4.2 |
9.2 |
11.3 |
|
Yields at Issue |
6.6% |
7.3% |
8.3% |
7.0% |
7.9% |
6.2% |
|
30-Dec-22 |
12.9% |
10.5% |
10.9% |
10.9% |
10.8% |
9.9% |
|
2-Jan-23 |
12.9% |
10.5% |
10.9% |
10.9% |
10.8% |
9.9% |
|
26-Jan-23 |
10.4% |
9.7% |
10.3% |
9.8% |
10.0% |
9.4% |
|
27-Jan-23 |
10.9% |
9.8% |
10.4% |
9.8% |
10.0% |
9.4% |
|
30-Jan-23 |
11.0% |
9.9% |
10.4% |
10.0% |
10.1% |
9.5% |
|
31-Jan-23 |
11.2% |
10.1% |
10.7% |
10.4% |
10.4% |
9.8% |
|
1-Feb-23 |
11.2% |
10.2% |
10.6% |
10.5% |
10.3% |
9.8% |
|
2-Feb-23 |
10.6% |
9.9% |
10.4% |
10.1% |
10.0% |
9.5% |
|
Weekly Change |
0.2% |
0.2% |
0.1% |
0.3% |
0.0% |
0.1% |
|
MTM Change |
(1.7%) |
(0.4%) |
(0.2%) |
(0.5%) |
(0.4%) |
(0.1%) |
|
YTD Change |
(2.3%) |
(0.6%) |
(0.5%) |
(0.8%) |
(0.8%) |
(0.4%) |
|
Issue to Date Change |
4.0% |
2.6% |
2.1% |
3.1% |
2.1% |
3.3% |
*2019 aggregate amount issued for the two issues was USD 2.1 bn
Source: Central Bank of Kenya (CBK)
Kenya Shilling:
During the month, the Kenya Shilling depreciated by 0.8% against the US Dollar, to close the month at Kshs 124.4, from Kshs 123.4 recorded at the end of December 2022, partly attributable to the increased dollar demand from importers, especially oil and energy sectors against a slower supply of hard currency.
During the week, the Kenyan shilling depreciated by 0.2% against the US dollar to close the week at Kshs 124.6, from Kshs 124.4 recorded the previous week, partly attributable to increased dollar demand from importers, especially oil and energy sectors against a slower supply of hard currency. On a year to date basis, the shilling has depreciated by 0.9% against the dollar, adding to the 9.0% depreciation recorded in 2022. We expect the shilling to remain under pressure in 2023 as a result of:
- High global crude oil prices on the back of persistent supply chain bottlenecks coupled with high demand,
- An ever-present current account deficit estimated at 4.9% of GDP in 2022, despite improving by 0.3% points from 5.2% recorded in 2021,
- The need for Government debt servicing which continues to put pressure on forex reserves given that 69.3% of Kenya’s External debt was US Dollar denominated as of October 2022, and,
- A continued hike in the US Fed interest rates in 2023 to a range of 4.5% - 4.75% in February 2023 has strengthened the dollar against other currencies by causing capital outflows from other global emerging markets.
The shilling is however expected to be supported by:
- Improved diaspora remittances standing at a cumulative USD 4.0 bn for the year 2022, representing an 8.3% y/y increase from a cumulative USD 3.7 bn recorded in 2021. Notably on a m/m basis, the remittance for the month of December 2022 increased by 3.4% to USD 0.4 bn, from USD 0.3 bn recorded in November 2022.
Key to note, Kenya’s forex reserves remained relatively unchanged at USD 7.0 bn as at 2nd February 2023. As such, the country’s months of import cover remained unchanged at 3.9 months, which are marginally below the statutory requirement of maintaining at least 4.0-months of import. The chart below summarizes the evolution of Kenya months of import cover over the last 10 years
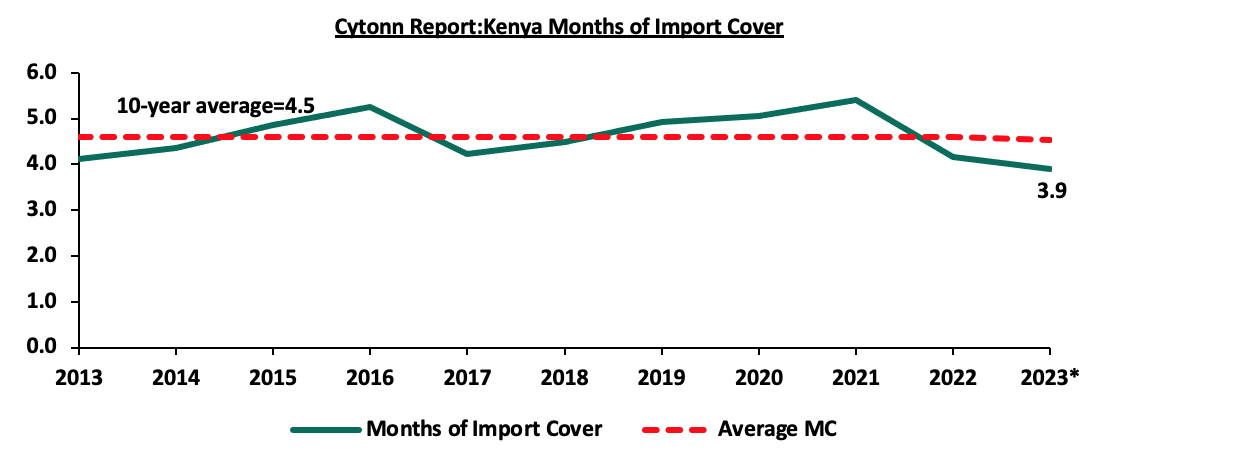
*Figure as of 2nd February 2023
Weekly Highlights:
- January 2023 Inflation
The y/y inflation in January 2023 came at 9.0%, marginally easing from the 9.1% recorded in December 2022. This was against our expectations of an increase within a range of 9.2%-9.6%, driven by an expected increase in the Housing, water Electricity, Gas and other fuel index following the increase in electricity prices. January 2023 inflation remained elevated compared to 5.4% recorded in January 2022 and above the CBKs target range of 2.5%-7.5%. The elevated annual inflation was mainly due to an increase in prices of commodities under, transport index, food and non-alcoholic beverages index, and, housing, water, electricity, gas and other fuel index. The table below shows a summary of both the year on year and month on month commodity indices performance:
|
Cytonn Report: Major Inflation Changes – January 2023 |
|||
|
Broad Commodity Group |
Price change m/m (December-2022/January-2023) |
Price change y/y (January-2022/January-2023) |
Reason |
|
Food and Non-Alcoholic Beverages |
0.2% |
12.8% |
The m/m increase was mainly driven by increase in price commodities such as tomatoes, beans and Beef. The increase was, however, mitigated by drop in prices of commodities such as mangoes, potatoes - irish, cowpeas, onions, maize grain and kales |
|
Housing, Water, Electricity, Gas and Other Fuel |
0.3% |
7.3% |
The m/m change was mainly due to increase in prices of 50 Kilowatts electricity units and 200 Kilowatts electricity units |
|
Transport cost |
0.0% |
13.1% |
The index remained unchanged as the prices of diesel and petrol remained unchanged in January 2023. |
|
Overall Inflation |
0.2% |
9.0% |
The m/m was mainly driven by 0.3% increase in Housing, Water, Electricity, Gas and Other Fuel |
Source: Kenya National Bureau of Statistics (KNBS)
Despite the slight ease in inflationary pressures, we expect the overall inflation to remain elevated in the short term but ease in the long-term as global supply constraints eases. The high inflation is mainly on the back of high fuel prices following the scaling down of the fuel subsidy and increased electricity prices due to high tariffs. With fuel and electricity being a major input in most businesses, we expect the high prices to continue elevating the cost of production and consequently leading to high commodities prices. Key to note, the full anchoring of the domestic inflationary pressures is largely pegged on how soon the global supply constrained is restored.
- January 2023 MPC Meeting
The Monetary Policy Committee (MPC) met on 30th January, 2023 to review the outcome of its previous policy decisions and recent economic developments, and to decide on the direction of the Central Bank Rate (CBR). The MPC retained the CBR rate at 8.75%, which was against our expectation of an increase by 25.0 bps to 9.0%. Below are some of the key highlights from the meeting:
- The headline inflation eased to 9.1% in December 2022 from 9.5% in November 2022 driven by softened food prices. Food inflation declined to 13.8% in December 2022 from 15.4% in November 2022, attributable to decrease in prices of maize and milk products owing to the ongoing harvests and the impact of the recent short rains, respectively. Fuel inflation during the month of December 2022 also declined to 12.7% from 13.8% in November 2022, mainly due to lower international oil prices. However, the prices of fuel remained elevated following the scaling down of the fuel subsidy and increased electricity prices due to high tariffs. We expect the overall inflation to remain elevated in the short term, however, to ease in the long-term as global supply constraints eases,
- The recently released GDP data for Q3’2022 together with leading economic indicators showed the Kenya economy registered a strong growth, recording a real GDP growth of 4.7% in Q3’2022. The growth was mainly driven by increased activities in sectors such as Wholesale and retail trade, electricity and water, and, real estate. Based on the available economic indicators, the economy is estimated to have grown by 5.6% in 2022,
- Goods export remained strong with export growing by 10.9% in 2022 compared with 11.1% in 2021. Receipts from tea and manufactured goods exports increased by 16.1% and 22.1%, respectively, attributed to increased demand from traditional markets. Additionally, imports grew by 5.8% in 2022, compared to 25.4% in 2021, the slowed growth of imports is partly attributable to drop of imports of infrastructure related equipment, mainly on the back of completed projects. Receipts from services exports rebounded significantly reflecting sustained improvement in international travel and transport. Remittances in 2022 totaled to USD 4.0, 8.3% higher than USD 3.7 bn recorded in 2021. Despite the development, the current account deficit is estimated at 4.9% of the GDP in 2022 and projected at 5.4% of GDP in 2023,
- The CBK foreign exchange reserves which currently stand at USD 7.0 bn representing a 3.9 months of import cover, continues to provide adequate cover against any short term shocks in the foreign exchange markets,
- The banking sector remained stable and resilient, with strong liquidity and capital adequacy ratios. The ratio of gross non-performing loans (NPLs) to gross loans stood at 13.3% in December 2022, compared to 13.8% in October 2022. Repayments and recoveries were noted in sectors such as, tourism, restaurant and hotels, transport and communication and manufacturing. Additionally, the banking sector asset base increased by 10.0% to Kshs 6.6 tn in 2022 from Kshs 6.0 tn at the end of 2021, attributable to banks reviewing their business models leveraging on technology and innovation, enhanced capital and liquidity buffers and continued focus on customer-centricity,
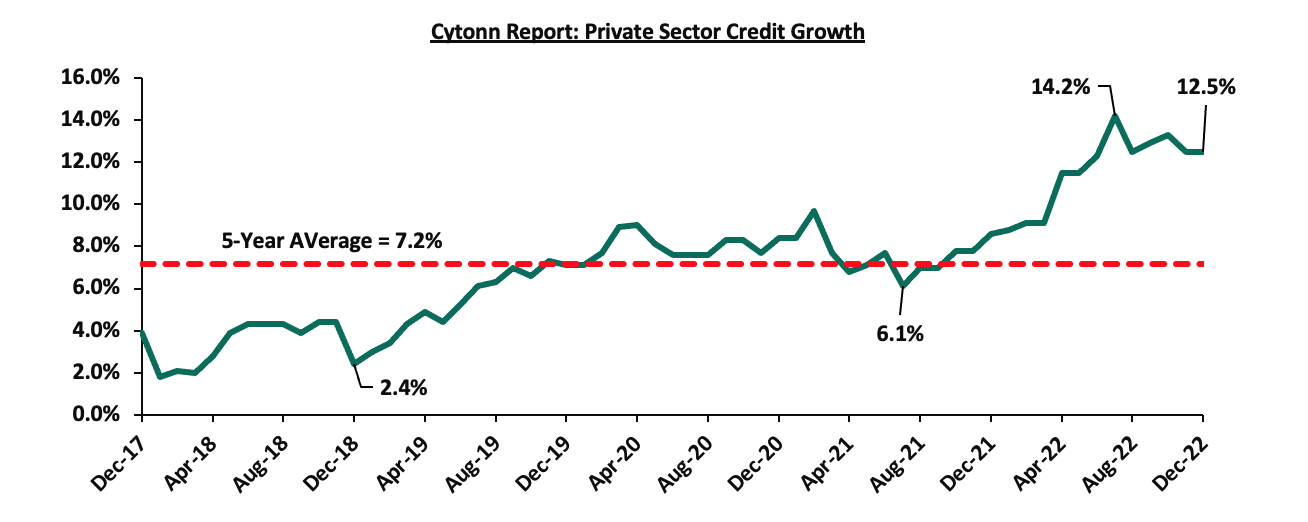
- Growth in private sector credit increased to 12.5% in 2022 compared to 8.6% in 2021, attributed to strong credit growth in sectors such as; transport and communication, manufacturing, and, business services of 23.5%, 13.8% and 13.7%, respectively. Additionally, the number of loans approval increased, reflecting improved demand with increased economic activities. The chart below shows the movement of the private sector credit growth of the last five years:
- The Committee noted the ongoing implementation of the FY2022/23 Government Budget, particularly the recent strong tax revenue collection reflecting enhanced tax administration efforts, evidenced by the revenue collections of Kshs 987.9 bn in the FY’2022/2023 as at the end of December, equivalent to 92.3% of its prorated target of Kshs 1.1 tn. The committee also noted the proposed FY2022/23 Supplementary Budget, and rationalization of expenditure which is expected to support the envisaged fiscal consolidation in the medium term.
The committee noted that, the impact of its move to tighten the monetary policy in November 2022 to anchor inflationary pressures was still in effect to the economy and therefore it concluded that the current stance on monetary policy was appropriate and decided to retain the Central Bank Rate at 8.75%. Additionally, the committee noted that the recent measures by the government to allow limited duty free imports on certain food items, such as maize, sugar and rice which are expected to moderate prices and consequently ease domestic inflationary pressures. However, we expect the inflationary pressures to remain elevated in the short term above the CBK’s ceiling of 7.5% mainly on the back of high food and fuel prices, which are key components in headline inflation index. The Committee will meet again in March 2023, but will closely monitor the impact of the policy measures as well as development in domestic and global economy and take additional measures as necessary.
- Stanbic Bank Kenya January 2023 Purchasing Manager’s Index (PMI)
During the week, Stanbic bank released its monthly Purchasing Managers Index (PMI), highlighting that the index for the month of January 2023 came in at 52.0, up from 51.6 recorded in December 2022, pointing towards a sustained improvement in the business environment for a fifth consecutive month. The improvement is largely attributable to rising demand levels, as well as improved operating conditions which boosted business confidence. This was evidenced by solid increase in new business volume which rose at the quickest pace within a year. Additionally, high sales growth was registered in sectors such as; agriculture, manufacturing, services, and, wholesale & retail, while construction was the only sector to record a decline in sales for the second consecutive month. However, many businesses continued to struggle due to the elevated inflationary pressures, higher tax burdens, as well as, the persistent depreciation of the Kenya shilling against the US dollar which continued to raise the cost of production. The chart below summarizes the evolution of PMI over the last 24 months.
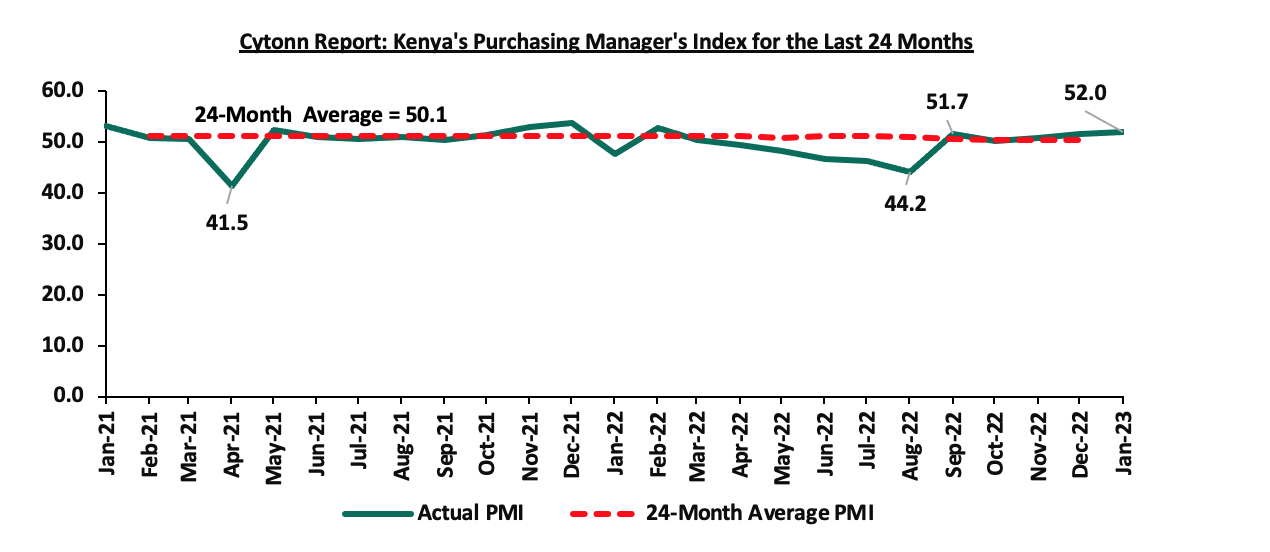
*** Key to note, a reading above 50.0 signal an improvement in business conditions, while readings below 50.0 indicate a deterioration.
Going forward, we maintain a cautious outlook in the business environment in the short-term owing to the elevated inflationary pressures, as well as the persistent depreciation of the shilling, with the shilling having depreciated by 0.9% year to date against the dollar, adding to the 9.0% depreciation recorded in 2022. Despite the inflation rate in the month of January 2023 marginally easing to 9.0%, from 9.1% recorded in December 2022, it remained above the Central Bank of Kenya (CBK) upper ceiling of 7.5%, and thus it is expected to continue to weigh down economic activities as well as hampering consumer demand. Additionally, we expect the cost of production to remain elevated following the scaling down of the fuel subsidy and increased electricity prices due to high tariffs. Consequently, this will lead to high commodities prices thus exerting pressure on consumer wallet.
Monthly Highlights:
- Stanbic Bank released its monthly Purchasing Manager’s Index (PMI), highlighting that the index for the month of December picked up to a three-month high of 51.6, from 50.9 in November 2022, pointing towards a sustained improvement in the business environment for a fourth consecutive month. The rebound in business activity in the country is linked to factors such as increase in demand, favourable weather conditions and softer price pressures as firms saw input costs increase at the slowest rate in 12 months. For more information, please see our Cytonn Weekly #01/2023,
- The National Treasury gazetted the revenue and net expenditures for the first half of FY’2022/2023, ending 30th December 2022, highlighting that the total revenue collected as at the end of December 2022 amounted to Kshs 987.9 bn, equivalent to 92.3% of the prorated estimates of Kshs 1070.8 bn. For more information, please see our Cytonn Weekly #02/2023,
- The Energy and Petroleum Regulatory Authority (EPRA) released their monthly statement on the maximum retail fuel prices in Kenya effective 15th January 2023 to 14th February 2023. Notably, fuel prices remained unchanged for the second consecutive month at Kshs 177.3, Kshs 162.0 and Kshs 145.9 per litres of Super Petrol, Diesel and Kerosene, respectively. For more information, please see our Cytonn Weekly #02/2023,
- The Kenya Revenue Authority released the draft regulations for the Excise Duty (Excisable Goods Management Systems)(Amendment) Regulations, 2023 having reviewed the previous Excise Duty (Excisable Goods Management Systems)(Amendment) Regulations, 2017, under the Excise Duty Act No. 23 of 2015, seeking to increase the stamp duty fees on various commodities. For more information, please see our Cytonn Weekly #03/2023, and,
- The National Treasury released the Draft 2023 Budget Policy Statement, projecting a 59.2% increase in tax revenue in the medium term to Kshs 4.0 tn by the end of FY’2026/27 from the Kshs 2.5 tn original FY’2022/23 budget estimates. For more information, please see our Cytonn Weekly #03/2023,
Rates in the Fixed Income market have remained relatively stable due to the relatively ample liquidity in the money market. The government is 8.5% behind its prorated borrowing target of Kshs 351.6 bn having borrowed Kshs 321.8 bn of the Kshs 581.7 bn domestic borrowing target for the FY’2022/2023. We expect sustained gradual economic recovery as evidenced by the revenue collections of Kshs 987.9 bn in the FY’2022/2023 as at the end of December, equivalent to a 46.1% of its annual target of Kshs 2.1 tn, and 92.3% of its prorated target of Kshs 1.1 tn. Despite the performance, we believe that the projected budget deficit of 6.2% is relatively ambitious given the downside risks and deteriorating business environment occasioned by high inflationary pressures. We however expect the support from the IMF and World Bank to ease the need for elevated borrowing and thus help maintain a stable interest rate environment since the government is not desperate for cash. Owing to this, our view is that investors should be biased towards short-term fixed-income securities to reduce duration risk.
Market Performance:
During the month of January, the equities market was on a downward trajectory, with NASI, NSE 20 and NSE 25 declining by 1.2%, 1.1% and 0.6%, respectively. The equities market performance was driven by losses recorded by large cap stocks such as NCBA Group, Bamburi, Safaricom and BAT of 8.8%, 7.9%, 3.1% and 2.2%, respectively. The losses were however mitigated by gains recorded by stocks such as Standard Chartered Bank of Kenya (SCBK), EABL and Co-operative Bank of 10.2%, 5.2% and 1.2%, respectively.
During the week, the equities market recorded mixed performance, with NASI and NSE 25 gaining by 2.5%, and 1.3%, respectively, while NSE 20 declined by 0.6%, taking the YTD performance to gains of 1.5% and 1.3% for NASI and NSE 25, respectively, and a decline of 0.7% for NSE 20. The equities market performance was mainly driven by gains recorded by large cap stocks such as Safaricom and EABL of 5.4% and 3.5%, respectively. The gains were however weighed down by losses recorded by large cap stocks such as NCBA Group, Diamond Trust Bank Kenya (DTB-K), Bamburi and Co-operative Bank of 4.1%, 2.6%, 1.4% and 1.2%, respectively.
Equities turnover increased by 70.1% in the month of January to USD 62.9 mn from USD 37.0 mn recorded in December 2022. Additionally, foreign investors remained net sellers, with a net selling position of USD 23.0 mn, compared to December’s net selling position of USD 13.6 mn.
During the week, equities turnover declined by 18.7% to USD 6.9 mn from USD 8.4 mn recorded the previous week taking the YTD turnover to USD 67.9 mn. Additionally, foreign investors turned net sellers, with a net selling position of USD 0.2 mn, from a net buying position of USD 0.4 mn recorded the previous week, taking the YTD net selling position to USD 23.4 mn.
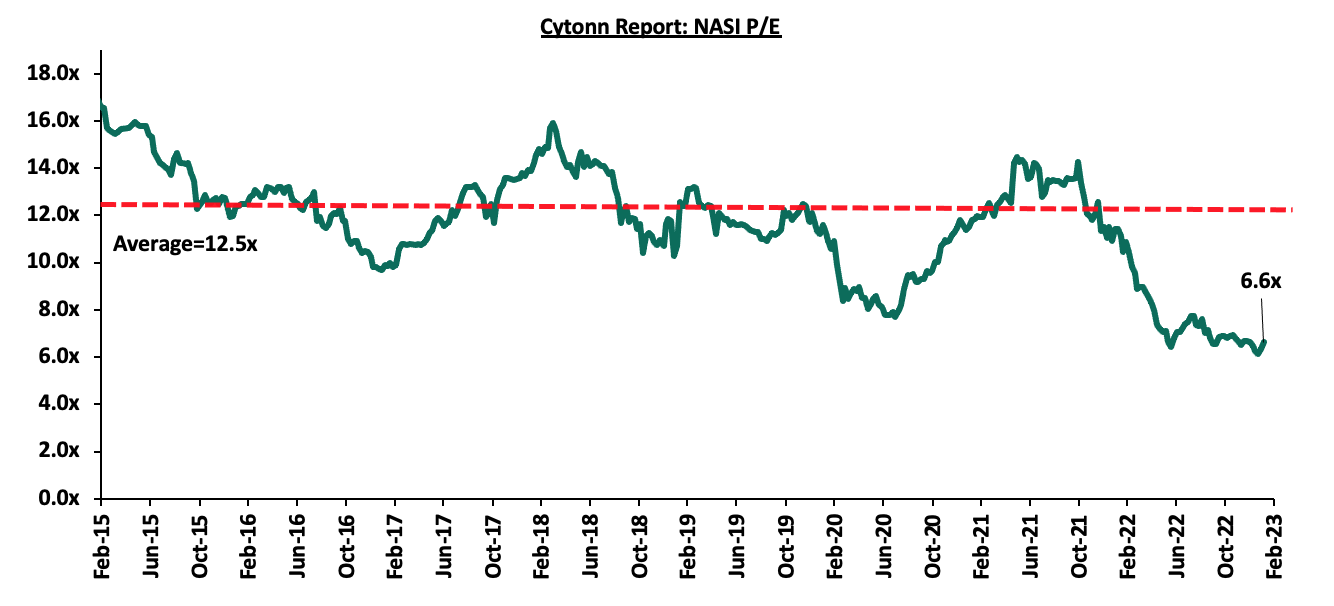
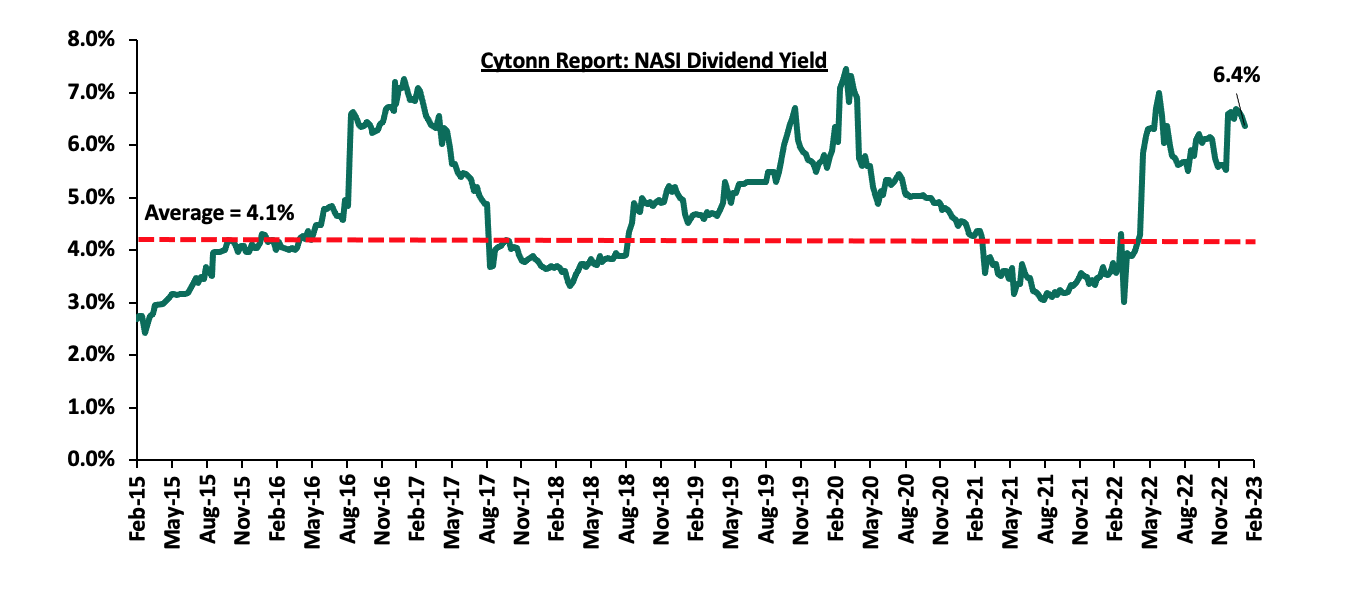
The market is currently trading at a price to earnings ratio (P/E) of 6.6x, 47.0% below the historical average of 12.5x, and a dividend yield of 6.4%, 2.3% points above the historical average of 4.1%. Key to note, NASI’s PEG ratio currently stands at 0.9x, an indication that the market is undervalued relative to its future growth. A PEG ratio greater than 1.0x indicates the market may be overvalued while a PEG ratio less than 1.0x indicates that the market is undervalued. The charts below indicate the historical P/E and dividend yields of the market;
Monthly Highlights
- Centum Investment Plc announced that it had terminated the Share Purchase Agreement (SPA) to sell its 83.4% stake in Sidian Bank Limited to Access Bank Plc. The termination was due to the lapse of time arising from expiry of the Long Stop Date and the two parties could not agree to extend the duration, as well as the set conditions between the two parties having not been met. For more information, please see our Cytonn Weekly #02/2023,
- The Insurance Regulatory Authority of Kenya (IRA) released the Quarterly Insurance Industry Report for the period ending 30th September 2022 highlighting that the industry’s profits after tax declined by 3.3% to Kshs 6.2 bn in Q3’2022, from Kshs 6.4 bn recorded in Q3’2021. For more information, please see our Cytonn Weekly #03/2023, and,
- East African Breweries Plc (EABL) released their H1’2023 financial results for the period ending 31st December 2022, recording a stagnation in the Profits After Tax (PAT) at Kshs 8.7 bn as was recorded in a similar period last year. For more information, please see our Cytonn 2023 Markets Outlook.
Weekly Highlights:
- Equity Bank Kenya Limited completes acquisition of Spire Bank Limited
During the week, Equity Group Holdings PLc, through Equity Bank Kenya Limited (EBKL) announced that it had completed the acquisition of certain assets and liabilities of the troubled local Bank, Spire Bank Limited. This comes after receiving full regulatory approvals from the Central Bank of Kenya (CBK) and the Cabinet Secretary for the National Treasury and Planning as well as approvals from Board and Shareholders of Equity Bank Kenya, Mwalimu National Sacco and Spire Bank Limited.
The completion of the acquisition follows the Assets and Liabilities Purchase Agreement, which was announced in September 2022, as highlighted in our Cytonn Weekly #37/2022. As such, Equity Bank Kenya Limited has taken over Spire Banks’s 12 branches as well as all existing depositors in Spire Bank, other than remaining deposits from its largest shareholder, Mwalimu Sacco. Additionally, Spire Bank has transferred approximately 20,000 deposit customers to Equity Bank, and 3,700 loan customers that had an outstanding loan balances reported at a net carrying value after statutory loss provisions of Kshs 0.9 bn. However, Mwalimu Sacco, the sole shareholder in Spire Bank, will pay Equity Group Holdings Plc Kshs 510.7 mn to cover the difference between the distress bank’s assets and liabilities, hence the P/Bv multiple in the transaction is inconsequential. The table below shows the combined pro-forma financials for the two banks;
|
Cytonn Report: Combined Pro-forma Balance Sheet |
|||
|
Balance Sheet |
**Equity Group |
*Spire Bank |
Combined Entity |
|
Net Loans (Kshs bn) |
673.9 |
1.7 |
675.6 |
|
Customer Deposits (Kshs bn) |
1,007.3 |
1.3 |
1,008.6 |
|
Total Assets (Kshs bn) |
1,363.7 |
3.6 |
1,371.3 |
|
Total Liabilities Kshs bn) |
1,209.7 |
2.9 |
1,212.6 |
|
No. of Branches |
337 |
12 |
349 |
**Figures for the period ended 30th September 2022, *Figures for the period ended 30th June 2022
Source: Equity Bank and Spire Bank Unaudited Financial Statements
We expect the completed acquisition to support Equity Group’s concerted efforts to champion the post COVID-19 economic recovery and resilience of individuals, communities and the continent at large. Additionally, this will support the Central Bank of Kenya’s efforts to encourage further consolidation aimed at enhancing stability of the Kenyan baking sector as well as prevent collapse of struggling baking sector players. Additionally, with the acquisition of Spire Bank Kenya, the ratio of the number of banks per 10 million populations in Kenya now stands at 6.7x, which is a reduction from 6.9x recorded in H1’2022, demonstrating continued consolidation of the banking sector, as shown in the chart below;
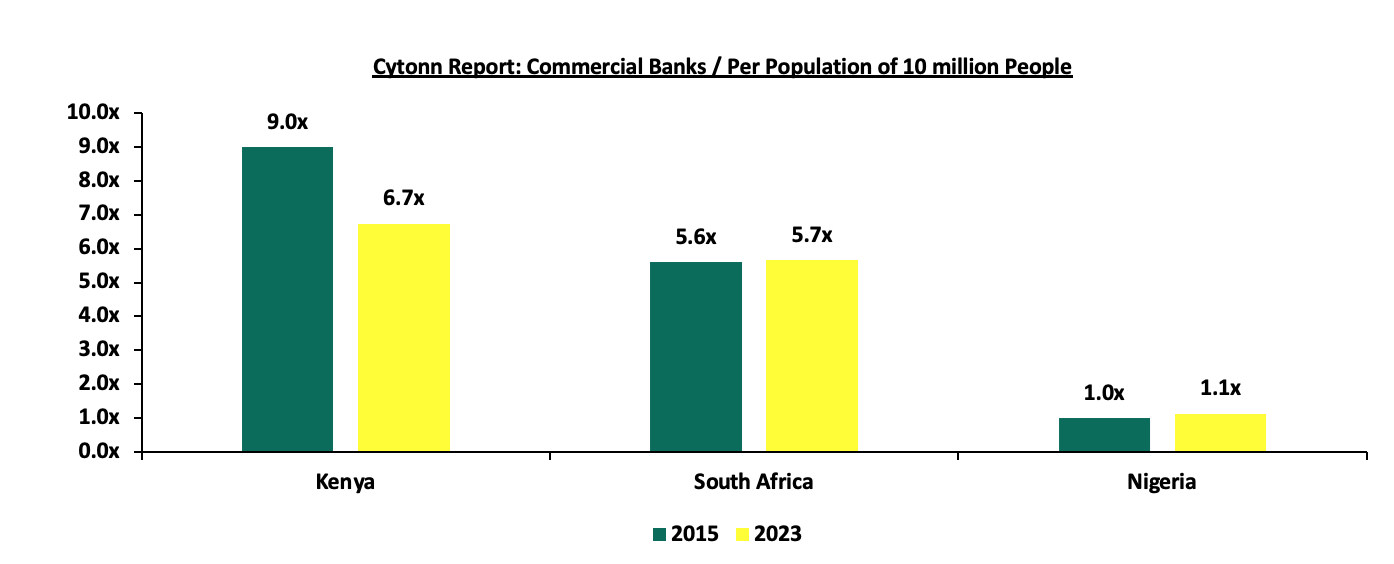
Source: World Bank, Central Bank of Kenya, South Africa Reserve Bank, Central Bank of Nigeria,
Notably, also during the week, the CBK announced that Commercial International Bank (Egypt) S.A.E (CIB) had completed acquisition of additional 49.0% shareholding of Mayfair CIB Bank Limited (MBL) by) at Kshs 5.0 bn following the earlier acquisition of 51.0% stake in MBL announced in April 2020. Consequently, MBL is now a fully owned subsidiary of CIB. Going forward, we expect to see more consolidation activities in the Kenya’s banking sector as larger banks with a sufficient capital base take over smaller and weaker banks. As such, we expect this will boost the tier 2 and tier 3 banks’ capital adequacy and liquidity ratios to the required minimum statutory levels.
Below is a summary of the deals in the last 9 years that have either happened, been announced or expected to be concluded:
|
Cytonn Report: Summary of Bank’s Acquisition Deals in Kenya |
||||||
|
Acquirer |
Bank Acquired |
Book Value at Acquisition (Kshs bn) |
Transaction Stake |
Transaction Value (Kshs bn) |
P/Bv Multiple |
Date |
|
Equity Group |
Spire Bank |
0.01 |
Undisclosed |
Undisclosed |
N/A |
Sep-22 |
|
KCB Group |
Trust Merchant Bank |
12.4 |
85.0% |
15.7 |
1.5x |
Aug-22 |
|
Access Bank PLC |
Sidian Bank |
4.1 |
83.4% |
4.3 |
1.1x |
June-22* |
|
KCB Group |
Banque Populaire du Rwanda |
5.3 |
100.0% |
5.6 |
1.1x |
Aug-21 |
|
I&M Holdings PLC |
Orient Bank Limited Uganda |
3.3 |
90.0% |
3.6 |
1.1x |
Apr-21 |
|
KCB Group** |
ABC Tanzania |
Unknown |
100.0% |
0.8 |
0.4x |
Nov-20* |
|
Co-operative Bank |
Jamii Bora Bank |
3.4 |
90.0% |
1 |
0.3x |
Aug-20 |
|
Commercial International Bank |
Mayfair Bank Limited |
4.3 |
100.0% |
Undisclosed |
N/D |
May-20* |
|
Access Bank PLC (Nigeria) |
Transnational Bank PLC. |
1.9 |
100.0% |
1.4 |
0.7x |
Feb-20* |
|
Equity Group ** |
Banque Commerciale Du Congo |
8.9 |
66.5% |
10.3 |
1.2x |
Nov-19* |
|
KCB Group |
National Bank of Kenya |
7.0 |
100.0% |
6.6 |
0.9x |
Sep-19 |
|
CBA Group |
NIC Group |
33.5 |
53% : 47% |
23 |
0.7x |
Sep-19 |
|
Oiko Credit |
Credit Bank |
3.0 |
22.8% |
1 |
1.5x |
Aug-19 |
|
CBA Group** |
Jamii Bora Bank |
3.4 |
100.0% |
1.4 |
0.4x |
Jan-19 |
|
AfricInvest Azure |
Prime Bank |
21.2 |
24.2% |
5.1 |
1.0x |
Jan-18 |
|
KCB Group |
Imperial Bank |
Unknown |
Undisclosed |
Undisclosed |
N/A |
Dec-18 |
|
SBM Bank Kenya |
Chase Bank Ltd |
Unknown |
75.0% |
Undisclosed |
N/A |
Aug-18 |
|
DTBK |
Habib Bank Kenya |
2.4 |
100.0% |
1.8 |
0.8x |
Mar-17 |
|
SBM Holdings |
Fidelity Commercial Bank |
1.8 |
100.0% |
2.8 |
1.6x |
Nov-16 |
|
M Bank |
Oriental Commercial Bank |
1.8 |
51.0% |
1.3 |
1.4x |
Jun-16 |
|
I&M Holdings |
Giro Commercial Bank |
3.0 |
100.0% |
5 |
1.7x |
Jun-16 |
|
Mwalimu SACCO |
Equatorial Commercial Bank |
1.2 |
75.0% |
2.6 |
2.3x |
Mar-15 |
|
Centum |
K-Rep Bank |
2.1 |
66.0% |
2.5 |
1.8x |
Jul-14 |
|
GT Bank |
Fina Bank Group |
3.9 |
70.0% |
8.6 |
3.2x |
Nov-13 |
|
Average |
|
|
78.9% |
|
1.2x |
|
|
* Announcement Date ** Deals that were dropped |
||||||
- NSE amends trading rules to allow block trades
During the week, the Nairobi Securities Exchange (NSE) amended the trading rules for equity securities to allow for block trades, aimed at boosting liquidity in the bourse, after receiving approval from the Capital Markets Authority (CMA). Generally, a block trade is a big purchase or sale of shares, option contracts or bonds, usually negotiated privately outside the public markets, as this reduces the impact of such huge transactions on the price of the security being traded. Block trades will constitute the sale of shares whose total value exceeds Kshs 3.0 bn in value and constitute 5.0% or more of an issuer’s total issued shares, but subject to a maximum of 25.0% of the issuer’s total number of shares. Additionally, if the block trade is less than Kshs 3.0 bn in value, it should constitute more than 15.0% of the issuer’s total issued shares but subject to the maximum of 25.0%.
The amendment, which was added to the other Boards in the Automated Trading System (ATS) within the Trading Rules for equity securities regulations approved in October 2019, is anchored on the fact that large transactions in the bourse may require other than the existing provision that guide price movement as well as require real time reporting of such huge transactions in order to maintain market transparency.
Additionally, block transaction trades shall be:
- Concluded within a 30.0% range based on the average security’s price for the last one month, from the date of the execution, leading to the processing of the transaction by the NSE within 24 hours,
- However, if the transaction is made outside the 30.0% range, the trading parties will be required to seek approval from the NSE before the execution of the transaction,
- Reported as off market transactions, not affecting the market statistics with the exemption of the total equities market turnover, and,
- If the parties agree to settle the transaction without the transfer of funds (Free of Payment), such a consent shall be filed with the Central Depository Securities Commission (CDSC) for action before the transaction is concluded.
In our view, we commend the move by both the NSE and the CMA to allow bigger transactions at the bourse as this will boost activity in the equities market by increasing its turnover as well as minimize volatility of the stocks’ prices. The introduction of the new provision will also ensure a more flexible pricing option, allowing for a bigger 30.0% price range based on one-month price average. This will drive more liquidity since this will be higher than the current 2.0% above the prevailing best bid price of the affected security in the normal board or the previous average price, whichever is higher. Additionally, with the recent launch of fractional investing in November 2022 to allow purchase of portions of shares, we expect these efforts by the CMA to enhance trading at the NSE. However, we note that the equities market has continued to suffer from a decline in its equities turnover, with the equities turnover declining by 36.5% in 2022, attributable to reduced foreign participation following foreign investor outflows following interest hikes in advanced economies, as well as concerns on macroeconomic deterioration.
Universe of coverage:
|
Company |
Price as at 27/01/2023 |
Price as at 03/02/2023 |
w/w change |
m/m change |
YTD Change |
Year Open 2022 |
Target Price* |
Dividend Yield |
Upside/ Downside** |
P/TBv Multiple |
Recommendation |
|
Jubilee Holdings |
194.3 |
185.8 |
(4.4%) |
(8.2%) |
(6.5%) |
198.8 |
305.9 |
0.5% |
65.2% |
0.3x |
Buy |
|
Kenya Reinsurance |
1.8 |
1.8 |
(1.7%) |
(2.2%) |
(5.3%) |
1.9 |
2.5 |
5.6% |
47.5% |
0.1x |
Buy |
|
Liberty Holdings |
4.8 |
4.6 |
(4.2%) |
(18.9%) |
(8.7%) |
5.0 |
6.8 |
0.0% |
46.7% |
0.3x |
Buy |
|
KCB Group*** |
38.5 |
38.2 |
(0.8%) |
0.0% |
(0.4%) |
38.4 |
52.5 |
7.9% |
45.3% |
0.6x |
Buy |
|
Sanlam |
8.3 |
8.3 |
0.0% |
(12.9%) |
(12.9%) |
9.6 |
11.9 |
0.0% |
42.8% |
0.9x |
Buy |
|
Britam |
5.2 |
5.1 |
(2.7%) |
(2.3%) |
(1.9%) |
5.2 |
7.1 |
0.0% |
39.6% |
0.8x |
Buy |
|
ABSA Bank*** |
12.5 |
12.4 |
(0.4%) |
0.8% |
1.6% |
12.2 |
15.5 |
12.1% |
36.7% |
1.0x |
Buy |
|
NCBA*** |
37.0 |
35.5 |
(4.1%) |
(8.8%) |
(8.9%) |
39.0 |
43.4 |
12.0% |
34.2% |
0.8x |
Buy |
|
Equity Group*** |
45.4 |
45.8 |
0.9% |
(1.1%) |
1.7% |
45.1 |
58.4 |
6.6% |
34.0% |
1.1x |
Buy |
|
Co-op Bank*** |
12.6 |
12.5 |
(1.2%) |
1.2% |
2.9% |
12.1 |
15.5 |
8.0% |
32.3% |
0.7x |
Buy |
|
I&M Group*** |
17.0 |
17.2 |
0.9% |
0.0% |
0.6% |
17.1 |
20.8 |
8.7% |
30.1% |
0.4x |
Buy |
|
Diamond Trust Bank*** |
51.3 |
49.9 |
(2.6%) |
0.0% |
0.1% |
49.9 |
57.1 |
6.0% |
20.5% |
0.2x |
Buy |
|
CIC Group |
1.9 |
2.0 |
5.8% |
(2.1%) |
4.7% |
1.9 |
2.3 |
0.0% |
16.0% |
0.7x |
Accumulate |
|
Stanbic Holdings |
112.0 |
110.8 |
(1.1%) |
7.8% |
8.6% |
102.0 |
112.0 |
8.1% |
9.3% |
1.0x |
Hold |
|
Standard Chartered*** |
157.0 |
158.0 |
0.6% |
10.2% |
9.0% |
145.0 |
166.3 |
3.8% |
9.0% |
1.1x |
Hold |
|
HF Group |
3.3 |
3.2 |
(1.2%) |
4.1% |
2.9% |
3.2 |
3.4 |
0.0% |
5.9% |
0.2x |
Hold |
|
Target Price as per Cytonn Analyst estimates **Upside/ (Downside) is adjusted for Dividend Yield ***For Disclosure, these are stocks in which Cytonn and/or its affiliates are invested in |
|||||||||||
We are “Neutral” on the Equities markets in the short term due to the current adverse operating environment and huge foreign investor outflows, and, “Bullish” in the long term due to current cheap valuations and expected global and local economic recovery.
With the market currently trading at a discount to its future growth (PEG Ratio at 0.9x), we believe that investors should reposition towards value stocks with strong earnings growth and that are trading at discounts to their intrinsic value. We expect the current high foreign investors sell-offs to continue weighing down the economic outlook in the short term.
- Industry Reports
- Hass House and Land Price Index Q4’2022 Reports by Hass Consult
During the week, Hass Consult, a Real Estate Development and Consulting firm based in Kenya, released its House Price Index Q4’2022 Report, which reports the performance of Nairobi Metropolitan Area’s (NMA) Real Estate residential sector. The following were the key take outs:
- The average q/q selling prices for residential houses declined by 2.2% in Q4’2022 compared to a 0.8% increase in Q3’2022, while on a y/y basis, the average selling prices appreciated by 4.8% compared to a 3.1% increase that was recorded in Q4’2021. The quarterly decrease was mainly driven by drop in the selling prices of all parameters under analysis such as detached units by 1.5%, semi-detached houses by 4.3%, and apartments by 1.5%. The quarter was cited to be affected by the political transition after the August General elections which fueled uncertainty in the market coupled with global inflationary pressures, and rising interest rates following an increase in MPC rates by the Central bank of Kenya (CBK) in September and November hence hiking of mortgage costs. However, the y/y increase in performance was mainly attributed to annual price increase of detached houses by 9.4% as the sector sustained recovery from the COVID-19,
- In the Nairobi Suburbs detached and semi-detached houses, Lang’ata was the best performing node having recorded a y/y capital appreciation of 13.0% for its detached units, pointing signs to the rising demand for standalone mansions and townhouses in the region due to the region’s affordability as compared to neighboring nodes such as Karen. On the other hand, houses in Lavington recorded the highest y/y price correction of 4.6%. This was largely due to a drop in demand for townhouses and a shift of trend by clients preferring to buying and renting apartment units. In the recent years, apartments have drastically altered the housing landscape in Lavington where the region was previously dominated by detached and semi-detached homes,
- In the Nairobi Suburbs apartments, Lang’ata remained to be the best performing region recording a y/y capital appreciation of 9.0% due to i) its proximity to the city center and prime locations such as Karen, iii) strategic and attractive location near various shopping malls located in Karen such as Galleria, the Hub, Waterfront, and recreational facilities such as Nairobi National Park, iii) adequate infrastructure providing seamless access to Lang’ata via Lang’ata road, Ngong’ Road, Mombasa Road, the Southern Bypass, and the presence of Wilson Airport for air transportation. All the select factors have contributed to increasing demand for those working within and outside the area seeking convenience with regards to shopping, recreation, and logistics. On the other hand, Upperhill realized the highest y/y price correction of 10.3% attributed to; i) its transformation into a business district, leading to a shift in demand from residential to commercial properties., and, ii) city dwellers preferring to live away from the hustle and bustle of the city occasioned by huge traffic snarl-ups in the area and noise pollution leading to reduced demand for the properties,
- In the satellite towns, houses in Ngong’ recorded the highest y/y price appreciation at 21.1% driven by increased demand resulting from; i) improved infrastructure development such as the Ngong’ Road thus enhancing accessibility, ii) growing middle income population in the area enhancing demand, and, iii) proximity to prime locations such as Karen. Conversely, houses in Limuru realized the highest y/y price correction of 5.9% attributed to reduced demand owing to the region’s unfavorable location far from Nairobi CBD, other major urban business nodes, and main transportation hubs like the Jomo Kenyatta International Airport (JKIA), Standard Gauge Railway (SGR), among others,
- In satellite towns’ apartments, Mlolongo recorded the highest y/y price appreciation of 1.2% attributed to increased demand for apartments in the region with the newly constructed Nairobi Expressway enhancing proximity to the City centre increasing accessibility to the satellite town. On the other hand, Ruaka realized the highest y/y price correction of 9.4% attributed to property developments that had priced their apartments in United States Dollars revise them to Kenyan Shillings. This is on the back of the continuous devaluation of the Kenyan Shilling against the Dollar, making the properties more expensive in the local market and thereby reducing their competitiveness against other property developments priced in Kenyan Shillings and,
- The overall asking rents of housing units in the NMA slightly declined by 1.5% q/q and slightly increased by 0.3% y/y, compared to a 0.2% q/q decline recorded in Q3’2022 and 2.7% y/y growth recorded in 2021, attributed to slow growth in the general demand for rental units. Apartments recorded the highest y/y increase in asking rents of 4.5% with detached and semi-detached units realizing price corrections of 0.6% and 2.4% respectively, signaling rising demand of tenants in the low-middle and middle income earning brackets who continue to prefer renting apartments due to their affordability,
- In the Nairobi suburbs, houses in Loresho realized the highest y/y rent appreciation of 6.9%. This was attributed to; i) the affordability it presents to most tenants who want to live in areas around leafy suburbs like Spring Valley, ii) presence of sufficient amenities and infrastructure enhancing investments, and, iii) its serene environment and strategic location which is in part of Westlands. On the other hand, houses in Kileleshwa realized the highest y/y rental rates decline of 9.0% attributed to reduced demand for detached and semi-detached houses owing to new tenants shifting preference to renting apartments in the region,
- In the Nairobi Suburbs apartments, Lang’ata remained to be the best performing region recording a y/y rent appreciation of 10.3%, attributed to increased demand for the units in the region due to better amenities and the accessibility it offers. On the other hand, Upperhill continued to realize the highest y/y rent correction of 8.3% attributable to reduced demand for residential properties by city dwellers and the region attracting more commercial office investments as compared to residential,
- In the satellite towns, houses in Ngong’ recorded the highest y/y rent appreciation at 16.2%, driven by increased demand resulting from; i) improved infrastructure development such as the Ngong’ Road thus enhancing accessibility, ii) a growing middle income population in the area enhancing demand, and, iii) proximity to prime locations such as Karen. Conversely, houses in Kiambu realized the highest y/y rent correction of 6.1% attributed to reduced demand for detached and semi-detached houses owing to competition from neighboring nodes like Juja and Ruiru that offer; i) affordable rental rates, ii) better institutions, shopping and recreational amenities such as Kenyatta University, Jomo Kenyatta University of Agriculture and Technology, Zetech University, Spur Mall, Juja City Mall, Thika Road Mall, and Garden City, iii) closeness to prime locations like the upcoming Northlands City and Tatu City, and, iv) improved accessibility as they are located along Thika Superhighway, and the Eastern and Northern Bypasses, and,
- For the satellite towns’ apartments, Rongai realized the highest y/y rental rate increase by 15.3% mainly due to better accessibility facilitated by improved infrastructure development like Nairobi Expressway. On the contrary, apartments in Athi River recorded the highest y/y rental rates declines of 1.7% due to reduced demand at the back of competition from neighboring nodes such as Kitengela, Rongai, Mlolongo and Syokimau which are all located along Mombasa road but are closer to the City centre and major transportation hubs like Jomo Kenyatta International Airport (JKIA) and the SGR via the Nairobi Expressway which has significantly improved accessibility to the regions.
The findings of the report are in line with our Cytonn Q4’2022 Markets Review, highlighting that the residential market in NMA recorded improvement in performance with the average total returns to investors coming at 6.2%, a 0.1%-points increase from the 6.1% recorded in FY’2021, attributable to average rental yield of 5.1% and y/y appreciation of 1.1%. The y/y improvement in performance was majorly driven by improved selling prices and rents which came in at Kshs 119,609 and Kshs 540, respectively, from Kshs 119,494 and Kshs 508, respectively, recorded in FY’2021. The improvement in price and rental charges was mainly driven by; i) increased major infrastructural developments like the Nairobi Expressway, and Eastern, Northern and Western Bypasses that have improved accessibility of areas along the development hence higher demand, ii) an increase in property transaction volumes, and, iii) a gradual economic recovery from the COVID-19 period which saw landlords collect higher rents. However, the performance is expected to be weighed down by; i) the continuous inflationary pressures in the economy, ii) devaluation of the Kenyan currency, and, iii) increased credit risk on accessing finances for development and buying of residential properties due to rising interest rates on loans and mortgages by commercial banks.
Hass Consult also released the Land Price Index Q4’2022 Report which highlights the performance of Real Estate land sector in the Nairobi Metropolitan Area (NMA). The following were the key take outs from the report:
- The average q/q and y/y selling prices for land in the Nairobi suburbs slightly increased by 0.2% and 1.2% respectively compared to 0.4% and 1.2% growth recorded in Q4’2021. The decrease in performance was attributable to continuous reduced activities on the Real Estate market and the general economy from the previous quarter due to August General elections and political transitions creating uncertainty among investors. Consequently, the average q/q and y/y selling prices for land in the satellite towns of Nairobi increased by 1.0% and 9.0%, respectively compared to 1.4% and 6.7%, fueled by their affordability,
- Spring Valley was the best performing node in the Nairobi suburbs with a y/y price appreciation of 14.6%. This was attributed to increase in demand for land in the region owing to; i) adequate infrastructure, ii) adequate amenities such as Global Trade Centre (GTC), Sarit Centre, and Westgate Shopping Malls, and, iii) proximity to prime and rising urban nodes such as Westlands which was cited as the city’s premium entertainment and commercial hub, creating value to its neighborhoods that ease access to the region’s working zones, recreational and shopping centres. On the other hand, Upperhill recording the highest y/y price correction of 3.3%. This was due to continuous decline in demand for development land resulting from; i) the existing high oversupply of commercial spaces hence developers pausing their construction plans, ii) land in the area being the most expensive in the NMA thus hindering uptake, and, iii) general drastic shift of developers to satellite towns due to scarcity of affordable land for development in Nairobi, and,
- For satellite towns, Syokimau was the best performing node with a y/y capital appreciation of 17.5%, attributed to rising demand for development land due to increased improved infrastructure and accessibility following the launch of the Nairobi Expressway in May 2022. On the other hand, Limuru was the worst performing node with a y/y price correction of 3.0% driven by low demand for land in the area, resulting from relatively farther distance from Nairobi CBD and other business nodes.
The findings of the report are also in line with our Cytonn Q4’2022 Markets Review, which highlighted that the overall average selling prices for land in the NMA appreciated by 4.3% to Kshs 131.0 mn per acre in Q4’2022 from Kshs 130.8 mn per acre recorded in Q4’2021. This was mainly attributed to; i) better accessibility through improved infrastructure which has increased areas attractiveness to investors and developers thereby fueling demand for land, ii) proximity to amenities such as shopping malls, organizations and learning institutions, iii) improved development of infrastructure such as roads, railways, water and sewer lines, and, iv) increased construction activities particularly in the residential and infrastructural sector hence fueling demand for land development.
- Kenya Market Update H2’2022 Report by Knight Frank
During the week, Knight Frank, an international Real Estate consultancy and management firm, released the Kenya Market Update H2’2022 Report highlighting the performance of key Real Estate sectors in the country. The following were the key take outs from the report:
- In the residential sector, the average selling prices for prime housing units increased by 0.9% points to 3.8% in Q4’2022 from 2.9% recorded in Q3’2022, mainly driven by; i) rising demand for high-quality homes for high-net worth individuals, ii) growth of multinationals in the country with preference for prime residential properties, iii) entry of new high quality projects in the market such as Rosslyn Grove which has been leased by the United States Embassy in Kenya and 221-unit Mi-Vida residential development in Garden City, and, iv) peaceful electioneering period which improved the economy and the purchasing power of buyers,
- The average asking rents for prime commercial office spaces stagnated at USD 1.2 per SQFT in H2’2022 from H1’2022. However, in terms of Kenyan Shillings, the performance represented a 4.7% increase to Kshs 148.2 per SQFT in H2’2022, from Kshs 141.5 per SQFT recorded in H1’2022. The increase was mainly driven by; i) the completion of grade A office spaces which fetch prime rents, ii) continued depreciation of the Kenyan Shilling against the Dollar, iii) increased demand at the back of continued preference for quality office spaces by Internet and Communication Technology (ICT) companies, Multinational Corporations (MNCs), and Non-Governmental Organizations (NGOs). The rise in demand was evidenced by a 1.2% points increase in occupancy rates to 74.0% from 72.8% in H1’2022 with increase in absorption of the existing office spaces and further decline in release of major incoming office spaces,
- In the retail sector, the average asking rents for prime retail spaces came in at Kshs 617.5 (USD 5.0) per SQFT in H2’2022. The report highlights that most established malls had attracted an occupancy rate of above 90.0% attributed to continuous expansion of local and foreign retailers like Naivas, Quickmart, Chandarana, and Carrefour who continue to occupy vacant spaces left by retailers such as Uchumi, Nakumatt, Tuskys, Game, Shoprite, and Choppies who exited the market. New major malls were opened towards the festive season such as Broadwalk in Nairobi County, Greenwood Mall in Meru County, Kilele Mall in Murang’a County, with major upcoming malls include Business Bay Square in Nairobi County, and Promenade Mall in Mombasa County. However, there was a decline in the general supply of malls in the country with more focus on convenience centres that serve residential neighborhoods in most parts of Nairobi Metropolitan Area (NMA), and,
- The average prime industrial rents recorded a 5.0% increase to Kshs 70 per SQFT from Kshs 68 per SQFT in H1’2022 mainly attributed to; i) rapid infrastructure developments driving growth of the sector, ii) the growth of e-commerce that continue to drive the demand for storage facilities, and, iii) the easing of logistic restrictions and improved business environment in post-election period which increased investor confidence in Kenya’s industrial market.
The findings of this report are in tandem with our Annual Markets Review 2022 Report which highlighted an increase in the average selling price for residential units and an increase in the average rent per SQFT of office spaces within the Nairobi Metropolitan Area (NMA). We still maintain our view that the Real Estate sector performance will be supported mainly by; i) the positive demographic driving demand and construction for housing units, ii) increased infrastructural developments boosting accessibility, iii) the continuous aggressive growth and expansion by both local and international retailers, iv) continuous absorption of existing office spaces coupled with the expansion of various firms, and, v) rising trend of co-working office space strategy. However, rising construction of costs of housing units, limited access to finances for Real Estate projects, fast-evolving e-commerce in retail sector, and existing oversupply of approximately 6.7 mn SQFT and 3.0 mn SQFT in the NMA commercial office and retail sectors respectively, are expected to hamper the optimum performance of the Real Estate sector.
- Residential Sector
During the week, Kenya Mortgage Refinancing Company (KMRC), a state-backed mortgage refinancing company increased the limit of maximum mortgage to be issued to its clients. The table below shows the adjustments made in the size of maximum mortgage in Kenya;
|
Cytonn Report: Kenya Mortgage Refinancing Company (KMRC) limit of maximum mortgage in Kshs |
||
|
Region |
Previous limit of maximum mortgage in Kshs |
New limit of maximum mortgage in Kshs |
|
Nairobi Metropolitan Area- Nairobi County - Kiambu County - Kajiado County - Machakos County |
4.0 mn |
8.0 mn |
|
The rest of the 43 counties |
3.0 mn |
6.0 mn |
Source: Kenya Mortgage Refinancing Company (KMRC)
The move to double up the limits was attributed by rising prices of residential units amid; i) renewed demand from buyers who had slowed down acquisitions at the peak of COVID-19 economic hardship, ii) elevated price growth of key construction inputs such as steel, paint, and cement due to persistent supply chain disruptions occasioned by the Russia-Ukraine war, and, iii) the global and domestic inflationary pressures on general cost of goods and services on the back of high fuel prices, acute scarcity of the United States Dollar in the global economy, and the continuous devaluation of the Kenyan currency against the Dollar. Banks and SACCOs which are in partnership with KMRC will lend the mortgages at a rate of 9.5% which is lower than the market rate of between 11.5% and 18.8% according to the Central Bank of Kenya’s Bank Supervision Annual Report 2021. However, the Kshs 8.0 mn KMRC backed mortgage is still lower than the average maximum home loan size which stands at Kshs 9.2 mn, as at 2021. The trend of average mortgage loan size has been upward in the recent past, realizing an 10-year Compounded Annual Growth Rate (CAGR) of 5.1% to Kshs 9.2 mn from Kshs 5.6 mn as shown in the graph below;
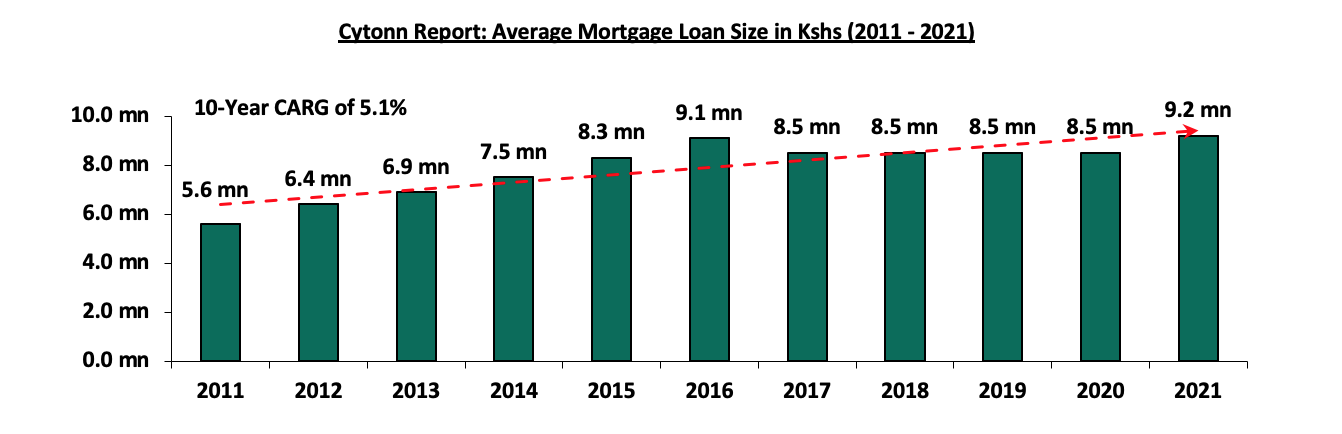
Source: Central Bank of Kenya
This growth can be attributed to the joint efforts of the government and private financial institutions in enhancing financial accessibility and providing more reasonable and flexible mortgage options. In line with the growth of mortgage loan size, the average number of loan accounts has also seen an increase, recording an 10-year CARG of 5.2%. These developments showcase a commitment towards making the mortgage process more accessible and accommodating for the general public. The graph below shows the average mortgage loan accounts from 2011 to 2021;
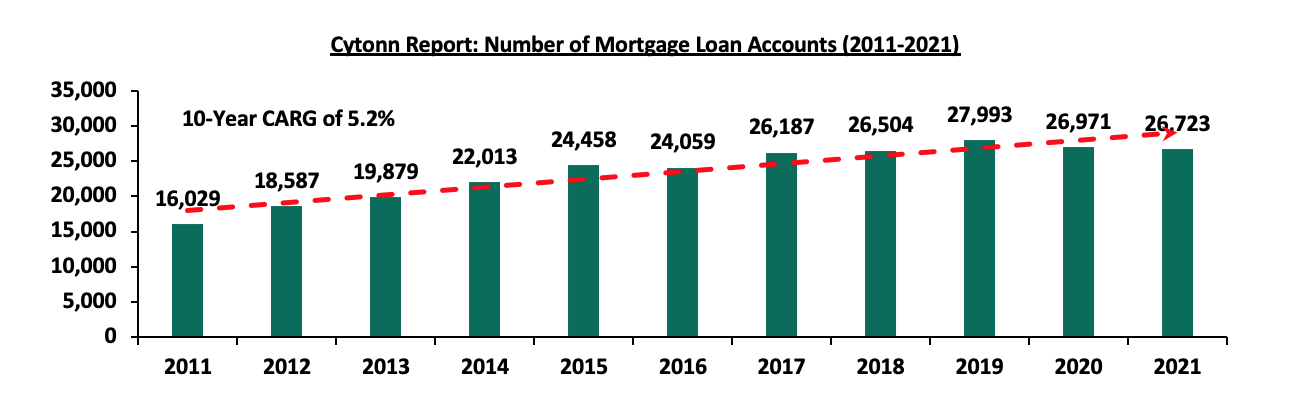
Source: Central Bank of Kenya
Additionally, KMRC increased the Loan to Value Ratio (LTV) to 105.0% from 90.0%, eliminating the previous 10.0% deposit required to be paid by a home-buyer before accessing the mortgage. KMRC noted that the 5.0% above the value of house under purchase will be used to cater for incidental costs such as legal fees and valuation. The decision will significantly reduce barriers buyers face to own houses there-by making the state-backed mortgage more affordable and lucrative in the market especially for the first time buyers within the low and middle-income class bracket.
We expect that the policy changes made by KMRC will improve its competitiveness in offering affordable mortgages in the market, thereby attracting more partners from the financial sector to widen the opportunity of offering the loans. We also expect the mortgage refinancing company to continuously modify its regulations in accordance with the fast-evolving Real Estate industry, specifically by raising its allocation to align with the average mortgage loan size of Kshs 9.2 mn and above. Consequently, the move is expected to boost homeownership for more Kenyans especially in urban centres, spark growth of mortgage uptake, and help address some of the critical challenges that have counteracted mortgage uptake in the country such as; i) increasing property prices making it difficult for low-income earners to access mortgages, ii) high interest rates and high deposit requirements, iii) low-income earning levels that cannot sustain servicing of loans, and, iv) lack of credit information for those in the informal sector hence facing exclusion from mortgage programs offered by financial institutions, and, v) high Incidental costs such as legal fee, valuation fee, and stamp duty.
Subsequently, Kenya’s mortgage to GDP continues to underperform at approximately 1.9%, compared to countries such as South Africa and Rwanda which are at approximately 16.3% and 4.2% as at 2021, respectively, as shown below;
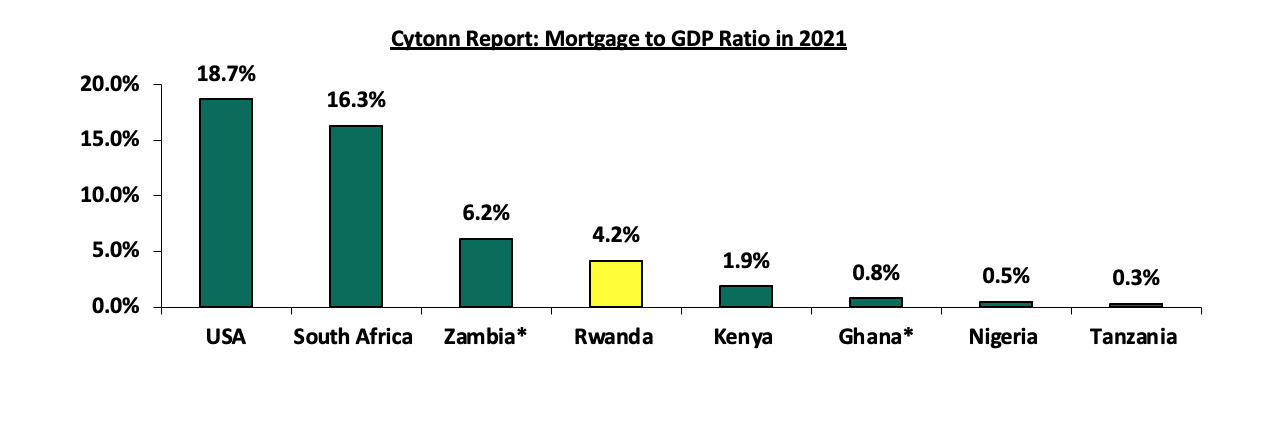
*(2020)
Source: Centre for Affordable Housing Africa
In addition, the percentage of Kenyan urban residents who own homes is relatively low at 22.0%, with the majority of the population, 78.0%, being property renters. This is in contrast to other Sub-Saharan African countries such as South Africa, Ghana, Malawi, and Nigeria where home-ownership rates are much higher at 69.7%, 52.0%, 30.0% and 25.5%, respectively as at 2022. The low home ownership rate in Kenya is majorly attributed to the high cost of purchasing residential properties and lack of affordable financing options and a standardized mechanism of accessing the finances for potential homeowners. The graph below shows homeownership percentages for different countries in comparison to Kenya in 2022;
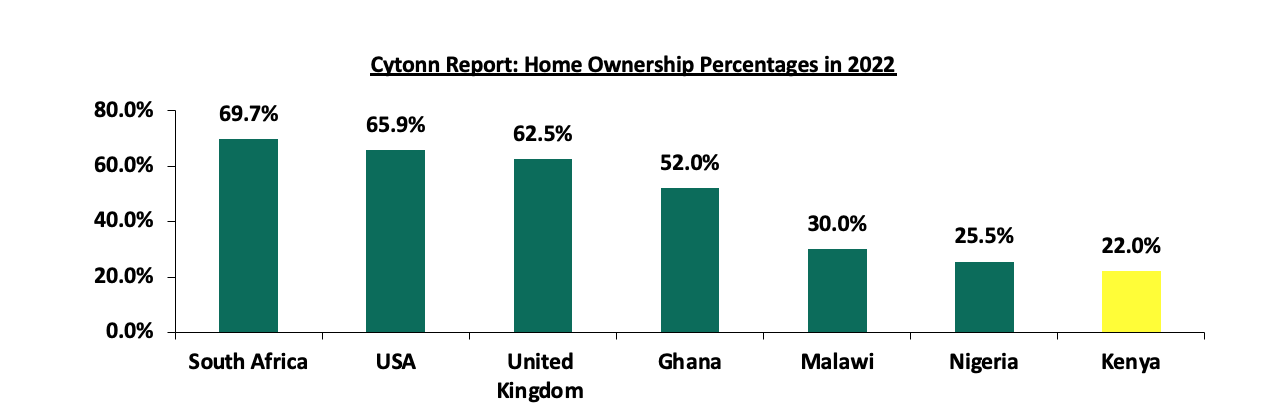
Source: US Census Bureau, UK Office for National Statistics, Centre for Affordable Housing Africa
Notable highlights during the month include;
- President William Ruto presided over the ground breaking ceremony of the Kshs 10.0 bn Shauri Moyo-A Affordable Housing Project which sits on an 8.0-acre piece of land in Shauri Moyo, Nairobi County. For more information, see Cytonn 2023 Markets Outlook,
- President Ruto oversaw the ground breaking of the Kings Boma Estate affordable housing project consisting 1,050 residential units, worth Kshs 2.8 bn, located along the Ruiru-Kiambu road in Kiambu County, nearing Kenya Prisons Staff Training College. For more information, see Cytonn Weekly #03/2023, and,
- Mwalimu National Sacco, a teachers-owned Sacco signed a partnership deal with state-owned financier, Kenya Mortgage Refinancing Company (KMRC) to provide low-cost mortgages capped at an interest rate of 9.0% to its members, 2.3% points lower than the market average of 11.3% in 2021. Additionally, Tatu City, a mixed-use satellite city development, launched a luxurious lakeside-living project dubbed ‘Kofinaf Tatu Residences’, sitting on a 200-acre piece of land within Kofinaf Estate, located in Tatu City, Kiambu County. For more information, see Cytonn Weekly #02/2023.
- Industrial Sector
During the month, Logistics firm Mitchell Cotts Freights Kenya Limited, in partnership with two other logistics firms; Perishable Movements Kenya Limited and Fresh Handing Kenya Limited, unveiled a dry cargo and cold storage facility worth Kshs 30.0 mn, within Jomo Kenyatta International Airport (JKIA). For more information, see Cytonn Weekly #02/2023.
- Statutory Reviews
During the month, the Finance Act 2022, became effective as of 1st January 2023, with the Capital Gains Tax (CGT) chargeable on net gains upon transfer of property tripling to 15.0% from the 5.0% previously chargeable. For more information, see Cytonn Weekly #01/2023.
- Real Estate Investment Trusts (REITs)
In the Nairobi Securities Exchange, ILAM Fahari I-REIT closed the week trading at an average price of Kshs 6.1 per share. The performance represented a 2.5% decline from Kshs 6.3 per share recorded the previous week, taking it to a 9.4% Year-to-Date (YTD) decline from Kshs 6.8 per share recorded on 3rd January 2023. In addition, the performance represented a 69.3% Inception-to-Date (ITD) loss from the Kshs 20.0 price. The dividend yield currently stands at 8.1%. The graph below shows Fahari I-REIT’s performance from November 2015 to 3rd February 2023;
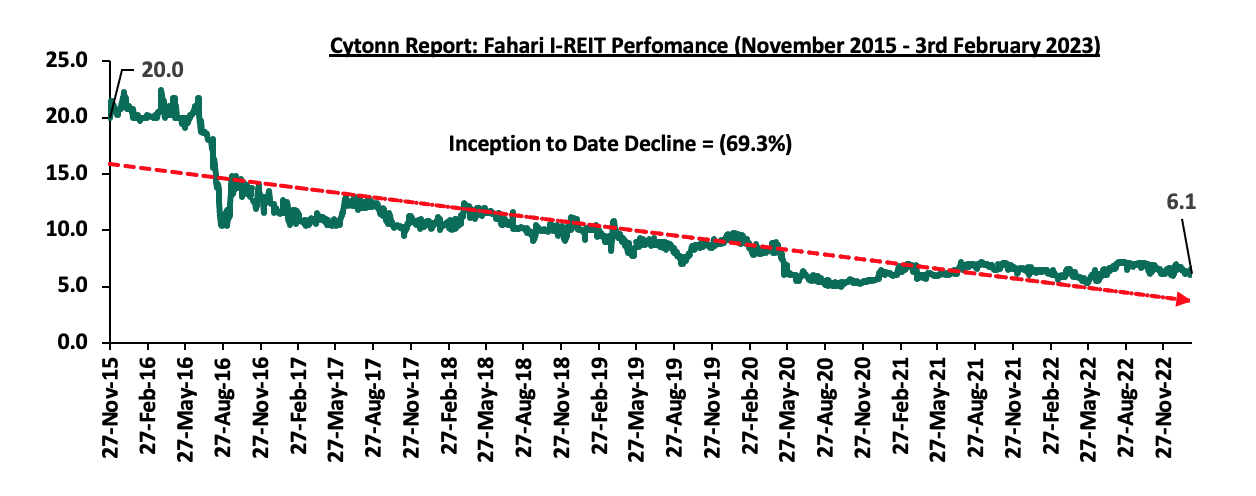
In the Unquoted Securities Platform, Acorn D-REIT and I-REIT traded at Kshs 23.9 and Kshs 20.9 per unit, respectively, as at 27th January 2023. The performance represented a 19.4% and 4.4% gain for the D-REIT and I-REIT, respectively, from the Kshs 20.0 inception price. The volumes traded for the D-REIT and I-REIT came in at 12.3 mn and 29.0 mn shares, respectively, with a turnover of Kshs 257.5 mn and Kshs 598.9 mn, respectively, since inception in February 2021.
We expect the performance of the Real Estate sector to remain on an upward trend, supported by factors such as; i) continued efforts geared to the adjustment of regulations on mortgage financing through the KMRC to align with the evolving Real Estate market, ii) the positive demographic profile of the country driving housing demand, iii) continuous partnership of the government with the private sector to focus on affordable housing, iv) progressive infrastructural development thereby opening up areas for investment, and, v) aggressive expansion by both local and international retailers in a bid to maintain market dominance. However, factors such as; i) increased construction costs on the back of high global and domestic inflation, ii) constrained financing to developers on the back of rising lending rates, coupled with underdeveloped capital markets, iii) prevailing oversupply of physical space in select sectors, and, iv) low investor appetite in Real Estate Investments Trusts (REITs) are expected to continue subduing the performance of the sector.
Unit Trust Funds (UTFs) are Collective Investment Schemes that pool funds from different investors and are managed by professional fund managers. The fund managers invest the pooled funds in a portfolio of securities such as equity stocks, bonds or any authorized financial securities, with the aim of generating returns to meet the specific objectives of the fund. Following the release of the Capital Markets Authority (CMA) Quarterly Statistical Bulletin-Q4’2022, we analyze the performance of Unit Trust Funds, whose total Assets Under Management (AUM) have been steadily increasing, being among the most popular investment options in the Kenyan market. We will further analyze the performance of Money Market Funds, a product under Unit Trust Funds.
In our previous focus on Unit Trust Funds, we looked at the Q2’2022 Unit Trust Funds Performance by Fund Managers, where we highlighted that their AUM stood at Kshs 145.8 bn, a 3.6% increase from Kshs 140.7 bn recorded in Q1’2022. In this topical, we focus on the Q3’2022 performance of Unit Trust Funds where we shall analyze the following:
- Performance of the Unit Trust Funds Industry,
- Spread of Investments,
- Performance of Money Market Funds,
- Comparing Unit Trust Funds AUM Growth with other Markets, and,
- Recommendations
Section I: Performance of the Unit Trust Funds Industry
Unit Trust Funds are investment schemes that pool funds from investors and are managed by professional Fund Managers. The fund manager invests the pooled funds with the aim of generating returns in line with the specific objectives of the fund. The Unit Trust Funds earn returns in the form of dividends, interest income, rent and/or capital gains depending on the underlying security. The main types of Unit Trust Funds include:
- Money Market Funds – These are funds that invest in fixed income securities such as fixed deposits, treasury bills and bonds, commercial papers, etc. They are very liquid, have stable returns, and, they are suitable for risk averse investors,
- Equity Funds – These are funds which largely invest in listed securities and seek to offer superior returns over the medium to long-term by maximizing capital gains and dividend income. The funds invest in various sectors to reduce concentration risk and maintain some portion of the fund’s cash in liquid fixed income investments to maintain liquidity and pay investors if need be without losing value,
- Balanced Funds – These are funds whose investments are diversified across the Equities and the Fixed Income market. Balanced Funds offer investors long-term growth as well as reasonable levels of stability of income,
- Fixed Income Funds – These are funds which invest in interest-bearing securities, which include treasury bills, treasury bonds, preference shares, corporate bonds, loan stock, approved securities, notes and liquid assets consistent with the portfolio’s investment objective, and,
- Sector Specific Funds – These are funds that invest primarily in a particular sector or industry. The funds provide a greater measure of diversification within a given sector than may be otherwise possible for the other funds. They are specifically approved by the capital Markets Authority as they are not invested as per the set rules and regulations.
As per the Capital Markets Authority (CMA) Quarterly Statistical Bulletin-Q4’2022, the industry’s overall Assets under Management (AUM) grew by 7.0% on a quarter on quarter basis to Kshs 155.9 bn as at the end of Q3’2022 from Kshs 145.8 bn recorded in Q2’2022. Similarly, on a y/y basis, the total AUM increased by 23.7% to Kshs 155.9 bn as at the end of Q3’2022, from Kshs 126.0 bn as at the end of Q3’2021. Key to note, Assets under Management of the Unit Trust Funds have registered an upward trajectory over the last five years, growing at a 5-year CAGR of 22.7% to Kshs 155.9 bn in Q3’2022, from Kshs 56.0 bn recorded in Q3’2017. The chart below shows the growth in Unit Trust Funds’ AUM;
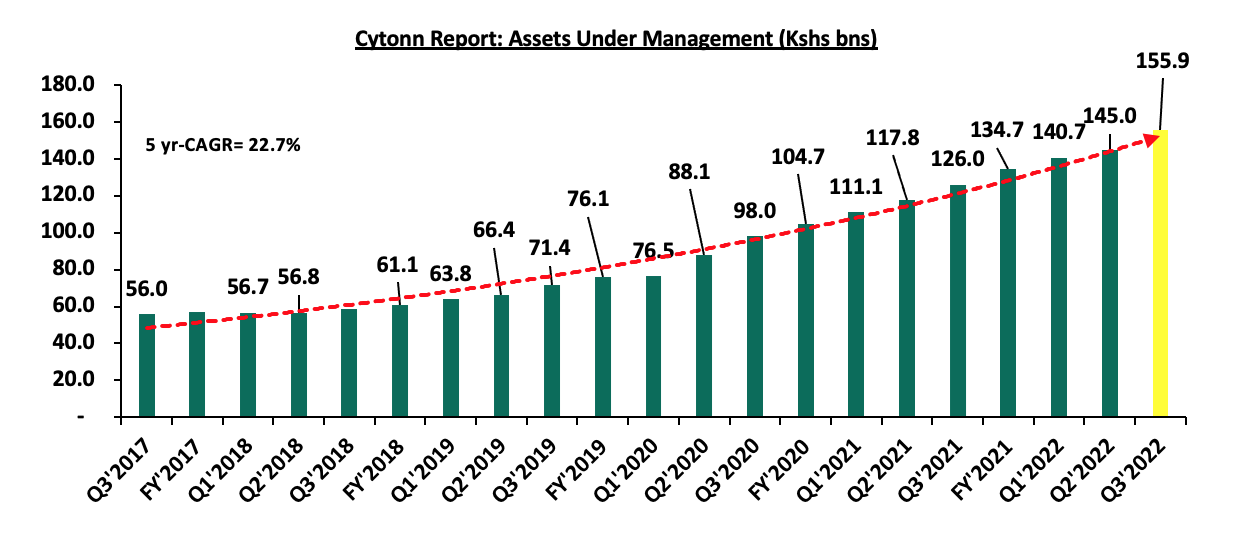
Source: Capital Markets Authority Quarterly Statistical bulletins
The growth can be largely attributed to:
- Low Investments minimums: Majority of the Unit Trust Funds Collective Investment Schemes’ (CIS) in the market require a relatively low initial investment ranging between Kshs 100.0 - Kshs 10,000.0. This has in turn made them attractive to retail and individual investors, boosting their growth,
- Increased Investor Knowledge: There has been a drive towards investor education mainly by the fund managers on the various products offered by trust funds, which has meant that more people are aware and have a deeper understanding of the investment subject. As a result, their confidence has been boosted leading to increased uptake,
- Diversified product offering: Unit Trust Funds are also advantageous in terms of providing investors with access to a wider range of investment securities through pooling of funds. This allows investors the opportunity of diversifying their portfolios which would have not been accessible if they invested on their own,
- Efficiency and ease of access to cash/High Liquidity: Funds invested in UTFs are invested as portfolios with different assets and the fund managers always maintain a cash buffer. Unit trusts are highly liquid, as it is easy to sell and buy units without depending on demand and supply at the time of investment or exit, and,
- Adoption of Fintech: Digitization and automation within the industry has enhanced liquidity, enabling investors to immediately access their investments via M-pesa withdrawals and 3 to 5 working days if they are withdrawing to their bank accounts. According to the Central Bank of Kenya, more individuals are transacting through mobile money services as evidenced by the sustained growth in the total number of registered mobile money accounts. During the period under review, registered mobile money accounts recorded a 5.9% y/y increase to 71.7 mn accounts in September 2022, from 67.7 mn accounts registered in September 2021. Notably the total number of registered mobile money accounts also grew at a 5-year CAGR of 15.1% to 71.7 mn in September 2022, from 35.5 mn recorded in September 2017. The upward trajectory is attributable to Fintech incorporation that has increased the efficiency of processing both payments and investments for fund managers. As a result, Collective Investment Schemes have become more accessible to retail investors. The graph below shows the trend of registered mobile money accounts from 2017 to 2022;
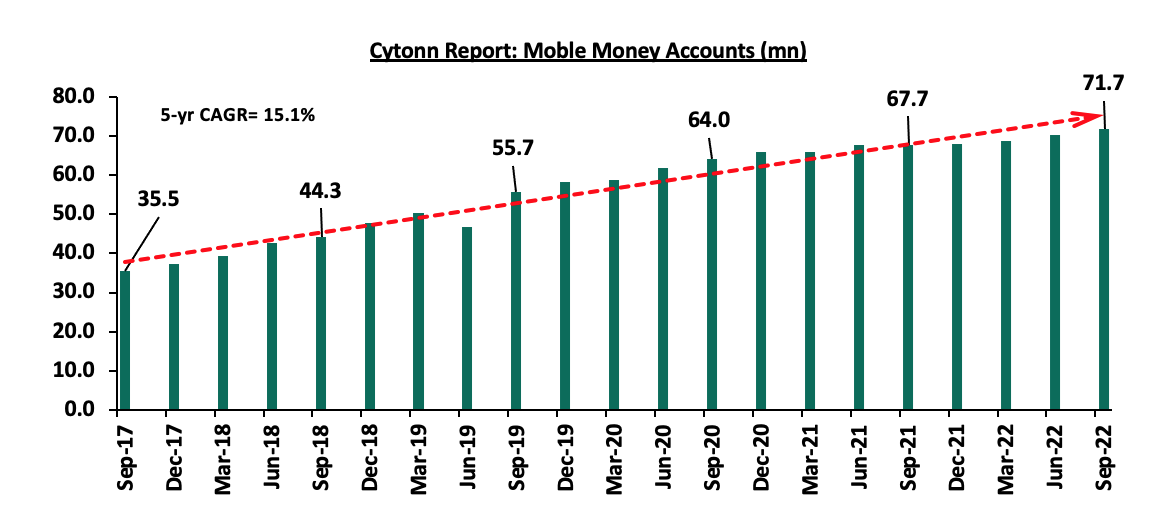
Source: CBK
According to the Capital Markets Authority, as at the end of Q3’2022, there were 32 Collective Investment Schemes (CISs) in Kenya, remaining unchanged from 32 recorded at the end of Q2’2022, but an 18.5% y/y increase from 27 recorded at the end of Q3’2021. Out of the 32, 20, equivalent to 62.5% were active while 12 (37.5%) were inactive. The table below outlines the performance of the Collective Investment Schemes comparing Q3’2022 and Q2’2022:
|
|
Cytonn Report: Assets Under Management (AUM) for the Approved Collective Investment Schemes |
|||||
|
No. |
Collective Investment Schemes |
Q2’2022 AUM |
Q2’2022 |
Q3'2022 AUM |
Q3’2022 |
AUM Growth |
|
(Kshs mns) |
Market Share |
(Kshs mns) |
Market Share |
Q2'2022 –Q3'2022 |
||
|
1 |
CIC Unit Trust Scheme |
57,126.4 |
39.2% |
60,579.0 |
38.9% |
6.0% |
|
2 |
NCBA Unit Trust Scheme |
20,152.1 |
13.8% |
23,687.8 |
15.2% |
17.5% |
|
3 |
ICEA Unit Trust Scheme |
14,317.7 |
9.8% |
14,939.0 |
9.6% |
4.3% |
|
4 |
Sanlam Unit Trust Scheme |
12,676.3 |
8.7% |
14,542.6 |
9.3% |
14.7% |
|
5 |
British American Unit Trust Scheme |
13,868.3 |
9.5% |
13,439.1 |
8.6% |
(3.1%) |
|
6 |
Old Mutual Unit Trust Scheme |
6,883.6 |
4.7% |
7,363.3 |
4.7% |
7.0% |
|
7 |
Dry Associates Unit Trust |
3,611.9 |
2.5% |
3,849.3 |
2.5% |
6.6% |
|
8 |
Coop Unit Trust Scheme |
3,725.4 |
2.6% |
3,341.6 |
2.1% |
(10.3%) |
|
9 |
Nabo Capital Ltd |
3,016.0 |
2.1% |
3,158.7 |
2.0% |
4.7% |
|
10 |
Madison Asset Unit Trust Funds |
2,734.3 |
1.9% |
2,806.8 |
1.8% |
2.7% |
|
11 |
Zimele Unit Trust Scheme |
2,297.4 |
1.6% |
2,485.3 |
1.6% |
8.2% |
|
12 |
ABSA Unit Trust Scheme |
1,048.1 |
0.7% |
1,536.3 |
1.0% |
46.6% |
|
13 |
African Alliance Kenya Unit Trust Scheme |
1,743.4 |
1.2% |
1,476.6 |
0.9% |
(15.3%) |
|
14 |
Apollo Unit Trust Scheme |
730.5 |
0.5% |
809.5 |
0.5% |
10.8% |
|
15 |
Cytonn Unit Trust Fund |
771.4 |
0.5% |
795.7 |
0.5% |
3.1% |
|
16 |
Genghis Unit Trust Funds |
575.1 |
0.4% |
626.4 |
0.4% |
8.9% |
|
17 |
Orient Collective Investment Scheme |
262.0 |
0.2% |
247.9 |
0.2% |
(5.4%) |
|
18 |
Equity Investment Bank |
199.5 |
0.1% |
189.3 |
0.1% |
(5.1%) |
|
19 |
Amana Unit Trust Funds |
27.3 |
0.0% |
27.8 |
0.0% |
1.9% |
|
20 |
Wanafunzi |
0.7 |
0.0% |
0.7 |
0.0% |
1.0% |
|
21 |
Genghis Specialized Funds |
- |
- |
- |
- |
- |
|
22 |
Standard Investments Bank |
- |
- |
- |
- |
- |
|
23 |
Diaspora Unit Trust Scheme |
- |
- |
- |
- |
- |
|
24 |
Dyer and Blair Unit Trust Scheme |
- |
- |
- |
- |
- |
|
25 |
Jaza Unit Trust Fund |
- |
- |
- |
- |
- |
|
26 |
Masaru Unit Trust Fund |
- |
- |
- |
- |
- |
|
27 |
Adam Unit Trust Fund |
- |
- |
- |
- |
- |
|
28 |
First Ethical Opportunities Fund |
- |
- |
- |
- |
- |
|
29 |
Natbank Unit Trust Scheme |
- |
- |
- |
- |
- |
|
30 |
GenAfrica Unit Trust Scheme |
- |
- |
- |
- |
- |
|
31 |
Amaka Unit Trust (Umbrella) Scheme |
- |
- |
- |
- |
- |
|
32 |
Mali Money Market Fund |
- |
- |
- |
- |
- |
|
Total |
145,767.5 |
100.0% |
155,902.6 |
100.0% |
7.0% |
|
Source: Capital Markets Authority: Quarterly Statistical Bulletin, Q4’2022, and CMA October 2022 List of Licensees
Key take outs from the above table include:
- Assets Under Management: CIC Unit Trust Scheme remained the largest overall Unit Trust Fund, with an AUM of Kshs 60.6 bn in Q3’2022, from an AUM of Kshs 57.1 bn in Q2’2022, translating to a 6.0% AUM growth,
- Growth: In terms of AUM growth, Absa Unit Trust recorded the highest growth of 46.6%, with its AUM increasing to Kshs 1.5 bn, from Kshs 1.0 bn in Q2’2022 while African Alliance Kenya recorded the largest decline with its AUM declining by 15.3% to Kshs 1.5 bn in Q3’2022, from Kshs 1.7 bn in Q2’2022,
- Market Share: CIC Unit Trust Scheme remained the largest overall Unit Trust with a market share of 38.9%, a 0.3% points decline from 39.2% achieved in Q2’2022. The decline in market share, albeit slow, is an indication of increasing competition as new collective schemes enter the market,
- 14 UTFs remained inactive during Q3’2022: GenAfrica Unit Trust Scheme, Natbank Unit Trust Scheme, First Ethical Opportunities Fund, Adam Unit Trust Fund, Masaru Unit Trust Fund, Jaza Unit Trust Fund, Dyer and Blair Unit Trust Scheme, Diaspora Unit Trust Scheme, Standard Investments Bank, Genghis Specialized Fund, Jubilee Unit Trust, Enwealth Capital Trust, Amaka Unit Trust and Mali Money Market Fund remained inactive as at the end of Q3’2022.
Key to note, Mali Money Market Fund became fully operational in November 2022 following the release of the updated terms and conditions of Mali M-pesa menu, and,
- Developments after period of review: The Capital Markets Authority approved Etica Capital and Kuza Unit Trust Schemes in November 2022.
Section II: Spread of Investments
Money Market Funds (MMFs) have gained popularity in Kenya with MMFs accounting for Kshs 121.3 bn out of the Kshs 155.9 bn managed by Collective Investments Schemes as at end of Q3’2022, equivalent to 77.8%, which is the largest share of investments allocation by the Collective Investment Schemes. Further, this translates to a 6.4% y/y increase from Kshs 114.0 bn recorded as at end of Q3’2021. The popularity of MMFs is driven by the ease in investing in terms of time and requirements, coupled with the higher returns they offer compared to the returns on bank deposits and treasury bills. The table below shows investment allocations of the different funds comparing Q3’2021 and Q3’2022:
|
Cytonn Report: Investment Allocation in Different Funds |
||||||
|
Item |
Sep-21 |
Q3'2021 Investment Share |
Jun-22 |
Q2'2022 Investment Share |
Sep-22 |
Q3'2022 Investment Share |
|
Money Market Funds |
114.0 |
90.3% |
113.9 |
78.5% |
121.3 |
77.8% |
|
Fixed Income Funds |
2.1 |
1.7% |
19.4 |
13.4% |
21.2 |
13.6% |
|
Equity Funds |
3.6 |
2.8% |
3.0 |
2.1% |
3.0 |
1.9% |
|
Other funds |
6.5 |
5.2% |
8.7 |
6.0% |
10.4 |
6.7% |
|
Total |
126.0 |
100.0% |
145.8 |
100.0% |
155.9 |
100.0% |
*All amounts in Kshs bns unless indicated otherwise
Source: CMA Q3’2022 Collective Investment Schemes Statistical bulletin
Key take outs from the table above include:
- Money Market Funds: MMFs have the largest investment allocation, coming in at 77.8% in Q3’2022, a decline from 78.5% and 90.3% allocations in Q2’2022 and Q3’2021, respectively. Despite the decline in investment allocation, the high percentage of 77.8% in Q3’2022 is an indication of its preference by majority of investors due to its ease of investing and high liquidity, coupled with high returns,
- Fixed Income Funds recorded tremendous y/y growth to Kshs 21.2 bn in Q3’2022, up from Kshs 2.1 in Q3’2021. Similarly, on a q/q basis, Fixed Income allocation increased by 9.3% to Kshs 21.2 bn, from Kshs 19.4 bn. The growth can be attributed to higher yields, following the upward readjustment of the yield curve, with investors demanding a higher premium to compensate for the perceived risks on the Kenyan economy. For the short term papers, weighted average yields for the 91-day T-bill increased by 190.0 bps to 8.6% from 6.7% recorded in Q3’2021 while both the 182-day and 364-day T-bills increased by 230.0 bps each to 9.4% and 9.9% from 7.1% and 7.6%, respectively, as recorded in Q3’2021, and,
- Equity Funds recorded dismal performance declining by 16.5% to Kshs 3.0 bn as at end of Q3’2022, from Kshs 3.6 bn as at end of Q3’2021. The decline in equity fund’s portfolio holdings is largely attributable to market movements, with the Nairobi All Share Index (NASI) registering a 23.2% YTD decline as at 30th September 2022 following increased selloffs in the Nairobi Securities Exchange.
In terms of UTFs’ distribution of investments by asset classes, the Fixed income segment had the largest share of investments, with Q3’2022 coming in at a total of Kshs 121.7 bn, equivalent to 78.1% of the total investments. Investments in Government securities constituted Kshs 58.4 bn (37.5%) while Fixed Deposits had Kshs 63.3 bn (40.6%). The concentration of investments on the fixed income assets highlights the lack of diversification of investments and the overreliance on one investment asset class. The table below shows the distribution of investments into various asset classes:
|
Cytonn Report: Q3'2022 Distribution of Investments in terms of Asset Classes (Kshs bn) |
|||||||
|
Asset Class |
Sep-21 |
Q3’2021 % |
Jun-22 |
Q2’2022 % |
Sep-22 |
Q3’2022 % |
y/y Change |
|
Government securities |
51.8 |
41.1% |
66.1 |
45.6% |
58.4 |
37.5% |
(3.6%) |
|
Fixed Deposits |
55.5 |
44.0% |
62.9 |
43.4% |
63.3 |
40.6% |
(3.4%) |
|
Nairobi Stock Exchange (NSE) Listed Securities |
8.7 |
6.9% |
6.1 |
4.2% |
19.6 |
12.6% |
5.7% |
|
Cash and Demand Deposits |
5.7 |
4.5% |
4.4 |
3.0% |
5.4 |
3.5% |
(1.1%) |
|
Other securities not listed at the NSE |
3.3 |
2.6% |
2.9 |
2.0% |
6.3 |
4.0% |
1.5% |
|
Other collective investments schemes |
0.7 |
0.6% |
1.6 |
1.1% |
1.2 |
0.8% |
0.2% |
|
Off-shore investments |
0.5 |
0.4% |
0.5 |
0.3% |
1.2 |
0.8% |
0.4% |
|
Total |
126.0 |
100.0% |
145.8 |
100.0% |
155.9 |
100.0% |
|
Source: CMA
Section III: Performance of Money Market Funds
According to the Central Bank of Kenya data, the average deposit rate increased by 20.0 bps to 6.8% in Q3’2022 from 6.6% recorded in Q2’2022. During the period under review, the 91-Day T-bill and the average deposit rate continued to offer lower yields, with the average yields for the month of September 2022 coming in at 8.9% and 6.8%, respectively, compared to September’s average MMF yield of 9.2%. Notably, the increased return on the 91-day T-bill at 8.9% comes on the back of an upward adjustment in the yield curve, with investors demanding higher compensation for the perceived risks in the country driven by high inflation and currency depreciation. The graph below shows the performance of the Money Market Fund to other short-term financial instruments:
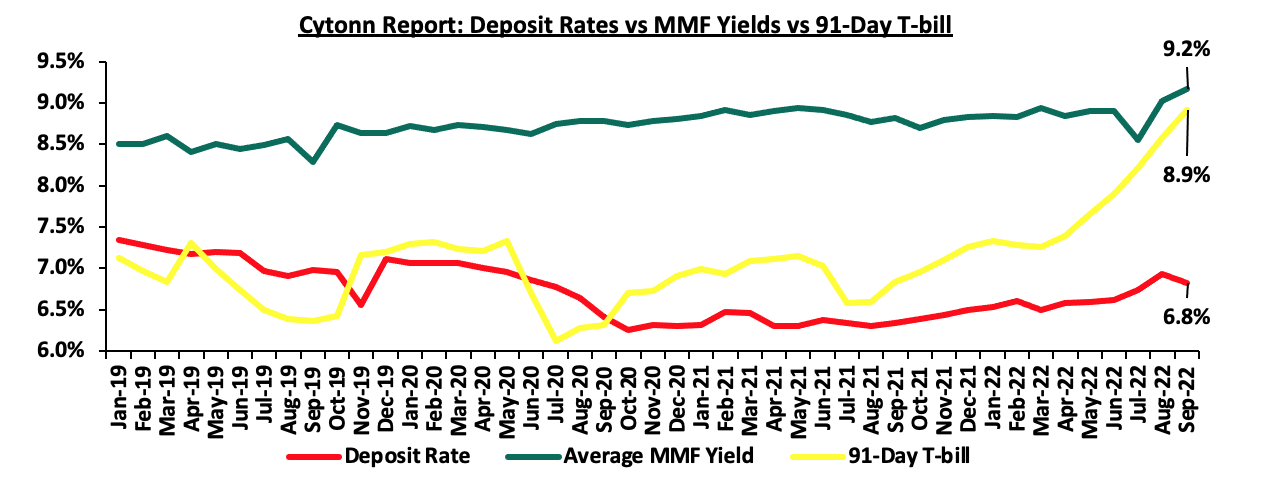
Source: Central Bank of Kenya, Cytonn Research
As per the regulations, funds in MMFs should be invested in short-term liquid interest-bearing securities with an average tenor to maturity of 18 months of less. The short-term securities include bank deposits, fixed income securities listed on the Nairobi Securities Exchange (NSE) and securities issued by the Government of Kenya. The Money Market funds are best suited for investors who require a low-risk investment that offers capital stability, liquidity, and require a high-income yield. The fund is also a good safe haven for investors who wish to switch from a higher risk portfolio to a low risk portfolio, especially in times of uncertainty.
Top Five Money Market Funds by Yields
During the quarter under review, the following Money Market Funds had the highest average effective annual yield declared, with the Cytonn Money Market Fund having the highest effective annual yield at 10.6% against the industry Q3’2022 average of 9.1%.
|
Cytonn Report: Top 5 Money Market Fund Yields in Q3'2022 |
||
|
Rank |
Money Market Fund |
Effective Annual Rate (Average Q3'2022) |
|
1 |
Cytonn Money Market Fund |
10.6% |
|
2 |
Zimele Money Market Fund |
9.9% |
|
3 |
Sanlam Money Market Fund |
9.5% |
|
4 |
Nabo Africa Money Market Fund |
9.5% |
|
5 |
Dry Associates Money Market Fund |
9.3% |
|
Average of Top 5 Money Market Funds |
9.7% |
|
|
|
Industry average |
9.1% |
Source: Cytonn Research
Section IV: Comparison between Unit Trust Funds AUM Growth and other Markets
Unit Trust Funds’ assets recorded a q/q growth of 7.0% in Q3’2022, while the listed bank deposits recorded a slower growth of 1.6% over the same period. For the Unit Trust Funds, the growth of 7.0% remained unchanged, similar to what was recorded in Q3’2021. On the other hand, for the bank deposits, the growth of 1.6% was a 1.3% points decline compared to the growth of 2.9% recorded in Q3’2021, respectively. The chart below highlights the Unit Trust Funds AUM growth vs bank deposits growth over the last five years;
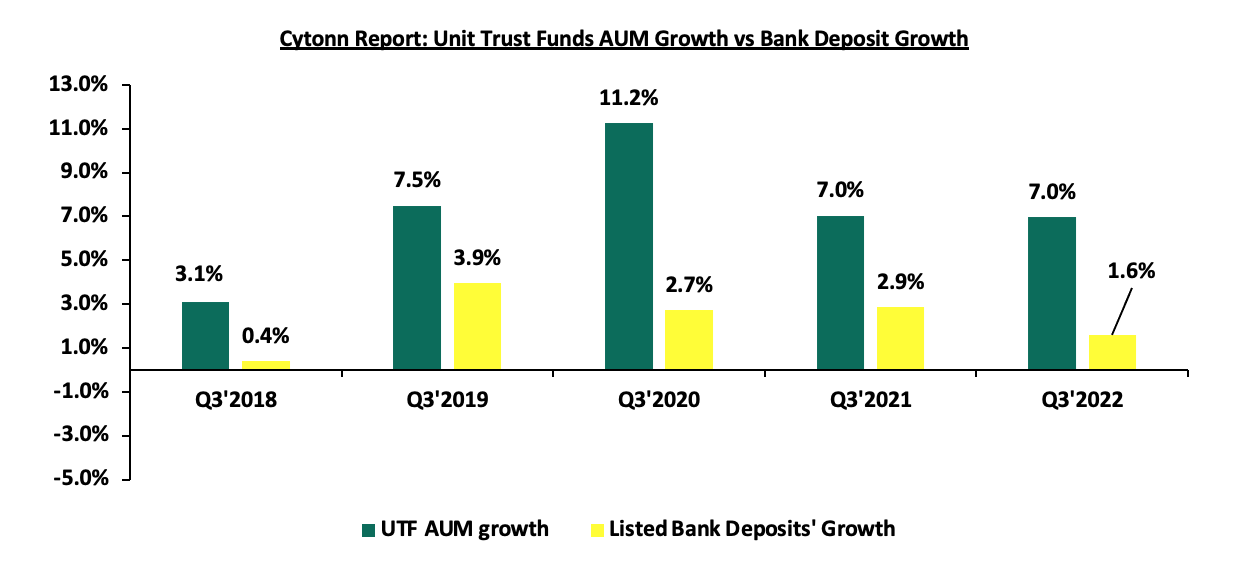
Source: Cytonn Research
The Unit Trust Funds’ (UTF) growth has outpaced the listed banking sector’s deposit growth with Q3’2022 growth coming in at 7.0% against 1.6% growth for listed banking sector’s deposit. We note that while the Unit Trust Funds’ growth has been higher as shown in the graph above, Kenya’s capital market remains constrained, driven by overreliance on the banking sector for funding. According to the World Bank data, in developed economies, businesses rely on bank funding for 40.0% of the funding; with the larger percentage of funding at 60.0% coming from the Capital markets. However, closer home, the World Bank noted that businesses in Kenya relied on banks for 99.0% of their funding while less than 1.0% comes from the capital markets, an indication of constraints in our capital markets. Notably, our Mutual Funds/UTFs to GDP ratio for Q3’2022 came in at 1.1%, similar to what was recorded as at end of Q2’2022, remaining significantly very low compared to an average of 57.3% amongst select global markets. Additionally, Sub-Saharan African countries such as South Africa and Namibia have higher mutual funds to GDP ratios of 61.5% and 43.1%, respectively as at end of 2021, compared to Kenya’s 1.1% depicting that Kenya’s UTF industry suffers from low penetration rate, driven by an underdeveloped capital market. As such, we still have room to improve and enhance our capital markets. The chart below shows some countries’ mutual funds as a percentage of GDP:
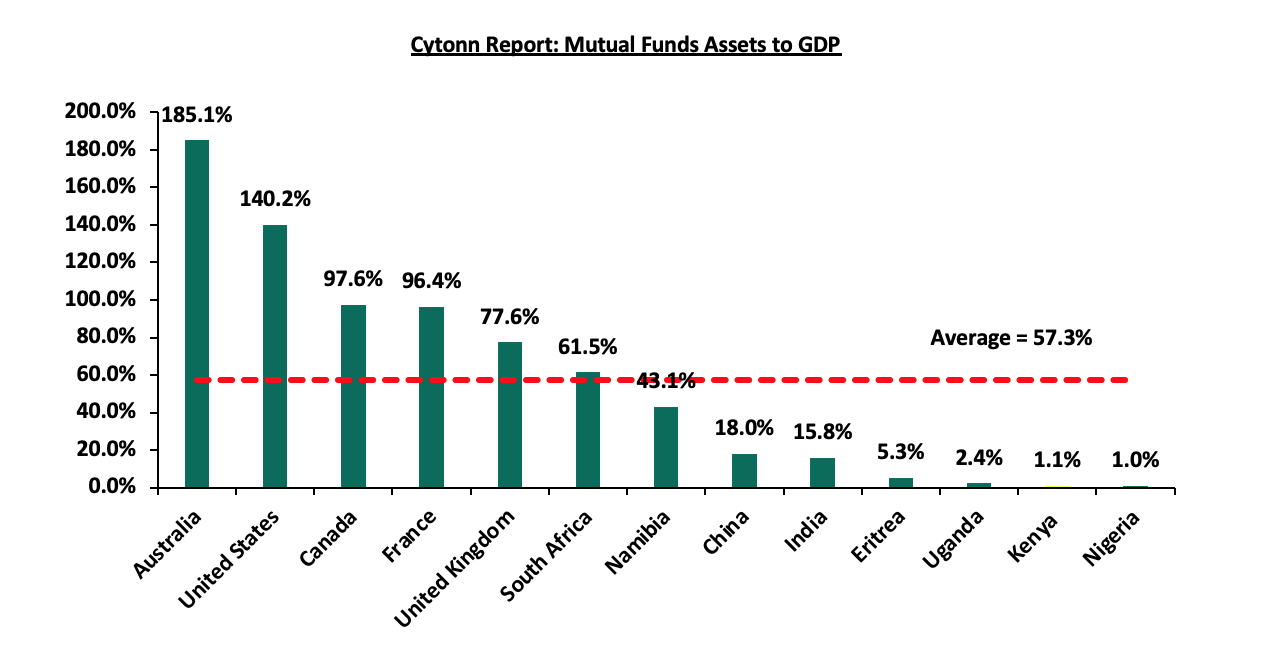
Source: World Bank Data
Over the past 5 years, Unit Trust Funds (UTFs) AUM has exhibited positive performance, with the Unit Trust Funds AUM having grown at a 5-year CAGR of 22.7% to Kshs 155.9 bn in Q3’2022, from Kshs 56.0 bn recorded in Q3’2017. However, even at Kshs 155.9 bn, the industry is overshadowed by asset gatherers such as bank deposits at Kshs 4.4 tn and the pension industry at Kshs 1.5 tn as of Q3’2022. Below is a graph showing the sizes of different saving channels and capital market products in Kenya as at September 2022;
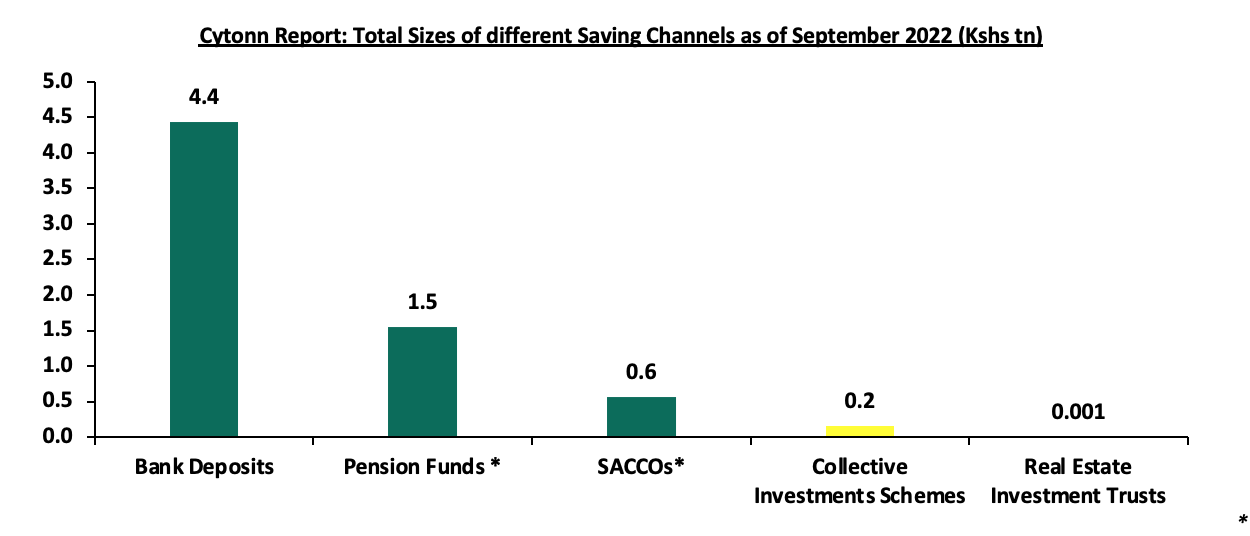
*Data as of December 2021
Source: CMA, RBA, CBK, SASRA Annual Reports and REITs Financial Statements
Comparing other Capital Markets products like REITS, Kenya still has a lot of room for improvement. The listed REITs capitalization as a percentage of total market cap in Kenya stands at a paltry 0.1%, as compared to 3.3% in the United States (US) and 1.6% in South Africa, as of 3rd February 2023. Below is a graph showing comparison of Kenya’s REITs to Market Cap Ratio to that of US and South Africa:
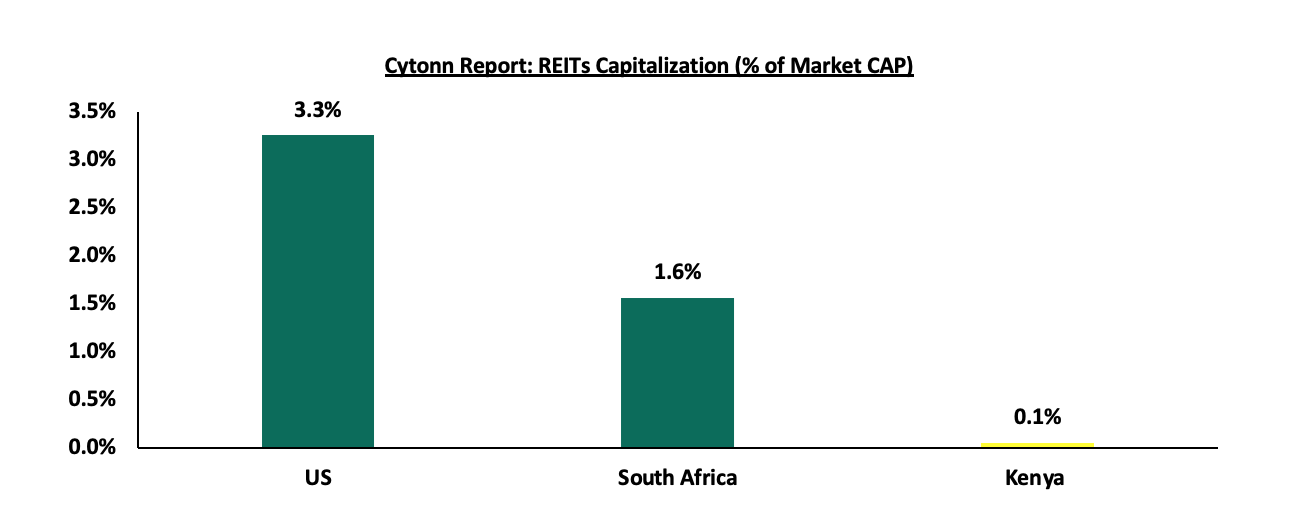
Source: Online research, Nairobi Securities Exchange (NSE)
Section V: Recommendations
Notably, we commend the Capital Markets Authority (CMA) for the gazettement of the Investment-based Crowdfunding Regulations 2022 on 30th September 2022 as the regulations now allow for proper licensing, authorizing and regulating of the all crowdfunding platforms and operators. As such, the regulations will enable crowdfunding platforms to operate within a distinguished legal framework while at the same time providing adequate security and assurance to investors. As highlighted in our Cytonn Weekly #43/2022, we note that the move will help boost investor confidence in Kenya’s capital market. Additionally, the Capital Markets Authority reduced the annual regulatory fee for crowdfunding platforms by 50.0% to Kshs 100,000.0 from the previous Kshs 200,000.0 and consequently reducing the cost of managing such platforms. The move acts as an incentive to operators within the Capital market. While the aforementioned regulations are a step in the right direction, we believe that more needs to be done to propel Unit Trust Funds (UTFs) performance in Kenya.
In order to improve our Capital Markets and stimulate UTFs growth, we recommend the following actions:
- Encourage innovation and diversification of UTFs’ investments: At the end of Q3’2022, investment in the fixed income segment constituted 78.1% of all total investments by the collective investments schemes depicting concentration risk. Notably, 40.6% of UTFs’ AUM was invested in Fixed Deposits with Commercial banks, a market that is in competition with Unit Trust Funds in terms of deposit mobilization with investments in Government Securities following at 37.5% of total Assets under Management. As a result, there is need to revisit regulations and encourage fund managers to diversify investments as well as enhance innovation of investment vehicles,
- Lower the minimum investment amounts: Currently, the minimum investment for sector specific funds is Kshs 1.0 mn, while that for Development REITS is currently at Kshs 5.0 mn. According to the Kenya National Bureau of Statistics, 42.2% of employees in the formal sector earn a monthly median gross income of Kshs 50,000.0 or less and another 45.5% earn a gross income range of Kshs 50,000.0 to Kshs 100,000.0, resulting in 87.7% of employees earning below Kshs 100,000.0 monthly. As such, the high minimum initial and top up investments amounts deter potential investors. Furthermore, these high amounts disadvantage the majority of retail investors by restricting their options for investments,
- Update regulations: The current Collective Investments Schemes Regulations in Kenya were formulated in 2001 and have not been updated since, despite the dynamic nature of the capital markets worldwide. This has led to the regulations lagging behind by not including provisions for private offers that have grown in importance over the years, as well as lack of clear special funds guidelines to cater for the sophisticated investors’ interest in regulated alternative investments products. However, while there are efforts to update the regulations, we note that they remain in progress and are yet to be completed,
- Allow for sector funds: Under the current capital markets regulations, UTFs are required to diversify. However, one has to seek special dispensation in the form of sector funds such as a financial services fund, a technology fund or a Real Estate Unit Trust Fund. Regulations allowing unit holders to invest in sector funds would go a long way in expanding the scope of unit holders interested in investing,
- Eliminate conflicts of interest in the capital markets governance and allow non-financial institutions to also serve as Trustees: The capital markets regulations should foster a governance structure that is more responsive to both market participants and market growth. In particular, restricting Trustees of Unit Trust Schemes to Banks only limits options, especially given the direct competition between the banking industry and capital markets,
- Provide Support to Fund Managers: In our opinion, the regulator, CMA needs to include market stabilization tools as part of the regulations/Act that will help Fund Managers meet fund obligations especially during times of distress like when there are a lot of withdrawals from the funds. We commend and appreciate the regulator’s role in safeguarding investor interests. However, since Fund Managers also play a significant role in the capital markets, the regulator should also protect the reputation of different fund managers in the industry. This can be done by collaborating with industry players to find solutions rather than publicly shunning and alienating industry players facing challenges as this may not be in the best interest of investors,
- Encourage different players to enter the market to increase competition: Increased competition in capital markets will not only push Unit Trust Fund managers to provide higher returns for investors but it will also eliminate conflicts of interest in markets and enhance the provision of innovative products and services, and,
- Improve fund transparency to provide more information to investors: To increase transparency for investors, each Unit Trust Fund should be required to publish their portfolio holdings on a quarterly basis and make the information available to the public. Providing more information to investors will increase accountability by enabling them to make more informed decisions, which will boost investor confidence.
In May 2022, the Capital Markets Authority (CMA) publicized the Draft Capital Markets Public Offers Listing and Disclosures Regulations 2022, meant to replace the Public Offers Listing and Disclosures Regulations 2002, which have been in effect since 2002, with the only amendments done in 2016. The Draft Regulations main objective is to create a more favorable environment in Kenya’s Capital Markets so as to encourage more listings on the Nairobi Securities Exchange. As highlighted in our Cytonn weekly#18/2022, we anticipate that more corporations and State Owned Enterprises will take advantage of this opportunity and seek capital markets funding through IPOs, which will further increase the percentage of funding for businesses provided by the Capital Markets. Additionally, In June 2022, the Capital Markets Authority (CMA) published the final draft regulations; Capital Markets (Collective Investment Schemes) Regulations 2022 and the Capital Markets (Alternative Investment Funds) Regulations 2022. Given the changes in market dynamics, the proposed regulations seek to update the current Collective Investment Scheme and Alternative Investment Funds Regulations while also addressing emerging issues.
We believe that in order to further spur the growth of UTFs in Kenya, there is a need to leverage more on innovation, digitization and product development in the capital markets given the high internet and mobile (SIM) subscription rates at 48.5 mn and 65.5 mn, respectively as at end of September 2022. Moreover, due to the high demand for innovative and convenient products by consumers in the retail money market, the use of technology as a distribution channel for mutual fund products opens up the funds to the retail segment. Furthermore, instead of restricting UTF growth and diversification, regulators should encourage and facilitate it. This will boost the development of the capital markets and encourage the entry of new players.
Disclaimer: The views expressed in this publication are those of the writers where particulars are not warranted. This publication, which is in compliance with Section 2 of the Capital Markets Authority Act Cap 485A, is meant for general information only and is not a warranty, representation, advice or solicitation of any nature. Readers are advised in all circumstances to seek the advice of a registered investment advisor.

- Talk to us
- Kenya
- P.O Box 20695 - 00200, Nairobi, Kenya
- Cell +254709101200
- Tel +254709101200
- WhatsApp +254741676635
- United States
- +254709101200
- DOWNLOAD OUR APP
-


- Kenya
- 8th Floor, Pinetree Plaza, Kaburu Drive, Ngong Road, Nairobi, Kenya
- USA
- Suite 1150, 1775 Eye Street NW, USA, Washington DC 20006, USA
- Investments
- High Yield
- Private Equity
- Real Estate
- Real Estate
- RiverRun Estates
- Cytonn Towers
- The Ridge
- Taraji Heights
- The Alma