
Cytonn Q3’ 2026 Markets Review
By research team, Oct 4, 2026
Executive Summary
Global Markets Review
According to the World Bank the global economy is projected to slow at 2.5% in 2026, from the 2.9% growth recorded in 2025. This is reflecting the impact of higher energy prices and disruptions arising from the ongoing conflict in the Middle East. The World Bank’s 2026 growth projection of 2.5% is 0.5% points lower than the 3.0% forecast by the IMF in its July 2026 World Economic Outlook Update. Notably, advanced economies are expected to record 1.5% growth in 2026, down from 1.8% in 2025, while emerging market and developing economies are projected to expand by 3.6%, down from 4.4% in 2025.
Sub-Saharan Africa Region Review
According to the World Bank, the Sub-Saharan economy is projected to grow by 4.1% in 2026, unchanged from the 4.1% growth recorded in 2025. The outlook remains constrained by rising fuel, food and fertilizer prices, which are expected to push inflation higher and weigh on household purchasing power, while tighter financial conditions continue to limit economic activity. High public debt and rising debt service costs continue to constrain fiscal space and limit governments’ ability to finance development priorities. The World Bank also notes that the ratio of external public debt service to government revenue has doubled from 9.0% in 2017 to 18.0% in 2025, highlighting the increasing pressure on debt servicing capacity.
Kenya Macro Economic Review
According to the Kenya National Bureau of Statistics (KNBS) the Q1’2026 Quarterly Gross Domestic Product Report highlighted that the Kenyan economy recorded a 5.3% growth in Q1’2026, higher than the 4.9% growth recorded in FY’2025. The main contributor to Kenyan GDP remains to be the Agriculture, Fishing and Forestry sector which grew by 4.9% in Q1’2026, lower than the 5.3% expansion recorded in Q1’2025. All sectors in Q1’2026 recorded positive growths, with varying magnitudes across activities. Notably, Accommodation and Food Services, Mining and quarrying and Construction recorded the highest growth rates of 14.7%, 9.1% and 6.6% respectively;
The year-on-year inflation in September 2026 increased by 0.2% points to 6.8% from the 6.6% recorded in August 2026. The price increase was primarily driven by a rise in prices of items in the Food and Non-Alcoholic Beverages at 9.5%; Transport at 15.6%; and Housing, Water, Electricity, Gas and other fuels at 3.2%; over the one-year period. The month-on-month inflation rate stood at 0.4% in September 2026.
Fixed Income
During Q3’2026, T-bills were oversubscribed, with the overall subscription rate coming in at 163.9%, up from 110.6% in Q3’2025. Investors’ preference for the 91-day paper persisted with the paper receiving bids worth Kshs 319.2 bn against the offered Kshs 100.0 bn, translating to an oversubscription rate of 319.2%, higher than the oversubscription rate of 174.6% recorded in Q3’2025. Overall subscription rates for the 182-day papers came in at 128.0%, significantly higher than 59.6% recorded in Q3’2025, while that of the 364-day papers came in at 80.4% which was lower than the 136.1% recorded in Q3’2025. The average yields on the 91-day and 182-day papers both increased by 0.7% points to 8.8% and 8.9% in Q3’2026, respectively, from 8.0% and 8.2%, respectively, in Q3’2025, while the average yield on the 364-day paper decreased by 0.6% points to 9.0% in Q3’2026 from 9.6% in Q3’ 2025. During the period, the acceptance rate stood at 83.1%, down from 89.5% in Q3’2025, with the government accepting bids worth Kshs 490.2 bn out of the Kshs 590.1 bn bids received;
During the week, T-bills were oversubscribed for the ninth consecutive week, with the overall subscription rate coming in at 170.4% higher than the subscription rate of 149.0% recorded the previous week. Investors’ preference for the shorter 91-day paper persisted, with the paper receiving bids worth Kshs 18.0 bn against the offered Kshs 8.0 bn, translating to a subscription rate of 224.8%, slightly higher than the subscription rate of 221.7%, recorded the previous week. The subscription rate for the 182-day paper increased to 191.5% from 127.6% recorded the previous week, while that of the 364-day paper decreased to 105.9% from 112.3% recorded the previous week. The government accepted a total of Kshs 41.2 bn worth of bids out of Kshs 47.7 bn bids received, translating to an acceptance rate of 86.3%. The yields on the government papers were on a downward trajectory, with the yields on the 91-day and 182-day papers decreasing the most by 0.9 bps, to 8.77% and 8.89% respectively from 8.78% and 8.90% respectively, while the yields on the 364-day paper decreased by 0.3 bps to remain relatively unchanged at 9.04% recorded the previous week;
During Q3’2026, the government re-opened fourteen bonds including three infrastructure bonds, seeking to raise Kshs 380.0 bn. The bonds were generally oversubscribed, receiving bids worth Kshs 840.4 bn against the offered Kshs 380.0 bn, translating to a subscription rate of 221.2%;
During the week, the Central Bank of Kenya released the auction results for the re-opened treasury bonds FXD3/2019/015 and FXD1/2019/020 with tenors to maturities of 7.8 years and 12.5 years respectively and fixed coupon rates of 12.3% and 12.9% respectively. The bonds were oversubscribed, with the overall subscription rate coming in at 161.1%, receiving bids worth Kshs 80.6 bn against the offered Kshs 50.0 bn. The government accepted bids worth Kshs 57.5 bn, translating to an acceptance rate of 71.4%. The weighted average yield for the accepted bids for the FXD3/2019/015 and FXD1/2019/020 came in at 12.7% and 13.6% respectively. Notably, the 12.7% yield on FXD3/2019/015 was lower than the 12.8% recorded at the last reopening in September 2026 while the 13.6% yield on the FXD1/2019/020 was marginally lower than the 13.61% recorded at the last reopening in September 2026. With the Inflation rate at 6.8% as of September 2026, the real returns of the FXD3/2019/015 and FXD1/2019/020 are 5.9 % and 6.8% respectively. Given the 10.0% withholding tax on the bonds, the tax equivalent yields for shorter term bonds with 15.0% withholding tax are 13.5% for FXD3/2019/015 and 14.4 % for FXD1/2019/020;
We expect the MPC to maintain the Central Bank Rate (CBR) at 8.75% in their October 2026 meeting;
Equities
During Q3’2026, the equities market was on an upward trajectory, with NSE 20, NSE 10, NSE 25, and NASI gaining by 15.0%, 13.5%, 12.4%, and 9.6%, respectively. The equities market performance during the quarter was driven by gains recorded by large caps such as Equity, DTBK and KCB of 30.9%, 30.3%, and 15.9% respectively. However, the performance was weighed down by losses recorded by large cap stocks such as Standard Chartered Bank and NCBA of 3.2% and 0.6% respectively;
During the week, the equities market was on a downward trajectory, with NSE 20, NSE 25, NSE 10 and NASI losing by 0.9%, 0.9%, 0.7%, and 0.5%, respectively, taking the YTD performance to gains of 39.2%, 37.7%, 36.8% and 32.0% for NSE 10, NSE 20, NSE 25, and NASI respectively. The equities market performance was mainly driven by losses recorded by large cap stocks such as NCBA, Standard Chartered Bank and Equity bank of 2.2%, 1.5% and 1.4% respectively. However, the performance was supported by gains recorded by large-cap stocks such as EABL and Safaricom, of 0.8% and 0.3%, respectively.
During Q3’2026, the banking sector index gained by 13.2% to 288.9 from 255.1 recorded the previous quarter. This is attributable to gains recorded by stocks such as Equity, DTBK and KCB of 30.9%, 30.3%, and 15.9%, respectively. However, the performance was weighed down by losses recorded by large cap stocks such as SCBK and NCBA of 3.2% and 0.6% respectively;
Also, during the week, the banking sector index decreased by 1.3% to 289.6 from 293.5 recorded the previous week. This is attributable to losses recorded by large cap stocks such NCBA, Standard Chartered Bank and Equity of 2.2%, 1.5% and 1.4% respectively;
Real Estate
In Q3’2026, the general Real Estate sector continued to witness considerable growth in activity in terms of property transactions and development activities. Consequently, the sector’s activity contribution to Gross Domestic Product (GDP) grew by 5.0% to Kshs 377.5 bn in Q1’2026, from Kshs 353.8 bn recorded during the same period in 2025. In addition, the sector contributed 7.9% to the country’s GDP, 0.1% points decrease from 8.0% recorded in Q1’2025. Cumulatively, the Real Estate and construction sectors contributed 14.0% to GDP, 0.2% points decrease from 14.3% in Q1’2025, attributable to a decline in construction contribution to GDP by 0.1% points, to 6.1% in Q1’2026, from 6.2% recorded in Q1’2025;
During the week, the Kenya National Bureau of Statistics (KNBS) released the Leading Economic Indicators (LEI) July 2026 Report, which highlighted that in July 2026, cement consumption reached 1.0 metric tonnes, representing an 13.5% y/y increase from 0.9 metric tonnes in July 2025. Quarter-on quarter basis, the consumption decreased by 2.6% from 2.8 recorded in Q1’2026
During the week, Interior Principal Secretary Raymond Omollo announced that the Funyula Affordable Housing Project in Busia County had completed construction of its 955 housing units across 10 residential blocks, with final painting and finishing works underway ahead of official commissioning and handover. The development incorporates social, affordable and market-rate housing, alongside supporting infrastructure, including reliable water supply, secure perimeter walls, cabro-paved roads, landscaped spaces, a children's play area and commercial facilities. The project is intended to widen access to decent housing for different income groups while providing residents with a serviced residential community.
During the week, Jambojet suspended its direct flights between Mombasa and Zanzibar, citing rising fuel costs and the introduction of mandatory travel insurance for visitors to Tanzania, which have made the route commercially unviable. According to Business Daily, the airline stopped operating the route in mid-September 2026 after passenger numbers declined following the introduction of a USD 44 (Kshs 5,708) travel insurance requirement for visitors to Tanzania. The airline also introduced a 20.0% fuel surcharge on ticket prices following the increase in fuel costs, while rising hotel prices further increased the cost of travelling to Zanzibar. Jambojet’s Chief Executive Officer, Karanja Ndegwa, attributed the suspension to the financial losses incurred on the route.
On the Unquoted Securities Platform Acorn D-REIT and I-REIT traded at Kshs 29.7 and Kshs 24.4 per unit, respectively, as per the last updated data on 25th September 2026. The performance represented a 48.5% and 22.0% gain for the D-REIT and I-REIT, respectively, from the Kshs 20.0 inception price. The volumes traded for the D-REIT and I-REIT came in at 13.7 mn and 46.0 mn shares, respectively. Additionally, ILAM Fahari I-REIT traded at Kshs 13.8 per share as of 25th September 2026, representing a 31.0 % loss from the Kshs 20.0 inception price;
Digital Payments
During the week, Visa shared new data showing the growing adoption of stablecoins in business payments, with approximately 17.0% of stablecoin-linked card volume in FY26 year-to-date occurring across business and commercial card programs, while payments volume across more than 160 stablecoin-linked card programs has grown nearly 200.0% year over year; the trend underscores a shift in stablecoin use from digital asset trading toward settlement, treasury management, and cross-border commerce, positioning Visa to capture a growing share of stablecoin-enabled money movement;
Investment Updates:
-
Weekly Rates: Cytonn Money Market Fund closed the week at a yield of 11.0% p.a. To invest, dial *809# or download the Cytonn App from Google Play store here or from the Appstore here;
-
We continue to offer Wealth Management Training every Tuesday, from 7:00 pm to 8:00 pm. The training aims to grow financial literacy among the general public. To register for any of our Wealth Management Trainings, click here; If interested in our Private Wealth Management Training for your employees or investment group, please get in touch with us through wmt@cytonn.com;
-
Cytonn Asset Managers Limited (CAML) continues to offer pension products to meet the needs of both individual clients who want to save for their retirement during their working years and Institutional clients that want to contribute on behalf of their employees to help them build their retirement pot. To more about our pension schemes, kindly get in touch with us through pensions@cytonn.com;
Hospitality Updates:
-
We currently have promotions for Staycations. Visit cysuites.com/offers for details or email us at sales@cysuites.com;
Global Economic Growth:
According to the World Bank the global economy is projected to slow at 2.5% in 2026, from the 2.9% growth recorded in 2025. This is reflecting the impact of higher energy prices and disruptions arising from the ongoing conflict in the Middle East. The World Bank’s 2026 growth projection of 2.5% is 0.5% points lower than the 3.0% forecast by the IMF in its July 2026 World Economic Outlook Update. Notably, advanced economies are expected to record 1.5% growth in 2026, down from 1.8% in 2025, while emerging market and developing economies are projected to expand by 3.6%, down from 4.4% in 2025.
The expected downturn in global economic growth in 2026 as compared to 2025 is majorly attributable to;
-
Geopolitical tension disruptions to global energy and trade flows: The re-escalation of conflict in the Middle East has disrupted global trade and energy markets, including through disruptions to shipping via the Strait of Hormuz, a key route for global oil and liquefied natural gas trade. This has contributed to a sharp increase in energy prices and renewed inflationary pressures, particularly affecting energy importing economies. The World Bank estimates that average commodity prices will rise by about 22.0% in 2026, largely driven by higher energy prices, while Brent crude oil is projected to average USD 94 per barrel during the year.
-
High inflation and tightening Monetary policy: The Global headline inflation is projected to increase to 4.0% in 2026, from 3.2% in 2025, according to the World Bank, as higher energy prices and supply disruptions raise input and consumer costs. The IMF’s latest July 2026 update similarly revised its global headline inflation forecast upward to 4.7% in 2026, from 4.1% in 2025, indicating that the global disinflation trend has stalled. Higher inflation is expected to constrain household purchasing power and consumer spending, while tighter monetary conditions are likely to weigh on investment and economic activity. However, monetary policy responses are expected to differ across economies depending on the extent of inflationary pressures and exposure to the energy shock.
However, global economic growth is expected to be supported by;
-
Easing financial conditions and technology driven investment: Global economic activity is expected to receive support from easing financial conditions and fiscal expansion in several large economies, which should help cushion the impact of weaker trade and domestic demand. In addition, the continued expansion of artificial intelligence and investment in related technologies is expected to support productivity, investment and demand, particularly in economies integrated into global technology value chains.
Global Commodities Market Performance:
Global commodity prices registered a mixed performance in Q3’2026, with prices of fertilizers, Energy, Precious Metals, and Metals and minerals decreasing by 21.4%, 12.7%, 7.9% and 1.6 %, respectively. This can be attributed to weaker global demand, improved supply conditions, elevated production, profit taking and higher US bond yields, which weighed on commodity demand and investment. Prices for Agriculture and Non-Energy increased by 3.4% and 0.2% respectively, supported by adverse weather conditions, supply constraints and geopolitical tensions that disrupted trade and logistics, particularly across key commodity producing and exporting regions. Below is a summary performance of various commodities;
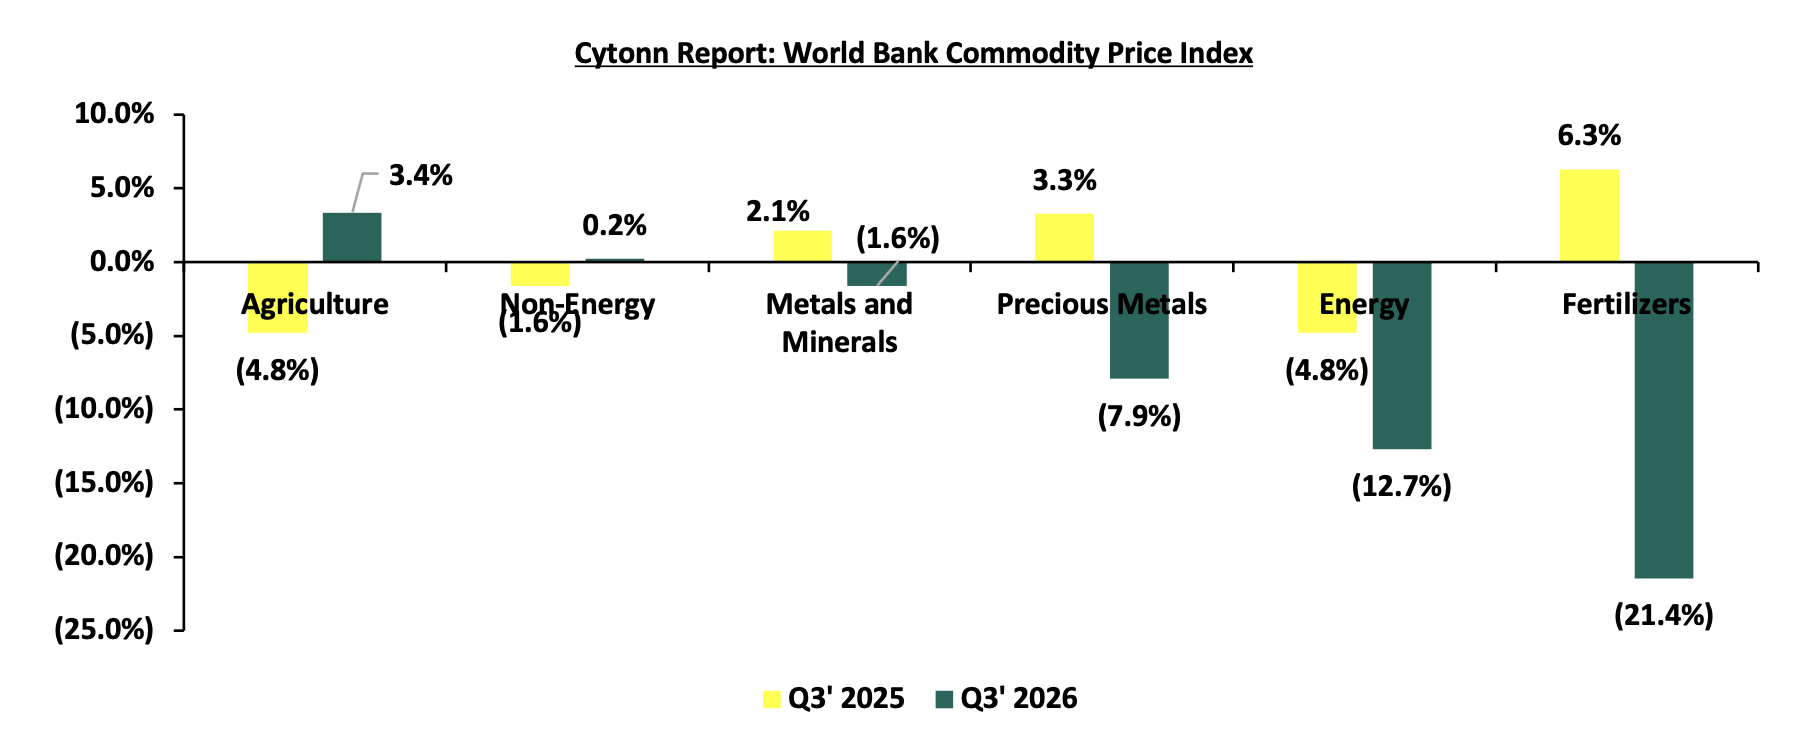
Source: World Bank
Global Equities Market Performance:
The global stock market registered a mixed performance in Q3’2026, with NSE 20 recording the best performance during the period, recording a gain at 14.8% in Q3’2026 largely driven by gains in the large-cap stocks such as Equity Bank, DTB and KCB Bank of 31.9%, 30.3% and 17.5% respectively. The performance was however weighed down by the FTSE Euro 300 Index, recording a decline of 24.7%. This is attributable to losses recorded by large cap stock such as Novo Nordisk, LVMH and AstraZeneca of 20.1%, 19.4% and 15.2% respectively. Below is a summary of the performance of key indices as at the end of Q3’2026:
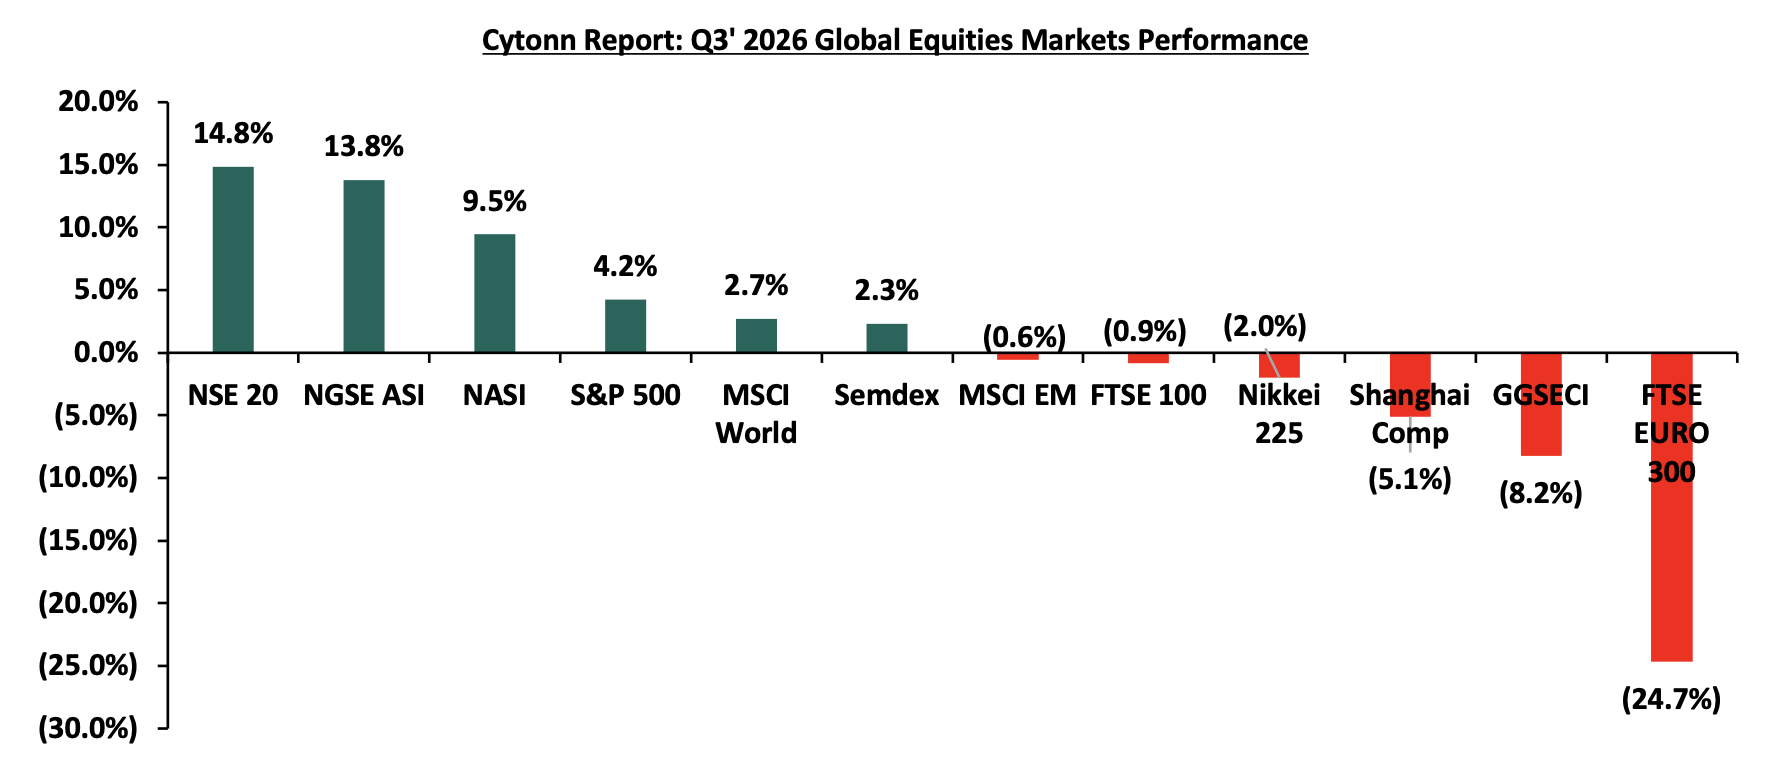
*Dollarized performance
According to the World Bank, the Sub-Saharan economy is projected to grow by 4.1% in 2026, unchanged from the 4.1% growth recorded in 2025. The outlook remains constrained by rising fuel, food and fertilizer prices, which are expected to push inflation higher and weigh on household purchasing power, while tighter financial conditions continue to limit economic activity. High public debt and rising debt service costs continue to constrain fiscal space and limit governments’ ability to finance development priorities.
Currency Performance:
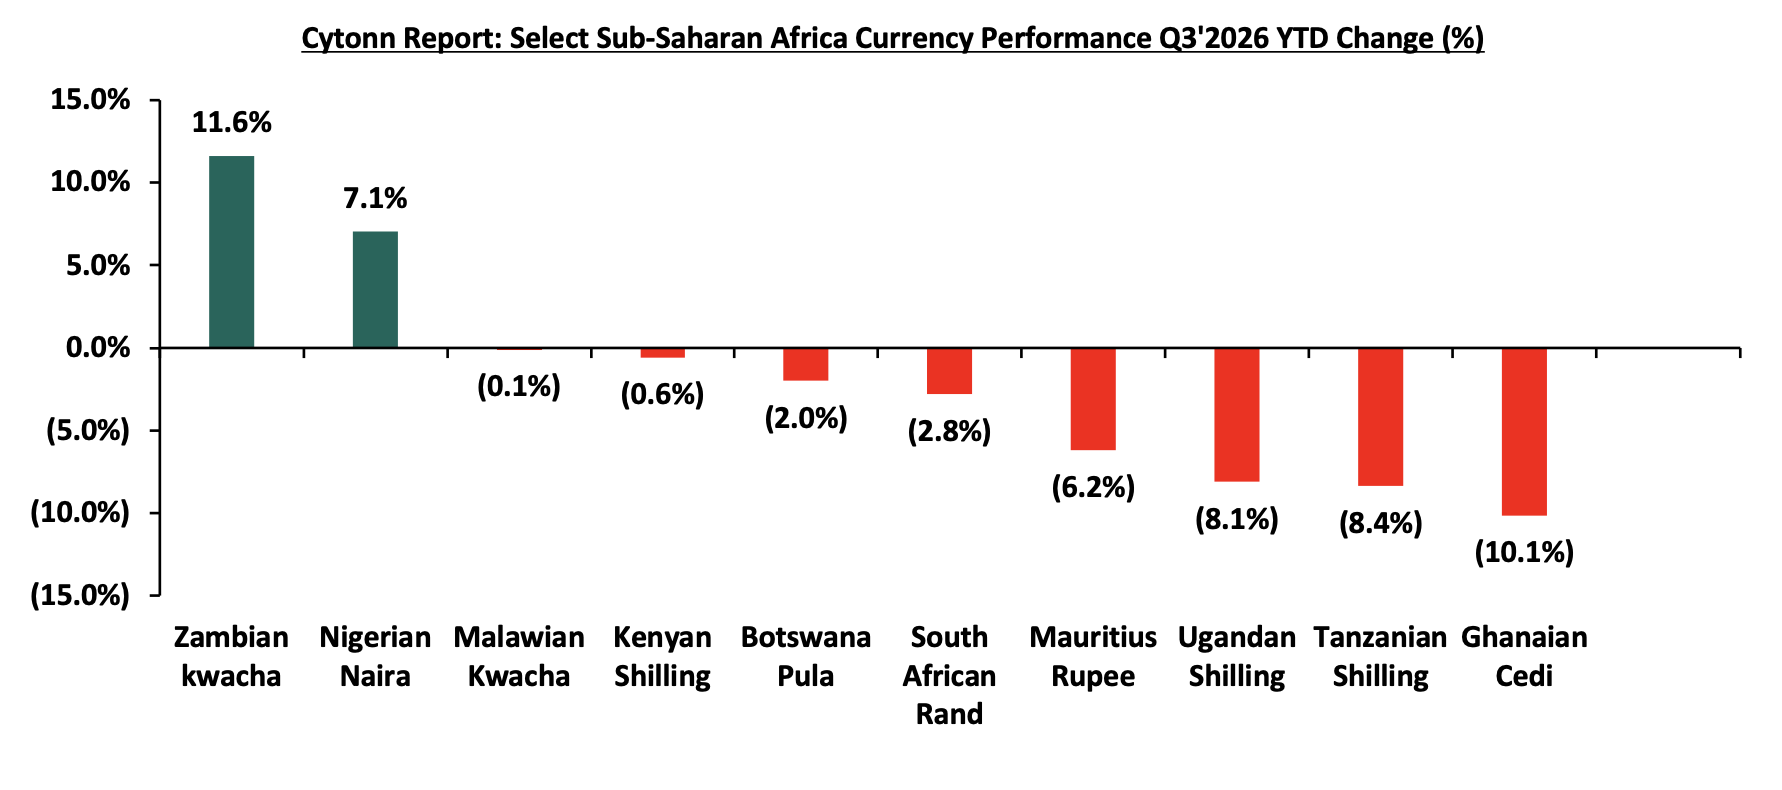
In Q3’2026, most of the select Sub-Saharan currencies depreciated against the US Dollar, primarily due to elevated inflationary pressures in the region, high debt servicing costs that continued to deplete foreign exchange reserves, and monetary policy tightening by advanced economies. High interest rates in developed countries resulted in significant capital outflows as investors, both institutional and individual, sought higher returns offered in these economies. However, the Zambian Kwacha emerged as the best performer among the selected currencies, appreciating by 11.6% against the USD on a year-to-date basis, closing Q3'2026 at ZMW 19.6 from ZMW 22.1 at the beginning of the year. Below is a table showing the performance of select African currencies against the US Dollar:
|
Cytonn Report: Select Sub-Saharan Africa Currency Performance vs USD |
|||||
|
Currency |
Sep-25 |
Jan-26 |
Sep-26 |
Last 12 months |
YTD Change (%) |
|
Zambian kwacha |
23.9 |
22.1 |
19.6 |
18.0% |
11.6% |
|
Nigerian Naira |
1,470.0 |
1430.3 |
1329.5 |
9.6% |
7.1% |
|
Malawian Kwacha |
1751.0 |
1731.9 |
1733.7 |
1.0% |
(0.1%) |
|
Kenyan Shilling |
129.2 |
129.1 |
129.8 |
(0.4%) |
(0.6%) |
|
Botswana Pula |
13.2 |
13.1 |
13.3 |
(0.8%) |
(2.0%) |
|
South African Rand |
17.3 |
15.9 |
16.4 |
5.3% |
(2.8%) |
|
Mauritius Rupee |
45.7 |
45.0 |
47.8 |
(4.6%) |
(6.2%) |
|
Ugandan Shilling |
3490.2 |
3625.3 |
3920.0 |
(12.3%) |
(8.1%) |
|
Tanzanian Shilling |
2453.6 |
2450.2 |
2654.8 |
(8.2%) |
(8.4%) |
|
Ghanaian Cedi |
12.3 |
10.5 |
11.6 |
5.7% |
(10.1%) |
Source: Yahoo Finance, Central Banks
The chart below shows the year-to-date performance of different sub-Saharan African countries in Q3’2026;
Source: Yahoo Finance
Key take outs from the above table and chart include:
-
The Zambian Kwacha was the largest gainer against the USD Dollar, gaining by 11.6% year to date to close at ZMW 19.6 from ZMW 22.1 beginning of the year. The Kwacha’s strength has been supported by several factors, including improved monetary policies and economic recovery that attracted global investors. and,
-
The Ghanaian Cedi was the worst performing currency in Q3’2026, depreciating by 10.1%, mainly as a result of the strength against the US dollar which is attributable to factors such as increased demand for the US Dollar required to import products such as fuel and machinery.
African Eurobonds:
Africa’s appetite for foreign-denominated debt has increased in recent times with the latest issuers during the nine months to end of Q3’2026 being Angola, Kenya, Ivory Coast, DRC, Gabon, Cameroon, and Benin, which raised USD 2.5 bn, USD 2.3 bn, USD 1.3 bn, USD 1.3 bn, USD 0.9 bn, USD 0.8 bn and USD 0.4 bn respectively, raising a total of USD 9.3 bn through Eurobond issuances. This compares with USD 7.9 bn raised through Nigeria, Ivory Coast, Angola, Kenya and Benin of USD 2.4 bn, USD 1.8 bn, USD 1.8 bn, USD 1.5 bn and USD 0.5 bn respectively in 2025. Notably, all the bonds were oversubscribed with the high support being driven by the yield hungry investors and also the outlook of positive recovery in the regional economies. It is good to note that there was a general decline in the yields of the various bonds from most countries due to general improvement in investor sentiment as the economy recovers and the easing inflationary pressures in the region.
The Yields of the Kenya’s 10-year Eurobond maturing in 2028 increased marginally by 0.8% points to 6.8% as at the end of September 2026 from 6.7% in September 2025. However, the yields for Nigeria’s 9-year and 12-year Eurobonds maturing in 2033 and 2031 respectively decreased marginally by both 0.6% points to 7.6% and 7.2% respectively at the end of September 2026, down from 8.2% and 7.8% respectively in September 2025. Below is a graph showing the Eurobond secondary market performance of select Eurobonds issued by the respective countries:
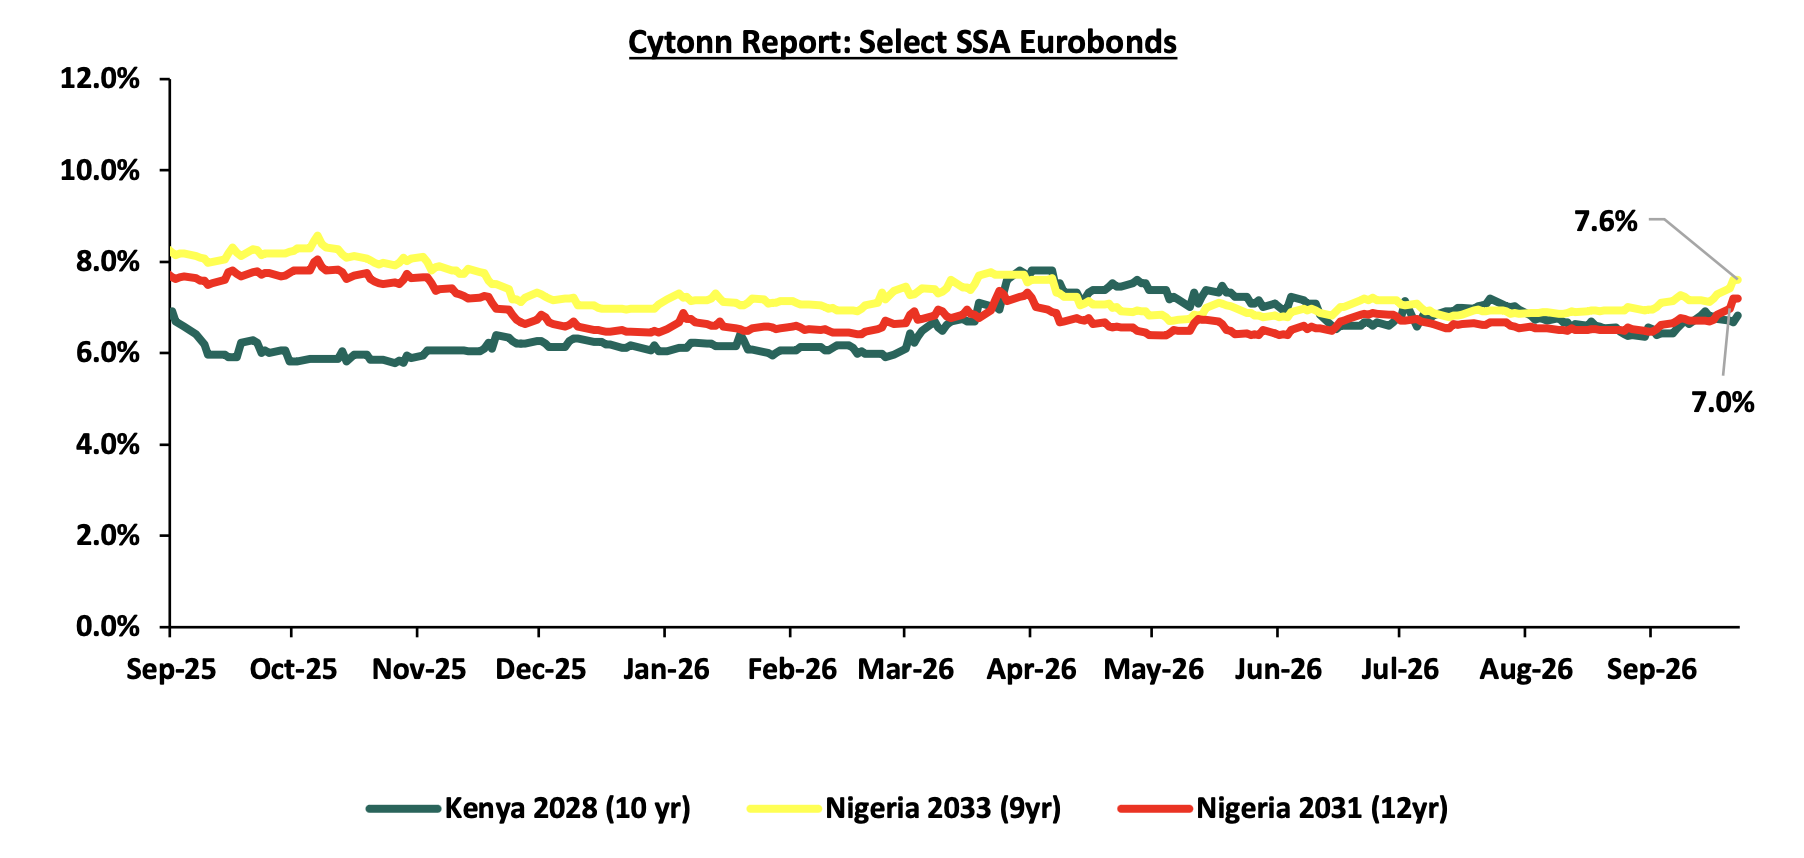
Source: Bloomberg, CBK
Equities Market Performance:
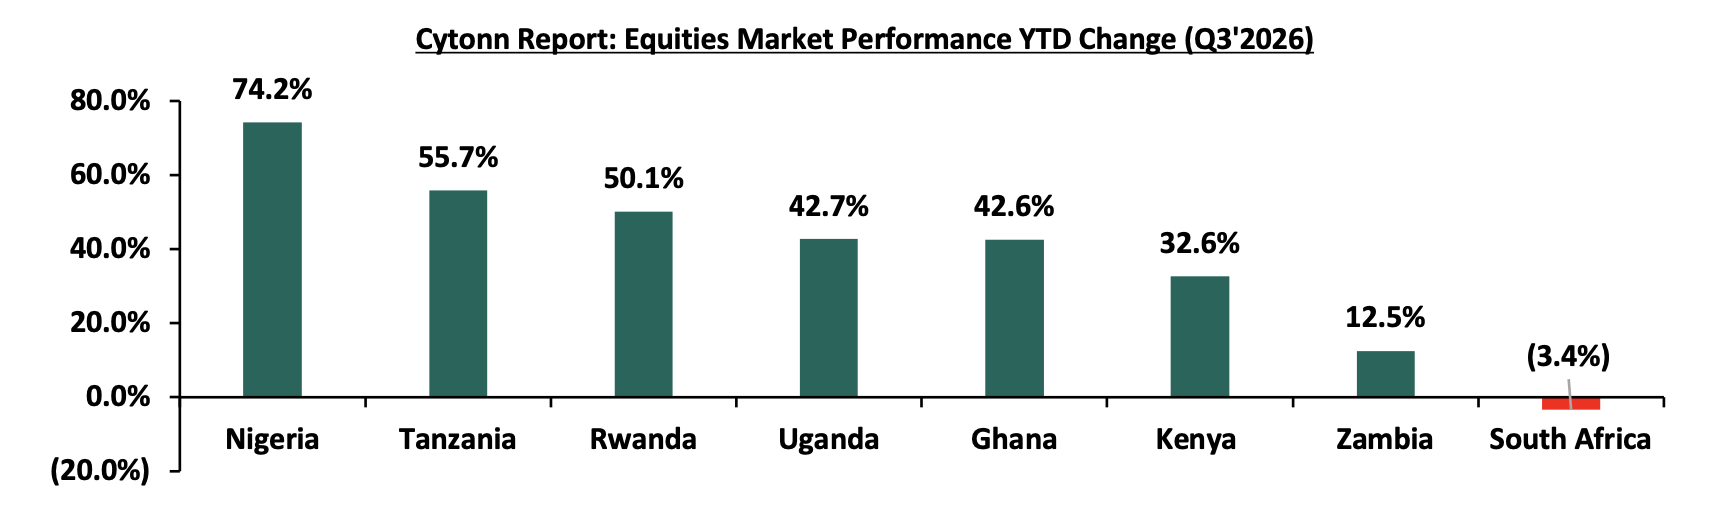
Sub-Saharan Africa (SSA) stock markets registered a mixed performance in Q3’2026, with Nigeria’s stock market (NGEASI) being the best performing market gaining by 74.2% YTD attributable to gains in the large-cap stocks such as FirstHoldco, Nigerian Exchange Group and Vodafon Group of 185.3%, 58.2% and 38.8% respectively. However, the performance was weighed down by the South Africa’s stock index negative performance of 3.4% attributable to YTD performance losses in large cap stocks such as Naspars, Goldfields and Valterra Platinum Ltd of 36.4%, 17.7% and 16.5% respectively. Below is a summary of the performance of key indices:
|
Cytonn Report: Equities Market Performance Q3'2026 (Dollarized*) |
||||||
|
Country |
Index |
Sep-25 |
Jan-26 |
Sep-26 |
Last 12 months |
YTD Change |
|
Nigeria |
NGEASI |
98.31 |
109.2 |
190.2 |
93.5% |
74.2% |
|
Tanzania |
DARSDEI |
1.016 |
1.1 |
1.8 |
74.1% |
55.7% |
|
Rwanda |
RSEASI |
0.095 |
0.1 |
0.2 |
61.2% |
50.1% |
|
Uganda |
USEASI |
0.4 |
0.5 |
0.6 |
52.0% |
42.7% |
|
Ghana |
GSECI |
670.16 |
839.3 |
1197.1 |
78.6% |
42.6% |
|
Kenya |
NASI |
1.38 |
1.4 |
1.9 |
38.8% |
32.6% |
|
Zambia |
LASILZ |
1056.0 |
1169.9 |
1316.0 |
24.6% |
12.5% |
|
South Africa |
JALSH |
6371.3 |
7021.0 |
6785.2 |
6.5% |
(3.4%) |
|
*The index values are dollarized for ease of comparison |
||||||
Source: Cytonn Research, Kwayisi, Yahoo Finance
The chart below shows the YTD Performance of the sub-Saharan Equities Market;
Dollarized performance
Global Markets and Sub-Saharan Africa Performance Summary and Outlook
|
Indicator |
Cytonn Report: Global and Sub-Saharan Africa Outlook Summary |
Current View |
Outlook Q4’ 2026 |
|
Outlook for Q4’2026 |
|||
|
Global Markets |
|
Neutral |
Neutral |
|
|||
|
Sub-Saharan Africa |
|
Neutral |
Neutral |
|
|||
|
Take for investors |
|
||
GDP growth in the Sub-Saharan Africa region is expected to improve, in contrast with the rest of the global economy. Additionally, public debt continues to be a major headwind, with high debt levels experienced in the region on the back of continued weakening of local currencies, which will make debt servicing costlier, making the region less attractive to foreign capital.
According to the Kenya National Bureau of Statistics (KNBS) the Q1’2026 Quarterly Gross Domestic Product Report, highlighted that the Kenyan economy recorded a 5.3% growth in Q1’2026, higher than the 4.9% growth recorded in Q1’2025. The main contributor to Kenyan GDP remains to be the Agriculture, Fishing and Forestry sector which grew by 4.9% in Q1’2026, lower than the 5.3% expansion recorded in Q1’2025. All sectors in Q1’2026 recorded positive growths, with varying magnitudes across activities. Notably, Accommodation and Food Services, Mining and quarrying and Construction recorded the highest growth rates of 14.7%, 9.1% and 6.6% respectively. In 2026, we expect the economy to stabilize within expectations with the projected GDP growth to come in to within a range of 4.4% - 5.3%, projected by various organizations as outlined below:
|
Cytonn Report: Kenya 2026 Growth Projections |
|||
|
No. |
Organization |
2026 Earlier GDP Projections |
2026 Revised GDP Projections |
|
1 |
International Monetary Fund |
4.9% |
4.5% |
|
2 |
National Treasury |
5.3% |
5.0% |
|
3 |
World Bank |
4.9% |
4.4% |
|
4 |
Fitch Solutions |
5.2% |
5.0% |
|
5 |
Cytonn Investments Management PLC |
5.0% |
4.8% |
|
Average |
5.0% |
4.8% |
|
Source: Cytonn Research
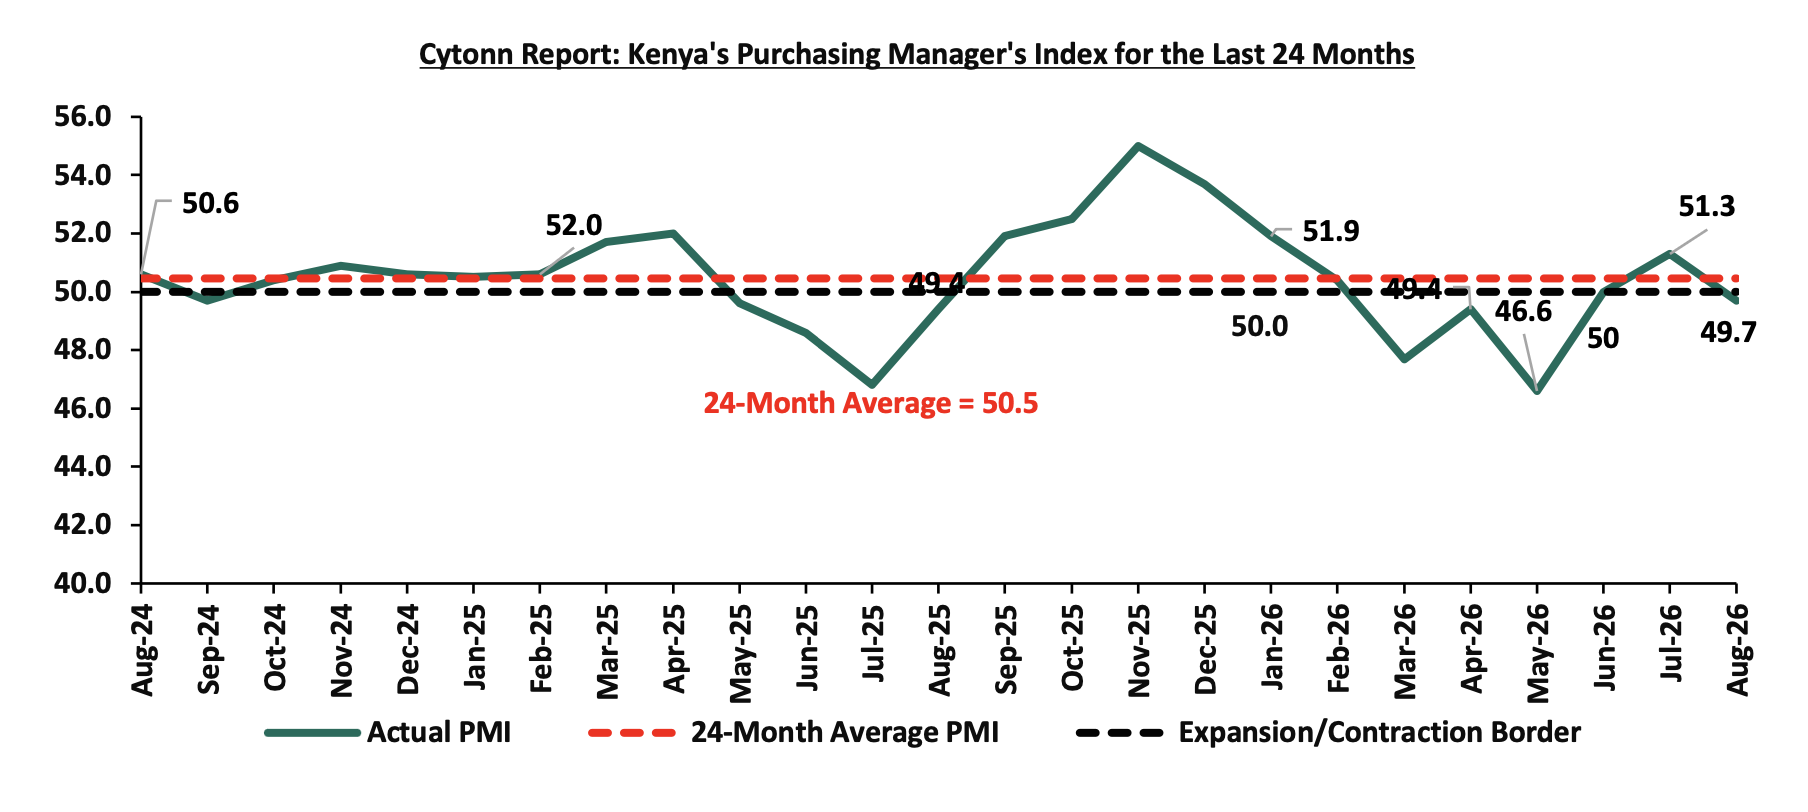
Key to note, Kenya’s general business environment remained subdued in August 2026 with the Purchasing Manager’s Index (PMI) coming at 49.7, slightly above the 49.4 recorded in August in 2025, but remaining below the 50.0 threshold that separates expansion from contraction. The marginal year-on-year improvement therefore did not translate into an overall improvement in operating conditions, as firms continued to face elevated raw material costs, tight cash flows and shortages of key inputs, which constrained their ability to convert rising customer sales into higher output. Although new orders increased for the third consecutive month, firms reduced production and scaled back purchases as higher input prices and liquidity constraints weighed on operations. The challenging domestic environment was further compounded by heightened Middle East tensions, which increased shipping and tanker costs and raised concerns around fuel and imported input prices, adding further pressure on business costs and profit margins. The chart below summarizes the evolution of PMI over the last 24 months to August 2026. Key to note, a PMI reading of above 50.0 indicates an improvement in the business conditions, while readings below 50.0 indicate a deterioration.
Stanbic Bank’s August 2026 Purchasing Manager’s Index (PMI)
In the month of August, Stanbic Bank released its monthly Purchasing Managers' Index (PMI), indicating that Kenya's Purchasing Managers' Index (PMI) declined by 1.6 points to 49.7 in August 2026, from 51.3 in July 2026, signaling a marginal deterioration in operating conditions. The latest reading was however higher than the 49.4 recorded in August 2025, reflecting a gradual recovery in private sector activity. The decline was primarily driven by persistent supply-side constraints, as elevated raw material costs, key material shortages, and tight cash flows prevented firms from converting stronger demand into higher output, with production contracting for a sixth consecutive month. Despite this, new orders grew for a third consecutive month, albeit at a slower pace than July, fueling further backlog accumulation at a historically strong pace and prompting additional hiring for a third straight month. Supply chain pressures persisted, with delivery times lengthening and input buying declining for a fourth consecutive month as firms adopted a cautious purchasing stance amid limited liquidity. Nonetheless, the gradual moderation in input and output price inflation from their June peaks and business confidence rising to its highest level since February 2023 suggest that the conditions for a more sustainable recovery are slowly falling into place, provided liquidity conditions ease and supply chain disruptions are resolved in the months ahead.
Going forward, the August PMI suggests that Kenya's private sector recovery remains fragile, as the return to contraction after just one month of expansion highlights the vulnerability of the current environment to persistent supply-side constraints and elevated cost pressures. While the third consecutive month of new order growth and sustained employment expansion signal that demand conditions are gradually improving, the continued inability of firms to translate stronger sales into higher output points to lingering liquidity challenges and material shortages that will need to be resolved before a more durable recovery can take hold. The moderation in input and output price inflation from their June peaks is an encouraging development and, if sustained, could progressively ease the margin pressures that have constrained production and purchasing activity. Business confidence rising to its highest level since February 2023, underpinned by planned investment in marketing, capacity improvements, and product diversification, provides a positive signal for the months ahead. However, a meaningful and sustained recovery in private sector activity will ultimately depend on a continued easing of cost pressures, improved access to liquidity, and resolution of supply chain disruptions that are preventing firms from fully capitalizing on the current strength in demand.
Inflation:
The average inflation rate increased to 6.6% in Q3'2026, compared to 4.4% in Q3'2025, mainly driven by rising fuel prices. However, the increase was moderated by a stronger Kenyan Shilling and stabilized transportation costs. Notably, fuel prices remained elevated during Q3’2026, with Nairobi’s Super Petrol price holding steady at Kshs 214.0 per litre throughout the quarter, while Diesel declined by Kshs 5.0 per litre from Kshs 222.9 in July to Kshs 217.9 in August and remained unchanged through September. Kerosene prices also remained stable at Kshs 191.4 per litre throughout the quarter with the latest prices effective from 15th September 2026 to 14th October 2026. The relative stability in pump prices provided some relief from the sharp increases recorded earlier in the year, although fuel costs remained significantly elevated and continued to weigh on transport expenses, business operating costs, and household purchasing power. This is reflected in the inflation data, with average inflation rising by 0.3% points to 6.8% in September 2026, from 6.5% in July 2026, mainly driven by increases in the Transport division to remain relatively unchanged from 15.6%; Food and Non-Alcoholic Beverages to 9.5% from 9.0%; and Housing, Water, Electricity, Gas and other fuels to remain relatively unchanged from 3.2% over the same period. Below is a chart showing the inflation trend for the last five years:
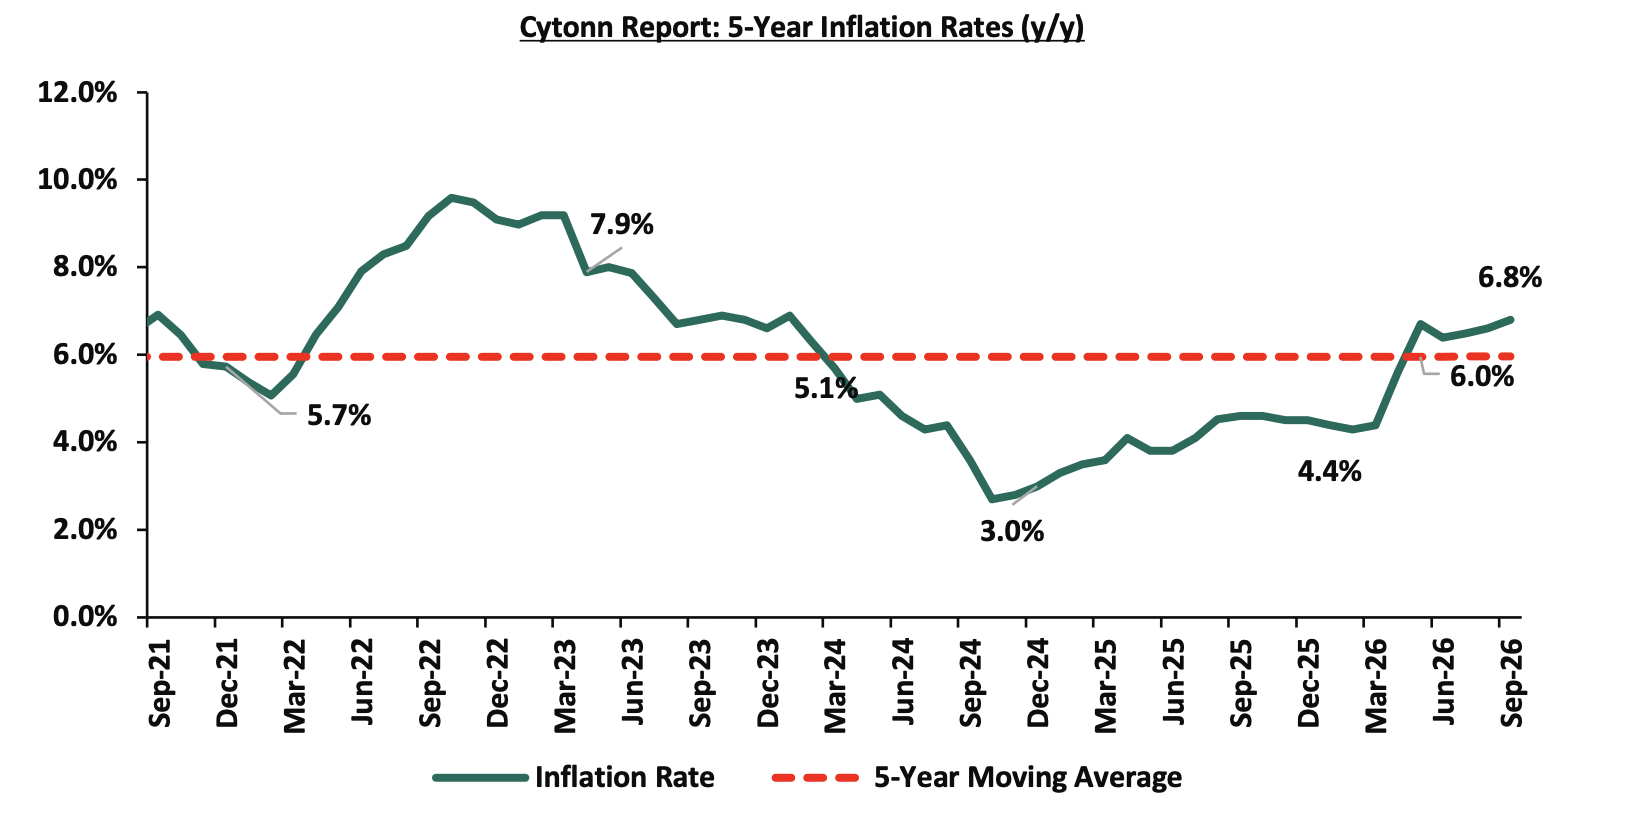
Over the last 36 months, Kenya's inflation had persistently remained within the Central Bank of Kenya's (CBK) target range of 2.5%–7.5%, supported by a stronger Shilling and relatively stable fuel prices. However, this stability came under strain, as the escalating conflict involving the US, Israel and Iran disrupted global oil supply chains and drove global oil prices sharply higher, feeding through into elevated domestic fuel and transport costs. As a result, headline Inflationary pressures remained elevated in Q3’2026, with inflation rising from 6.4% in June to 6.5% in July, 6.6% in August and 6.8% in September, driven largely by higher food, transport and housing-related costs. Against this backdrop, the Monetary Policy Committee maintained the Central Bank Rate (CBR) at 8.75% at its August 11, 2026 meeting, extending the pause in the easing cycle as it sought to keep inflation expectations anchored and support exchange-rate stability amid elevated global energy prices and uncertainties from the Middle East conflict.
Going forward, we expect Kenya's inflation to remain above the midpoint of the CBK's target range of 2.5%–7.5%, in the short to medium term driven by persistent food price volatility due to weather-related supply disruptions, elevated fuel and electricity costs, fluctuations in global commodity prices, and exchange rate pass-through effects that increase the cost of imported goods and production inputs, majorly as a result of the Middle East War. Geopolitical tensions continue to trigger higher global oil prices exerting upward pressure on domestic fuel, transport, and production costs. Nevertheless, we expect the CBK's prudent monetary policy stance and relative exchange rate stability to help anchor inflation expectations and keep inflation within the target range over the medium term.
September 2026 Inflation
The year-on-year inflation in September 2026 increased by 0.2% points to 6.8% from the 6.6% recorded in August 2026. The price increase was primarily driven by a rise in prices of items in the Food and Non-Alcoholic Beverages at 9.5%; Transport at 15.6%; and Housing, Water, Electricity, Gas and other fuels at 3.2%; over the one-year period. The month-on-month inflation rate stood at 0.4% in September 2026. The table below summarizes the performance of commodity indices both on a year-on-year and month-on-month basis:
|
Cytonn Report: Major Inflation Changes – September 2026 |
|||
|
Broad Commodity Group |
Price change m/m (September-2026/ August-2026) |
Price change y/y September-2026/September-2025) |
Reason |
|
Food and Non-Alcoholic Beverages |
0.9% |
9.5% |
The m/m increase was mainly driven by a rise in prices of white wheat flour, fresh unpacketed cow milk, and fresh packeted cow milk by 4.5%, 5.8% and 6.0% respectively. However, the increase was weighed down by a decline in prices of tomatoes, loose maize flour and sugar by 4.1%, 1.9% and 0.4% respectively. |
|
Transport |
(0.4%) |
15.6% |
The m/m decline was mainly driven by a decrease in country bus/matatu fares for inter-town travel and city bus/matatu fares by 1.0% and 0.3% respectively. However, the decline was supported by an 8.1% increase in international flight fares. |
|
Housing, Water, Electricity, Gas and Other Fuels |
0.1% |
3.2% |
The m/m increase was mainly due to a rise in firewood and charcoal prices by 1.8% and 1.6% respectively. However, the increase was weighed down by a decline in electricity (200kWh) and Gas/LPG prices by 2.2% and 0.2% respectively. |
|
Overall Inflation |
0.4% |
6.8% |
The m/m increase was mainly attributable to the 0.9% rise in Food and Non-Alcoholic Beverages, despite the 0.4% decline in Transport. |
In September 2026, overall inflation increased by 0.2% points to 6.8% from the 6.6% recorded in August 2026 on a y/y basis, signaling continued price pressure across major categories, but still remained within the Central Bank of Kenya's preferred range of 2.5%-7.5%, for the thirty-ninth consecutive month. The maximum allowed pump prices for Super Petrol, Diesel and Kerosene remained unchanged at Kshs 214.03, Kshs 217.86 and Kshs 191.38 respectively, in the pricing cycle running from 15th September to 14th October 2026, as EPRA held fuel prices steady for a second consecutive review. Electricity costs eased during the month, with the 50kWh and 200kWh tariffs declining by 2.4% and 2.2% respectively between August and September 2026. The Central Bank Rate (CBR) remained at 8.75%, with the Monetary Policy Committee (MPC) of the Central Bank of Kenya (CBK) not due to meet again until 7th October 2026, as the Committee continues its cautious, data-dependent approach aimed at anchoring inflation expectations and preserving exchange rate stability amid persistent geopolitical uncertainty stemming from the Middle East conflict.
The Kenyan Shilling:
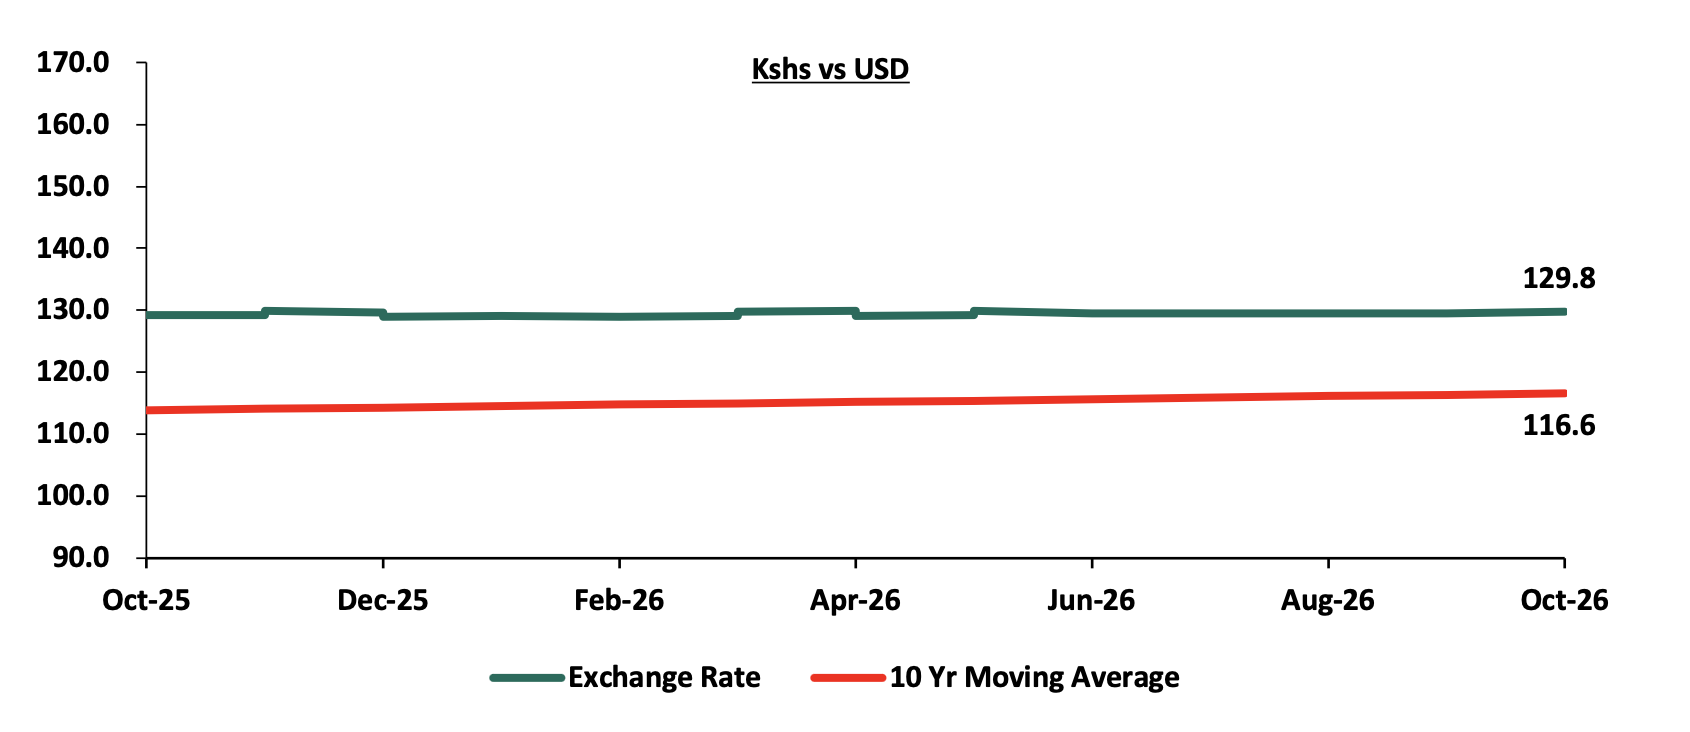
The Kenyan Shilling remained relatively stable during the third quarter of 2026, however, depreciating against the US Dollar by 23.2 bps in Q3’2026, to close at Kshs 129.8, from Kshs 129.5 as at the beginning of the quarter. The mild depreciation reflects a combination of moderating diaspora remittance growth, partly due to disruptions in Gulf economies, a modest drawdown in forex reserves, and broad US Dollar strength amid heightened global risk aversion. Additionally, the accommodative monetary policy stance by the Central Bank of Kenya (CBK), including the maintenance in the Central Bank Rate (CBR) to 8.75% in August 2026, alongside increased liquidity in the market, further contributed to the depreciation pressure, as lower yields reduced the relative attractiveness of Shilling-denominated assets. These pressures were largely offset by steady export earnings from tea, coffee, and horticulture, resilient tourism receipts, and continued prudent forex management by the CBK, helping the Shilling remain one of the most stable currencies in Africa through Q3'2026. During the week, the Kenya Shilling depreciated against the US Dollar by 10.8 bps to Kshs 129.8, from Kshs 129.6 recorded the previous week.
We expect the shilling to be supported by:
-
Diaspora remittances standing at a cumulative USD 5,012.7 mn in the twelve months to August 2026, slightly lower than the USD 5,078.8 mn recorded over the same period in 2025. These have continued to cushion the shilling against further depreciation. In the August 2026 diaspora remittances figures, North America remained the largest source of remittances to Kenya accounting for 50.3% in the period,
-
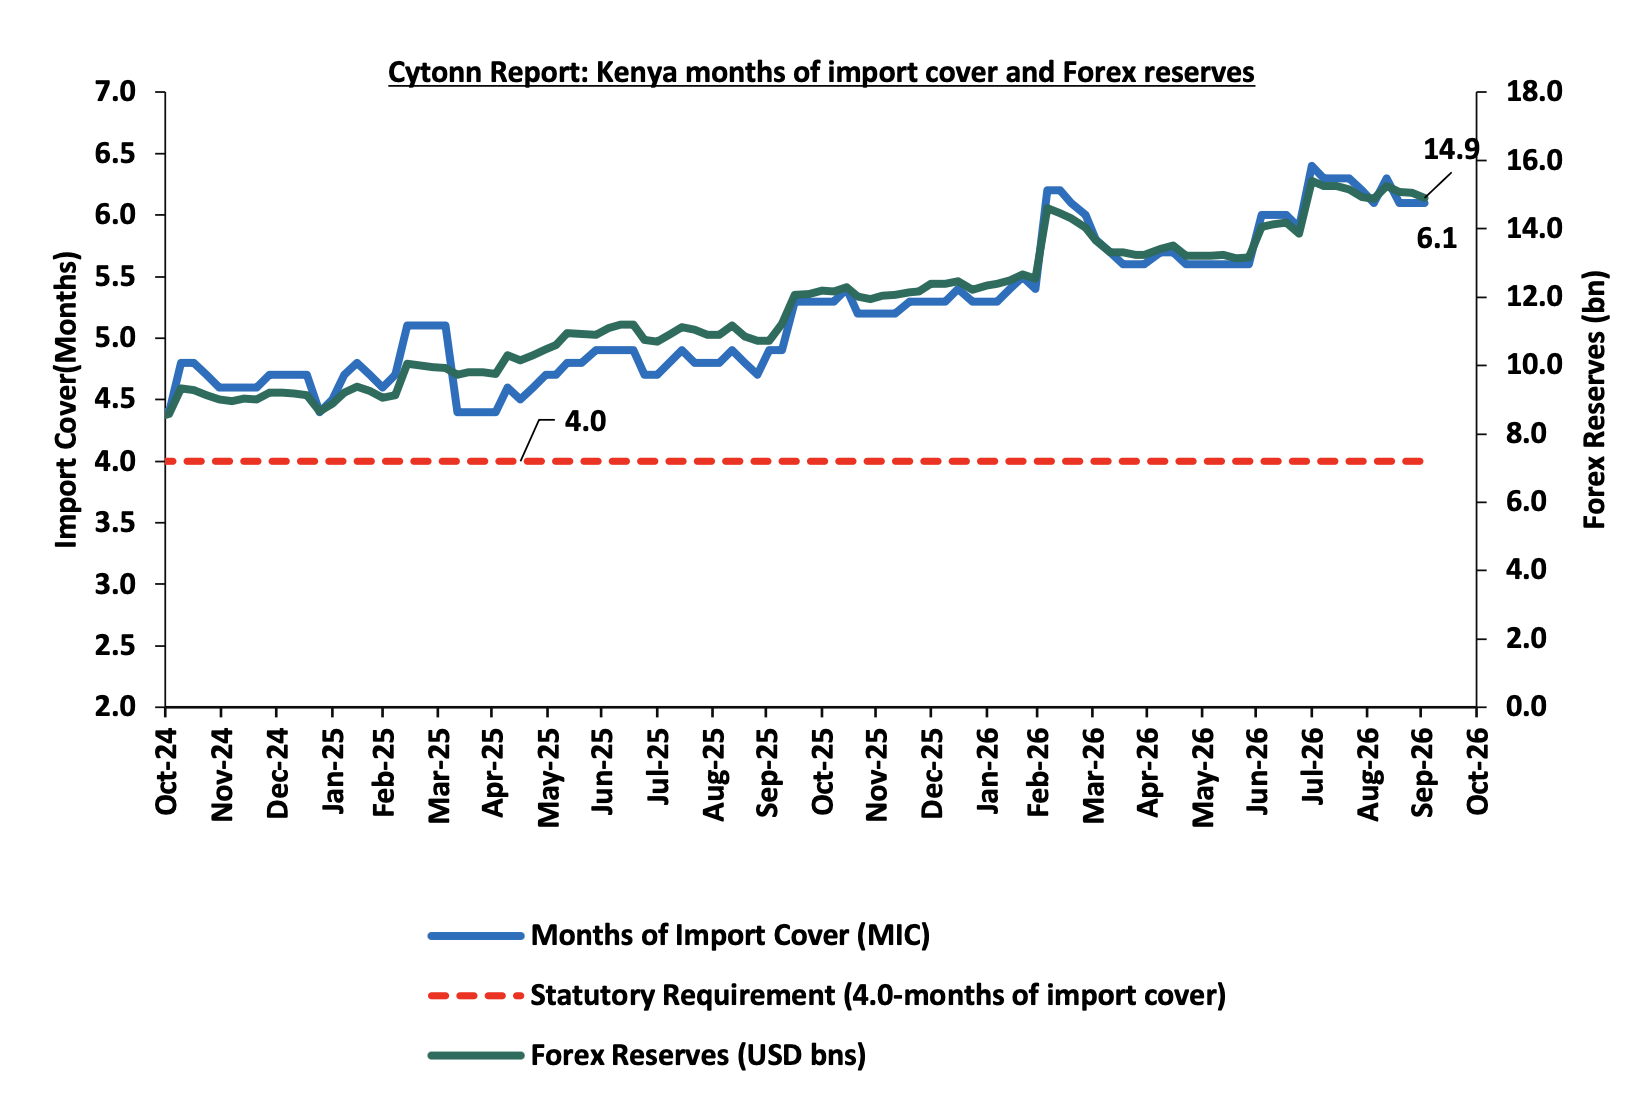
Improved forex reserves currently at USD 14.9 bn (equivalent to 6.1-months of import cover), which is above the statutory requirement of maintaining at least 4.0-months of import cover and above the EAC region’s convergence criteria of 4.5-months of import cover.
The shilling is however expected to remain under pressure in 2026 as a result of:
-
An ever-present current account deficit which widened to 3.0% of GDP in the 12 months to June 2026 compared to 1.9% of GDP in a similar period in 2025 and,
-
The need for government debt servicing, continues to put pressure on forex reserves given that 54.8% of Kenya’s external debt is US Dollar-denominated as of June 2026.
-
Rising geopolitical tensions in the Middle East, which could exert pressure on the shilling through higher global oil prices and increased uncertainty in international markets. Given that Kenya is a net importer of petroleum products, any sustained increase in oil prices would widen the import bill, increase demand for US Dollars, and consequently put depreciation pressure on the shilling.
Key to note, during the third quarter of 2026, Kenya’s forex reserves increased by 7.1% to close at USD 15.0 bn from the USD 14.0 bn recorded at the start of the quarter. Also in the third quarter of 2026, Kenya’s months of import cover increased by 1.7% to close at 6.1 from the 6.0 months recorded at the start of the quarter. The chart below summarizes the evolution of Kenya's months of import cover over the years:
Monetary Policy:
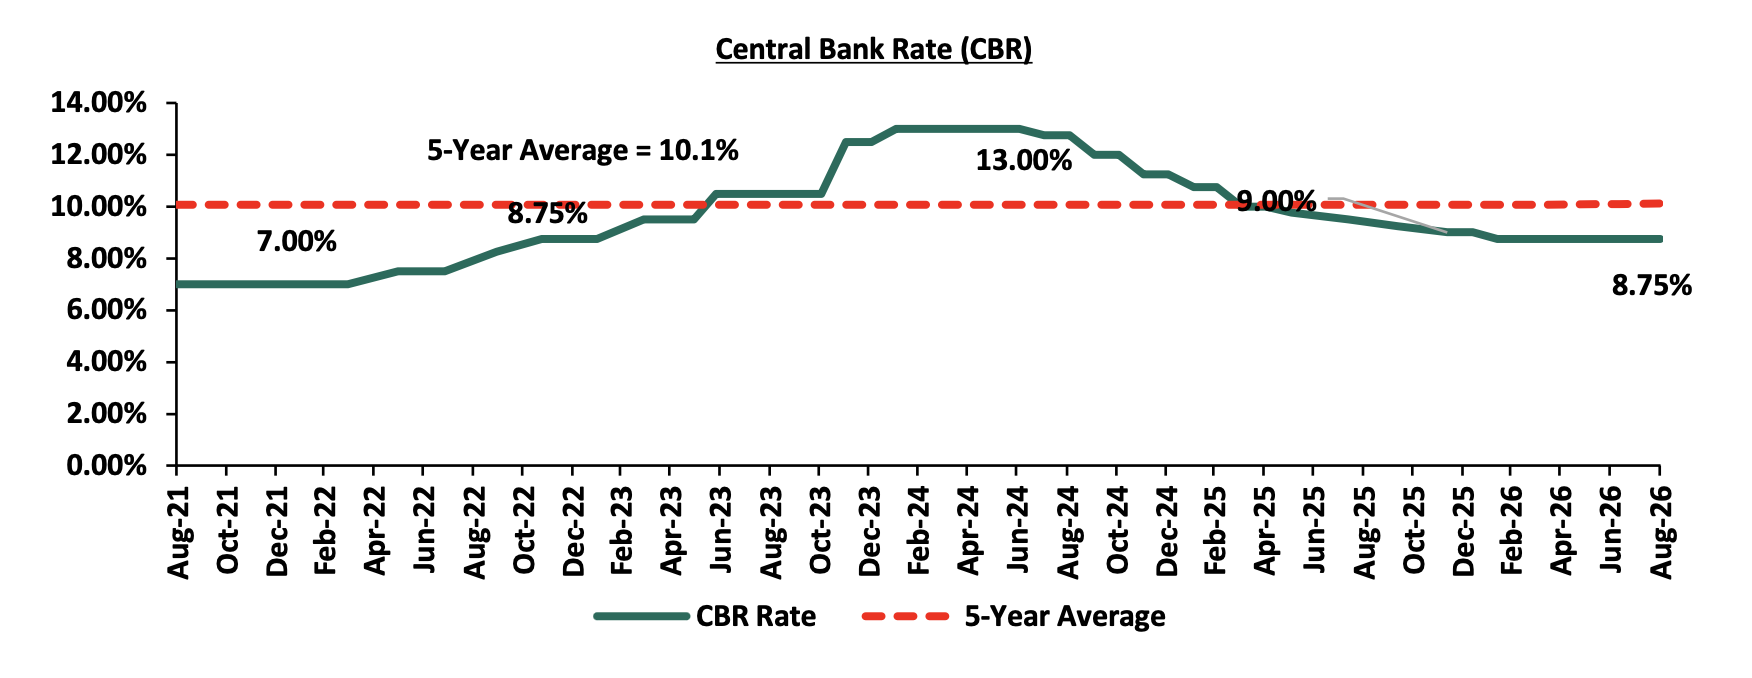
The Monetary Policy Committee (MPC) met once in Q3'2026, maintaining the Central Bank Rate (CBR) at 8.75% unchanged from the June 2026 meeting, extending the pause in the monetary easing cycle. The decision reflected heightened global uncertainty, particularly elevated energy prices and supply disruptions arising from the Middle East conflict, alongside concerns over potential second-round effects on domestic inflation. The Committee noted that the prevailing monetary policy stance remained appropriate to keep inflation expectations anchored within the target range and support exchange-rate stability, while continued improvements in private-sector credit growth and declining lending rates provided room to assess the impact of earlier rate cuts. Below are some of the key highlights from the August 2026 meeting:
-
Overall inflation remained within the CBK preferred range of 2.5%-7.5% in July 2026, increasing marginally to 6.5% from 6.4% in June 2026. Core inflation remained relatively stable at 3.2% in July, compared to 3.1% in June, while non-core inflation declined to 15.0% from 15.1%, mainly supported by lower energy prices, government interventions including subsidies and the temporary reduction of VAT on fuel. However, food inflation remained elevated due to higher prices of vegetables, particularly Irish potatoes, tomatoes, kales, cabbages and onions. Overall inflation is expected to remain within the target range in the near term, assuming a de-escalation of the conflict in the Middle East, supported by appropriate monetary policy actions, government interventions, expected stability in food prices and a stable exchange rate.
-
The growth of the Kenyan economy accelerated to 5.3% in the first quarter of 2026, compared to 4.9% in the first quarter of 2025, reflecting broad-based growth across all sectors of the economy, with stronger growth in the industry and services sectors. The economy is projected to grow by 4.9% in 2026 and 5.3% in 2027, compared to 4.6% in 2025. The outlook is supported by a robust industrial sector, resilient services and stable agricultural growth. However, the growth outlook remains subject to risks arising from a prolonged conflict in the Middle East, elevated trade policy uncertainties and the potential adverse effects of the El Niño weather phenomenon.
-
The current account deficit is estimated at 3.0% of GDP in the 12 months to June 2026, compared to 1.9% of GDP in a similar period in 2025, mainly due to a higher trade deficit and lower secondary income transfers. Goods exports increased by 8.9%, driven mainly by horticulture, tea, and machinery and transport equipment, while goods imports increased by 13.1%, reflecting higher imports of food, mineral fuels, and intermediate and capital goods. Services receipts increased by 8.3%, mainly supported by travel services receipts, while diaspora remittances declined by 2.4%. The current account deficit is projected at 3.0% of GDP in 2026, compared to 2.1% in 2025, mainly reflecting increased imports of mineral fuels due to higher international oil prices, lower remittances and export receipts. The deficit is expected to be more than fully financed by financial and capital account inflows, resulting in an overall balance of payments surplus of USD 2.485 billion in 2026. CBK foreign exchange reserves stood at USD 15.249 billion, equivalent to 6.3 months of import cover, providing an adequate buffer against short-term domestic and external shocks.
-
The banking sector remains stable and resilient, with strong liquidity and capital adequacy ratios. The ratio of gross non-performing loans (NPLs) to gross loans stood at 14.6% in July 2026, down from 15.4% in April 2026 and 17.6% in August 2025. Decreases in NPLs were noted in the manufacturing, building and construction, trade, agriculture and real estate sectors. Banks have continued to make adequate provisions for NPLs.
-
Growth in commercial banks’ lending to the private sector remained strong at 10.2% in July 2026, despite the decline from 10.6% in June 2026 and -2.9% in January 2025. Credit growth to key sectors of the economy, particularly trade, building and construction, agriculture and consumer durables, remained strong, reflecting improved demand for credit in line with declining lending interest rates. Average commercial banks’ lending rates declined to 14.3% in July 2026 from 14.4% in June 2026 and 17.2% in November 2024.
-
The CEOs Survey and Market Perceptions Survey conducted in July 2026 revealed sustained optimism regarding business activity and economic growth prospects over the next 12 months. The optimism was attributed to continued macroeconomic stability, Government support for the agriculture sector, prospects for favourable weather conditions, increased infrastructure spending, increased digital innovations, a stable exchange rate and improved private sector credit growth. Nevertheless, respondents remained concerned about elevated global uncertainties arising from the conflict in the Middle East and high energy costs.
-
A majority of respondents to the July 2026 Agriculture Sector Survey expect inflation to remain within the target range in the near term, supported by stable food and fuel prices and exchange rate stability. However, some respondents expect moderate upward pressure on inflation due to concerns over higher energy prices arising from elevated international oil prices following the conflict in the Middle East.
-
Global growth is projected to moderate to 3.0% in 2026 from 3.5% in 2025, mainly due to higher energy prices arising from the conflict in the Middle East. Other key risks to global growth include elevated trade policy uncertainty and the Russia-Ukraine conflict. Global inflation is expected to increase to 4.7% in 2026 from 4.1% in 2025 on account of higher energy prices and transport costs. Inflation rates in most major economies have increased in recent months and remained above their respective targets due to higher energy prices and persistent core inflation. Central banks in most major economies have maintained their policy rates as they continue to assess the impact of the Middle East conflict on their inflation and growth outlooks.
-
The Committee noted the outcome of the implementation of the FY2025/26 Supplementary Budget II, the Budget for FY2026/27, and the planned fiscal consolidation strategy aimed at reducing debt vulnerabilities over the medium term.
The MPC noted that maintaining the Central Bank Rate (CBR) at 8.75% remains appropriate to ensure that inflation expectations remain anchored within the target range and the exchange rate remains stable. The Committee emphasized the need to continue monitoring the evolution of global oil prices and any second-round effects on inflation, as well as other developments in the global and domestic economies, and remains ready to take further action as necessary in line with its mandate. Going forward, we expect the MPC to maintain a cautious approach to monetary policy adjustments, balancing the need to anchor inflation expectations and support exchange rate stability and private sector credit growth, while monitoring the effects of the Middle East conflict and global energy prices. The next MPC meeting is scheduled for October 2026.
Fiscal Policy:
On 11th June 2026, the National Treasury presented Kenya’s FY’2026/2027 National Budget to the National Assembly highlighting that the total budget for FY’2026/27 increased by 3.9% to Kshs 4.8 tn from the Kshs 4.6 tn in FY’2025/2026 revised estimates, while the total revenue inclusive of grants increased by 6.8% to Kshs 3.7 tn from the Kshs 3.4 tn in FY’2025/2026 revised estimates . The increase is mainly due to an 7.2% increase in ordinary revenue to Kshs 3.0 tn for FY’2026/2027, from the Kshs 2.9 tn in FY’2025/26 revised estimates. The expenditure will be funded by revenue collections and grants of Kshs 3.7 tn and borrowings amounting to Kshs 1.1 tn. Of the total borrowing, Kshs 1.1 bn is projected to be domestic while Kshs 116.2 bn is projected to be net foreign borrowing
For the FY’2026/2027, the budget is projected to increase by 3.9% to Kshs 4.8 tn, from Kshs 4.6 tn in FY’2025/2026 revised estimates. The expenditure will be funded by revenue collections and grants of Kshs 3.7 tn and borrowings amounting to Kshs 1.1 tn. The table below summarizes the key buckets and the projected changes:
|
Amounts in Kshs billions unless stated otherwise |
|||
|
Cytonn Report: Comparison between FY’2026/2027 and FY’2025/2026 Budgets Estimates |
|||
|
Item |
FY'2025/26 Revised Estimates |
FY'2026/27 Estimates |
Change y/y |
|
Ordinary Revenue |
2,784.4 |
2,985.7 |
7.2% |
|
Ministerial Appropriation-in-Aid |
619.8 |
644.8 |
4.0% |
|
Total grants |
34.8 |
43.6 |
25.3% |
|
Total Revenue & Grants |
3,439.0 |
3,674.1 |
6.8% |
|
National Government expenditure |
2,837.0 |
2,081.1 |
(26.6%) |
|
Consolidated Funds Services (CFS) |
1,366.6 |
1,501.3 |
9.9% |
|
Development expenditure |
831.1 |
809.0 |
(2.7%) |
|
County Transfer(Equitable share) & Contingencies |
415.0 |
429.0 |
3.4% |
|
Total expenditure |
4,638.4 |
4,820.4 |
3.9% |
|
Fiscal deficit inclusive of grants |
(1199.4) |
(1146.3) |
(4.4%) |
|
Projected Deficit as % of GDP |
(6.4%) |
(5.5%) |
(0.3%) |
|
Net foreign borrowing |
225.8 |
116.2 |
(48.5%) |
|
Net domestic borrowing |
973.6 |
1030.1 |
5.8% |
|
Total borrowing |
1199.4 |
1146.3 |
(4.4%) |
Source: National Treasury of Kenya, www.parliament.go.ke
Key take outs from the table include;
-
The government projects total revenue inclusive of grants for FY’2026/27 to increase by 6.8% to Kshs 3.7 tn (equivalent to 17.6% of GDP), from the Kshs 3.4 tn in FY’2025/2026 revised estimates (equivalent to 18.4% of GDP). The increase is mainly due to a 7.2% increase in ordinary revenue to Kshs 3.0 tn (equivalent to 14.3% of GDP) for FY’2026/2027, from the Kshs 2.8 tn in FY’2025/26 revised estimates (equivalent to 14.9% of GDP),
-
Total expenditure is set to increase by 3.9% to Kshs 4.8 tn (equivalent to 23.2% of GDP), from Kshs 4.6 tn (equivalent to 24.9% of GDP) in the FY’2025/26 revised Budget estimates,
-
National government expenditure is set to decrease by 26.6% to Kshs 2.1 tn (equivalent to 16.2% of GDP), in FY’2025/2026, from Kshs 2.8 tn in the FY’2025/2026 revised budget estimates. Consolidated Funds Services expenditure is set to increase by 9.9% to Kshs 1.5 tn in FY’2026/2027, from Kshs 1.3 tn in the FY’2025/2026 revised budget estimates. Also, Development expenditure is set to decrease by 2.7% to Kshs 809.0 bn, from Kshs 831.1 bn in the FY’2025/2026 revised budget estimates,
-
Although the fiscal deficit is projected to decline by 4.4% to Kshs 1,146.3 bn in FY’2026/2027 from Kshs 1,199.4 bn in FY’2025/2026, the government remains heavily reliant on borrowing to finance its expenditure plans. With the total deficit expected be financed through domestic debt totaling Kshs 1,030.1 bn and foreign debts totaling Kshs 116.2 bn. Notably, Kenya’s public debt burden which stood at 70.2% of GDP as of March 2026, surpassing the 55.0% recommended threshold by 15.2% points, continues to exert pressure on fiscal sustainability and increase the risk of debt distress in the country, and,
-
The budget deficit is projected to decline by 0.3% points to 5.5% of GDP, from the 6.4% of GDP in the FY’2025/2026 budget, mainly as growth in revenues outpace growth in expenditure.
Notably, The National Treasury gazetted the revenue and net expenditures for the second month of FY’2026/2027, ending 31st August 2026, highlighting that the total revenue collected as at the end of August 2026 amounted to Kshs 413.2 bn, equivalent to 13.8 % of the original estimates of Kshs 2,985.7 bn for FY’2026/2027 and is 83.0% of the prorated estimates of Kshs 497.6 bn. The total expenditure amounted to Kshs 780.6 bn, equivalent to 15.1% of the original estimates of Kshs 5,177.5 bn, and is 90.5% of the prorated target expenditure estimates of Kshs 862.9 bn.
Going forward, we believe that the persistent fiscal deficit, owing to expenditure continuing to exceed revenues despite improvements in revenue collection, will require the government to maintain its reliance on borrowing. We therefore expect the government to continue implementing expenditure rationalization measures, particularly through moderating development expenditure, in order to accommodate growing debt maturities and the increasing recurrent expenditure burden while supporting its fiscal consolidation objectives.
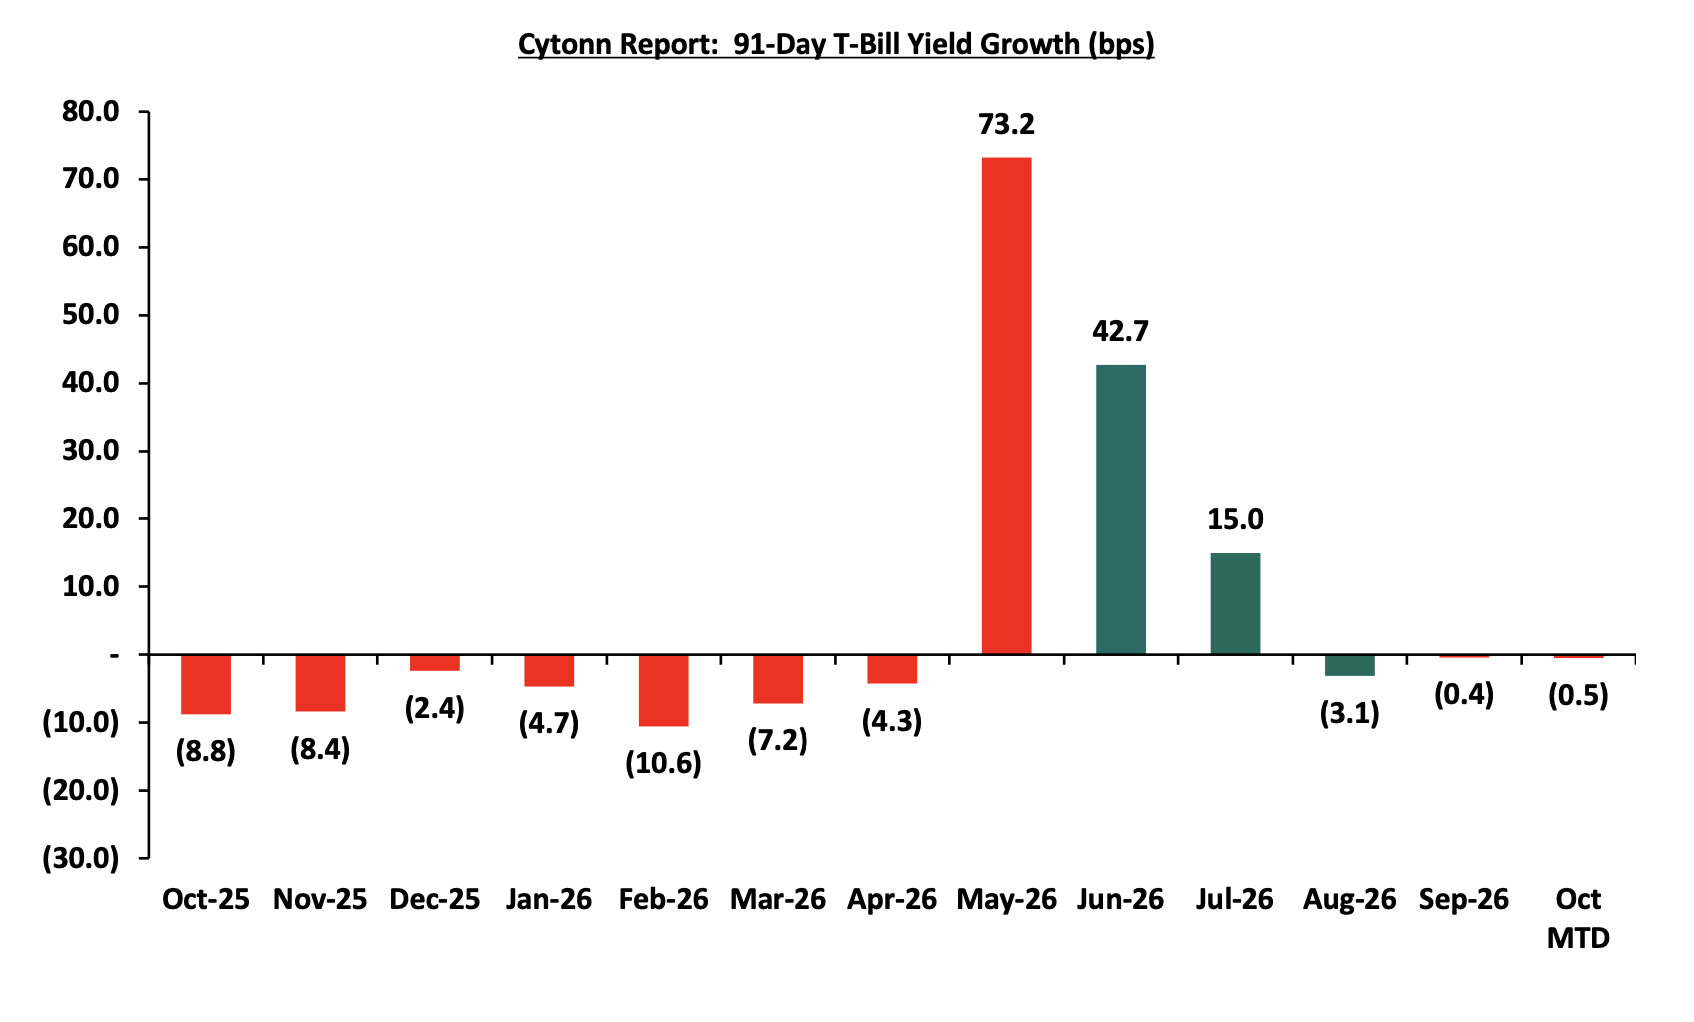
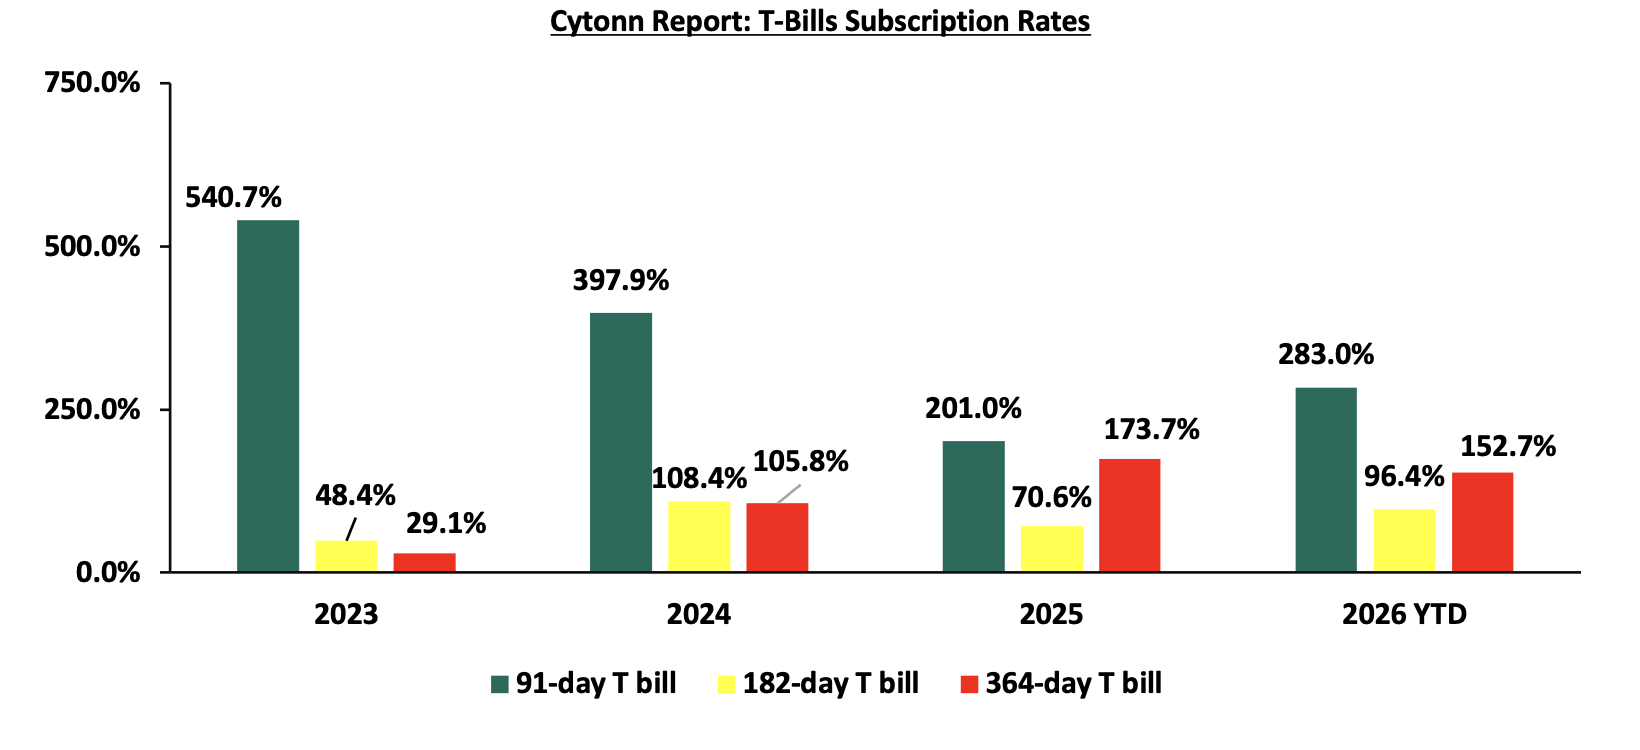
During Q3’2026, T-bills were oversubscribed, with the overall subscription rate coming in at 163.9%, up from 110.6% in Q3’2025. Investors’ preference for the 91-day paper persisted with the paper receiving bids worth Kshs 319.3 bn against the offered Kshs 100.0 bn, translating to an oversubscription rate of 319.2%, higher than the oversubscription rate of 174.6% recorded in Q3’2025. Overall subscription rates for the 182-day papers came in at 128.0%, significantly higher than 59.6% recorded in Q3’2025, while that of the 364-day papers came in at 80.4% which was lower than the 136.1% recorded in Q3’2025. The average yields on the 91-day and 182-day papers both increased by 0.7% points to 8.8% and 8.9% in Q3’2026, respectively, from 8.0% and 8.2%, respectively, in Q3’2025, while the average yield on the 364-day paper decreased by 0.6% points to 9.0% in Q3’2026 from 9.6% in Q3’ 2025. During the period, the acceptance rate stood at 83.1%, down from 89.5% in Q3’2025, with the government accepting bids worth Kshs 490.2 bn out of the Kshs 590.1 bn bids received. The chart below shows the yield growth rate for the 91-day paper during the year:
This week, T-bills were oversubscribed for the ninth consecutive week, with the overall subscription rate coming in at 170.4% higher than the subscription rate of 149.0% recorded the previous week. Investors’ preference for the shorter 91-day paper persisted, with the paper receiving bids worth Kshs 18.0 bn against the offered Kshs 8.0 bn, translating to a subscription rate of 224.8%, slightly higher than the subscription rate of 221.7%, recorded the previous week. The subscription rate for the 182-day paper increased to 191.5% from 127.6% recorded the previous week, while that of the 364-day paper decreased to 105.9% from 112.3% recorded the previous week. The government accepted a total of Kshs 41.2 bn worth of bids out of Kshs 47.7 bn bids received, translating to an acceptance rate of 86.3%. The yields on the government papers were on a downward trajectory, with the yields on the 91-day and 182-day papers decreasing the most by 0.9 bps, to 8.77% and 8.89% respectively from 8.78% and 8.90% respectively, while the yields on the 364-day paper decreased by 0.3 bps to remain relatively unchanged at 9.04% recorded the previous week;
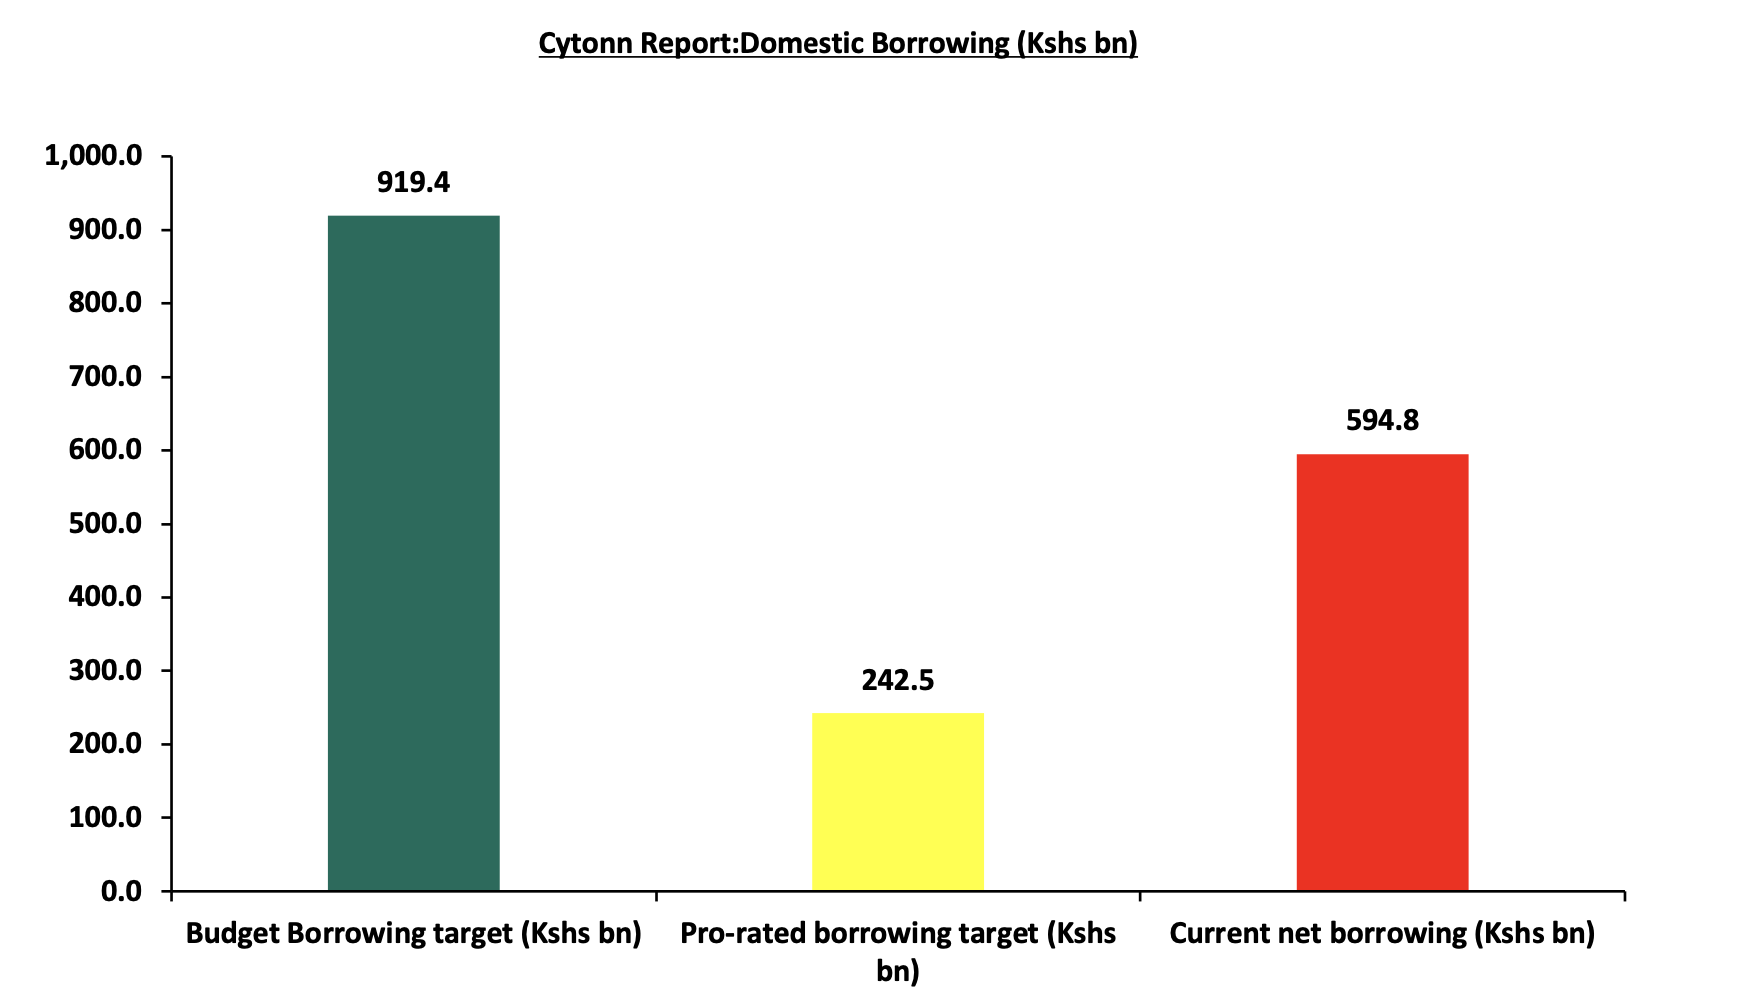
So far in the current FY’2026/27, government securities totaling Kshs 833.0 bn have been advertised. The government has accepted bids worth Kshs 1,155.3 bn, of which Kshs 531.4 bn and Kshs 623.9 bn were treasury bills and bonds, respectively. Total redemptions so far in FY’2026/27 equal to Kshs 560.5 bn, with treasury bills accounting for Kshs 442.3 bn while treasury bonds accounted for Kshs 118.1 bn. As a result, the government has a domestic borrowing surplus of Kshs 594.8 bn in FY’2026/27, which is 35.3% of the total net domestic borrowing target of Kshs 919.4 bn. The chart below shows the government’s current domestic borrowing:
The chart below compares the overall average T-bills subscription rates obtained in 2023, 2024, 2025 and 2026 Year to Date (YTD):
Primary T-Bond Auctions in H1’2026
During Q3’2026, the government re-opened fourteen bonds including three infrastructure bonds, seeking to raise Kshs 380.0 bn. The bonds were generally oversubscribed, receiving bids worth Kshs 840.4 bn against the offered Kshs 380.0 bn, translating to a subscription rate of 221.2%. The government accepted Kshs 543.8 bn of the Kshs 840.4 bn worth of bids received, translating to an acceptance rate of 64.7%. Importantly, the government mostly issued longer-dated bonds, aligning with the government’s objective of lengthening the maturity profile of public debt and reducing refinancing risk. Also, during Q3’2026, the government conducted three bond switch auctions, involving switches from FXD1/2021/005 to FXD1/2012/020 in July, from FXD1/2012/015 and Treasury bills Issue Nos. 2685/091, 2646/182 and 2574/364 to FXD4/2019/010 in August and from FXD1/2013/015 to FXD4/2019/010 in September. FXD1/2012/020 was undersubscribed, receiving bids worth 8.2 bn against the offered 10.0 bn, translating to subscription rate of 81.6 % having an average acceptance yield of 12.8%, FXD4/2019/010 issued in August was oversubscribed, receiving bids worth 22.6 bn against the offered 15.0 bn, translating to subscription rate of 150.6% having an average acceptance yield of 11.2%. FXD4/2019/010 in September was also oversubscribed, receiving bids worth Kshs 13.5 bn against the offered 10.0 bn, translating to subscription rate of 135.2% having an average acceptance yield of 11.0%.
During the week, the Central Bank of Kenya released the auction results for the re-opened treasury bonds FXD3/2019/015 and FXD1/2019/020 with tenors to maturities of 7.8 years and 12.5 years respectively and fixed coupon rates of 12.3% and 12.9% respectively. The bonds were oversubscribed, with the overall subscription rate coming in at 161.1%, receiving bids worth Kshs 80.6 bn against the offered Kshs 50.0 bn. The government accepted bids worth Kshs 57.5 bn, translating to an acceptance rate of 71.4%. The weighted average yield for the accepted bids for the FXD3/2019/015 and FXD1/2019/020 came in at 12.7% and 13.6% respectively. Notably, the 12.7% yield on FXD3/2019/015 was lower than the 12.8% recorded at the last reopening in September 2026 while the 13.6% yield on the FXD1/2019/020 was marginally lower than the 13.61% recorded at the last reopening in September 2026. With the Inflation rate at 6.8% as of September 2026, the real returns of the FXD3/2019/015 and FXD1/2019/020 are 5.9 % and 6.8% respectively. Given the 10.0% withholding tax on the bonds, the tax equivalent yields for shorter term bonds with 15.0% withholding tax are 13.5% for FXD3/2019/015 and 14.4 % for FXD1/2019/020.
|
Cytonn Report: Bond Issuances in Q3’ 2026 |
|
||||||||||
|
Issue Date |
Bond Auctioned |
Effective Tenor to Maturity (Years) |
Coupon |
Amount offered (Kshs bn) |
Actual Amount Raised/Accepted (Kshs bn) |
Total bids received (Subscription) |
Average Accepted Yield |
Subscription Rate |
Acceptance Rate |
|
|
|
21/09/2026 |
FXD1/2019/020-Reopened |
12.6 |
12.9% |
60.0 |
33.5 |
43.8 |
14% |
135.7% |
76.4% |
|
|
|
FXD1/2026/030-Reopened |
29.6 |
12.5% |
16.7 |
37.6 |
14% |
44.5% |
|
||||
|
7/09/2026 |
FXD4/2019/010-Switch |
3.2 |
12.3% |
10.0 |
11.0 |
13.5 |
11% |
135.2% |
81.5% |
|
|
|
2/09/2026 |
FXD3/2019/015-Reopened |
7.9 |
12.3% |
60.0 |
41.1 |
57.1 |
12.8% |
113.7% |
72.0% |
|
|
|
SDB1/2011/030-Reopened |
14.4 |
12.0% |
6.6 |
11.1 |
13.8% |
59.6% |
|
||||
|
12/08/2026
|
IFB1/2019/016-Reopened |
9.3 |
11.8% |
150.0 |
112.6 |
166.22 |
12.2% |
306.9% |
67.8% |
||
|
IFB1/2021/018-Reopened |
12.7 |
12.7% |
105.5 |
154.90 |
12.7% |
68.1% |
|||||
|
IFB1/2021/018-Reopened |
16.2 |
12.7% |
93.9 |
139.28 |
13.1% |
67.4% |
|
||||
|
26/08/2026
|
FXD4/2019/010-Switch |
3.2 |
12.3% |
15.0 |
22.5 |
22.6 |
11.2% |
150.6% |
99.7% |
|
|
|
22/07/2026
|
FXD1/2019/020 - Reopened |
12.8 |
12.9% |
40.00 |
12.2 |
24.0 |
13.9% |
214.8% |
51.1% |
|
|
|
FXD1/2022/025-Reopened |
21.4 |
14.2% |
51.0 |
62.0 |
14.4% |
82.4% |
|
||||
|
15/07/2026 |
FXD1/2012/020-Switch |
6.3 |
12.0% |
10.00 |
8.0 |
8.2 |
12.8% |
81.6% |
97.5% |
|
|
|
08/07/2026 |
FXD1/2022/010-Reopened |
5.8 |
13.5% |
70.0 |
51.0 |
104.0 |
12.8% |
178.3% |
49.1% |
|
|
|
FXD1/2021/020-Reopened |
15.2 |
13.4% |
13.5 |
20.9 |
14.3% |
64.9% |
|
||||
|
FXD1/2026/030-Reopened |
29.2 |
12.5% |
6.0 |
19.7 |
14.6% |
30.7% |
|
||||
|
Q3’2026 Total |
|
|
380.0 |
543.8 |
840.4 |
|
|
|
|
||
|
Q3’2025 Total |
|
|
250.0 |
405.3 |
713.1 |
|
|
|
|
||
|
Q3’2026 Average |
15.6 |
12.8% |
|
|
|
13.5% |
221.2% |
64.7% |
|
||
|
Q3’2025 Average |
14.4 |
13.2% |
|
|
|
13.8% |
285.3% |
56.8% |
|
||
Source: Central Bank of Kenya (CBK) and National Treasury
Secondary Bond Market Activity:
-
Bond Turnover:
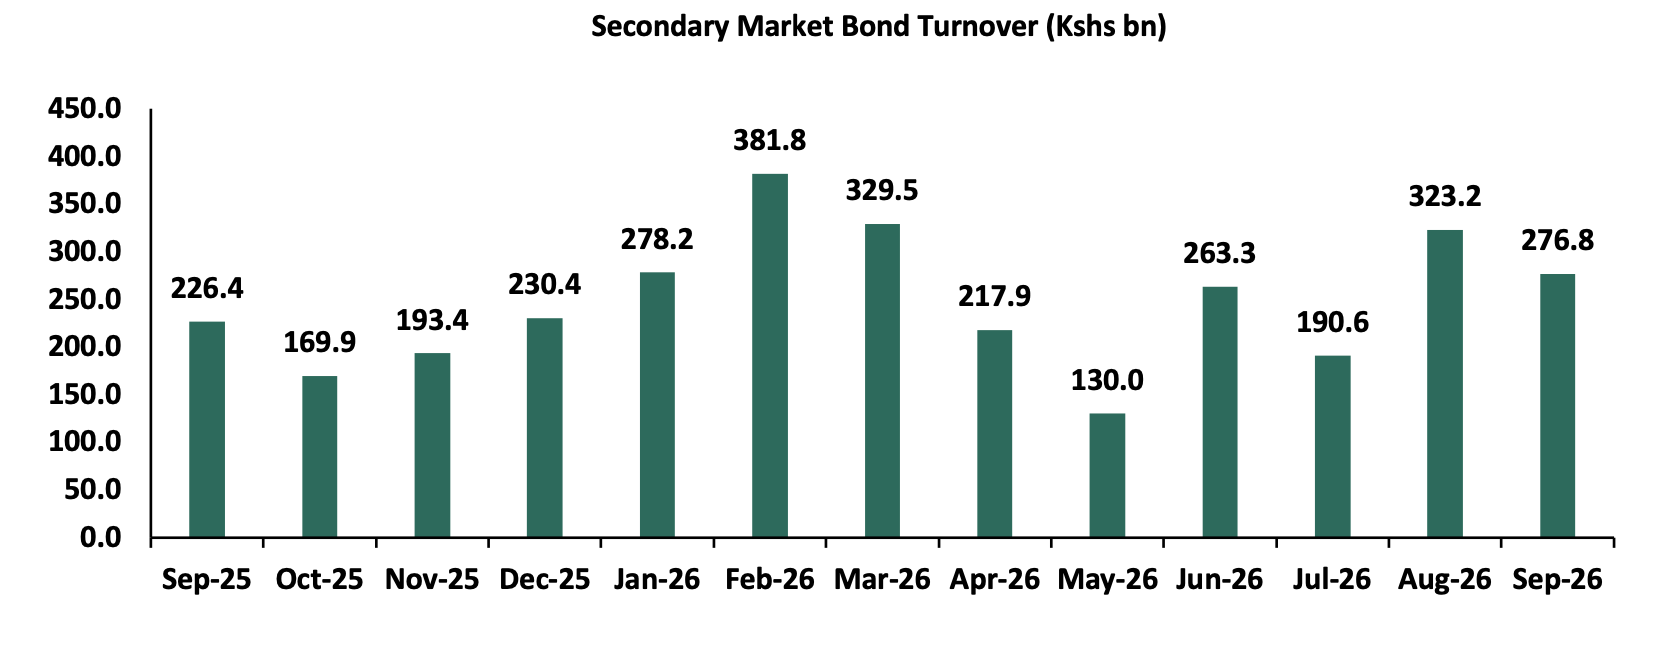
The secondary bond market recorded increased activity, with the total bond turnover increasing by 21.2% to Kshs 790.5 bn from Kshs 652.2 bn in Q3’2025, pointing towards increased activities by commercial banks in the secondary bond market. On a year-on-year basis, the bond turnover increased by 22.2% to Kshs 276.8 bn in September 2026, from Kshs 226.4 bn worth of treasury bonds transacted over a similar period last year. The chart below shows the bond turnover over the past 12 months;
-
Yield Curve:
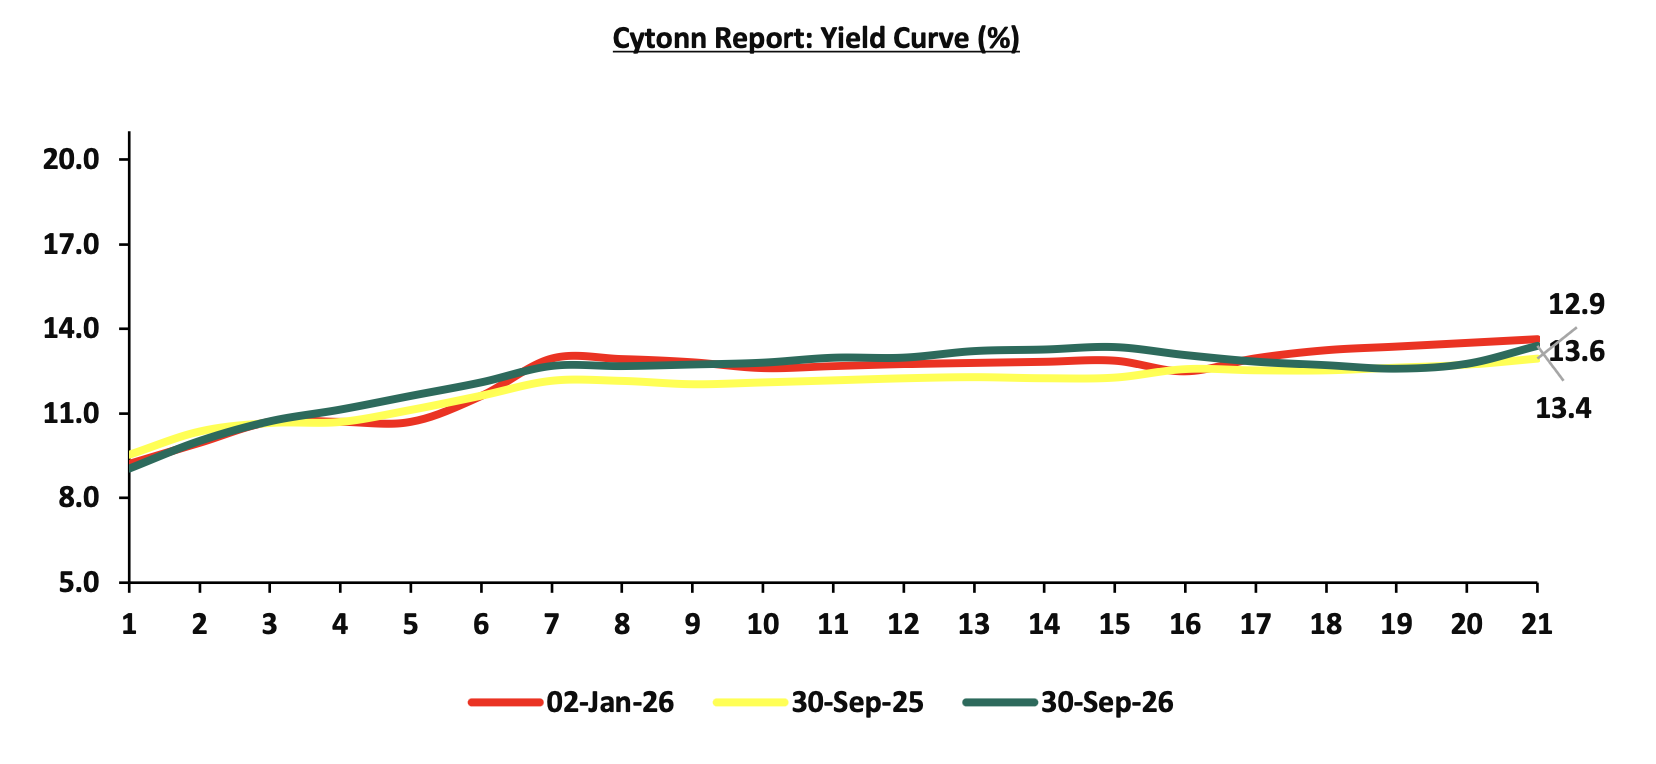
During Q3’2026, yields on the government securities recorded a mixed performance compared to the same period in 2025. This was primarily driven by the Central Bank of Kenya's pause in its rate-cutting cycle, increased government domestic borrowing and the rise in inflation, which prompted investors to demand higher yields to preserve real returns.
Notably, the yield curve has adjusted towards a normal upward sloping curve, with long-term bonds registering highest yields. The shift in sentiment indicates increased confidence in the economic landscape. The chart below shows the yield curve movement during the period:
Money Market Performance
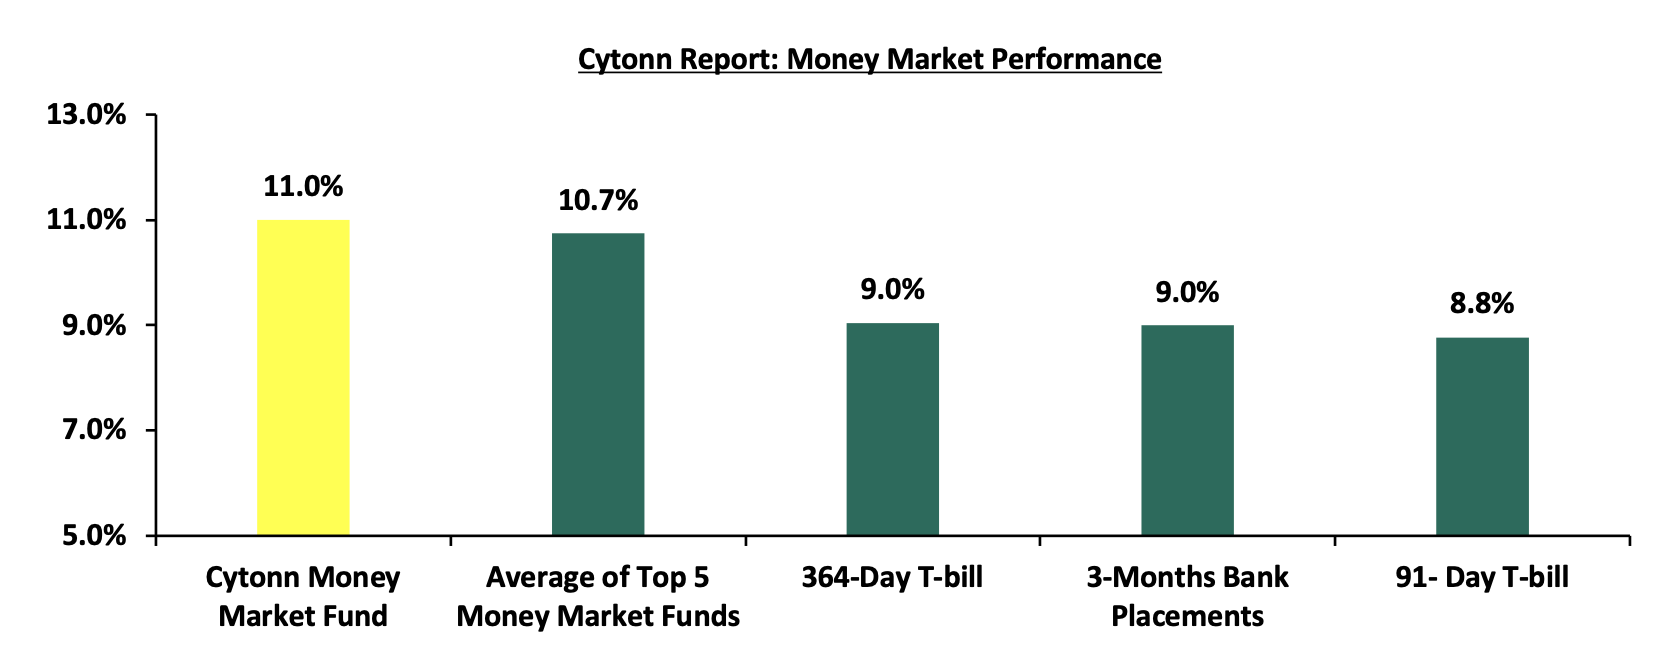
The 3-month bank placements recorded 9.0% at the end of Q3’2026, 0.5% points lower than the 9.5% recorded at the end of Q3’2025 (based on what we have been offered by various banks). The average yields on 91-day papers increased by 0.9% points to 8.8% from 7.9%, in Q3’2025, while that of the 364-day papers decreased by 0.6% points to 9.0% from 9.6% in Q3’ 2025. The average Top 5 Money Market Funds decreased by 1.8% points to 10.7%, from 12.5% at the end of Q3’2025. The yield on the Cytonn Money Market (CMMF) decreased by 1.8% points to 11.0% at the end of Q3’2026, from 12.8% recorded at the end of Q3’2025.
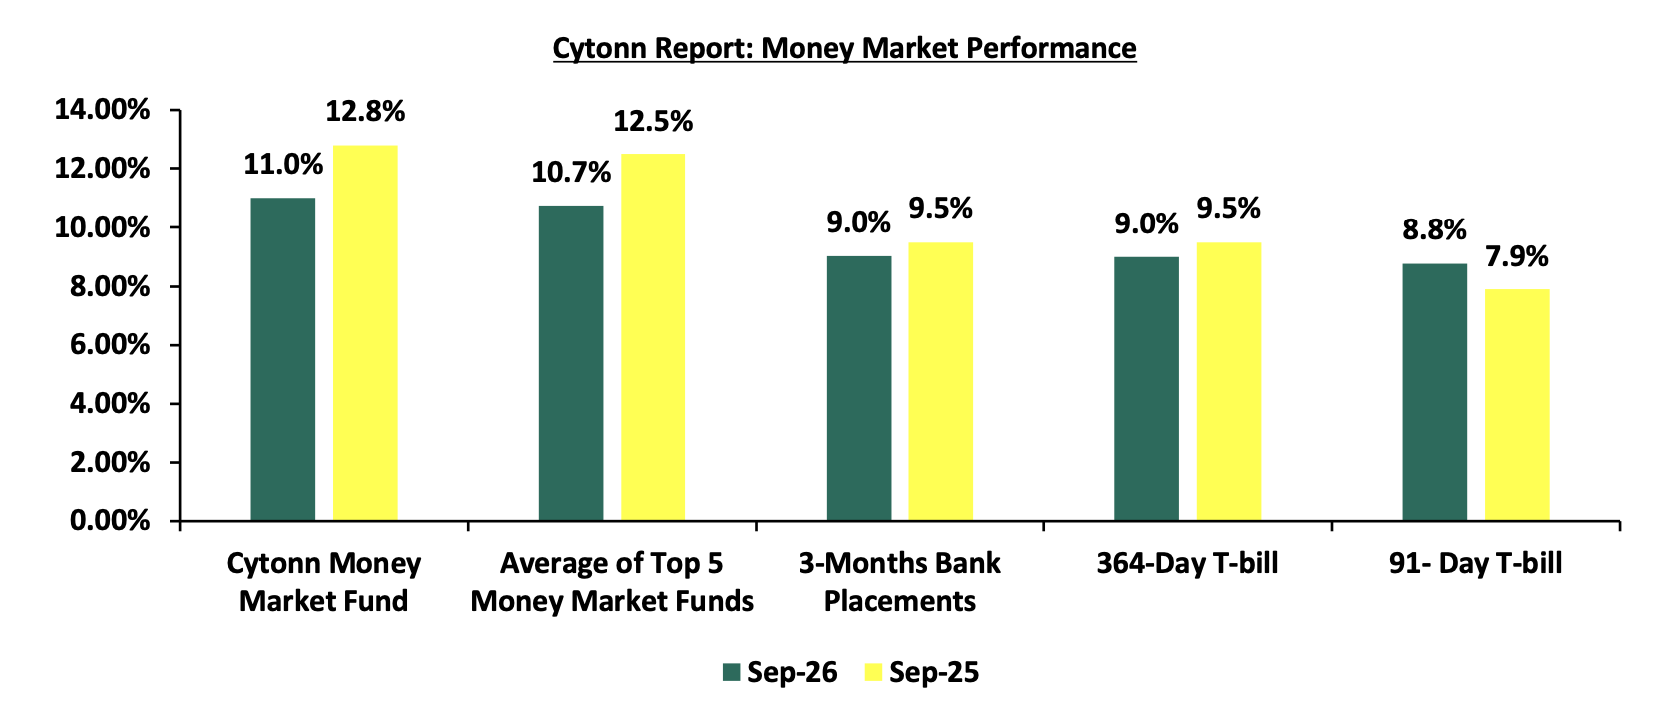
In the money markets, 3-month bank placements ended the week at 9.0% (based on rates offered by various banks. The yields on the 91-day decreased by 0.9 bps, to 8.77% from 8.78%, while the yields on the 364-day paper decreased by 0.3 bps to remain relatively unchanged at 9.04% recorded the previous week. The yield on the Cytonn Money Market Fund remained unchanged at 11.0%, while the average yields on the Top 5 Money Market Funds decreased by 3.4 bps to 10.75% from 10.78% recorded the previous week.
The table below shows the Money Market Fund Yields for Kenyan Fund Managers as published on 2nd October 2026:
|
Cytonn Report: Money Market Fund Yield for Fund Managers as published on 2nd October 2026 |
||
|
Rank |
Fund Manager |
Effective Annual Rate |
|
1 |
Cytonn Money Market Fund ( Dial *809# or download Cytonn App) |
11.0% |
|
2 |
Nabo Africa Money Market Fund |
10.8% |
|
3 |
Faulu Money Market Fund |
10.8% |
|
4 |
Lofty-Corban Money Market Fund |
10.7% |
|
5 |
Enwealth Money Market Fund |
10.6% |
|
6 |
Madison Money Market Fund |
10.6% |
|
7 |
Jubilee Money Market Fund |
10.5% |
|
8 |
Ndovu Money Market Fund |
10.5% |
|
9 |
Arvocap Money Market Fund |
10.5% |
|
10 |
Orient Kasha Money Market Fund |
10.4% |
|
11 |
Globetec Money Market Fund |
10.4% |
|
12 |
Kuza Money Market fund |
10.4% |
|
13 |
Rejesha Money Market Fund |
10.3% |
|
14 |
Old Mutual Money Market Fund |
10.3% |
|
15 |
Gulfcap Money Market Fund |
10.1% |
|
16 |
Etica Money Market Fund |
10.0% |
|
17 |
British-American Money Market Fund |
9.8% |
|
18 |
SanlamAllianz Money Market Fund |
9.8% |
|
19 |
Apollo Money Market Fund |
9.6% |
|
20 |
KCB Money Market Fund |
9.3% |
|
21 |
Dry Associates Money Market Fund |
9.3% |
|
22 |
GenAfrica Money Market Fund |
9.3% |
|
23 |
Genghis Money Market Fund |
9.0% |
|
24 |
CIC Money Market Fund |
8.4% |
|
25 |
CPF Money Market Fund |
8.4% |
|
26 |
AA Kenya Shillings Fund |
8.2% |
|
27 |
Mayfair Money Market Fund |
8.2% |
|
28 |
Co-op Money Market Fund |
8.0% |
|
29 |
Mali Money Market Fund |
8.0% |
|
30 |
ICEA Lion Money Market Fund |
7.7% |
|
31 |
Absa Shilling Money Market Fund |
7.3% |
|
32 |
Ziidi Money Market Fund |
6.1% |
|
33 |
Stanbic Money Market Fund |
5.4% |
|
34 |
Equity Money Market Fund |
3.8% |
Source: Business Daily
Liquidity:
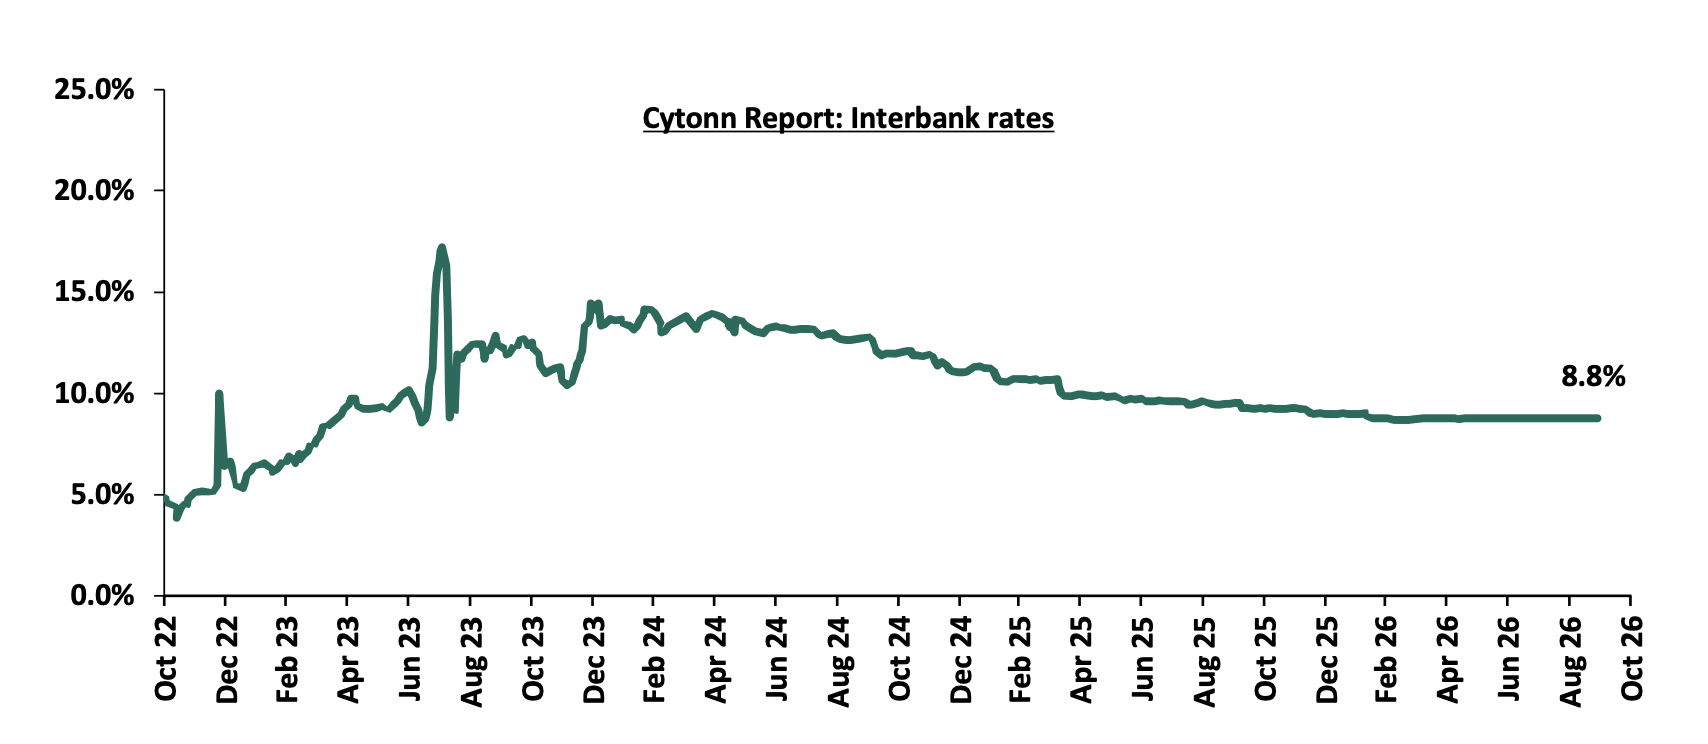
In Q3’2026, liquidity in the money markets eased, as evidenced by the decrease in the interbank rate by 0.8% points to 8.8%, from 9.6% in Q3’2025, partly attributable to government payments that offset tax remittances. Additionally, the average volumes traded in the interbank market decreased by 5.5% to Kshs 11.8 bn, from Kshs 12.4 bn recorded in Q3’2025.
During the week, liquidity in the money markets eased, with the average interbank rate decreasing marginally by 0.04 bps to remain relatively unchanged at 8.8%, partly attributable to government payments that offset tax remittances. The average interbank volumes traded decreased by 34.4% to Kshs 9.5 bn from Kshs 14.5 bn recorded the previous week. The chart below shows the interbank rates in the market over the years.
Kenya Eurobonds:
During Q3’2026, the yields on Eurobonds recorded an upward trajectory with the yield on the 30-Year Eurobond issued in 2018 increasing the most by 254.9 bps to 9.8% from 7.3% recorded at the beginning of the quarter.
During the week, the yields on Eurobonds were on an upward trajectory, with the yield on the 10-Year Eurobond issued in 2018 increasing the most by 75.6 bps to 7.6% from 6.9% recorded the previous week. The table below shows the summary of the performance of the Kenyan Eurobonds as of 2nd October 2026;
|
Cytonn Report: Kenya Eurobonds Performance |
||||||
|
|
2018 |
2019 |
2021 |
2024 |
||
|
Tenor |
10-year issue |
30-year issue |
12-year issue |
13-year issue |
7-year issue |
|
|
Amount Issued (USD) |
1.0 bn |
1.0 bn |
1.0 bn |
1.5 bn |
1.5 bn |
|
|
Years to Maturity |
2.5 |
22.5 |
8.8 |
5.5 |
10.5 |
|
|
Yields at Issue |
7.3% |
8.3% |
6.2% |
10.4% |
9.9% |
|
|
2-Jan-26 |
6.1% |
8.8% |
7.2% |
7.8% |
7.1% |
|
|
01-Jul-26 |
6.8% |
7.3% |
7.5% |
8.0% |
7.1% |
|
|
24-Sep-26 |
6.9% |
9.4% |
8.0% |
8.5% |
7.8% |
|
|
25-Sep-26 |
7.1% |
9.5% |
8.2% |
8.7% |
7.9% |
|
|
28-Sep-26 |
7.4% |
9.6% |
8.5% |
9.0% |
8.1% |
|
|
29-Sep-26 |
7.3% |
9.6% |
8.4% |
8.8% |
8.0% |
|
|
30-Sep-26 |
7.3% |
9.5% |
8.4% |
8.9% |
8.0% |
|
|
01-Oct-26 |
7.6% |
9.8% |
8.8% |
9.2% |
8.3% |
|
|
Weekly Change |
0.8% |
0.4% |
0.7% |
0.7% |
0.5% |
|
|
QTD Change |
0.9% |
2.5% |
1.3% |
1.3% |
1.2% |
|
|
YTD Change |
1.6% |
1.0% |
1.6% |
1.4% |
1.2% |
|
Source: Central Bank of Kenya (CBK)
Weekly Highlights
I. October 2026 Monetary Policy Committee (MPC) Meeting
The Monetary Policy Committee (MPC) is scheduled to meet on 7th October 2026, to review the outcome of its previous policy decisions and recent global and domestic economic developments, and to decide on the direction of the Central Bank Rate (CBR). In their previous meeting held on 11th August 2026, the Committee determined that the current monetary policy stance, with the CBR unchanged at 8.75%, remained appropriate to keep inflation expectations anchored within the target range of 2.5%-7.5% and maintain exchange rate stability. Additionally, the MPC noted the need to monitor the evolution of global oil prices and any potential second round effects on inflation, alongside developments in the global and domestic economies, standing ready to take further action as necessary to ensure price stability and support its mandate.
The main goal of monetary policy is to maintain price stability and support economic growth by controlling the money supply in the economy. We expect the MPC to maintain the Central Bank Rate (CBR) at 8.75%, with their decision mainly being supported by;
-
Global monetary policy stance: The latest meetings show a shift towards tighter monetary policy as central banks respond to energy-driven inflation linked to the conflict in the Middle East. The US Federal Reserve raised the federal funds rate by 25.0 bps to 3.75%-4.00% in September, its first hike since 2023. The European Central Bank raised its deposit rate by 25.0 bps to 2.50%, and the Bank of Japan raised its policy rate by 25.0 bps to 1.25%. Closer home, the South African Reserve Bank raised its repo rate by 25.0 bps to 7.25%, citing the persistence of fuel price shocks and rising global interest rates. On the other hand, the Bank of England maintained its Bank Rate at 3.75%, although three members voted for a hike. The Swiss National Bank maintained its policy rate at 0.0%, and the Bank of Canada held at 2.25%. This tightening bias limits the room for the MPC to lower the CBR without risking capital outflows and pressure on the Shilling. However, with domestic inflation still within the target range, there is no immediate need to follow with a hike. This makes holding the CBR at 8.75% the most appropriate stance.
-
The need to support the economy: Private sector indicators point to the need for a supportive monetary stance. The Stanbic Bank PMI declined to 49.7 in August 2026, from 51.3 in July 2026, signaling a marginal deterioration in operating conditions as firms cut output and purchases amid elevated input costs. Growth expectations have also been revised downwards, the CBK now projects 2026 growth at 4.9%, from 5.3% earlier, and the World Bank cut its forecast to 4.3%. At the same time, private sector credit growth improved to 10.2% in July 2026, supported by the decline in average lending rates to 14.3%. However, lending rates remain elevated, and a rate hike could undermine this recovery. Maintaining the policy rate at 8.75% therefore offers the most balanced approach. It supports credit growth and business confidence while allowing the CBK to monitor external risks, particularly energy-driven inflation, without adding strain to an already fragile economy.
-
The continued stability of the Shilling against major currencies: The Kenyan Shilling has remained relatively stable, depreciating marginally by 29.4 bps against the US Dollar to Kshs 129.76 as at 2nd October 2026, from Kshs 129.38 at the last MPC meeting. It is supported by forex reserves of USD 14.9 bn, equivalent to 6.1 months of import cover as of 2nd October 2026, comfortably above the statutory minimum of 4.0 months, and by record monthly diaspora remittances of USD 451.8 mn in August 2026. However, with Brent crude trading above USD 100.0 per barrel, higher oil import costs could increase demand for dollars and put pressure on the Shilling, which would feed into inflation given that Kenya's fuel and most essential imports are priced in dollars. Maintaining the CBR at 8.75% helps anchor investor confidence, preserve currency stability and mitigate the risk of sharp depreciation, while shielding the economy from the inflationary pass-through of a weaker Shilling.
However, we note that inflationary pressures continue to build. Inflation has risen for three consecutive months to 6.8% in September 2026, and core inflation has increased to 4.0% from 3.4% in August 2026. Global oil prices also remain elevated, with Brent crude trading above USD 100.0 per barrel at the end of September 2026. EPRA has noted higher landed costs for diesel and kerosene, which raises the risk of an increase in pump prices at the 15th October 2026 review and further pass-through to transport and food prices. The MPC will therefore need to monitor the evolution of inflation closely. Should inflation continue to rise towards or above the upper bound of the 2.5%-7.5% target range, we would expect the MPC to consider a rate hike in its subsequent meetings to anchor inflation expectations and maintain exchange rate stability.
For a more detailed analysis, please see our Cytonn October 2026 MPC Note
Q3’2026 Notable Highlights:
-
During the month of July, Kenya National Bureau of Statistics (KNBS) released the Q1’2026 Quarterly Gross Domestic Product Report, highlighting that the Kenyan economy recorded a 5.3% growth in FY’2025, higher than the 4.9% growth recorded in Q1’2026. For more information, please see our Cytonn Weekly #27/2026
-
During the month of July, Kenya National Bureau of Statistics (KNBS) released Q1’2026 Quarterly Balance of Payments Report, highlighting that Kenya’s balance of payments position deteriorated by 128.6% in Q1’2026, to a deficit of Kshs 176.0 bn, from a deficit of Kshs 77.0 bn in Q1’2025 and the current account deficit widened by 72.7% to Kshs 120.9 bn in Q1’2026 from the Kshs 70.0 bn deficit recorded in Q1’2025. For more information, please see our Cytonn Weekly #27/2026
-
During the month of July, the President assented to law the Sovereign Wealth Fund Bill, 2026, following its passage by the National Assembly with amendments on 2nd July 2026, giving Kenya a legal vehicle to save part of its oil, mineral and privatization earnings and shield them from political misuse and debt repayment. For more information, please see our Cytonn Weekly #27/2026
-
The Monetary Policy Committee (MPC) met on 11th August, 2026, to review the outcome of its previous policy decisions and decided to maintain the Central Bank Rate (CBR) at 8.75%, unchanged from the June 2026 meeting. For more information, please see our Cytonn Weekly #32/2026,
-
The National Treasury published the 2026 Budget Review and Outlook Paper (BROP), providing a review of the FY’2025/26 budget implementation and updated macroeconomic and fiscal projections for FY’2026/27 and the medium term. For more information, please see our Cytonn Weekly #32/2026,
-
S&P Global Ratings affirmed Kenya's long-term sovereign credit rating at 'B' with a stable outlook in August 2026, even as it warned that the fiscal deficit could widen to 7.1% of GDP in FY2026/27 on revenue shortfalls and pre-election spending, and trimmed its 2026 GDP growth forecast to 4.9% from 5.1% on the back of elevated import costs linked to the Middle East conflict. For more information, please see our Cytonn Monthly August 2026.
Rates in the fixed income market have declined MTD, reversing the recent upward trend. The decline comes despite the CBK's decision to pause its rate-cutting cycle at 8.75%, with inflation remaining elevated at 6.8% but within the CBK's target range of 2.5%-7.5%. The government is 245.3% ahead of its prorated net domestic borrowing target of Kshs 242.5 bn, having a net borrowing position of Kshs 594.8 mn (inclusive of T-bills). We expect investors to maintain a preference for short to medium-term papers as they monitor the pace of government issuance and the path of inflation before committing further out on the curve, with the yield curve likely to remain under upward pressure rather than stabilize, at least until the inflation trajectory becomes clearer.
Market Performance:
During Q3’2026, the equities market was on an upward trajectory, with NSE 20, NSE 10, NSE 25, and NASI gaining by 15.0%, 13.5%, 12.4%, and 9.6%, respectively. The equities market performance during the quarter was driven by gains recorded by large caps such as Equity, DTBK and KCB of 30.9%, 30.3%, and 15.9% respectively. However, the performance weighed down by losses recorded by large cap stocks such as Standard Chartered Bank and NCBA of 3.2% and 0.6% respectively.
During Q3’2026, the banking sector index gained by 13.2% to 288.9 from 255.1 recorded the previous quarter. This is attributable to gains recorded by stocks such as Equity, DTBK and KCB of 30.9%, 30.3%, and 15.9%, respectively. However, the performance was weighed down by losses recorded by large cap stocks such as Standard Chartered Bank and NCBA of 3.2% and 0.6% respectively.
During Q3’2026 equities turnover decreased by 72.6% to USD 560.6 mn from USD 2,044.3 mn in Q2’2026. Foreign investors remained net sellers in Q3’2026 with a net selling position of USD 89.9 mn, from a net selling position of USD 9.3 mn recorded in Q2’2026.
During the week, the equities market was on a downward trajectory, with NSE 20, NSE 25, NSE 10 and NASI losing by 0.9%, 0.9%, 0.7%, and 0.5%, respectively, taking the YTD performance to gains of 39.2%, 37.7%, 36.8% and 32.0% for NSE 10, NSE 20, NSE 25, and NASI respectively. The equities market performance was mainly driven by losses recorded by large cap stocks such as NCBA, Standard Chartered Bank and Equity bank of 2.2%, 1.5% and 1.4% respectively. However, the performance was supported by gains recorded by large-cap stocks such as EABL and Safaricom, of 0.8% and 0.3%, respectively.
Also, during the week, the banking sector index decreased by 1.3% to 289.6 from 293.5 recorded the previous week. This is attributable to losses recorded by large cap stocks such NCBA, SCBK and Equity of 2.2%, 1.5% and 1.4% respectively;
During Q3’2026 equities turnover increased by 55.0% to USD 560.6 mn from USD 361.7 mn recorded in Q’3 2025. Foreign investors remained net sellers in Q’3 2026 with a net selling position of USD 89.9 mn from a net selling position of USD 30.8 mn recorded in Q’3 2025.
During the week, equities turnover decreased by 51.0% to USD 17.5 mn from USD 35.8 mn recorded the previous week, taking the YTD total turnover to USD 3,053.1 mn. Foreign investors became net buyers for the second consecutive week with a net buying position of USD 1.2 mn, from a net buying position of USD 0.5 mn recorded the previous week, taking the YTD foreign net selling position to USD 166.1 mn, compared to a net selling position of USD 92.9 mn recorded in 2025.
The market is currently trading at a price to earnings ratio (P/E) of 7.6x, 31.9% points below the historical average of 11.2x, and a dividend yield of 5.8%, 1.0% above the historical average of 4.8%. Key to note, NASI’s PEG ratio currently stands at 1.0x, an indication that the market is priced relative to its future growth. A PEG ratio greater than 1.0x indicates the market may be overvalued while a PEG ratio less than 1.0x indicates that the market is undervalued.
The charts below indicate the historical P/E and dividend yields of the market;
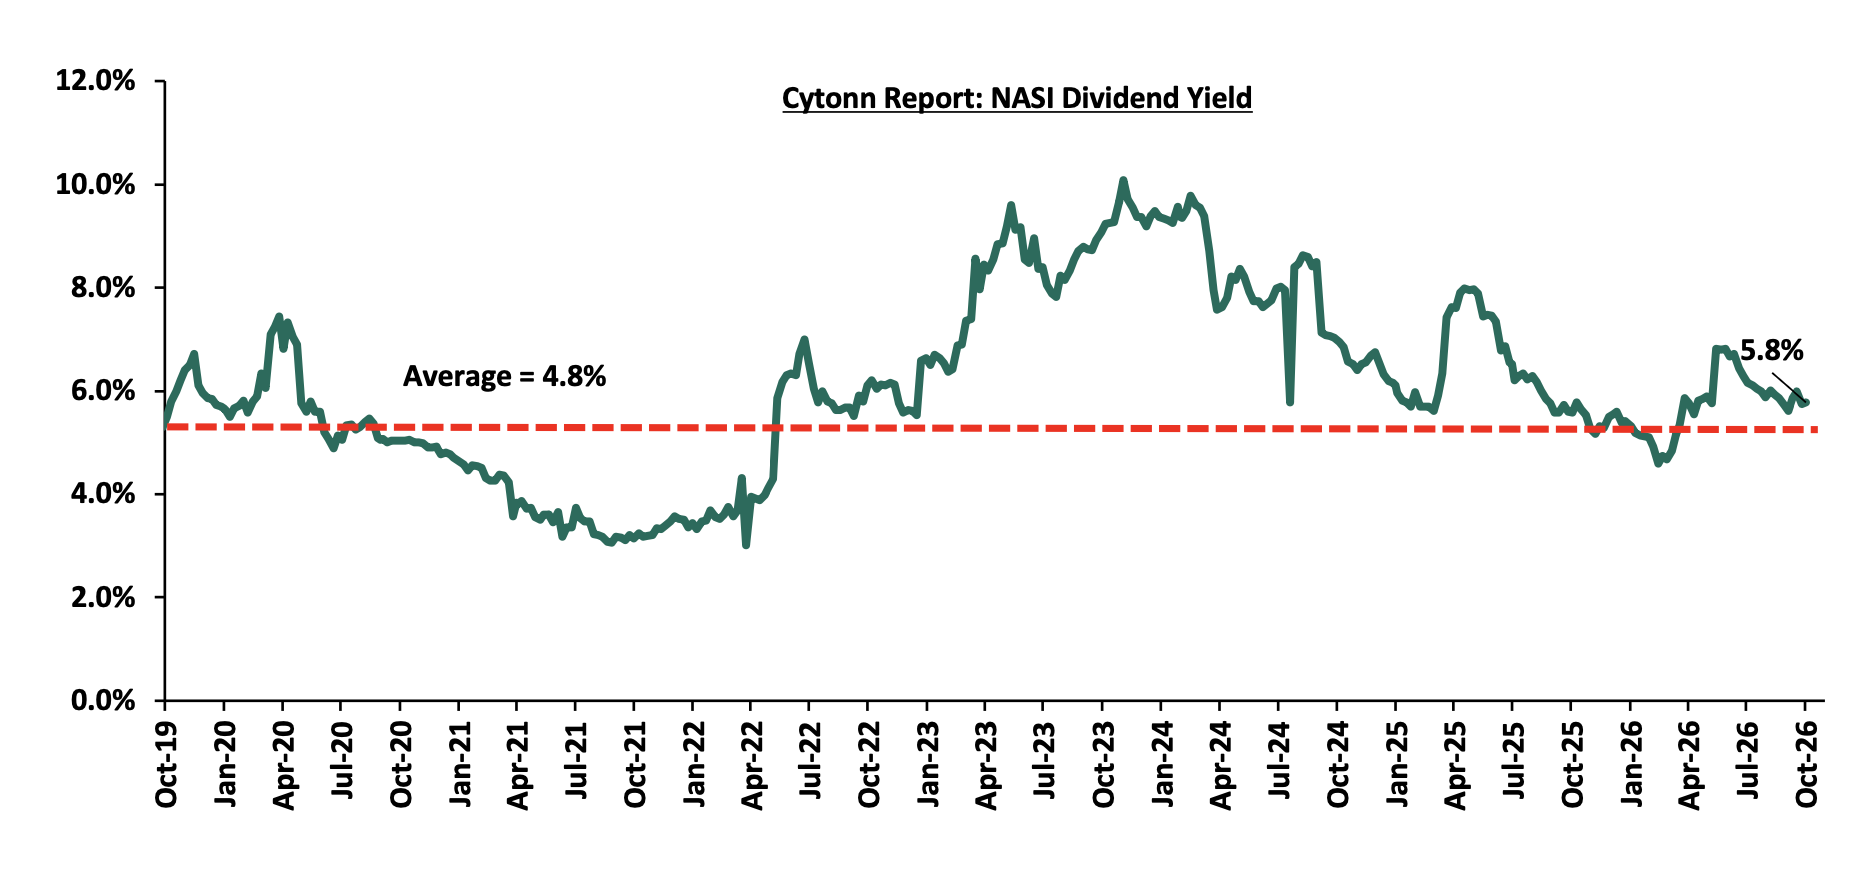
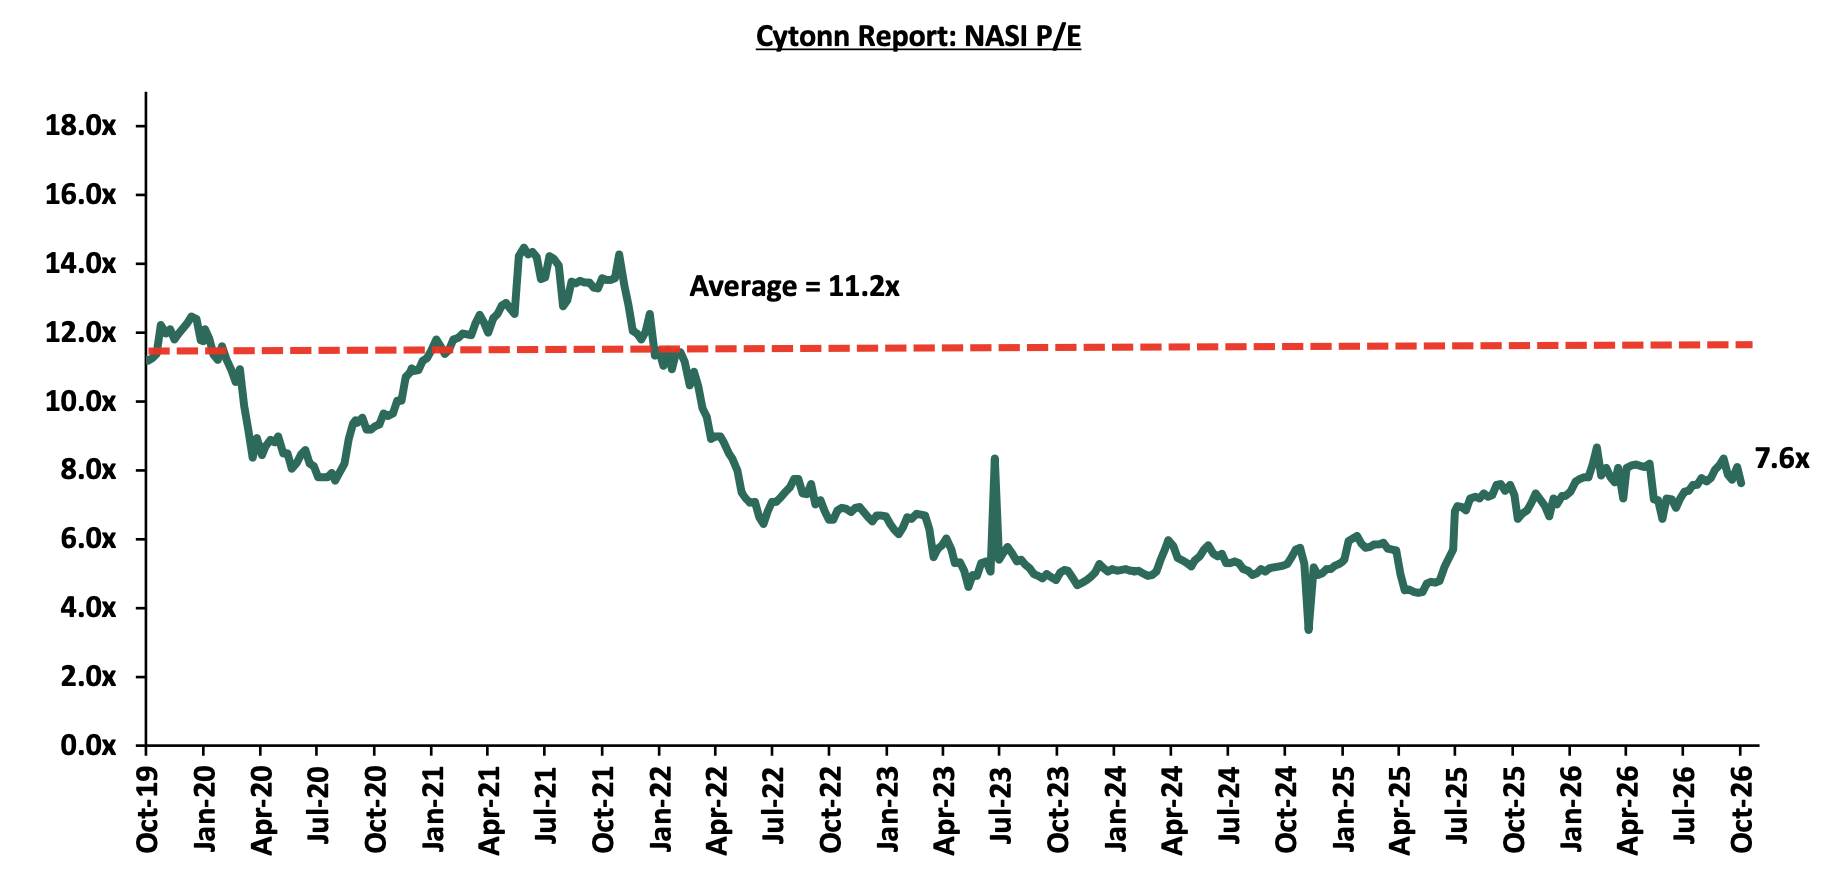
Universe of Coverage:
|
Price as at 25/09/2027 |
Price as at 02/10/2026 |
w/w change |
YTD Change |
Year Open 2026 |
Target Price* |
Dividend Yield |
Upside/ Downside** |
P/TBv Multiple |
Recommendation |
|
|
NCBA |
89.8 |
87.8 |
(2.2%) |
3.2% |
85.0 |
108.9 |
8.1% |
32.2% |
1.2x |
Buy |
|
Co-op Bank |
37.3 |
37.1 |
(0.5%) |
55.0% |
23.9 |
46.1 |
6.7% |
31.2% |
1.4x |
Buy |
|
KCB Group |
93.5 |
92.5 |
(1.1%) |
40.7% |
65.8 |
104.4 |
7.6% |
20.4% |
1.0x |
Buy |
|
Standard Chartered Bank |
324.5 |
319.5 |
(1.5%) |
6.6% |
299.8 |
345.8 |
9.7% |
17.9% |
2.0x |
Accumulate |
|
ABSA Bank |
33.4 |
33.1 |
(1.0%) |
33.0% |
24.9 |
36.8 |
6.2% |
17.7% |
1.8x |
Accumulate |
|
Family Bank |
29.5 |
28.7 |
(2.5%) |
59.4% |
18.0 |
32.5 |
4.2% |
17.4% |
1.5x |
Accumulate |
|
Stanbic Holdings |
282.5 |
280.5 |
(0.7%) |
41.8% |
197.8 |
300.3 |
8.0% |
15.0% |
1.6x |
Accumulate |
|
I&M Group |
85.0 |
82.5 |
(2.9%) |
92.8% |
42.8 |
90.4 |
4.5% |
14.1% |
1.3x |
Accumulate |
|
Equity Group |
107.0 |
105.5 |
(1.4%) |
57.5% |
67.0 |
113.5 |
5.5% |
13.0% |
1.4x |
Accumulate |
|
Diamond Trust Bank |
189.3 |
189.0 |
(0.1%) |
64.7% |
114.8 |
199.5 |
4.8% |
10.3% |
0.5x |
Accumulate |
|
Jubilee Holdings |
403.5 |
399.0 |
(1.1%) |
23.7% |
322.5 |
420.5 |
3.8% |
9.1% |
0.5x |
Hold |
|
CIC Group |
5.1 |
5.1 |
0.0% |
11.5% |
4.5 |
5.0 |
2.6% |
0.6% |
1.3x |
Lighten |
|
Britam |
18.9 |
18.7 |
(1.3%) |
105.8% |
9.1 |
18.5 |
0.0% |
(1.1%) |
1.4x |
Sell |
|
*Target Price as per Cytonn Analyst estimates **Upside/ (Downside) is adjusted for Dividend Yield ***Dividend Yield is calculated using FY’2025 Dividends |
||||||||||
Kenyan Q3’2026 Equities Outlook
Below, we summarize the metrics used in coming up with our Q3’2026 Equities Outlook;
|
|
Cytonn Report: Equities Outlook Summary |
|
|
|
Equities Market Indicators |
Outlook for Q4’2026 |
Current View |
Q4’2026 Outlook |
|
Macro- Economic Environment |
Kenya's economic outlook remains supported by the 5.3% real GDP growth recorded in Q1’2026, compared to 4.9% in Q1’2025. Growth was supported by agriculture, manufacturing, construction, financial services and accommodation activities. Kenya’s GDP is projected to grow by 4.9% in 2026, according to the Central Bank of Kenya (CBK), supported by strong performance in the agriculture and services sectors, alongside a recovery in industrial activity. However, the World Bank cut its 2026 forecast to 4.3% , reflecting downside risks from elevated global energy prices and heightened geopolitical uncertainty. Inflation averaged to 6.6% in Q3’2026 compared to 6.2% in Q2’2026 and 4.4% in Q1’2026, well within the CBK’s target range of 2.5%-7.5% but above the mid-point. Inflation increased by 0.2% points to 6.8% in September 2026 from 6.6% August 2026. Although the increase was driven by The September increase was primarily driven by food and non-alcoholic beverages, transport and housing-related costs, the upward movement presents a potential constraint to household consumption and corporate margins. The Kenyan Shilling remained relatively stable, closing Q3’2026 at Kshs 129.8 against the US Dollar, compared to Kshs 129.6 at the end of Q2’2026. However, the Q4’2026 global economic environment remains exposed to geopolitical tensions in the Middle East, particularly disruptions to oil shipments through the Strait of Hormuz. The resulting upward pressure on international oil prices presents a risk to Kenya’s inflation outlook, given its reliance on imported petroleum products. Higher fuel prices could increase transportation, electricity and production costs, compress corporate profit margins and weaken consumer purchasing power. Furthermore, an increase in the petroleum import bill could widen the current account deficit and exert pressure on the Shilling. These developments may constrain corporate earnings, delay monetary easing and weigh on equity valuations, particularly if higher global interest rates and risk aversion trigger reduced foreign investor participation in emerging markets. Investors should therefore monitor the CBK’s October 7, 2026 Monetary Policy Committee decision for indications of how the Bank intends to balance inflation management, exchange-rate stability and economic growth. Developments in foreign exchange reserves will also be important in assessing the economy’s capacity to withstand external shocks. In addition, international oil prices should be monitored because sustained increases could translate into higher domestic fuel and transport costs, renewed inflationary pressure and increased operating expenses for listed companies. These factors, alongside corporate earnings announcements and foreign investor flows, will be important in assessing the sustainability of the Kenyan equities market’s performance in Q4’2026. |
Neutral |
Neutral |
|
Corporate Earnings Growth |
We expect the listed sector to sustain positive earnings growth in Q4’2026, supported by resilient domestic demand, continued digital financial services adoption and improved revenue diversification across the banking, insurance and telecommunications sectors. The banking sector recorded improved earnings performance in H1’2026, supported by a 14.6% weighted average growth in non-funded income (NFI), compared to a decline of 5.8% in H1’2025. The improvement was primarily driven by growth in fees and commissions, reflecting increased transaction-based income and loan-related fees. Consequently, the listed banks recorded a weighted average core earnings per share growth of 16.3%, compared to 8.4% in H1’2025. The performance highlights the growing contribution of non-interest revenue streams in supporting banking sector profitability amid moderating net interest income growth. Telecommunications earnings are expected to remain supported by mobile financial services, data consumption and digital transactions, with Safaricom's performance remaining an important determinant of sector earnings. Manufacturing, transport and consumer-facing companies may experience continued margin pressures from elevated input costs, fuel prices and inflationary pressures, while firms with pricing flexibility and effective cost management may sustain profitability. However, the outlook remains subject to the pace of monetary easing, consumer purchasing power and the ability of listed companies to translate revenue growth into improved net earnings. |
Positive |
Positive |
|
Valuations |
We expect Kenyan equities to maintain relatively attractive valuations in Q4’2026, supported by a price-to-earnings (P/E) ratio of 7.6x, compared to the 15-year historical average of 11.2x, and a dividend yield of 5.8%, above the historical average of 4.8%. The market's relatively low earnings multiple and attractive dividend income may support selective investment opportunities, particularly in fundamentally sound banking, telecommunications and insurance counters. However, the market's valuation attractiveness should be assessed alongside earnings sustainability, as rising inflation, elevated financing costs and geopolitical uncertainties may constrain corporate profitability and investor risk appetite. Additionally, foreign investor participation remains an important consideration, with sustained capital outflows potentially limiting valuation expansion. Consequently, we expect valuations to remain relatively attractive in Q4’2026, with potential for selective re-rating among companies demonstrating resilient earnings growth, sustainable dividend payouts and strong balance sheets. |
Positive |
positive |
|
Investor Sentiment and Security |
We expect investor sentiment at the Nairobi Securities Exchange to remain cautiously optimistic in Q4’2026, supported by relatively stable macroeconomic conditions, adequate foreign exchange reserves which are currently at USD 1.2 mn and opportunities arising from attractive equity valuations. However, foreign investor participation may remain volatile following the significant net foreign outflows recorded in July and August of USD 26.9 mn and 35.1 mn respectively. In September the foreign outflows stood at USD 27.9 mn. Moreover, Foreign investors remained net sellers in Q’3 2026 with a net selling position of USD 89.9 mn from a net selling position of USD 30.8 mn recorded in Q’3 2025. Nevertheless, the subsequent return of foreign investors to net buying during the week ended September 25th 2026 with net purchases of USD 0.6 mn, and the week ended 2nd October 2026 with a net buying position of USD 1.2 mn indicates the potential for renewed capital participation as market conditions stabilize. Domestic investor participation is expected to remain supported by dividend income and relatively attractive valuations, although inflationary pressures, global interest rate developments and geopolitical uncertainties could constrain risk appetite and liquidity. Consequently, we expect investor sentiment to improve selectively in Q4’2026, particularly toward fundamentally sound counters with resilient earnings, sustainable dividend payouts and strong balance sheets. However, sustained foreign inflows will remain dependent on improved global risk appetite and reduced market volatility. |
Neutral |
Neutral |
Out of the four metrics that we track, two have “positive” and two have “neutral” outlook and therefore our outlook for Q4’2026 remains broadly positive.
Notable Highlights in Q3’2026 include:
-
During the quarter, Quick Mart PLC (Quickmart) announced its intention to list on the Main Investment Market Segment of the Nairobi Securities Exchange (NSE) through an offer for sale (OFS) by its sole shareholder, Sokoni Retail Kenya Limited (SRKL). The proposed Offer comprises 2.0 bn existing ordinary shares with a nominal value of Kshs 0.2 each, representing 50.0% of Quickmart’s issued share capital, with an over-allotment option of up to 15.0% of the Offer Shares that could increase the stake sold to 57.5%; For more information, please see our Cytonn Weekly #38/2026
-
During the quarter, Kenya Power & Lighting Company Plc (KPLC) released its FY’2026 audited financial results, recording a 2.1% increase in profitability to Kshs 25.0 bn, up from Kshs 24.5 bn in FY’2025. For more information, please see our Cytonn Weekly #37/2026;
-
During the quarter, Kenya Electricity Generating Company (KenGen), released its FY'2026 financial results for the period ended 30th June 2026, recording a profit after tax of Kshs 10.4 bn, a 1.2% decrease from the Kshs 10.5 bn recorded in FY’2025, majorly attributable to the 6.8% increase in operating expenses to Kshs 37.5 bn from Kshs 35.1 bn recorded in FY’2025, reflecting cost pressures as well as planned investment in plant maintenance, availability and long-term reliability. For more information, please see our Cytonn Weekly #36/2026;
-
For other notable highlights during the quarter, please see Our Cytonn Monthly August 2026 and Cytonn Monthly July 2026
We maintain a “cautiously optimistic” short-term outlook supported primarily earnings-led attractive valuations, despite heightened geopolitical risks such as Iran war that may weigh on investor sentiment, and, “neutral” in the long term as persistent foreign investor outflows continue to constrain market liquidity and limit broad-based market re-rating. With the market currently trading at a discount to its future growth (PEG Ratio at 1.0x), where performance will be driven by company-specific fundamentals rather than general market direction, we believe that investors should reposition towards value stocks exhibiting strong earnings growth, attractive dividend yields, solid balance sheets, sustainable competitive advantages and trading at compelling discounts to their intrinsic value. While foreign investor sell-offs are expected to continue exerting pressure in the near term, we believe this will create selective entry opportunities for long-term investors
In Q3’2026, the general Real Estate sector continued to witness considerable growth in activity in terms of property transactions and development activities. Consequently, the sector’s activity contribution to Gross Domestic Product (GDP) grew by 5.0% to Kshs 377.5 bn in Q1’2026, from Kshs 353.8 bn recorded during the same period in 2025. In addition, the sector contributed 7.9% to the country’s GDP, 0.1% points decrease from 8.0% recorded in Q1’2025. Cumulatively, the Real Estate and construction sectors contributed 14.0% to GDP, 0.2% points decrease from 14.3% in Q1’2025, attributable to a decline in construction contribution to GDP by 0.1% points, to 6.1% in Q1’2026, from 6.2% recorded in Q1’2025;
The graph below highlights the Real Estate and Construction sectors’ contribution to GDP from 2021 to Q1’2026;
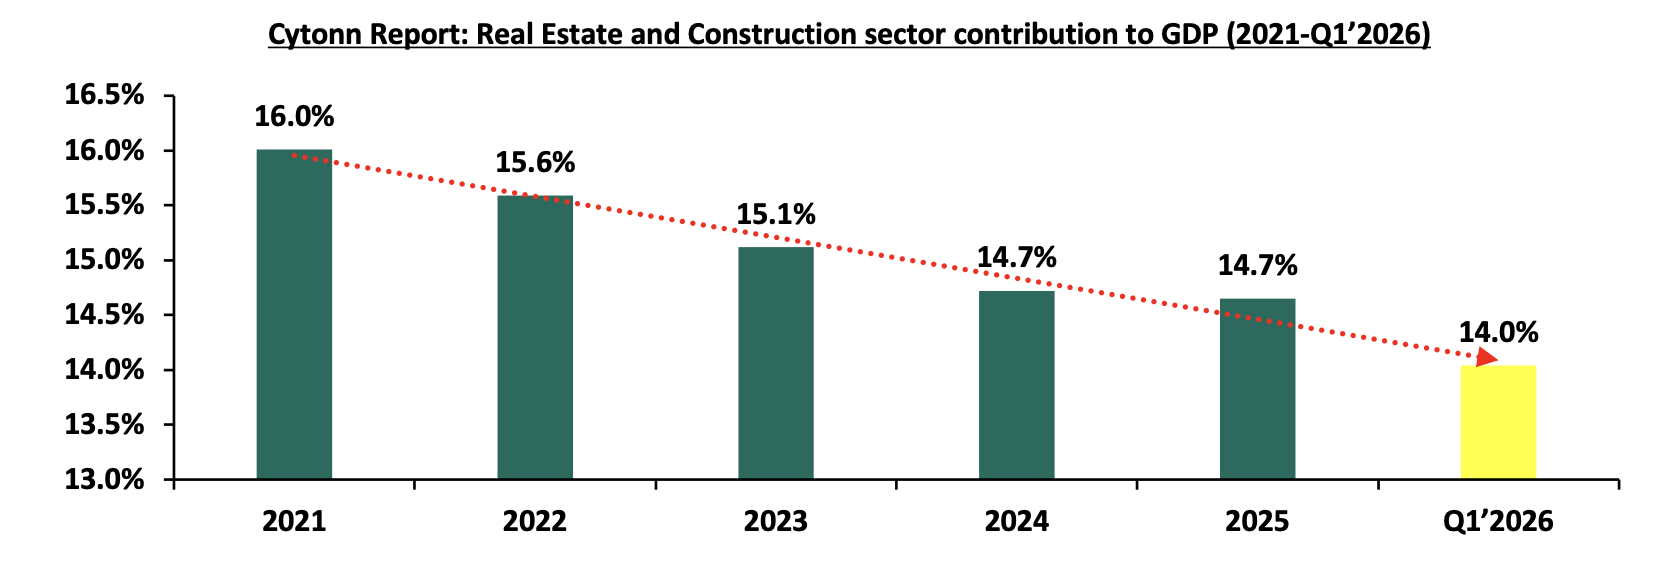
Source: Kenya bureau of statistics (KNBS)
In Q3’2026, Real Estate was promoted by key initiatives as follows:
-
Government’s continued Focus on Affordable Housing: the Kenyan government has maintained its commitment towards the delivery of affordable housing under the Affordable Housing Programme (AHP), which remains a key pillar of the Bottom-Up Economic Transformation Agenda (BETA). As of September 2026, the AHP pipeline comprises 196,846 housing units under construction, with 10,107 units completed since inception in September 2022, according to the State Department for Housing and Urban Development. Additionally, the operationalization of the Affordable Housing Act, 2024, supported by the housing levy, has enhanced resource mobilization, thereby improving project execution and supporting supply in the low- and middle-income housing segments,
-
Infrastructural development: Continuous improvements in infrastructure, such as new roads, bridges, and utilities, have opened up previously inaccessible areas for real estate development. This has led to increased property value and demand in urban and peri-urban areas. The government has continually prioritized infrastructural development in efforts aimed at positioning the country as a regional hub through the implementation of several key projects including, the Ngong Road flyover near Junction Mall and other road improvement initiatives across Nairobi and its environs. Notably, the completion of the Nairobi Western Bypass has stimulated demand for residential development in Ruaka, on the edge of the UN Blue Zone, according to the HassConsult Land Price Index Q2’2026,
-
Provision of affordable mortgage financing: Kenya Mortgage Refinance Company (KMRC) has continued to drive the availability and affordability of home loans to Kenyans by providing single-digit fixed rate, and long-term finance to Primary Mortgage Lenders (PMLs) such as banks and SACCOs. Recently, KMRC, broadened its refinancing services to include non-shareholders, such as SACCOs and microfinance institutions. This is a strategic move to improve access to affordable mortgages, particularly for low and middle-income earners, a key target of Kenya's affordable housing agenda,
-
Aggressive expansion pursued by retailers: the Kenyan retail sector is undergoing a massive transformation, characterized by the rapid growth of both local and global giants. Following the collapse of formerly dominant chains like Tuskys, Nakumatt, Uchumi, and Choppies, a market vacuum emerged. This gap is being aggressively filled by expanding retailers such as Naivas, QuickMart, Carrefour and China square. This momentum is further bolstered by the entry of premium international brands like Adidas, Puma, Aldo, Michael Kors and Nike, signalling a new era of development for the industry,
-
Kenya’s recognition as a regional business hub: Kenya continues to enjoy recognition as a regional business hub. As a result, foreign entities have continued to open business operations in Kenya, boosting the demand for both commercial and residential Real Estate. Increased business activity has driven up demand for office space, apartments, and housing near business hubs, leading to the development of new projects, increased property values, and job creation in the construction sector,
-
Positive Demographics: with relatively high urbanization and population growth rates of 2.9% p.a and 1.9% p.a, respectively, against the global average of 1.4% p.a and 1.0% p.a, respectively, as at 2025, there is a sustained demand for more housing units in the country,
-
Increasing Investor Confidence: Increase in investor confidence has greatly influenced hospitality sector and this is evident through mergers, acquisitions and expansions of hotels. Furthermore, the number of international arrivals into the country by the end of June 2026 registered a 5.9% year-to-year (y/y) increase to 1.2 mn persons in June 2026 from 1.1 mn arrivals recorded in June 2025. Notably, the Hotel Chain Development Pipelines in Africa 2026 Report ranked Nairobi at 4th position by planned number of hotels and rooms with 35 hotels and 6,190 rooms in the pipeline, and,
-
Special Built Developments: There has been an increased popularity of purpose-built properties to host Student housing, medical centres, Diplomatic residentials, data centres which offer potential for growth to the Real Estate sector through alternative markets. Due to these assets classes, the industry remains resilient despite the rapidly changing technological and economic environments, and,
Despite the above drivers, the sector’s optimal performance is expected to be hampered by the following factors in 2026:
-
Existing oversupply of physical space in select sectors: With approximately 5.8 mn SQFT in the NMA commercial office market, approximately 3.0 mn SQFT in the Nairobi Metropolitan Area (NMA) retail market, with the rest of the Kenyan retail market having an oversupply of approximately 1.7 mn SQFT. This has led to prolonged vacancy rates in the respective Real Estate sectoral themes,
-
Subdued REITs Market: The REITs market in Kenya continues to be subdued owing to various challenges such as the large capital requirements of Kshs 100.0 mn for trustees compared to Kshs. 10 mn for pension fund Trustees, which limits the role to banks, prolonged approval process for REITs, only a few legal entities capable of incorporating REITs, high minimum subscription amounts or offer parcels set at Kshs 0.1 mn for D-REITs and 5.0 mn for restricted I-REITs and lack of adequate knowledge of the financial asset class by investors,
-
Constrained Financing to Developers: Access to financing remains a challenge for real estate developers, with elevated credit risk potentially affecting lenders’ appetite for property-related lending. According to the Central Bank of Kenya’s 2025 Bank Supervision Annual Report, real estate accounted for Ksh 113.8 billion, or 16.3%, of the banking sector’s gross non-performing loans as at December 2025. The sector’s gross NPLs represented 16.3% of total banking-sector NPLs, while real estate loans accounted for 11.8% of total gross loans. Although the overall banking-sector gross NPL ratio subsequently declined to 15.3% in May 2026 from 17.6% in August 2025, credit risk remains a consideration in property financing. and,
-
Underdeveloped capital markets: It is difficult to develop pools of capital focused on projects, particularly in the private markets, to supplement government efforts in providing housing. Banks in Kenya are the primary source of funding for real estate developers, providing nearly 95.0% of funding as opposed to 40.0% in developed countries. This means that capital markets contribute only 5.0% of Real Estate development funding, compared to 60.0% in developed countries as shown below;
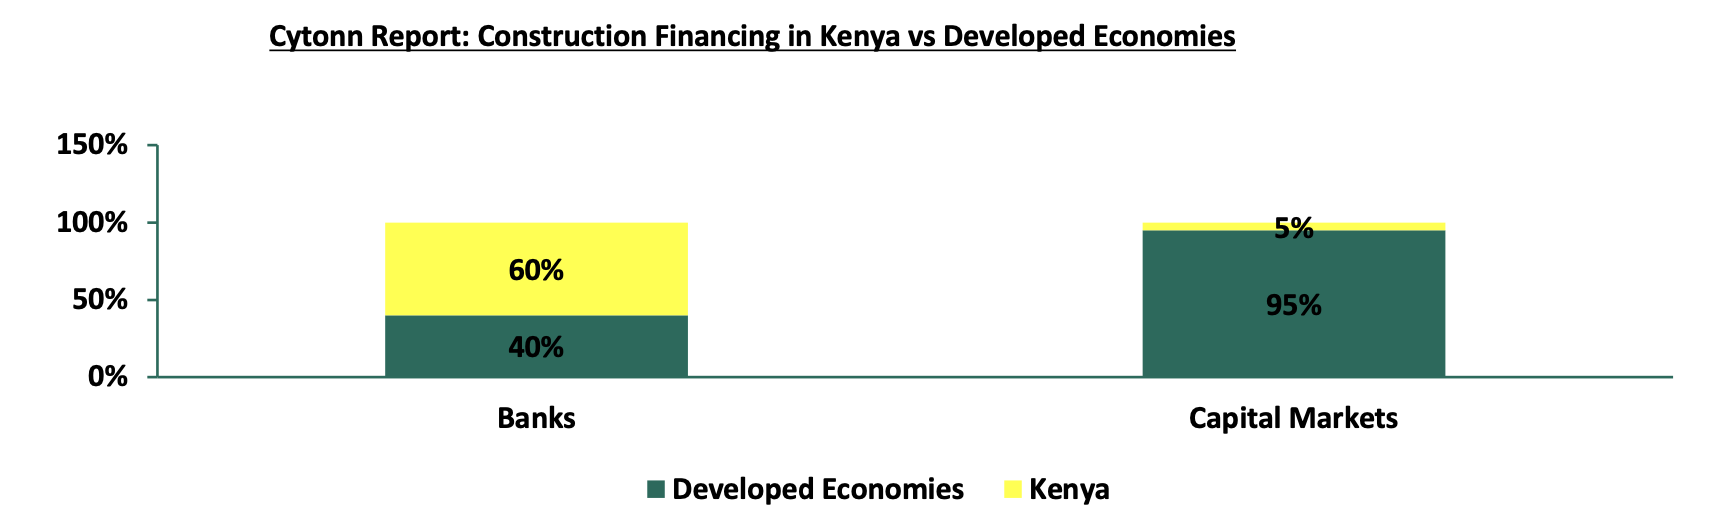
Source: World Bank, Capital Markets Authority
Sectoral Market Performance
-
Industry Report
During the quarter, the following industry reports were released and the key take-outs were as follows;
|
Cytonn Report: Notable Industry Reports in Q3’2026 |
|||
|
# |
Theme |
Report |
Key Take-outs |
|
1. |
Kenya Market Update H1'2026 Report |
Knight Frank’s H1’2026 Kenya Market Update |
|
|
2. |
Land Sector |
Hass Consult Q2’2026 Land Index |
|
|
3. |
Residential Sector |
Hass Consult Q2’2026 Property Index |
|
-
July Leading Economic Indicators (LEI)
During the week, the Kenya National Bureau of Statistics (KNBS) released the Leading Economic Indicators (LEI) July 2026 Report, which highlighted the performance of major economic indicators. The key highlights related to the Real Estate sector include:
-
Cement consumption: In July 2026, cement consumption reached 1.0 metric tonnes, representing an 13.5% y/y increase from 0.9 metric tonnes in July 2025. Quarter-on quarter basis, the consumption decreased by 2.6% from 2.8 recorded in Q1’2026. Month-on-month, consumption decreased by 3.9%, to 893,447 from 929,328 in May attributable to increased construction input cost during the period, such as transport and fuel. The y/y performance was anchored by (i) continued private sector construction activity in urban hubs such as Nairobi, Mombasa, and Kisumu, (ii) government-led infrastructure investments under the Bottom-Up Economic Transformation Agenda (BETA), including roads, affordable housing, water, and sanitation projects, and (iii) public works initiatives in rural and semi-urban areas, which both support livelihoods and expand critical infrastructure.
The chart below shows cement consumption in metric tonnes in Kenya between Q3’2025 and Q3’2026.
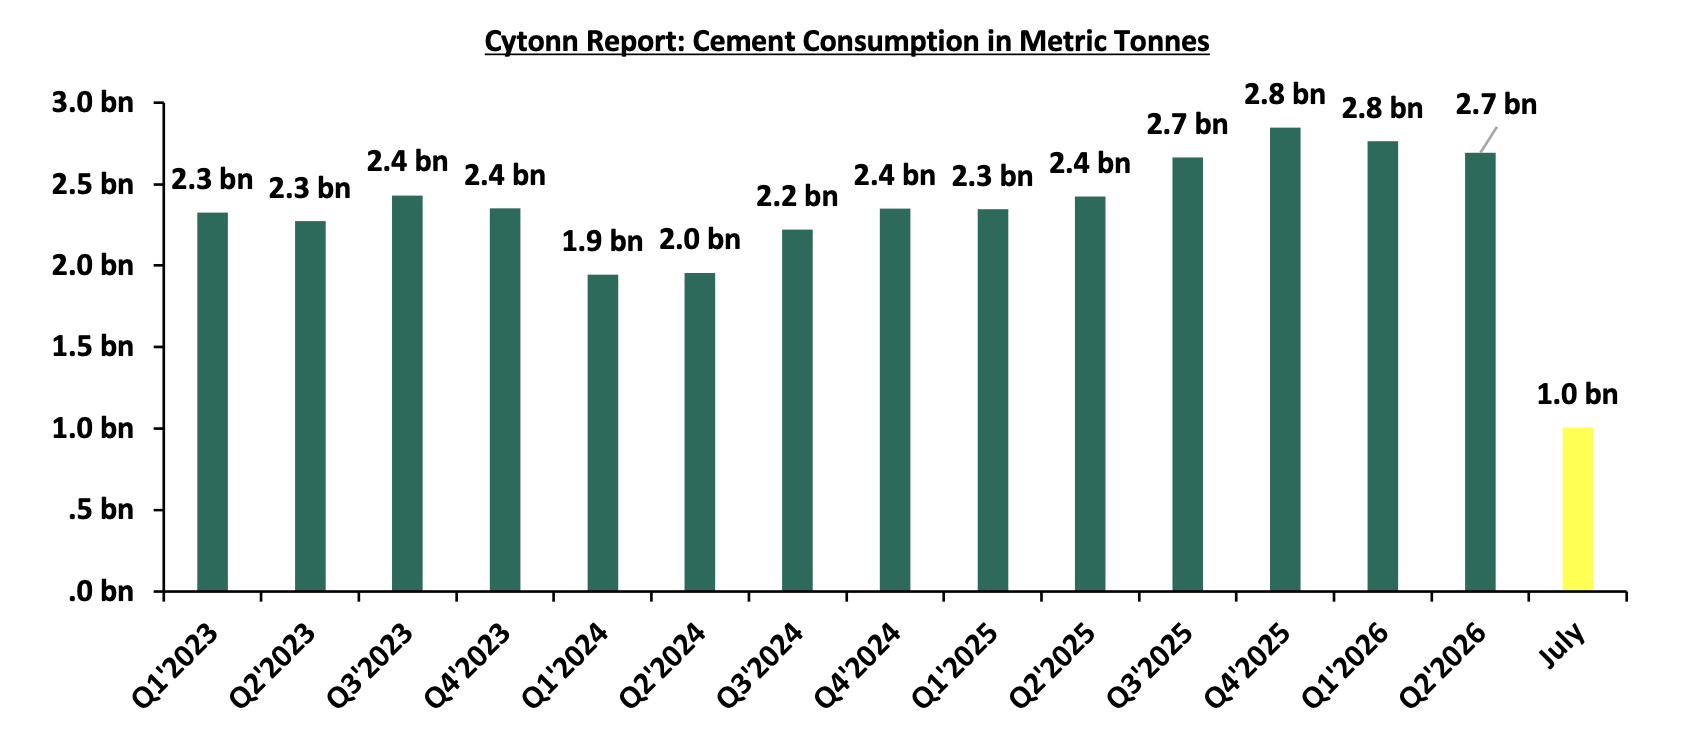
Source: Kenya Bureau of Statistics (KNBS)
For more notable developments during Q3’2026 please visit our Cytonn Monthly July 2026, and Cytonn Monthly August 2026,
-
Residential Sector
During Q3’2026, the NMA residential sector recorded a slight increase in performance, with the average total returns to investors coming in at 6.9%, to remain relative unchanged from the 6.9% recorded in Q3’2025. The performance was attributed to an increase in the residential average y/y price appreciation which came in at 1.3% in Q3’2026, 0.1%-points higher than the 1.2% appreciation recorded in Q3’2025, driven by increased property transactions during the year. On the other hand, the average rental yield came in at 5.1% in Q3’2026, to remain relatively unchanged from the 5.1% rental yield recorded in Q3’2025. This was driven by an increase in the residential average y/y price appreciation which came in at 1.3% in Q3’2026, 0.1%-points higher than the 1.2% appreciation recorded in Q3’2025. The table below shows the NMA residential sector’s performance during Q3’2025 and Q3’2026,
|
(All values in Kshs unless stated otherwise) |
|||||||||
|
Cytonn Report: Nairobi Metropolitan Area (NMA) Residential Sector Summary - H1’2026/H1’2025 |
|||||||||
|
Segment |
Average of Price per SQM Q3'2026 |
Average of Rent per SQM Q3'2026 |
Average of Rental Yield Q3'2026 |
Average of Price Appreciation Q3'2026 |
Average of Total Returns Q3'2026 |
Average of Rental Yield Q3'2025 |
Average of Price Appreciation Q3'2025 |
Average of Total Returns Q3'2025 |
y/y change in Rental Yield (% Points) |
|
Detached Units |
|||||||||
|
Lower Middle |
89,515 |
376 |
5.0% |
3.2% |
8.2% |
4.8% |
0.3% |
6.2% |
4.1% |
|
Upper Middle |
147,190 |
590 |
4.6% |
3.1% |
7.7% |
4.6% |
0.2% |
5.2% |
0.6% |
|
High End |
208,314 |
866 |
4.6% |
2.6% |
7.2% |
4.5% |
0.5% |
6.5% |
2.1% |
|
Detached Units Average |
148,340 |
611 |
4.7% |
3.0% |
7.7% |
4.6% |
0.7% |
5.5% |
2.3% |
|
Apartments |
|||||||||
|
Upper Mid-End |
128,327 |
784 |
6.4% |
2.2% |
8.7% |
6.3% |
1.3% |
8.1% |
1.8% |
|
Lower Mid-End Satellite Towns |
82,977 |
495 |
5.6% |
2.5% |
8.1% |
5.2% |
2.1% |
8.7% |
7.9% |
|
Lower Mid-End Suburbs |
101,814 |
501 |
5.2% |
3.3% |
8.6% |
5.4% |
1.9% |
7.8% |
(3.0%) |
|
Apartments Average |
104,373 |
593 |
5.8% |
2.7% |
8.4% |
5.6% |
1.8% |
8.2% |
2.1% |
|
Residential Market Average |
126,356 |
602 |
5.2% |
2.8% |
8.1% |
5.1% |
1.3% |
6.9% |
2.2% |
Source: Cytonn Research
-
Detached Units Performance
The table below shows the NMA residential sector detached units’ performance during Q3’2026;
|
All values are in Kshs unless stated otherwise |
||||||||
|
Cytonn Report: Residential Detached Units Summary H1’2026 |
||||||||
|
Area |
Average of Price per SQM Q3'2026 |
Average of Occupancy Q3'2026 |
Average of Uptake Q3'2026 |
Average of Annual Uptake Q3'2026 |
Average of Rental Yield Q3'2026 |
Average of Rent per SQM Q3'2026 |
Average of Price appreciation Q3'2026 |
Total returns |
|
High End |
||||||||
|
Rosslyn |
201,571 |
86.0% |
90.0% |
8.9% |
5.2% |
994 |
2.9% |
8.1% |
|
Runda |
256,347 |
88.4% |
90.1% |
7.7% |
4.7% |
1,105 |
2.5% |
7.2% |
|
Lower Kabete |
168,490 |
90.4% |
85.7% |
8.2% |
4.6% |
684 |
2.5% |
7.1% |
|
Karen |
173,728 |
93.1% |
94.1% |
9.6% |
4.3% |
700 |
1.2% |
5.5% |
|
Kitisuru |
241,432 |
95.5% |
89.0% |
8.8% |
4.2% |
845 |
4.1% |
8.3% |
|
Average |
208,314 |
90.7% |
89.8% |
8.6% |
4.6% |
866 |
2.6% |
7.2% |
|
Upper Middle |
||||||||
|
South B/C |
118,219 |
91.5% |
89.3% |
9.3% |
7.6% |
806 |
2.0% |
9.6% |
|
Runda Mumwe |
172,148 |
93.7% |
88.7% |
7.6% |
5.0% |
765 |
4.0% |
9.1% |
|
Loresho |
155,844 |
90.6% |
90.6% |
9.4% |
4.9% |
700 |
4.8% |
9.7% |
|
Redhill & Sigona |
101,418 |
88.9% |
77.7% |
8.3% |
4.3% |
397 |
3.3% |
7.7% |
|
Langata |
113,674 |
89.0% |
85.6% |
6.7% |
4.2% |
438 |
4.9% |
9.1% |
|
Lavington |
191,911 |
92.5% |
95.5% |
9.1% |
3.8% |
625 |
0.3% |
4.1% |
|
Ridgeways |
177,115 |
89.3% |
76.0% |
7.5% |
2.6% |
403 |
2.4% |
5.0% |
|
Average |
147,190 |
90.8% |
86.2% |
8.3% |
4.6% |
590 |
3.1% |
7.7% |
|
Lower Middle |
||||||||
|
Thika |
67,303 |
91.1% |
88.1% |
10.2% |
6.5% |
375 |
3.1% |
9.6% |
|
Syokimau/Mlolongo |
77,611 |
93.2% |
91.5% |
9.9% |
6.2% |
428 |
2.0% |
8.2% |
|
Ngong |
83,491 |
86.6% |
85.1% |
8.5% |
5.2% |
411 |
3.0% |
8.2% |
|
Juja |
106,769 |
91.1% |
92.8% |
12.9% |
4.9% |
366 |
4.7% |
9.6% |
|
Athi River |
108,206 |
90.6% |
91.4% |
8.9% |
4.7% |
414 |
4.5% |
9.2% |
|
Kitengela |
74,823 |
85.9% |
85.6% |
9.0% |
4.3% |
309 |
3.1% |
7.4% |
|
Donholm & Komarock |
96,874 |
83.9% |
91.0% |
9.1% |
4.3% |
400 |
2.6% |
6.9% |
|
Rongai |
101,045 |
89.0% |
86.5% |
9.1% |
3.7% |
308 |
2.7% |
6.4% |
|
Average |
89,515 |
88.9% |
89.0% |
9.7% |
5.0% |
376 |
3.2% |
8.2% |
|
Grand Total |
148,340 |
90.1% |
88.3% |
8.9% |
4.7% |
611 |
3.0% |
7.7% |
Source: Cytonn Research
The key take-outs from the table include;
-
Average Total Returns – The average total returns to detached units’ investors came in at 7.7%, 2.2% points higher than the 5.5% recorded in Q3’2025. The performance was driven by a 0.5%-points decrease in average rental yield to 4.7% in Q3’2026, from 5.2% recorded in Q3’2025.
-
Segment Performance – The best-performing segment was the Lower Middle segment offering an average total return of 8.2%, attributable to a relatively high average rental yield of 5.0%, 0.3%-points higher than the detached market average appreciation of 4.7%. The impressive performance of the segment was driven by returns from well-performing nodes such Thika, Syokimau/Mlolongo and Ngong which have continued to offer relatively high returns to investors, and,
-
Nodal Performance – Overall, Loresho was the best-performing node, offering the highest returns at 9.7%, 2.0% points higher than the detached market average of 7.7%, driven by a relatively high average appreciation of 4.8%. Loresho is attracting residential property investments owing to infrastructural development with roads such as Waiyaki Way and the Nairobi Expressway, favoring residents in the area, and being considered as one of Nairobi’s premier upmarket and exclusive residential growth corridors.
-
Apartments Performance
The table below shows the NMA residential sector apartments’ performance during Q3’2025;
|
All values are in Kshs unless stated otherwise |
|||||||||
|
Area |
Average of Price per SQM Q3'2026 |
Average of Rent per SQM Q3'2026 |
Average of Occupancy Q3'2026 |
Average of Uptake Q3'2026 |
Average of Annual Uptake Q3'2026 |
Average of Rental Yield Q3'2026 |
Average of Price Appreciation Q3'2026 |
Total Returns |
|
|
Upper Mid-End |
|||||||||
|
Kileleshwa |
129,186 |
752 |
96.3% |
93.6% |
8.7% |
6.8% |
(0.7%) |
6.1% |
|
|
Parklands |
127,244 |
910 |
93.2% |
88.1% |
8.3% |
6.4% |
3.2% |
9.6% |
|
|
Westlands |
133,929 |
744 |
91.7% |
93.0% |
9.4% |
6.4% |
1.7% |
8.1% |
|
|
Upperhill |
143,976 |
860 |
86.7% |
86.3% |
8.8% |
6.3% |
3.5% |
9.8% |
|
|
Kilimani |
107,300 |
654 |
89.8% |
89.6% |
9.6% |
6.1% |
3.6% |
9.7% |
|
|
Average |
128,327 |
784 |
91.5% |
90.1% |
9.0% |
6.4% |
2.2% |
8.7% |
|
|
Lower Mid-End Suburbs |
|||||||||
|
Dagoretti |
86,632 |
601 |
93.5% |
81.0% |
9.7% |
6.0% |
3.4% |
9.5% |
|
|
Race Course/Lenana |
75,187 |
642 |
95.3% |
93.8% |
11.0% |
5.8% |
3.3% |
9.1% |
|
|
South B |
111,588 |
519 |
94.6% |
98.4% |
10.8% |
5.4% |
2.2% |
7.6% |
|
|
Waiyaki Way |
135,799 |
463 |
93.2% |
94.0% |
9.9% |
5.3% |
4.2% |
9.6% |
|
|
Kahawa West |
88,455 |
465 |
96.2% |
92.3% |
7.5% |
5.2% |
4.1% |
9.3% |
|
|
Imara Daima |
88,184 |
368 |
96.6% |
92.0% |
8.1% |
5.0% |
2.4% |
7.4% |
|
|
Langata |
108,308 |
475 |
90.6% |
88.1% |
7.9% |
4.9% |
5.0% |
9.9% |
|
|
South C |
120,364 |
475 |
84.9% |
96.0% |
10.4% |
4.1% |
1.7% |
5.8% |
|
|
Average |
101,814 |
501 |
93.1% |
92.0% |
9.4% |
5.2% |
3.3% |
8.6% |
|
|
Lower Mid-End Satellite Towns |
|||||||||
|
Athi River |
63,208 |
507 |
93.4% |
84.2% |
7.3% |
6.5% |
2.1% |
8.6% |
|
|
Ngong |
75,843 |
541 |
94.2% |
88.9% |
10.4% |
6.2% |
2.2% |
8.4% |
|
|
Syokimau |
75,093 |
422 |
90.8% |
87.1% |
8.4% |
6.1% |
3.2% |
9.4% |
|
|
Rongai |
58,215 |
330 |
93.8% |
88.0% |
9.1% |
5.9% |
2.9% |
8.8% |
|
|
Kikuyu |
88,443 |
505 |
96.7% |
96.7% |
11.9% |
5.8% |
2.7% |
8.6% |
|
|
Thindigua |
102,543 |
554 |
90.1% |
87.7% |
9.2% |
5.5% |
3.1% |
8.6% |
|
|
Ruaka |
106,214 |
568 |
91.3% |
88.8% |
9.1% |
4.7% |
(0.7%) |
4.0% |
|
|
Ruiru |
94,255 |
529 |
89.5% |
89.5% |
7.8% |
4.2% |
4.3% |
8.5% |
|
|
Average |
82,977 |
495 |
92.5% |
88.9% |
9.1% |
5.6% |
2.5% |
8.1% |
|
|
Grand Average |
104,373 |
593 |
92.4% |
90.3% |
9.2% |
5.8% |
2.7% |
8.4% |
|
Source: Cytonn Research
The key take-outs from the table include;
-
Average Total Returns – The average total returns to apartment investors increased by 0.2 percentage points to 8.4% in Q3’2026, from 8.2% in Q3’2025. This performance was supported by changes in rental yields and capital appreciation, with rental yields declining by 0.6 percentage points to 5.8% from 6.4% over the review period. The increase in total returns despite lower rental yields suggests that capital appreciation may have offset the decline in rental income returns,
-
Segment Performance – The best-performing segment was the upper mid-end towns with average total returns of 8.7%, attributed to a relatively high average y/y price appreciation of 2.2% and rental yield of 6.4%. The impressive performance of the segment was driven by returns from well-performing nodes such as Westlands, Upperhill and Kilimani that have continued to offer competitive returns to investors in comparison to other segments, and
-
Nodal Performance – Overall, the best-performing node was Upper Hill, offering investors average total returns of 9.7%, 1.3%-points higher than the apartment market average total return of 8.4%. Upper Hill is attracting residential property investments owing to infrastructural development with roads such as the Kenyatta Avenue–Upper Hill Viaduct and Ngong Road, favoring residents in the area, and being considered as one of Nairobi’s premier high-density and elite commercial hubs.
Notable Highlights during the week include;
- Funyula Affordable Housing Project nears completion as Busia expands housing supply
During the week, Interior Principal Secretary Raymond Omollo announced that the Funyula Affordable Housing Project in Busia County had completed construction of its 955 housing units across 10 residential blocks, with final painting and finishing works underway ahead of official commissioning and handover. The development incorporates social, affordable and market-rate housing, alongside supporting infrastructure, including reliable water supply, secure perimeter walls, cabro-paved roads, landscaped spaces, a children's play area and commercial facilities. The project is intended to widen access to decent housing for different income groups while providing residents with a serviced residential community.
Meanwhile, construction of the Busia ATC Estate Affordable Housing Project is progressing under the Government's Boma Yangu Affordable Housing Programme. The project occupies a 10.5-acre site and is being implemented in two phases. Phase I, comprising 1,025 housing units across 11 residential blocks, is 25.0% complete, while Phase II, which will deliver an additional 1,026 units, has reached 18.0% completion. Upon completion, the two phases will provide more than 2,000 housing units. According to PS Omollo, the development is also generating employment and business opportunities through the construction value chain, with local youth and women securing on-site jobs and Jua Kali artisans supplying key components.
Going forward, completion of the Funyula project and continued development of the Busia ATC Estate are expected to expand the supply of formal housing in Busia County, supporting homeownership across different income segments. The developments could also stimulate demand for retail and other commercial facilities, while improved residential infrastructure and construction-related employment may support economic activity in Funyula and Busia Town. For the Real Estate sector, these projects highlight the role of affordable housing developments in combining residential supply with supporting infrastructure and local economic opportunities.
Notable Highlights in the quarter include;
-
The Parliamentary Budget Office (PBO) flagged a Kshs 118.3 bn financing gap facing Kenya's housing development programme reporting that Kshs 228.3 bn is required in FY2026/27 to finance ongoing housing projects, against an approved allocation of Kshs 110.0 bn, creating a Kshs 118.3 bn funding shortfall. For more information, please visit our Cytonn Cytonn Weekly #38/2026.
-
Kenya's mortgage market showed signs of recovery, with the Central Bank of Kenya (CBK) reporting that the value of outstanding mortgage loans increased by 10.0% to Kshs 307.2 bn in 2025 from Kshs 279.3 bn 2024. The increase of Kshs 27.9 bn was attributed to new mortgage lending during 2025. For more information, please visit our Cytonn Cytonn Weekly #38/2026
For more notable developments during Q3’2026 please visit our Cytonn Monthly_July 2026, and Cytonn Monthly_August 2026,
We have a NEUTRAL outlook for the NMA residential sector, we expect continued vibrant performance in the residential sector within the country sustained by; i)ongoing residential developments under the Affordable Housing Agenda, aiming to reduce the housing deficit in the country currently estimated at 80.0%, ii) increased investment from local and international investors in the housing sector, iii) favorable demographics in the country, shown by high population and urbanization rates of 2.9% p.a and 1.9% p.a, respectively, leading to higher demand for housing units. However, challenges such as rising construction costs, strain on infrastructure development, and limited access to financing will continue to restrict the optimal performance of the residential sector.
-
Commercial Office Sector
The table below highlights the performance of the Nairobi Metropolitan Area (NMA) Commercial Office sector over time;
|
(All Values in Kshs Unless Stated Otherwise) |
|||||||||
|
Cytonn Report: Nairobi Metropolitan Area (NMA) Commercial Office Returns Over Time |
|||||||||
|
Year |
FY'2024 |
Q1'2025 |
H1'2025 |
Q3'2025 |
FY'2025 |
Q1’2026 |
H1’2026 |
Q3’2026 |
∆ Q3'2025/Q3'2026 |
|
Occupancy % |
80.7% |
80.3% |
80.9% |
82.4% |
83.1% |
84.7% |
83.4% |
84.7% |
2.7% |
|
Asking Rents (Kshs/SQFT) |
104.8 |
105 |
105 |
105 |
105 |
111 |
108 |
110 |
3.3% |
|
Average Prices (Kshs/SQFT) |
12,614 |
12,614 |
12,673 |
12,681 |
12,699 |
12,718 |
12,896 |
14,497 |
2.2% |
|
Average Rental Yields (%) |
7.8% |
7.6% |
7.7% |
7.8% |
7.8% |
8.9% |
8.1% |
8.2% |
0.3% |
Source: Cytonn Research
-
Average Asking Rents – In Q3’2026, average asking rents per SQFT in the Nairobi Metropolitan Area (NMA) increased by 3.3% to Kshs 110 per SQFT from Kshs 105 per SQFT in Q3’2025. This performance can be attributable to addition of new Grade A offices to the pipeline. Notable examples driving this upward trend include recently completed developments like Purple Tower on Mombasa Road, 761 Lenana Rd in Kilimani, and The Mandrake and Matrix One in Westlands, alongside decentralized options like Eneo in Tatu City. Additionally, incoming 2026 completions such as Mwanzi Square and 277 Brookside in Westlands, The Pod and The Angelo in Lavington, and the Tanzanian High Commission in Upper Hill continue to pull market medians upward as occupiers willingly pay premium rates for modern, ESG-compliant workspaces.
-
Average Occupancy Rate – In Q3’2026, commercial office occupancy showed an improvement in performance by 2.7%-points to 84.7% from 82.4% achieved in Q3’2025.
-
Average Rental Yield – The average rental yields showed resilience with 0.3%-points increase in average rental yields in Q3’2026 to 8.2%, from 7.8% recorded in Q3’2025 attributable to increased occupancy and rental rates.
For submarket performance, Westlands and Gigiri emerged as the top performers, achieving an average rental yield of 9.4% and 8.8% respectively in Q3’2026, surpassing the market average of 8.2%. This performance can be attributed to several factors: i) These locations feature a high concentration of top-tier office buildings that command premium rental rates and yields, ii) Landlords in these areas often prefer to collect rent in dollars, enhancing the investment appeal, iii) Well-developed infrastructure and abundant amenities add significant value to investments in these locations, iv) The presence of multinational corporations, and international organizations increases the demand for high-quality office spaces.
In contrast, Mombasa Rd was the least performing node with an average rental yield of 7.0% in Q3’2026, 1.2% points lower than the market average of 8.2%. This lower performance can be attributed to: i) The high prevalence of lower-quality office buildings in this area leads to lower average rental rates, typically around Kshs 92 per SQFT as compared to an average of Kshs 110 per SQF , ii) Mombasa Road is predominantly recognized as an industrial zone, reducing its attractiveness to office-based businesses seeking commercial spaces, iii) Intense competition from other sub-markets further compounds the challenges Mombasa Road faces in attracting tenants and achieving higher rental yields. The table below displays the performance of sub-markets in the Nairobi Metropolitan Area (NMA).
|
All values in Kshs unless stated otherwise |
|||||||||||
|
Cytonn Report: Nairobi Metropolitan Area Commercial Office Market Performance Q1’2026 |
|||||||||||
|
Area |
Price/SQFT Q3’2026 |
Rent/SQFT Q3’2026 |
Occupancy Q3’2026 |
Rental Yields Q3’2026 |
Price Kshs/ SQFT Q3’2025 |
Rent Kshs/ SQFT Q3’2025 |
Occupancy Q3’2025 |
Rental Yield Q3’2025 |
∆ in Rent |
∆ in occupancy |
∆ in Rental Yields (% points) |
|
Gigiri |
14,850 |
140 |
82.2% |
9.4% |
15,050 |
135 |
82.4% |
8.6% |
3.7% |
(0.2%) |
0.8% |
|
Westlands |
18,695 |
123 |
85.7% |
8.8% |
12,510 |
120 |
82.4% |
9.4% |
2.5% |
4.0% |
(0.6%) |
|
Karen |
14,408 |
118 |
85.0% |
8.4% |
14,077 |
115 |
81.5% |
8.0% |
2.6% |
4.3% |
0.4% |
|
Kilimani |
12,923 |
108 |
84.8% |
8.3% |
12,805 |
105 |
83.0% |
7.9% |
2.9% |
2.2% |
0.4% |
|
Nairobi CBD |
12,794 |
97 |
89.7% |
8.2% |
12,294 |
94 |
88.8% |
8.0% |
3.2% |
1.0% |
0.2% |
|
Parklands |
12,155 |
96 |
88.3% |
8.1% |
12,018 |
94 |
84.5% |
7.9% |
2.1% |
4.5% |
0.2% |
|
Upperhill |
12,738 |
109 |
79.5% |
8.0% |
12,857 |
105 |
75.4% |
7.0% |
3.8% |
5.4% |
1.0% |
|
Thika Road |
12,907 |
96 |
82.7% |
7.4% |
13,057 |
93 |
80.1% |
6.7% |
3.2% |
3.2% |
0.7% |
|
Mombasa Road |
12,000 |
92 |
76.4% |
7.0% |
11,575 |
89 |
72.7% |
6.4% |
3.4% |
5.1% |
0.6% |
|
Average |
13,719 |
109 |
83.8% |
8.2% |
12,916 |
106 |
81.2% |
7.8% |
3.0% |
3.3% |
0.4% |
X
Source: Cytonn Research
We maintain a NEUTRAL outlook on the Nairobi Metropolitan Area (NMA) commercial office sector, impacted by several key dynamics: i) the increasing presence of multinational companies in Kenya is likely to drive up occupancy levels, ii) the increasing trend of co-working spaces, iii) more start-ups are expected to drive demand for commercial spaces, and iv) a considerable take-up of prevailing commercial office spaces after developers adopted a 'wait-and-see' approach to avoid vacancies in newly built spaces, However, the sector continues to face challenges due to a significant oversupply of office space, currently standing at 3.4 mn SQFT. Despite these challenges, there are attractive investment opportunities in areas such as Westlands, Kilimani, and Parklands, which offer returns that exceed the market average.
-
Retail Sector
The table below shows the performance of the retail sector performance in Nairobi Metropolitan Area from H1’2025 to Q3’2026;
|
All values are in Kshs unless stated otherwise |
|||||||
|
Cytonn Report: Summary of Retail Sector Performance in Nairobi Metropolitan Area Q3’2025 - Q3’2026 |
|||||||
|
Item |
H1’2025 |
Q3'2025 |
FY'2025 |
Q1’2026 |
H1’2026 |
Q3’2026 |
Y/Y 2026 ∆ |
|
Average Asking Rents (Kshs/SQFT) |
185.5 |
186.7 |
185.8 |
188.0 |
189.0 |
194.0 |
3.9% |
|
Average Occupancy (%) |
83.3% |
84.8% |
82.0% |
87.2% |
88.1% |
87.9% |
3.1% |
|
Average Rental Yields |
8.5% |
8.8% |
8.6% |
8.9% |
8.9% |
9.1% |
0.3% |
Source: Cytonn Research
The key take-outs from the table include;
-
Average Occupancy Rate - In Q3'2026, the retail sector recorded a y/y increase in average occupancy of 3.1%-points to 87.9%, up from 84.8% in Q3'2025, even as it eased marginally from the 88.1% high recorded in H1'2026. This performance continues to be underpinned by several key factors: i) continued expansion by domestic and international retailers such as Naivas, QuickMart, Carrefour, and Magunas, absorbing available space across the NMA, ii) sustained demand for consumer goods and services, buoyed by favourable demographic trends, iii) retailers' adaptation to evolving consumer preferences, exemplified by initiatives such as Jaza Stores and Carrefour enabling online orders via platforms like WhatsApp, and, iv) ongoing improvements in infrastructure, which continue to support existing retail spaces while unlocking new areas for retail growth, broadening the sector's expansion.
-
Asking Rents - In Q3'2026, average asking rents rose by 3.9% y/y to Kshs 194.0 per SQFT, up from Kshs 186.7 in Q3'2025, with the 2.6% quarter-on-quarter jump from H1'2026's Kshs 189.0 marking the fastest pace of rental growth recorded so far in the review period. This growth was driven by several key factors: i) sustained demand for premium retail space in strategic nodes within the Nairobi Metropolitan Area (NMA), such as Karen, Kilimani, Westlands, and along Kiambu and Limuru roads, which continue to attract both local and foreign businesses seeking proximity to multinational organizations and embassies serving an international clientele, ii) limited supply of new retail space in prime locations, tightening availability and pushing up rents on existing stock, iii) continued recovery in consumer footfall and retail activity on the back of ongoing economic stabilization efforts, and, iv) the entry of renowned global brands such as Adidas, Puma, Michael Kors, and Aldo into the Kenyan market, intensifying competition for prime retail space and further driving up rental rates.
-
Average Rental Yield- The average rental yield for the NMA retail sector improved by 0.3%-points y/y to 9.1% in Q3'2026, from 8.8% in Q3'2025, having held flat at 8.9% between Q1'2026 and H1'2026 before accelerating in the third quarter. This improvement was driven by the faster pace of rental rate growth relative to occupancy gains over the period, affirming the retail sector's continued recovery.
In terms of sub-market performance, Kilimani, Karen, and Ngong Road demonstrated impressive average rental yields of 11.0%, 9.9%, and 9.8% respectively, outpacing the overall market average of 9.1%. This strong performance was largely driven by the increased demand for retail offerings in the above locations, as well as the presence of top-tier retail spaces commanding higher rents, coupled with the provision of quality infrastructure services enhancing the attractiveness for both tenants and customers. Conversely, retail spaces in satellite towns reported the lowest average rental yield at 7.5%, influenced by several factors: i) rental rates significantly below the market average of Kshs 194 per SQFT, standing at Kshs 145 per SQFT resulting from the presence of lower quality spaces in the region, ii) inadequate infrastructure across most towns within the regions, hindering accessibility and sustainability for retail spaces, and, iii) the prevalence of informal retail spaces and service stations, offering competitive rates and diverse amenities, intensifying market competition and impacting demand.
The following table illustrates the submarket performance of nodes within the Nairobi Metropolitan Area (NMA) in Q3’2026;
|
(All values in Kshs unless stated otherwise) |
||||||||||
|
Nairobi Metropolitan Area Retail Market Performance H1’2025 |
||||||||||
|
Area |
Prices Kshs /SQFT Q3'2025 |
Rent Kshs /SQFT Q3'2026 |
Occupancy% Q3’2026 |
Rental Yield Q3'2026 |
Rent Kshs /SQFT Q3’2025 |
Occupancy% Q3’2025 |
Rental Yield Q3’2025 |
∆ in Rental Rates |
∆ in Occupancy (% points) |
∆ in Rental Yield (% points) |
|
Karen |
25,400 |
226 |
94.0% |
9.9% |
222 |
92.0% |
9.7% |
1.7% |
2.0% |
0.2% |
|
Ngong Road |
24,263 |
203 |
89.3% |
9.6% |
191 |
86.9% |
8.3% |
6.6% |
2.4% |
1.5% |
|
Kiambu road & Limuru Road |
20,167 |
185 |
87.8% |
9.6% |
187 |
79.7% |
9.0% |
(0.9%) |
8.2% |
0.6% |
|
Westlands |
25,000 |
224 |
84.7% |
9.1% |
239 |
82.2% |
9.4% |
(6.2%) |
2.5% |
(0.3%) |
|
Kilimani |
24,201 |
204 |
91.2% |
9.0% |
199 |
83.2% |
9.9% |
2.2% |
8.0% |
1.1% |
|
Mombasa road |
20,000 |
172 |
86.6% |
8.8% |
178 |
86.8% |
9.2% |
(3.6%) |
(0.1%) |
(0.5%) |
|
Thika Road |
22,291 |
172 |
92.5% |
8.3% |
168 |
82.7% |
8.2% |
2.2% |
9.8% |
0.1% |
|
Eastlands |
20,500 |
173 |
80.6% |
8.1% |
161 |
83.1% |
7.8% |
7.1% |
(2.4%) |
0.3% |
|
Satellite towns |
20,200 |
145 |
87.1% |
7.5% |
142 |
88.2% |
7.6% |
1.8% |
(1.1%) |
(0.1%) |
|
Average |
22,447 |
194 |
87.9% |
9.1% |
187 |
85.0% |
8.8% |
4.4% |
3.2% |
0.3% |
Source: Cytonn Research
For more notable developments during Q3’2026 please visit our Q1’2026 market review report, Cytonn Monthly July 2026, and Cytonn Monthly August 2026,
We maintain a NEUTRAL outlook on the retail sector’s performance, which is anticipated to be influenced by several key drivers: i) continued aggressive expansion efforts by both local and foreign retailers, as they seek to secure new and existing spaces to capitalize on evolving consumer preferences and market dynamics, ii) ongoing advancements in public infrastructure, including road and railway projects, are expected to enhance accessibility to new areas for retail investments, stimulating further growth opportunities, and, iii) positive demographic trends, characterized by a growing population, are anticipated to underpin increasing demand for retail goods and services. However, the sector's growth momentum may face headwinds from certain negative factors, including: i) escalating adoption of e-commerce by retailers, which continues to erode traditional occupier demand for physical retail spaces, necessitating innovative strategies to adapt to changing consumer shopping habits, and, ii) limited access to and expensive financing from financial institutions for retail developments, coupled with the imperative for small and medium-sized enterprises (SMEs) to invest in technological advancements to enhance operational efficiency and competitiveness in the market.
-
Hospitality Sector
Notable Highlights during the week include;
- Jambojet suspends Mombasa–Zanzibar flights amid rising operating costs
During the week, Jambojet suspended its direct flights between Mombasa and Zanzibar, citing rising fuel costs and the introduction of mandatory travel insurance for visitors to Tanzania, which have made the route commercially unviable. According to Business Daily, the airline stopped operating the route in mid-September 2026 after passenger numbers declined following the introduction of a USD 44 (Kshs 5,708) travel insurance requirement for visitors to Tanzania. The airline also introduced a 20.0% fuel surcharge on ticket prices following the increase in fuel costs, while rising hotel prices further increased the cost of travelling to Zanzibar. Jambojet’s Chief Executive Officer, Karanja Ndegwa, attributed the suspension to the financial losses incurred on the route.
The suspension follows Jambojet’s launch of the Mombasa–Zanzibar route in June 2024, which primarily targeted Kenyan tourists travelling to the island and provided onward connections to Nairobi and other destinations. Following the withdrawal, RwandAir and Safarilink remain among the airlines offering direct flights between Mombasa and Zanzibar, while Kenya Airways, Precision Air and Air Tanzania continue to serve travellers flying to Zanzibar from Nairobi. Jambojet is also preparing to resume flights to Entebbe, Uganda, while its previously announced plans to launch direct flights between Nairobi and Dar es Salaam remain uncertain amid rising fuel costs and adjustments to flight frequencies.
Going forward, the suspension could affect tourism-related businesses along the Kenyan coast, particularly hotels, serviced apartments, restaurants and other hospitality establishments that benefit from regional leisure travel. Reduced direct connectivity between Mombasa and Zanzibar may increase travel costs or inconvenience for some travellers, potentially influencing demand for accommodation and related services. However, the overall effect on coastal hospitality demand will depend on the availability and affordability of alternative transport options and the extent to which visitors substitute other destinations. For the Real Estate sector, the development highlights the importance of affordable air connectivity and operating costs in supporting tourism-led demand for hospitality and short-stay accommodation along the coast.
Key highlights during Q3’2026 include:
-
The Kenya Wildlife Service (KWS) and Kenya Tourism Board (KTB) launched Kenya’s digital tourism through the “Experience Wonder Live from Kenya” programme. The six-month initiative provides live wildlife and conservation broadcasts from nine KWS-managed protected areas, including Nairobi National Park, Amboseli, Tsavo East, Tsavo West, the Aberdares, Sibiloi, Meru, Ruma and Mount Elgon. For more information please see our Cytonn Weekly #38/2026.
-
Attention was drawn to the shortfall in Kenya’s tourism levy collections, highlighting the challenges faced by authorities in regulating the country’s growing short-term rental market. The Tourism Fund collected Kshs 5.6 bn in the 2025/26 financial year, against a target of Kshs 6.7 bn, resulting in a shortfall of about Kshs 1.0 bn. For more information, please see our Cytonn Weekly #37/2026.
-
Artesano Investment Limited, Gulf Hotels Group, Silva Gigiri Limited and Season Global Limited announced plans to invest Kshs 5.5 bn in hospitality developments in Nairobi's Gigiri neighborhood, expected to add a combined 587 accommodation units to the area. For more information, please see our Cytonn Weekly #36/2026.
For more notable developments during Q3’2026 please visit our Cytonn monthly July 2026, and Cytonn Monthly August 2026.
We maintain a POSITIVE outlook for the hospitality sector, supported by several key drivers: i) aggressive marketing campaigns promoting Kenya’s tourism, expected to boost tourist arrivals and improve occupancy rates at hospitality venues, ii) international recognition of Kenya’s tourism industry, enhancing its status as a leading tourist destination and drawing more global visitors, iii) strategic partnerships within the tourism sector, fostering innovation and collaboration to capitalize on new opportunities, iv) events and initiatives aimed at increasing tourism activity and improving guest experiences. However, while the sector demonstrated resilience in its overall performance in 2025, the outlook remains cautiously optimistic. Kenya continues to face significant competition from neighboring markets, such as Rwanda, which employs aggressive promotional strategies, alongside Zanzibar, Tanzania, and South Africa. These regions actively position themselves as attractive alternatives, challenging Kenya's market share in the region. Additionally, Kenya’s hospitality sector remains vulnerable to the impacts of negative travel advisories issued during times of crisis, resulting in reduced international visitor numbers.
-
Land Sector
During the period under review, the land sector in Nairobi Metropolitan Area (NMA) recorded a price appreciation of 1.3 % to Kshs 134.4 mn from 132.1 mn. This performance was supported by;
-
The growing demand for land in the Nairobi Metropolitan Area (NMA) is driven by a rising population, as individuals from various regions of the country migrate annually in search of employment, education, and other opportunities,
-
The fixed supply of land has intensified demand, particularly for residential and commercial purposes, leading to an increase in land prices,
-
There is an expanding middle class in the NMA with disposable income, willing to invest in land as a savings and investment option,
-
The government's ongoing infrastructural development projects, such as roads, sewers, railways, and water connections, are opening up more satellite towns, subsequently driving land prices upward,
-
The widely held belief among the middle class that land represents a secure form of wealth has prompted many families to save specifically for land acquisition, and,
-
The government’s Affordable Housing Program, under the Bottom-Up Economic Transformation Agenda (BETA), has initiated construction projects across various parts of Nairobi and the country, further increasing land values due to heightened construction activity.
Overall Performance:
Nairobi suburbs-Commercial areas registered the highest capital appreciation during the period under review, with an annual capital appreciation of 2.5%, where the average selling price rose to Kshs 406.4 mn from Kshs 396.4 mn recorded in Q3’2025. The strong performance can be attributed to a combination of improving infrastructure, rising commercial activity, and investor preference for lower-density growth nodes outside the CBD. On the other hand, land in Nairobi Suburbs under high rise residential areas recorded the least movement with an annual capital appreciation of 0.3%, below the market average of 1.3%. This muted performance can largely be attributed to oversupply and weaker investor appetite in Nairobi’s high-rise residential segment, particularly in areas that have experienced rapid apartment development over the past few years. The table below shows the overall performance of the sector across all land sub-sectors during Q3’2026;
|
|
Q3’2025 |
Q3’2026 |
Annualized Capital Appreciation |
|
Nairobi Suburbs- Commercial Areas |
396.4 mn |
406.4 mn |
2.5% |
|
Serviced land-Satellite Towns |
20.1 mn |
20.6 mn |
2.3% |
|
Un-serviced land-satellite Towns |
18.1 mn |
18.3 mn |
0.9% |
|
Nairobi Suburbs (Low Rise & High Residential Areas) |
140.7 mn |
141.3 mn |
0.4% |
|
Nairobi Suburbs- High Rise Residential Areas |
85.3 mn |
85.6 mn |
0.3% |
|
Average |
132.1 mn |
134.4 mn |
1.3% |
Source: Cytonn Research
Sub-markets Performance – For the unserviced satellite towns, Juja, Limuru, and Utawala emerged as the best-performing nodes with annualized capital appreciation of 0.4%, 1.8% and 2.3%, respectively. This performance can be attributed to: i) good transport network connecting these areas to Nairobi ii) a rising middle class looking to settle in these areas, iv) good proximity to retail centres such as malls, and v) relatively affordable prices compared to the market average. Additionally, land in unserviced towns presents a good opportunity for speculative investors, who invest in anticipation of price appreciation. On the other hand, high rise residential areas in Nairobi’s Suburbs registered the least average price movement, with Kilimani recording a appreciation of 0.3%. Notably, some areas in this segment, such as Kilimani, are witnessing an influx of high-rise apartments, which has made them less attractive. The table below shows NMA’s land performance by submarkets in Q3’2026;
|
Price in Kshs per Acre |
|||
|
Cytonn Report: Nairobi Metropolitan Area Land Performance by Submarkets – Q3’2026 |
|||
|
Location |
Price Q3’2025 |
Price Q3’2026 |
Capital Appreciation |
|
Satellite Towns - Unserviced Land |
|||
|
Utawala |
17.5 mn |
17.9 mn |
2.3% |
|
Limuru |
24.8 mn |
25.3 mn |
1.8% |
|
Juja |
15.9 mn |
16.0 mn |
0.4% |
|
Rongai |
17.1 mn |
17.1 mn |
(0.2%) |
|
Athi River |
15.3 mn |
15.2 mn |
(0.5%) |
|
Average |
18.1 mn |
18.3 mn |
0.7% |
|
Satellite Towns - Serviced Land |
|||
|
Ruiru & Juja |
20.8 mn |
22.0 mn |
5.8% |
|
Rongai |
18.3 mn |
18.7 mn |
1.9% |
|
Athi River |
20.0 mn |
20.4 mn |
1.9% |
|
Ruai |
12.8 mn |
13.0 mn |
1.2% |
|
Syokimau |
28.7 mn |
28.9 mn |
0.7% |
|
Average |
20.1 mn |
20.6 mn |
2.3% |
|
Nairobi Middle End Suburbs – High Rise Residential Areas |
|||
|
Embakasi |
83.1 mn |
83.9 mn |
1.0% |
|
Kasarani |
86.7 mn |
87.1 mn |
0.4% |
|
Dagoretti |
86.2 mn |
85.9 mn |
(0.3%) |
|
Average |
85.3 mn |
85.6 mn |
0.4% |
|
Nairobi High End Suburbs (Low- and High-Rise Areas) |
|||
|
Karen |
63.9 mn |
64.8 mn |
1.4% |
|
Ridgeways |
90.1 mn |
90.9 mn |
0.8% |
|
Spring Valley |
175.7 mn |
176.9 mn |
0.7% |
|
Kitisuru |
96.4 mn |
96.6 mn |
0.2% |
|
Kileleshwa |
308.7 mn |
309.0 mn |
0.1% |
|
Runda |
109.3 mn |
109.4 mn |
0.1% |
|
Average |
140.7 mn |
141.3 mn |
0.6% |
|
Nairobi Suburbs - Commercial Zones |
|||
|
Riverside |
327.4 mn |
339.7 mn |
3.8% |
|
Kilimani |
377.3 mn |
390.0 mn |
3.4% |
|
Westlands |
419.7 mn |
430.7 mn |
2.6% |
|
Upperhill |
461.3 mn |
465.0 mn |
0.8% |
|
Average |
396.4 mn |
406.4 mn |
2.6% |
Source: Cytonn Research
We maintain a POSITIVE outlook for the land sector in the Nairobi Metropolitan Area (NMA), considering it a dependable investment opportunity that has shown improving performance year on year. Going forward, we expect the sector's performance to be driven by several factors: i) government efforts to streamline land transactions through innovative solutions such as Ardhi Sasa, ii) continued activities by players on both the demand and supply sides, iii) growing demand for land driven by positive demographics, iv) the launch of infrastructure development projects opening up satellite towns for investment opportunities, and v) the continued rollout of the Affordable Housing Program (AHP) by the government, driving further demand for land.
-
Infrastructure Sector
Key highlight during Q3’2026;
-
During the Month, Zaria Group through its local subsidiary, Metro arena Development Company, proposed a Kshs 38.1 bn Nairobi Railway City development, which will feature a 10,000-seat multi-purpose indoor arena as the centerpiece of a wider Meetings, Incentives, Conferences and Exhibitions (MICE) development. The proposal follows a long-term lease agreement between Zaria Group and Kenya Railways Corporation signed in April 2026. Please see our Cytonn Weekly #38/2026.
We maintain a POSITIVE outlook for the infrastructure sector. We anticipate continued government efforts to advance infrastructure development across Kenya, particularly in the roads and transport sector, in line with the Bottom-Up Economic Transformation Agenda (BETA) and broader economic stimulus objectives. These enhancements are expected to facilitate the more efficient movement of people, goods, and services, thereby reducing logistics costs, stimulating economic activity, and increasing demand for real estate in previously underserved remote areas and satellite towns. Our optimistic stance is supported by several key developments: i) The launch of the National Infrastructure Fund and Sovereign Wealth Fund, designed to channel resources into priority projects with minimal additional public debt, primarily through privatization proceeds; such as the IPO of Kenya Pipeline Company; ii) The 2026 launch of the Naivasha–Narok–Kisumu–Malaba extension of the Standard Gauge Railway (SGR), establishing a modern logistics corridor across East and Central Africa; iii) Accelerated progress on PPPs for the Rironi–Mau Summit highway; iv) Anticipated construction of a new world-class terminal at Jomo Kenyatta International Airport (JKIA) to solidify Kenya’s position as East Africa’s premier aviation hub; v) Ongoing modernization of Mombasa and Lamu ports under the LAPSSET corridor initiative; and, vi) Expected completion of the Talanta Sports Complex and Bomas International Convention Centre, enhancing sports and MICE tourism infrastructure. Nevertheless, the sector continues to face longstanding challenges that could temper progress if not effectively managed. These include persistent delays in project execution, land acquisition disputes, cost overruns, a weak culture of infrastructure maintenance, and lingering reliance on debt-financed models. Addressing these headwinds will be critical to fully realizing the sector’s transformative potential.
-
Real Estate Investments Trusts (REITs)
On the Unquoted Securities Platform Acorn D-REIT and I-REIT traded at Kshs 29.7 and Kshs 24.4 per unit, respectively, as per the last updated data on 25th September 2026. The performance represented a 48.5% and 22.0% gain for the D-REIT and I-REIT, respectively, from the Kshs 20.0 inception price. The volumes traded for the D-REIT and I-REIT came in at 13.7 mn and 46.0 mn shares, respectively. Additionally, ILAM Fahari I-REIT traded at Kshs 13.8 per share as of 25th September 2026, representing a 31.0 % loss from the Kshs 20.0 inception price, the volume traded came in at 1.2 mn shares. REITs offer various benefits, such as tax exemptions, diversified portfolios, and stable long-term profits. However, the ongoing decline in the performance of Kenyan REITs and the restructuring of their business portfolios are hindering significant previous investments. Additional general challenges include:
-
Insufficient understanding of the investment instrument among investors leading to a slower uptake of REIT products,
-
Lengthy approval processes for REIT creation,
-
High minimum capital requirements of Kshs 100.0 mn for REIT trustees compared to Kshs 10.0 mn for pension funds Trustees, essentially limiting the licensed REIT Trustee to banks only
-
The rigidity of choice between either a D-REIT or and I-REIT forces managers to form two REITs, rather than having one Hybrid REIT that can allocate between development and income earning properties
-
Limiting the type of legal entity that can form a REIT to only a trust company, as opposed to allowing other entities such as partnerships, and companies,
-
We need to give time before REITS are required to list – they would be allowed to stay private for a few years before the requirement to list given that not all companies maybe comfortable with listing on day one, and,
-
Minimum subscription amounts or offer parcels set at Kshs 0.1 mn for D-REITs and Kshs 5.0 mn for restricted I-REITs. The significant capital requirements still make REITs relatively inaccessible to smaller retail investors compared to other investment vehicles like unit trusts or government bonds, all of which continue to limit the performance of Kenyan REITs.
Notable Highlights in the quarter include;
-
Laptrust released the H1’2026 financial results for the Imara I-REIT for the period ended 30th June 2026. The I-REIT was authorized by the Capital Markets Authority (CMA) on 1st November 2022. Laptrust Imara I-REIT holds several properties across the country including; Pension towers, CPF House, Metro Park, Freedom Heights mall, Freedom Heights serviced plot, Man apartments, and Nova Pioneer in Eldoret. For more information, please visit our Cytonn Cytonn Weekly #32/2026
We expect Kenya’s Real Estate sector to remain on a growth trend, supported by: i) demand for housing sustained by positive demographics, such as urbanization and population growth rates of 2.9% p.a and 1.9% p.a, respectively, against the global average of 1.7% p.a and 0.9% p.a, respectively, as at 2025,, ii) activities by the government under the Affordable Housing Program (AHP) iii) heightened activities by private players in the residential sector iv) increased investment by local and international investors in the hospitality and industrial sector,v) improved infrastructure throughout the country. However, challenges such as rising construction costs, strain on infrastructure development (including drainage systems), high capital requirements for REITs, and existing oversupply in select Real Estate sectors will continue to hinder the sector’s optimal performance by limiting developments and investments.
Real Estate Performance Summary and Outlook
Below is a summary of the sectorial performance in Q3’2026 and investment opportunities:
|
Theme |
Cytonn Report: Thematic Performance and Outlook H1’ 2025 |
Outlook |
|
Residential |
|
Neutral |
|
||
|
Commercial Office |
|
Neutral |
|
||
|
Retail |
The average rental yield for the NMA retail sector improved by 0.3%-points y/y to 9.1% in Q3'2026, from 8.8% in Q3'2025. |
Neutral |
|
||
|
Hospitality |
|
Positive |
|
Infrastructure |
|
Positive |
|
Land |
|
Positive |
-
Visa Data Shows Stablecoins Gaining Traction in Business Payments
During the week, Visa Inc. shared new data showing that approximately 17.0% of stablecoin-linked card volume in FY26 year-to-date occurred across business and commercial card programs, while payments volume across more than 160 stablecoin-linked card programs spanning consumer, business, and commercial activity has grown nearly 200.0% year over year; the data reflects a shift in how stablecoins are used, from trading within digital asset markets to practical applications in supplier payments, treasury operations, and cross-border commerce. Supported by industry research estimating annual stablecoin payments volume of between USD 401.0 bn and USD 527.0 bn, with B2B flows showing the highest cross-border share at 43.0%, Visa continues to expand its stablecoin capabilities across settlement, Visa Direct pre-funding, and payouts, positioning the network to connect stablecoin innovation into real-world payment flows.
-
Mastercard Expands Agent Pay with New Trust and Intelligence Services
During the week, Mastercard announced an expansion of Agent Pay, its agentic payments program, with new trust and intelligence services that combine identity, intent, behavioral, and fraud insights, including a probability score, rolling out for testing in the U.S., that indicates the likelihood that a transaction was initiated by an AI agent; the services form the intelligence layer of the Agent Pay Trust Framework and give financial institutions and retailers a clearer, shared understanding of AI-driven activity, supporting smarter authorization decisions and less unnecessary friction for legitimate agent-led purchases. With one in 10 consumers projected to routinely use agents to make purchases by 2030, and partnerships with Cloudflare and Skyfire strengthening visibility and agent verification across the ecosystem, Mastercard is positioning itself as a trusted infrastructure provider for secure agentic commerce.
-
American Express Declares Regular Quarterly Dividend
During the week, the Board of Directors of American Express declared a regular quarterly dividend of USD 0.95 per common share, payable on November 10th, 2026, to shareholders of record on October 9th, 2026; the declaration signals stability in the company's capital position and a continued commitment to returning capital to shareholders, supporting the investment case for American Express as a premium, cash-generative payments franchise.
-
PayPal Survey Shows Holiday Spending Holding Firm as Shoppers Priorities Value and Flexibility
During the week, PayPal released its 2026 Holiday Shopping Survey, which revealed that 58.0% of Americans feel greater financial concern heading into the holidays, yet 64.0% still expect to spend the same or more than they did last holiday season, while 58.0% plan to shop before Thanksgiving and 67.0% are more likely to shop with a retailer offering rewards or cash back; the survey highlights that consumers are changing how they spend rather than how much, with 55.0% having used or considered BNPL, of whom three-quarters plan to use or are considering using it for holiday shopping. This shift toward earlier planning, rewards, and flexible payment options strengthens the case for PayPal's Pay Later offerings, including Pay in 4 and Pay Monthly, and its PayPal Cashback Mastercard, as shoppers look to stretch their holiday budgets.
-
Digital Payments Stock Performance
The table below presents a snapshot of NYSE-listed digital payments stocks, covering Visa, Mastercard, American Express (AXP), Wise Plc, Block and PayPal:X
|
Cytonn Report: Digital Payments NYSE and LSE stock perfomance |
|
||||||||||||
|
Company |
Year Open 2026 |
Price 6/30/2026 |
Price 8/03/2026 |
Price 9/25/2026 |
Price 9/30/2026 |
Price 10/03/2026 |
w/w change |
m/m change |
Q/Q change |
YTD change |
Forward P/E |
||
|
American Express |
372.7 |
338.3 |
344.7 |
308.9 |
304.1 |
302.8 |
(2.0%) |
(12.2%) |
(10.1%) |
(18.8%) |
15.1 x |
||
|
Visa |
346.5 |
343.1 |
3665.7 |
367.4 |
359.3 |
360.7 |
(1.8%) |
(90.2%) |
4.7% |
4.1% |
24.0 x |
||
|
Mastercard |
563.1 |
513.6 |
571.0 |
567.7 |
551.5 |
552.3 |
(2.7%) |
(3.3%) |
7.4% |
(1.9%) |
24.2 x |
||
|
Circle |
83.5 |
62.6 |
60.4 |
89.0 |
82.2 |
81.3 |
(8.7%) |
34.6% |
31.2% |
(2.7%) |
74.6 x |
||
|
Block |
65.2 |
76.0 |
82.1 |
76.4 |
73.5 |
74.3 |
(2.7%) |
(9.5%) |
(3.3%) |
14.1% |
14.5 x |
||
|
Paypal Holdings |
58.1 |
43.2 |
57.9 |
55.0 |
52.5 |
52.8 |
(4.1%) |
(8.8%) |
21.7% |
(9.2%) |
9.1 x |
||
|
Global Payments Inc |
77.0 |
72.6 |
84.2 |
86.5 |
81.7 |
78.4 |
(9.4%) |
(6.9%) |
12.6% |
1.8% |
5.3 x |
||
|
Average |
|
|
|
|
|
|
|
|
|
|
23.8 x |
||
Source: Visa, AXP, Circle, Mastercard, Block and PayPal financials, NYSE, PE* calculated using FY’2025 audited financials
The stocks are currently trading at an average forward P/E multiple of 23.8x, indicating that investors are pricing in strong future earnings growth and are prepared to pay a substantial premium for current earnings. This also suggests that valuations may be stretched relative to near-term fundamentals.
Other notable digital payments sector highlights during the month of September 2026 include:
-
During the month, Visa released its Money Travels 2026 report, which found that U.S. consumer intent to use stablecoins rose from 36.0% to 56.0% under a hypothetical scenario involving bank-level fraud protection and deposit insurance, while willingness to use stablecoins increased to 45.0% when offered through an existing financial provider, highlighting consumer protection and institutional trust as key drivers of stablecoin adoption. Cytonn Weekly #38/2026
-
During the month, Mastercard partnered with startup Alchemy to introduce an agentic payment option using one-time-use virtual card credentials and stablecoin wallets, enabling AI agents to discover, compare and purchase goods on behalf of users within set parameters, while prompting the industry to adapt risk rules and anti-fraud frameworks to allow bots to transact safely. Cytonn Weekly #37/2026
-
During the month, Circle Internet Group Inc. announced a definitive agreement to acquire Singapore-based cross-border payments infrastructure provider Tazapay, bringing more than USD 25.0 bn in annualized payment volume, over 60 banking and fintech partners and local payout rails across more than 100 markets into Circle’s payments ecosystem, strengthening its ability to originate and terminate USDC-denominated payments globally. Cytonn Weekly #36/2026
We expect the global digital payments sector to continue shifting toward greater payment sovereignty and reduced reliance on traditional card-based networks, as governments and financial institutions prioritize control over domestic payment ecosystems. The European Central Bank's progress toward launching the Digital Euro signals a growing move toward central bank-backed payment infrastructure, which is likely to intensify competition with established private networks such as Visa Inc. and Mastercard Incorporated. However, despite these favorable long-term tailwinds, valuations remain elevated, with the companies under coverage trading at an average forward P/E of 23.8x, suggesting that much of the expected growth may already be priced in. As such, we expect near-term performance to remain sensitive to regulatory developments, execution risk, and how quickly incumbents and new entrants adapt to the changing payments landscape.
Disclaimer: The views expressed in this publication are those of the writers where particulars are not warranted. This publication, which is in compliance with Section 2 of the Capital Markets Authority Act Cap 485A, is meant for general information only and is not a warranty, representation, advice or solicitation of any nature. Readers are advised in all circumstances to seek the advice of a registered investment advisor.

- Talk to us
- Kenya
- P.O Box 20695 - 00200, Nairobi, Kenya
- Cell +254709101200
- Tel +254709101200
- WhatsApp +254741676635
- United States
- +254709101200
- DOWNLOAD OUR APP
-


- Kenya
- 8th Floor, Pinetree Plaza, Kaburu Drive, Ngong Road, Nairobi, Kenya
- USA
- Suite 1150, 1775 Eye Street NW, USA, Washington DC 20006, USA
- Investments
- High Yield
- Private Equity
- Real Estate
- Real Estate
- RiverRun Estates
- Cytonn Towers
- The Ridge
- Taraji Heights
- The Alma