Kenya’s Public Debt, & Cytonn Weekly #52/2020
By Cytonn Research, Dec 27, 2020
Executive Summary
Fixed Income
During the week, T-bills remained undersubscribed, with the overall subscription rate coming in at 52.8%, a decrease from 90.4% recorded the previous week. This can be mainly attributed to the continued tight liquidity in the money market as evidenced by 0.7% points increase in the average interbank rate to 5.8% from 5.1%, recorded last week. Investors preferred the 91-day paper, which had the highest subscription rate which came in at 143.8% but it was a decrease from 215.7% recorded the previous week. During the week, parliament approved COVID-19 tax reversals to be effective from January 1st 2021 by ratifying the Tax Laws (Amendment) [No.2] Bill, 2020. The incentives had been issued under the economic stimulus package as a way to mitigate the effects of COVID-19 on individual and business incomes;
Equities
During the week, the equities market was on an upward trajectory, with both NASI and NSE 25 gaining by 1.4% and NSE 20 gained by 2.4%, taking their YTD performance to losses of 9.8%, 30.7%, and 18.4%, for NASI, NSE 20 and NSE 25, respectively. The equities market performance was driven by gains recorded by large-cap stocks such as Bamburi, Diamond Trust Bank (DTBK) and ABSA of 8.3%, 7.8% and 5.0%, respectively. The gains were however weighed down by losses recorded by other large-cap stocks such as Standard Chartered Bank and BAT of 1.5% and 1.3%, respectively. During the week, the Central Bank of Kenya (CBK) released the Commercial Banks’ Credit Survey Report for Q3’2020, with 76.0% of the respondents in Mining and Quarrying sector stating that the perceived demand for credit remained unchanged, with 45% and 44% of the Household and Trade sectors seeing an increase in credit demand;
Real Estate
During the week, Knight Frank, a global real estate company and property manager released the Kenya Buyer Survey 2020, which indicated that house prices are expected to remain low with some ready to give up to 15% discounts. In the residential sector, Meera Construction Limited, a subsidiary of Krishna Group launched a Kshs 750 mn project in Thindigua dubbed Green Zone Estate. In the industrial sector, a Mauritius-based firm, Grit Real Estate Income Group, announced plans to set up 10,142 square meters of modern warehousing space within Mlolongo area targeting the growing industrial and transport hub. In the land sector, the ministry of lands announced that it will be overseeing the development of a National Land Valuation index (NLVI) that is intended to guide the process of land valuations within the country;
Focus of the Week
Over the past few years, Kenya’s Public Debt has been on the rise, increasing from Kshs 1.3 tn 10 years ago to Kshs 7.1 tn now, at a 10-year CAGR of 18.5%. The rising debt has been brought about by the government’s significant borrowing to fund infrastructural projects and bridge the fiscal deficit that has averaged 7.7% of GDP since 2012, with borrowing being both direct and also by guaranteeing state corporations. The debt mix currently stands at 51:49 external to domestic debt, respectively, compared to a mix of 45:55 external to domestic debt 10 years ago. With the current pandemic, revenue collections have been also lagging and we expect more borrowing to bridge the gap, evidenced by the government’s plan to borrow USD 2.3 bn (Kshs 256.2 bn) loan from the IMF and up to USD 1.5 bn (Kshs 167.1 bn) from the World Bank. Key to note, the IMF had approved a USD 739.0 mn (Kshs 78.4 bn) disbursement to be drawn under the Rapid Credit Facility in May, in addition to USD 1.0 bn (Kshs 106.1 bn) financing received from the World Bank in the same month to help the country respond to the sudden economic shock at the onset of the pandemic;
- Weekly Rates:
- Cytonn Money Market Fund closed the week at a yield of 10.74%. To invest, just dial *809#;
- Cytonn High Yield Fund closed the week at a yield of 13.55% p.a. To invest, email us at sales@cytonn.comand to withdraw the interest you just dial *809#;
- For an exclusive tour of Cytonn’s real estate developments, visit: Sharp Investor's Tourand for more information, email us at sales@cytonn.com;
- We successfully handed over Phase 3 of the Alma project on the 22nd of December 2020. Please see attached photos of the happy homeowners;
- We continue to offer Wealth Management Training daily, from 9:00 am to 11:00 am, through our Cytonn Foundation. The training aims to grow financial literacy among the general public. To register for any of our Wealth Management Training, click here;
- For Pension Scheme Trustees and members, we shall be having different industry player’s talk about matters affecting Pension Schemes and the pensions industry at large. Join usevery Wednesday from 9:00 am to 11:00 am for in-depth discussions on matters pension;
- If interested in our Private Wealth Management Training for your employees or investment group, please get in touch with us through wmt@cytonn.com;
- We have 10 investment-ready projects, offering attractive development and buyer targeted returns. See further details here: Summary of Investment-ready Projects;
- We are currently running a Christmas offer on some of our Real Estate projects, email at us at sales@cytonn.com for more information;
For recent news about the company, see our news section here.
Money Markets, T-Bills & T-Bonds Primary Auction:
During the week, T-bills remained undersubscribed, with the overall subscription rate coming in at 52.8%, a decrease from the 90.4% recorded the previous week. This can be mainly attributed to the continued tightening of liquidity in the market evidenced by 0.7% points increase in the average interbank rate to 5.8% from 5.1%, recorded last week. Investors continued to prefer the 91-day paper, which had the highest subscription rate but the same decreased to 143.8% from 215.7% recorded the previous week. The subscription for the 182-day paper decreased to 24.2% from 78.6%, while that of the 364-day paper, declined to 44.0% from 52.1% recorded the previous week. The yields on the 91-day, 182-day and 364-day increased by 3.0 bps, 4.0 bps and 9.0 bps to 6.9%, 7.4% and 8.3%, respectively. The government continued to reject expensive bids with the acceptance rate declining to 80.0%, from 98.4% recorded the previous week, accepting bids worth Kshs 10.1 bn out of the Kshs 12.8 bn worth of bids received.
The Treasury has offered two new bonds, FXD1/2021/02 and IFB1/2021/16, with effective tenors of 2 years and 16 years, respectively for a total value of Kshs 25.0 bn and Kshs 50.0 bn, respectively. The bonds will have market-determined coupon rates. The period of sale runs from 21st Dec 2020 to; 5th Jan 2021 for FXD1/2021/002 and 19th Jan 2021 for IFB1/2021/016.
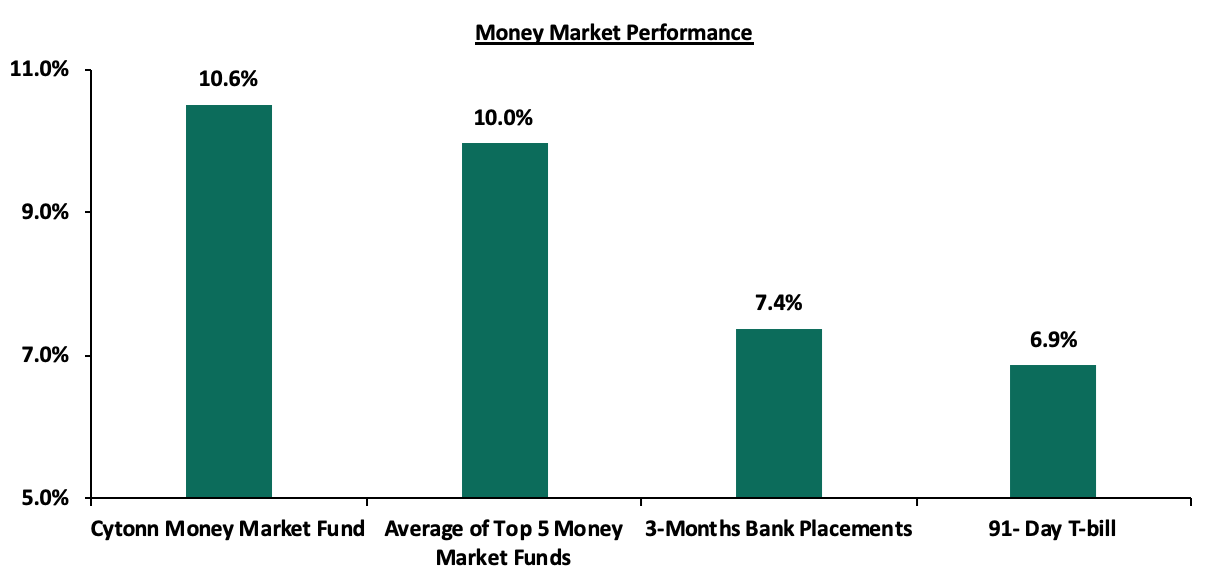
In the money markets, 3-month bank placements ended the week at 7.4% (based on what we have been offered by various banks), while the yield on the 91-day T-bill increased by 2.0 bps to 6.9%. The average yield of Top 5 Money Market Funds remained unchanged at 10.0%, as recorded the previous week. The yield on the Cytonn Money Market also remained unchanged at 10.5%, recorded the previous week.
Liquidity:
During the week, liquidity in the market continued to tighten with the average interbank rate increasing by 0.7% points, to 5.8% from 5.1% recorded the previous week. The average interbank volumes declined by 24.9% to Kshs 11.2 bn, from Kshs 14.9 bn recorded the previous week.
Kenya Eurobonds:
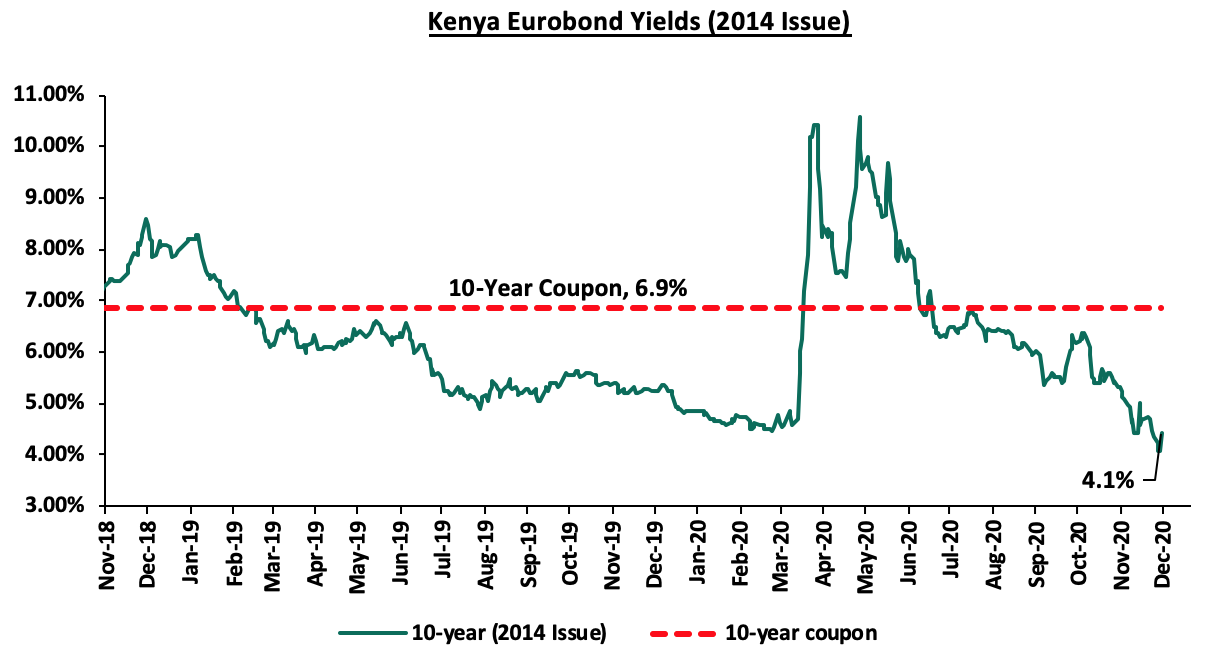
During the week, the yields on all Eurobonds remained unchanged. The yield on the 10-year Eurobond issued in June 2014 remained unchanged at 4.1%.
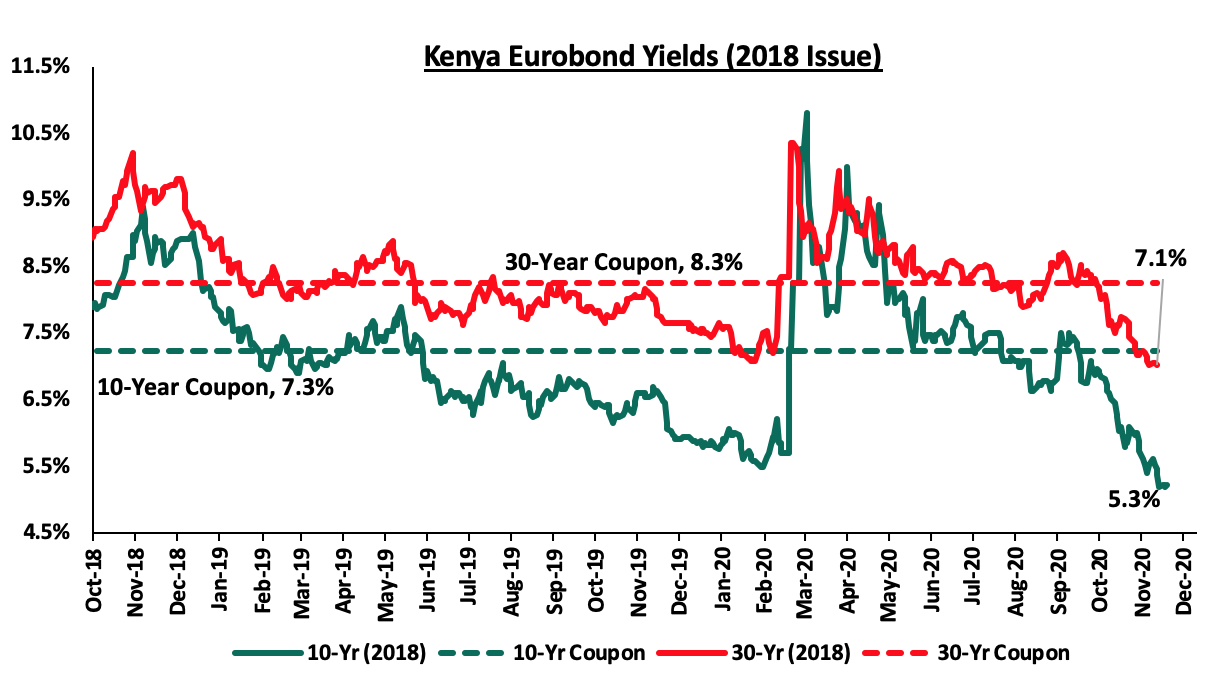
During the week, the yields on the 10-year and 30-year Eurobonds issued in 2018 both remained unchanged at 5.3%, and the 30-year at 7.1%.
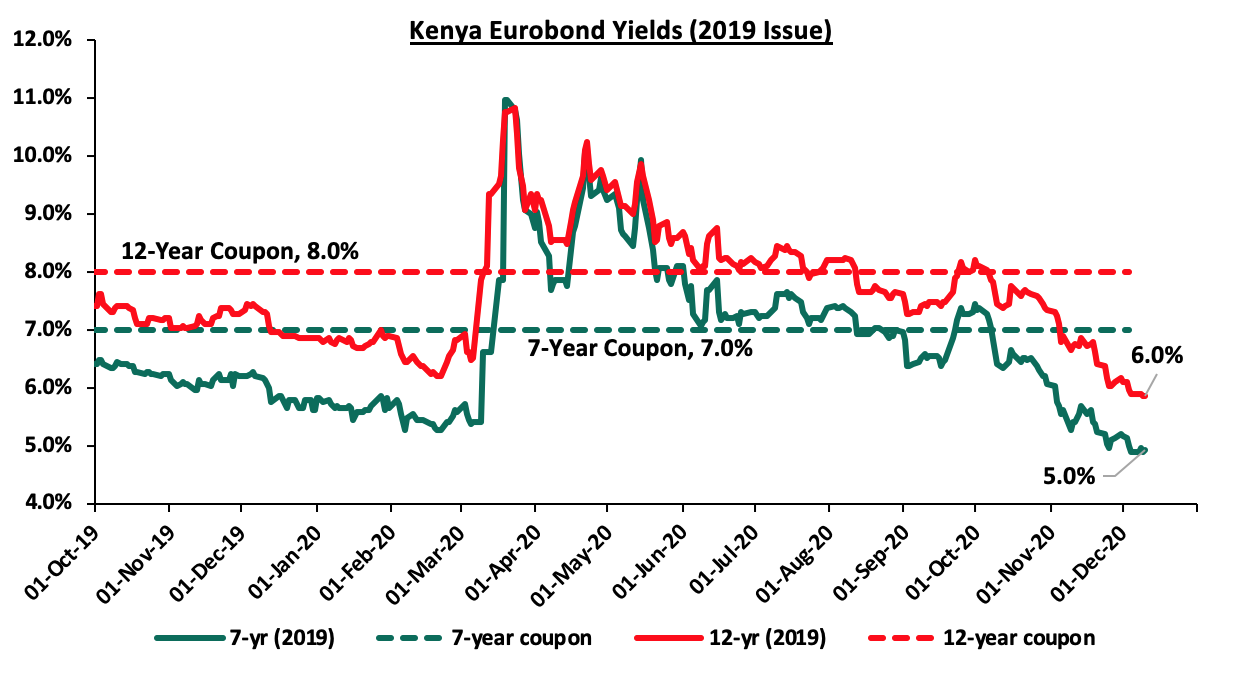
During the week, the yields on the 2019 dual-tranche Eurobonds both remained unchanged at 5.0% for the 7-year Eurobond and, the 12-year Eurobond at 6.0% as recorded last week.
Kenya Shilling:
During the week, the Kenyan shilling appreciated against the US dollar by 2.5% to Kshs 108.8 from Kshs 111.6. This is partly attributable to the easing of the US dollar against other world currencies falling and also the support activity by the Central Bank. On a YTD basis, the shilling has depreciated by 7.4% against the dollar, in comparison to the 0.5% appreciation in 2019. We expect continued pressure on the Kenyan shilling due to:
- Demand from merchandise traders as they beef up their hard currency positions ahead of the festive season, amid a slowdown in foreign dollar currency inflows, and,
- Continued uncertainty globally making people prefer holding dollars and other hard currencies.
However, in the short term, the shilling is expected to be supported by:
- The Forex reserves which are currently at USD 7.8 bn (equivalent to 4.8-months of import cover), which is above the statutory requirement of maintaining at least 4.0-months of import cover, and the EAC region’s convergence criteria of 4.5-months of import cover, and,
- Improving diaspora remittances evidenced by a 17.3% y/y increase to USD 263.1 mn in October 2020, from USD 224.3 mn recorded over the same period in 2019, has cushioned the shilling against further depreciation,
Weekly Highlight:
During the week, Parliament approved COVID-19 tax reversals to be effective from 1st January 2021 by ratifying the Tax Laws (Amendment) [No.2] Bill, 2020. The incentives had been issued under the economic stimulus package as a way to mitigate the effects of COVID-19 on individual and business incomes. The rates affected include;
- The rate of pay as you earn (PAYE) and corporation tax rate which will both revert to 30.0% from the current 25.0%, and,
- Value-added tax rate which will revert to 16.0% from the current 14.0%,
This comes on the back of revenue underperformance reported in the first quarter of the 2020/21 Fiscal year. The ordinary revenue collection declined by 10.9% to Kshs 342.6 bn against a target of Kshs 384.3 bn, representing a Kshs 41.7 bn reduction. This was mainly attributable to reduced tax collections, whereby PAYE and local VAT collections declined by 27.1% and 30.8%, respectively. Consequently, we are of the view that the reversal will still not help the government achieve its revenue targets since; many people are still jobless following the vast loss of jobs due to the pandemic. The prospects of a sudden recovery are forestalled by the spike in the number of new COVID-19 infections in the country. The increase in VAT will likely be reflected in an increase in inflation as traders pass the burden to the consumers. What would have been more helpful to the economy was a stimulus to assist businesses recover and hence create jobs.
Rates in the fixed income market have remained relatively stable due to the high liquidity in the money markets, coupled with the discipline by the Central Bank as they reject expensive bids. The government is 39.3% ahead of its prorated borrowing target of Kshs 215.1 bn having borrowed Kshs 299.5 bn. In our view, due to the current subdued economic performance brought about by the effects of the COVID-19 pandemic, the government will record a shortfall in revenue collection with the target having been set at Kshs 1.9 tn for FY’2020/2021 thus leading to a larger budget deficit than the projected 7.5% of GDP, ultimately creating uncertainty in the interest rate environment as additional borrowing from the domestic market may be required to plug the deficit. Owing to this uncertain environment, our view is that investors should be biased towards short-term to medium-term fixed income securities to reduce duration risk.
Markets Performance
During the week, the equities market was on an upward trajectory, with both NASI and NSE 25 gaining by 1.4%, while NSE 20 gained by 2.4%, taking their YTD performance to losses of 9.8%, 30.7%, and 18.4%, for NASI, NSE 20 and NSE 25, respectively. The equities market performance was driven by gains recorded by large-cap stocks such as Bamburi, Diamond Trust Bank (DTBK) and ABSA of 8.3%, 7.8% and 5.0%, respectively. The gains were however weighed down by losses recorded by other large-cap stocks such as Standard Chartered Bank and BAT of 1.5% and 1.3%, respectively.
Equities turnover declined by 32.9% during the week to USD 12.4 mn, from USD 18.4 mn recorded the previous week, taking the YTD turnover to USD 1.4 bn. Foreign investors remained net sellers during the week, with a net selling position of USD 1.7 mn, from a net selling position of USD 2.3 mn recorded the previous week, taking the YTD net selling position to USD 281.5 mn.
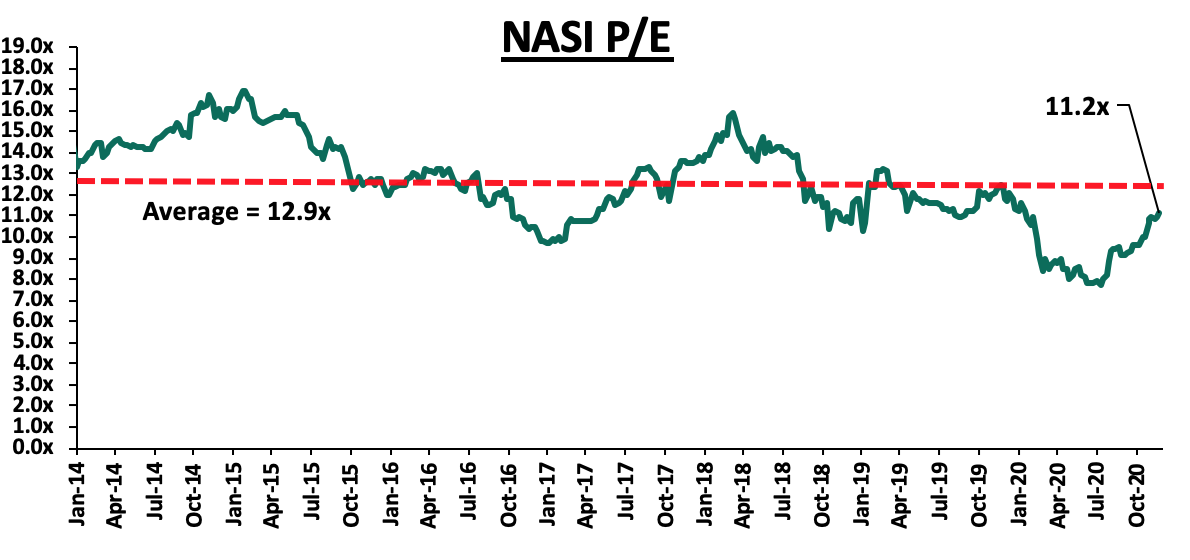
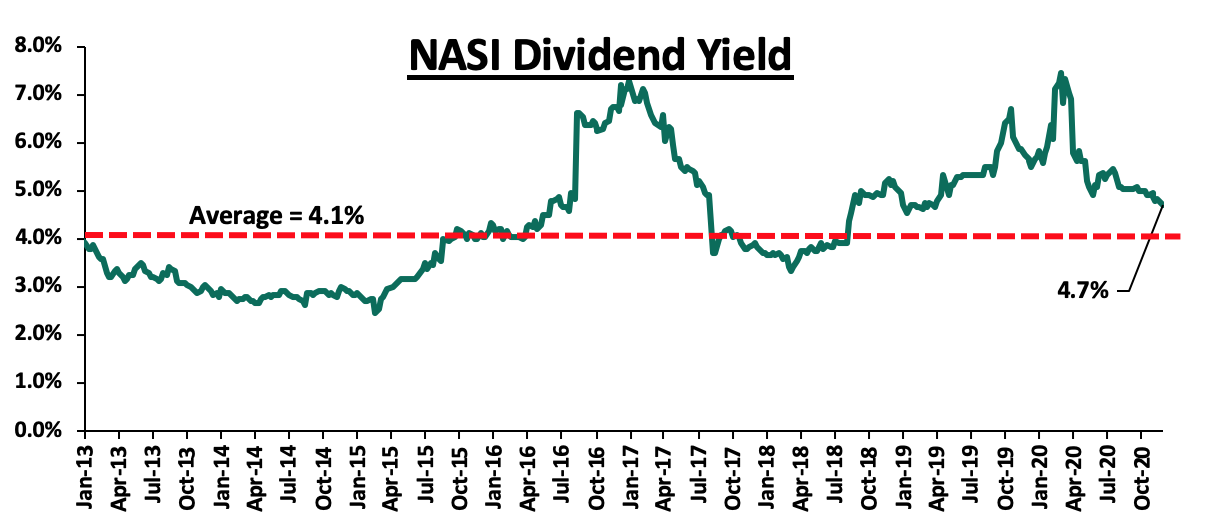
The market is currently trading at a price to earnings ratio (P/E) of 11.2x, 13.6% below the 11-year historical average of 12.9x. The average dividend yield is currently at 4.7%, 0.1% points below the 4.8% recorded the previous week and 0.6% points above the historical average of 4.1%.
With the market trading at valuations below the historical average, we believe there are pockets of value in the market for investors with higher risk tolerance and are willing to wait out the pandemic. The current P/E valuation of 11.2x is 45.2% above the most recent valuation trough of 7.7x experienced in the first week of August 2020. The charts below indicate the market’s historical P/E and dividend yield.
Weekly Highlight
During the week, the Central Bank of Kenya (CBK) released the Commercial Banks’ Credit Survey Report for Q3’2020, highlighting that 76.0% of the respondents in the mining and Quarry reported that the perceived demand for credit remained unchanged. 45.0% and 44.0% of the respondents in personal/household and trade sectors, respectively, reported increases in credit demand. Additionally, 44.0% and 42.0% of the respondents reported that the demand for credit decreased in the Real estate and Tourism sectors, respectively. Key to note, 50.0% of the banks reported that the COVID-19 pandemic had negatively impacted the demand for credit with the loan book growing by 1.2% in Q3’2020, down from the 2.2% growth recorded in Q2’2020, while 81.0% of the respondents indicated that the demand for credit remained unchanged, after the repeal of interest rate capping law. A total of 38 operating commercial banks and 1 mortgage finance company participated in the Survey. Other Key take-outs from the report include:
- The balance sheet expanded by 10.4% to Kshs 5.3 tn in Q3’2020, from Kshs 4.8 tn in Q3’2019. This was attributable to increased investment in government securities and foreign currency loans during the period under review, coupled with a 6.4% increase in gross loans to Kshs 2,943.5 bn in Q3’2020, from Kshs 2,766.7 bn in Q3’2019, which was on account of increased advances in the Real Estate, Transport and Communication and personal/household sectors,
- Adverse effects from a slowdown in business activities from the COVID-19 pandemic eroded the banks’ asset quality, with the NPL ratio rising by 1.2% points to 13.6% in Q3’2020, from 12.4% recorded in Q3’2019,
- According to the report, the implementation of IFRS 9 that became effective from January 2018 has negatively impacted the banks’ capital adequacy due to the increased provisioning levels required. To mitigate this, the regulator indicates that banks have injected more capital to accommodate the expected increase in credit losses as well as continuously reviewed their business models to incorporate a forward-looking credit risk assessment model, which complies with IFRS 9,
- The banking sector remained liquid as evidenced by a 0.5% points increase in the liquidity position to 53.3% in Q3’2020, from 52.8% in Q2’2020. This was 33.3% points above the minimum statutory ratio of 20.0%. The improved liquidity position was attributed to; i) increase in deposit mobilization contributing 57.0%, ii) maturity of government securities contributing 24.0%, iii) capital injection contributing 9.0%, and iv) loan recovery efforts contributing 9.0%. Additionally, the lowering of the Cash Reserve Ratio (CRR) to 4.25%, from 5.25% in March 2020, availed more funds in the sector for onward lending, and,
- The guidance on loan restructuring given on the onset of the pandemic in March 2020 saw banks give payment holidays to their borrowers who had been adversely affected by the pandemic. As such, most banks reported that they were currently meeting all the loan extension and restructuring costs, putting a strain in their operations as well as their interest income.
Despite the CBK’s efforts to cushion the sector against any pandemic related shocks, credit risk remained elevated as demonstrated by the banking industry NPL ratio deteriorating by 0.5% points to 13.6% in Q3’ 2020 from 13.1% in Q2’2020. As highlighted in our Q3’2020 Listed Banks Report, we believe that the banking sector remains highly susceptible to these shocks, as evidenced by the depressed earnings and the deterioration in asset quality among the listed banks, with the NPL ratio rising by 2.6% points to 12.4% in Q3’2020, from 9.8% recorded in Q3’2019. However, intensified credit recovery efforts in sectors such as Transport and Communication, Real estate and trade coupled with the banks' adherence to IFRS 9 provisioning requirements will improve the overall quality of the asset portfolio. We expect the banking industry to remain resilient having implemented tightened credit standards on granting of new loans coupled with the proactive monitoring of the current loan book, and the removal of the waiver of fees on bank transfers which will, in turn, boost the Non-funded income.
Universe of Coverage:
|
Company |
Price at 18/12/2020 |
Price at 24/12/2020 |
w/w change |
YTD Change |
Year Open |
Target Price* |
Dividend Yield |
Upside/ Downside** |
P/TBv Multiple |
Recommendation |
|
Kenya Reinsurance |
2.3 |
2.4 |
4.9% |
(22.1%) |
3.0 |
4.0 |
4.7% |
74.2% |
0.3x |
Buy |
|
Diamond Trust Bank*** |
67.3 |
72.5 |
7.8% |
(33.5%) |
109.0 |
105.1 |
3.7% |
48.7% |
0.3x |
Buy |
|
I&M Holdings*** |
45.2 |
43.4 |
(4.0%) |
(19.6%) |
54.0 |
60.1 |
5.9% |
44.4% |
0.7x |
Buy |
|
Sanlam |
11.8 |
13.0 |
9.7% |
(24.7%) |
17.2 |
18.4 |
0.0% |
42.1% |
1.1x |
Buy |
|
KCB Group*** |
36.8 |
37.0 |
0.5% |
(31.5%) |
54.0 |
46.0 |
9.5% |
33.8% |
0.9x |
Buy |
|
Co-op Bank*** |
11.7 |
11.9 |
1.7% |
(27.2%) |
16.4 |
14.5 |
8.4% |
30.3% |
0.9x |
Buy |
|
Equity Group*** |
34.6 |
34.7 |
0.3% |
(35.2%) |
53.5 |
43.0 |
5.8% |
29.9% |
1.0x |
Buy |
|
Liberty Holdings |
7.4 |
7.8 |
6.3% |
(24.4%) |
10.4 |
9.8 |
0.0% |
25.3% |
0.6x |
Buy |
|
Britam |
7.0 |
7.2 |
2.3% |
(20.2%) |
9.0 |
8.6 |
3.5% |
23.3% |
0.8x |
Buy |
|
ABSA Bank*** |
9.2 |
9.6 |
5.0% |
(27.9%) |
13.4 |
10.5 |
11.4% |
20.6% |
1.2x |
Buy |
|
Stanbic Holdings |
82.0 |
79.0 |
(3.7%) |
(27.7%) |
109.3 |
84.9 |
8.9% |
16.4% |
0.8x |
Accumulate |
|
Standard Chartered*** |
147.3 |
145.0 |
(1.5%) |
(28.4%) |
202.5 |
153.2 |
8.6% |
14.3% |
1.2x |
Accumulate |
|
Jubilee Holdings |
285.0 |
283.3 |
(0.6%) |
(19.3%) |
351.0 |
313.8 |
3.2% |
13.9% |
0.7x |
Accumulate |
|
NCBA*** |
23.5 |
24.5 |
4.3% |
(33.5%) |
36.9 |
25.4 |
1.0% |
4.7% |
0.6x |
Lighten |
|
CIC Group |
2.1 |
2.1 |
2.9% |
(21.3%) |
2.7 |
2.1 |
0.0% |
(0.5%) |
0.8x |
Sell |
|
HF Group |
3.2 |
3.2 |
(2.5%) |
(51.1%) |
6.5 |
3.0 |
0.0% |
(5.1%) |
0.1x |
Sell |
|
*Target Price as per Cytonn Analyst estimates **Upside/ (Downside) is adjusted for Dividend Yield ***For Disclosure, these are banks in which Cytonn and/ or its affiliates are invested in |
||||||||||
We are “Neutral” on the Equities markets in the short term but “Bullish” in the medium to long term. We expect the recent discovery of a new strain of COVID-19 coupled with the introduction of strict lockdown measures in major economies to continue dampening the economic outlook. However, we believe there exist pockets of value in the market, with a bias on financial services stocks given the resilience exhibited in the sector. The sector is currently trading at historically cheaper valuations and as such, presents attractive opportunities for investors with a high-risk tolerance, willing to wait out the pandemic.
- Industry Reports
During the week, Knight Frank, a global real estate company and property manager released the Kenya Buyer Survey 2020, a survey that was conducted to understand the impact the Covid-19 pandemic on residential markets, and in particular, the buyers' attitude. Some of the key take-outs from the survey include:
- 32.0% of households are likely to move from their current homes to other house units over the next 12 months. Out of the population, 72.0% are likely to stay in the same location that they live in but move to a different property,
- 54.0% of respondents are more likely to buy a detached family home than they were before Covid-19, with 50.0% in favour of waterfront homes,
- The demand for apartments has declined, with 50.0% of respondents indicating that they are less likely to want to live in an apartment in the future as they seek to have more spacious living spaces that can accommodate both living and working spaces,
- More than a third of prospective homebuyers from the sample selected are looking for low-cost houses, this is mainly as a result of the tough economic environment brought about by the COVID-19 pandemic which has led to a shift to affordable housing options,
- Over three-quarters of respondents stated that they are more likely to work from home in the future as a result of Covid-19, with only 1.0% of respondents indicating that they intended to work less from home. In our view, the continued working from home trend is likely to result in reduced demand for physical office spaces and the increased the need for convenient residential housing with spaces accommodating work, shopping and living spaces,
- The house prices are expected to fall over the next 12 months with 50.0% of respondents expecting prices of properties to fall over the next 12 months, 36.0% do not foresee any change, while 14.0% believe that prices will increase,
- Sellers of residential properties are more inclined to discount the prices of properties and provide offers of up to 15.0% off the asking prices as a result of increased demand for liquidity, and,
- Similar to primary residences, buyers of second homes are prioritising home offices, greater privacy and outdoor space when choosing a second home.
The results generated from the survey shows a shift in the buyer’s trends when it comes to choosing a residential home as a result of the COVID-19 pandemic. The market continues to witness high demand for low-cost housing evidenced by the higher uptake of units in the lower mid-end areas as seen in our Nairobi Metropolitan Area Residential Report-2020, according to which, the detached units in the lower mid-end areas recorded an average uptake of 17.5%, 1.0% points higher than 16.5% average uptake for the high-end detached units. Additionally, apartments in the lower mid-end areas recorded an average uptake of 20.3%, 1.8% points higher than the 18.5% average uptake of apartments in the upper mid-end areas within the Nairobi Metropolitan Area (NMA).
The table below shows the residential performance summary for FY’2020
All values in Kshs unless stated otherwise
|
Residential Performance Summary FY’20 |
||||||||
|
Segment |
Typology |
Average Price Per SQM |
Average Rent Per SQM |
Average Annual Uptake |
Average Occupancy |
Average Rental Yield |
Average Y/Y Price Appreciation |
Average Total Returns |
|
High-End |
Detached |
184,843 |
736 |
16.5% |
82.3% |
4.2% |
0.0% |
4.2% |
|
Upper Mid-End |
Detached |
140,642 |
601 |
17.7% |
88.9% |
4.6% |
0.9% |
5.6% |
|
Lower Mid-End |
Detached |
69,484 |
317 |
17.5% |
83.7% |
4.6% |
(0.5%) |
4.1% |
|
Upper Mid-End |
Apartments |
116,093 |
610 |
18.5% |
87.9% |
5.4% |
(0.7%) |
4.6% |
|
Lower Mid-End |
Apartments |
90,939 |
526 |
20.3% |
86.6% |
5.8% |
0.1% |
5.9% |
|
Satellite Towns |
Apartments |
81,833 |
426 |
19.5% |
84.3% |
5.4% |
(0.1%) |
5.3% |
|
Residential Market Average |
113,972 |
536 |
18.3% |
85.6% |
5.0% |
(0.1%) |
5.0% |
|
Source: Cytonn Research
- Residential
During the week, Meera Construction Limited, a subsidiary of Krishna Group launched a Kshs 750 mn project in Thindigua dubbed Green Zone Estate. The Green Zone Housing project is expected to host approximately 160 units: 64 one-bedroom units, 32 two-bedroom units, and 64 three-bedroom units priced at Kshs 2.7 mn, 4.6 mn, and, 6.3mn, respectively. The units will be in phase two of the project, with 224 units on a two and a half-acre plot in phase one of the project. Below is the summary of the sales prices of the units;
|
Green Zone Estates-Thindigua |
|||
|
No of Bedrooms |
Unit Size (SQM) |
Price (Kshs) |
Price per SQM (Kshs) |
|
1 |
45 |
2,700,000 |
60,000 |
|
2 |
96 |
4,600,000 |
48,168 |
|
3 |
144 |
6,300,000 |
43,750 |
|
Average |
|
|
50,639 |
Source: Online Research
The units are priced at approximately Kshs 50,639 per SQM on average, 117.7% lower than the market average rates for Thindigua which stand at Kshs 110,224 per SQM according to the Cytonn Q3’2020 Markets Review. The project which will be financed by the Bank of Baroda, who has also partnered with Housing Finance to offer mortgage loans to buyers at an interest rate of 9.0%, thus enabling buyers to own the relatively affordable houses through the cash and tenant purchase option. The launch of the project indicates the continued efforts by private sector players in support of the affordable housing initiative which aims to see the delivery of approximately 0. 5mn affordable units by 2022.
In terms of performance, Thindigua was the best performing submarket for apartments recording an average total return of 8.1%, 2.4% points higher than the market average of 5.7%, supported by positive demographics as Thindigua hosts a significant working population, ease of accessibility as the area is served by Kiambu Road and, and, availability of amenities such as the Two-Rivers, Ridgeways mall, and Ciata City mall.
All Values in Kshs Unless Stated Otherwise
|
Lower Mid-End: Satellite Towns Apartments Performance Q3’2020 |
||||||||
|
Area |
Average price per SQM (Kshs) Q3’2020 |
Average rent per SQM (Kshs) Q3’2020 |
Average Occupancy Q3’2020 |
Average Uptake Q3’2020 |
Average Annual Uptake Q3’2020 |
Average Rental Yield Q3’2020 |
Average Price Appreciation Q3’2020 |
Total Returns Q3’2020 |
|
Thindigua |
110,224 |
590 |
96.4% |
93.2% |
18.8% |
5.8% |
2.3% |
8.1% |
|
Syokimau |
69,225 |
362 |
88.3% |
79.9% |
14.2% |
5.5% |
1.4% |
6.8% |
|
Ruiru |
89,781 |
495 |
76.4% |
60.7% |
20.4% |
5.0% |
1.3% |
6.2% |
|
Kikuyu |
81,090 |
416 |
86.0% |
84.4% |
26.5% |
5.7% |
0.1% |
5.8% |
|
Athi River |
58,311 |
340 |
84.6% |
90.1% |
15.3% |
6.2% |
(1.8%) |
4.4% |
|
Kitengela |
60,027 |
325 |
88.1% |
99.5% |
13.6% |
6.0% |
(1.7%) |
4.3% |
|
Ruaka |
100,215 |
520 |
89.9% |
86.2% |
25.6% |
5.3% |
(1.3%) |
4.0% |
|
Average |
81,268 |
436 |
87.1% |
84.8% |
19.2% |
5.6% |
0.0% |
5.7% |
Source: Cytonn Research
We expect increased activities on the affordable housing front with private sector players complementing government efforts supported by; the growing demand for affordable housing options, positive demographics with Kenya recording relatively high urbanization and population rates of 4.0% and 2.2%, compared to the global average of 1.9% and 1.1%, respectively according to the World Bank, and government incentives such as ; (i) waiver on stamp duty for first time home buyers of affordable housing units, and, (ii) the affordable housing relief of 15.0% of gross emoluments up to Kshs 108,000 per annum or Kshs 9,000 per month for Kenyans buying houses under the Affordable Housing Scheme.
- Land
The ministry of lands announced that it will be overseeing the development of a National Land Valuation index that is intended at guiding the process of land valuations within the country. The process will involve the collection of data and undertaking of inspections of land parcels located in counties such as; Kiambu, Kajiado, Nakuru, Machakos, and, Meru. So far, the Ministry of Land has completed the process of data collection in 11 other counties which include; Kakamega, Garissa, Bungoma, and Busia among others. The land valuation index will be of essence in; i) creating a credible valuation database for use in making investment decisions, ii) making land compensation decisions, iii) creation of a generalized system that will determine the land rates throughout the country, iv) preparation of development appraisals, iv) monitoring the performance of properties, and, v) using accurate land values to determine loan securities. In our view, the land valuation index will play an important role in determining the market rates of land as it can be used as a basis of negotiation between buyers and sellers, for land rent, land taxation, compensation, mortgages appraisal, secured borrowing, future investment, land use planning, and identifying the value of individual land assets.
- Industrial Sector
A Mauritius-based firm, Grit Real Estate Income Group, announced plans to set up 10,142 square meters of modern warehousing space within Mlolongo area targeting the growing industrial and transport hub. The firm plans to expand its logistics presence within the country by focusing on the Mlolongo and Syokimau areas which have continued to offer new investment areas for storage and logistics following the completion of the Standard Gauge Railway (SGR) and the establishment of an inland container depot. The establishment of the prime logistics and warehousing space is expected to commence in 2021 and will be ready for occupation in mid-2022.
The decision by Grit Real Estate Income Group to invest in a modern warehousing facility signals rise in demand for high-quality storage for goods with features such as; (i) high floor load-bearing capacity, (ii) low operating costs due to environmental friendly features such as solar-powered electricity, and, (iii) approximately 12 m operating heights which make it possible to stack more goods. Besides the demand for good warehousing spaces stems from the prevalence of outdated spaces in most industrial parks in Kenya despite the growing demand for the spaces as the manufacturing sector continues to expand. The decision to focus on Mlolongo is supported by; (i) relatively good infrastructural network with the area being served by Mombasa Road, (ii) availability of development land, iii) proximity to the Standard Gauge Railway terminus that serves as an offloading point for Nairobi for goods coming from Mombasa, and iv) the zoning of the area as an industrial zone thus high presence of industries.
We expect the industrial sector to witness a growing uptake and occupancy of warehouse space fuelled by; (i) expansion of local and international retailers seeking storage space for goods, (ii) government focus on the Big 4 Agenda on manufacturing which is expected to influence demand for warehouses, (iii) the improving infrastructure, for instance, the construction of SGR phase two which will increase the output of Special Economic Zones, and, (iv) growth in e-commerce trade.
The real estate sector is expected to continue recording activities with an anticipated focus on affordable residential projects, modern warehousing facilities, and establishment of land reforms. Nevertheless, the sector especially the residential theme is expected to continue being faced by the COVID-19 pandemic which has resulted in a shift in buyer trends.
Over the past few years, Kenya’s Public Debt has been on the rise, increasing from Kshs 1.3 tn 10 years ago to Kshs 7.1 tn now, at a 10-year CAGR of 18.5%. The rising debt has been brought about by the government’s significant borrowing to fund infrastructural projects and bridge the fiscal deficit that has averaged 7.7% of GDP since 2012, with borrowing being both direct and also by guaranteeing state corporations. The debt mix currently stands at 51:49 external to domestic debt, respectively, compared to 45:55 external to domestic debt 10 years ago. With the current pandemic, the revenue collections have also been lagging and we expect more borrowing to bridge the gap, evidenced by the government’s plan to borrow USD 2.3 bn (Kshs 256.2 bn) loan from the IMF and up to USD 1.5 bn (Kshs 167.1 bn) from the World Bank. Key to note, the IMF had approved a USD 739.0 mn (Kshs 78.4 bn) disbursement to be drawn under the Rapid Credit Facility in May, in addition to USD 1.0 bn (Kshs 106.1 bn) financing received from the World Bank in the same month to help the country respond to the sudden economic shock at the onset of the pandemic. The 9 months following the reporting of the first case of Covid-19 have seen public debt rise to new highs driven by several factors which include but are not limited to:
- Reduction in government revenue for the first quarter of FY’2020/21, with revenue collection being Kshs 100.8 bn lower than at the same period last year, being at Kshs 527.7 bn compared to Kshs 628.5 bn collected in the same period last year. The low collection can be attributed to the significant weakening of economic activity as a result of containment measures by the government in addition to the tax incentives put in place to cushion the economy against the adverse effects of the pandemic. Key to note, however, some of the tax measures put in place to cushion the economy will revert to pre-Covid rates on January 1st 2021. These include:
- Corporate Tax rate which was reduced to 25.0% from 30.0%,
- Individual Income Tax rate for individuals earning higher than Kshs 24,000, which was reduced to 25.0% from 30.0%, and,
- Value Added Tax (VAT) rate which was reduced to 14.0% from 16.0%,
- Parliament’s approval of a proposal by the National Treasury in October 2019 to raise the national debt ceiling to an absolute figure of Kshs 9.0 tn from the previous limit of 50.0% of the GDP which has given the government more room for borrowing, and,
- Continued servicing of commercial loans and Eurobonds, denominated in US dollars, despite a weakening shilling which has depreciated by 7.4% YTD to stand at Kshs 108.8 against the dollar as at 24th December 2020,
We have been tracking the evolution of the public debt and below are the previous topicals we have done on Kenya’s debt:
- Kenya’s Debt Levels: Are we on a Sustainable Path?– In May 2016, we wrote about the rising debt levels in the country and concluded that they were within the safer bounds in terms of debt levels but needed to look into risks associated with the changing funding patterns that could see the debt levels rise,
- Kenyan Debt Sustainability– In December 2016, we wrote about Kenya’s debt level, questioning its sustainability, and concluded that the government needed to reduce the amount of public debt, giving suggestions as to how this could be achieved,
- Kenya’s Public Debt, Should We be concerned? – In February 2018, we wrote about the concerns surrounding the debt level of the country and concluded that we should be concerned about the country’s debt levels unless decisive policies were implemented, and,
- Kenya’s Public Debt – In July 2020, we wrote about the high debt levels in the country, which have exceeded the recommended threshold, and the downgrading of Kenya’s creditworthiness on the back of an economic downturn following the global pandemic and we gave suggestions on measures that could be taken towards debt sustainability,
In this week’s topical, we focus on the current state of affairs regarding the country’s public debt profile and levels and discuss how sustainable the same is. Under this, we shall cover:
- Kenya’s Evolution of Debt,
- Kenya’s Current Debt Levels, Debt Profile and Composition,
- Analysis of debt metrics
- Debt management strategies put in place, risks abound and recommendations going forward
- Conclusion
Section II: Current Debt Levels and Evolution of Debt
The country’s total public debt as at 30th September 2020 stood at Kshs 7.1 tn (equivalent to 69.6% of GDP), which is a Kshs 1.2 tn increase from the Kshs 6.0 tn debt recorded in September 2019 (equivalent to 62.1% of GDP). Parliament approved to increase the debt ceiling to the absolute figure of Kshs 9.0 tn from the initial 50.0% of GDP in October 2019, meaning that the government has headroom to borrow an additional Kshs 1.9 tn before the current debt ceiling is exceeded. Key to note, since the first reported case of COVID-19 on 13th March 2020 in Kenya, the total public debt has grown by 13.3% to Kshs 7.1 tn from Kshs 6.3 tn. The debt mix currently stands at 51:49 external to domestic debt, respectively, with foreign borrowing at Kshs 3.7 tn while domestic borrowing stands at Kshs 3.5 tn. Banking institutions account for the highest percentage of domestic debt in terms of government securities holdings at 53.9%.
Below is a table of the composition of government domestic debt by holder:
|
|
Composition of Government Domestic Debt by Holder |
||||||||||
|
|
Dec-10 |
Dec-11 |
Dec-12 |
Dec-13 |
Dec-14 |
Dec-15 |
Dec-16 |
Dec-17 |
Dec-18 |
Dec-19 |
Dec-20 |
|
Banking Institutions |
55.1% |
47.3% |
52.6% |
48.2% |
54.0% |
55.8% |
52.2% |
54.3% |
54.5% |
54.2% |
53.9% |
|
Insurance Companies |
10.5% |
11.7% |
10.5% |
10.3% |
9.9% |
8.4% |
7.2% |
6.4% |
6.1% |
6.5% |
6.4% |
|
Parastatals |
6.8% |
6.5% |
4.8% |
3.6% |
2.8% |
4.7% |
5.9% |
6.9% |
7.3% |
6.7% |
5.7% |
|
Pension Funds |
20.6% |
29.2% |
20.3% |
26.6% |
24.0% |
25.2% |
28.1% |
27.8% |
27.6% |
28.2% |
29.8% |
|
Other Investors |
7.0% |
5.3% |
11.8% |
11.3% |
9.3% |
5.9% |
6.5% |
4.5% |
4.6% |
4.4% |
4.3% |
|
Total |
100.0% |
100.0% |
100.0% |
100.0% |
100.0% |
100.0% |
100.0% |
100.0% |
100.0% |
100.0% |
100.0% |
Source: Central Bank of Kenya
Below is a table highlighting the trend in the external and domestic debt composition over the last 10 years;
Source: Central Bank of Kenya
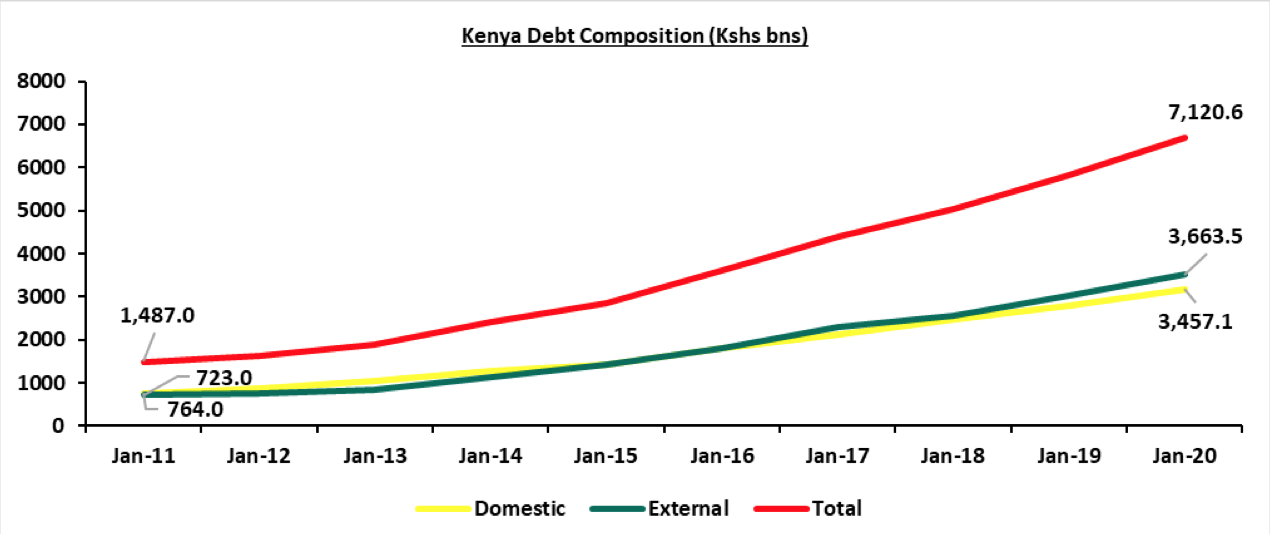
Debt composition and Evolution:
The country’s debt composition has evolved, with the government increasing foreign debt to Kshs 3.7 tn as at September 2020 compared to Kshs 0.6 tn in September 2010, at a 10-year CAGR of 20.0%, while domestic debt has increased to Kshs 3.5 tn as at September 2020 compared to 0.7 tn in September 2010, a 10-year CAGR of 17.5%. Foreign debt has therefore increased at a faster rate than domestic debt, highlighting that the government is turning more to external lenders. Foreign debt comprises of multilateral loans, bilateral loans and commercial loans. Multilateral loans are debts issued by international institutions such as the World Bank and the IMF to member nations to promote social and economic development while bilateral loans are loan agreements between individual nations. Multilateral and bilateral loans are categorized as concessional loans due to the favourable terms offered in terms of either below-market interest rates, long grace periods or a combination of both. Commercial loans, on the other hand, are loans agreed between a country and an external commercial bank or an external financial debt instrument. Commercial loans typically have higher rates and shorter grace periods.
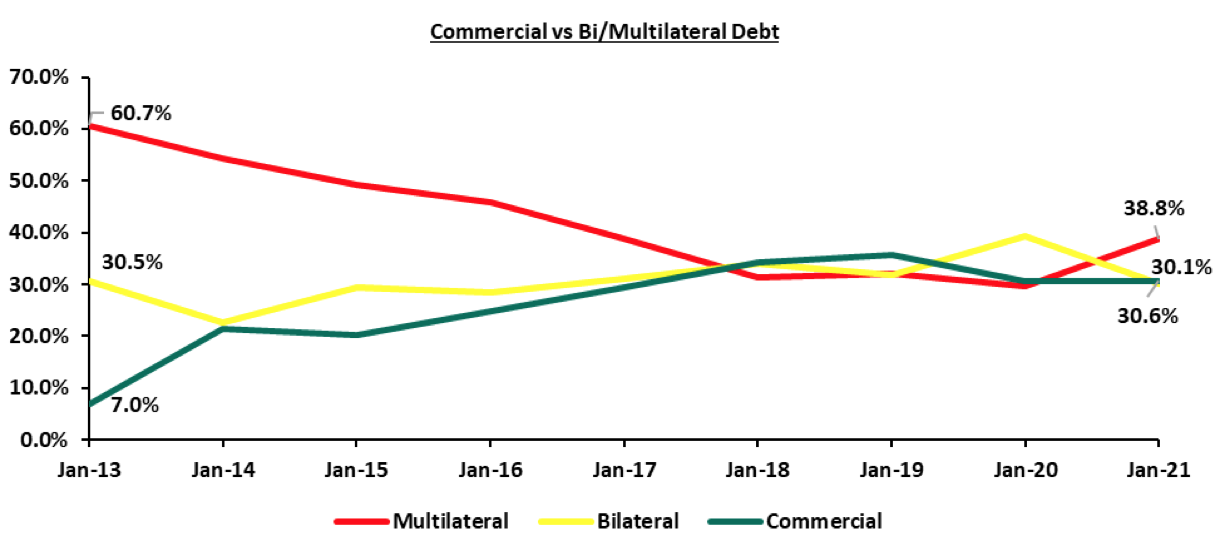
Kenya’s exposure to bilateral and multilateral loans has been declining in favour of a much more commercial funding structure comprising of Eurobonds and syndicated loans (loans provided by a group of lenders who work together to provide funds for a single borrower). This has seen the proportion of concessional loans (Bilateral and Multilateral debt) which stood at 79.8% of total external debt as at September 2015, decline by 10.9% points to approximately 68.9% of total external debt as at September 2020. Commercial loans, deemed more expensive because of their high-interest costs, have grown at a 5-year CAGR of 30.5% from a low of Kshs 295.6 bn (equivalent to 19.1% of total external debt) as at September 2015, to Kshs 1.1 tn (equivalent to 30.6% of total external debt) as at September 2020. It is key to note that:
- Multilateral debt increased by 9.1% points to 38.8% in September 2020 from 29.7% of total external debt in June 2020 due to loans from the IMF and the World Bank received during the period. Bilateral debt decreased by 1.0% points to 30.1% in September 2020, from 31.1% in September 2015, and,
- Commercial debt has cumulatively increased by 11.5% points to 30.6% of total external debt in September 2020 from 19.1% in September 2015, mainly attributable to the issue of Eurobonds within the period,
This is illustrated in the chart below:
Source: Central Bank of Kenya & National Treasury
Section III: Debt Metrics
- Debt to GDP Ratio
Kenya’s debt to GDP ratio came in at an estimated 69.6% in 2020, 15.6% points above the IMF recommended threshold of 50.0% for developing countries. Late last year, the treasury amended the Public Finance Management (PFM) regulations to substitute the debt ceiling which was previously set at 50.0% of GDP to an absolute figure of Kshs 9.0 tn to plug the budget shortfalls. As highlighted in our focus on Kenya’s Public Debt in July, according to Fitch Ratings, the shocks from COVID-19 are expected to delay the narrowing of the fiscal deficit. Government debt is forecasted to reach 70.0% of GDP in 2021 on the back of rising debt levels and weak revenue growth. Below is a graph highlighting the trend in the country’s debt to GDP ratio;
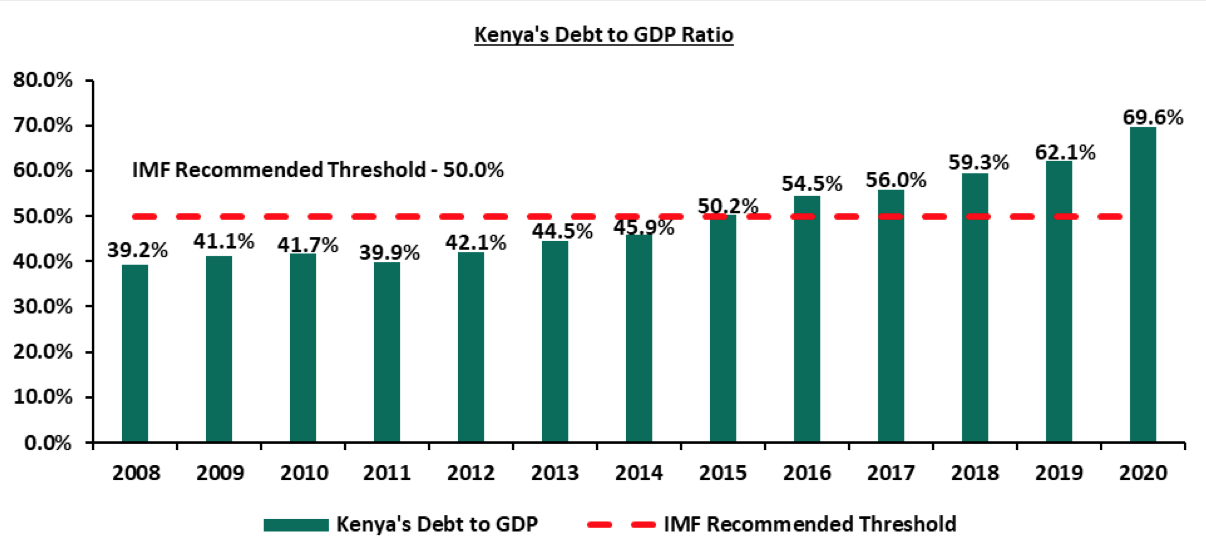
Source: World Bank
- Debt Service to revenue
This is a measure of how much of the government’s revenue is used to service debt. For the first half of 2020, revenue collection activities of the government have been affected due to the ongoing pandemic with major economic sectors such as tourism, manufacturing and agriculture bearing the brunt of the effects of the pandemic following supply-side shocks. According to the National Treasury’s Annual Debt Management Report 2019/2020, the debt service to revenue ratio is estimated at 41.4% at the end of 2020, 11.4% points higher than the recommended threshold of 30.0% but 15.4% points lower than FY’ 2019’s debt service ratio of 56.8%, attributable to reduced debt service obligations during the year. The reduction in service obligations in 2020 compared to 2019 is attributed to the country retiring the Kshs 75.0 bn debut Eurobond floated in 2014 in FY’ 2019/2020. This payment was however serviced using funds from the Kshs 210.0 bn dual-tranche 7-year and 12-year Eurobond issued the same year. The sustained level of debt service to revenue ratio above the recommended threshold is a worrying sign, elevating the refinancing risk following shocks arising from the ongoing pandemic and low revenue collection. For this financial year, a total of Kshs 651.5 bn has been set aside for debt servicing from the targeted Kshs 1.6 tn revenue collection. Below is a chart showing the debt service to revenue ratio;
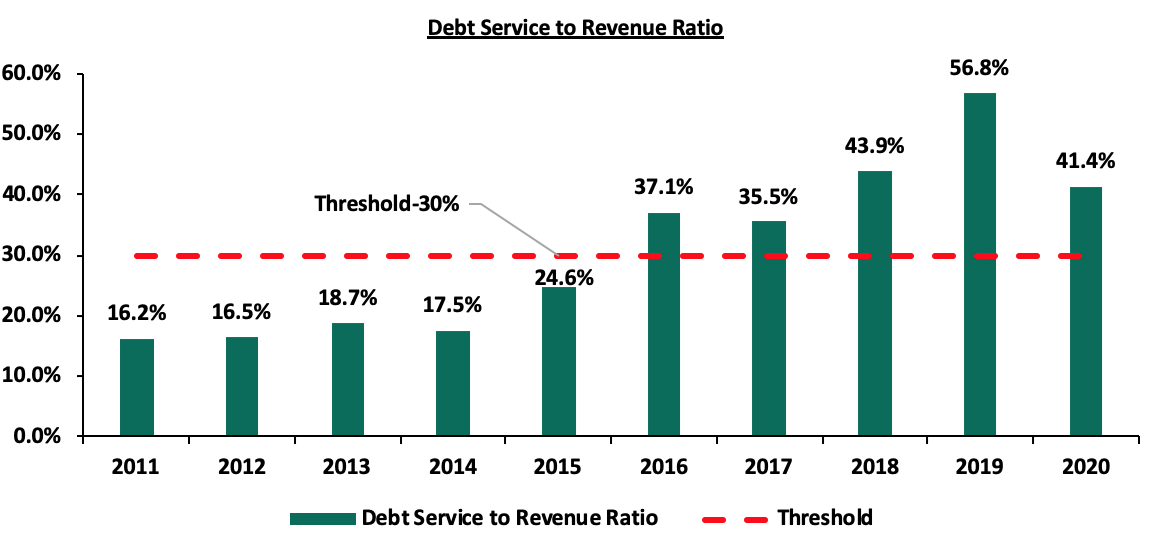
Source: National Treasury Annual Public Debt Report
Further to the above, we expect the country’s cost of debt servicing to rise driven by currency depreciation with the shilling having depreciated by 7.4% year to date to close the week at Kshs/USD 108.8. This means that as the shilling depreciates, the government will have to pay more to service its foreign-denominated external debt. Additionally, the debt service to revenue ratio is expected to increase mainly driven by the expected decline in revenue. The table below shows the comparison of the currency composition of foreign debt in June 2020 compared to June 2014:
|
Currency composition of External Debt end June 2020 |
||
|
Jun-14 |
Jun-20 |
|
|
USD |
42.8% |
67.3% |
|
Euro |
28.5% |
18.0% |
|
Japanese Yen |
11.5% |
6.6% |
|
Chinese Yuan |
4.8% |
5.4% |
|
GBP |
4.7% |
2.5% |
|
Others |
7.7% |
0.2% |
|
Total |
100.0% |
100.0% |
Source: National Treasury Annual Public Debt Report
- GDP per Capita vs Debt per Capita
Kenya’s Public Debt per Capita has increased at an 11-year CAGR of 14.7% from FY’2008 to FY’2019, compared to GDP per Capita which has grown at an 11-year CAGR of 3.0%. This is an indication that public debt is rising at a faster rate than the GDP, further elevating the risk of debt distress and may also be an indication that the debt being incurred is not translating into economic growth. The Debt per Capita, which can be viewed as an indicator of the average debt burden on an individual citizen, currently stands at Kshs 110,472.9, which is Kshs 14,430.9 higher than the GDP per Capita, which currently stands at Kshs 96,042.0, according to World Bank data.
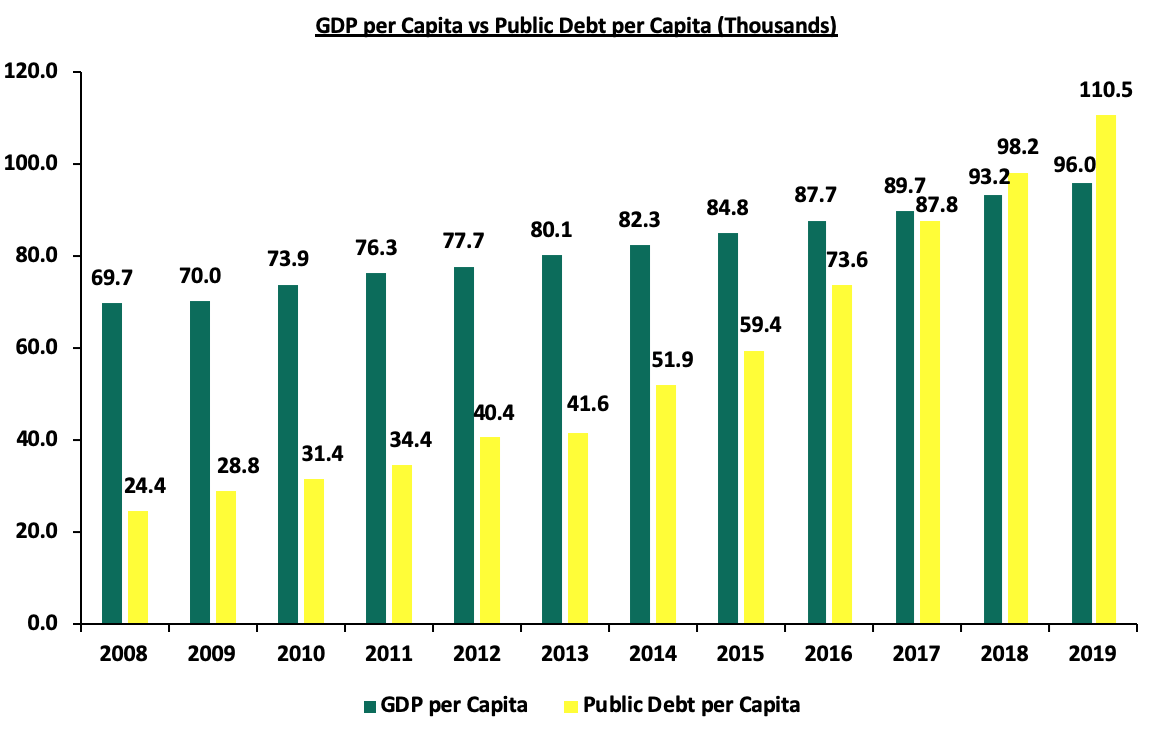
Source: World Bank and Central Bank of Kenya
Section IV: Debt Management Strategies and Recommendations going forward
During the financial year, the National Treasury, through the Public Debt Management Office (PDMO), formulated the Public Debt and Borrowing Policy, which was approved by the cabinet in March 2020, to strengthen and guide the management of public debt. The objectives of the Public Debt and Borrowing Policy include:
- Ensure government financing needs and payment obligations are met at the lowest possible cost over the medium to long-run, consistent with a prudent degree of risk,
- Promote the development of the domestic debt market through a partnership with the Kenya Bankers’ Association by establishing an Over-The-Counter (OTC) platform to improve liquidity in Kenya’s debt market
- Provide guidance to the treasury on debt management and contraction of public debt
- Ensure value for money from debt-funded programs
- Safeguard the country’s debt sustainability
In addition to the Public Debt and Borrowing Policy, the government is also considering the G-20’s Debt Service Suspension Initiative (DSSI) which would see the country benefit from up to Kshs 75.0 bn in suspended debt service obligations (7.0% of total debt). The DSSI, however, doesn’t involve commercial creditors or some bilateral lenders such as China, which accounts for 28.0% of foreign bilateral trade. The DSSI is being offered as a condition to secure additional funds from the IMF, but it would only offer a short term solution and possibly lead to the further downgrading of Kenya’s credit rating by international credit rating institutions, consequently increasing the cost of debt. The government, therefore, finds itself between a rock and a hard place as it weighs its options. According to a clause in the Eurobonds II Prospectus, external debt suspension of foreign-denominated debt of any form is taken as default, and as such, the holders of at least 25.0% of the bond may declare all the Notes to be immediately due and payable at their principal amount together with the accrued interest. This is a situation the government isn’t willing to get into, hence the hesitation of joining the DSSI.
Due to sub-optimal revenue collection owing to the subdued business environment caused by the containment measures put in place to curb the spread of Covid-19, the government has found itself in a position where it has to borrow more funds to plug the fiscal deficit. Below are some of the risks that the high debt levels open the economy to:
- Further depreciation of the local currency, which hit an all-time low of Kshs 111.6 against the dollar on 15th December as other governments demand hard currency to service the debt increases,
- The higher cost of debt servicing due to debt obligations in foreign currencies despite a weakening shilling, which may lead to higher taxation as the government tries to keep up with its debt obligations,
- The increased cost of further borrowing since lenders will price the new debt at higher rates considering the possible increased risks,
- Crowding out of the private sector by the government which largely leads to lower projected economic growth, subsequently impacting collections further, and,
- Fiscal consolidation and austerity measures which undermine economic activity, development objectives and decrease the government’s ability to effectively respond to emergencies since governments often borrow to address unexpected events. Having a high debt level means there will be fewer options,
Recommendations
The high debt levels in the country have become a point of great concern with both the debt to GDP ratio as well as the debt service to revenue ratio having exceeded the recommended thresholds. We expect the economy to face fiscal challenges arising from the global pandemic. This sentiment has been echoed by various authoritative bodies, pointing to a possible further downgrading of Kenya’s creditworthiness. Despite this, some investors are optimistic with regards to the country’ outlook evidenced by the decline in Eurobond yields since May, pointing to the perception of lower risk in the country going forward, coupled with the additional funding received from both the World Bank and the IMF. Locally, the Central Bank, through the Monetary Policy Committee, has continued to support the economy through the policy rate and the Cash Reserve Ratio and is confident that the measures put in place are having the desired effect. Below are some actionable steps the government can take towards debt sustainability;
- Restructuring the debt mix towards more concessional borrowing: the government should go for more concessional borrowing to reduce the amounts paid in debt service. Additionally, commercial borrowing should be limited to development projects with high financial and economic returns, to ensure that more expensive debt is invested in projects that yield more than the market rate charged,
- Reduce capital expenditure: The government can carry out capital expenditure cuts during the current period of distress and direct the funds to areas that have a higher economic return such as supporting the agricultural and manufacturing sectors. By scaling down on the funding of new projects and focusing on completing those that are pending, the economic benefits will be transmitted into the economy and support overall economic growth. Feasibility tests should also be done before embarking on mega-infrastructure projects to ascertain their Economic Rate of Return (ERR) to ensure the economic benefits outweigh the cost and the ripple effect from the projects will provide an enabling economic environment to facilitate servicing the debt instead of saddling the servicing burden on taxpayers,
- Build an export-driven economy: The government can focus on developing certain sectors such as agriculture and manufacturing to build an export-driven economy. Encouraging growth in the agricultural and manufacturing sectors will help increase the value of our exports, leading to an improved current account. Additionally, they can encourage private sector involvement in such development projects to reduce the strain on government expenditure, and,
- Private-Public Partnerships for projects: Establishing Private-Public partnerships to facilitate infrastructural projects and reduce the reliance on borrowing to fund projects. The recently launched Kenya Pension Funds Investment (KEPFIC), that allows pension funds to invest up to 10.0% of their Assets Under Management (AUM) on infrastructure and alternative investments is a step in the right direction in this regard since it will not only reduce the infrastructural burden of debt but also deepen and enhance the capital market,
Section V: Conclusion
The current level of debt is worrying which has further been exacerbated by the weak economic fundamentals attributable to the effects of COVID-19 pandemic. Q2’2020 GDP growth contracted by 5.7%, the first contraction since Q3’2001 when the economy contracted by 2.5%, the 2020 contraction was due to the closure of schools and contraction in education output, which contributed a 1.7% points reduction in GDP, contraction in the services sub-sector which contributed a 1.4% points contraction and reduced government revenue from taxes, which weighed down GDP growth by 0.6% points. According to the IMF, GDP growth is however expected to come in at 1.0% in 2020 and rebound to 4.7% in 2021 owing to the gradual reopening of schools and the global economy, favorable rains and consequently improve agricultural output.
A significant amount of government spending has gone towards development projects whose expected economic return might not be able to finance the cost of financing. For example, the Exim Bank of China is set to receive Kshs 43.2 bn in debt payments for the SGR in the current fiscal year despite the project facing a variety of challenges such as low cargo volumes and revenue shortfalls. In the period from January to May 2020, the SGR recorded revenues of Kshs 4.9 bn against operation costs of Kshs 7.3 bn, representing a loss of Kshs 2.4 bn. This means that instead of the high-cost project contributing to its debt servicing, the burden is falling entirely on the taxpayer; an indication that a significant part of growth in debt is not translating into growth in the economy.
The coming financial year will likely see the government cut back on expenditure and focus on fiscal consolidation as it aims to reduce the budget deficit. The austerity measures that are likely to follow will negatively affect the economy, which requires stimulus as it recovers from the adverse effects of the pandemic. Limited government expenditure will also work against the governments ambitious ‘Big 4 agenda’ and limit the ability of the government to provide public services. We are of the view that suspending debt obligations would not solve the problem but instead exacerbate the issue by increasing servicing pressure once the suspension period is over since the government will then have to service more expensive commercial loans in addition to the servicing the suspended obligations.
Disclaimer: The views expressed in this publication are those of the writers where particulars are not warranted. This publication is meant for general information only and is not a warranty, representation, advice or solicitation of any nature. Readers are advised in all circumstances to seek the advice of a registered investment advisor.

- Talk to us
- Kenya
- P.O Box 20695 - 00200, Nairobi, Kenya
- Cell +254709101200
- Tel +254709101200
- WhatsApp +254741676635
- United States
- +254709101200
- DOWNLOAD OUR APP
-


- Kenya
- 8th Floor, Pinetree Plaza, Kaburu Drive, Ngong Road, Nairobi, Kenya
- USA
- Suite 1150, 1775 Eye Street NW, USA, Washington DC 20006, USA
- Investments
- High Yield
- Private Equity
- Real Estate
- Real Estate
- RiverRun Estates
- Cytonn Towers
- The Ridge
- Taraji Heights
- The Alma