Kenya’s Real Estate Investment Trusts (REITs) FY’2023 Report, & Cytonn Weekly #23/2024
By Research Team, Jun 9, 2024
Executive Summary
Fixed Income
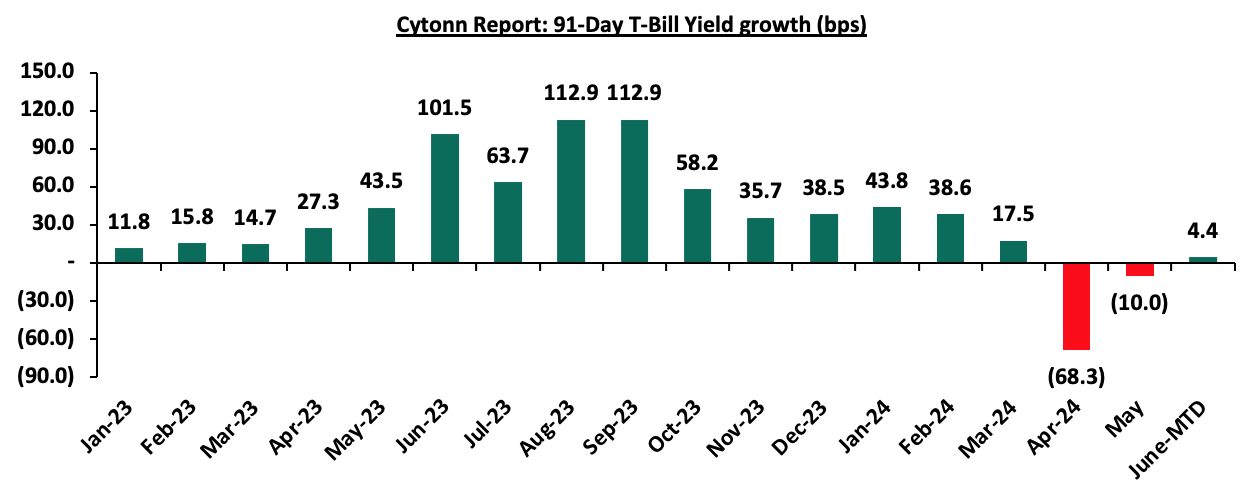
During the week, T-bills were oversubscribed for the sixth consecutive week, with the overall oversubscription rate coming in at 151.0%, higher than the oversubscription rate of 139.6% recorded the previous week. Investors’ preference for the shorter 91-day paper persisted, with the paper receiving bids worth Kshs 25.1 bn against the offered Kshs 4.0 bn, translating to an oversubscription rate of 626.5%, higher than the oversubscription rate of 446.6% recorded the previous week. The subscription rate for the 182-day and 364-day papers decreased to 59.7% and 52.0% respectively from 91.7% and 64.7% recorded the previous week. The government accepted a total of Kshs 34.1 bn worth of bids out of Kshs 36.2 bn bids received, translating to an acceptance rate of 94.3%. The yields on the government papers were on an upward trajectory, with the yields on the 91-day, 182-day and 364-day papers increasing by 1.1 bps, 3.3 bps and 2.5 bps to 15.97%, 16.64% and 16.73% from 15.95%, 16.61% and 16.71% respectively recorded the previous week;
During the week, the Central Bank of Kenya released the auction results for the re-opened bond FXD1/2023/002 with a tenor to maturity of 1.2 years, and a fixed coupon rate of 17.0% and FXD1/2024/003 with a tenor to maturity of 2.6 years, and a fixed coupon rate of 18.4%. The bonds were oversubscribed with the overall subscription rate coming in at 109.5%, receiving bids worth Kshs 32.8 bn against the offered Kshs 30.0 bn. The government accepted bids worth Kshs 30.9 bn, translating to an acceptance rate of 94.0%. The weighted average yield of accepted bids for the FXD1/2023/002 and the FXD1/2024/003 came in at 17.1% and 17.6% respectively, which was slightly above our expectation of within a bidding range of 16.6% - 16.8% for the FXD1/2023/002 and 17.0% - 17.4% for the FXD1/2024/003. Notably, the FXD1/2023/002 registered an increase from the 17.0% registered in April when it was last re-opened. With the Inflation rate at 5.1% as of May 2024, the real return of the FXD1/2023/002 and the FXD1/2024/003 is 12.0% and 12.5% respectively;
Also, during the week, the monetary policy committee met to review the outcome of its previous policy decisions against a backdrop of improved global outlook for growth, continued stickiness in inflation in advanced economies as well as the heightened geopolitical tensions. The MPC decided to maintain the CBR rate at 13.0%, which was in line with our expectation for the MPC to retain the CBR rate at 13.0%.
Additionally, during the week, Stanbic Bank released its monthly Purchasing Manager's Index (PMI) highlighting that the index for the month of May 2024 improved slightly, coming in at 51.8, above the 50.0 neutral, up from 50.1 in April 2024, signaling a modest improvement in operating conditions across Kenya;
Equities
During the week, the equities market was on an upward trajectory, with NSE 20 gaining the most by 2.3% while NASI, NSE 25, and NSE 10 gained by 1.4%, 0.8%, and 0.03% respectively taking the YTD performance to gains of 28.5%, 25.0%, 24.6% and 16.8% for NSE 10, NSE 25, NASI, and NSE 20 respectively. The equities market performance was driven by gains recorded by large-cap stocks such as Stanbic, DTB-K, and KCB Group of 7.9%, 3.1%, and 2.5% respectively. The performance was, however, weighed down by losses recorded by large-cap stocks such as EABL, BAT, and NCBA of 7.4%, 1.1, and 0.2% respectively;
Real Estate
On the Unquoted Securities Platform, Acorn D-REIT and I-REIT traded at Kshs 24.5 and Kshs 22.0 per unit, respectively, as of 7th June 2024. The performance represented a 22.5% and 10.0% gain for the D-REIT and I-REIT, respectively, from the Kshs 20.0 inception price;
Focus of the Week
Following the release of the FY’2023 results by all four authorized Real Estate Investment Trusts (REITs) in Kenya, the Cytonn Real Estate Research Team undertook an analysis of the financial performance of the REITs and identified the key factors that shaped the performance of the sector. The report is themed “Strategies for Advancing Kenya's REIT Market,” where we discuss the background and structure of REITs in Kenya, and assess the financial performance of the current REITs in the market during FY’2023 in terms of operational metrics, profitability metrics, leverage ratios, liquidity ratios and valuation metrics;
Investment Updates:
- Weekly Rates:
- Cytonn Money Market Fund closed the week at a yield of 17.59% p.a. To invest, dial *809# or download the Cytonn App from Google Play store here or from the Appstore here;
- We continue to offer Wealth Management Training every Monday, from 7:00 pm to 8:00 pm. The training aims to grow financial literacy among the general public. To register for any of our Wealth Management Trainings, click here;
- If interested in our Private Wealth Management Training for your employees or investment group, please get in touch with us through wmt@cytonn.com;
- Cytonn Insurance Agency acts as an intermediary for those looking to secure their assets and loved ones’ future through insurance namely; Motor, Medical, Life, Property, WIBA, Credit and Fire and Burglary insurance covers. For assistance, get in touch with us through insuranceagency@cytonn.com;
- Cytonn Asset Managers Limited (CAML) continues to offer pension products to meet the needs of both individual clients who want to save for their retirement during their working years and Institutional clients that want to contribute on behalf of their employees to help them build their retirement pot. To more about our pension schemes, kindly get in touch with us through pensions@cytonn.com;
Real Estate Updates:
- For more information on Cytonn’s real estate developments, email us at sales@cytonn.com;
- Phase 3 of The Alma is now ready for occupation and the show house is open daily. To join the waiting list to rent, please email properties@cytonn.com;
- For Third Party Real Estate Consultancy Services, email us at rdo@cytonn.com;
- For recent news about the group, see our news section here;
Hospitality Updates:
- We currently have promotions for Staycations. Visit cysuites.com/offers for details or email us at sales@cysuites.com;
Money Markets, T-Bills Primary Auction:
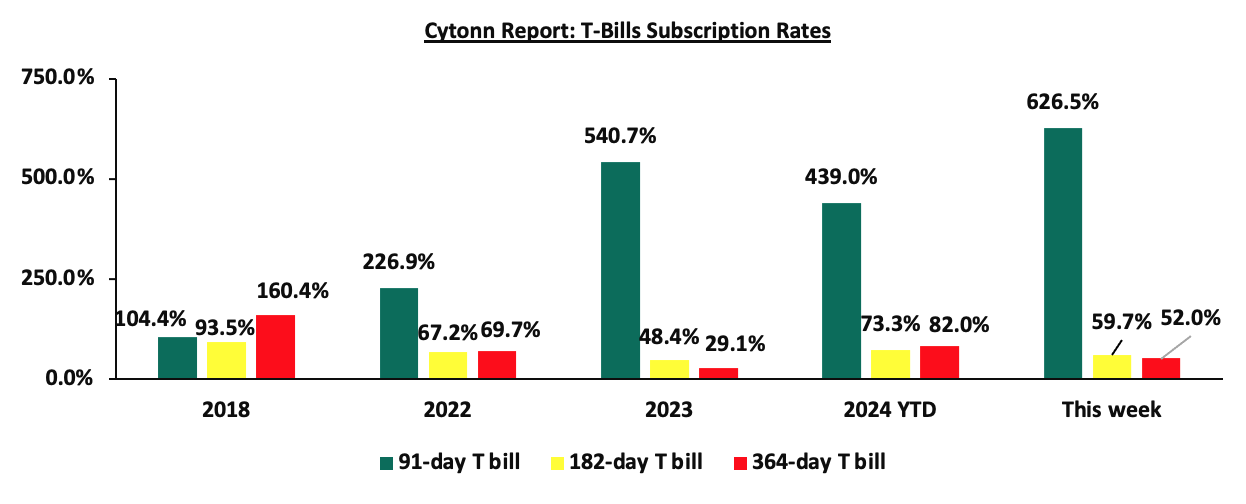
During the week, T-bills were oversubscribed for the sixth consecutive week, with the overall oversubscription rate coming in at 151.0%, higher than the oversubscription rate of 139.6% recorded the previous week. Investors’ preference for the shorter 91-day paper persisted, with the paper receiving bids worth Kshs 25.1 bn against the offered Kshs 4.0 bn, translating to an oversubscription rate of 626.5%, higher than the oversubscription rate of 446.6% recorded the previous week. The subscription rate for the 182-day and 364-day papers decreased to 59.7% and 52.0% respectively from 91.7% and 64.7% recorded the previous week. The government accepted a total of Kshs 34.1 bn worth of bids out of Kshs 36.2 bn bids received, translating to an acceptance rate of 94.3%. The yields on the government papers were on an upward trajectory, with the yields on the 91-day, 182-day, and 364-day papers increasing by 1.1 bps, 3.3 bps, and 2.5 bps to 15.97%, 16.64%, and 16.73% from 15.95%, 16.61% and 16.71% respectively recorded the previous week:
The chart below compares the overall average T-bill subscription rates obtained in 2018, 2022, 2023, and 2024 Year-to-date (YTD):
During the week, the Central Bank of Kenya released the auction results for the re-opened bond FXD1/2023/002 with a tenor to maturity of 1.2 years, and a fixed coupon rate of 17.0% and FXD1/2024/003 with a tenor to maturity of 2.6 years, and a fixed coupon rate of 18.4%. The bonds were oversubscribed with the overall subscription rate coming in at 109.5%, receiving bids worth Kshs 32.8 bn against the offered Kshs 30.0 bn. The government accepted bids worth Kshs 30.9 bn, translating to an acceptance rate of 94.0%. The weighted average yield of accepted bids for the FXD1/2023/002 and the FXD1/2024/003 came in at 17.1% and 17.6% respectively, which was slightly above our expectation of within a bidding range of 16.6% - 16.8% for the FXD1/2023/002 and 17.0% - 17.4% for the FXD1/2024/003. Notably, the FXD1/2023/002 registered an increase from the 17.0% registered in April when it was last re-opened. With the Inflation rate at 5.1% as of May 2024, the real return of the FXD1/2023/002 and the FXD1/2024/003 is 12.0% and 12.5% respectively.
Money Market Performance:
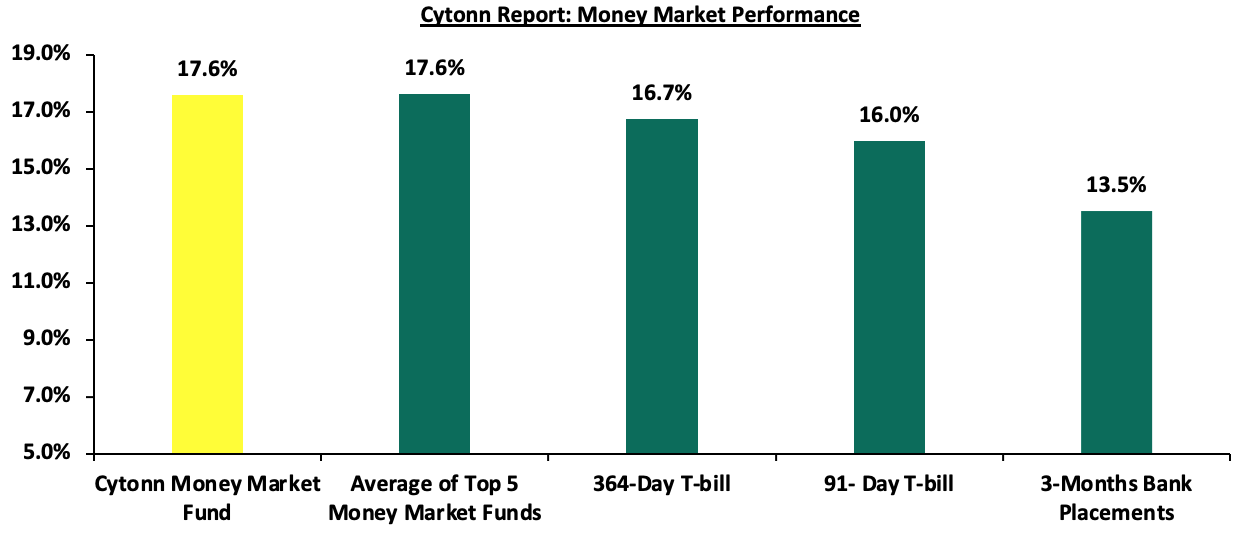
In the money markets, 3-month bank placements ended the week at 13.5% (based on what we have been offered by various banks), and the yields on the government papers were on an upward trajectory, with the yields on the government papers were on an upward trajectory, with the yields on the 91-day and 364-day papers increasing by 1.1 bps and 2.5 bps to 15.97% and 16.73% from 15.95% and 16.71% respectively recorded the previous week. The yields on the Cytonn Money Market Fund decreased by 8.0 bps to 17.6% from 17.7% recorded the previous week, while the average yields on the Top 5 Money Market Funds decreased by 7.8 bps to 17.6% from the 17.7% recorded the previous week.
The table below shows the Money Market Fund Yields for Kenyan Fund Managers as published on 7th June 2024:
|
Cytonn Report: Money Market Fund Yield for Fund Managers as published on 7th June 2024 |
||
|
Rank |
Fund Manager |
Effective Annual Rate |
|
1 |
Lofty-Corban Money Market Fund |
18.3% |
|
2 |
Etica Money Market Fund |
18.1% |
|
3 |
Cytonn Money Market Fund |
17.6% |
|
4 |
Kuza Money Market fund |
17.3% |
|
5 |
GenAfrica Money Market Fund |
16.8% |
|
6 |
Nabo Africa Money Market Fund |
16.8% |
|
7 |
Apollo Money Market Fund |
15.9% |
|
8 |
Enwealth Money Market Fund |
15.8% |
|
9 |
Co-op Money Market Fund |
15.7% |
|
10 |
KCB Money Market Fund |
15.6% |
|
11 |
Madison Money Market Fund |
15.6% |
|
12 |
GenCap Hela Imara Money Market Fund |
15.5% |
|
13 |
Jubilee Money Market Fund |
15.5% |
|
14 |
Mayfair Money Market Fund |
15.4% |
|
15 |
Sanlam Money Market Fund |
15.3% |
|
16 |
Mali Money Market Fund |
15.2% |
|
17 |
AA Kenya Shillings Fund |
15.1% |
|
18 |
Absa Shilling Money Market Fund |
14.9% |
|
19 |
Dry Associates Money Market Fund |
14.1% |
|
20 |
Orient Kasha Money Market Fund |
13.9% |
|
21 |
Equity Money Market Fund |
13.9% |
|
22 |
Old Mutual Money Market Fund |
13.5% |
|
23 |
CIC Money Market Fund |
13.2% |
|
24 |
ICEA Lion Money Market Fund |
12.3% |
|
25 |
British-American Money Market Fund |
10.0% |
Source: Business Daily
Liquidity:
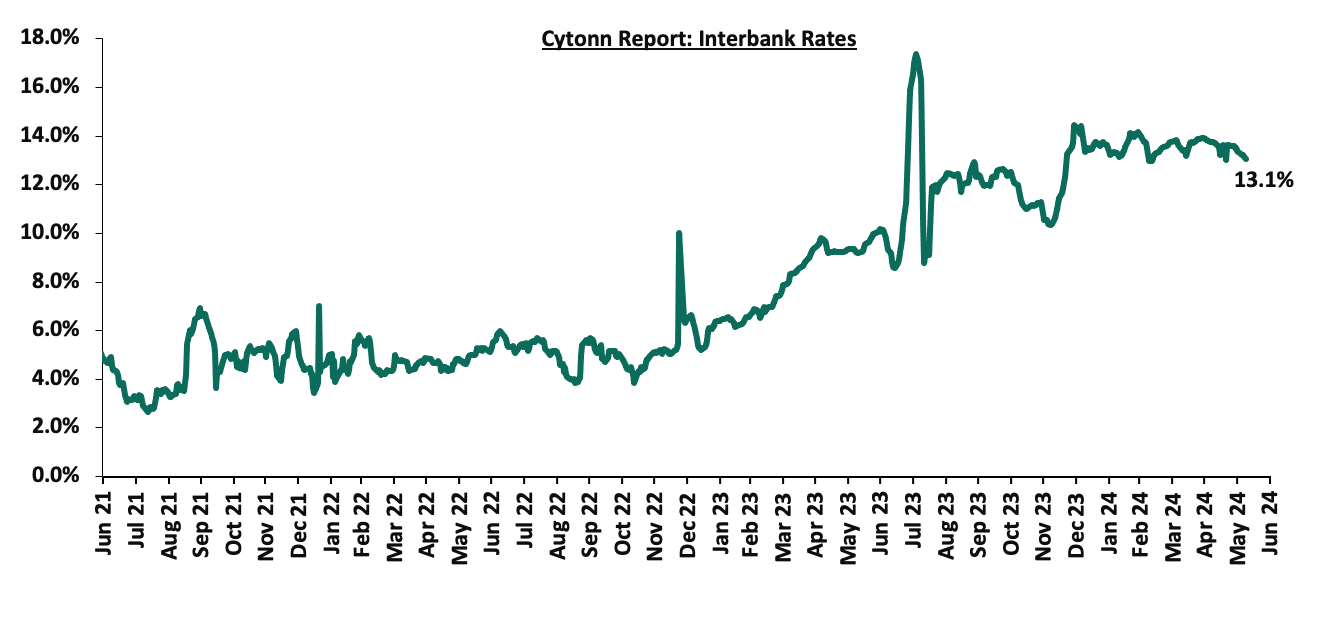
During the week, liquidity in the money markets eased, with the average interbank rate decreasing by 29.1 bps, to 13.2% from the 13.5% recorded the previous week, partly attributable to government payments that offset tax remittances. The average interbank volumes traded increased significantly by 72.8% to Kshs 30.1 bn from Kshs 17.4 bn recorded the previous week. The chart below shows the interbank rates in the market over the years:
 Private Sector Credit Growth:
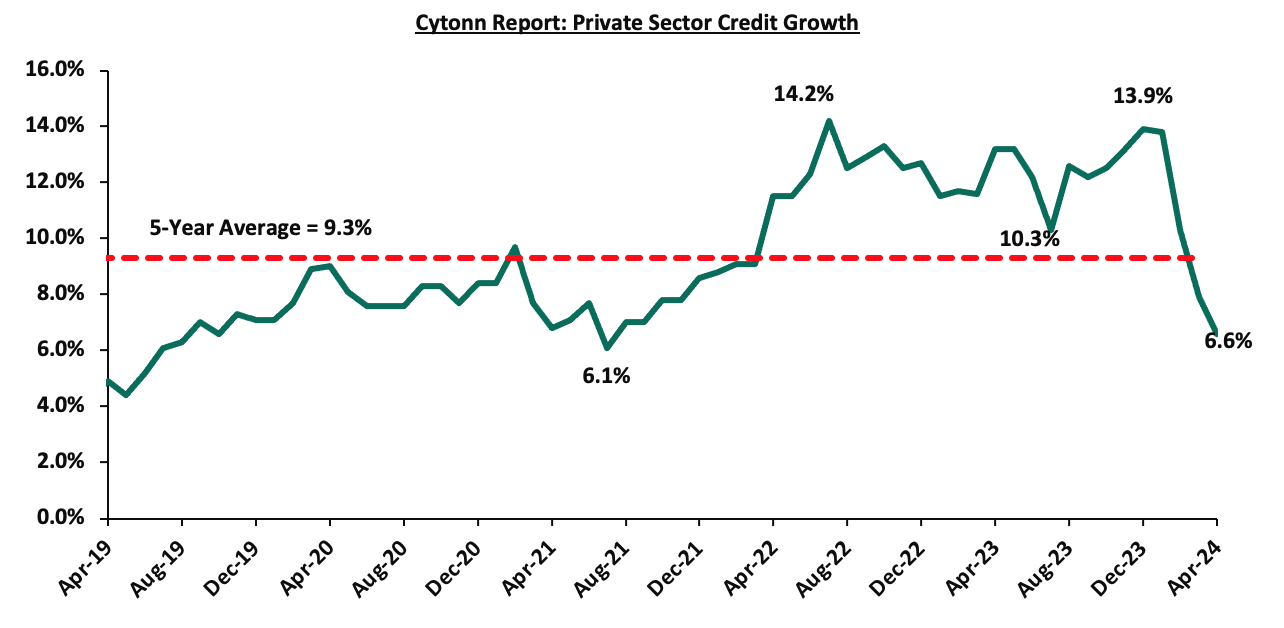
The Kenyan private sector credit growth declined to 6.6% in April from 7.9% recorded in March 2024. This is partly attributable to the impact of monetary policy tightening following the Monetary Policy Committee’s (MPC) to maintain the Central Bank Rate (CBR) at 13.0% in addition to the effect of exchange rate appreciation on foreign currency. Notably, the 6.6% growth rate recorded in April 2024 is the lowest recorded figure in 29 months and is 2.7% points below the 5-year average growth rate of 9.3%. The chart below shows the movement of the private sector credit growth:
Kenya Eurobonds:
During the week, the yields on Eurobonds were on a downward trajectory, with the yields on the 10-year Eurobond issued in 2018 decreasing the most by 28.6 bps to 9.1% from 9.3% recorded the previous week. The table below shows the summary of the performance of the Kenyan Eurobonds as of 6th June 2024;
|
Cytonn Report: Kenya Eurobonds Performance |
||||||
|
|
2018 |
2019 |
2021 |
2024 |
||
|
Tenor |
10-year issue |
30-year issue |
7-year issue |
12-year issue |
13-year issue |
7-year issue |
|
Amount Issued (USD) |
1.0 bn |
1.0 bn |
0.9 bn |
1.2 bn |
1.0 bn |
1.5 bn |
|
Years to Maturity |
3.8 |
23.8 |
3.0 |
8.0 |
10.1 |
6.8 |
|
Yields at Issue |
7.3% |
8.3% |
7.0% |
7.9% |
6.2% |
10.4% |
|
1-Jan-24 |
9.8% |
10.2% |
10.1% |
9.9% |
9.5% |
|
|
31-May-24 |
9.3% |
10.1% |
9.2% |
9.8% |
9.9% |
9.8% |
|
3-Jun-24 |
9.2% |
10.1% |
9.0% |
9.7% |
9.8% |
9.7% |
|
3-Jun-24 |
9.2% |
10.1% |
9.0% |
9.7% |
9.8% |
9.7% |
|
4-Jun-24 |
9.3% |
10.1% |
9.1% |
9.8% |
9.9% |
9.8% |
|
5-Jun-24 |
9.2% |
10.2% |
9.0% |
9.7% |
9.9% |
9.7% |
|
6-Jun-24 |
9.1% |
10.1% |
8.9% |
9.6% |
9.8% |
9.6% |
|
Weekly Change |
(0.3%) |
- |
(0.3%) |
(0.1%) |
(0.1%) |
(0.2%) |
|
MTD Change |
(0.2%) |
0.0% |
(0.1%) |
(0.1%) |
(0.0%) |
(0.1%) |
|
YTD Change |
(0.8%) |
(0.1%) |
(1.2%) |
(0.3%) |
0.3% |
- |
Source: Central Bank of Kenya (CBK) and National Treasury
Kenya Shilling:
During the week, the Kenya Shilling appreciated against the US Dollar by 0.1%, to close at Kshs 130.0, from Kshs 130.2 recorded the previous week. On a year-to-date basis, the shilling has appreciated by 17.2% against the dollar, a contrast to the 26.8% depreciation recorded in 2023.
We expect the shilling to be supported by:
- Diaspora remittances standing at a cumulative USD 4,457.5 mn in the 12 months to April 2024, 11.9% higher than the USD 3,984.9 mn recorded over the same period in 2023, which has continued to cushion the shilling against further depreciation. In the April 2024 diaspora remittances figures, North America remained the largest source of remittances to Kenya accounting for 54.0% in the period, and,
- The tourism inflow receipts which came in at USD 352.5 bn in 2023, a 31.5% increase from USD 268.1 bn inflow receipts recorded in 2022, and owing to tourist arrivals that improved by 27.6% to 182,000 in the 12 months to January 2024, from 151,000 recorded during a similar period in 2023.
The shilling is however expected to remain under pressure in 2024 as a result of:
- An ever-present current account deficit which came at 4.0% of GDP in FY’2023 from 5.1% recorded in FY’2022,
- The need for government debt servicing, continues to put pressure on forex reserves given that 67.3% of Kenya’s external debt was US Dollar denominated as of December 2023, and,
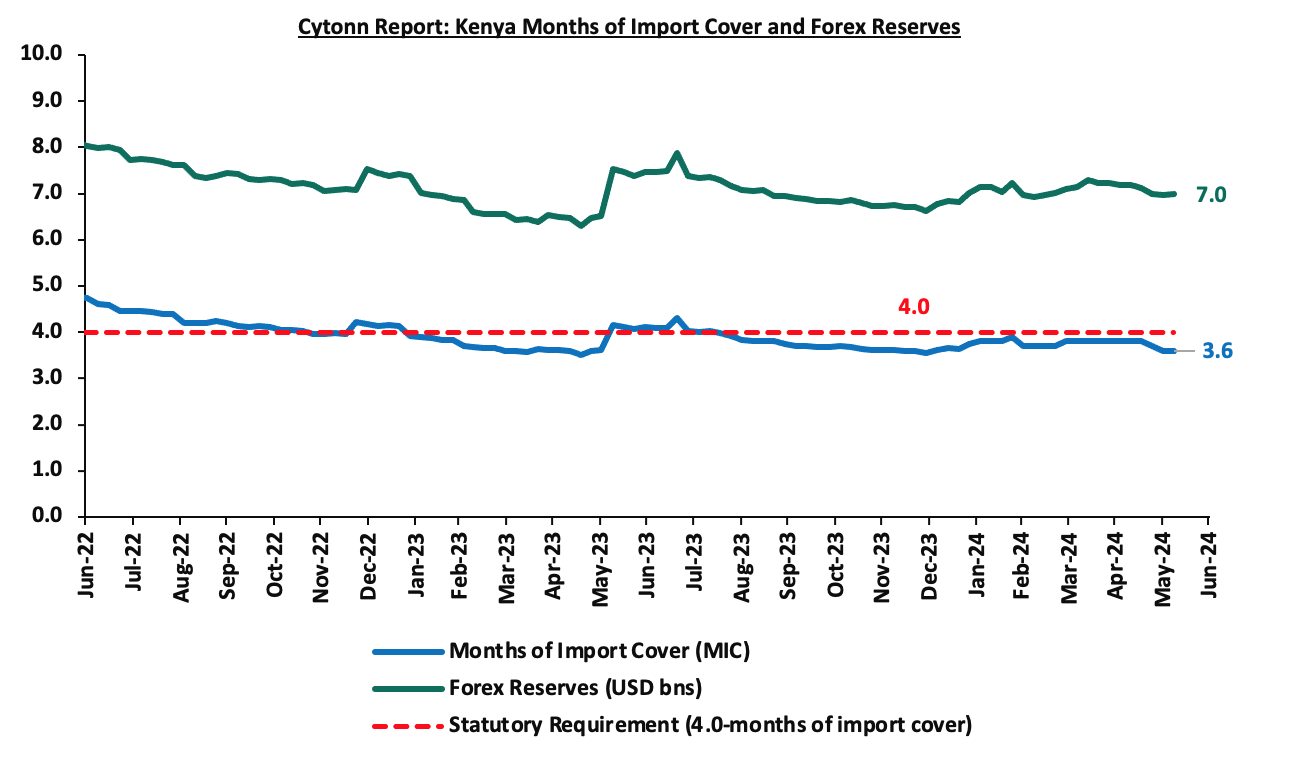
- Dwindling forex reserves, currently at USD 7.0 mn (equivalent to 3.6 months of import cover), which is below the statutory requirement of maintaining at least 4.0 months of import cover.
Key to note, Kenya’s forex reserves decreased by 0.1% during the week to remain relatively unchanged from the USD 7.0 bn recorded the previous week, equivalent to 3.6 months of import cover, same as was recorded the previous week, and remained below the statutory requirement of maintaining at least 4.0-months of import cover.
The chart below summarizes the evolution of Kenya's months of import cover over the years:
Weekly Highlights
- Monetary policy Committee (MPC) June Meeting
The monetary policy committee met on June 5, 2024, to review the outcome of its previous policy decisions against a backdrop of improved global outlook for growth, continued stickiness in inflation in advanced economies as well as the heightened geopolitical tensions. The MPC decided to maintain the CBR rate at 13.0%, which was in line with our expectation for the MPC to retain the CBR rate at 13.0%. Our expectation to maintain the rate at 13.0% was mainly on the back of retained high interest by major economies, the need to maintain the recent appreciation of the Shilling and stabilize it from volatility, a broadly unchanged inflation rate, coming in at 5.1% in May 2024 from 5.0% in April, remaining within the CBK preferred range of 2.5%-7.5% for the eleventh consecutive month, as well as the need to allow more time for the effects of the previous policy rate to transmit in the economy. Key to note, the MPC had maintained the CBR rate at 13.0% in the previous meeting in April 2024. Below are some of the key highlights from the June meeting:
- The overall inflation tightened marginally to 5.1% in May 2024, from 5.0% in April 2023, positioning it at the mid-point of the preferred CBK range of 2.5%-7.5%, mainly driven by the high fuel prices, despite the decrease in fuel inflation. Fuel inflation decreased to 7.8% in May 2024 from 8.3% in April 2024, largely attributable to a downward adjustment in pump prices and lower electricity tariffs. The food inflation increased to 6.2% in May 2024 from 5.6% in April 2024, attributable largely to higher prices of a few vegetables i.e. onions, kales tomatoes and Irish potatoes, following a decline in supply due to the recent heavy rains and floods in some parts of the country. The increase was however mitigated by a decrease in the prices of a few non-vegetable food items, particularly maize, sugar and wheat flour. The non-food non-fuel inflation slightly decreased to 3.4% in May 2024 from 3.6% in April 2024. We expect the overall inflation to remain within the CBK’s preferred range of 2.5%-7.5%, mainly on the back of a strengthened currency, tight monetary policy, reduced fuel prices and reduced electricity prices,
- The recently released Economic Survey 2024 for FY’2023 showed continued strong performance of the Kenyan economy, with real GDP growing by 5.6%, from a growth of 4.9% in 2022. This was attributable to a strong rebound in the agriculture sector due to favourable weather conditions that boosted crop and livestock production and resilient performance of the services sector. Leading indicators of economic activity pointed to continued strong performance in the first quarter of 2024. Despite the recent flooding in some parts of the country, the economy is expected to continue to strengthen in 2024, supported by resilient services sector, the rebound in agriculture, and implementation of measures to boost economic activity in priority sectors by the Government,
- Goods exports increased by 2.9% in the 12 months to April 2024, compared to a similar period in 2023, reflecting a rise in exports of agricultural commodities and re-exports. Receipts from tea and fruits and vegetables exports increased by 5.6% and 10.5% respectively, while re-exports grew by 38.1% in the period. Notably, exports increased 15.2% in the first four months of 2024 compared to the same period in 2023. Imports declined by 7.7% in the 12 months to April 2024 compared to a similar period in 2023, mainly reflecting lower imports across all categories except machinery and transport equipment. However, imports increased by 2.2% in the first four months of 2024 compared to the same period in 2023. Tourist arrivals improved by 27.2% in the 12 months to March 2024, compared to a similar period in 2023. Remittances totalled USD 4,457 million in the 12 months to April 2024 and were 11.9% higher compared to USD 3,985 million in a similar period in 2023. The current account deficit is estimated at 4.1% of GDP in the 12 months to April 2024, down from 4.8% of GDP in a similar period in 2023, and is projected at 4.0% of GDP in 2024, reflecting improvement in exports of agricultural products, sustained remittances, recovery in imports supported by stable exchange rate and effects of regional trade integration initiatives,
- The CBK foreign exchange reserves, which currently stand at USD 6,979 mn representing 3.6 months of import cover, continue to provide adequate cover and a buffer against any short-term shocks in the foreign exchange market,
- The banking sector remains stable and resilient, with strong liquidity and capital adequacy ratios. The ratio of gross non-performing loans (NPLs) to gross loans increased to 16.1% in April 2024 compared to 15.5% in February 2024. Increases in NPLs were noted in the agriculture, real estate, tourism, restaurant and hotels, trade and building and construction sectors. Banks have continued to make adequate provisions for the NPLs,
- The CEOs Survey and Market Perceptions Survey conducted ahead of the MPC meeting revealed a positive outlook on business activity for the next year. Participants of the survey expressed concerns about fiscal policies, high interest rates, and the impact of geopolitical uncertainties on the economy. Despite this, they remained optimistic that economic growth would remain resilient and improve in 2024, supported by increased agricultural production, a resilient service sector and a stable macroeconomic activity,
- The Survey of the Agriculture Sector revealed an expectation by respondents that the prices of key food items were expected to remain unchanged or increase in the next three months due to expected rise in food supply due to favourable weather conditions, stable exchange rate, and lower fuel prices,
- Global growth is expected to increase by 0.1% points to 3.2% in 2024 from 3.1% in 2023, attributable to a higher-than-expected growth in the United States and a high growth in several large and emerging markets, particularly India. Additionally, headline inflation rates have moderated, though some persistence remains in advanced economies. Food inflation has continued to decline due to an improved supply of key food items, particularly sugar and cereals. International oil prices have moderated because of a reduced risk premium from the Middle East conflict and increased supply from non-OPEC+ oil producers,
- Growth in private sector credit decreased to 6.6% in April 2024 from 7.9% in March 2024, mainly attributed to exchange rate valuation effects on foreign currency-denominated loans due to the appreciation of the Shilling. In April, local currency loans increased by 14.3%, while foreign currency loans, which make up around 26.0% of total loans, decreased by 14.2%. The chart below shows the movement of the private sector credit growth over the last five years:
- The Committee noted the ongoing implementation of the FY2023/24 Government Budget, as well as the proposed FY2024/25 Budget which are expected to continue to reinforce fiscal consolidation, and,
- The Committee observed that the new monetary policy implementation framework, adopted on August 9, 2023, has led to better functioning of the interbank market, reduced interest rate spreads with decreased market segmentation and improved monetary policy transmission. To further enhance the effectiveness of this framework, the MPC considered and approved a recommendation to narrow the width of the interest rate corridor around the CBR from the current 250 basis points (bps) to 150 bps. Additionally, the MPC approved a recommendation to adjust the applicable interest rate on the Discount Window from the current 400 bps above the CBR to 300 bps above the CBR.
The MPC noted that its previous measures have successfully reduced overall inflation to the mid-point of the target range of 2.5% - 7.5%, stabilized the exchange rate, and anchored inflationary expectations. The Committee also observed that NFNF inflation has remained persistent in recent months and that interest rates in major economies are expected to stay higher for longer due to persistent inflation. The MPC concluded that the current monetary policy stance will maintain overall inflation around the mid-point of the target range in the short term while ensuring continued exchange rate stability. The MPC will closely monitor the impact of its policy measures, as well as developments in the global and domestic economy, and stands ready to take further action as necessary in line with its mandate. The Committee will meet again in August 2024.
- Stanbic Bank’s May 2024 Purchasing Managers Index
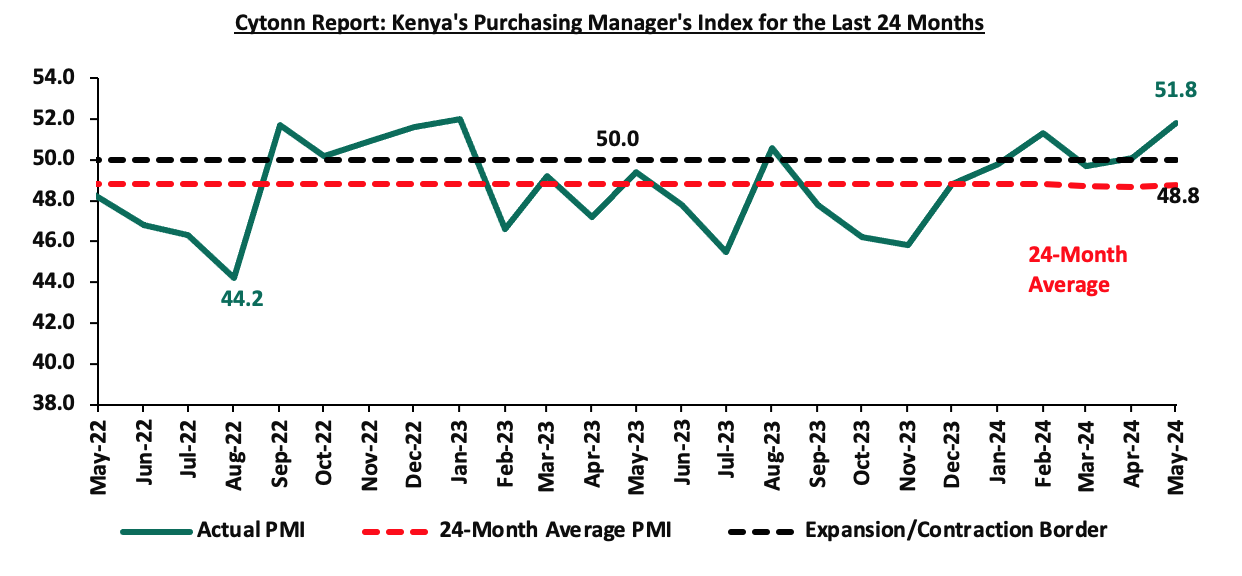
During the week, Stanbic Bank released its monthly Purchasing Manager's Index (PMI) highlighting that the index for the month of May 2024 improved slightly, coming in at 51.8, above the 50.0 neutral, up from 50.1 in April 2024, signaling a modest improvement in operating conditions across Kenya. Private sector conditions strengthened during the month of May 2024, reflecting a further improvement in economic activity. On a year-to-year basis, the index recorded a 4.9% improvement from the 49.4 recorded in May 2023. The modest improvement of the general business environment is mainly attributable to inflation remaining broadly unchanged in May 2024 and the service sector experiencing improved business conditions, with inflation coming in at 5.1%, from 5.0% in April 2024, fractionally above CBK’s preferred target of 5.0%, and remaining within the Central Bank of Kenya (CBK) target range of 2.5% to 7.5% for the eleventh consecutive month, and a decrease of 0.7% points from 5.7% in March 2024. Notably, the prices for Super Petrol, Diesel, and Kerosene decreased by Kshs 1.0, Kshs 1.2, and Kshs 1.3 each respectively from the April 2024 prices, to retail at Kshs 192.8, Kshs 179.2 and Kshs 168.7 per litre respectively
The average input charges fell for the second time since June 2020, attributable to the lower fuel prices and decrease in import costs amid the continued appreciation of the Shilling against the dollar. Meanwhile, output prices rose, just marginally. The sector data showed an increase in output, for the first time since February, with expansions recorded in the services, manufacturing, and wholesale & retail segments. Agriculture and construction sectors, however, posted declines in output attributable to the impact of the heavy rains and floods experienced in the country. With cost pressures easing and the downturn in sales softening, purchasing activity at Kenyan firms increased in May, reflecting stronger consumer spending, helping businesses to raise their inventories and improving their buffers for the fourth consecutive month. Similarly, the employment levels improved for the fifth consecutive month in May, with a rise in staff costs, increased inventories and prospects of new business driven by an uptick in customer demand.
Private sector prices increased marginally in May after dipping for the first time in over three years in April. Efforts to boost margins led to price increases, but enterprises often passed on cost savings to customers. Notably, overall sentiment towards future activity of the Kenyan business environment remained positive, despite the degree of confidence falling from the 13-month high level reached in April 2024. The outlook reflected anticipated investment in marketing, capacity enhancements, and new branches. Key to note, a PMI reading of above 50.0 indicates an improvement in the business conditions, while readings below 50.0 indicate a deterioration. The chart below summarizes the evolution of PMI over the last 24 months:
Going forward, we expect the business climate to be restrained in the short to medium term as a result of the difficult economic environment caused by high interest rates from tightening monetary policy, increasing taxes, and an overall rise in the cost of living. However, we expect firms to benefit from reduced inflationary pressures and an appreciating Shilling, which will lower input prices.
Rates in the Fixed Income market have been on an upward trend given the continued high demand for cash by the government and the occasional liquidity tightness in the money market. The government is 36.1% ahead of its prorated net domestic borrowing target of Kshs 385.8 bn, and 29.0% ahead of the total domestic net borrowing target of Kshs 407.0 bn for FY’2023/2024, having a net borrowing position of Kshs 525.2 bn. However, we expect a downward readjustment of the yield curve in the short and medium term, with the government looking to increase its external borrowing to maintain the fiscal surplus, hence alleviating pressure in the domestic market. As such, we expect the yield curve to normalize in the medium to long-term and hence investors are expected to shift towards the long-term papers to lock in the high returns.
Market Performance:
During the week, the equities market was on an upward trajectory, with NSE 20 gaining the most by 2.3% while NASI, NSE 25, and NSE 10 gained by 1.4%, 0.8%, and 0.03% respectively taking the YTD performance to gains of 28.5%, 25.0%, 24.6%, and 16.8% for NSE 10, NSE 25, NASI, and NSE 20 respectively. The equities market performance was driven by gains recorded by large-cap stocks such as Stanbic, DTB-K, and KCB Group of 7.9%, 3.1%, and 2.5% respectively. The performance was, however, weighed down by losses recorded by large-cap stocks such as EABL, BAT, and NCBA of 7.4%, 1.1, and 0.2% respectively.
During the week, equities turnover significantly decreased by 84.4% to USD 13.8 mn from USD 88.3 mn recorded the previous week, taking the YTD total turnover to USD 321.6 mn. Foreign investors remained net buyers for the third consecutive week with a net buying position of USD 1.5 mn, from a net buying position of USD 6.6 mn recorded the previous week, taking the YTD foreign net buying position to USD 4.5 mn.
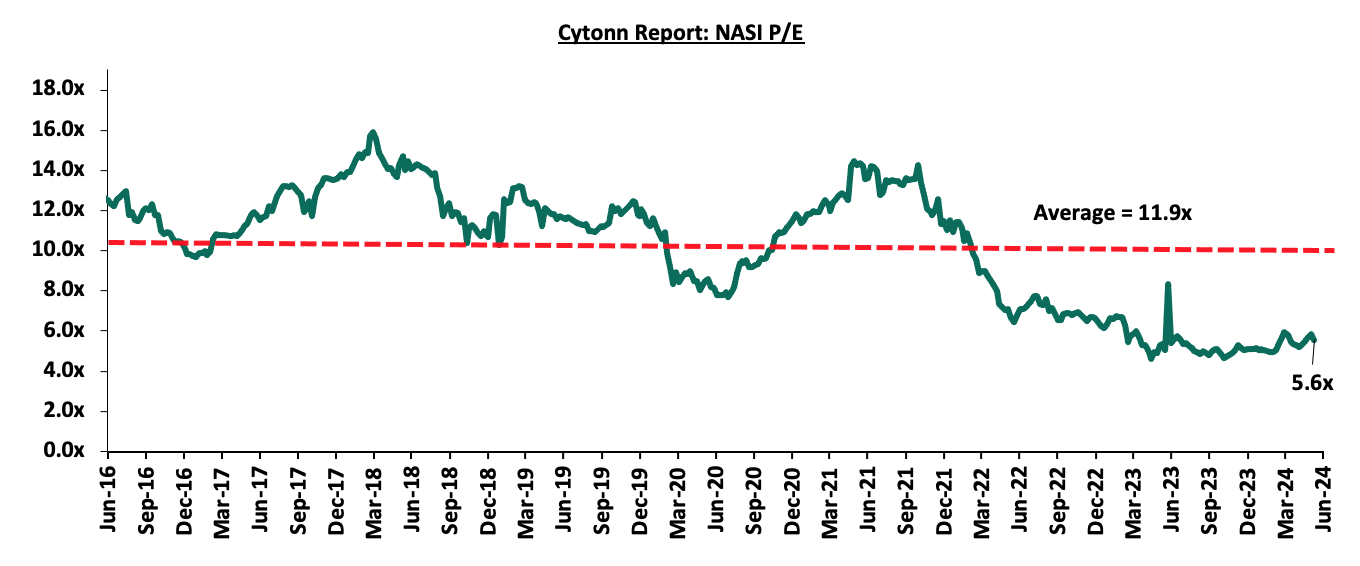
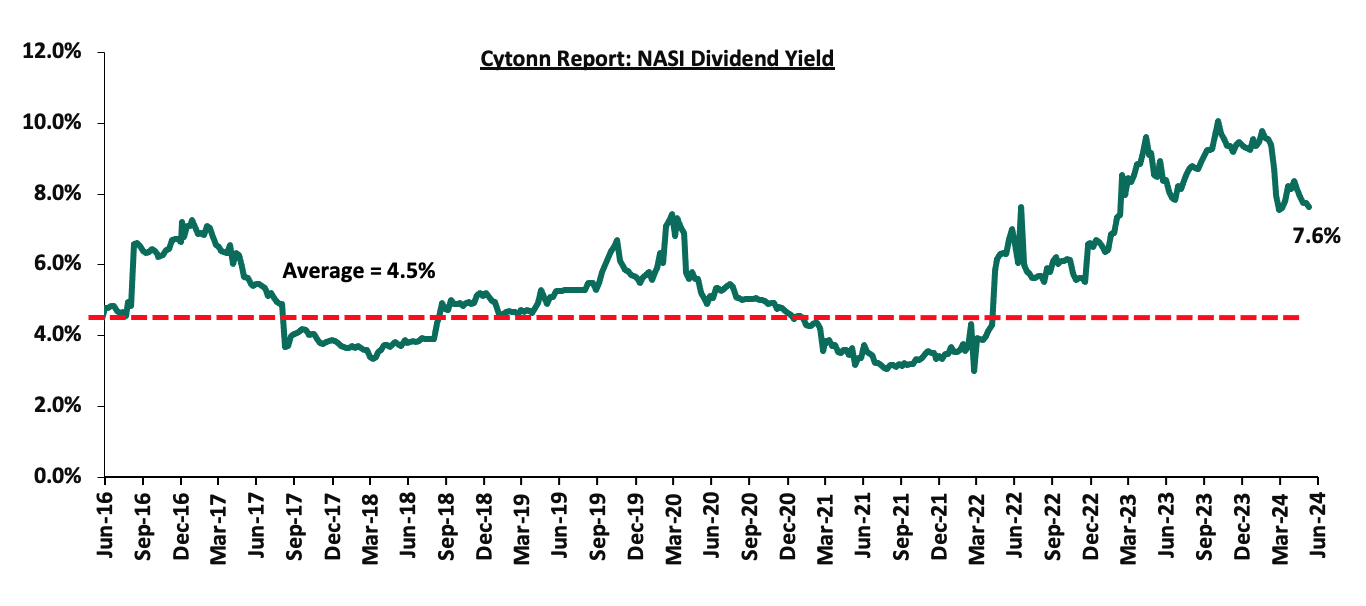
The market is currently trading at a price-to-earnings ratio (P/E) of 5.6x, 53.2% below the historical average of 11.9x. The dividend yield stands at 7.6%, 3.1% points above the historical average of 4.5%. Key to note, NASI’s PEG ratio currently stands at 0.7x, an indication that the market is undervalued relative to its future growth. A PEG ratio greater than 1.0x indicates the market is overvalued while a PEG ratio less than 1.0x indicates that the market is undervalued. The charts below indicate the historical P/E and dividend yields of the market;
 Universe of Coverage:
|
Cytonn Report: Equities Universe of Coverage |
||||||||||
|
Company |
Price as at 31/05/2024 |
Price as at 07/06/2024 |
w/w change |
YTD Change |
Year Open 2024 |
Target Price* |
Dividend Yield |
Upside/ Downside** |
P/TBv Multiple |
Recommendation |
|
Sanlam |
6.3 |
5.8 |
(6.7%) |
(2.7%) |
6.0 |
8.8 |
0.0% |
50.9% |
1.6x |
Buy |
|
Jubilee Holdings |
189.0 |
184.5 |
(2.4%) |
(0.3%) |
185.0 |
260.7 |
7.8% |
49.0% |
0.3x |
Buy |
|
Diamond Trust Bank*** |
45.9 |
47.3 |
3.1% |
5.7% |
44.8 |
65.2 |
10.6% |
48.4% |
0.2x |
Buy |
|
Equity Group*** |
43.5 |
43.7 |
0.5% |
27.8% |
34.2 |
60.2 |
9.2% |
46.9% |
0.9x |
Buy |
|
NCBA*** |
42.0 |
41.9 |
(0.2%) |
7.9% |
38.9 |
55.2 |
11.3% |
43.1% |
0.8x |
Buy |
|
Standard Chartered*** |
186.5 |
189.0 |
1.3% |
17.9% |
160.3 |
233.1 |
15.3% |
38.7% |
1.3x |
Buy |
|
ABSA Bank*** |
13.8 |
13.8 |
0.0% |
19.0% |
11.6 |
17.3 |
11.3% |
37.1% |
1.1x |
Buy |
|
Co-op Bank*** |
13.5 |
13.8 |
2.2% |
21.6% |
11.4 |
17.2 |
10.9% |
35.5% |
0.6x |
Buy |
|
Stanbic Holdings |
110.3 |
119.0 |
7.9% |
12.3% |
106.0 |
145.3 |
12.9% |
35.0% |
0.8x |
Buy |
|
CIC Group |
2.2 |
2.2 |
(1.3%) |
(3.5%) |
2.3 |
2.8 |
5.9% |
32.6% |
0.7x |
Buy |
|
I&M Group*** |
20.3 |
21.5 |
6.2% |
23.2% |
17.5 |
25.5 |
11.9% |
30.5% |
0.4x |
Buy |
|
KCB Group*** |
35.6 |
36.5 |
2.5% |
66.1% |
22.0 |
46.7 |
0.0% |
28.0% |
0.6x |
Buy |
|
Kenya Reinsurance |
2.4 |
2.6 |
9.2% |
41.1% |
1.9 |
3.0 |
11.5% |
26.4% |
0.2x |
Buy |
|
Britam |
5.7 |
6.0 |
4.2% |
16.0% |
5.1 |
7.0 |
0.0% |
17.4% |
0.8x |
Accumulate |
|
Liberty Holdings |
5.8 |
5.8 |
0.0% |
50.3% |
3.9 |
6.1 |
6.4% |
11.6% |
0.4x |
Accumulate |
|
HF Group |
4.4 |
4.5 |
3.0% |
31.0% |
3.5 |
5.0 |
0.0% |
10.6% |
0.2x |
Accumulate |
|
Target Price as per Cytonn Analyst estimates **Upside/ (Downside) is adjusted for Dividend Yield ***For Disclosure, these are stocks in which Cytonn and/or its affiliates are invested in |
||||||||||
We are “Neutral” on the Equities markets in the short term due to the current tough operating environment and huge foreign investor outflows, and, “Bullish” in the long term due to current cheap valuations and expected global and local economic recovery. With the market currently being undervalued for its future growth (PEG Ratio at 0.7x), we believe that investors should reposition towards value stocks with strong earnings growth and that are trading at discounts to their intrinsic value. We expect the current high foreign investors’ sell-offs to continue weighing down the equities outlook in the short term.
On the Unquoted Securities Platform, Acorn D-REIT and I-REIT traded at Kshs 24.5 and Kshs 22.0 per unit, respectively, as of 7th June 2024. The performance represented a 22.5% and 10.0% gain for the D-REIT and I-REIT, respectively, from the Kshs 20.0 inception price. The volumes traded for the D-REIT and I-REIT came in at 12.3 mn and 30.7 mn shares, respectively, since inception in February 2021.
In Kenya, REITs provide various benefits like tax exemptions, a diversified pool of investment portfolios from commercial office to residential properties, and stable long-term profits. However, the continuous deterioration in the performance of Kenyan REITs and the restructuring of their business portfolios is hampering major investments that had previously been made. The challenges impeding REIT performance include: i) limited knowledge of the investment instrument among investors, ii) prolonged approval processes for REIT creation, iii) high minimum capital requirements of Ksh 100.0 mn for trustees, and iv) minimum investment amounts set at Ksh 5.0 mn.
We expect the real estate sector in Kenya to remain resilient, supported by several key factors. These include activities from private players and the government, as seen under the Affordable Housing Programme (AHP); recovery of the hospitality sector, supported by an increasing number of international arrivals; the launch of various infrastructural developments across the country; increased investment by local and international players in the retail sector; and relatively high demographics. However, despite these positive indicators, we anticipate that rising construction costs, challenging macroeconomic conditions, and limited investor knowledge regarding Real Estate Investment Trusts (REITs) could constrain growth in the sector.
Following the release of the FY’2023 results by all four authorized Real Estate Investment Trusts (REITs) in Kenya, the Cytonn Real Estate Research Team undertook an analysis of the financial performance of the REITs and identified the key factors that shaped the performance of the sector. For the earnings notes of the various REITs, click the links below:
- ILAM Fahari I-REIT FY’2023 Earnings Note
- LapTrust Imara I-REIT FY’2023 Earnings Note
- Acorn I-REIT and D-REIT FY’2023 Earnings Note
The report is themed “Strategies for Advancing Kenya's REIT Market,” where we discuss the background and structure of REITs in Kenya, and assess the financial performance of the current REITs in the market during FY’2023 in terms of operational metrics, profitability metrics, leverage ratios, liquidity ratios, and valuation metrics. In addition, we highlight the outlook regarding our expectations for the REITs sector going forward. This we will cover as follows;
- Overview of the REITs Sector in Kenya,
- Themes that shaped the Real Estate Sector in FY’2023,
- Summary Performance of the REITS in FY’2023, and,
- Conclusion and Outlook for the REITs sector.
Section I: Overview of the REITs Sector in Kenya
Kenya's Real Estate sector has played a vital role in the nation's GDP, growing at a Compound Annual Growth Rate (CAGR) of 5.5% over the past five years. In Q3’2023, the sector expanded by 5.4%, reaching Kshs 785.9 bn, up from Kshs 743.4 bn in the same period of 2022. This growth underscores the sector's increasing significance, with its contribution to the national GDP rising to 10.5% from 10.0% in the previous quarter. Several factors have driven this growth, including: i) the government's sustained focus on affordable housing, ii) aggressive expansion strategies by local and international retailers, iii) rapid population and urbanization growth, iv) the reopening and expansion of the hospitality sector amid economic recovery, v) increased investor confidence, vi) the Kenya Mortgage Refinance Company's (KMRC) ongoing efforts to boost homeownership through long-term, low-interest home loans, vii) a growing demand for Mixed-Use Developments (MUDs) due to their convenience, and, viii) continuous infrastructure improvements across the country creating new investment opportunities.
Despite the aforementioned cushioning factors, several challenges hinder the optimal performance of the Real Estate sector. These challenges include rising construction costs, an existing oversupply of physical space in certain sectors, and difficulties in accessing financing due to elevated credit risk and increasing interest rates. Supporting this, gross Non-Performing Loans (NPLs) in the Real Estate sector surged by 26.7%, reaching Kshs 101.7 mn from Kshs 80.3 mn in Q4’2022. To mitigate this funding shortfall, stakeholders in the Real Estate sector have been actively seeking alternative financing options, such as Real Estate Investment Trusts (REITs). The Capital Markets Authority (CMA) established a comprehensive framework and regulations for REITs in 2013, allowing developers to raise capital through this mechanism.
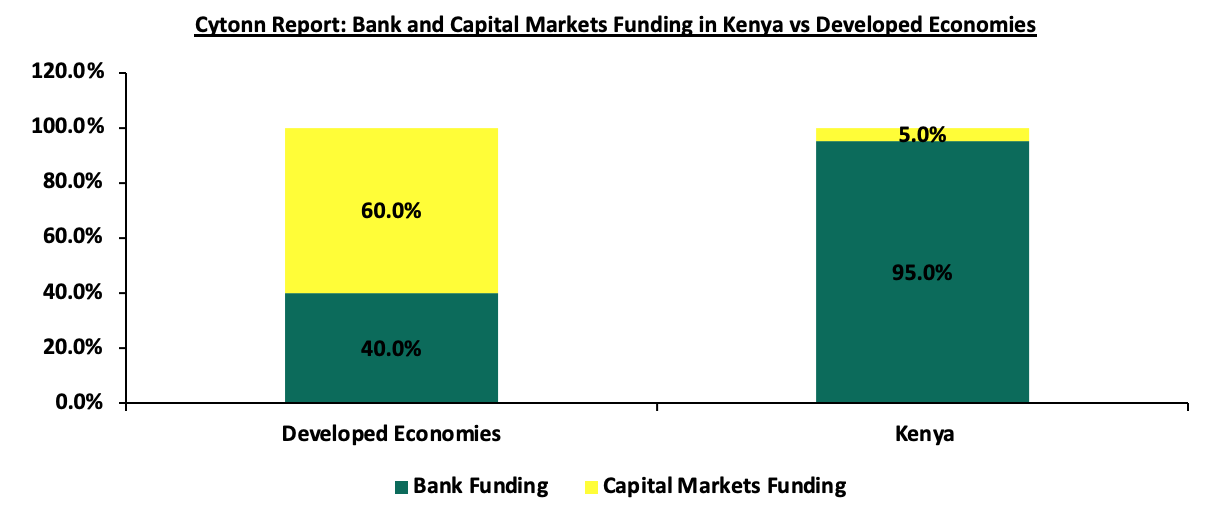
The growth of Kenya's Real Estate sector is driven by ongoing construction activities fueled by significant demand for real estate developments. The residential market faces an 80.0% housing deficit, with only 50,000 units supplied annually against a demand for 200,000 units per year. Additionally, the formal retail market remains in its early stages, with a penetration rate of about 30.0%, according to the Nielsen Report 2018. Despite the high demand in the Real Estate market, developers face limited funding options. Kenyan banks are the primary funding source for real estate development, providing nearly 95.0% of construction financing compared to 40.0% in developed countries. The graph below illustrates the comparison of construction financing in Kenya versus developed economies;
Source: World Bank, Capital Markets Authority (CMA)
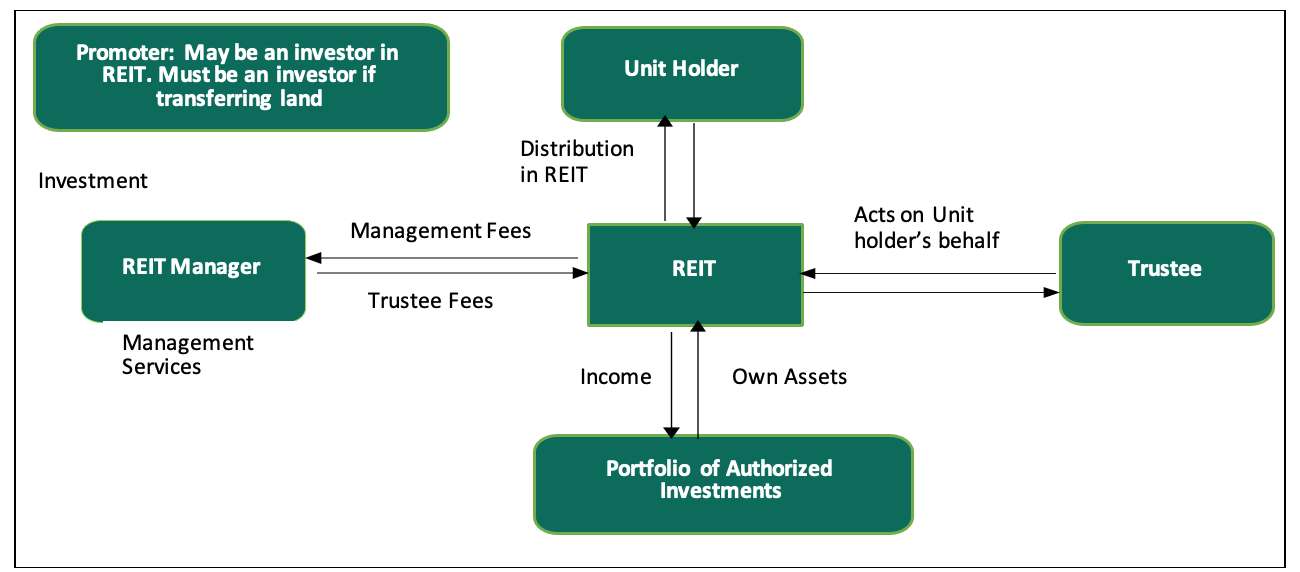
As a result, alternative financing solutions for developers are necessary to address this funding gap. In 2013, the Capital Markets Authority (CMA) established a framework for the operationalization of Real Estate Investment Trusts (REITs) in Kenya. REITs are regulated collective investment vehicles that allow the pooling of money in exchange for acquiring rights or interests in a trust, which is divided into units. The goal is for investors to earn profits or income from real estate as beneficiaries of the trust. To protect the interests of a REIT and promote transparency and accountability, four key entities are integral to the REIT structure in Kenya. These entities are as follows:
- The Promoter: This party is involved in setting up a REIT scheme. The promoter is regarded as the initial issuer of REIT securities and is involved in making submissions to the regulatory authorities to seek relevant approvals of a draft trust deed, draft prospectus, or an offering memorandum. Some of the REIT promoters in Kenya include Acorn Holdings Limited and LAP Trust,
- The REIT Manager: This is a company that has been incorporated in Kenya and has been issued a license by the authority (CMA) to provide Real Estate and fund management services for a REIT scheme on behalf of investors. Currently, there are 10 REIT Managers in Kenya namely; Cytonn Asset Managers Limited (CAML), Acorn Investment Management, Stanlib Kenya Limited, Nabo Capital, ICEA Lion Asset Managers Limited, Fusion Investment Management Limited, H.F Development and Investment Limited, Sterling REIT Asset Management, Britam Asset Managers Limited, and CIC Asset Management Limited,
- The Trustee: This is a corporation or a company that has been appointed under a trust deed and is licensed by the authority (CMA) to hold the Real Estate assets on behalf of investors. The Trustee’s main role is to act on behalf of the investors in the REIT, by assessing the feasibility of the investment proposal put forward by the REIT Manager and ensuring that the assets of the scheme are invested in accordance with the Trust Deed. REIT trustees in Kenya include; Kenya Commercial Bank (KCB), Co-operative Bank (Coop), Housing Finance Bank and NCBA Bank Kenya, and,
- Project/Property Manager: The role of the project manager is to oversee the planning and delivery of the construction projects in the REITs. The property manager on the other hand plays the role of managing the completed Real Estate development that has been acquired by a REIT with his main goal being profit generation.
The relationship between key parties in a typical REIT structure is depicted in the figure below;
Source: Capital Markets Authority (CMA)
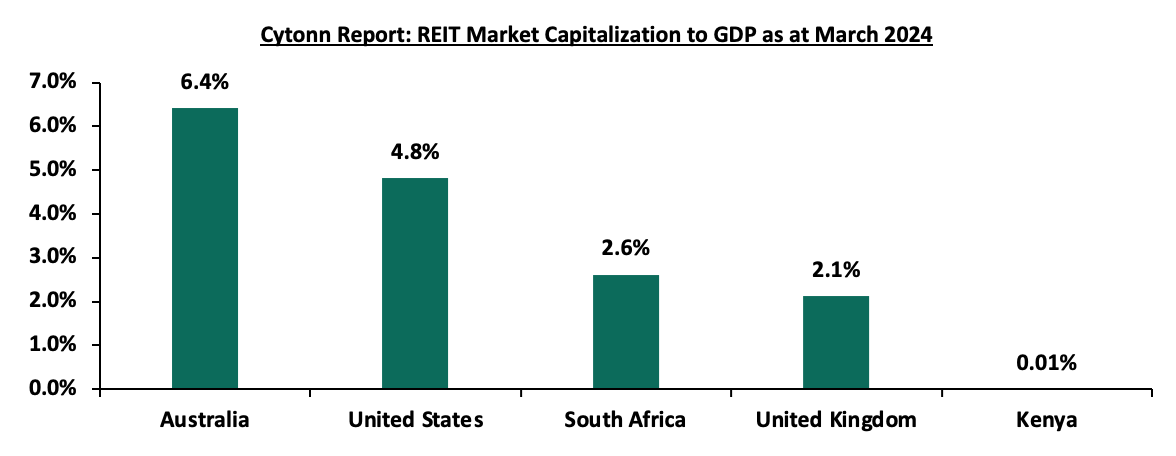
Since its inception in 2013, the Kenyan REIT market has remained subdued due to several challenges. These include the substantial capital requirement of Kshs 100.0 mn for trustees, which restricts this role primarily to banks, a lengthy approval process for REIT creation, high minimum investment amounts set at Kshs 5.0 mn that deter investors, and insufficient investor awareness and understanding of this financial asset class. Notably, REIT market capitalization in Kenya remains significantly lower compared to other jurisdictions as shown below;
Source: European Public Real Estate Association (EPRA), World Bank
The REITs challenge is further compounded by Kenya’s underdeveloped capital markets as compared to other African countries such as South Africa. Currently, there exists only one listed REIT in the country, albeit one that is not actively trading. The above indicates a sector that has remained moribund since REIT regulations were put in place in 2013. Due to this, most property developers rely on conventional sources of funding such as banks, compared to other developed countries. Following the establishment of REIT regulations in 2013, four REITs were approved in the Kenyan market, all designed as closed-ended funds with a fixed number of shares. Currently, none of these REITs are actively trading on the Main Investments Market Segment of the Nairobi Securities Exchange (NSE). After the recent delisting of ILAM Fahari I-REIT, LAPTrust Imara I-REIT is the only listed REIT in the country, quoted on the restricted market sub-segment of the Main Investment Market of the NSE. However, it is important to note that Imara did not raise funds upon listing. Acorn I-REIT and D-REIT are not listed but trade on the Unquoted Securities Platform (USP), an over-the-counter market segment of the NSE. The table below highlights all the REITs authorized by the Capital Markets Authority (CMA) in Kenya;
|
Cytonn Report: Authorized REITs in Kenya |
||||||
|
# |
Issuer |
Name |
Type of REIT |
Listing Date |
Market Segment |
Status |
|
1 |
ICEA Lion Asset Management (ILAM) |
Fahari |
I-REIT |
October 2015 |
Main Investment Market |
Delisted on 12th February 2024 |
|
2 |
Acorn Holdings Limited |
Acorn Student Accommodation (ASA) – Acorn ASA |
I-REIT |
February 2021 |
Unquoted Securities Platform (USP) |
Trading |
|
3 |
Acorn Holdings Limited |
Acorn Student Accommodation (ASA) – Acorn ASA |
D-REIT |
February 2021 |
Unquoted Securities Platform (USP) |
Trading |
|
4 |
Local Authorities Pension Trust (LAPTrust) |
Imara |
I-REIT |
March 2023 |
Main Investment Market: Restricted Sub-segment |
Restricted |
Source: Nairobi Securities Exchange, CMA
Section II: Themes that Shaped the REIT Sector in FY’2023
In this section, we delve into the pivotal themes that have profoundly influenced the REITs sector to the period FY’2023. Exploring the dynamic landscape, we analyze the impact of regulations, acquisitions, and capital raising activities on the trajectory of the REIT industry as we gain insights into the broader factors impacting the performance and direction of the REIT sector during this period.
- Regulations
REITs are formally established in accordance with regulations set forth for Real Estate Investment Trusts (REITs) and granted approval by the Capital Markets Authority (CMA) under the Capital Markets Real Estate Investment Trusts Collective Investment Schemes Regulations of 2013. Instead of taking the form of conventional companies, they are structured as trusts. The management of investment properties falls under the purview of a corporate REIT manager, licensed by the CMA. Units of listed REITs are traded on the Nairobi Securities Exchange (NSE), akin to shares of any other company listed on both the Main Market Segment and the Unquoted Security Platform (USP), providing investors with a liquid stake in Real Estate. Both individual and corporate investors have the opportunity to partake in a public offering on the NSE, as outlined in the Regulations of 2013.
Furthermore, the regulations stipulate that Kenyan REITs are mandated to distribute a minimum of 80.0% of distributable earnings to their unitholders. REITs automatically qualify for several tax exemptions such as the Income Tax Act (ITA), Value Added Tax (VAT), and Capital Gains Tax (CGT) under the authorization of the Kenya Revenue Authority (KRA). Some of the recent regulatory transformations in the REITs industry include;
- Exemption from Income Tax Act
Section 20 (1) (c) and (d) of the Income Tax Act (ITA) stipulates that upon registration with the Commissioner of Kenya Revenue Authority (KRA), both REITs and the companies they invest in are exempt from the standard 30.0% Income Tax Rate (ITR). Additionally, any income distributed by REITs to their investors (unitholders) is not subject to taxation. However, it is important to note that this tax exemption does not extend to the withholding tax imposed on interest income and dividends received by unitholders who are not exempted as per the first schedule of the ITA. The rates for this withholding tax can be found in paragraph 5 of the third schedule of the Income Tax Act.
- Capital Gains Tax (CGT) exemptions
A capital gain arises when the value of a unit upon transfer exceeds its adjusted cost. The disparity between these values is liable to a tax rate of 15.0%. Consequently, any profits made by a promoter or investors of a REIT from transferring property into the REIT are now subject to Capital Gains Tax (CGT) at the revised rate of 15.0%, supplanting the previous rate of 5.0% effective from 1 January 2023. Additionally, individuals holding units in a REIT who opt to sell their ownership stake are also required to remit CGT. This stipulation emerged following an amendment to Section 34 (1) (j) of the Income Tax Act through the Finance Act 2022.
However, within the REIT industry, there are certain scenarios that qualify for exemptions from CGT:
- Transfers of property from life insurance companies to a REIT are exempt from CGT, as outlined in Section 19 (6B) of the Income Tax Act (ITA),
- Indirect transfer of property into a REIT when the promoter first transfers properties to a Special Purpose Vehicle (SPV). Subsequently, the shares of the investee company held by the SPV are transferred to the REIT. This is considered a restructuring, as the property transfer does not involve a third party. This exemption is based on Paragraph 13 of the Eighth Schedule to the ITA. However, CGT is applicable on gains made during the transfer of shares from the investee company to the REIT Trustee,
- Payments received by unit holders or shareholders in a REIT for unit redemption or share sale are exempt from CGT in accordance with section 20 (2) of the ITA,
- Gains realized by the REIT from the sale of properties, whether directly or through an SPV, are also exempt from CGT.
- Exemption from Value Added Tax (VAT)
The Finance Act 2021 reinstated a significant alteration concerning the exemption from Value Added Tax (VAT) for transactions involving the transfer of assets to REITs and asset-backed securities. This exemption had previously been rescinded by the Tax Laws Amendment Act No. 2 of 2020. In line with Paragraph 33 of Part II of the First Schedule to the VAT Act 2021, a direct transfer of property from the REIT promoter or investors is not subject to VAT. However, if the transfer of assets to the REIT occurs indirectly, through the initial transfer of assets to the investee company, VAT will apply. It is noteworthy that the transfer of shares from a REITs SPV to the REIT trustee will be exempt from VAT, regardless of whether the initial asset transfer involved VAT.
- Adjustment in Stamp Duty
In accordance with the regulations outlined in section 96A of the Stamp Duty Act, when properties within a Development REIT (D-REIT) reach completion and commence generating stable income, any subsequent transfer of these stabilized properties from the D-REIT to the Income REIT (I-REIT) is exempt from stamp duty. However, it is crucial to note that this exemption was only applicable to transactions completed before 31 December 2022. Therefore, starting from 1 January 2023, any transfers are subject to stamp duty as per section 96A subsection 4 of the act.
The intricate nature of these regulations within the REITs, coupled with the complex rules governing REITs, presents challenges for individuals to navigate and fully comprehend. Consequently, potential investors and stakeholders may feel uncertain about the tax implications of their actions within the REIT framework. This uncertainty can foster skepticism about the fairness and reliability of the investment environment, potentially dissuading them from capitalizing on lucrative opportunities.
Furthermore, the lack of sufficient information available to the public about these REIT regulations exacerbates the problem. When individuals are not adequately informed about the tax consequences of their investment decisions, they may avoid making investments altogether or may not make informed choices, which could impact their financial gains.
Looking ahead, we anticipate that both the government and stakeholders in the REITs sector will address these regulatory concerns and promote enhanced transparency and trust within the REIT sector through various measures, including: i) prioritizing the accessibility and clarity of information for the broader public to gain a better understanding of the potential impact of their investment decisions, ii) launching educational campaigns and providing resources dedicated to informing investors about relevant regulations and any changes in the law, iii) encouraging collaboration between regulatory authorities and industry stakeholders to raise public awareness about the benefits and potential drawbacks associated with REIT investment, iv) providing clear and easily understandable documentation outlining the tax implications associated with different investment scenarios, and v) establishing consultation services to allow investors to seek expert advice on tax-related aspects of REIT investments, thereby alleviating reservations and uncertainties.
- Acquisitions
Acquisitions play a pivotal role in the dynamic landscape of the Kenyan REITs industry. These strategic moves signify the industry's evolution, adaptability, sustainability, and growth potential. As of December 2023, the industry has witnessed noteworthy acquisitions that are reshaping the sector. These acquisitions hold a promising outlook for the industry, contributing to its progress and value proposition. They exemplify how REITs are actively enhancing their portfolios, expanding their market presence, and optimizing their performance. Some of the notable acquisitions as at FY’2023 include;
- LAPTrust Imara I-REIT possesses a diversified portfolio of properties which include; i) Pension Towers, Metro Park, and CPF House which are commercial office buildings located in Nairobi CBD, ii) Retail centre Freedom Heights mall located in Lang’ata, iii) Nova Pioneer which is a purpose-built educational facility located in Eldoret, iv) Freedoms Height residential apartments and serviced plot located in Lang’ata, and, v) Man apartments located in Kilimani,
- ILAM Fahari I-REIT manages and operates several properties under their portfolio which include: i) a mixed used development (MUD) Greenspan Mall located in Donholm, Nairobi, ii) 67 Gitanga Place which is a prime office property located in Lavington, and, iii) Bay Holdings and Highway House which are industrial properties located in Industrial Area and Mombasa Road area respectively,
- Acorn Student Accommodation (ASA) I-REIT has five completed student housing properties with 3,003 beds under their management serving up to 128 universities and colleges. These properties include; Qwetu Jogoo Road, Qwetu Ruaraka, Qwetu WilsonView in Lang’ata, Qwetu Parklands, and Qwetu Aberdare Heights I along Thika Road next to United States International University Africa (USIU-A). On the other hand, Acorn D-REIT boasts of four properties which are currently operational and six other properties under development bringing to a total of ten properties with 10,060 beds under its portfolio. Operational properties include; Qwetu Hurlingham, Qwetu Abedare Heights II, Qwetu Karen, Qejani Karen whereas properties under development include; Qwetu Chiromo, Qejani Chiromo, Qejani JKUAT next to Jomo Kenyatta University of Agriculture and Technology, Qejani Hurlingham, Qwetu KU, and Qejani KU next to Kenyatta University,
- During H1’2023 period, the ASA I-REIT and ASA D-REIT entered into a legally bidding agreement for the acquisition of Qwetu Hurlingham, along Arwings Kodhek Road. The property commenced operations in January 2022 and caters to serve tertiary- education students within Hurlingham area and surrounding regions, primarily targeting Daystar University, University of Nairobi (UoN) School of Medicine, Riara University, and Strathmore University students. The transaction is scheduled to be finalized in Q3’2023. The acquisition decision by ASA I-REIT was driven by the impressive performance exhibited by the property since its inception, achieving stabilization within just 11 months of operation, and a consistently high monthly occupancy rate of over 90.0% since project completion, and,
- During FY’2023, Acorn Student Accommodation Development REIT (ASA D-REIT) announced it had sold its stabilized asset, Qwetu Aberdare Heights II, to the Acorn Student Accommodation Income REIT (ASA I-REIT) in a Kshs 1.5 bn deal. The acquisition of the 630-bed capacity hostel located adjacent to Qwetu Aberdare Heights I and United States International University (USIU) brings the total number of assets acquired by the I-REIT to four over the last three years, after successful acquisitions of Qwetu Hurlingham in June 2023, Qwetu WilsonView in February 2021, and Qwetu Aberdare Heights I in October 2022. Through the sale, ASA D-REIT will repay Kshs 600.0 mn of the Acorn Green Bond, pushing the repayment of the Kshs 5.7 bn bond to Kshs 3.0 bn ahead of its maturity in November 2024. The bond which was first floated in 2019, was issued in partnership with Private Equity Fund Helios and had attracted an 85.0% subscription rate, raising Kshs 4.3 bn of the targeted amount of Kshs 5.0 bn. The bond was priced at a rate of 12.3%, and was intended to be used to finance sustainable and climate-resilient student accommodation with a combined capacity of 40,000 beds.
Looking ahead, we anticipate that the pattern of strategic acquisitions will continue, with REITs actively pursuing opportunities to expand and diversify their portfolios, address changing market needs, and lead efforts to promote environmental sustainability, as demonstrated by Acorn Holding's issuance of green bonds. These acquisitions can also serve as drivers for innovation, encouraging the industry to explore novel concepts, designs, and services to meet the requirements of both investors and tenants.
- Capital Raising
Raising capital is essential in the REITs industry, fueling growth, development, and innovation. Securing funds from diverse sources, whether through debt or equity, enables REITs to expand their portfolios, improve existing properties, and explore new investment opportunities. This practice benefits the REITs and significantly shapes the Real Estate landscape, providing attractive investment options to stakeholders. Some of the notable capital infusion in the REITs industry as of FY’2023 include;
- In February 2023, ASA D-REIT secured Kshs 4.3 bn in equity from investors and Kshs 6.7 bn in debt from Absa Bank Kenya PLC, totaling Kshs 11.0 bn for developing student accommodation properties in Kiambu and Nairobi counties over the next three years. Some of the projects include: i) Qwetu Chiromo and Qejani Chiromo on Riverside Drive, costing Kshs 833.0 mn and Kshs 852.2 mn respectively, with a combined bed capacity of 2,695; ii) Qejani JKUAT at Kshs 639.6 mn; iii) Qejani Hurlingham at Kshs 772.2 mn, adding 1,280 beds to complement Qwetu Hurlingham Phase One; and iv) Qwetu KU and Qejani KU at Kshs 717.6 mn and Kshs 815.8 mn respectively, adding 2,186 beds to the D-REIT portfolio,
- In March 2023, Kenya's long-standing pension scheme, the Local Authorities Pension Trust (LapTrust) listed the inaugural Income-Real Estate Investment Trust (I-REIT) by a pension fund on the NSE, a ceremony presided over by President William Ruto. The I-REIT dubbed 'LAPTrust Imara I-REIT', holds profound importance for government pension schemes and the broader Kenyan capital markets, presenting investors with an exceptional chance to participate in a diversified collection of income-generating Real Estate assets. Furthermore, this move is expected to encourage other pension funds, particularly those heavily invested in physical assets, to unlock liquidity for the betterment of pensioners. For more information, see our Cytonn Monthly-October 2022,
- During the same period, CMA collaborated with key market stakeholders, including the Sanduku Investment Initiative, the Association of Pension Trustees and Administrators of Kenya (APTAK), and the Nairobi Securities Exchange (NSE), to establish the Kenya National REIT (KNR). With a focus on affordable housing and infrastructure, this initiative falls under the purview of the Sanduku Investment Initiative. For more information, see our Cytonn weekly #06/2023, and,
- In December 2023, ILAM Fahari I-REIT sold two properties valued at Kshs 200.4 mn as part of its strategy to divest non-core assets and reorganize its operations. The properties earmarked for sale included Highway House, a three-story industrial building off Mombasa Road in Nairobi, and Bay Holdings, fully leased to Imperial Bank, Packard Limited, and Architecture Supply Limited, located in Nairobi's Industrial Area. Fahari initially acquired these properties in 2016 for Kshs 324.8 mn, resulting in a 33.8% loss on the disposals before accounting for the rental income accumulated over the years. These asset sales left the I-REIT with only two remaining properties: the Greenspan Mall, a retail center in Donholm, and the commercial office building 67 Gitanga Place in Lavington. This adjustment lowered the fund's investment property value from Kshs 3.2 bn to Kshs 2.9 bn while significantly increasing its cash holdings. In terms of new acquisitions, Fahari has yet to initiate property purchases but is actively considering developing a portion of the vacant land at Greenspan Mall.
- Structural Adjustments
ILAM Fahari I-REIT's delisting from the Main Investment Market Segment (MIMS) of the Nairobi Securities Exchange (NSE) marked a strategic move in response to operational challenges and structural optimization. Following approval from the Capital Markets Authority (CMA), ILAM Fahari embarked on a transition to become a Restricted I-REIT, tailored to target professional investors. The decision to delist ILAM Fahari I-REIT from the unrestricted main investment market segment to the restricted segment reflects both challenges faced by the REIT and its proactive response. Operational hurdles prompted a re-evaluation of its structure and operations, leading to resolutions passed during an Extraordinary General Meeting (EGM) in December 2023. Key among these was the proposed conversion to a restricted REIT and subsequent delisting, which garnered significant unitholder support.
Implications of Delisting:
- Non-Professional Unitholders: Retail investors faced choices following the delisting announcement. Accepting the redemption offer ceased their unitholder status, while those opting to retain units faced trading restrictions post-conversion,
- Professional Unitholders: Professional investors remained unaffected by the delisting, with the option to trade units on the Unquoted Securities Platform (USP), albeit with liquidity uncertainties, and,
- Tenants and Regulators: Tenants and regulators experienced minimal impact from the delisting, with the CMA maintaining regulatory oversight as the REIT transitioned to a Restricted I-REIT.
The delisting and conversion strategy aligned with ILAM Fahari’s vision to optimize investments and cater to a specialized investor base. By focusing on professional investors, the REIT aimed to offer tailored investment opportunities, enhance flexibility, and unlock growth potential. While restructuring facilitates operational optimization and capital raising initiatives, it restricts retail investor participation, emphasizing the shift towards high net worth individuals in the REIT market.
Looking ahead, the trend of capital raising will continue to shape the trajectory of the Kenyan REITs industry. The infusion of equity and debt, along with strategic partnerships between private investors and government entities, will be crucial in driving expansion and unlocking new opportunities, such as affordable housing and infrastructure development projects, aligning with market demands and government priorities. As the industry progresses, collaborations, regulatory support, and investor education will play essential roles in ensuring that capital raising yields positive outcomes and propels the Kenyan REITs industry toward a vibrant and sustainable future.
Section III: Summary Performance of the REITs in FY’2023
The tables below highlight the performance of the Kenyan REITs sector, showing the performance using several National Association of Real Estate Investments Trusts (NAREIT) approved metrics, and the key take-outs;
|
Cytonn Report: Summary Performance Kenya REITs in FY’2023 |
||||||||||||||
|
Laptrust Imara I-REIT |
ILAM Fahari I-REIT |
Acorn I-REIT |
Acorn D-REIT |
FY'2022 |
FY'2023 |
y/y change |
||||||||
|
H1'2023 |
FY'2023 |
FY'2022 |
FY'2023 |
y/y Change |
FY'2022 |
FY'2023 |
y/y Change |
FY'2022 |
FY'2023 |
y/y Change |
||||
|
Operating Metrics |
||||||||||||||
|
Net Operating Income (NOI) |
99.6 |
244.6 |
141.9 |
148.7 |
4.8% |
206.0 |
340.1 |
65.1% |
657.0 |
368.6 |
(43.9%) |
1,004.9 |
1,102.0 |
9.7% |
|
Profitability Metrics |
||||||||||||||
|
Funds from Operations |
99.6 |
57.2 |
(28.4) |
(0.3) |
99.0% |
571.3 |
501.8 |
(12.2%) |
657.0 |
368.6 |
(43.9%) |
1,199.9 |
927.3 |
(22.7%) |
|
Adjusted FFO |
99.6 |
57.2 |
(45.8) |
(6.1) |
86.7% |
571.3 |
501.8 |
(12.2%) |
657.0 |
368.6 |
(43.9%) |
1,182.4 |
921.5 |
(22.1%) |
|
Cash Available for Distribution (CAD) |
99.6 |
244.6 |
141.9 |
148.7 |
4.8% |
162.4 |
235.7 |
45.1% |
0.0 |
239.8 |
- |
304.3 |
868.9 |
185.5% |
|
Cash Amounts Distributed (CAD) |
0.0 |
57.2 |
117.6 |
126.7 |
7.7% |
132.3 |
154.1 |
16.5% |
0.0 |
71.6 |
- |
249.9 |
352.3 |
41.0% |
|
Valuation Metrics |
||||||||||||||
|
Net Asset Value (NAV) |
7,024.3 |
6,981.9 |
3,424.4 |
3,306.4 |
(3.4%) |
5,854.3 |
7,377.5 |
26.0% |
6,155.6 |
6,560.9 |
6.6% |
15,434.2 |
24,269.1 |
57.2% |
Source: Cytonn Research
Key takeaways from the table include:
- The combined Net Operating Income (NOI) of Kenyan REITs saw a 9.7% increase, reaching Kshs 1,102.0 mn in FY’2023, up from Kshs 1,004.9 mn in FY’2022. This growth was largely driven by a 65.1% rise in the net operating income of Acorn I-REIT, which increased to Kshs 340.1 mn from Kshs 206.0 mn in FY’2022. Additionally, ILAM Fahari I-REIT reported a notable NOI growth of 4.8%, reaching Kshs 148.7 mn from Kshs 141.9 mn in FY’2022, further contributing to the overall positive performance,
- Combined Funds from Operations (FFO) of Kenyan REITs declined by 22.7% in FY’2023, dropping to Kshs 927.3 mn from Kshs 1,199.9 mn in FY’2022. Similarly, Adjusted FFOs for Kenyan REITs fell by 22.1%, reaching Kshs 921.5 mn in FY’2023 from Kshs 1,182.4 mn in FY’2022. This decrease was largely due to significant reductions in NOIs during the period. Acorn D-REIT’s NOI saw the largest drop, falling by 43.9% to Kshs 368.6 mn from Kshs 657.0 mn in FY’2022, which in turn led to a 43.9% decrease in Adjusted FFO. Additionally, Acorn D-REIT’s FFO decreased by 12.2% due to a 56.1% drop in fair value adjustment to investment property, which fell to Kshs 160.4 mn from Kshs 365.3 mn in FY’2022,
- The REITs combined Cash amounts available for paying dividends to REIT investors which we measured using the Cash Available for Distribution (CAD) metric increased by 185.5% in FY’2023 to Kshs 868.9 mn from Kshs 304.3 mn in FY’2022. The performance was propelled by Laptrust Imara I-REIT’s distributable earnings which stood at Kshs 244.6 mn,
- Notably, the REIT managers of all four REITs recommended final dividends. ILAM Fahari I-REIT’s manager proposed a first and final dividend of Kshs 0.7 per unit, making Kshs 126.7 mn available for distribution out of Kshs 148.8 mn. Acorn I-REIT increased its total distribution for the year to Kshs 242.8 mn, translating to Kshs 0.7 per unit, marking a 20.7% rise from the Kshs 192.5 mn distributed in 2022. Acorn D-REIT recommended a distribution of Kshs 240.0 mn, equivalent to Kshs 0.9 per unit, which was paid in December 2023. For Laptrust Imara I-REIT, the REIT Manager suggested a first and final dividend distribution of Kshs 195.7 mn, amounting to Kshs 0.57 per unit, which was approved by the Trustee for the 2023 fiscal year, and,
- Combined Net Asset Values for Kenyan REITs increased by 57.2% to reach an all-time high of Kshs 24,269.1 mn in FY’2023, from Kshs 15,434.2 mn in FY’2022. This was attributable to 26.0% and 6.6% growths in the Net Asset Values of Acorn I-REIT and Acorn D-REIT’s to Kshs 7,377.5 mn and Kshs 6,560.9 mn in FY’2023 from Kshs 5,854.3 mn and Kshs 6,155.6 mn in FY’2022 respectively.
The table below makes a comparison of the leverage and liquidity ratios of all four Kenyan REITs during FY’2023 and FY’2022;
|
Cytonn Report: Leverage & Liquidity Ratios of Kenyan REITs |
|||||||||||||||
|
|
Laptrust Imara I-REIT |
ILAM Fahari I-REIT |
Acorn I-REIT |
Acorn D-REIT |
FY'2022* |
FY'2023** |
y/y change |
||||||||
|
H1'2023 |
FY'2023 |
FY'2022 |
FY'2023 |
y/y Change |
FY'2022 |
FY'2023 |
y/y Change |
FY'2022 |
FY'2023 |
y/y Change |
|||||
|
Leverage Ratios |
|||||||||||||||
|
Debt to Equity Ratios |
0.0x |
0.0x |
0.0x |
0.0% |
0.0x |
0.0x |
0.0% |
0.6x |
0.2x |
(40.5%) |
0.3x |
0.1x |
(21.2%) |
||
|
Debt to Total Market Cap Ratio |
0.0% |
0.0% |
0.0% |
0.0% |
0.0% |
0.0% |
0.0% |
60.1% |
16.0% |
(44.1%) |
27.9% |
5.1% |
(22.8%) |
||
|
Debt to Gross Book Value Ratio |
0.0% |
0.0% |
0.0% |
0.0% |
0.0% |
0.0% |
0.0% |
33.8% |
9.4% |
(24.3%) |
15.7% |
3.0% |
(12.7%) |
||
|
Debt to EBITDA Multiple |
0.0x |
0.0x |
0.0x |
0.0% |
0.0x |
0.0x |
0.0% |
5.3x |
2.9x |
(45.1%) |
2.5x |
0.9x |
(62.2%) |
||
|
Liquidity Ratios |
|||||||||||||||
|
Debt Service Coverage Ratio |
- |
- |
- |
- |
- |
- |
- |
18.7% |
34.1% |
15.3% |
8.7% |
10.9% |
2.2% |
||
|
Implied Capitalization Rate |
0.0% |
18.7% |
21.3% |
2.6% |
3.3% |
4.4% |
1.1% |
7.3% |
3.7% |
(3.6%) |
6.6% |
3.7% |
(3.0%) |
||
|
*Market cap weighted as at 31/12/2022 **Market cap weighted as at 31/12/2023 |
|||||||||||||||
Source: Cytonn Research
Key takeaways from the table include;
- Majority of the REITs remained ungeared during FY’2023, with their leverage ratios remaining at zero except Acorn D-REIT. Acorn D-REIT debt ratios decreased in FY’2023 on account of a 69.1% decline in its long-term borrowings to Kshs 3.5 bn from Kshs 1.1 bn in FY’2022,
- Notably, Acorn D-REIT’s Debt to EBITDA Multiple reduced to 2.9x in FY’2023, from 5.3x recorded in FY’2022. This was on the back of a faster decline in the REIT’s long-term borrowings which outpaced the EBITDA’s decline. Acorn D-REIT EBITDA in FY’2023 decreased by 43.8% to Kshs 370.0 mn from Kshs 657.0 mn in FY’2022, compared to a 69.1% decrease in the REIT’s long-term debt, and,
- ILAM Fahari I-REIT traded at the highest implied capitalization rate of 21.3%, signifying a higher return on investment compared to other REITs. In contrast, LAPTrust Imara I-REIT had the lowest implied capitalization rate of zero. Despite this, we anticipate that LAPTrust Imara I-REIT's performance will improve gradually, given that the REIT is still in its early years of operation.
The table below presents a summary of key valuation metrics of Kenyan REITs in FY’2023;
|
Cytonn Report: Valuation Metrics for Kenyan REITs |
||||||||||||||
|
|
Laptrust Imara I-REIT |
ILAM Fahari I-REIT |
Acorn I-REIT |
Acorn D-REIT |
FY'2022 |
FY'2023 |
y/y change |
|||||||
|
|
H1'2023 |
FY'2023 |
FY'2022 |
FY'2023 |
y/y Change |
FY'2022 |
FY'2023 |
y/y Change |
FY'2022 |
FY'2023 |
y/y Change |
|||
|
Price/ FFO per Share |
69.5x |
121.0x |
(41.6x) |
(3,830.5x) |
9,107.9% |
9.7x |
14.2x |
46.1% |
8.9x |
18.3x |
106.3% |
(7.7x) |
(932.1x) |
11,524.7% |
|
Dividend Yield
|
0.00% |
2.8% |
10.0% |
11.1% |
1.1% |
2.4% |
2.2% |
(0.2%) |
0.0 |
0.0 |
- |
1.2% |
2.2% |
0.9% |
|
Dividend Coverage/ Payout Ratio |
100.0% |
80.0% |
82.9% |
85.2% |
2.3% |
81.4% |
45.3% |
(36.1%) |
0.0% |
19.4% |
- |
40.7% |
45.3% |
4.6% |
|
Net Asset Value |
7,024.3 |
6,981.9 |
3424.4 |
3306.4 |
(3.4%) |
5,854.3 |
7,377.5 |
26.0% |
6,155.6 |
6,560.9 |
6.6% |
15,434.2 |
24,269.1 |
57.2% |
|
Net Asset Value per Share |
20.3 |
20.2 |
18.9 |
18.3 |
(3.4%) |
22.1 |
22.5 |
2.0% |
25.2 |
24.6 |
(2.4%) |
22.1 |
21.4 |
(2.9%) |
Source: Cytonn Research
- Laptrust Imara I-REIT units are trading at a premium relative to its peers, with a Price to FFO per share multiple of Kshs 121.0. Comparatively, ILAM Fahari I-REIT units would trade at a significant discount with a negative Price to FFO per share multiple of Kshs 3,830.5,
- ILAM Fahari I-REIT boasted the highest dividend yield in FY’2023 at 11.1%, surpassing Laptrust Imara I-REIT’s 2.8% and Acorn I-REIT’s 2.2%. On the payout side, ILAM’s dividend payout was 85.2%, adhering to Kenya's REIT regulations that mandate distributing at least 80.0% of net profits after tax as dividends. Conversely, Acorn I-REIT and D-REIT had lower payouts of 45.3% and 19.4%, respectively, falling short of the regulatory threshold, and,
- Acorn D-REIT recorded the highest NAV per share at Kshs 24.6, a 2.4% decline from FY’2022’s NAV per share of Kshs 25.2. This is on the back of a faster growth in the number of shares, which increased by 9.2% to Kshs 266.7 mn from Kshs 244.2 mn in FY’2022; compared to a 6.6% growth in the Net Asset Value (NAV) to Kshs 6.6 bn from Kshs 6.2 mn. ILAM Fahari had the lowest NAV per share at Kshs 18.3, a 3.4% decline from 18.9 recorded in FY’2022. This is attributable to a 4.0% decrease in total assets to Kshs 3.5 bn from Kshs 3.6 bn in FY’2022.
Section IV: Conclusions, Recommendations, and Outlook for the REITs Sector
The performance of the REITs market in Kenya has followed a moderate trajectory, shaped by various factors. Despite the overall challenges, there are positive signs within the Kenyan REIT sector. Notably, net operating incomes have shown growth, indicating improved financial performance. Additionally, leverage ratios for most REITs remained notably low, with the majority being ungeared and relying on short-term debt for their operations. We expect this trend to continue as REITs aim to avoid overexposure to interest rates, especially in the current environment of rising rates. In support of this, we foresee more developments in financial sustainability, exemplified by key players like Acorn Holdings through its issuance of a green bond. Moreover, we anticipate that the recent regulatory proposal by the Capital Markets Authority (CMA) to lower the minimum investment amounts for professional investors to Kshs 10,000 will boost interest in the sector, potentially attracting a wider investor base.
Based on our research and analysis, we make the following recommendations to enhance the REITs sector through a more informed and strategic approach:
- Enhancing Stakeholder Education: All key stakeholders need to be educated on the REIT structure. Implementing investor education and awareness campaigns is essential to inform potential investors about the benefits and risks associated with REIT investments. By improving investor knowledge and understanding, it is likely that more individuals will be encouraged to participate in the REIT market, thereby contributing to its growth and development,
- Expanding Legal Framework: In South Africa, the REITs' legal and operational framework allows different legal entities to establish REITs, unlike Kenya, where this is limited to trusts. In both Belgium and the United States, REIT formation permits flexibility in the choice of legal entities, contributing to the diversity and dynamism of the REIT market. Belgium allows various legal structures, including public limited companies, limited liability companies, and cooperative companies, tailored to different investor preferences and business models. Similarly, in the US, REITs can be structured as corporations, trusts, or associations, providing versatility in organizational structures. To enhance the Kenyan REIT market, it is prudent to introduce similar flexibility. By expanding the range of permissible structures beyond traditional trust-based models to include corporations, partnerships, and limited liability companies, Kenya can better accommodate diverse investor needs and facilitate easier entry into the REIT market. This diversification would promote a more robust and dynamic REIT sector, catering to different organizational preferences,
- Streamlined approval process: To improve the efficiency of Real Estate Investment Trusts (REITs) approval, it is recommended to consolidate the approval structure into a single agency, instead of the current two (CMA and KRA). Merging the approval process under one agency would eliminate the need to navigate through two separate entities for REITs approval. This consolidation would streamline the process, enhancing efficiency, reducing costs, and improving transparency and accountability,
- Introduce Hybrid REIT Vehicles: Currently, investors have to subscribe to both of the separate REIT classes, forcing them to pay duplicate costs, due to the nature of exclusivity of the two. A hybrid REIT would provide investors integrated returns, by combining the higher return from development while reducing risk exposure through the relatively stable income component of the I-REIT. In addition, an IPO with such a hybrid REIT vehicle would eliminate the duplicated costs of running two separate REITs, thereby improving subscriptions by investors. Introducing a hybrid REIT within a unified structure would thus enable investors to capitalize on the strengths of both investment types, potentially leading to more balanced risk-reward profiles,
- Flexibility in Listing: Acknowledging the apprehensions of companies regarding an immediate shift to public listing, we propose a gradual, phased strategy. Providing REITs with an initial period of private operation before mandating public listing would facilitate a smoother transition and align with the comfort levels of corporate entities. Belgium's stipulation of ensuring 30.0% of shares held by the public strikes a balance between public ownership and flexibility for REIT promoters. Kenya could adopt a similar approach to encourage broader investor participation while ensuring sufficient liquidity in the market. Moreover, Kenya could follow the example of the United States by offering flexibility in listing options for REITs. Granting REITs the autonomy to choose between going public or remaining private offers increased flexibility to accommodate diverse investor preferences and business models. By accommodating both publicly listed and privately held REITs, Kenya can promote inclusivity in the market and cater to the needs of a wide range of investors, thereby bolstering the vibrancy and liquidity of the REIT market. This approach creates a favourable environment for REITs to thrive while addressing concerns related to the transition to public listing,
- Inclusive Corporate Trusteeship: An essential modification entails the integration of Corporate Trustees, mirroring practices observed in the pension sector. Additionally, we propose a reduction in the minimum capital requirement, presently set at Kshs 100.0 mn, as this financial threshold currently limits trusteeship options solely to banking institutions. Currently, four banks are registered as REIT Trustees, including Kenya Commercial Bank (KCB), Co-operative Bank (Coop), Housing Finance Bank, and NCBA Bank Kenya. We suggest lowering the minimum to Kshs 10.0 million to align with the minimum required for a Pension Fund Trustee. This adjustment would expand the pool of potential Trustees available to REIT Managers,
- Introduce Tokenization of REITs: Introducing the concept of tokenization for REITs presents an innovative solution and has the potential to amplify market participation. This would facilitate the ownership of REIT units in smaller denominations, even as low as Kshs 100.0, and,
- Diminishing Entry Barriers: Reconsideration of the steep Kshs 5.0 mn minimum for D-REITs is vital to eliminate entry barriers that inadvertently limit individual market entry. A revised minimum could promote a more inclusive investment landscape.
In summary, despite the hurdles encountered in the Kenyan market, the potential of REITs remains promising. These investment instruments offer a means to enhance liquidity and broaden financing options within the Real Estate sector, presenting an alternative avenue for development funding and potential returns for investors. Although Kenya's REIT journey has faced challenges, the proposed adjustments in investment thresholds and the resilience shown in the financial performance of certain REITs indicate a possible revitalization in the sector.
To read the full Cytonn Kenya’s REITs FY’2023 Report, click here.
Disclaimer: The views expressed in this publication are those of the writers where particulars are not warranted. This publication, which is in compliance with Section 2 of the Capital Markets Authority Act Cap 485A, is meant for general information only and is not a warranty, representation, advice, or solicitation of any nature. Readers are advised in all circumstances to seek the advice of a registered investment advisor.

- Talk to us
- Kenya
- P.O Box 20695 - 00200, Nairobi, Kenya
- Cell +254709101200
- Tel +254709101200
- WhatsApp +254741676635
- United States
- +254709101200
- DOWNLOAD OUR APP
-


- Kenya
- 8th Floor, Pinetree Plaza, Kaburu Drive, Ngong Road, Nairobi, Kenya
- USA
- Suite 1150, 1775 Eye Street NW, USA, Washington DC 20006, USA
- Investments
- High Yield
- Private Equity
- Real Estate
- Real Estate
- RiverRun Estates
- Cytonn Towers
- The Ridge
- Taraji Heights
- The Alma