Unit Trust Funds Performance, Q2’2022, & Cytonn Monthly – October 2022
By Research Team, Nov 6, 2022
Executive Summary
Fixed Income
During the month of October, T-bills were undersubscribed, with the overall subscription rate declining to 91.9%, from 106.3% recorded in September 2022 partly attributable to tightened liquidity during the period with the average interbank rate increasing to 5.1% from 4.6% recorded in September. The overall subscription rates for the 91-day and 182-day papers declined to 324.4% and 61.7% from 362.0% and 85.7%, respectively, while that of the 364-day paper slightly increased to 29.0% from 24.7% recorded in September 2022. In the primary bond market, the government bonds for the month of October were undersubscribed with the average subscription rate coming in at 60.7%, lower than the 92.3% average subscription rate for the month of September 2022;
During the week, T-bills were oversubscribed, with the overall subscription rate coming in at 181.9%, an increase from the 75.8% recorded the previous week. The increase in the subscription rate was partly attributable to the eased liquidity in the money market with the average interbank rate declining to 4.6% from 5.0% recorded the previous week. Investor’s preference for the shorter 91-day paper persisted, with the paper receiving bids worth Kshs 18.5 bn against the offered Kshs 4.0 bn, translating to a subscription rate of 463.8%, up from 299.8% recorded the previous week. Similarly, the subscription rates for the 364-day and 182-day papers increased to 167.6% and 83.4%, from 21.5% and 40.4% respectively, recorded the previous week. The yields on the government papers were on an upward trajectory, with the yields on the 364-day, 182-day and 91-day papers increasing by 14.4 bps, 1.3 bps and 1.2 bps to 10.1%, 9.7% and 9.1%, respectively;
Also during the week, the Kenya National Bureau of Statistics (KNBS) released the y/y inflation for the month of October 2022 highlighting that the inflation rate increased to 9.6%, from the 9.2% recorded in September 2022, higher than our expectations;
Equities
During the month of October, the equities market recorded mixed performance, with NASI and NSE 25 gaining by 0.3% and 0.6%, respectively while NSE 20 declined by 2.3%. The equities market performance was driven by gains recorded by large cap stocks such as EABL, NCBA Group, and Standard Chartered Bank of Kenya (SCBK) of 17.8%, 4.0%, and 1.1%, respectively. The gains were however weighed down by losses recorded by other large cap stocks such as KCB Group, Diamond Trust Bank (DTB-K), and BAT of 9.2%, 4.5%, and 2.3%, respectively;
During the week, the equities market was on a downward trajectory with NASI, NSE 20 and NSE 25 declining by 0.7%, 0.3%, and 0.9%, taking their YTD performance to losses of 23.7%, 12.5%, and 17.7%, for NASI, NSE 20 and NSE 25, respectively. The equities market performance was mainly driven by losses recorded by banking stocks such as NCBA Group and Equity Group of 3.6% and 2.4% respectively and manufacturing stocks such as EABL and BAT of 1.6% and 1.5%, respectively. The losses were however mitigated by gains recorded by stocks such as ABSA Bank and Bamburi of 2.2% and 1.2% respectively;
Real Estate
During the month, the Kenya National Bureau of Statistics (KNBS) released the Q2’2022 GDP Report highlighting that the Real Estate Sector grew by 5.5% in the period under review, 0.6% points and 1.9% points lower than the 6.1% and 7.4% growth recorded in Q1’2022 and Q2’2021, respectively. In the residential sector, Gulf African Bank signed a partnership deal with property developer Superior Homes, to provide mortgages to potential home buyers at an 11.8% interest rate. In the retail sector, Naivas Supermarket opened two new outlets located at Meru’s Greenwood City Mall, and at Kahawa Sukari opposite Engen Petrol Station. In the hospitality sector, the United Nations (UN) through its Director General, Zainab Hawa, announced plans to break ground of an ultra-modern conference facility worth USD 278.9 mn (Kshs 33.9 bn) in Gigiri, Nairobi. In the infrastructure sector, the national government in partnership with the African Development Bank (AfDB), announced plans to construct a highway linking West Pokot and Turkana counties with South Sudan. In the listed Real Estate sector, the Capital Markets Authority (CMA) approved the listing of the Local Authorities Pension Trust (LAP Trust) Imara I-REIT, on the Nairobi Securities Exchange (NSE) Main Investment Market under the Restricted Sub-segment. Also in the NSE, Fahari I-REIT closed the week trading at an average price of Kshs 6.9 per share, while Acorn D-REIT and Acorn I-REIT prices stood at Kshs 23.8 and Kshs 20.8 per unit, respectively, on the Unquoted Securities Platform as at 7th October 2022;
Focus of the Week
Following the release of the Capital Markets Authority (CMA) Quarterly Statistical Bulletin-Q3’2022 we examine the performance of Unit Trust Funds. During the period of review, Unit Trusts’ Assets under Management grew by 3.1% to Kshs 145.0 bn as at the end of Q2’2022, from Kshs 140.7 bn recorded in Q1’2022. Additionally, as at the end of Q2’2022, there were 32 approved Collective Investment Schemes, making up 129 funds in total;
Investment Updates:
- Weekly Rates:
- Cytonn Money Market Fund closed the week at a yield of 10.7%. To invest, dial *809# or download the Cytonn App from Google Playstore here or from the Appstore here;
- Cytonn High Yield Fund closed the week at a yield of 14.0% p.a. To invest, email us at sales@cytonn.com and to withdraw the interest, dial *809# or download the Cytonn App from Google Playstore here or from the Appstore here;
- Christopher Aura, an Investments Analyst at Cytonn Investments featured on Look Up Tv to discuss on the government public debt situation. Watch the conversation here;
- We continue to offer Wealth Management Training every Wednesday and every third Saturday of the month, from 9:00 am to 11:00 am, through our Cytonn Foundation. The training aims to grow financial literacy among the general public. To register for any of our Wealth Management Trainings, click here;
- If interested in our Private Wealth Management Training for your employees or investment group, please get in touch with us through wmt@cytonn.com;
- Any CHYS and CPN investors still looking to convert are welcome to consider one of the five projects currently available for assignment, click here for the latest term sheet;
- Cytonn Insurance Agency acts as an intermediary for those looking to secure their assets and loved ones’ future through insurance namely; Motor, Medical, Life, Property, WIBA, Credit and Fire and Burglary insurance covers. For assistance, get in touch with us through insuranceagency@cytonn.com;
- Cytonnaire Savings and Credit Co-operative Society Limited (SACCO) provides a savings and investments avenue to help you in your financial planning journey. To enjoy competitive investment returns, kindly get in touch with us through clientservices@cytonn.com;
Real Estate Updates:
- For an exclusive tour of Cytonn’s real estate developments, visit: Sharp Investor's Tour, and for more information, email us at sales@cytonn.com;
- Phase 3 of The Alma is now ready for occupation and the show house is open daily. To rent please email properties@cytonn.com;
- We have 8 investment-ready projects, offering attractive development and buyer targeted returns; See further details here: Summary of Investment-ready Projects;
- For Third Party Real Estate Consultancy Services, email us at rdo@cytonn.com;
- For recent news about the group, see our news section here;
Hospitality Updates:
- We currently have promotions for Staycations. Visit com/offers for details or email us at sales@cysuites.com
Money Markets, T-Bills Primary Auction:
During the month of October, T-bills were undersubscribed, with the overall subscription rate declining to 91.9%, from 106.3% recorded in September 2022 partly attributable to tightened liquidity during the period with the average interbank rate increasing to 5.1% from 4.6% recorded in September. The overall subscription rates for the 91-day and 182-day papers declined to 324.4% and 61.7% from 362.0% and 85.7%, respectively, while that of the 364-day paper slightly increased to 29.0% from 24.7% recorded in September 2022. The average yields on the government papers were on an upward trajectory during the month with the 364-day, 182-day and 91-day papers increasing by 1.9 bps, 5.0 bps and 13.7 bps to 9.9%, 9.7% and 9.1% respectively. For the month of October, the government continued to reject expensive bids, accepting a total of Kshs 92.8 bn out of the Kshs 110.2 bn worth of bids received, translating to an acceptance rate of 84.2%.
During the week, T-bills were oversubscribed, with the overall subscription rate coming in at 181.9%, an increase from the 75.8% recorded the previous week. The increase in the subscription rate was partly attributable to the eased liquidity in the money market with the average interbank rate declining to 4.6% from 5.0% recorded the previous week. Investor’s preference for the shorter 91-day paper persisted, with the paper receiving bids worth Kshs 18.5 bn against the offered Kshs 4.0 bn, translating to a subscription rate of 463.8%, up from 299.8% recorded the previous week. Similarly, the subscription rates for the 364-day and 182-day papers increased to 167.6% and 83.4%, from 21.5% and 40.4% respectively, recorded the previous week. The yields on the government papers were on an upward trajectory, with the yields on the 364-day, 182-day and 91-day papers increasing by 14.4 bps, 1.3 bps and 1.2 bps to 10.1%, 9.7% and 9.1%, respectively. The government rejected expensive bids, accepting a total of Kshs 39.5 bn worth of bids out of the Kshs 43.7 bn worth of bids received, translating to an acceptance rate of 90.4%.
The October 2022 bonds remained undersubscribed, with FXD1/2017/10 and FXD1/2020/15 receiving bids worth Kshs 18.8 bn against the offered Kshs 40.0 bn, translating to a subscription rate of 47.0% while FXD1/2022/25 received bids worth Kshs 14.9 bn against the offered Kshs 20.0 bn, translating to a subscription rate of 74.5%. The weighted average rate of accepted bids for the October bonds was 13.8%, 0.2% points lower than the 14.0% average rate for the September bonds. The table below provides more details on the bonds issued during the month of October:
|
Cytonn Report: Government Bonds performance October 2022 |
|||||||||
|
Issue Date |
Bond Auctioned |
Effective Tenor to Maturity (Years) |
Coupon |
Amount offered (Kshs bn) |
Actual Amount Raised (Kshs bn) |
Total bids received |
Average Accepted Yield |
Subscription Rate |
Acceptance Rate |
|
10/10/2022 |
FXD1/2017/10-Reopened |
4.9 |
13.0% |
40.0 |
15.1 |
18.8 |
13.4% |
47.0% |
80.4% |
|
10/10/2022 |
FXD1/2020/15-Reopened |
12.3 |
12.8% |
14.0% |
|||||
|
24/10/2022 |
FXD1/2022/25-New |
25.0 |
14.2% |
20.0 |
13.7 |
14.9 |
14.2% |
74.5% |
91.7% |
|
Oct 2022 Average |
14.1 |
13.3% |
30.0 |
14.4 |
16.8 |
13.8% |
60.7% |
86.1% |
|
|
Sep 2022 Average |
12.5 |
13.7% |
50.0 |
39.0 |
46.1 |
14.0% |
92.3% |
84.6% |
|
Source: Central Bank of Kenya
Secondary Bond Market:
The yields on the government securities increased during the month compared to the same period in 2021, partly attributable to the increased perceived risks arising from increasing inflationary pressures and local currency depreciation. The chart below shows the yield curve movement during the period: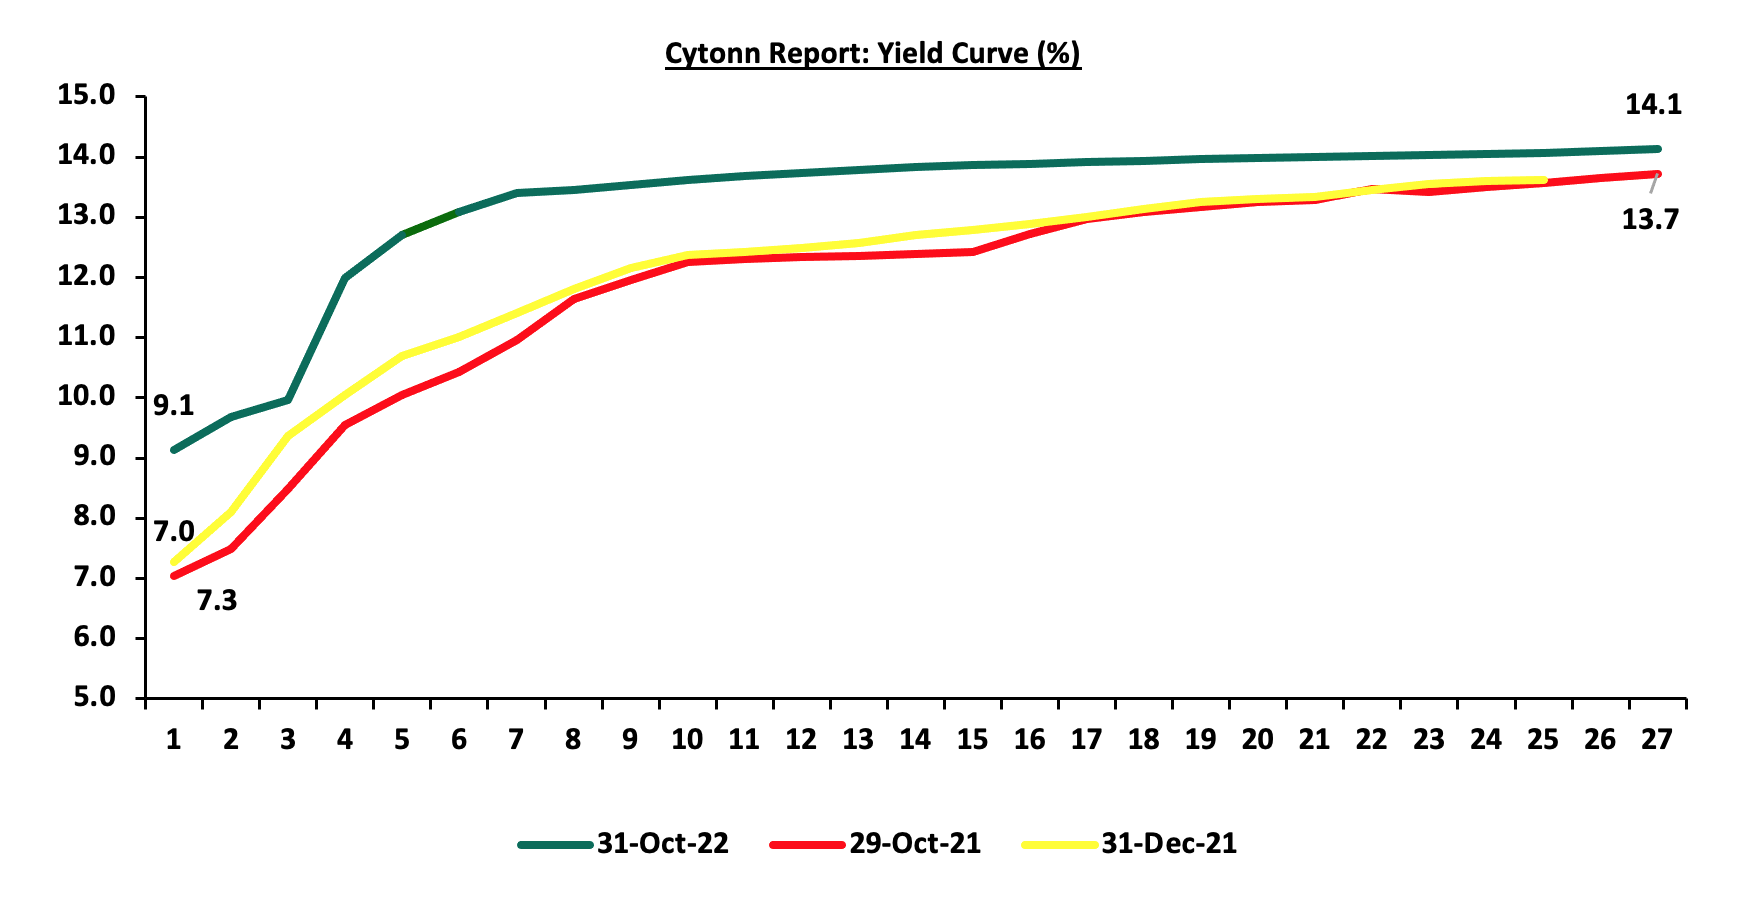
The secondary bond turnover declined by 12.3% to Kshs 57.6 bn, from Kshs 66.4 bn recorded in September 2022, pointing towards reduced activity by commercial banks in the secondary bonds market. On a year on year basis, the bonds turnover declined by 21.1% to Kshs 634.4 bn, from Kshs 803.9 bn worth of treasury bonds transacted over a similar period last year. 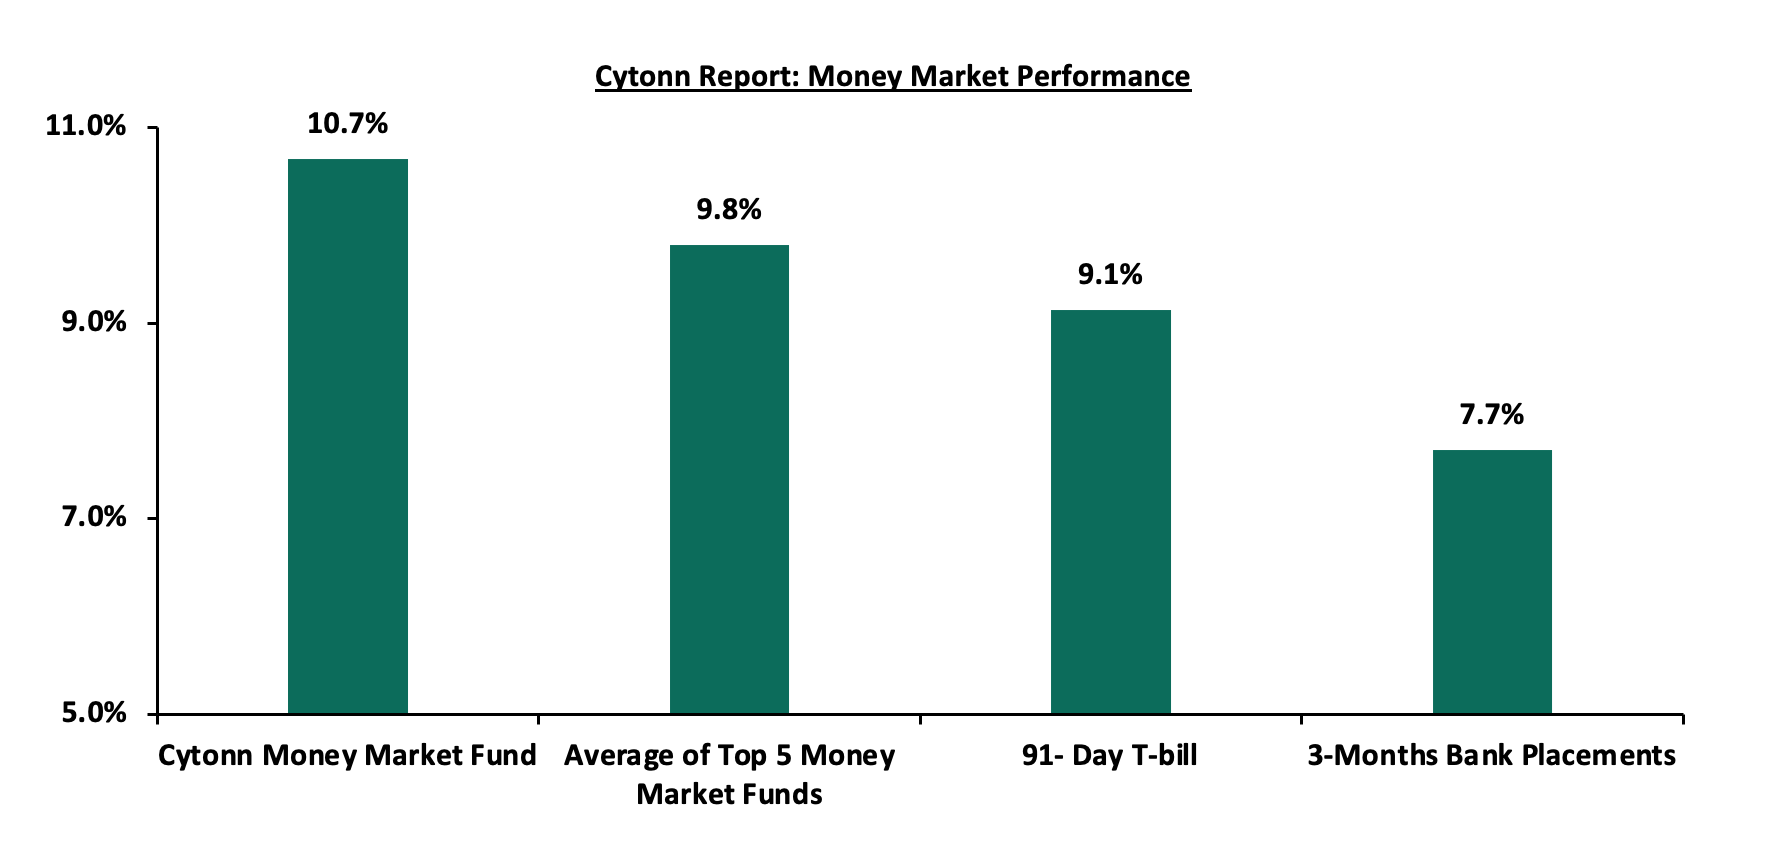
In the money markets, 3-month bank placements ended the week at 7.7% (based on what we have been offered by various banks), while the yield on the 91-day T-bill increased by 1.2 bps to 9.1%. The average yields of the Top 5 Money Market Funds and the Cytonn Money Market Fund remained unchanged at 9.9% and 10.7%, respectively.
The table below shows the Money Market Fund Yields for Kenyan Fund Managers as published on 4th October 2022:
|
Cytonn Report: Money Market Fund Yield for Fund Managers as published on 4th October 2022 |
||
|
Rank |
Fund Manager |
Effective Annual Rate |
|
1 |
Cytonn Money Market Fund |
10.7% |
|
2 |
Zimele Money Market Fund |
9.9% |
|
3 |
NCBA Money Market Fund |
9.5% |
|
4 |
Sanlam Money Market Fund |
9.5% |
|
5 |
Madison Money Market Fund |
9.4% |
|
6 |
Nabo Africa Money Market Fund |
9.3% |
|
7 |
Dry Associates Money Market Fund |
9.3% |
|
8 |
Old Mutual Money Market Fund |
9.3% |
|
9 |
Apollo Money Market Fund |
9.2% |
|
10 |
Co-op Money Market Fund |
9.2% |
|
11 |
CIC Money Market Fund |
9.1% |
|
12 |
GenCap Hela Imara Money Market Fund |
8.9% |
|
13 |
British-American Money Market Fund |
8.8% |
|
14 |
ICEA Lion Money Market Fund |
8.6% |
|
15 |
Orient Kasha Money Market Fund |
8.5% |
|
16 |
AA Kenya Shillings Fund |
8.4% |
|
17 |
Absa Shilling Money Market Fund |
8.4% |
|
18 |
Equity Money Market Fund |
5.4% |
Source: Business Daily
Liquidity:
Liquidity in the money markets tightened in the month of October 2022, with the average interbank rate increasing to 5.1%, from 4.6%, recorded in September 2022. However, during the week, liquidity in the money markets eased, with the average interbank rate declining to 4.6% from 5.0% recorded the previous week, partly attributable to government payments that offset tax remittances. The average interbank volumes traded declined by 32.3% to Kshs 20.2 bn from Kshs 29.8 bn recorded the previous week.
Kenya Eurobonds:
During the month, the yields on the Eurobonds were on a downward trajectory despite the prevailing uncertainties surrounding the increasing inflationary pressures and local currency depreciation. The yield on the 10-year Eurobond issued in 2014 was the largest decliner having declined by 2.0% points to 15.6% from 17.6%, recorded in September 2022.
During the week, the yields on Eurobonds were also on a downward trajectory with the yield on the 7-year Eurobond issued in 2019 recording the largest decline having declined by 0.7% points to 14.4% from 15.1%, recorded the previous week. The table below shows the summary of the performance of the Kenyan Eurobonds as of 3rd November 2022;
|
Cytonn Report: Kenya Eurobonds Performance |
||||||
|
|
2014 |
2018 |
2019 |
2021 |
||
|
Date |
10-year issue |
10-year issue |
30-year issue |
7-year issue |
12-year issue |
12-year issue |
|
3-Jan-22 |
4.4% |
8.1% |
8.1% |
5.6% |
6.7% |
6.6% |
|
30-Sep-22 |
17.6% |
14.7% |
14.0% |
15.6% |
14.7% |
13.2% |
|
27-Oct-22 |
16.2% |
14.1% |
13.4% |
15.1% |
14.4% |
12.8% |
|
28-Oct-22 |
16.1% |
13.9% |
13.3% |
14.7% |
14.2% |
12.7% |
|
31-Oct-22 |
15.6% |
13.9% |
13.2% |
14.7% |
14.1% |
12.7% |
|
1-Nov-22 |
15.7% |
13.7% |
13.2% |
14.4% |
14.0% |
12.5% |
|
2-Nov-22 |
15.8% |
13.7% |
13.1% |
14.3% |
14.1% |
12.5% |
|
3-Nov-22 |
15.7% |
13.6% |
13.2% |
14.4% |
13.9% |
12.5% |
|
Weekly Change |
(0.5%) |
(0.5%) |
(0.2%) |
(0.7%) |
(0.5%) |
(0.3%) |
|
MTM Change |
(2.0%) |
(0.8%) |
(0.8%) |
(0.9%) |
(0.6%) |
(0.5%) |
|
YTD Change |
11.3% |
5.5% |
5.1% |
8.8% |
7.2% |
5.9% |
Source: Central Bank of Kenya (CBK)
Kenya Shilling:
During the month, the Kenya Shilling depreciated by 0.5% against the US Dollar, to close the month at Kshs 121.5, from Kshs 120.7 recorded at the end of September 2022, partly attributable to the increased dollar demand from importers, especially oil and energy sectors against a slower supply of hard currency.
During the week, the Kenyan shilling depreciated by 0.2% against the US dollar to close the week at Kshs 121.5, from Kshs 121.3 recorded the previous week, partly attributable to increased dollar demand from importers, especially oil and energy sectors against a slower supply of hard currency. On a year to date basis, the shilling has depreciated by 7.4% against the dollar, higher than the 3.6% depreciation recorded in 2021. We expect the shilling to remain under pressure in 2022 as a result of:
- High global crude oil prices on the back of persistent supply chain bottlenecks coupled with high demand,
- An ever-present current account deficit estimated at 5.3% of GDP in the 12 months to September 2022, same as what was recorded in a similar period in 2021, and,
- The need for Government debt servicing which continues to put pressure on forex reserves given that 68.1% of Kenya’s External debt was US Dollar denominated as of July 2022.
The shilling is however expected to be supported by:
- Improved diaspora remittances standing at a cumulative USD 3.0 bn as of September 2022, representing a 10.4% y/y increase from USD 2.7 bn recorded over the same period in 2021, and,
- Sufficient Forex reserves currently at USD 7.2 bn (equivalent to 4.0 months of import cover), which are currently at par with the statutory requirement of maintaining at least 4.0-months of import cover, however it’s important to note that Forex reserves have dropped by 16.5% YTD from USD 8.8 bn. The chart below summarizes the evolution of Kenya months of import cover over the last 10 years;
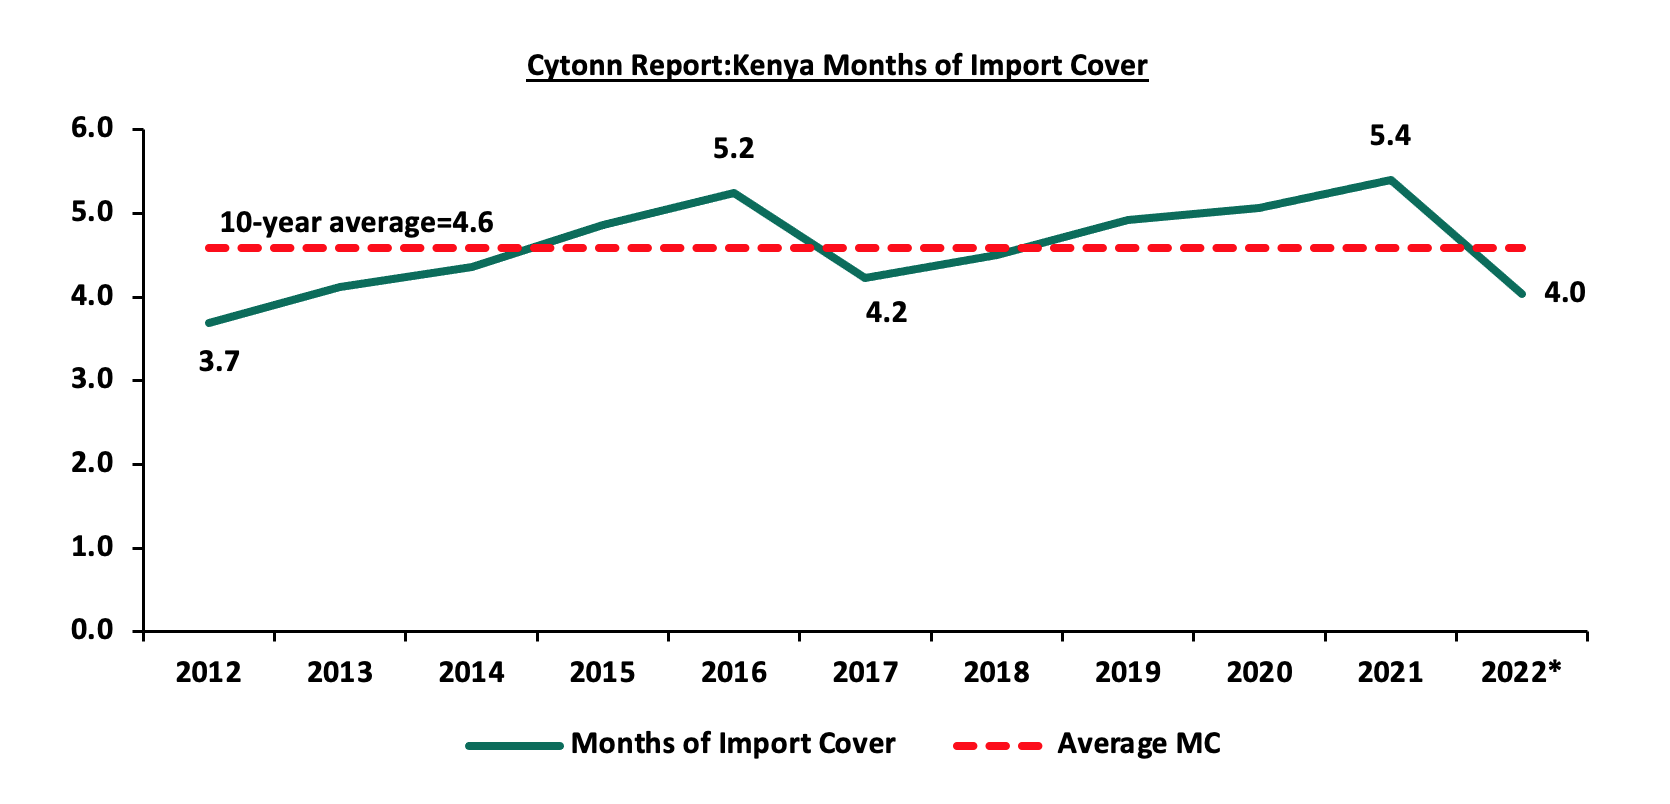
*Figure as of November 2022
Weekly Highlights:
- October 2022 Inflation
The y/y inflation for the month of October 2022 increased to 9.6%, from the 9.2% recorded in September 2022, higher than our expectations mainly driven by the elevated food and fuel prices. The table below shows a summary of both the year on year and month on month commodity groups’ performance:
|
|
Cytonn Report: Major Inflation Changes – October 2022 |
||
|
Broad Commodity Group |
Price change m/m (October- 22/Sep-22) |
Price change y/y (October-22/ October-21) |
Reason |
|
Food & Non-Alcoholic Beverages |
1.4% |
15.8% |
The m/m increase was mainly contributed by increase in prices of potatoes (irish), sugar and beans. The increase was however mitigated by a decline in prices of cooking oil (salad) and carrots |
|
Housing, Water, Electricity, Gas and other Fuel |
0.5% |
7.1% |
The m/m increase was as a result of increase in prices of 50Kw and 200 Kw electricity units. The increase was however mitigated by the decrease in the prices of Kerosene |
|
Transport Cost |
1.0% |
11.6% |
The m/m increase was as a result of increase in matatu fares, taxi fares among others. However, the prices of diesel and petrol dropped but were still above October 2021 prices |
|
Overall Inflation |
0.9% |
9.6% |
The m/m increase was driven by a 1.4% increase in food & non-alcoholic beverages coupled with a 0.5% increase in housing, water, electricity, gas and other fuels |
Source: Kenya National Bureau of Statistics (KNBS)
We expect the inflationary pressures to remain elevated primarily owing to the high fuel and food prices. Further, we expect that fuel prices will remain elevated owing to the Organization of the Petroleum Exporting Countries (OPEC) decision to lower their production target by 2 million barrels per day which will affect global oil supply as well the partial removal of the fuel subsidy which we expect to be completely eliminated in the coming months. Additionally, we expect food prices to remain elevated, given the uneven weather patterns and drought that have reduced the country’s food security. Key to note is that the Monetary Policy Committee raised the Central Bank Rate to 8.25%, from the previous 7.50% with the aim of anchoring the inflation rate which has continued to increase over the last nine months. Despite the monetary stance, we still believe that the inflationary pressures are due to external shocks and a decline is largely pegged on how soon global supply chains stabilize.
- Stanbic Bank’s September 2022 Purchasing Manager’s Index (PMI)
During the week, Stanbic Bank released its monthly Purchasing Manager’s Index (PMI), highlighting that the index for the month of October dropped to 50.2 from 51.7 recorded in September 2022, a seven-month high. Key to note, the drop was largely attributable to the rising costs of living leading to slow growth in demand for consumer goods which consequently led to slowdown in sales and reduced output in the production. The chart below summarizes the evolution of PMI over the last 24 months.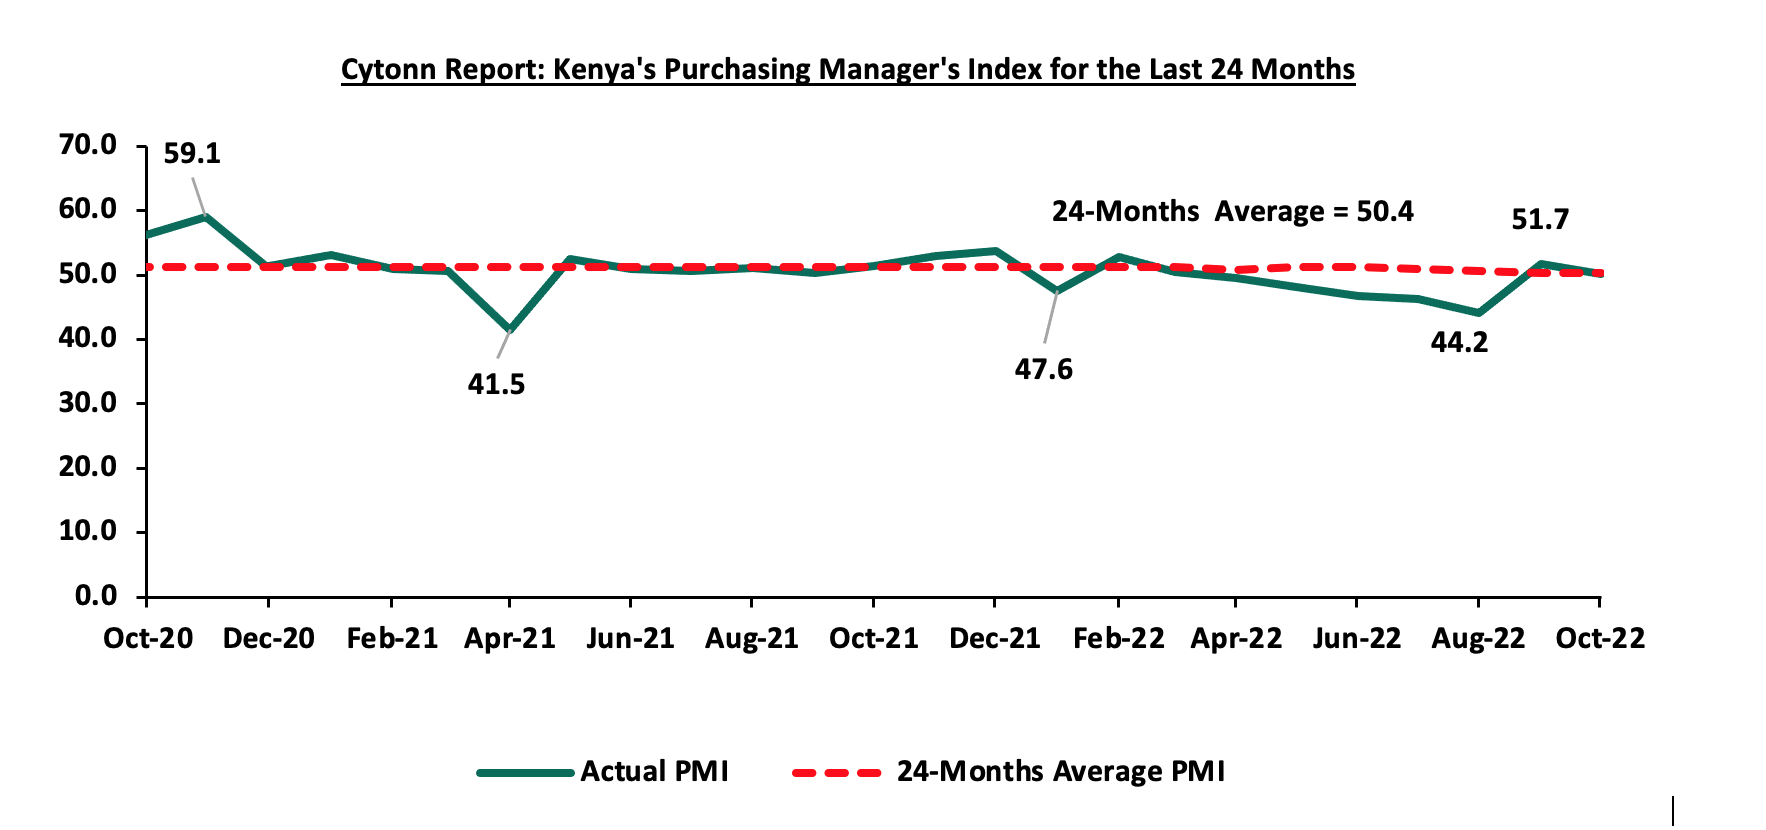
*** Key to note, a reading above 50.0 signals an improvement in business conditions, while readings below 50.0 indicate a deterioration.
Going forward, we expect the general business environment to remain subdued in the short term mainly as a result of the high cost of living brought on by the elevated inflationary pressures consequently pushing the prices of commodities. With fuel being a major input cost to many businesses, we expect the high global fuel prices to further deteriorate the business conditions in the country, given the partial removal of the fuel subsidy which will subsequently increase the cost of production.
Monthly Highlights:
-
- Stanbic Bank released its monthly Purchasing Manager’s Index (PMI), highlighting that the index for the month of September rose to 51.7 from 44.2 recorded in August 2022, pointing towards an improvement in the business conditions following a peaceful general election. For more information, please see our Cytonn Weekly #40/2022,
- The National Treasury gazettedthe revenue and net expenditures for the first quarter of FY’2022/2023, closing 30th September 2022, highlighting that the total revenue collected for the quarter ended September 2022 amounted to Kshs 486.0 bn, equivalent to 90.8% of the prorated estimates of Kshs 535.4 bn for the first three months of FY’2022/2023. For more information, please see our Cytonn Weekly #41/2022, and,
- According to the International Monetary Fund (IMF)Regional Economic Outlook Report October 2022, the Sub-Saharan Region’s economic growth rate is projected to grow at 3.6% in 2022 and rise marginally to 3.7% in 2023, down from 4.7% recorded in 2021. For more information, please see our Cytonn Weekly #43/2022.
Rates in the Fixed Income market have remained relatively stable due to the relatively ample liquidity in the money market. The government is 21.2% behind its prorated borrowing target of Kshs 203.0 bn having borrowed Kshs 160.0 bn of the Kshs 581.7 bn borrowing target for the FY’2022/2023. We expect sustained gradual economic recovery as evidenced by the revenue collections of Kshs 486.0 bn in the FY’2022/2023, equivalent to a 22.7% of its target of 2.1 tn. Despite the performance, we believe that the projected budget deficit of 6.2% is relatively ambitious given the downside risks and deteriorating business environment occasioned by high inflationary pressures. We however expect the support from the IMF and World Bank to finance some of the government projects and thus help maintain a stable interest rate environment since the government is not desperate for cash. Owing to this, our view is that investors should be biased towards short-term fixed-income securities to reduce duration risk
Market Performance:
During the month of October, the equities market recorded mixed performance, with NASI and NSE 25 gaining by 0.3% and 0.6%, respectively while NSE 20 declined by 2.3%. The equities market performance was driven by gains recorded by large cap stocks such as EABL, NCBA Group, and Standard Chartered Bank of Kenya (SCBK) of 17.8%, 4.0%, and 1.1%, respectively. The gains were however weighed down by losses recorded by other large cap stocks such as KCB Group, Diamond Trust Bank (DTB-K), and BAT of 9.2%, 4.5%, and 2.3%, respectively.
During the week, the equities market was on a downward trajectory with NASI, NSE 20 and NSE 25 declining by 0.7%, 0.3%, and 0.9%, taking their YTD performance to losses of 23.7%, 12.5%, and 17.7%, for NASI, NSE 20 and NSE 25, respectively. The equities market performance was mainly driven by losses recorded by banking stocks such as NCBA Group and Equity Group of 3.6% and 2.4%, respectively and manufacturing stocks such as EABL and BAT of 1.6% and 1.5%, respectively. The losses were however mitigated by gains recorded by other large cap stocks such as ABSA Bank and Bamburi of 2.2% and 1.2% respectively.
Equities turnover declined by 37.5% in the month of October to USD 48.7 mn, from USD 78.0 mn recorded in September 2022. Additionally, foreign investors remained net sellers, with a net selling position of USD 19.2 mn, compared to September’s net selling position of USD 19.4 mn.
During the week, equities turnover declined by 36.9% to USD 8.3 mn from USD 13.2 mn recorded the previous week, taking the YTD turnover to USD 712.5 mn. Additionally, foreign investors remained net sellers, with a net selling position of USD 0.8 mn, from a net selling position of USD 5.8 mn recorded the previous week, taking the YTD net selling position to USD 184.0 mn.
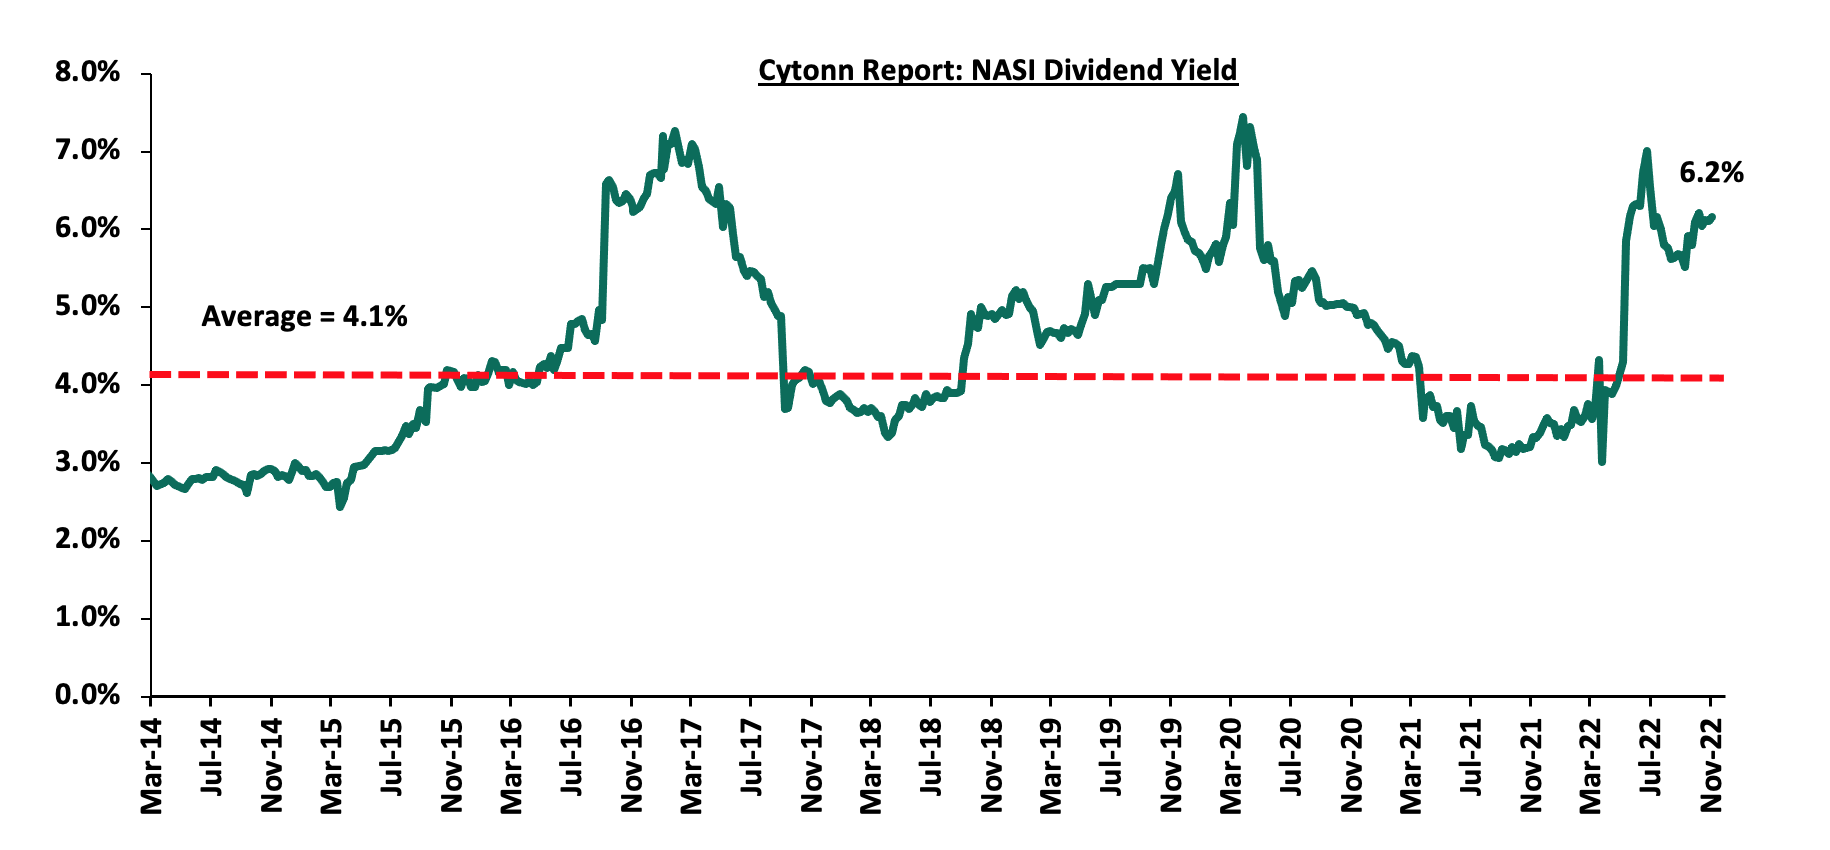
The market is currently trading at a price to earnings ratio (P/E) of 6.8x, 46.3% below the historical average of 12.6x, and a dividend yield of 6.2%, 2.1% points above the historical average of 4.1%. Key to note, NASI’s PEG ratio currently stands at 0.9x, an indication that the market is undervalued relative to its future growth. A PEG ratio greater than 1.0x indicates the market may be overvalued while a PEG ratio less than 1.0x indicates that the market is undervalued.
The charts below indicate the historical P/E and dividend yields of the market;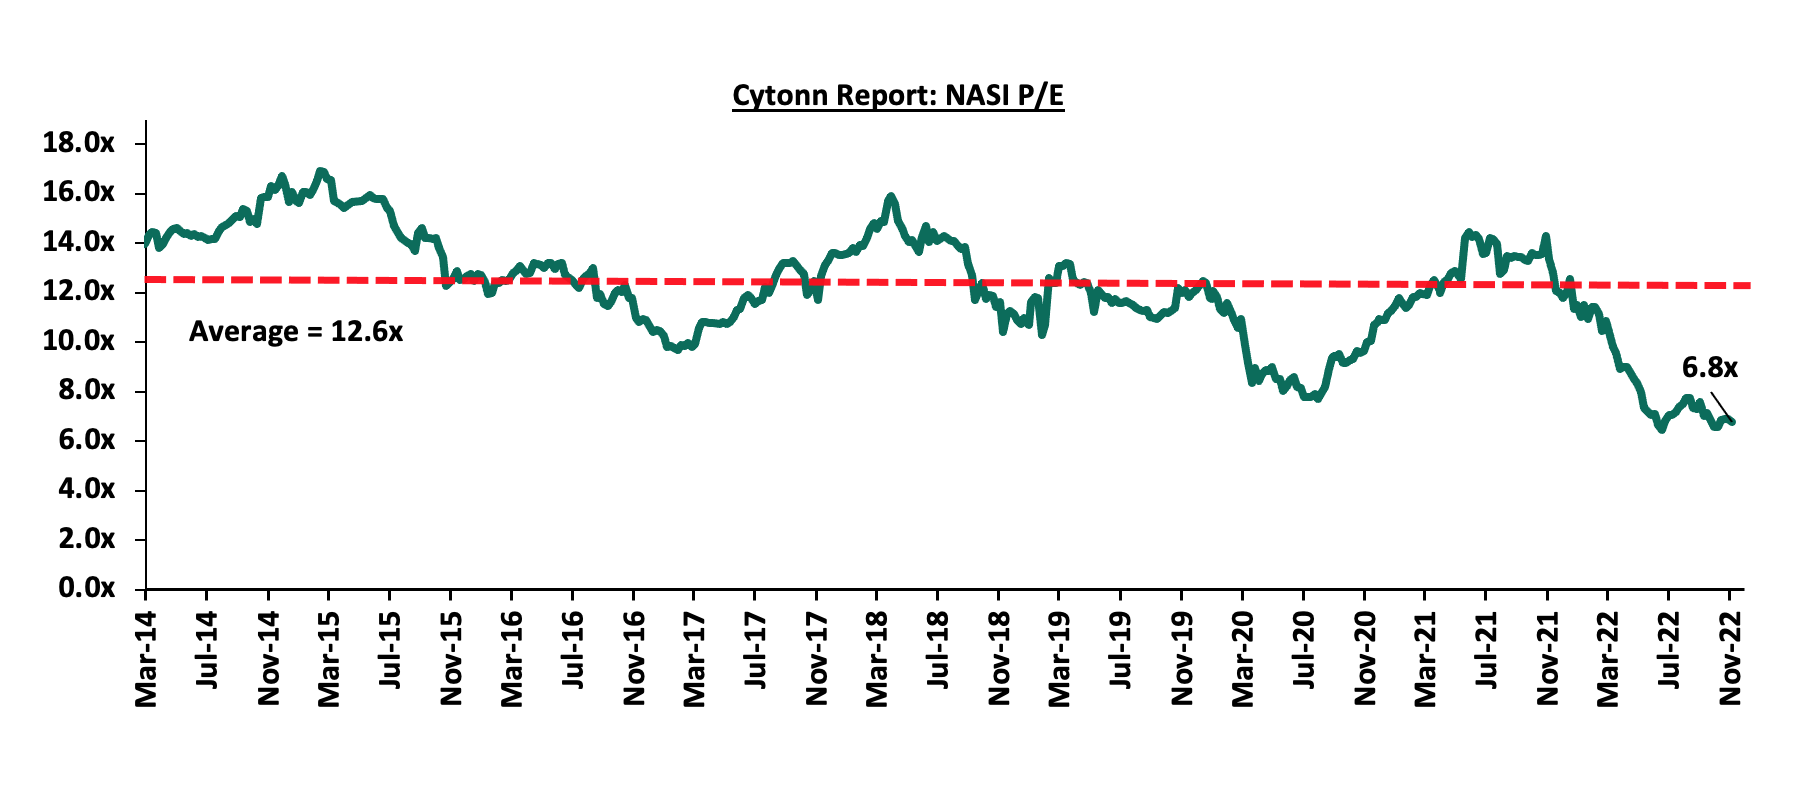
Monthly Highlights:
- The Insurance Regulatory Authority of Kenya (IRA) released the Quarterly Insurance Industry Report for the period ending 30th June 2022 highlighting that the industry’s gross premiums rose by 13.2% to Kshs 163.1 bn in Q2’2022 from Kshs 144.0 bn in Q2’2021, with the general insurance business contributing 56.7% of the industry’s premium income, a 2.6% points decline from the 59.3% contribution witnessed in Q2’2021. For more information, please see our Cytonn Weekly #40/2022, and Cytonn H1’2022 Listed Insurance Report,
- Safaricom Group Plc announced the official launch of Safaricom Telecommunications Ethiopia (STE), an international consortium that will offer telecommunication services in Ethiopia. The official launch and roll out of services in Addis Ababa comes after the Safaricom-led consortium won the licensing bid valued at Kshs 91.6 bn (USD 800.0 mn) in 2021. For more information, please see our Cytonn Weekly #40/2022,
- Diageo UK, through Diageo Kenya, announced that it served a notice on East African Breweries Plc (EABL) of its intention to acquire an additional 15.0% to bring its shareholding stake in EABL to 65.0%, translating to an additional 118,394,897.0 ordinary shares at an average price of Kshs 192.00, through a tender offer made to minority shareholders. For more information please see our Cytonn Weekly #41/2022,
- Fitch Ratings, a global credit rating agency, affirmed Sanlam Life Insurance Limited’s (Sanlam Life), an Insurance provider in Kenya, an Insurer Financial Strength (IFS) rating and Issuer Default Rating (IDR) at ‘B’ and its holding Company Sanlam Kenya Plc’s (Sanlam Kenya) IDR at ‘B-‘. For more information please see our Cytonn Weekly #41/2022,
- Global Company Ratings (GCR), an affiliate of Moody’s Investors Services, affirmed Centum Investments long and short-term issuer ratings of ‘A+’ and ‘AI’ respectively with a stable outlook. However, its Real Estate development subsidiary has a rating of ‘BBB+’ with a negative outlook. For more information, please see our Cytonn Weekly #42/2022, and,
The Cabinet Secretary for the National Treasury and Planning, through the Capital Markets Authority (CMA) announced the gazettement of the amended The Capital Markets (Investment-Based Crowdfunding) Regulation 2022, highlighting that the platform operator’s annual regulatory fee was reduced by 50.0% to Kshs 100,000.0 from Kshs 200,000.0, in a bid to increase the access to funding for the Micro, Small and Medium Enterprises (MSMEs), startups and businesses while protecting investor’s interest. For more information, please see our Cytonn Weekly #43/2022.
Universe of coverage
|
Company |
Price as at 28/10/2022 |
Price as at 04/11/2022 |
w/w change |
m/m change |
YTD Change |
Year Open 2022 |
Target Price* |
Dividend Yield |
Upside/ Downside** |
P/TBv Multiple |
Recommendation |
|
KCB Group*** |
37.7 |
37.2 |
(1.5%) |
(9.2%) |
(18.4%) |
45.6 |
53.5 |
8.1% |
52.1% |
0.6x |
Buy |
|
Jubilee Holdings |
230.0 |
215.0 |
(6.5%) |
(6.1%) |
(32.1%) |
316.8 |
305.9 |
0.5% |
42.8% |
0.4x |
Buy |
|
Co-op Bank*** |
11.8 |
11.8 |
(0.4%) |
(0.4%) |
(9.6%) |
13.0 |
15.6 |
8.5% |
41.3% |
0.7x |
Buy |
|
Kenya Reinsurance |
1.9 |
1.9 |
(1.1%) |
(2.5%) |
(17.9%) |
2.3 |
2.5 |
5.3% |
38.8% |
0.2x |
Buy |
|
Equity Group*** |
46.8 |
45.7 |
(2.4%) |
0.5% |
(13.4%) |
52.8 |
59.7 |
6.6% |
37.1% |
1.1x |
Buy |
|
ABSA Bank*** |
11.2 |
11.4 |
2.2% |
(1.7%) |
(3.0%) |
11.8 |
14.9 |
1.8% |
32.5% |
1.0x |
Buy |
|
Liberty Holdings |
5.5 |
5.2 |
(5.5%) |
(7.9%) |
(26.3%) |
7.1 |
6.8 |
0.0% |
29.8% |
0.4x |
Buy |
|
I&M Group*** |
16.7 |
17.0 |
1.8% |
0.0% |
(20.6%) |
21.4 |
20.5 |
8.8% |
29.6% |
0.4x |
Buy |
|
Diamond Trust Bank*** |
48.2 |
48.3 |
0.3% |
(4.5%) |
(18.8%) |
59.5 |
59.5 |
6.2% |
29.4% |
0.2x |
Buy |
|
Sanlam |
8.5 |
9.3 |
9.9% |
(14.3%) |
(19.1%) |
11.6 |
11.9 |
0.0% |
27.5% |
1.0x |
Buy |
|
Britam |
5.6 |
5.8 |
2.5% |
(6.4%) |
(23.8%) |
7.6 |
7.1 |
0.0% |
23.6% |
1.0x |
Buy |
|
Standard Chartered*** |
138.8 |
136.8 |
(1.4%) |
1.1% |
5.2% |
130.0 |
155.0 |
10.2% |
23.6% |
0.9x |
Buy |
|
NCBA*** |
32.3 |
31.1 |
(3.6%) |
4.0% |
22.2% |
25.5 |
35.2 |
6.4% |
19.5% |
0.7x |
Accumulate |
|
CIC Group |
2.0 |
2.0 |
1.0% |
(1.0%) |
(8.3%) |
2.2 |
2.3 |
0.0% |
16.6% |
0.7x |
Accumulate |
|
Stanbic Holdings |
100.0 |
100.0 |
0.0% |
(3.8%) |
14.9% |
87.0 |
99.9 |
9.0% |
8.9% |
0.8x |
Hold |
|
HF Group |
3.0 |
3.3 |
7.3% |
(10.1%) |
(14.5%) |
3.8 |
3.5 |
0.0% |
7.7% |
0.2x |
Hold |
|
Target Price as per Cytonn Analyst estimates **Upside/ (Downside) is adjusted for Dividend Yield ***For Disclosure, these are stocks in which Cytonn and/or its affiliates are invested in
|
|||||||||||
We are “Neutral” on the Equities markets in the short term due to the current adverse operating environment and huge foreign investor outflows, and, “Bullish” in the long term due to current cheap valuations and expected global and local economic recovery.
With the market currently trading at a discount to its future growth (PEG Ratio at 0.9x), we believe that investors should reposition towards value stocks with strong earnings growth and that are trading at discounts to their intrinsic value. We expect the current high foreign investors sell-offs to continue weighing down the economic outlook in the short term.
- Industry Report
During the month, the following industry report was released and the key take-outs were as follows:
|
# |
Theme |
Report |
Key Take-outs |
|
1 |
General Real Estate |
Q2’2022 GDP Report by the Kenya National Bureau of Statistics (KNBS) |
· The Real Estate Sector grew by 5.5% in the period under review, 0.6% and 1.9% points lower than the 6.1% and 7.4% growth recorded in Q1’2022 and Q2’2021, respectively, · The Construction Sector grew by 5.8% in Q2’2022, 1.0% point lower than the 6.8% growth recorded in Q2’2021. The performance was also a 0.6% q/q decline, from the 6.4% growth recorded in Q1’2022, and, · The Accommodation and Restaurant services grew by 22.0% in Q2’2022, from the 90.1% and 56.2% growth recorded in Q2’2021 and Q1’2022, respectively. For more information, see Cytonn Weekly #41/2022. |
- Residential Sector
During the week, Gulf African Bank signed a partnership deal with property developer Superior Homes, to provide mortgages to potential home buyers at an 11.8% interest rate. The Shariah-compliant mortgage finance will be accessed within 48 hours of approval to investors seeking to purchase housing units developed by Superior Homes in Pazuri at Vipingo in Kilifi County, and, Green Park in Athi River in Machakos County. Additionally, potential buyers will be provided with up to 90.0% of financing from the bank, with a repayment period of up to 20 years. Other features of the deal include mortgage transfers or takeovers from other financial institutions, diaspora mortgages, outright purchases for new homebuyer, and equity release arrangements which will be accessible to both Muslims and non-Muslim investors. We expect the partnership to spark growth of mortgage uptake and boost urban homeownership for more Kenyans, with the interest rate of 11.8% is estimated to be lowest home financing rate offered by a Shariah-compliant bank in Kenya.
Further, we expect such partnerships to spur the uptake of mortgages in the country which continue to remain relatively low owing to various setbacks such as; i) high interest rates and high deposit requirements, ii) increasing property prices making it difficult for buyers to access mortgages, iii) low-income earning levels that can sustain servicing of loans, and, iv) exclusion of the those in informal sector due to lack of credit information. In support of this, Central Bank of Kenya’s Bank Supervision Annual Report 2021 highlights that mortgage loans accounts recorded a 0.9% decline to 26,723 in 2021 from 26,971 recorded in 2020 with an adult population of more than 24.0 mn in Kenya, as shown below;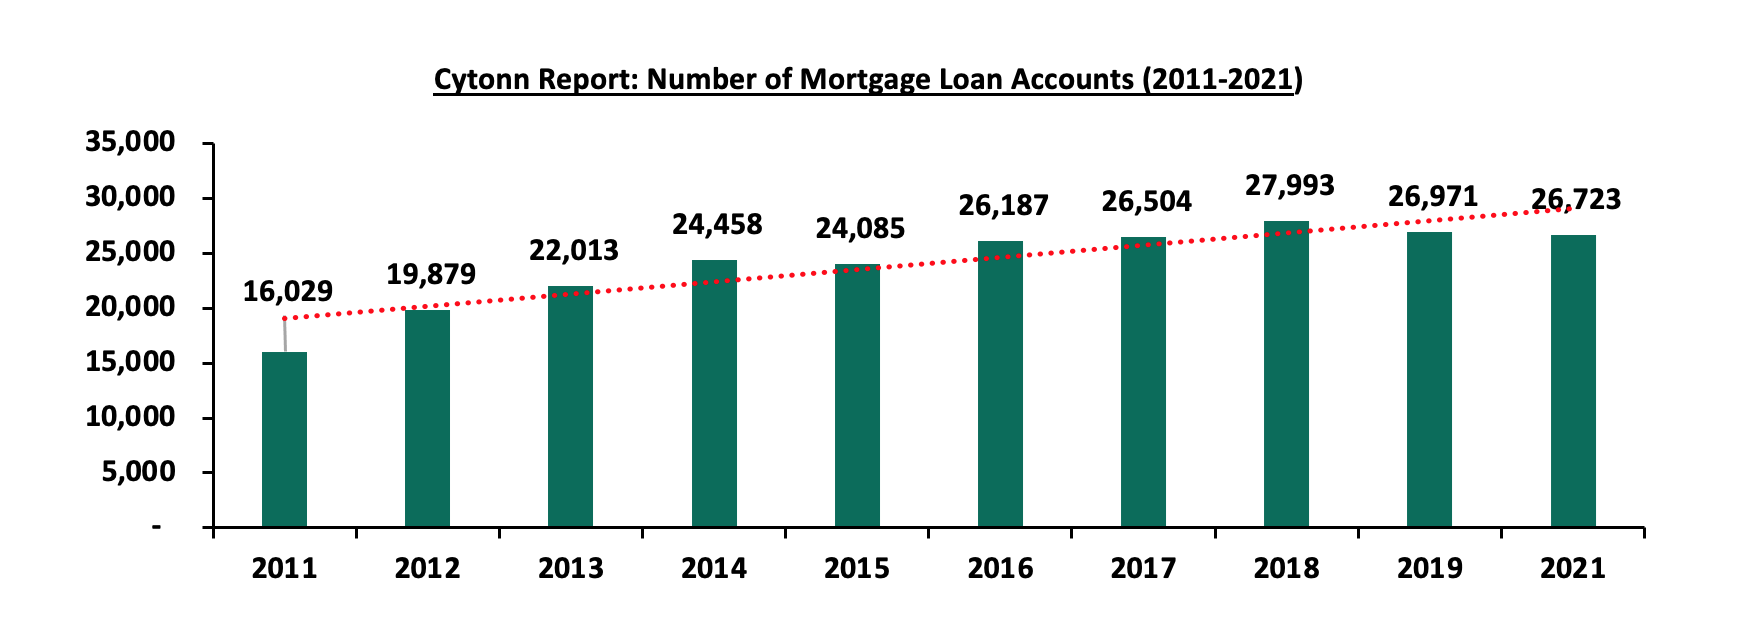
Source: Central Bank of Kenya
Given the above, Kenya’s mortgage to GDP continues to lag behind at approximately 2.2% compared to countries such as South Africa which is at approximately 23.3% as of 2021, as shown below;
Source: Centre for Affordable Housing Africa
Further, urban home ownership rate in Kenya still remains low at approximately 21.3%, indicating that 78.7% of the total population are property renters compared to other nations such as South Africa and Ghana which boasts rates of approximately 53.0% and 47.2%, respectively. The underperformance is mainly attributed to unaffordability and inadequate alternative housing finance options. The graph below shows homeownership percentages for different countries in comparison to Kenya;
Source: Cytonn Research
Other notable highlights during the month include;
- Student housing property developer Acorn Holdings, announced plans to repay loans worth Kshs 800.2 mn, which is a portion of its outstanding Kshs 5.7 bn green bond, through an early redemption option. For more information, see Cytonn Weekly #43/2022,
- Shelter Afrique, a Pan African housing finance institution based in Nairobi’s Upperhill district, announced plans to develop a sovereign lending product which will boost its traditional lending products to finance both the demand and supply sides of the housing sector in Africa. For more information, see Cytonn Weekly #43/2022,
- Property developer Unity homes completed 64 units out of 640 units of its Kshs 5.4 bn housing project dubbed Unity East, which sits on a 10.4-acre piece of land at Tatu City in Ruiru Sub - County. For more information, see Cytonn Weekly #42/2022,
- President William Ruto floated a mortgage plan that will allow tenants to own homes under the social housing tenant purchase scheme, and, affordable housing initiative, through monthly rental payments. The President also announced plans to commission an affordable housing project consisting of 5,000 units in Homa Bay County with a start date of November 2022. For more information, see Cytonn Weekly #40/2022.
- Retail Sector
During the week, Naivas Supermarket opened two new outlets located at Meru’s Greenwood City Mall, and at Kahawa Sukari opposite Engen Petrol Station. This brings the retailer’s number of operating outlets countrywide to 88. Naivas also plans to open two more outlets at Parklands and Ruai town by the end of the year, signifying its rapid expansion drive to maintain market dominance. The move by Naivas to open up the new branches is driven by; i) the increased demand for goods and services which has further been propelled by the onset of the festive season, ii) the strategic location of the outlets thus servicing multiple areas iii) the availability of new market opportunities given that the Meru branch is the first in the Mount Kenya region, and, iv) the need to keep up with the rapid market competition from other retailers such as QuickMart Supermarket. The table below shows the number of stores operated by key local and international retail supermarket chains in Kenya;
|
Cytonn Report: Main Local and International Retail Supermarket Chains |
|||||||||||
|
Name of retailer |
Category |
Branches as at FY’ 2018 |
Branches as at FY’ 2019 |
Branches as at FY’ 2020 |
Branches as at FY’ 2021 |
Branches opened in 2022 |
Closed branches |
Current branches |
Branches expected to be opened |
Projected branches FY’2022 |
|
|
Naivas |
Local |
46 |
61 |
69 |
79 |
9 |
0 |
88 |
2 |
90 |
|
|
QuickMart |
Local |
10 |
29 |
37 |
48 |
3 |
0 |
51 |
0 |
51 |
|
|
Chandarana |
Local |
14 |
19 |
20 |
23 |
1 |
1 |
24 |
4 |
28 |
|
|
Carrefour |
International |
6 |
7 |
9 |
16 |
0 |
0 |
16 |
0 |
16 |
|
|
Cleanshelf |
Local |
9 |
10 |
11 |
12 |
0 |
0 |
12 |
0 |
12 |
|
|
Tuskys |
Local |
53 |
64 |
64 |
3 |
0 |
61 |
3 |
0 |
3 |
|
|
Game Stores |
International |
2 |
2 |
3 |
3 |
0 |
0 |
3 |
0 |
3 |
|
|
Uchumi |
Local |
37 |
37 |
37 |
2 |
0 |
35 |
2 |
0 |
2 |
|
|
Choppies |
International |
13 |
15 |
15 |
0 |
0 |
13 |
0 |
0 |
0 |
|
|
Shoprite |
International |
2 |
4 |
4 |
0 |
0 |
4 |
0 |
0 |
0 |
|
|
Nakumatt |
Local |
65 |
65 |
65 |
0 |
0 |
65 |
0 |
0 |
0 |
|
|
Total |
|
257 |
313 |
334 |
186 |
13 |
179 |
199 |
6 |
205 |
|
Source: Cytonn Research
In terms of performance per region, Nairobi where Kahawa Sukari is located recorded the highest average rental yield of 7.8% in 2022, 1.0% points higher than the market average of 6.8%, whereas Mount Kenya where Meru is located recorded a sharp decline in the average rental yield to 5.3% in 2022 from 7.9% in 2021. The decline was mainly on the back of the addition of Greenwood City Mall in Meru into the market which weighed down the overall occupancy rates in the region. We however expect the rates to improve gradually as various retailers such as Naivas take up spaces in the area. The performance of the key urban centres in Kenya is as summarized below:
|
Cytonn Report: Kenya Retail Performance 2022 |
|||
|
Region |
Rent (Kshs per SQFT) 2022 |
Occupancy Rate 2022 |
Rental yield 2022 |
|
Nairobi |
173 |
75.9% |
7.8% |
|
Nakuru |
73 |
81.3% |
7.4% |
|
Mombasa |
110 |
84.0% |
7.0% |
|
Kisumu |
108 |
79.7% |
7.0% |
|
Eldoret |
132 |
86.1% |
6.6% |
|
Mount Kenya |
138 |
56.7% |
5.3% |
|
Average |
122 |
77.3% |
6.8% |
Source: Cytonn Research
Overall, we expect Kenya’s retail sector performance to continue being shaped by; i) continuous expansion by retailers in the market, ii) improved accessibility on the back of improved infrastructure developments, iii) enhanced ease of doing business, and, iv) rapid population and urbanization growth rates driving the demand for goods and services. However, the performance of the retail sector continues to be weighed down by the rapid developments in the e-commerce sector, and the existing oversupply of retail spaces at 1.7 mn SQFT in Kenya, which in turn affect occupancy rates and overall return to investors.
- Hospitality Sector
During the week, the United Nations (UN) through its Director General, Zainab Hawa, announced plans to break ground an ultra-modern conference facility worth USD 278.9 mn (Kshs 33.9 bn) in Gigiri. Proposed during the 76th United Nations (UN) general assembly held in December 2021, the project aims to expand the conference facility’s capacity to 9,000 sitting participants from the existing 3,325 total seats, and is expected to be completed within 18 months. Additionally, this will be an upgrade of the current conference facility which currently serves approximately 3,000 meetings a year and about 8,000 over a two-year period, when the UNEP and UN-Habitat biannual assemblies take place. In support of this, the Kenyan government has welcomed the move to expand the conference facility, by availing more land for undertaking the project. Upon completion, the added capacity of the conference centre will allow for more events to be held in the complex thereby boosting Nairobi’s position as a global and regional hub for Meetings, Incentives, Conferences, and Exhibitions (MICE).
Other notable highlights during the month include;
- Crowne Plaza Nairobi was voted the best luxury airport hotel in Africa during the 16th World Luxury Hotel Awards 2022, thereby becoming Kenya’s first airport hotel to win the award, while Kenya emerged as Africa’s best MICE destination in the in the 3rd annual World MICE Awards. For more information, see Cytonn Weekly #43/2022, and,
- Nairobi was voted as Africa’s leading business travel destination in the 29th World Travel Awards which was held at the Kenyatta International Convention Centre (KICC). Nairobi has received the award for the fourth consecutive year signifying the continued confidence in the city as a vibrant business destination. For more information, see Cytonn Weekly #42/2022.
- Statutory Reviews
During the month;
- President William Ruto announced plans to exempt all first-time home buyers from paying stamp duty. This comes two years after the Stamp Duty Act was amended in 2020 to allow exemptions for first time home buyers of only approved affordable housing units by the government. For more information, see Cytonn Weekly #43/2022, and,
- The Retirement Benefits Authority (RBA) announced plans to have pension managers publish data on the number of Kenyans who use their retirement savings to purchase homes by January 2023, after having reviewed the Retirement and Benefits Act. For more information, see Cytonn Weekly #41/2022.
- Infrastructure
During the week, the national government in partnership with the African Development Bank (AfDB), announced plans to construct a highway linking West Pokot and Turkana counties with South Sudan. The construction of the road whose distance, construction cost and period is yet to be disclosed, will be done by the Kenya National Highway Authority (KeNHA). Additionally, KENHA also disclosed plans to upgrade the Nakuru-Marigat-Loruk-Barpelo-Marich Pass Highway. Upon completion, the roads are expected to;
- Enhance seamless transport services,
- Reduce regional imbalance in the country,
- Promote Real Estate developments through improved accessibility, and,
- Boost investment returns on the back of increased property rates.
Given that infrastructure is a vital necessity for the country’s development and growth, we expect the government to continue initiating and implementing more projects within the country, guided by various factors such as, i) continued initiation of project partnership strategies such as PPPs and Joint Ventures (JVs), ii) floating of infrastructure bonds in order to raise capital for financing projects, and, iii) annual budget allocations with the sector having been allocated Kshs 212.5 bn in the FY’2022/23, which is 6.4% of the total Kshs 3.3 tn budget. Other ongoing infrastructure projects include but not limited to; the Nairobi Western Bypass, Mombasa-Mariakani highway, and the Sagana-Marua highway.
Additionally, during the month, President William Ruto announced plans to complete the construction of over 200.0 km of roads covering Homa Bay County and its environs. The roads include; Mbita-Kiabuya-Magunga-Sori road, Kanyadhiang’-Pala-Kandiege-Kadel road, and, the Karabok-Adiedo road, whose construction had stalled owing to inadequate financing. For more information, see Cytonn Weekly #40/2022.
- Real Estate Investment Trusts (REITs)
During the week, the Capital Markets Authority (CMA) approved the listing of the Local Authorities Pension Trust (LAP Trust) Imara I-REIT, on the Nairobi Securities Exchange (NSE) Main Investment Market under the Restricted Sub-segment. This implies that Laptrust will hold 100.0% of the Imara I-REIT securities with no initial offer to the public. The I-REIT will be listed as a close-ended fund capped at Kshs 20.0 per unit, with a total of 346.2 mn units worth Kshs 6.9 bn. The Imara I-REIT becomes the 3rd I-REIT in Kenya after the listed ILAM Fahari I-REIT launched in 2015, and the Acorn I-REIT launched in 2021 and trades on the Unquoted Securities Platform (USP).
LAP Trust becomes the first pension fund in the country to issue an I-REIT through the Nairobi Securities Exchange (NSE) and will be managed by Sterling REIT Asset Management Limited, and with Co-operative Bank Kenya Limited as the Trustee. Properties to be held under Imara I-REIT portfolio include; CPF Metro Park, CPF House, Pension Towers, Freedom Heights which encompasses a mall and apartments, Man Apartment and Nova Eldoret.
The minimum investment amount for the I-REIT will be capped at Kshs 5.0 mn implying that that the maximum number of retail and institutional investors that can invest into the I-REIT is 1,385, assuming that each investor makes an investment of Kshs 5.0 mn. This is significantly lower than the maximum number of retail and institutional investors accorded by the Stanlib Fahari I-REIT at 180,673 when it listed at a value of Kshs 3.6 bn with a minimum investment amount of Kshs 20,000.
The listing and eventual sale of Imara REIT units to the public is commendable given that REITs offer various benefits such as low cost exposure to Real Estate, tax exemption, and diversification among many others. However, their performance has been subdued over time owing to various setbacks such as; i) general lack of knowledge and interest on the financing instrument, ii) lengthy approval processes discouraging those interested in investing in it, iii) high minimum capital requirements for a trustee of Kshs 100.0 mn which essentially limits the role to banks, and, iv) high minimum investments amounts for D-REITs set at Kshs 5.0 mn thus locking out many potential investors. Similarly, we expect Imara’s optimum performance to be weighed down by the aforementioned challenges, if not addressed by the regulatory authority. On the brighter side, it’s listing will;
- Accord LAP Trust an opportunity to build investor confidence in its product and brand,
- Build a performance track record, and,
- Acknowledge the critical role held by REITs towards the achievement of government’s housing agenda as well as democratization of investment opportunities.
In the Nairobi Stock Exchange, ILAM Fahari I-REIT closed the week trading at an average price of Kshs 6.9 per share. The performance represented a 10.2% Year-to-Date (YTD) increase. However, the performance also represented a 65.5% Inception-to-Date (ITD) decline from Kshs 20.0. The graph below shows Fahari I-REIT’s performance from November 2015 to 4th November 2022: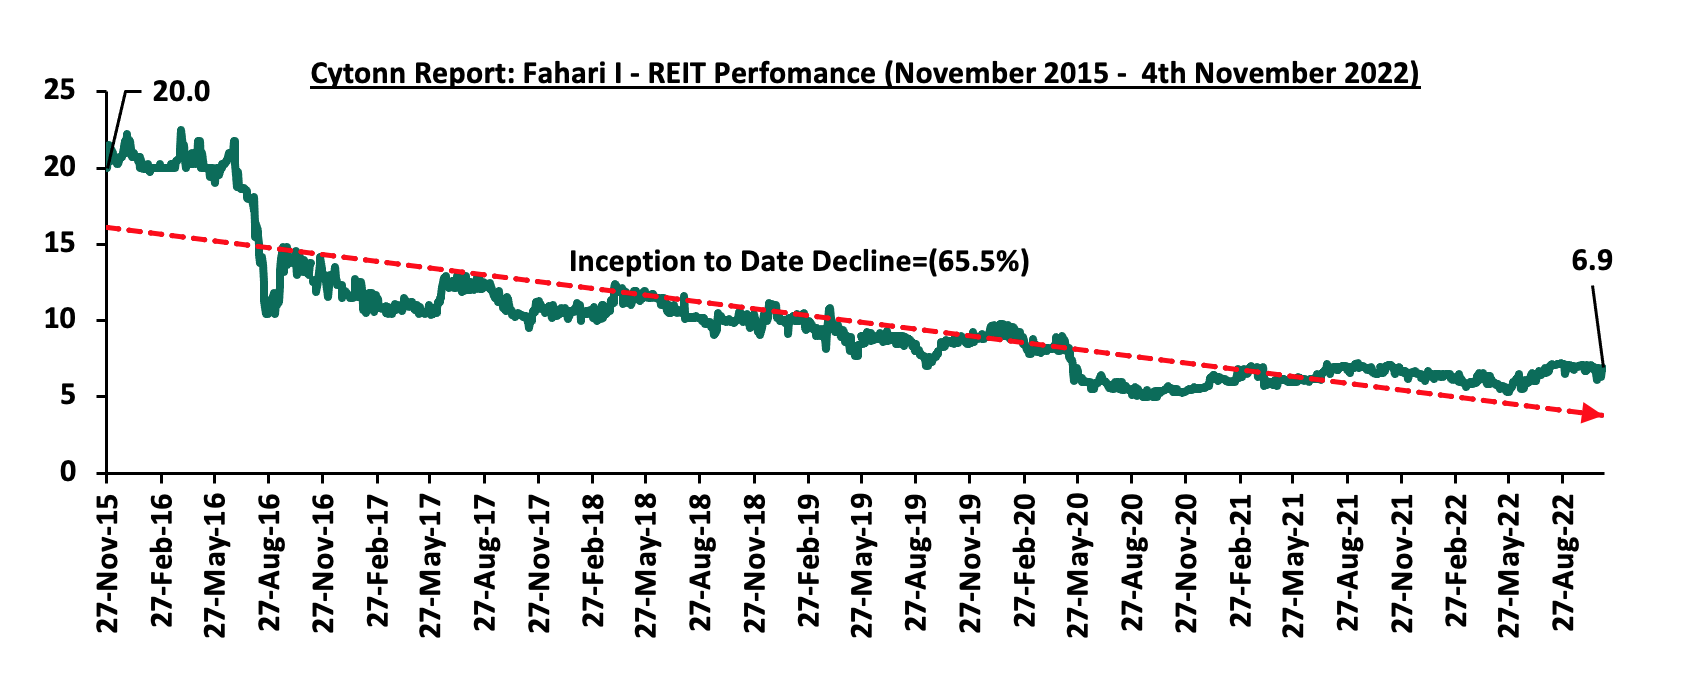
In the Unquoted Securities Platform, Acorn D-REIT and I-REIT closed the week at Kshs 23.8 and Kshs 20.8 per unit, respectively, as at 7th October 2022. The performance represented a 19.0% and 4.0% gain for the D-REIT and I-REIT, respectively, from the Kshs 20.0 inception price. The volumes traded for the D-REIT and I-REIT came in at 5.5 mn and 14.5 mn shares, respectively, with a turnover of Kshs 116.9 mn and Kshs 300.3 mn, respectively, since its Inception in February 2021.
Kenya’s Real Estate sector is expected to be on an upward trajectory driven by; i) efforts to provide mortgage financing in the housing market, ii) rapid expansion in the retail sector, iii) continued growth in the hospitality sector, iv) recognition of Kenya as an impressive tourism destination, v) implementation of policies aimed at streamlining activities in the property market, and, vi) initiation of various infrastructure projects that will promote investments within the country. However, the performance of the Real Estate sector is expected to be weighed down by inflationary pressures in the economy, low investor appetite in listed Real estate due to high minimum investment amounts, and, oversupply of physical space in select sectors.
Unit Trust Funds (UTFs) are Collective Investment Schemes that pool funds from different investors and are managed by professional fund managers. The fund managers invest the pooled funds in a portfolio of securities with the aim of generating returns to meet the specific objectives of the fund. Following the release of the Capital Markets Authority (CMA) Quarterly Statistical Bulletin-Q3’2022, we analyze the performance of Unit Trust Funds, as the total Assets Under Management (AUM) have been steadily increasing and they are among the most popular investment options in the Kenyan market. We will further analyze the performance of Money Market Funds, a product under Unit Trust Funds. In our previous focus on Unit Trust Funds, we looked at the Q1’2022 Unit Trust Funds Performance by Fund Managers. In this topical, we focus on the Q2’2022 performance of Unit Trust Funds where we shall analyze the following:
- Performance of the Unit Trust Funds Industry,
- Performance of Money Market Funds,
- Comparing Unit Trust Funds AUM Growth with other Markets, and,
- Recommendations
Section I: Performance of the Unit Trust Funds Industry
Unit Trust Funds are investment schemes that pool funds from investors and are managed by professional Fund Managers. The fund manager invests the pooled funds with the aim of generating returns in line with the specific objectives of the fund. The Unit Trust Funds earn returns in the form of dividends, interest income, rent and/or capital gains depending on the underlying security. The main types of Unit Trust Funds include:
- Money Market Funds – These are funds that invest in fixed income securities such as fixed deposits, treasury bills and bonds, commercial papers, etc. They are very liquid, have stable returns, and, they are suitable for risk averse investors,
- Equity Funds – These are funds which largely invest in listed securities and seek to offer superior returns over the medium to long-term by maximizing capital gains and dividend income. The funds invest in various sectors to reduce concentration risk and maintain some portion of the fund’s cash in liquid fixed income investments to maintain liquidity and pay investors if need be without losing value,
- Balanced Funds – These are funds whose investments are diversified across the Equities and the Fixed Income market. Balanced Funds offer investors long-term growth as well as reasonable levels of stability of income,
- Fixed Income Funds – These are funds which invest in interest-bearing securities, which include treasury bills, treasury bonds, preference shares, corporate bonds, loan stock, approved securities, notes and liquid assets consistent with the portfolio’s investment objective, and,
- Sector Specific Funds – These are funds that invest primarily in a particular sector or industry. The funds provide a greater measure of diversification within a given sector than may be otherwise possible for the other funds. They are specifically approved by the capital Markets Authority as they are not invested as per the set rules and regulations.
As per the Capital Markets Authority (CMA) Quarterly Statistical Bulletin-Q3’2022, the industry’s overall Assets under Management (AUM) grew by 23.1% to Kshs 145.0 bn as at the end of Q2’2022, from Kshs 117.8 bn as at the end of Q2’2021. Assets under Management of the Unit Trust Funds have grown at a 5-year CAGR of 21.2% to Kshs 145.0 bn in Q2’2022, from Kshs 55.5 bn recorded in Q2’2017. The chart below shows the growth in Unit Trust Funds’ AUM;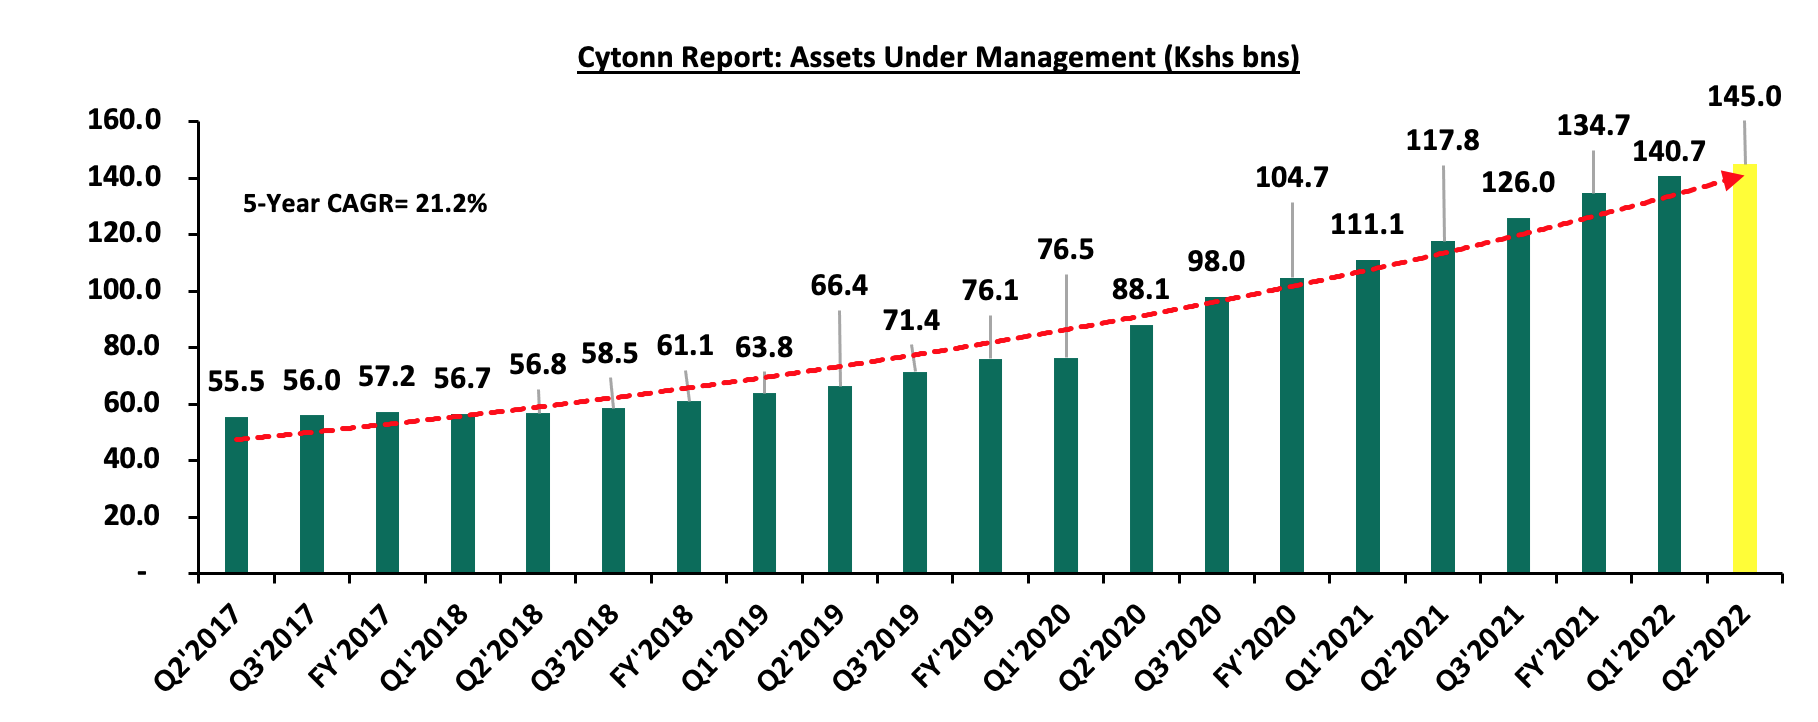
Source: Capital Markets Authority Quarterly Statistical bulletins
The growth can be largely attributed to:
- Low Investments minimums: Majority of the Unit Trust Funds Collective Investment Schemes’ (CIS) in the market require a relatively low initial investment ranging between Kshs 100.0 - Kshs 10,000.0. This has in turn made them attractive to retail and individual investors, boosting their growth,
- Increased Investor Knowledge: There has been a drive towards investor education mainly by the fund managers on the various products offered by trust funds which has meant that more people are aware and have a deeper understanding of the investment subject. As a result, their confidence has been boosted resulting to increased uptake,
- Diversified product offering: Unit Trust Funds are also advantageous in terms of providing investors with access to a wider range of investment securities through pooling of funds. This allows investors the opportunity of diversifying their portfolios which would have not been accessible if they invested on their own,
- Efficiency and ease of access to cash/High Liquidity: Funds invested in UTFs are invested as portfolios with different assets and the fund managers always maintain a cash buffer. Unit trusts are highly liquid, as it is easy to sell and buy units without depending on demand and supply at the time of investment or exit, and,
- Adoption of Fintech: Digitization and automation within the industry has enhanced liquidity, enabling investors immediate access to funds when withdrawing via M-PESA and receiving their funds within 3 to 5 working days if they are withdrawing to their bank accounts. According to the Central Bank of Kenya, more and more individuals are transacting through mobile money services as evidenced by continuous increase in the total number of registered mobile money accounts which has grown at a 5-year CAGR of 15.5% to 70.3 mn in June 2022, from 34.2 mn recorded in June 2017. Fintech has increased the efficiency of processing both payments and investments for fund managers and made Collective Investment Schemes more accessible to retail investors.
According to the Capital Markets Authority, as at the end of Q2’2022, there were 32 approved Collective Investment Schemes in Kenya, up from 25 recorded at the end of Q2’2021. Out of the 32, only 20, equivalent to 62.5% were active while 12 (37.5%) were inactive. The table below outlines the performance of the Collective Investment Schemes comparing Q2’2022 and Q1’2022:
|
|
Cytonn Report: Assets Under Management (AUM) for the Approved Collective Investment Schemes |
|||||
|
No. |
Collective Investment Schemes |
Q1’2022 AUM |
Q1’2022 |
Q2’2022 AUM |
Q2’2022 |
AUM Growth |
|
(Kshs mns) |
Market Share |
(Kshs mns) |
Market Share |
Q1'2022 –Q2'2022 |
||
|
1 |
CIC Unit Trust Scheme |
56,919.1 |
40.5% |
57,126.4 |
39.4% |
0.4% |
|
2 |
NCBA Unit Trust Scheme |
19,757.2 |
14.0% |
20,152.1 |
13.9% |
2.0% |
|
3 |
British American Unit Trust Scheme |
14,527.8 |
10.3% |
13,868.3 |
9.6% |
(4.5%) |
|
4 |
ICEA Unit Trust Scheme |
13,669.2 |
9.7% |
13,669.2 |
9.4% |
0.0% |
|
5 |
Sanlam Unit Trust Scheme |
10,205.1 |
7.3% |
12,676.3 |
8.7% |
24.2% |
|
6 |
Old Mutual Unit Trust Scheme |
6,713.2 |
4.8% |
6,883.6 |
4.7% |
2.5% |
|
7 |
Coop Unit Trust Scheme |
3,294.8 |
2.3% |
3,725.4 |
2.6% |
13.1% |
|
8 |
Dry Associates Unit Trust |
3,215.7 |
2.3% |
3,611.9 |
2.5% |
12.3% |
|
9 |
Nabo Capital Ltd |
2,719.6 |
1.9% |
3,016.0 |
2.1% |
10.9% |
|
10 |
Madison Asset Unit Trust Funds |
2,794.6 |
2.0% |
2,734.3 |
1.9% |
(2.2%) |
|
11 |
Zimele Unit Trust Scheme |
2,165.8 |
1.5% |
2,165.8 |
1.5% |
0.0% |
|
12 |
African Alliance Kenya Unit Trust Scheme |
1,822.1 |
1.3% |
1,743.4 |
1.2% |
(4.3%) |
|
13 |
ABSA Unit Trust Scheme |
287.1 |
0.2% |
1,048.1 |
0.7% |
265.0% |
|
14 |
Cytonn UnitTrust Fund |
725.7 |
0.5% |
771.4 |
0.5% |
6.3% |
|
15 |
Apollo Unit Trust Scheme |
719.2 |
0.5% |
730.5 |
0.5% |
1.6% |
|
16 |
Genghis Unit Trust Funds |
593.5 |
0.4% |
575.1 |
0.4% |
(3.1%) |
|
17 |
Orient Collective Investment Scheme |
257.4 |
0.2% |
262.0 |
0.2% |
1.8% |
|
18 |
Equity Investment Bank |
249.6 |
0.2% |
199.5 |
0.1% |
(20.0%) |
|
19 |
Amana Unit Trust Funds |
29.5 |
0.0% |
27.3 |
0.0% |
(7.5%) |
|
20 |
Wanafunzi |
0.7 |
0.0% |
0.7 |
0.0% |
2.4% |
|
21 |
Genghis Specialized Funds |
- |
- |
- |
- |
- |
|
22 |
Standard Investments Bank |
- |
- |
- |
- |
- |
|
23 |
Diaspora Unit Trust Scheme |
- |
- |
- |
- |
- |
|
24 |
Dyer and Blair Unit Trust Scheme |
- |
- |
- |
- |
- |
|
25 |
Jaza Unit Trust Fund |
- |
- |
- |
- |
- |
|
26 |
Masaru Unit Trust Fund |
- |
- |
- |
- |
- |
|
27 |
Adam Unit Trust Fund |
- |
- |
- |
- |
- |
|
28 |
First Ethical Opportunities Fund |
- |
- |
- |
- |
- |
|
29 |
Natbank Unit Trust Scheme |
- |
- |
- |
- |
- |
|
30 |
GenAfrica Unit Trust Scheme |
- |
- |
- |
- |
- |
|
31 |
Amaka Unit Trust (Umbrella) Scheme |
- |
- |
- |
- |
- |
|
32 |
Mali Money Market Fund |
- |
- |
- |
- |
- |
|
|
Total |
140,667.0 |
100.0% |
144,987.5 |
100.0% |
3.1% |
Source: Capital Markets Authority: Quarterly Statistical Bulletin, Q3’2022, and Capital Markets Authority List of licensees
Key take outs from the above table include:
- Assets Under Management: CIC Unit Trust Scheme remained the largest overall Unit Trust Fund with an AUM of Kshs 57.1 bn in Q2’2022, from an AUM of Kshs 56.9 bn in Q1’2022, translating to a 0.4% AUM growth,
- Growth: In terms of AUM growth, Absa Unit Trust recorded the highest growth of 265.0%, with its AUM increasing to Kshs 1.0 bn, from Kshs 0.3 bn in Q1’2022 while Equity Investment Bank recorded the largest decline, with its AUM declining by 20.0% to Kshs 199.5 mn in Q2’2022, from Kshs 249.6 mn in Q1’2022. Absa growth is be to the fact that it’s a new fund, hence the rapid growth and Equity’s decline is because it is no longer focused on the UTF business,
- Market Share: CIC Unit Trust Scheme remained the largest overall Unit Trust with a market share of 39.4%, a 1.1% points decline from 40.5% in Q1’2022,
- GenAfrica Unit Trust Scheme, Natbank Unit Trust Scheme, First Ethical Opportunities Fund, Adam Unit Trust Fund, Masaru Unit Trust Fund, Jaza Unit Trust Fund, Dyer and Blair Unit Trust Scheme, Diaspora Unit Trust Scheme, Standard Investments Bank, Genghis Specialized Fund, Amaka Unit Trust and Mali Money Market Fund remained inactive as at the end of Q2’2022.
Section II: Performance of Money Market Funds
Money Market Funds (MMFs) in the recent past have gained popularity in Kenya driven by the higher returns they offer compared to the returns on bank deposits and treasury bills. According to the Central Bank of Kenya data, the average deposit rate increased by 10 bps to 6.6% in Q2’2022 from 6.5% recorded in Q1’2022. During the period under review, the 91-Day T-bill and the average deposit rate continued to offer lower yields at 7.9% and 6.6%, respectively, compared to the average MMF yields of 8.9%.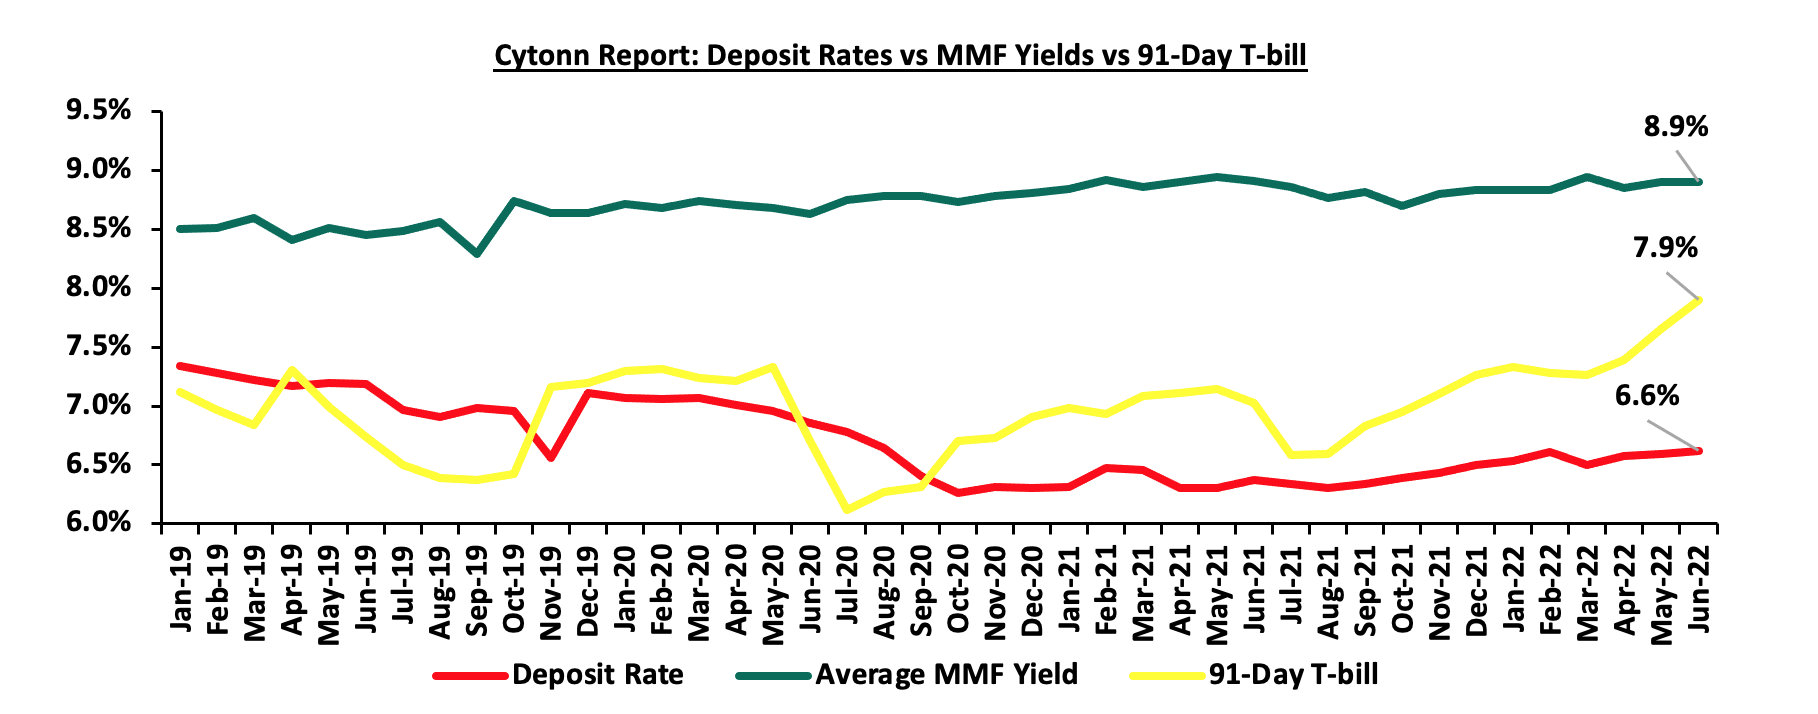
Source: Central Bank of Kenya, Cytonn Research
As per the regulations, funds in MMFs should be invested in liquid interest-bearing securities which include bank deposits, fixed income securities listed on the Nairobi Securities Exchange (NSE) and securities issued by the Government of Kenya. The fund is best suited for investors who require a low-risk investment that offers capital stability, liquidity, and require a high-income yield. The fund is also a good safe haven for investors who wish to switch from a higher risk portfolio to a low risk portfolio, especially in times of uncertainty.
Top Five Money Market Funds by Yields
During the period under review, the following Money Market Funds had the highest average effective annual yield declared, with the Cytonn Money Market Fund having the highest effective annual yield at 10.5% against the industry average of 8.9%.
|
Cytonn Report: Top 5 Money Market Fund Yield in Q2'2022 |
||
|
Rank |
Money Market Fund |
Effective Annual Rate (Average Q2'2022) |
|
1 |
Cytonn Money Market Fund |
10.5% |
|
2 |
Zimele Money Market Fund |
9.9% |
|
3 |
Nabo Africa Money Market Fund |
9.7% |
|
4 |
Sanlam Money Market Fund |
9.4% |
|
5 |
Madison Money Market Fund |
9.3% |
|
|
Industry average |
8.9% |
Source: Cytonn Research
Section III: Comparison between Unit Trust Funds AUM Growth and other Markets
Unit Trust Funds’ assets recorded a q/q growth of 3.1% in Q2’2022, while the listed bank deposits recorded a growth of 5.2% over the same period. For the Unit Trust Funds, this was slower than the growth recorded as at the end of Q2’2021 of 6.0%. However, for the bank deposits, it was an improvement compared to a growth of 4.4% recorded in Q2’2021. The chart below highlights the Unit Trust Funds AUM growth vs bank deposits growth over the last five years;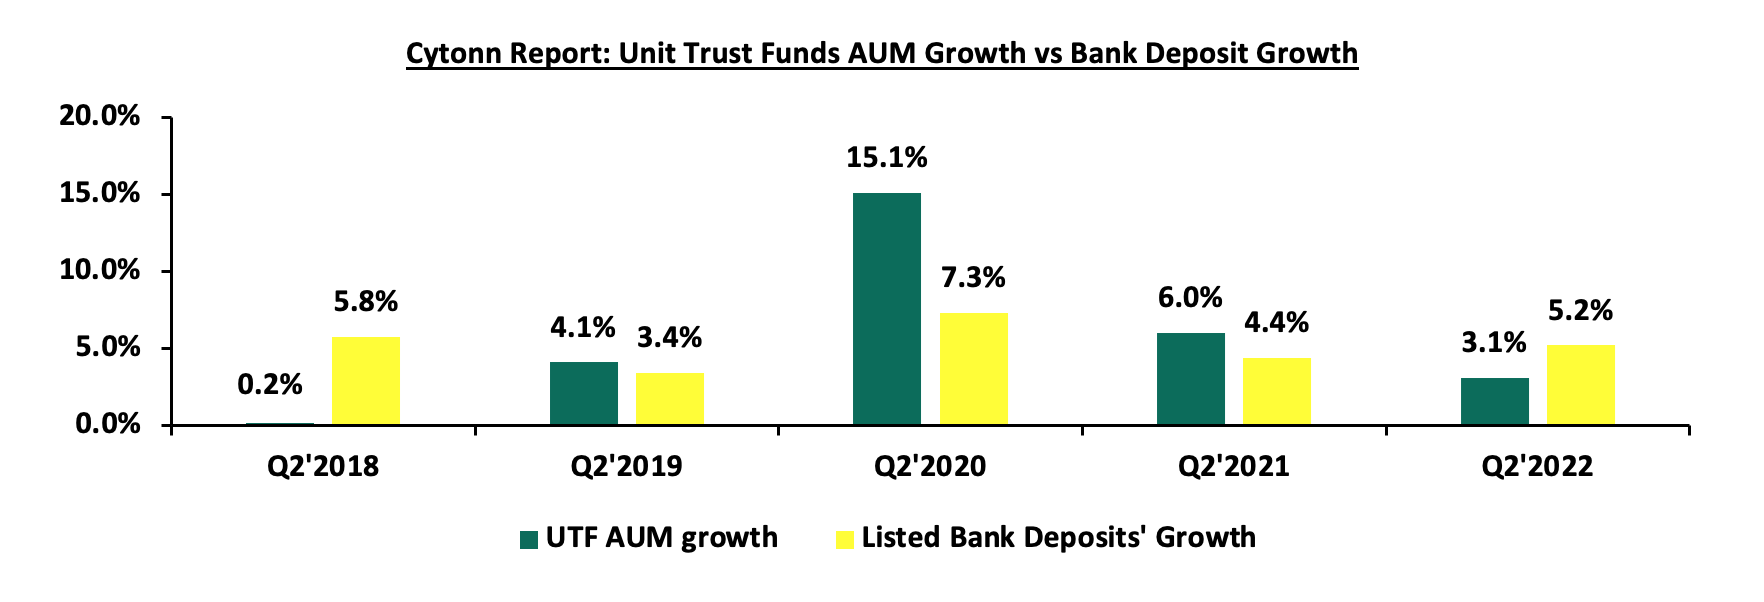
Source: Cytonn Research
Unit Trust Funds’ (UTF) growth of 3.1% was outpaced by the listed banking sector’s deposit growth of 5.2% in Q2’2022. We note that the 3.1% growth rate was slower than the 6.0% growth recorded in Q2’2021, while listed banks deposits growth increased by 0.8% points to 5.2% from 4.4% in Q1’2021, an indication of a relative slowdown and constraints in our capital markets. According to the World Bank data, in well-functioning economies, businesses rely on bank funding for 40.0%, with the larger percentage of 60.0% coming from the Capital markets. Closer home, the World Bank noted that businesses in Kenya relied on banks for 99.0% of their funding while less than 1.0% come from the capital markets. Notably, our Mutual Funds/UTFs to GDP ratio at 1.1% is still very low compared to an average of 69.6% amongst select global markets, indicating that we still have room to improve and enhance our capital markets. The chart below shows some countries’ mutual funds as a percentage of GDP: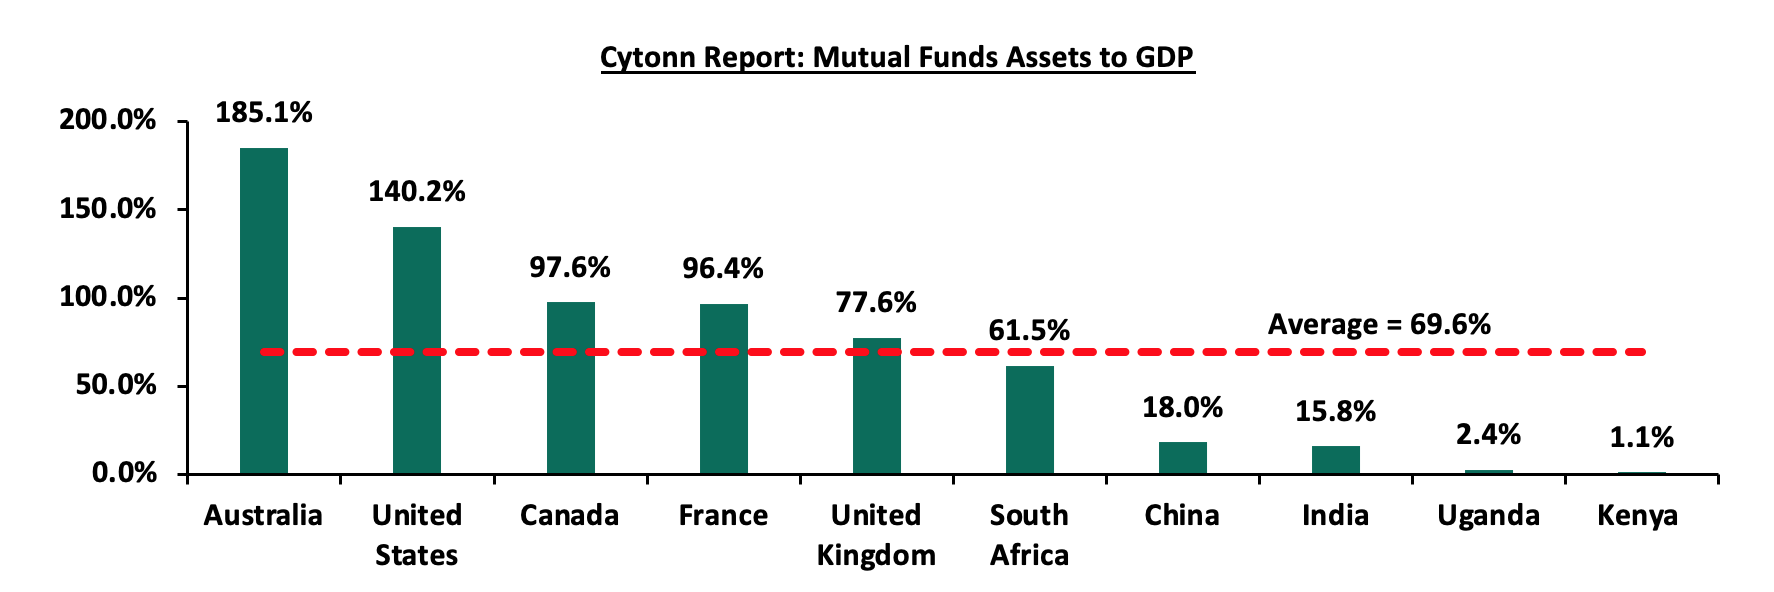
Source: World Bank Data
Over the past 5 years, the Unit Trust Funds AUM have grown at a 5-year CAGR of 21.2% to Kshs 145.0 bn in Q2’2022, from Kshs 55.5 bn recorded in Q2’2017. However, even at Kshs 145.0 bn, the industry is dwarfed by asset gatherers such as bank deposits at Kshs 4.6 tn and the pension industry at Kshs 1.5 tn as of Q2’2022. Below is a graph showing the sizes of different saving channels and capital market products in Kenya as at June 2022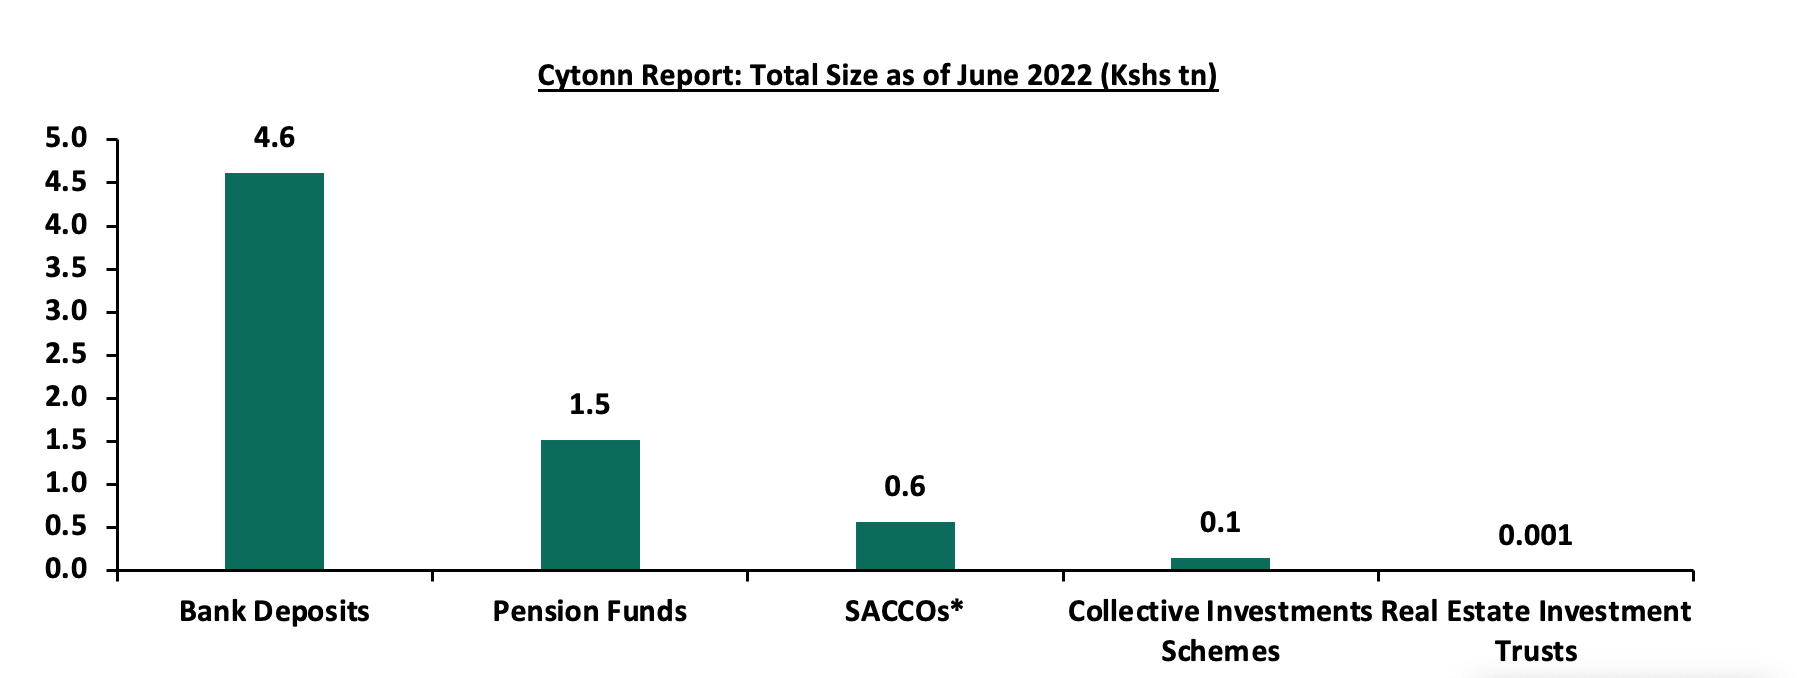
*Data as of December 2021
Source: CMA, RBA, CBK, SASRA Annual Reports and REITs Financial Statements
On a REITs to Market Cap Ratio, Kenya still has a lot of room for improvement. The listed REITs capitalization as a percentage of total market cap in Kenya stands at a paltry 0.1%, as compared to 3.0% in the US and 1.0% in South Africa, as of 4th November, 2022. Below is a graph showing comparison of Kenya’s REITs to Market Cap Ratio to that of United States (US) and South Africa:
Source: Online research, Nairobi Securities Exchange (NSE)
Section IV: Recommendations
In order to improve our Capital Markets and stimulate its growth, we recommend the following actions:
- Lower the minimum investment amounts: Currently, the minimum investment for sector specific funds is Kshs 1.0 mn, while that for Development REITS is currently at Kshs 5.0 mn. According to the Kenya National Bureau of Statistics, 74.4% of all employees in the formal sector earn a monthly median gross income of Kshs 50,000 or less and therefore the high minimum initial and top up investments amounts deter potential investors. Furthermore, these high amounts disadvantage the majority of retail investors by restricting their options for investments,
- Update regulations: The current Collective Investments Schemes Regulations in Kenya were formulated in 2001 and have not been updated since, despite the dynamic nature and ever-changing nature of the capital markets worldwide. This has led to the regulations lagging behind by not including provisions for private offers which have grown in importance over the years, and clear special funds guidelines to cater for the sophisticated investors’ interest in regulated alternative investments products. While there is some movement to update the regulations, the same remain in progress and are yet to be completed,
- Allow for sector funds: Under the current capital markets regulations, UTFs are required to diversify. However, one has to seek special dispensation in the form of sector funds such as a financial services fund, a technology fund or a Real Estate Unit Trust Fund. Regulations allowing unit holders to invest in sector funds would go a long way in expanding the scope of unit holders interested in investing,
- Eliminate conflicts of interest in the capital markets governance and allow non-financial institutions to also server as Trustees: The capital markets regulations should foster a governance structure that is more responsive to both market participants and market growth. In particular, restricting Trustees of Unit Trust Schemes to Banks only limits options, especially given the direct competition between the banking industry and capital markets,
- Provide Support to Fund Managers: In our opinion, the regulator, CMA needs to include market stabilization tools as part of the regulations/Act that will help Fund Managers meet fund obligations especially during times of distress like when there are a lot of withdrawals from the funds. We commend and appreciate the regulator’s role in safeguarding investor interests. However, since Fund Managers also play a significant role in the capital markets, the regulator should also protect the reputation of different fund managers in the industry. This can be done by collaborating with industry players to find solutions rather than publicly shunning and alienating industry players facing challenges as this may not be in the best interest of investors,
- Encourage different players to enter the market to increase competition: Increased competition in capital markets will not only push Unit Trust Fund managers to provide higher returns for investors but it will also eliminate conflicts of interest in markets and enhance the provision of innovative products and services, and,
- Improve fund transparency to provide more information to investors: To increase transparency for investors, each Unit Trust Fund should be required to publish their portfolio holdings on a quarterly basis and make the information available to the public. Providing more information to investors will increase accountability by enabling them to make more informed decisions, which will boost investor confidence.
In May 2022, the Capital Markets Authority (CMA) publicized the Draft Capital Markets Public Offers Listing and Disclosures Regulations 2022, meant to replace the Public Offers Listing and Disclosures Regulations 2002, which have been in effect since 2002, with the only amendments done in 2016. The Draft Regulations main objective is to create a more favorable environment in Kenya’s Capital Markets so as to encourage more listings on the Nairobi Securities Exchange. As highlighted in our Cytonn weekly#18/2022, we anticipate that more corporations and State Owned Enterprises will take advantage of this opportunity and seek capital markets funding through IPOs, which will further increase the percentage of funding for businesses provided by the Capital Markets. Additionally, In June 2022, the Capital Markets Authority (CMA) published the final draft regulations; Capital Markets (Collective Investment Schemes) Regulations 2022 and the Capital Markets (Alternative Investment Funds) Regulations 2022. Given the changes in market dynamics, the proposed regulations seek to update the current Collective Investment Scheme and Alternative Investment Funds Regulations while also addressing emerging issues.
We believe that in order to further propel the growth of UTF’s in Kenya, there is a need to leverage more on innovation, digitization and product development in the capital markets. Due to the high demand of innovative and convenient products by consumers in the retail market, the use of technology as a distribution channel for mutual fund products opens up the funds to the retail segment. Furthermore, instead of restricting UTF growth and diversification, regulators should encourage and facilitate it. This will boost the development of the capital markets and encourage the entry of new players.
Disclaimer: The views expressed in this publication are those of the writers where particulars are not warranted. This publication, which is in compliance with Section 2 of the Capital Markets Authority Act Cap 485A, is meant for general information only and is not a warranty, representation, advice or solicitation of any nature. Readers are advised in all circumstances to seek the advice of a registered investment advisor.

