Kenya’s Real Estate Investment Trusts (REITs) H1’2023 Report, & Cytonn Weekly #33/2023
By Cytonn Research, Aug 20, 2023
Executive Summary
Fixed Income
During the week, T-bills were oversubscribed for the second week consecutively, with the overall subscription rate coming in at 186.2%, albeit lower than the oversubscription rate of 199.7% recorded the previous week. Investors’ preference for the shorter 91-day paper persisted, with the paper receiving bids worth Kshs 38.2 bn against the offered Kshs 4.0 bn, translating to an oversubscription rate of 955.7%, albeit lower than the 1044.6% recorded the previous week. The subscription rate for the 364-day paper increased to 25.9% from 9.0% recorded the previous week, while the subscription rate for the 182-day paper decreased to 38.6% from the 52.5% recorded the previous week. The government accepted a total of Kshs 43.6 bn worth of bids out of Kshs 44.7 bn of bids received, translating to an acceptance rate of 97.5%. The yields on the government papers recorded a mixed performance, with the yields on the 364-day paper and 91-day paper increasing by 40.6 bps and 36.5 bps to 13.7% and 13.5% respectively while the yields on the 182-day paper decreased by 16.2 bps to 13.3%;
In the primary market, the Central Bank of Kenya released the auction results for the newly issued bond FXD1/2023/02 with a tenor to maturity of 2 years and the re-opened bond FXD1/2023/05 with a 4.9-year tenor to maturity. In line with our expectation, the bonds recorded an oversubscription rate of 132.5%, receiving bids worth Kshs 53.0 bn against the offered Kshs 40.0 bn. The government accepted bids worth Kshs 19.1 bn, translating to an acceptance rate of 36.1%. The weighted average yield of accepted bids came in at 17.0% and 18.0% for FXD1/2023/02 and FXD1/2023/05, respectively. The coupon rate for the FXD1/2023/02 came at 17.0% and FXD1/2023/05 is set at 16.8%;
During the week, the National Treasury gazetted the revenue and net expenditures for the first month of FY’2022/2023, ending 31st July 2022, indicating that the total revenue collected as at the end of July 2023 amounted to Kshs 159.6 bn, equivalent to 6.2% of the original estimates of Kshs 2,571.2 bn for FY’2023/2024 and is 74.5% of the prorated estimates of Kshs 214.3 bn.
Also, during the week the Energy and Petroleum Regulatory Authority (EPRA) released their monthly statement on the maximum retail fuel prices in Kenya effective 15 August 2023 to 14 September 2023. Notably, fuel prices remained unchanged at Kshs 194.7 per litre for Super Petrol, Kshs 179.7 per litre for Diesel and Kshs 169.5 per litre for Kerosene respectively;
Equities
During the week, the equities market was on a downward trajectory, with NASI, NSE 20, and NSE 25 declining by 2.5%, 3.9%, and 3.3%, respectively, taking the YTD performance to losses of 20.4%, 8.5%, and 16.5% for NASI, NSE 20, and NSE 25, respectively. The equities market performance was mainly driven by losses recorded by large-cap stocks such as EABL, Standard Chartered Bank-Kenya, Bamburi and KCB of 9.2%, 8.8%, 7.8% and 4.8%, respectively. The losses were, however, marginally mitigated by gains recorded by stocks such as DTB-K of 0.1%;
During the week, two listed banks Equity group and Co-operative Banks released their H1’2023 financial results, with their Core Earnings Per Share EPS increasing by 7.8% and 5.9% respectively;
Real Estate
During the week, Fahari I-REIT closed the week trading at an average price of Kshs 6.1 per share in the Nairobi Securities Exchange, representing a 3.5% decline from the Kshs 6.3 recorded the previous week. On the Unquoted Securities Platform as at 18 August 2023, Acorn D-REIT and I-REIT closed the week trading at Kshs 23.9 and Kshs 21.6 per unit, a 19.5% and 8.0% gain for the D-REIT and I-REIT, respectively, from the Kshs 20.0 inception price. In addition, Cytonn High Yield Fund (CHYF) closed the week with an annualized yield of 13.6%, remaining relatively unchanged from what was recorded the previous week;
Focus of the Week
Following the release of the H1’2023 results by all four authorized Real Estate Investment Trusts (REITs) in Kenya, the Cytonn Real Estate Research Team undertook an analysis of the financial performance of the REITs and identified the key factors that shaped the performance of the sector;
Investment Updates:
- Weekly Rates:
- Cytonn Money Market Fund closed the week at a yield of 12.44% p.a To invest, dial *809# or download the Cytonn App from Google Playstore here or from the Appstore here;
- Cytonn High Yield Fund closed the week at a yield of 13.56% p.a. To invest, email us at sales@cytonn.com and to withdraw the interest, dial *809# or download the Cytonn App from Google Playstore here or from the Appstore here;
- We continue to offer Wealth Management Training every Wednesday, from 9:00 am to 11:00 am. The training aims to grow financial literacy among the general public. To register for any of our Wealth Management Trainings, click here;
- If interested in our Private Wealth Management Training for your employees or investment group, please get in touch with us through wmt@cytonn.com;
- Cytonn Insurance Agency acts as an intermediary for those looking to secure their assets and loved ones’ future through insurance namely; Motor, Medical, Life, Property, WIBA, Credit and Fire and Burglary insurance covers. For assistance, get in touch with us through insuranceagency@cytonn.com;
- Cytonn Asset Managers Limited (CAML) continues to offer pension products to meet the needs of both individual clients who want to save for their retirement during their working years and Institutional clients that want to contribute on behalf of their employees to help them build their retirement pot. To more about our pension schemes, kindly get in touch with us through pensions@cytonn.com;
Real Estate Updates:
- For more information on Cytonn’s real estate developments, email us at sales@cytonn.com;
- Phase 3 of The Alma is now ready for occupation and the show house is open daily. To join the waiting list to rent, please email properties@cytonn.com;
- For Third Party Real Estate Consultancy Services, email us at rdo@cytonn.com;
- For recent news about the group, see our news section here;
Hospitality Updates:
- We currently have promotions for Staycations. Visit cysuites.com/offers for details or email us at sales@cysuites.com;
Money Markets, T-Bills Primary Auction:
During the week, T-bills were oversubscribed for the second week consecutively, with the overall subscription rate coming in at 186.2%, albeit lower than the oversubscription rate of 199.7% recorded the previous week. Investors’ preference for the shorter 91-day paper persisted, with the paper receiving bids worth Kshs 38.2 bn against the offered Kshs 4.0 bn, translating to an oversubscription rate of 955.7%, albeit lower than the 1044.6% recorded the previous week. The subscription rate for the 364-day paper increased to 25.9% from 9.0% recorded the previous week, while the subscription rate for the 182-day paper decreased to 38.6% from the 52.5% recorded the previous week. The government accepted a total of Kshs 43.6 bn worth of bids out of Kshs 44.7 bn of bids received, translating to an acceptance rate of 97.5%. The yields on the government papers recorded a mixed performance, with the yields on the 364-day paper and 91-day paper increasing by 40.6 bps and 36.5 bps to 13.7% and 13.5% respectively while the yields on the 182-day paper decreased by 16.2 bps to 13.3%.
So far in the current FY’2023/24, government securities totalling Kshs 292.0 bn have been advertised, and bids amounting Kshs 377.8 bn have been received, comprising Kshs 228.6 bn in treasury bills and Kshs 149.2 bn in bonds, respectively. The government has accepted bids worth Kshs 320.4 bn, of which 219.3 bn and 101.1 bn were treasury bills and bonds, respectively. Total redemptions so far in FY’2023/24 equal to Kshs 269.5 bn, with treasury bills accounting for all redemptions. As a result, the government has a domestic borrowing surplus of Kshs 50.9 billion in FY’2023/24.
The chart below compares the overall average T- bills subscription rates obtained in 2017, 2022 and 2023 Year to Date (YTD):
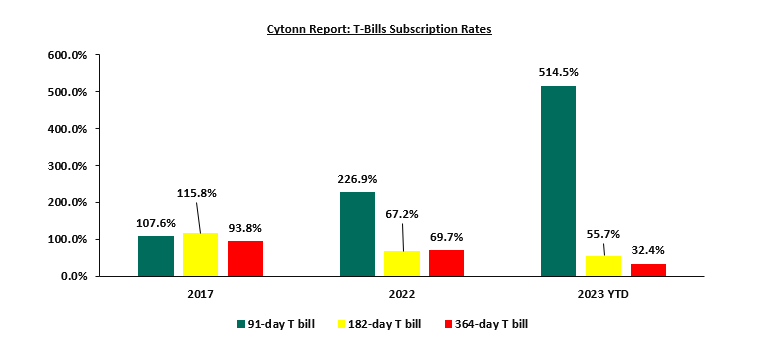
Source: Central Bank of Kenya (CBK)
In the primary market, the Central Bank of Kenya released the auction results for the newly issued bond FXD1/2023/02 with a tenor to maturity of 2 years and the re-opened bond FXD1/2023/05 with a 4.9-year tenor to maturity. In line with our expectation, the bonds recorded an oversubscription rate of 132.5%, receiving bids worth Kshs 53.0 bn against the offered Kshs 40.0 bn. The government accepted bids worth Kshs 19.1 bn, translating to an acceptance rate of 36.1%. The weighted average yield of accepted bids came in at 17.0% and 18.0% for FXD1/2023/02 and FXD1/2023/05, respectively. The coupon rate for the FXD1/2023/02 came at 17.0% and FXD1/2023/05 is set at 16.8%.
Money Market Performance:
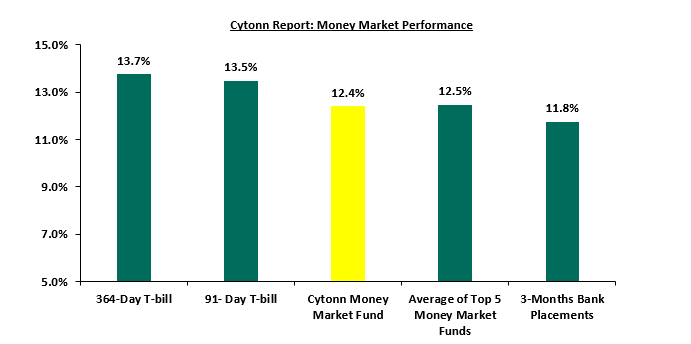
In the money markets, 3-month bank placements ended the week at 11.8% (based on what we have been offered by various banks), while the yields on the 364-day and 91-day T-bills increased by 40.6 bps and 36.5 bps to 13.7% and 13.5%, respectively. The yield of Cytonn Money Market Fund remained unchanged at 12.4%, while the average yields on the Top 5 Money Market Funds increased by 19.4 bps to 12.5% from 12.3% recorded the previous week.
The table below shows the Money Market Fund Yields for Kenyan Fund Managers as published on 18th August 2023:
|
Money Market Fund Yield for Fund Managers as published on 18th August 2023 |
||
|
Rank |
Fund Manager |
Effective Annual |
|
1 |
GenAfrica Money Market Fund |
12.6% |
|
2 |
Enwealth Money Market Fund |
12.6% |
|
3 |
Cytonn Money Market Fund |
12.4% |
|
4 |
Lofty-Corban Money Market Fund |
12.4% |
|
5 |
Etica Money Market Fund |
12.3% |
|
6 |
Madison Money Market Fund |
12.0% |
|
7 |
Jubilee Money Market Fund |
11.7% |
|
8 |
Kuza Money Market fund |
11.6% |
|
9 |
Sanlam Money Market Fund |
11.5% |
|
10 |
AA Kenya Shillings Fund |
11.3% |
|
11 |
Co-op Money Market Fund |
11.3% |
|
12 |
GenCap Hela Imara Money Market Fund |
11.2% |
|
13 |
Old Mutual Money Market Fund |
11.2% |
|
14 |
ICEA Lion Money Market Fund |
10.9% |
|
15 |
Absa Shilling Money Market Fund |
10.9% |
|
16 |
KCB Money Market Fund |
10.8% |
|
17 |
Apollo Money Market Fund |
10.8% |
|
18 |
NCBA Money Market Fund |
10.7% |
|
19 |
Nabo Africa Money Market Fund |
10.5% |
|
20 |
CIC Money Market Fund |
10.5% |
|
21 |
Dry Associates Money Market Fund |
10.5% |
|
22 |
Orient Kasha Money Market Fund |
9.9% |
|
23 |
British-American Money Market Fund |
9.5% |
|
24 |
Mali Money Market Fund |
9.3% |
|
25 |
Equity Money Market Fund |
9.0% |
Source: Business Daily
Liquidity
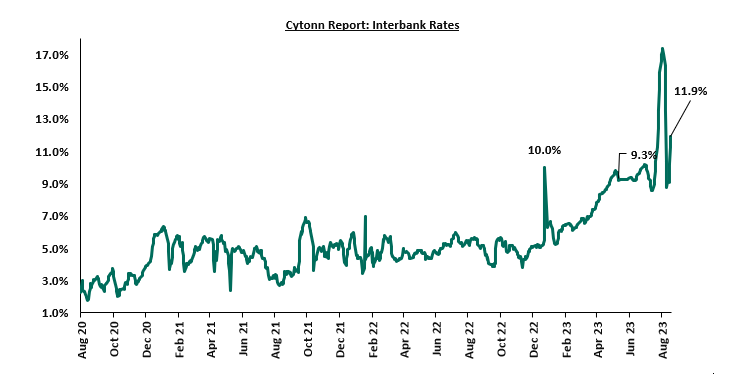
During the week, liquidity in the money markets increased, with the average interbank rate decreasing to 10.3% from 11.6% recorded the previous week, partly attributable to increased governments payments which offset tax remittances. Additionally, the decrease in the interbank rate is also attributable to the recent intervention of the Central Bank of Kenya to introduce an interbank interest rate corridor around the Central Bank Rate (CBR), set at CBR +/-2.5%. As such, the monetary operations will be aimed at ensuring the interbank rate closely tracks the CBR. The average interbank volumes traded increased by 6.7% to Kshs 22.4 bn, from Kshs 21.0 bn recorded the previous week. The chart below shows the interbank rates in the market over the years:
Kenya Eurobonds:
During the week, the yields on Eurobonds were on an upward trajectory, with the yield on the 10-year Eurobond issued in 2014 and 7-year Eurobond issued in 2019 recording the largest increase, having increased by 1.0% points to 14.2% from 13.2%, and 12.3% from 11.3% recorded the previous week respectively. The table below shows the summary of the performance of the Kenyan Eurobonds as of 17th August 2023;
|
Cytonn Report: Kenya Eurobonds Performance |
||||||
|
|
2014 |
2018 |
2019 |
2021 |
||
|
Date |
10-year issue |
10-year issue |
30-year issue |
7-year issue |
12-year issue |
12-year issue |
|
Amount Issued (USD) |
2.0 bn |
1.0 bn |
1.0 bn |
0.9 bn |
1.2 bn |
1.0 bn |
|
Years to Maturity |
0.9 |
4.6 |
24.6 |
3.8 |
8.8 |
10.9 |
|
Yields at Issue |
6.6% |
7.3% |
8.3% |
7.0% |
7.9% |
6.2% |
|
2-Jan-23 |
12.9% |
10.5% |
10.9% |
10.9% |
10.8% |
9.9% |
|
1-Aug-23 |
12.5% |
10.8% |
10.8% |
11.3% |
10.8% |
10.3% |
|
10-Aug-23 |
13.2% |
11.0% |
10.9% |
11.3% |
11.0% |
10.5% |
|
11-Aug-23 |
13.4% |
11.2% |
11.0% |
11.3% |
11.1% |
10.6% |
|
14-Aug-23 |
13.4% |
11.4% |
11.1% |
11.6% |
11.2% |
10.7% |
|
15-Aug-23 |
14.2% |
11.8% |
11.4% |
12.2% |
11.5% |
11.1% |
|
16-Aug-23 |
14.3% |
11.7% |
11.4% |
12.3% |
11.5% |
11.0% |
|
17-Aug-23 |
14.2% |
11.7% |
11.4% |
12.3% |
11.5% |
11.0% |
|
Weekly Change |
1.0% |
0.7% |
0.5% |
1.0% |
0.5% |
0.5% |
|
MTD Change |
1.7% |
0.9% |
0.5% |
1.0% |
0.7% |
0.7% |
|
YTD Change |
1.2% |
1.2% |
0.5% |
1.4% |
0.7% |
1.2% |
Source: Source: Central Bank of Kenya (CBK) and National Treasury
Kenya Shilling:
During the week, the Kenya Shilling depreciated by 0.4% against the US dollar to close the week at Kshs 144.2 from Kshs 143.6 recorded the previous week. On a year to date basis, the shilling has depreciated by 16.8% against the dollar, adding to the 9.0% depreciation recorded in 2022. We expect the shilling to remain under pressure in 2023 as a result of:
- An ever-present current account deficit, which came at 2.3% of GDP in Q1’2023 from 4.2% recorded in a similar period last year, and,
- The need for government debt servicing, continues to put pressure on forex reserves given that 66.8% of Kenya’s external debt of xxx is US Dollar denominated as of April 2023, and,
The shilling is however expected to be supported by:
- Diaspora remittances standing at a cumulative USD 2,411.9 mn in 2023 as of July 2023, 2.0% higher than the USD 2,364.0 mn recorded over the same period in 2022, and,
- The tourism inflow receipts which came in at Kshs 268.1 bn in 2022, a significant 82.9% increase from Kshs 146.5 bn inflow receipts recorded in 2021.
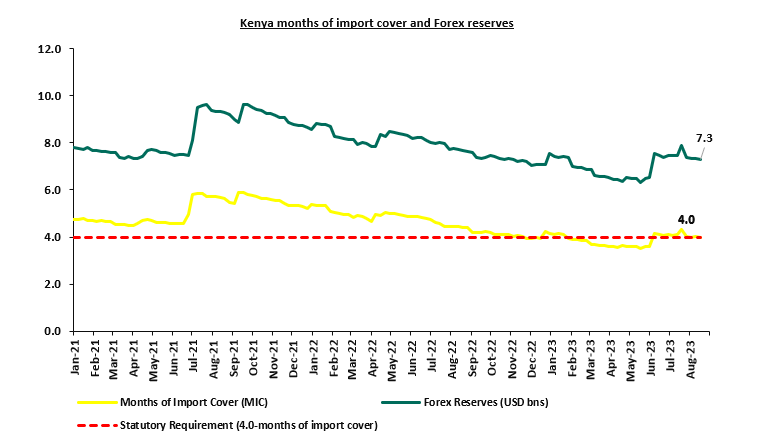
- Adequate forex reserves currently at USD 7.3 bn (equivalent to 4.0-months of import cover), which is within the statutory requirement of maintaining at least 4.0-months of import cover.
The chart below summarizes the evolution of Kenya months of import cover over the years:
Weekly Highlights:
- Revenue and Net Exchequer for FY’2023/2024
The National Treasury gazetted the revenue and net expenditures for the first month of FY’2023/2024, ending 31st July 2023. Below is a summary of the performance:
|
Cytonn Report: FY'2023/2024 Budget Outturn - As at 31st July 2023 |
|||||
|
Amounts in Kshs billions unless stated otherwise |
|||||
|
Item |
12-months Original Estimates (A) |
Actual Receipts/Release (B) |
Percentage Achieved of the Original Estimates (B/A) |
Prorated D=(1/12*A) |
% achieved of the Prorated ( B/D) |
|
Opening Balance |
2.6 |
||||
|
Tax Revenue |
2,495.8 |
155.1 |
6.2% |
208.0 |
74.6% |
|
Non-Tax Revenue |
75.3 |
1.9 |
2.5% |
6.3 |
29.8% |
|
Total Revenue |
2,571.2 |
159.6 |
6.2% |
214.3 |
74.5% |
|
External Loans & Grants |
870.2 |
43.1 |
4.9% |
72.5 |
59.4% |
|
Domestic Borrowings |
688.2 |
83.6 |
12.1% |
57.4 |
145.7% |
|
Other Domestic Financing |
3.2 |
0.9 |
27.6% |
0.3 |
330.8% |
|
Total Financing |
1,561.6 |
127.5 |
8.2% |
130.1 |
98.0% |
|
Recurrent Exchequer issues |
1,302.8 |
57.0 |
4.4% |
108.6 |
52.5% |
|
CFS Exchequer Issues |
1,963.7 |
188.0 |
9.6% |
163.6 |
114.9% |
|
Development Expenditure & Net Lending |
480.8 |
1.9 |
0.4% |
40.1 |
4.7% |
|
County Governments + Contingencies |
385.42 |
32.76 |
8.5% |
32.1 |
102.0% |
|
Total Expenditure |
4,132.7 |
279.6 |
6.8% |
344.4 |
81.2% |
|
Fiscal Deficit excluding Grants |
1,561.6 |
120.1 |
7.7% |
130.1 |
92.3% |
|
Total Borrowing |
1,558.4 |
126.6 |
8.1% |
129.9 |
97.5% |
The Key take-outs from the release include;
- Total revenue collected as at the end of July 2023 amounted to Kshs 159.6 bn, equivalent to 6.2% of the original estimates of Kshs 2,571.2 bn for FY’2023/2024 and is 74.5% of the prorated estimates of Kshs 214.3 bn. The performance is attributable to the deterioration of the business environment seen during the month of July as evidenced by the drop in the purchasing managers index (PMI) to 45.5 in July 2023, from 52.0 that was recorded at the beginning of the year 2023. Cumulatively, tax revenues amounted to Kshs 155.1 bn, equivalent to 6.2% of the original estimates of Kshs 2,495.8 bn and 74.6% of the prorated estimates of Kshs 208.0 bn,
- Total financing amounted to Kshs 127.5 bn, equivalent to 8.2% of the original estimates of Kshs 1,561.6 bn and is equivalent to 98.0% of the prorated estimates of Kshs 130.1 bn. Additionally, domestic borrowing amounted to Kshs 83.6 bn, equivalent to 12.1% of the original estimates of Kshs 688.2 bn and is 145.7% of the prorated estimates of Kshs 57.4 bn,
- The total expenditure amounted to Kshs 279.6 bn, equivalent to 6.8% of the original estimates of Kshs 4,132.7 bn, and is 81.2% of the prorated target expenditure estimates of Kshs 344.4 bn. Additionally, the net disbursements to recurrent expenditures came in at Kshs 57.0 bn, equivalent to 4.4% of the original estimates and 52.5% of the prorated estimates of Kshs 108.6 bn,
- Consolidated Fund Services (CFS) Exchequer issues came in at Kshs 188.0 bn, equivalent to 9.6% of the original estimates of Kshs 1,963.7 bn, and are 114.9% of the prorated amount of Kshs 163.6 bn. The cumulative public debt servicing cost amounted to Kshs 161.8 bn which is 9.2% of the original estimates of Kshs 1,751.1 bn, and is 110.9% of the prorated estimates of Kshs 145.9 bn. Additionally, the Kshs 161.8 bn debt servicing cost is equivalent to 101.4% of the actual revenues collected as at the end of July 2023, and,
- Total Borrowings as at the end of July 2023 amounted to Kshs 126.6 bn, equivalent to 8.1% of the original estimates of Kshs 1,558.4 bn for FY’2023/2024 and are 97.5% of the prorated estimates of Kshs 129.9 bn. The cumulative domestic borrowing of Kshs 688.2 bn comprises of Net Domestic Borrowing KSh. 313.7 bn and Internal Debt Redemptions (Rollovers) Kshs 374.5 bn.
The revenue performance for the first month of the FY’2023/2024 is mainly on the back of poor business environment brought about by high cost of living amid high fuel prices as well as sustained depreciation of the Kenya shilling. This is evidenced by the purchasing managers index for the month of July 2023 coming in at 45.5, the lowest reading in 12 months to July 2023. As such, we believe that the performance of revenue collection in the coming months will be largely determined by how soon the country’s business environment stabilizes
II. Fuel Prices effective 15th August 2023 to 14th September 2023.
During the week, the Energy and Petroleum Regulatory Authority (EPRA) released their monthly statement on the maximum retail fuel prices in Kenya effective 15 August 2023 to 14 September 2023. Notably, fuel prices remained unchanged at Kshs 194.7 per litre for Super Petrol, Kshs 179.7 per litre for Diesel and Kshs 169.5 per litre for Kerosene respectively.
Other key take-outs from the performance include;
- The average landing cost per cubic meter for Super Petrol, Kerosene and Diesel increased by 6.8%, 7.4% and 4.3% and to USD 739.1, 690.6 and USD 702.0 in July 2023, from USD 691.8, USD 642.9 and USD 673.1 June 2023, respectively.
We note that fuel prices in the country still remain elevated based on historical levels, despite global fuel prices dropping to USD 86.2 per barrel from a peak of USD 128.3 per barrel in March 2022. Notably, the high fuel prices in the country are mainly due to the high cost of fuel imports as a result of the sustained depreciation of the shilling against the US dollar as well as the double increase in VAT on petroleum products to 16.0% from 8.0% as provisioned in the Finance Act 2023.
Rates in the Fixed Income market have been on an upward trend given the continued high demand for cash by the government and the occasional liquidity tightness in the money market. The government is 38.1% behind its prorated net domestic borrowing target of Kshs 82.2 bn, having a net borrowing position of Kshs 50.9 bn of the domestic net borrowing target of Kshs 586.5 bn for the FY’2023/2024. Therefore, we expect a continued upward readjustment of the yield curve in the short and medium term, with the government looking to bridge the fiscal deficit through the domestic market. Owing to this, our view is that investors should be biased towards short-term fixed-income securities to reduce duration risk.
Market Performance:
During the week, the equities market was on a downward trajectory, with NASI, NSE 20, and NSE 25 declining by 2.5%, 3.9%, and 3.3%, respectively, taking the YTD performance to losses of 20.4%, 8.5%, and 16.5% for NASI, NSE 20, and NSE 25, respectively. The equities market performance was mainly driven by losses recorded by large-cap stocks such as EABL, Standard Chartered Bank-Kenya, Bamburi and KCB of 9.2%, 8.8%, 7.8% and 4.8%, respectively. The losses were, however, marginally mitigated by gains recorded by stocks such as DTB-K of 0.1%;
During the week, equities turnover increased by 35.4% to USD 11.7 mn from USD 8.7 mn recorded the previous week, taking the YTD total turnover to USD 530.0 mn. Foreign investors remained net buyers for the third consecutive week with a net buying position of USD 0.7 mn, from a net buying position of USD 4.8 mn recorded the previous week, taking the YTD foreign net selling position to USD 271.7 mn.
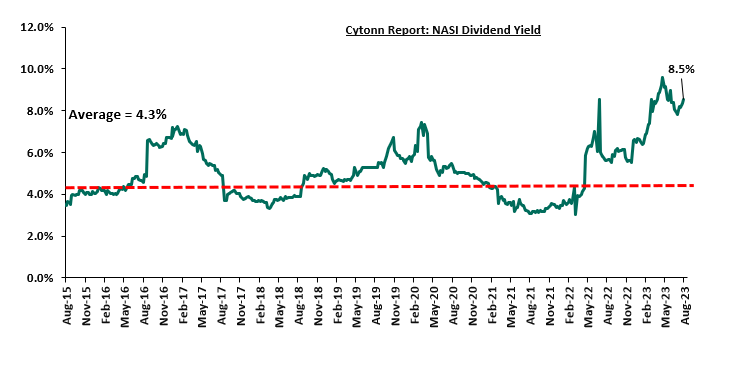
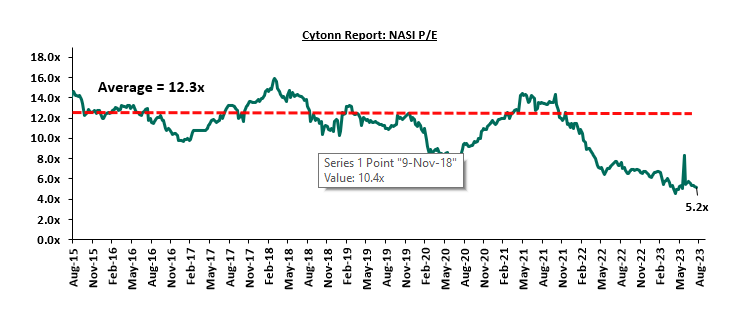
The market is currently trading at a price to earnings ratio (P/E) of 5.2x, 58.1% below the historical average of 12.3x. The dividend yield stands at 8.5%, 4.2% points above the historical average of 4.3%. Key to note, NASI’s PEG ratio currently stands at 0.7x, an indication that the market is undervalued relative to its future growth. A PEG ratio greater than 1.0x indicates the market is overvalued while a PEG ratio less than 1.0x indicates that the market is undervalued. The charts below indicate the historical P/E and dividend yields of the market;
Weekly Highlight
- Earnings Release
- Equity Group H1’2023 Financial Performance
During the week, Equity Group released their H1’2023 financial results. Below is a summary of the performance.
|
Balance Sheet Items |
H1'2022 |
H1'2023 |
y/y change |
|
Government Securities |
236.8 |
278.5 |
17.6% |
|
Net Loans and Advances |
650.6 |
817.2 |
25.6% |
|
Total Assets |
1333.9 |
1644.8 |
23.3% |
|
Customer Deposits |
970.9 |
1175.3 |
21.0% |
|
Deposits per branch |
2.9 |
3.3 |
15.2% |
|
Total Liabilities |
1183.5 |
1450.5 |
22.6% |
|
Shareholders’ Funds |
143.7 |
186.1 |
29.5% |
|
Balance Sheet Ratios |
H1'2022 |
H1'2023 |
y/y change |
|
Loan to Deposit Ratio |
67.0% |
69.5% |
2.5% |
|
Return on average equity |
31.9% |
29.1% |
(2.8%) |
|
Return on average assets |
3.8% |
3.2% |
(0.6%) |
|
Income Statement |
H1'2022 |
H1'2023 |
y/y change |
|
Net Interest Income |
39.8 |
46.4 |
16.5% |
|
Net non-Interest Income |
25.8 |
36.5 |
41.2% |
|
Total Operating income |
65.6 |
82.9 |
26.2% |
|
Loan Loss provision |
(4.1) |
(7.1) |
73.6% |
|
Total Operating expenses |
(34.7) |
(47.7) |
37.4% |
|
Profit before tax |
30.9 |
35.2 |
13.7% |
|
Profit after tax |
24.4 |
26.3 |
7.8% |
|
Core EPS |
6.5 |
7.0 |
7.8% |
|
Income Statement Ratios |
H1'2022 |
H1'2023 |
y/y change |
|
Yield from interest-earning assets |
4.9% |
5.1% |
0.3% |
|
Cost of funding |
2.8% |
3.4% |
0.5% |
|
Cost of risk |
6.2% |
8.6% |
2.3% |
|
Net Interest Margin |
7.3% |
7.2% |
(0.1%) |
|
Net Interest Income as % of operating income |
60.6% |
56.0% |
(4.7%) |
|
Non-Funded Income as a % of operating income |
39.4% |
44.0% |
4.7% |
|
Cost to Income Ratio |
52.9% |
57.6% |
4.7% |
|
CIR without LLP |
46.7% |
49.0% |
2.3% |
|
Cost to Assets |
2.5% |
2.7% |
0.2% |
|
Capital Adequacy Ratios |
H1'2022 |
H1'2023 |
% points change |
|
Core Capital/Total Liabilities |
15.5% |
17.9% |
2.4% |
|
Minimum Statutory ratio |
8.0% |
8.0% |
|
|
Excess |
7.5% |
9.9% |
2.4% |
|
Core Capital/Total Risk Weighted Assets |
14.1% |
15.0% |
0.9% |
|
Minimum Statutory ratio |
10.5% |
10.5% |
|
|
Excess |
3.6% |
4.5% |
0.9% |
|
Total Capital/Total Risk Weighted Assets |
18.8% |
19.0% |
0.2% |
|
Minimum Statutory ratio |
14.5% |
14.5% |
|
|
Excess |
4.3% |
4.5% |
0.2% |
|
Liquidity Ratio |
53.2% |
51.1% |
(2.1%) |
|
Minimum Statutory ratio |
20.0% |
20.0% |
|
|
Excess |
33.2% |
31.1% |
(2.1%) |
Key Take Outs
- Earnings growth - Core earnings per share (EPS) grew by 7.8% to Kshs 7.0, from Kshs 6.5 in H1’2022, driven by the 26.2% growth in total operating income to Kshs 82.9 bn, from Kshs 65.6 bn in H1’2022. However, the performance was weighed down by a 37.4% growth in total operating expenses to Kshs 47.7 bn, from Kshs 34.7 bn in H1’2022
- Increased Provisioning – On the back of high credit risk occasioned by the deteriorated business environment, the bank increased its provisions holdings to cover for the anticipated losses in the future, with its provisions increasing by 26.1% to Kshs 34.7 bn from Kshs 27.5 bn recorded in H1’2022, and,
- Revenue Diversification – The Group’s Non-Funded income increased by 41.2% to Kshs 36.5 bn in H1’2023, from Kshs 25.8 bn in H1’2022, which resulted to a shift in revenue mix to 56:44 in H1’2023 from 61:39 in H1’2022. The increase was mainly attributable to a faster 41.2% increase in non-funded income to Kshs 36.5 bn, from Kshs 25.8 bn in H1’2022, compared to the 16.5% increase in Funded income to kshs 46.4 bn, from kshs 39.8 bn in H1’2022.
For a more detailed analysis, please see the Equity Holding H1’2023 Earnings Note
- Cooperative Bank kenya H1’2023 Financial Performance
|
Balance Sheet Items |
H1'2022 |
H1'2023 |
y/y change |
|
Government Securities |
183.2 |
188.5 |
2.9% |
|
Net Loans and Advances |
330.1 |
365.4 |
10.7% |
|
Total Assets |
603.9 |
664.9 |
10.1% |
|
Customer Deposits |
423.0 |
463.9 |
9.7% |
|
Total Liabilities |
506.9 |
556.4 |
9.8% |
|
Shareholders Funds |
96.7 |
108.3 |
11.9% |
|
Balance Sheet Ratios |
H1'2022 |
H1'2023 |
y/y change |
|
Loan to Deposit Ratio |
78.0% |
78.8% |
0.7% |
|
Return on average equity |
21.8% |
22.2% |
0.3% |
|
Return on average assets |
3.5% |
3.6% |
0.1% |
|
Income Statement |
H1'2022 |
H1'2023 |
y/y change |
|
Net Interest Income |
21.1 |
21.5 |
2.3% |
|
Non-Interest Income |
13.3 |
13.8 |
4.0% |
|
Total Operating income |
34.4 |
35.4 |
3.0% |
|
Loan Loss provision |
(3.3) |
(2.9) |
(14.4%) |
|
Total Operating expenses |
(19.2) |
(19.1) |
(0.1%) |
|
Profit before tax |
15.3 |
16.4 |
7.4% |
|
Profit after tax |
11.5 |
12.1 |
5.9% |
|
Earning per share |
2.0 |
2.1 |
5.9% |
|
Income Statement Ratios |
H1'2022 |
H1'2023 |
% point change |
|
Yield from interest-earning assets |
11.4% |
11.6% |
0.3% |
|
Cost of funding |
3.2% |
3.8% |
0.6% |
|
Net Interest Spread |
8.2% |
7.8% |
(0.4%) |
|
Net Interest Income as % of operating income |
61.3% |
60.9% |
(0.4%) |
|
Non-Funded Income as a % of operating income |
38.7% |
39.1% |
0.4% |
|
Cost to Income |
55.8% |
54.1% |
(1.7%) |
|
CIR without provisions |
46.0% |
46.0% |
0.0% |
|
Cost to Assets |
2.6% |
2.5% |
(0.1%) |
|
Net Interest Margin |
8.4% |
8.2% |
(0.2%) |
|
Capital Adequacy Ratios |
H1'2022 |
H1'2023 |
% points change |
|
Core Capital/Total deposit Liabilities |
19.7% |
21.2% |
1.5% |
|
Minimum Statutory ratio |
8.0% |
8.0% |
|
|
Excess |
11.7% |
13.2% |
1.5% |
|
Core Capital/Total Risk Weighted Assets |
15.5% |
16.5% |
1.0% |
|
Minimum Statutory ratio |
10.5% |
10.5% |
|
|
Excess |
5.0% |
6.0% |
1.0% |
|
Total Capital/Total Risk Weighted Assets |
16.6% |
20.5% |
3.9% |
|
Minimum Statutory ratio |
14.5% |
14.5% |
|
|
Excess |
2.1% |
6.0% |
3.9% |
|
Liquidity Ratio |
44.5% |
52.3% |
7.8% |
|
Minimum Statutory ratio |
20.0% |
20.0% |
|
|
Excess |
24.5% |
32.3% |
7.8% |
Key Take Outs
- Earnings growth - Core earnings per share (EPS) grew by 5.9% to Kshs 2.1, from Kshs 2.0 in H1’2022, driven by the 3.0% growth in total operating income to Kshs 35.4 bn, from Kshs 34.4 bn in H1’2022.
- Improved efficiency – The bank’s total operating expenses decreased by 0.1% to Kshs 19.1 bn in H1’2023 from Kshs 19.2 bn in H1’2022, attributable to a 14.4% decrease in loan loss provisions to Kshs 2.9 bn, from Kshs 3.3 bn recorded in H1’2022, coupled with a 4.9% decrease in other expenses to Kshs 8.3 bn from Kshs 8.7 bn in H1’2022, which outpaced the slower 12.6% increase in staff costs to Kshs 8.0 bn, from Kshs 7.1 bn in H1’2022, and,
- Asset quality Deterioration- The bank’s asset quality deteriorated as evidenced by the NPL ratio increasing to 14.6% in H1’2023 from 14.1% in H1’2022, attributable to 14.2% increase in Gross non-performing loans to Kshs 58.4 bn, from Kshs 51.2 bn in H1’2022, compared to the 10.2% increase in gross loans to Kshs 400.9 bn, from Kshs 363.8 bn recorded in H1’2022,
For a more detailed analysis, please see the Cooperative Bank H1’2023 Earnings Note
Asset Quality
The table below is a summary of the listed banks that have released their H1’2023 results:
|
Cytonn Report: Listed Bank Asset Quality |
||||||
|
|
H1'2023 NPL Ratio* |
H1'2022 NPL Ratio** |
% point change in NPL Ratio |
H1'2023 NPL Coverage* |
H1'2022 NPL Coverage** |
% point change in NPL Coverage |
|
Equity Group |
11.2% |
8.8% |
2.4% |
54.5% |
64.1% |
(9.6%) |
|
Co-operative Bank |
14.6% |
14.1% |
0.5% |
60.7% |
65.8% |
(5.1%) |
|
Stanbic Bank |
8.1% |
9.4% |
(1.3%) |
57.4% |
56.0% |
1.4% |
|
Mkt Weighted Average |
11.5% |
13.0% |
(1.5%) |
56.6% |
62.3% |
(5.7%) |
|
*Market cap weighted as at 18/08/2023 |
||||||
|
**Market cap weighted as at 09/09/2022 |
||||||
Key take-outs from the table include:
- Asset quality for the listed banks that have released improved during the H1’2023, with market weighted average NPL declining by 1.5% points to 11.5% from a 13.0% in H1’2022. The improvement in asset quality was mainly driven by an improvement in Stanbic bank asset quality with its NPL ratio declining by 1.3% points to 8.1% from 9.4% in H1’2022,
- Equity Group had the highest NPL ratio jump by 2.4% points to 11.2% from 8.8% points in H1’2022, attributable to 59.8% increase in Gross non-performing loans to Kshs 97.5 bn, from Kshs 61.0 bn in H1’2022, which outpaced the 26.2% increase in gross loans to Kshs 870.3 bn, from Kshs 689.7 bn recorded in H1’2022
- Market weighted average NPL Coverage for the listed banks that have released decreased by 5.7% points to 56.6% in H1’2023, from 62.3% recorded in H1’2022, majorly on the back of decreased NPL coverage recorded by Equity Group and Co-operative Bank of Kenya by 9.6% and 5.1% respectively. However, Stanbic bank NPL coverage increased by 1.4% points to 57.4% in H1’2023 from 56.0% in H1’2022.
Summary Performance
The table below shows performance of listed banks using several metrics:
|
Cytonn Report: Listed Banks Performance in H1’2023 |
|||||||||||||
|
Bank |
Core EPS Growth |
Interest Income Growth |
Interest Expense Growth |
Net Interest Income Growth |
Net Interest Margin |
Non-Funded Income Growth |
NFI to Total Operating Income |
Growth in Total Fees & Commissions |
Deposit Growth |
Growth in Government Securities |
Loan to Deposit Ratio |
Loan Growth |
Return on Average Equity |
|
Stanbic Bank |
47.0% |
46.3% |
51.5% |
44.4% |
7.1% |
29.7% |
42.5% |
22.5% |
10.5% |
10.1% |
98.6% |
15.3% |
18.5% |
|
Equity Group |
8.0% |
27.0% |
54.3% |
16.5% |
7.2% |
41.2% |
44.0% |
38.3% |
21.0% |
17.6% |
69.5% |
25.6% |
29.1% |
|
Co-op Bank |
5.9% |
12.0% |
38.9% |
2.3% |
8.2% |
4.0% |
39.1% |
8.4% |
22.7% |
2.9% |
78.8% |
10.7% |
22.2% |
|
H1'23 Mkt Weighted Average* |
14.5% |
27.2% |
50.4% |
18.4% |
7.4% |
30.9% |
42.6% |
28.8% |
19.5% |
13.0% |
76.8% |
20.4% |
25.7% |
|
H1'22 Mkt Weighted Average** |
34.0% |
18.0% |
18.6% |
17.7% |
7.3% |
24.4% |
37.1% |
17.9% |
11.3% |
11.6% |
72.7% |
17.7% |
21.9% |
|
*Market cap weighted as at 11/08/2023 |
|||||||||||||
|
**Market cap weighted as at 09/09/2022
|
|||||||||||||
Key take-outs from the table include:
- The listed banks that have released there H1’2023 earnings recorded a 14.5% growth in core Earnings per Share (EPS) in H1’2023, compared to the weighted average growth of 34.0% in H1’2022, an indication of sustained performance despite the tough operating environment experienced in H1’2023,
- Non-Funded Income grew by 30.9% compared to market weighted average growth of 24.4% in H1’2022, an indication of increased revenue diversification efforts by the banks, and,
- The Banks recorded a deposit growth of 19.5%, higher than the market weighted average deposit growth of 11.3% in H1’2022,
Universe of coverage:
|
Company |
Price as at 11/08/2023 |
Price as at 18/08/2023 |
w/w change |
YTD Change |
Target Price* |
Dividend Yield |
Upside/ Downside** |
P/TBv Multiple |
Recommendation |
|
Jubilee Holdings |
189.3 |
170.0 |
(10.2%) |
(14.5%) |
260.7 |
7.1% |
60.4% |
0.3x |
Buy |
|
KCB Group*** |
28.9 |
27.5 |
(4.8%) |
(28.3%) |
41.3 |
7.3% |
57.3% |
0.5x |
Buy |
|
Liberty Holdings |
4.0 |
3.9 |
(3.3%) |
(23.4%) |
5.9 |
0.0% |
53.4% |
0.3x |
Buy |
|
Kenya Reinsurance |
1.9 |
1.8 |
(4.2%) |
(3.2%) |
2.5 |
11.0% |
49.7% |
0.1x |
Buy |
|
Co-op Bank*** |
12.0 |
11.5 |
(4.2%) |
(5.4%) |
15.0 |
13.1% |
43.7% |
0.5x |
Buy |
|
NCBA*** |
39.3 |
38.7 |
(1.4%) |
(0.6%) |
48.9 |
11.0% |
37.2% |
0.8x |
Buy |
|
Standard Chartered*** |
164.8 |
150.3 |
(8.8%) |
3.6% |
183.9 |
14.6% |
37.0% |
1.0x |
Buy |
|
Equity Group*** |
41.0 |
40.6 |
(1.0%) |
(9.9%) |
51.2 |
9.9% |
35.9% |
0.9x |
Buy |
|
ABSA Bank*** |
12.5 |
11.9 |
(4.4%) |
(2.5%) |
14.7 |
11.3% |
34.6% |
1.0x |
Buy |
|
CIC Group |
2.1 |
2.0 |
(5.2%) |
4.2% |
2.5 |
6.5% |
32.2% |
0.6x |
Buy |
|
Sanlam |
8.3 |
8.0 |
(3.6%) |
(16.5%) |
10.3 |
0.0% |
28.6% |
2.3x |
Buy |
|
Diamond Trust Bank*** |
47.0 |
47.1 |
0.1% |
(5.6%) |
54.6 |
10.6% |
26.6% |
0.2x |
Buy |
|
Britam |
5.1 |
5.0 |
(3.5%) |
(4.6%) |
6.0 |
0.0% |
20.4% |
0.7x |
Buy |
|
Stanbic Holdings |
120.0 |
117.0 |
(2.5%) |
14.7% |
127.9 |
10.8% |
20.1% |
0.8x |
Buy |
|
I&M Group*** |
19.0 |
18.5 |
(2.9%) |
8.2% |
19.5 |
12.2% |
17.7% |
0.4x |
Accumulate |
|
HF Group |
5.0 |
5.0 |
0.6% |
58.7% |
5.8 |
0.0% |
16.2% |
0.2x |
Accumulate |
We are “Neutral” on the Equities markets in the short term due to the current tough operating environment and huge foreign investor outflows, and, “Bullish” in the long term due to current cheap valuations and expected global and local economic recovery.
With the market currently being undervalued to its future growth (PEG Ratio at 0.7x), we believe that investors should reposition towards value stocks with strong earnings growth and that are trading at discounts to their intrinsic value. We expect the current high foreign investors sell-offs to continue weighing down the equities outlook in the short term.
- Real Estate Regulated Funds
- Real Estate Investment Trusts (REITs)
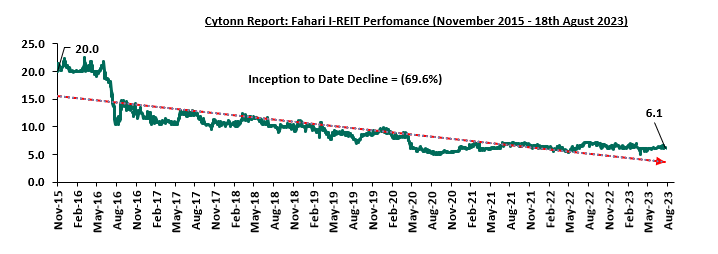
In the Nairobi Securities Exchange, ILAM Fahari I-REIT closed the week trading at an average price of Kshs 6.1 per share. The performance represented a 3.5% decline from Kshs 6.3 per share recorded the previous week, taking it to a 10.3% Year-to-Date (YTD) decline from Kshs 6.8 per share recorded on 3 January 2023. In addition, the performance represented a 69.6% Inception-to-Date (ITD) loss from the Kshs 20.0 price. The dividend yield currently stands at 10.7%. The graph below shows Fahari I-REIT’s performance from November 2015 to 18 August 2023;
In the Unquoted Securities Platform, Acorn D-REIT and I-REIT traded at Kshs 23.9 and Kshs 21.6 per unit, respectively, as at 18 August 2023. The performance represented a 19.5% and 8.0% gain for the D-REIT and I-REIT, respectively, from the Kshs 20.0 inception price. The volumes traded for the D-REIT and I-REIT came in at 12.3 mn and 30.2 mn shares, respectively, with a turnover of Kshs 257.5 mn and Kshs 624.4 mn, respectively, since inception in February 2021.
REITs provide various benefits like tax exemptions, diversified portfolios, and stable long-term profits. However, factors such as; i) inadequate comprehension of the investment instrument among investors, ii) prolonged approval processes for REITs creation, iii) high minimum capital requirements of Kshs 100.0 mn for trustees, and, iv) minimum investment amounts set at Kshs 5.0 mn, continue to limit the performance of the Kenyan REITs market.
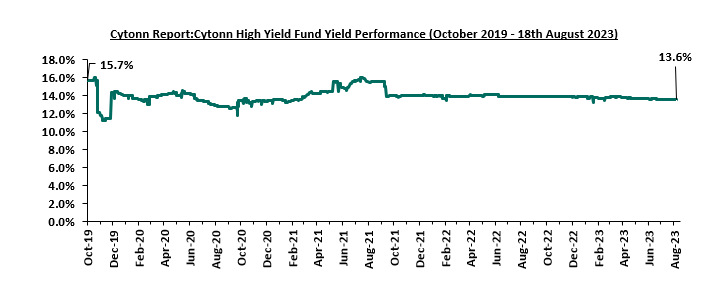
- Cytonn High Yield Fund (CHYF)
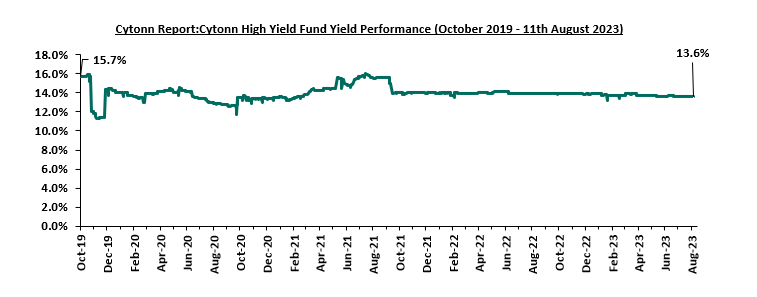
Cytonn High Yield Fund (CHYF) closed the week with an annualized yield of 13.6%, remaining relatively unchanged from the previous week. The performance also represented a 0.3% points Year-to-Date (YTD) decline from 13.9% yield recorded on 1 January 2023, and 2.1% points Inception-to-Date (ITD) decline from the 15.7% yield. The graph below shows Cytonn High Yield Fund’s performance from October 2019 to 18 August 2023;
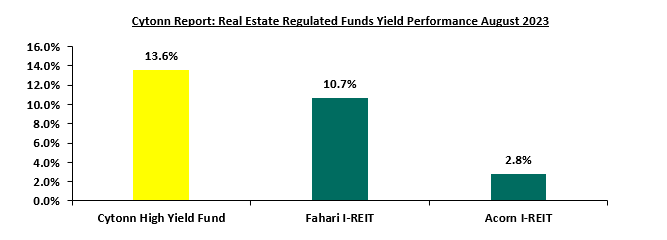
Notably, the CHYF has outperformed other regulated Real Estate funds with an annualized yield of 13.6%, as compared to Fahari I-REIT, and Acorn I-REIT with yields of 10.7% and 2.8% respectively. As such, the higher yields offered by CHYF makes the fund one of the best alternative investment resource in the Real Estate sector. The graph below shows the yield performance of the Regulated Real Estate Funds:
Source: Cytonn Research
We expect the performance of Kenya’s Real Estate sector to remain on an upward trajectory, supported by factors such as; i) positive demographic trends facilitating increased housing demand, ii) continued focus by the government and private sector to provide affordable housing, iii) infrastructure developments opening up areas for investments, and iv) rapid expansion of retail investors. However, the oversupply of physical space in select sectors, including commercial office and retail sectors leading to slower uptake of new spaces, rising construction costs on the back of inflationary pressure, and limited investor knowledge and interest in REITs, which is expected to hinder the sector's optimal performance.
Following the release of the H1’2023 results by all four authorized Real Estate Investment Trusts (REITs) in Kenya, the Cytonn Real Estate Research Team undertook an analysis of the financial performance of the REITs and identified the key factors that shaped the performance of the sector. For the earnings notes of the various REITs, click the links below:
- ILAM Fahari I-REIT H1'2023 Earnings Note
- LAPTrust Imara I-REIT H1’2023 Earnings Note
- Acorn I-REIT H1’2023 Earnings Note
- Acorn D-REIT H1’2023 Earnings Note
The report is themed “Strategic Financial Sustainability of Kenyan REITs Redefining Real Estate Investment,” where we discuss the background and structure of REITs in Kenya, and assess the financial performance of the current REITs in the market during H1’2023 in terms of operational metrics, profitability metrics, leverage ratios, liquidity ratios and valuation metrics. In addition, we highlight the outlook regarding our expectations for the REITs sector going forward. This we will cover as follows;
- Overview of the REITs Sector in Kenya,
- Themes that shaped the Real Estate Sector in H1’2023,
- Summary Performance of the REITS in H1’2023, and,
- Conclusion and Outlook for the REITs sector.
Section I: Overview of the REITs Sector in Kenya
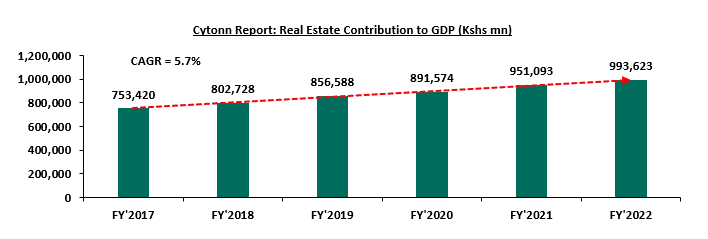
Through the years, Kenya’s Real Estate sector has continued to witness consistent growth, with the overall sectoral contribution to gross domestic product (GDP) recording a 5-year CAGR of 5.7% to Kshs 993.6 bn in 2022 from Kshs 753.4 bn in 2017. The chart below shows the Real Estate sector’s contribution to GDP from 2017 to 2022;
Source: Kenya National Bureau of Statistics (KNBS)
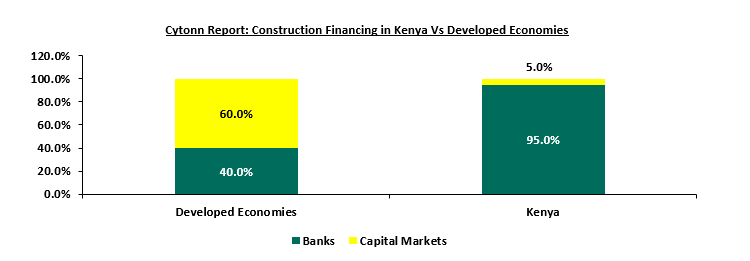
This growth of the Real Estate sector is underpinned by sustained construction activities in the country, prompted by a substantial demand for Real Estate developments. This is as the residential market bears an 80.0% housing deficit, as only 50,000 units are currently supplied annually against a demand of 200,000 units per year. In addition, the formal retail market is still nascent, with the penetration standing at approximately 30.0% according to the Nielsen Report 2018. Despite the existing demand in the Real Estate market, there exists limited funding options for developers. Banks in Kenya are the primary source of funding for Real Estate development, providing nearly 95.0% of funding for construction activities as opposed to 40.0% in developed countries. The graph below shows the comparison of construction financing in Kenya against developed economies;
Source: World Bank, Capital Markets Authority
Consequently, there needs to be alternative financing solutions for developers in order to meet this funding gap. In 2013, the Capital Markets Authority (CMA) put in place a framework for the operationalization of Real Estate Investment Trusts (REITs) in Kenya. REITS are regulated collective investment vehicles that enable the contribution of money’s worth as consideration for the acquisition of rights or interests in a trust that is divided into units with the intention of a person earning profits or income from Real Estate as a beneficiary of the trust. In order to safeguard the interests of a REIT, as well as to foster transparency and accountability, there are four key entities enshrined within the REIT structure in Kenya. These entities are as follows:
- The Promoter: The promoter is responsible for initiating the establishment of a REIT scheme. They serve as the initial issuer of REIT securities and undertake the process of submitting drafts of the trust deed, prospectus, or offering memorandum to regulatory authorities for necessary approvals. Notable REIT promoters in Kenya include Acorn Holdings Limited and LAP Trust,
- The REIT Manager: This is a company incorporated in Kenya that holds a license from the Capital Markets Authority (CMA) to offer Real Estate and fund management services on behalf of investors within a REIT scheme. REIT Managers in Kenya include; Acorn Investment Management, Stanlib Kenya Limited, Nabo Capital, ICEA Lion Asset Managers Limited, Fusion Investment Management Limited, H.F Development and Investment Limited, Sterling REIT Asset Management, Britam Asset Managers Limited, and CIC Asset Management Limited,
- The Trustee: A trustee is a corporation or company appointed under a trust deed and licensed by the CMA to hold Real Estate assets on behalf of REIT investors. The trustee plays a vital role in assessing the feasibility of investment proposals from the REIT Manager and ensuring that scheme assets are invested in line with the Trust Deed. Notable REIT trustees in Kenya include Kenya Commercial Bank (KCB), Co-operative Bank (Coop), and Housing Finance Bank, and,
- The Project/Property Manager: The project manager oversees the planning and execution of construction projects within REITs. On the other hand, the property manager's role involves the management of completed Real Estate developments acquired by REITs, with a primary focus on generating profits. Their responsibilities span both the development and operational phases of Real Estate assets within REITs.
The collaboration among these four entities within the REIT structure ensures the comprehensive management, oversight, and strategic growth of REITs, contributing to their operation as investment vehicles. The figure below illustrates the relationship between the key entities in a typical REITs structure
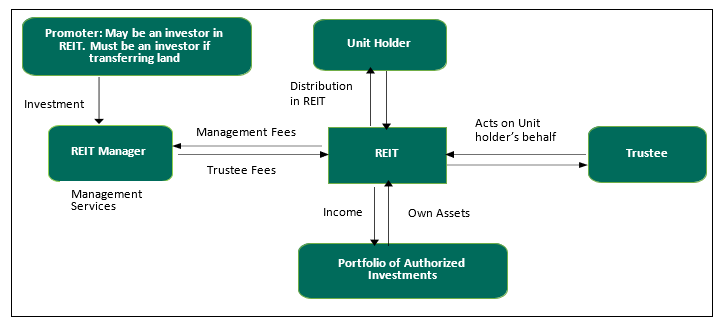
Source: Capital Markets Authority (CMA)
Notably, Kenya become the third African nation to launch REITs regulations and adopt a regulatory framework promoting REITs as an investment vehicle, following in the footsteps of Ghana and Nigeria, who had initiated their REIT frameworks in 1994 and 2007 respectively. Subsequently, South Africa became the fourth African country to launch REITs in 2013 after Kenya. However, despite Kenya being a relatively earlier entrant into the REIT market, its subsequent trajectory has been overshadowed by an underwhelming performance in comparison to countries such as South Africa. This is underscored by the fact that, Kenya currently only has four authorized REITs in Kenya as opposed to South Africa which boast of 33 listed REITs. Additionally, the Kenyan REITs market capitalization to Gross Domestic Product (GDP) remains low, in comparison to other countries. The dismal performance is attributable to factors such as; i) inadequate investor knowledge of the investment instrument, ii) lengthy approval procedures for REITs creation, iii) high minimum capital requirements of Kshs 100.0 mn for trustees, and, iv) minimum investment amounts set at Kshs 5.0 mn, among others which continue to limit the performance of REITs in Kenya. The graph below compares Kenya’s REIT market capitalization to GDP of other countries;
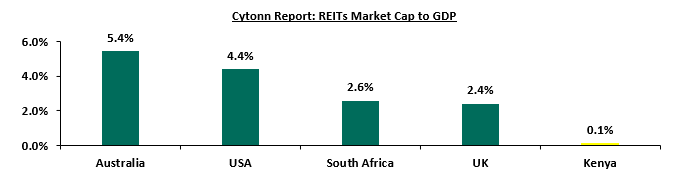
Source: World Bank, National Association of Listed REITs
Presently, all four authorized REITs in the Kenyan market are structured as closed-ended funds. Among them, ILAM Fahari I-REIT is the only one listed and trading on the Nairobi Securities Exchange (NSE) Main Investment Market, allowing its units to be transferred through the exchange. On the other hand, both Acorn Student Accommodation (ASA) I-REIT and D-REIT are not listed, but are instead traded on the Unquoted Securities Platform (USP); an over-the-counter market segment of the NSE. Additionally, LAPTrust Imara I-REIT is listed on the NSE’s Main Investment Market, under the Restricted Sub-Segment, with open trading of the securities restricted for a three-year period from March 2023. The table below highlights the REITs authorized by the CMA in Kenya;
|
Cytonn Report: Authorized REITs in Kenya |
||||||
|
|
Issuer |
Name |
Type of REIT |
Listing Date |
Market Segment |
Status |
|
1 |
ICEA Lion Asset Management (ILAM) |
Fahari |
I-REIT |
October 2015 |
Main Investment Market |
Trading |
|
2 |
Acorn Holdings Limited |
Acorn Student Accommodation (ASA) – Acorn ASA |
I-REIT |
February 2021 |
Unquoted Securities Platform (USP) |
Trading |
|
3 |
Acorn Holdings Limited |
Acorn Student Accommodation (ASA) – Acorn ASA |
D-REIT |
February 2021 |
Unquoted Securities Platform (USP) |
Trading |
|
4 |
Local Authorities Pension Trust (LAPTrust) |
Imara |
I-REIT |
November 2022 |
Main Investment Market: Restricted Sub-segment |
Restricted |
Source: Nairobi Securities Exchange, Capital Markets Authority
Section II: Themes that Shaped the REIT Sector in H1’2023
In this section, we delve into the pivotal themes that have profoundly influenced the REITs sector to the period H1’2023. Exploring the dynamic landscape, we analyze the impact of regulations, acquisitions, and capital raising activities on the trajectory of the REIT industry as we gain insights into the broader factors impacting the performance and direction of the REIT sector during this period.
- Regulations
REITs are officially established in accordance with the REIT Regulations and granted approval by the Capital Markets Authority (CMA) under Capital Markets Real Estate Investment Trusts Collective Investment Schemes) Regulations, 2013. Instead of adopting the form of companies, they are structured as trusts. The management of investment properties falls under the responsibility of a corporate REIT manager, duly licensed by the CMA. Units of listed REITs are traded on the Nairobi Securities Exchange (NSE), similar to shares of any other company under Main Market Segment and Unquoted Security Platform (USP), offering investors a liquid stake in Real Estate. Both individual and corporate investors have the opportunity to participate in a public offer on the NSE, as exemplified under the Regulations (2013).
Furthermore, the regulations stipulate that Kenyan REITs are mandated to distribute a minimum of 80.0% of distributable earnings to their unitholders. REITs automatically qualify for several tax exemptions such as the Income Tax Act (ITA), Value Added Tax (VAT), and Capital Gains Tax (CGT) under the authorization of Kenya Revenue Authority (KRA). Some of the recent regulatory transformations in the REITs industry include;
- Exemption from Income Tax Act
The Income Tax Act's Section 20 (1) (c) and (d) state that REITs and companies that REITs invest in do not have to pay the regular 30.0% Income Tax Rate (ITR) upon being registered with the Commissioner of Kenya Revenue Authority (KRA). Furthermore, any income that REITs distribute to their investors (unitholders) are not taxed.
However, this tax exemption does not cover the withholding tax imposed on interest income and dividends received by unitholders who are not exempted according to the first schedule of the ITA. The rates for this withholding tax are outlined in paragraph 5 of the third schedule of the Income Tax Act.
- Capital Gains Tax (CGT) exemptions
A capital gain occurs when the value at which a unit is transferred exceeds the adjusted cost of that unit. The difference between these values is subject to a tax rate of 15.0%. Therefore, any profit gained by a promoter or investors of a REIT from transferring property into the REIT is now subject to CGT at the revised rate of 15.0%, replacing the previous rate of 5.0% starting from 1 January 2023. Moreover, individuals who hold units in a REIT and decide to sell their ownership stake are also obligated to pay CGT. This requirement emerged due to an amendment to Section 34(1)(j) of the Income Act via the Finance Act 2022.
However, within the REIT industry, there are certain scenarios that qualify for exemptions from CGT:
- Transfers of property from life insurance companies to a REIT are exempt from CGT, as outlined in Section 19 (6B) of the Income Tax Act (ITA),
- Indirect transfer of property into a REIT when the promoter first transfers properties to a Special Purpose Vehicle (SPV). Subsequently, the shares of the investee company held by the SPV are transferred to the REIT. This is considered a restructuring, as the property transfer does not involve a third party. This exemption is based on Paragraph 13 of the Eighth Schedule to the ITA. However, CGT is applicable on gains made during the transfer of shares from the investee company to the REIT Trustee,
- Payments received by unit holders or shareholders in a REIT for unit redemption or share sale are exempt from CGT in accordance with section 20 (2) of the ITA,
- Gains realized by the REIT from the sale of properties, whether directly or through an SPV, are also exempt from CGT.
- Exemption from Value Added Tax (VAT)
The Finance Act 2021 reintroduced a significant change regarding the exemption from Value Added Tax (VAT) for transactions involving the transfer of assets to REITs and asset-backed securities. This exemption had previously been removed by the Tax Laws Amendment Act No. 2 of 2020.
According to Paragraph 33 of Part II of the First Schedule to the VAT Act 2021, a direct transfer of property from the REIT promoter or investors is not subject to VAT. However, if the transfer of assets to the REIT is done indirectly, through the initial transfer of assets to the investee company, VAT will be applicable. Importantly, the transfer of shares from a REITs SPV to the REIT trustee will be exempt from VAT, even if the initial asset transfer involved VAT.
- Adjustment in Stamp Duty
As per the regulations set out in section 96A of the Stamp Duty Act, when the properties within a Development REIT (D-REIT) are completed and start to generate stable income, any later transfer of these stabilized properties from the D-REIT to the Income REIT (I-REIT) is not subject to stamp duty. However, it is important to highlight that this exemption was only applicable to transactions completed before 31 December 2022. Consequently, starting from 1 January, 2023, any transfers occurring is subject to stamp duty in accordance with section 96A subsection 4 of the act.
Generally, the intricate nature of these regulations within the REITs and the convoluted rules applicable to REITs are proving to be challenging for individuals to navigate and comprehend fully. As a result, potential investors and stakeholders may feel unsure about the tax implications of their actions within the REIT framework. This uncertainty can lead individuals may become skeptical about the fairness and reliability of the investment environment, hindering them from capitalizing on potentially lucrative opportunities.
Furthermore, the lack of sufficient information available to the public about these REIT regulations exacerbates the problem. When individuals are not adequately informed about the tax consequences of their investment decisions, they may avoid making investments altogether or may not make informed choices, which could impact their financial gains.
Moving forward, we expect both the government and stakeholders in REITs sector will address these regulatory concerns and foster improved transparency and trust within the REIT sector such as; i) increasingly prioritise on making information accessible and easy to understand for the broader public to gain a clearer insight into the potential impact of their investment choices, ii) initiating educational campaigns and resources dedicated to informing investors about these regulations and any adjustments in law, iii) collaboration between regulatory authorities and industry stakeholders is imperative to elevate public awareness about the advantages and potential drawbacks linked with REIT investment, iv) offering unambiguous and easily understandable documentation outlining the tax implications tied to various investment scenarios is pivotal, and, v) establishing consultation services investors to access expert advice concerning tax-related aspects of REIT investments can alleviate reservations and uncertainties.
- Acquisitions
Acquisitions play a pivotal role in the dynamic landscape of the Kenyan REITs industry. These strategic moves signify the industry's evolution, adaptability, sustainability, and growth potential. As of June 30, 2023, the industry has witnessed noteworthy acquisitions that are reshaping the sector. These acquisitions hold a promising outlook for the industry, contributing to its progress and value proposition. They exemplify how REITs are actively enhancing their portfolios, expanding their market presence, and optimizing their performance. Some of the notable acquisition as at H1’2023 include;
- LAPTrust Imara I-REIT possess a diversified portfolio of properties which include; i) Pension Towers, Metro Park, and CPF House which are commercial office buildings located in Nairobi CBD, ii) Retail centre Freedom Heights mall located in Lang’ata, iii) Nova Pioneer which is a purpose built education facility located in Eldoret, iv) Freedoms Height residential apartments and serviced plot located in Lang’ata, and, v) Man apartments located in Kilimani,
- ILAM Fahari I-REIT manages and operates several properties under their portfolio which include: i) a mixed used development (MUD) Greenspan Mall located in Donholm, Nairobi, ii) 67 Gitanga Place which is a prime office property located in Lavington, and, iii) Bay Holdings and Highway House which are industrial properties located in Industrial Area and Mombasa Road area respectively,
- Acorn Student Accommodation (ASA) I-REIT has five completed student housing properties with 3,003 beds under their management serving up to 128 universities and colleges. These properties include; Qwetu Jogoo Road, Qwetu Ruaraka, Qwetu WilsonView in Lang’ata, Qwetu Parklands, and Qwetu Aberdare Heights I along Thika Road next to United States International University Africa (USIU-A). On the other hand, Acorn D-REIT boasts of four properties which are currently operational and six other properties under development bringing to a total of ten properties with 10,060 beds under its portfolio. Operational properties include; Qwetu Hurlingham, Qwetu Abedare Heights II, Qwetu Karen, Qejani Karen whereas properties under development include; Qwetu Chiromo, Qejani Chiromo, Qejani JKUAT next to Jomo Kenyatta University of Agriculture and Technology, Qejani Hurlingham, Qwetu KU, and Qejani KU next to Kenyatta University,
- During H1’2023 period, the ASA I-REIT and ASA D-REIT entered into a legally bidding agreement for the acquisition of Qwetu Hurlingham, along Arwings Kodhek Road. The property commenced operations in January 2022 and caters to serve tertiary- education students within Hurlingham area and surrounding regions, primarily targeting Daystar University, University of Nairobi (UoN) School of Medicine, Riara University and Strathmore University students. The transaction is scheduled to be finalized in Q3’2023. The acquisition decision by ASA I-REIT was driven by the impressive performance exhibited by the property since its inception, achieving stabilization within just 11 months of operation, and consistently high monthly occupancy rate of over 90.0% since project completion, and,
- Sale proceeds from the acquisition will serve a dual purpose as a significant portion of the funds will be allocated towards repaying of Kshs 860.6 mn which was part of the Acorn Green Bond issued by Acorn Holdings in partnership with PE Fund Helios in October 2019. The planned transfer of both Qwetu Hurlingham will make it the third project acquired by Acorn I-REIT, after successful acquisitions of Qwetu WilsonView in February 2021, and Qwetu Aberdare Heights I in October 2022. Additionally, the I-REIT is on another roadmap for a planned acquisition of Qwetu Aberdare Heights II with bed capacity of 601 in Ruaraka.
Moving forward, we expect the trend of strategic acquisitions to persist, with REITs actively seeking opportunities to broaden and diversify their portfolios, cater to evolving market demands and also set standards in promoting environmental sustainability such as execution of green bonds by Acorn holding. These acquisitions can also act as catalysts for innovation, driving the industry to explore new concepts, designs, and services to meet the expectations of both investors and tenants.
- Capital Raising
Capital raising is a crucial aspect of the REITs industry, driving growth, development, and innovation. The ability to secure funds from various sources either through debt or equity empowers REITs to expand their portfolios, enhance existing properties, and tap into new investment opportunities. This practice not only benefits the REITs themselves but also plays a significant role in shaping the Real Estate landscape and offering attractive investment avenues to stakeholders. Some of the notable capital infusion in the REITs industry as of H1’2023 include;
- Through injection of Kshs 4.3 bn equity raised from investors and Kshs 6.7 bn debt secured from Absa Bank Kenya PLC in February 2023, ASA D-REIT is currently developing student accommodation properties across Kiambu and Nairobi countries at a total cost of Kshs 11.0 bn for the next three years. Some of the projects under construction include; i) Qwetu Chiromo and Qejani Chiromo projects on Riverside drive at a cost of Kshs 833.0 mn and Kshs 852.2 mn respectively set to be opened in H1’2023, with a total bed capacity of 2,695, ii) Qejani JKUAT at a cost of Kshs 639.6 mn, iii) Qejani Hurlingham at a cost of Kshs 772.2 mn to supplement supply on Qwetu Hurlingham phase one offering, with a total bed capacity of 1,280, and, iv) Qwetu KU and Qejani KU at a cost of Kshs 717.6 mn and Kshs 815.8 mn respectively, expected to deliver 2,186 beds to the D-REIT portfolio,
- In March 2023, Kenya's long-standing pension scheme, the Local Authorities Pension Trust (LapTrust) listed the inaugural Income-Real Estate Investment Trust (I-REIT) by a pension fund on the NSE, a ceremony presided over by President William Ruto. The I-REIT dubbed 'LAPTrust Imara I-REIT', holds profound importance for government pension schemes and the broader Kenyan capital markets, presenting investors with an exceptional chance to participate in a diversified collection of income-generating Real Estate assets. Furthermore, this move is expected to encourage other pension funds, particularly those heavily invested in physical assets, to unlock liquidity for the betterment of pensioners. For more information, see our Cytonn Monthly-October 2022,
- During the same period, CMA collaborated with key market stakeholders, including the Sanduku Investment Initiative, the Association of Pension Trustees and Administrators of Kenya (APTAK), and the Nairobi Securities Exchange (NSE), to establish the Kenya National REIT (KNR). With a focus on affordable housing and infrastructure, this initiative falls under the purview of the Sanduku Investment Initiative. For more information, see our Cytonn weekly #06/2023, and,
- Additionally during this period, ILAM Fahari I-REIT proposed the sale of two properties valued at Kshs 200.4 mn, as part of its strategy to divest non-core assets and reorganize its operations. The properties earmarked for sale include Highway House, a three-story industrial building situated off Mombasa Road in Nairobi, currently vacant following the departure of the former tenant, and Bay Holdings, fully leased to Imperial Bank, Packard Limited, and Architecture Supply Limited, located in Nairobi's Industrial Area. The sale process is anticipated to conclude by December 2023. Fahari initially acquired these properties in 2016 for a total of Kshs 324.8 mn, resulting in a 33.8% loss on the disposals before accounting for the rental income accumulated over the years.These planned asset sales will leave the I-Reit with only two remaining properties: the Greenspan Mall, a retail center in Donholm, and the commercial office building 67 Gitanga Place in Lavington. This adjustment will lower the fund's investment property value from Kshs 3.2 bn to Kshs 2.9 bn while significantly augmenting its cash holdings. In terms of new acquisitions, Fahari has yet to initiate property purchases but is actively considering the development of a portion of the vacant land at Greenspan Mall.
Looking ahead, the trend of capital raising is set to continue shaping the trajectory of the Kenyan REITs industry. The injection of equity and debt, as well as strategic partnerships among private investors and government interaction, will remain vital drivers of expansion and unlocking new avenues such as affordable housing and infrastructure development projects, aligning with market demands and government priorities. As the industry advances, collaborations, regulatory support, and investor education will play pivotal roles in ensuring that capital raising continues to yield positive outcomes and drive the Kenyan REITs industry toward a vibrant and sustainable future.
Section III: Summary Performance of the REITs in H1’2023
The tables below highlight the performance of the Kenyan REITs sector, showing the performance using several National Association of Real Estate Investments Trusts (NAREIT) approved metrics, and the key take-outs;
(All values in Kshs mns unless stated otherwise)
|
Cytonn Report: Summary Performance Kenya REITs in H1’2023 |
||||||||||||||
|
|
Laptrust Imara I-REIT |
ILAM Fahari I-REIT |
Acorn I-REIT |
Acorn D-REIT |
H1’2022 Total |
H1’2023 Total |
y/y |
|||||||
|
H1'2023 |
H1'2022 |
H1'2023 |
y/y Change |
H1'2022 |
H1'2023 |
y/y Change |
H1'2022 |
H1'2023 |
y/y Change |
|
change |
|||
|
Operating Metrics |
||||||||||||||
|
Net Operating Income (NOI) |
99.6 |
86.2 |
86.0 |
(0.2%) |
139.4 |
128.0 |
(8.2%) |
233.3 |
334.2 |
43.2% |
458.9 |
647.9 |
41.2% |
|
|
Profitability Metrics |
||||||||||||||
|
Funds from Operations |
99.6 |
86.2 |
86.0 |
(0.2%) |
188.8 |
149.8 |
(20.7%) |
233.3 |
334.2 |
43.2% |
508.3 |
669.7 |
31.7% |
|
|
Adjusted FFO |
99.6 |
82.8 |
84.4 |
2.0% |
188.8 |
149.8 |
(20.7%) |
233.3 |
334.2 |
43.2% |
505.0 |
668.1 |
32.3% |
|
|
Cash Available for Distribution (CAD) |
99.6 |
86.2 |
86.0 |
(0.2%) |
144.1 |
92.8 |
(35.6%) |
- |
- |
- |
230.3 |
278.5 |
20.9% |
|
|
Cash Amounts Distributed |
0.0 |
0.0 |
0.0 |
|
64.0 |
87.0 |
35.9% |
- |
- |
- |
64.0 |
87.0 |
35.9% |
|
|
Valuation Metrics |
||||||||||||||
|
Net Asset Values (NAV) |
7,024.3 |
3,538.9 |
3,392.8 |
(4.1%) |
4,720.4 |
6,342.1 |
34.4% |
5,575.6 |
6,547.7 |
17.4% |
13,834.8 |
23,306.6 |
68.5% |
|
Source: Cytonn Research
Key takeaways from the table include:
- Combined Net Operating Incomes (NOI) of Kenyan REITs recorded a 41.2% growth to Kshs 647.9 mn in H1’2023, from Kshs 458.9 mn in H1’2022. The performance during the period was mainly supported by a 43.2% growth in the reported net operating income of Acorn D-REIT, to come in at Kshs 334.2 mn from Kshs 233.3 mn realized in H1’2022 respectively. In addition, LAPTrust Imara I-REIT reported a significant NOI at Kshs 99.6 mn, which further contributed to the positive performance,
- Combined Funds from Operations (FFO) of Kenyan REITs increased by 31.7% in H1’2023 to Kshs 669.7 mn from Kshs 508.3 mn in H1’2022, whereas Adjusted FFOs for Kenyan REITs also increased by 32.3% to Kshs 668.1 mn in H1’2023 from Kshs 505.0 mn in H1’2022. This was on the back of significant increases in the reported NOIs during the period. The performance was however weighed down by an 8.2% decrease in the NOI of Acorn I-REIT to Kshs 128.0 mn from Kshs 139.4 mn in H1’2022, which consequently led to a 20.7% decrease in the I-REIT’s FFOs and Adjusted FFOs to Kshs 149.8 mn from Kshs 188.8 mn in H1’2022 respectively,
- The REITs combined Cash amounts available for paying dividends to REIT investors which we measured using the Cash Available for Distribution (CAD) metric increased by 20.9% in H1’2023 to Kshs 278.5 mn from Kshs 230.3 mn in H1’2022. The performance was propelled by Laptrust Imara I-REIT’s distributable earnings which stood at Kshs 99.6 mn, despite a notable decline in Acorn I-REITs distributable earnings. Acorn I-REIT’s distributable earnings declined by 35.6% to Kshs 92.8 mn from Kshs 144.1 mn in H1’2022,
- Notably, only Acorn I-REIT’s REIT manager recommended an interim dividend of Kshs 0.30 per unit, with the total cash distributed in H1’2023 amounting to Kshs 87.0 mn. Conversely, ILAM Fahari I-REIT, LAPTrust Imara I-REIT, and Acorn D-REIT REITs managers did not recommend interim dividends for the period H1’2023, and,
- Combined Net Asset Values for Kenyan REITs increased by 68.5% to reach an all time high of Kshs 23,306.6 mn in H1’2023, from Kshs 13,834.8 mn in H1’2022. This was attributable to 34.4% and 17.4% growths in the net asset values of Acorn I-REIT and Acorn D-REIT’s to Kshs 6,342 and Kshs 6,547.7 mn in H1’2023 from Kshs 4,720.4 and Kshs 5,575.6 mn in H1’2022 respectively.
The table below makes a comparison of the leverage and liquidity ratios of all four Kenyan REITs during H1’2023 and H1’2022;
|
Cytonn Report: Leverage & Liquidity ratios of Kenyan REITs |
||||||||||||
|
|
LAPTrust Imara I-REIT |
ILAM Fahari I-REIT |
Acorn I-REIT |
Acorn D-REIT |
H1’2022 Weighted Average* |
H1’2023 Weighted Average** |
||||||
|
H1'2023 |
H1'2022 |
H1'2023 |
y/y Change |
H1'2022 |
H1'2023 |
y/y Change |
H1'2022 |
H1'2023 |
y/y Change |
|
||
|
Leverage Ratios |
||||||||||||
|
Debt to Equity |
0.0x |
0.0x |
0.0x |
0.0x |
0.0x |
0.0x |
0.0x |
0.6x |
0.6x |
1.0x |
0.3x |
0.2x |
|
Debt to Total Market Cap |
0.0% |
0.0% |
0.0% |
0.0% |
0.0% |
0.0% |
0.0% |
59.3% |
64.0% |
4.7% |
29.2% |
19.3% |
|
Debt to Gross Book Value |
0.0% |
0.0% |
0.0% |
0.0% |
0.0% |
0.0% |
0.0% |
34.1% |
35.1% |
1.0% |
16.8% |
10.6% |
|
Debt to EBITDA Multiple |
0.0x |
0.0x |
0.0x |
0.0% |
0.0x |
0.0x |
0.0% |
14.2x |
11.8x |
(16.6%) |
7.0x |
3.6x |
|
|
||||||||||||
|
Debt Service Coverage |
0.0 |
0.0 |
0.0 |
0.0% |
0.0 |
0.0 |
0.0% |
6.8% |
8.1% |
1.3% |
3.3% |
2.5% |
|
Implied Cap Rate |
1.4% |
9.6% |
12.3% |
2.6% |
3.1% |
2.0% |
(1.2%) |
2.5% |
3.2% |
0.8% |
3.4% |
2.7% |
|
*Market cap weighted as at 30/06/2022 |
||||||||||||
|
**Market cap weighted as at 30/06/2023 |
||||||||||||
Source: Cytonn Research
Key takeaways from the table include;
- Majority of the REITs remained ungeared during H1’2023, with their leverage ratios remaining at zero except Acorn D-REIT. Acorn D-REIT debt ratios increased in H1’2023 on account of a 19.5% growth in its long-term borrowings to Kshs 3.9 bn from Kshs 3.3 bn in H1’2022,
- Notably, Acorn D-REIT’s Debt to EBITDA Multiple reduced to 11.8x in H1’2023, from 14.2x recorded in H1’2022. This was on the back of a faster growth in the REIT’s EBITDA compared to its long-term borrowings. Acorn D-REIT EBITDA in H1’2023 increased by 42.3% to Kshs 334.2 mn from Kshs 233.3 mn in H1’2022, compared to a 19.5% growth in the REIT’s long-term debt, and,
- ILAM Fahari I-REIT traded at the highest implied capitalization rate of 12.3%, indicating that it offers a higher return on investment compared to all other REITs. Contrarily, LAPTrust Imara I-REIT had the lowest implied capitalization rate of 1.4%. However, despite the performance, we expect that the LAPTrust Imara I-REIT performance will improve gradually, considering that the REIT is still in its initial year of operation.
The table below presents a summary of key valuation metrics of Kenyan REITs in H1’2023;
|
Cytonn Report: Valuation Metrics for Kenyan REITs |
||||||||||
|
|
LAPTrust Imara I-REIT |
ILAM Fahari I-REIT |
Acorn I-REIT |
Acorn D-REIT |
||||||
|
H1'2023 |
H1'2022 |
H1'2023 |
y/y Change |
H1'2022 |
H1'2023 |
y/y Change |
H1'2022 |
H1'2023 |
y/y Change |
|
|
Price/FFO per share multiple |
69.5x |
12.6x |
12.7x |
3.0% |
24.7x |
41.6x |
68.8% |
23.9x |
18.5x |
(22.7%) |
|
Dividend Yield |
- |
0.0% |
0.0% |
0.0% |
1.4% |
1.4% |
0.1% |
- |
- |
- |
|
Dividend Coverage/Payout Ratio |
0.0 |
0.0% |
0.0% |
0.0% |
44.4% |
93.7% |
49.3% |
- |
- |
- |
|
NAV per share |
20.3 |
19.6 |
18.7 |
(4.1%) |
21.2 |
22.0 |
3.7% |
23.9 |
25.3 |
6.0 |
Source: Cytonn Research
- LAPTrust Imara I-REIT units are trading at a premium relative to its peers, with a price to FFO per share multiple of 69.5. Comparatively, ILAM Fahari I-REIT units are trading at a discount with a price to FFO per share multiple of Kshs 12.7,
- Acorn I-REIT dividend yield currently stands at 1.4%. ILAM Fahari I-REIT, LAPTrust Imara I-REIT and Acorn D-REIT did not pay any dividends during the period. Distinctly, Imara LAPTrust Imara I-REIT has not issued any dividend distributions since it began its operation earlier this year, and Acorn D-REIT is yet to issue dividends since it began its operations in 2021. The initial strategic priority for Acorn D-REIT was centered around property development and exit upon successful stabilization. Due to this, it was envisioned that the initiation of dividend distributions for the D-REIT commence after the completion of its third year of operations,
- Imara LAPTrust Imara I-REIT, ILAM Fahari and Acorn D-REIT REIT did not pay out dividends during H1’2023 This was on account of REIT managers not recommending interim dividend distributions for LAPTrust Imara I-REIT and ILAM Fahari respectively, and Acorn D-REIT’s three-year grace period in relation to paying out dividends. Conversely, Acorn I-REIT dividend payout came in at 93.7%, in line with REITs regulation in Kenya which require that REITs distribute at least 80.0% of their net profits after tax as dividends, and,
- Acorn D-REIT recorded the highest NAV per share at Kshs 25.3, and, ILAM Fahari had the lowest NAV per share at Kshs 18.7. Notably, all REITs share prices are in line with their NAV per shares, with the exception of ILAM Fahari I-REITs shares that are trading at a discount its NAV per share.
Section IV: Conclusions, Recommendations, and Outlook for the REITs Sector
The performance of the REITs market in Kenya has been marked by a moderate trajectory, influenced by a range of contributing factors. Noteworthy, despite the overall challenges, there are positive indicators within the Kenyan REIT landscape. Notably, net operating incomes have displayed growth, reflecting improved financial performances. Additionally, leverage ratios for most REITs remained strikingly low, as majority of the REITs remain ungeared with most leaning towards short-term debt to sustain their operations. We anticipate that this trend will continue to persist going forward, in line with REITs fear of overexposure to interest rates, particularly in the current rising interest rates environment. In support of this, we expect to see more developments along financial sustainability commitment as demonstrated by key sector players such as Acorn Holdings, through the issuance of its green bond. Additionally, we anticipate that the recent regulatory proposition by the Capital Markets Authority (CMA) to reduce minimum investment amounts for professional investors to Kshs 10,000 will invigorate interest in the sector, potentially attracting a broader investor base.
Based on our research and analysis, we make the following recommendations to enhance the REITs sector through a more informed and strategic approach:
- Enhancing Stakeholder Education: All key stakeholders need to be educated on the REIT structure. within governmental bodies. For instance, there have been reported challenges pertaining to the challenge of acquiring a KRA PIN due to an agency's unfamiliarity with the intricacies of the REIT structure. As such, addressing this informational gap is crucial to streamline administrative processes,
- Expanding Legal Framework: In South Africa, REITs legal and operational framework allow for different legal entities to establish REITs as opposed to Kenya where the same is limited to trusts only. In light of this, it is prudent to introduce flexibility in the legal entities permissible for REIT establishment. While Kenya currently allows only trust-based formations, broadening the scope to encompass companies, partnerships, and trusts would promote diversity and cater to different organizational preferences,
- Introduce Hybrid REIT Vehicles: Currently, investors have to subscribe to both of the separate REIT classes, forcing them to pay duplicate costs, due to the nature of exclusivity of the two. A hybrid REIT would provide investors integrated returns, by combining the higher return from development while reducing risk exposure through the relatively stable income component of the I-REIT. In addition, an IPO with such a hybrid REIT vehicle would eliminate the duplicated costs of running two separate REITs, thereby improving subscriptions by investors. Introducing a hybrid REIT within a unified structure would thus enable investors to capitalize on the strengths of both investment types, potentially leading to more balanced risk-reward profiles,
- Gradual Public Listing Requirement: Recognizing the concerns of companies regarding an immediate transition to public listing, we advocate for a gradual, phased approach. Allowing REITs an initial period of private operation before enforcing mandatory public listing will serve to facilitate a smoother transition and conforms to the comfort thresholds of corporate entities,
- Inclusive Corporate Trusteeship: A pivotal change involves the incorporation of Corporate Trustees, akin to the practices in the pension market. Furthermore, we recommend the reduction of the minimum capital requirement which currently stands at Kshs 100.0 mn, as this financial threshold currently confines trusteeship options to banking institutions exclusively,
- Introduce Tokenization of REITs: Introducing the concept of tokenization for REITs presents an innovative solution and has the potential to amplify market participation. This would facilitate the ownership of REIT units in smaller denominations, even as low as Kshs 100.0, and,
- Diminishing Entry Barriers: Reconsideration of the steep Kshs 5.0 mn minimum for D-REITs is vital to eliminate entry barriers that inadvertently limit individual market entry. A revised minimum could promote a more inclusive investment landscape.
In conclusion, the potential of REITs remains promising despite the challenges faced by the Kenyan market. Serving as a means to amplify liquidity and diversify financing within the Real Estate sector, REITs provide an alternate avenue for development funding, while offering the potential to generate returns for investors. While Kenya's REIT journey has been marked by hurdles, the proposed changes in investment thresholds and the demonstrated resilience within the financial metrics of certain REITs suggest a potential resurgence in the sector.
For the full Cytonn Kenya’s REITs H1’2023 Report, click here
Disclaimer: The views expressed in this publication are those of the writers where particulars are not warranted. This publication, which is in compliance with Section 2 of the Capital Markets Authority Act Cap 485A, is meant for general information only and is not a warranty, representation, advice or solicitation of any nature. Readers are advised in all circumstances to seek the advice of a registered investment advisor

- Talk to us
- Kenya
- P.O Box 20695 - 00200, Nairobi, Kenya
- Cell +254709101200
- Tel +254709101200
- WhatsApp +254741676635
- United States
- +254709101200
- DOWNLOAD OUR APP
-


- Kenya
- 8th Floor, Pinetree Plaza, Kaburu Drive, Ngong Road, Nairobi, Kenya
- USA
- Suite 1150, 1775 Eye Street NW, USA, Washington DC 20006, USA
- Investments
- High Yield
- Private Equity
- Real Estate
- Real Estate
- RiverRun Estates
- Cytonn Towers
- The Ridge
- Taraji Heights
- The Alma