Nairobi Metropolitan Area Mixed-Use Developments (MUDs) Report-2020 & Cytonn Weekly #51/2020
By Research Team, Dec 20, 2020
Executive Summary
Fixed Income
T-bills remained undersubscribed, with the overall subscription rate coming in at 90.4%, an increase from 41.1% the previous week. This can be mainly attributed to the continued tightening of liquidity in the market as evidenced by 1.0% points increase in the average interbank rate to 5.1% from 4.1%, recorded last week. The highest subscription rate was on the 91-day paper which increased to 215.7% from 38.8% recorded the previous week. The Energy and Petroleum Regulatory Authority (EPRA) released the monthly prices of the petroleum products which increased by 0.9%, 1.2% and 2.3% for Petrol, Diesel and Kerosene prices respectively;
Equities
The equities market was on an upward trajectory, with NASI, NSE 20 and NSE 25 all gaining by 0.6%, 0.2% and 0.1%, respectively, taking their YTD performance to losses of 11.0%, 32.3%, and 19.6%, for NASI, NSE 20 and NSE 25, respectively. The equities market performance was mainly driven by gains recorded by large cap stocks such as Safaricom and NCBA Group of 1.7% and 0.9%, respectively. Other major notable gains were recorded in Stanbic holdings, Kenya Reinsurance and Jubilee Holdings which gained by 9.0%, 6.6% and 5.6%, respectively. The gains were however weighed down by losses recorded by large-cap stocks such as Bamburi, ABSA Bank and DTBK of 10.0%, 4.2% and 2.9%, respectively;
The Central Bank of Kenya (CBK) released the Bank Supervision Annual Report 2019 highlighting that the sector’s gross loans and advances increased by 8.8% to Kshs 2.7 tn in FY’2019, from Kshs 2.5 tn in FY’2018;
Following the approval granted by the Capital Markets Authority (CMA), the Nairobi Securities Exchange (NSE) launched the Unquoted Securities Platform (USP), a market infrastructure that will facilitate the trading, clearing and settlement of securities of unlisted companies;
Real Estate
According to the Central Bank of Kenya (CBK) Bank Supervision Annual Report 2019, the mortgage loan accounts registered a 6.0% increase to 27,993 from 26,504 reported in December 2018. In the residential sector, the Kenya Mortgage Refinance Company (KMRC), a state backed mortgage firm offered KCB Group, Housing Finance, Stima Sacco and Nyandarua Sacco Kshs 2.64 bn home loans at an interest rate of 5.0%. In the retail sector, Naivas, a local retail chain opened its 69th branch in Rongai completing a series of outlets that they had initially announced would be opened within the Nairobi Metropolitan Area earlier this year. In the hospitality sector, Sarova Group of Hotels and Resorts announced that it has ventured into the restaurant business to cushion themselves against the effects of the pandemic which has hurt some of its outlets like Sarova Stanley and Sarova Panafric. Radisson Blu, an international hotel chain announced that it has halted the operations of its Nairobi UpperHill branch as bookings remain low due to the COVID-19 Pandemic. In addition, Serena Group of Hotels reopened its Mombasa beach resort after eight and a half months of closure on 15th of December;
On Statutory review, the President of Kenya, Uhuru Kenyatta signed into law the Sectional Properties Act 2019 which provides for the division of buildings into units to be owned by individual proprietors and common property to be owned by proprietors of the units as tenants in common, and, the Statute Law (Miscellaneous Amendments) 2020 Bill which amended 21 statutes among them the Kenya Roads Board Act 1999 (No.7 of 1999 and The Housing Act (Cap.117);
Focus of the Week
This week we update our Nairobi Metropolitan Area Mixed-Use Developments (MUDs) Report 2019, by focusing on Mixed-Use Developments’ performance against the single-use market performance of the residential, commercial office, and retail sectors within the Nairobi Metropolitan Area. In terms of performance, Mixed-Use Developments recorded average rental yields of 7.1% in 2020, 0.3% points higher than the respective single-use retail, commercial office and residential themes average of 6.8%, attributed to the MUDs prime locations, mostly serving the high and growing middle class who have been attracted by the mixed-use concept due to convenience as a result of incorporated working, shopping and living spaces. The investment opportunity for mixed-use themed developments lies in Westlands which recorded an average MUD yield of 8.5%, and, Limuru Road and Karen recording average MUD yields of 7.3% each.
- Weekly Rates:
- Cytonn Money Market Fund closed the week at a yield of 10.73%. To invest, just dial *809#;
- Cytonn High Yield Fund closed the week at a yield of 13.41% p.a. To invest, email us at sales@cytonn.comand to withdraw the interest you just dial *809#;
- Solomon Kariuki, an Investment and Research Assistant at Cytonn Investments was at CNBC Africa talking about the expected impact of the decision by Somalia to cut diplomatic ties with Kenya. Watch Solomon here;
- For an exclusive tour of Cytonn’s real estate developments, visit: Sharp Investor's Tourand for more information, email us at sales@cytonn.com;
- We shall be handing over Phase 3 of the Alma project on the 22nd of December 2020. To register to attend click here;
- We continue to offer Wealth Management Training daily, from 9:00 am to 11:00 am, through our Cytonn Foundation. The training aims to grow financial literacy among the general public. To register for any of our Wealth Management Training, click here;
- For Pension Scheme Trustees and members, we shall be having different industry player’s talk about matters affecting Pension Schemes and the pensions industry at large. Join usevery Wednesday from 9:00 am to 11:00 am for in-depth discussions on matters pension;
- If interested in our Private Wealth Management Training for your employees or investment group, please get in touch with us through wmt@cytonn.com;
- We have 10 investment-ready projects, offering attractive development and buyer targeted returns. See further details here: Summary of Investment-ready Projects;
- We are currently running a Christmas offer on some of our Real Estate projects, email at us at sales@cytonn.com for more information;
- For recent news about the company, see our news section here.
Money Markets, T-Bills & T-Bonds Primary Auction:
Subscription rates for the Treasury bills Improved to 90.4% from 41.1% the previous week. Despite the tight liquidity in the money market. The investors shifted their preference to the 91-day paper, which had the highest subscription rate increasing to 215.7% from 38.8% recorded the previous week. The subscription for the 182-day paper increased to 78.6% from 30.2%, while that of the 364-day paper, declined to 52.1% from 52.8% recorded the previous week. The yields on the 91-day, 182-day and 364-day increased by 2.0 bps, 3.0 bps and 4.0 bps to 6.9%, 7.4% and 8.3%, respectively. The government continued to reject expensive bids with the acceptance rate declining marginally to 98.4%, from 98.7% recorded the previous week, accepting bids worth Kshs 21.3 bn out of the Kshs 21.7 bn worth of bids received.
The Treasury has offered a tap sale for two 15-year bonds, FXD1/2012/15 and FXD2/2019/15, with effective tenors of 7 years and 14 years, respectively and are seeking to raise Kshs 22.0 bn. The bonds have fixed coupon rates of 11.0% and 12.7%, respectively. The period of sale runs from 15th Dec 2020 to 23rd Dec 2020 or upon attainment of the amount offered.
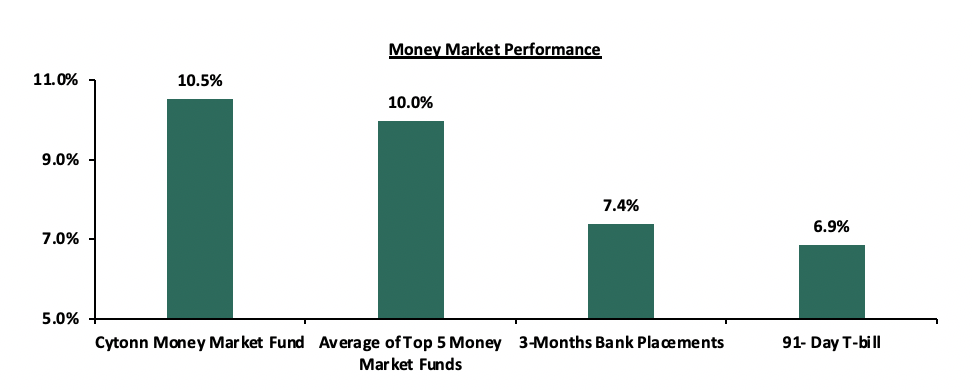
In the money markets, 3-month bank placements ended the week at 7.4% (based on what we have been offered by various banks), while the yield on the 91-day T-bill increased by 2.0 bps to 6.9%. The average yield of Top 5 Money Market Funds remained unchanged at 10.0%, as recorded the previous week. The yield on the Cytonn Money Market also remained unchanged at 10.5%, recorded the previous week.
Liquidity:
During the week, liquidity in the market continued to tighten with the average interbank rate increasing by 1.0% points, to 5.1% from 4.1% recorded the previous week, attributable to the end of the monthly Cash Reserve Requirement (CRR) cycle for the month of December which ended on the 14th. The average interbank volumes increased by 46.9% to Kshs 15.6 bn, from Kshs 10.6 bn recorded the previous week. According to the Central Bank of Kenya’s weekly bulletin, released on 18th December 2020, commercial banks’ excess reserves came in at Kshs 26.2 bn in relation to the 4.25% Cash Reserve Ratio.
Kenya Eurobonds:
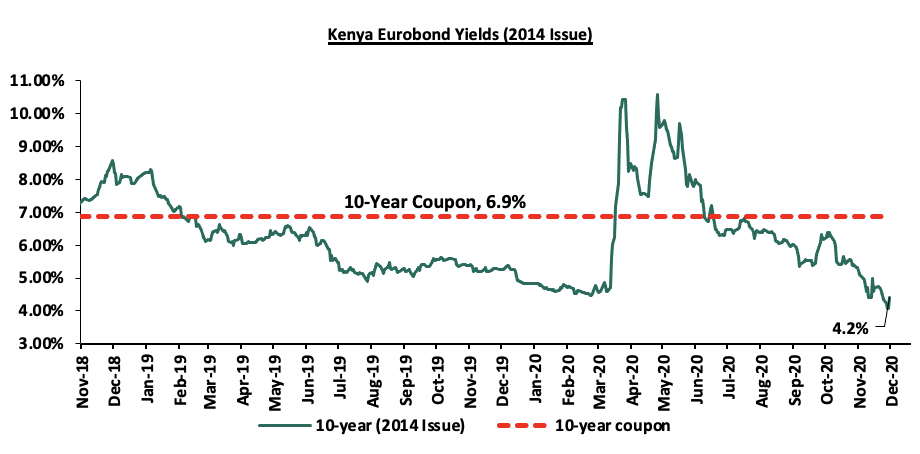
During the week, the yields on all Eurobonds recorded an increase. According to Reuters, the yield on the 10-year Eurobond issued in June 2014 increased by 0.1% points to 4.2% from 4.1%, as was recorded the previous week.
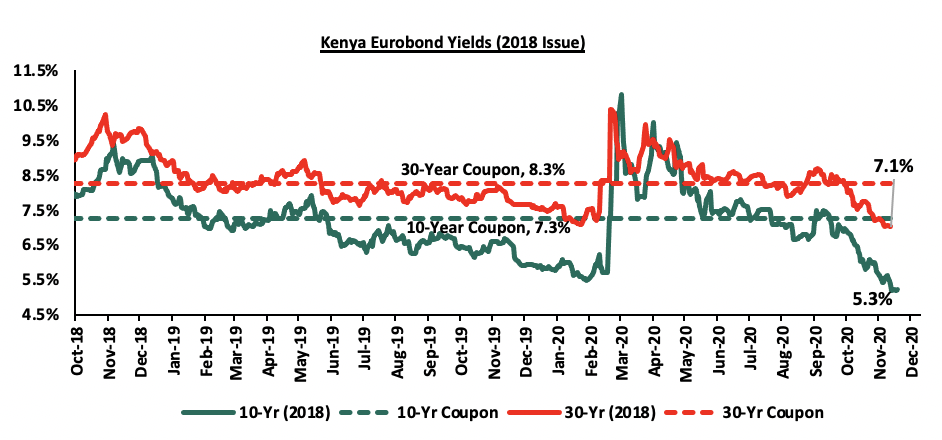
During the week, the yields on the 10-year and 30-year Eurobonds issued in 2018 both increased by 0.1% points with the 10-year issue increasing to 5.3% from 5.2%, and the 30-year issue increasing to 7.1% from 7.0%, recorded last week.
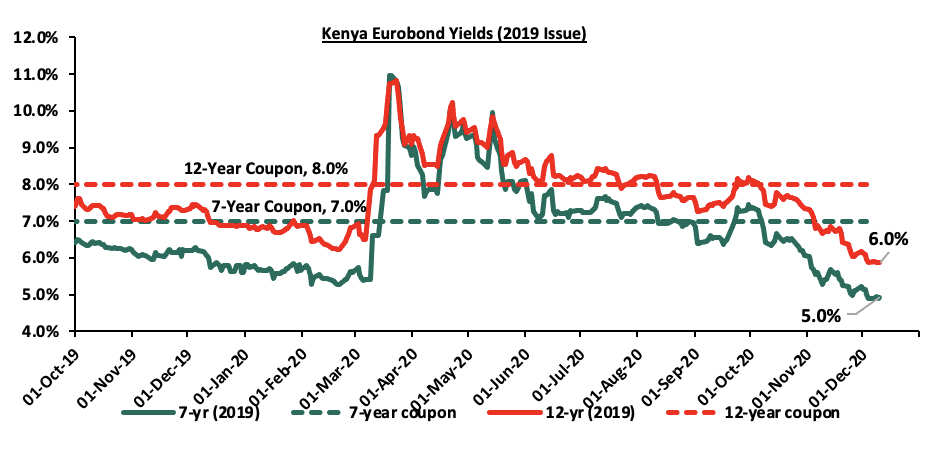
During the week, the yields on the 2019 dual-tranche Eurobonds both increased by 0.1% with the 7-year Eurobond increasing to 5.0% from 4.9%, and, the 12-year Eurobond increasing to 6.0% from the 5.9%, recorded last week.
Kenya Shilling:
During the week, the Kenyan shilling depreciated against the US dollar by 0.1% to an all-time low of Kshs 111.6 from Kshs 111.4 recorded last week. This is partly attributable to demand for hard currency remaining subdued amid slow activity as companies closed down for the festive season. On a YTD basis, the shilling has depreciated by 10.1% against the dollar, in comparison to the 0.5% appreciation in 2019. We expect continued pressure on the Kenyan shilling due to:
- Demand from merchandise traders as they beef up their hard currency positions ahead of the festive season, amid a slowdown in foreign dollar currency inflows, and,
- Continued uncertainty globally making people prefer holding dollars and other hard currencies.
However, in the short term, the shilling is expected to be supported by:
- The Forex reserves which are currently at USD 7.8 bn (equivalent to 4.8-months of import cover), which is above the statutory requirement of maintaining at least 4.0-months of import cover, and the EAC region’s convergence criteria of 4.5-months of import cover, and,
- Improving diaspora remittances evidenced by a 17.3% y/y increase to USD 263.1 mn in October 2020, from USD 224.3 mn recorded over the same period in 2019, has cushioned the shilling against further depreciation,
Weekly Highlight:
During the week, the Energy and Petroleum Regulatory Authority (EPRA) released their monthly statement on the Maximum wholesale and retail prices in Kenya effective from 15th December 2020 to 14th January 2021. Below are the key take-outs from the statement:
- Petrol prices have increased by 0.9% to Kshs 106.9 per litre from Kshs 105.9 per litre previously, while diesel prices increased by 1.2% to Kshs 91.8 per litre from Kshs 90.7per litre. Kerosene prices also rose by 2.3% to Kshs 83.5 per litre from Kshs 81.6 per litre.
- The changes in prices have been attributed to:
-
- An increase in the average landed cost of imported super petrol by 0.7% to USD 318.7 per cubic from USD 316.6 per cubic meter in October 2020,
- Average landed costs for diesel increased by 1.8% to USD 293.9 Per cubic meter from USD 288.8 per cubic meter in October 2020,
- Landed costs for kerosene also increased by 6.2% to USD 277.3 per cubic meter from USD 261.2 Per cubic meter in October 2020,
- A 7.2% increase in Free on Board (FOB) price of Murban crude oil lifted in November 2020 to USD 43.0 per barrel, from USD 40.2 per barrel in October 2020, and,
- The Kenyan shilling depreciation by 1.1% against the dollar to close at Kshs 110.4 in November 2020, from Kshs 109.1 in October 2020.
We expect an increase in the transport and fuel index which carries a weighting of 8.7% in the total consumer price index (CPI) as a result of the increase in petrol and diesel at 0.9% and 1.2%, respectively which will consequently result to an increase in the prices of other commodity baskets like food prices due to higher transport costs.
Rates in the fixed income market have remained relatively stable due to the high liquidity in the money markets, coupled with the discipline by the Central Bank as they reject expensive bids. The government is 26.6% ahead of its prorated borrowing target of Kshs 224.4 bn having borrowed Kshs 284.2 bn. In our view, due to the current subdued economic performance brought about by the effects of the COVID-19 pandemic, the government will record a shortfall in revenue collection with the target having been set at Kshs 1.9 tn for FY’2020/2021 thus leading to a larger budget deficit than the projected 7.5% of GDP, ultimately creating uncertainty in the interest rate environment as additional borrowing from the domestic market may be required to plug the deficit. Owing to this uncertain environment, our view is that investors should be biased towards short-term to medium-term fixed income securities to reduce duration risk
Markets Performance
During the week, the equities market was on an upward trajectory, with NASI, NSE 20 and NSE 25 all gaining by 0.6%, 0.2% and 0.1%, respectively, taking their YTD performance to losses of 11.0%, 32.3%, and 19.6%, for NASI, NSE 20 and NSE 25, respectively. The equities market performance was mainly driven by gains recorded by large cap stocks such as Safaricom and NCBA Group of 1.7% and 0.9%, respectively. Other major notable gains were recorded by Stanbic holdings, Kenya Reinsurance and Jubilee Holdings which gained by 9.0%, 6.6% and 5.6%, respectively. The gains were however weighed down by losses recorded by large-cap stocks such as Bamburi, ABSA Bank and DTBK of 10.0%, 4.2% and 2.9%, respectively.
Equities turnover declined by 23.3% during the week to USD 18.4 mn, from USD 24.1 mn recorded the previous week, taking the YTD turnover to USD 1.4 bn. Foreign investors remained net sellers during the week, with a net selling position of USD 2.3 mn, from a net selling position of USD 1.6 mn recorded the previous week, taking the YTD net selling position to USD 279.8 mn.
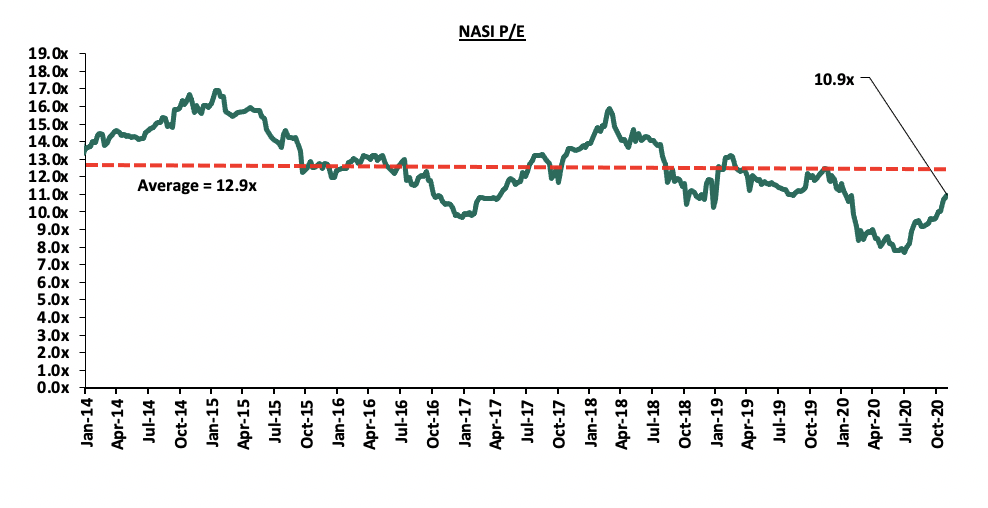
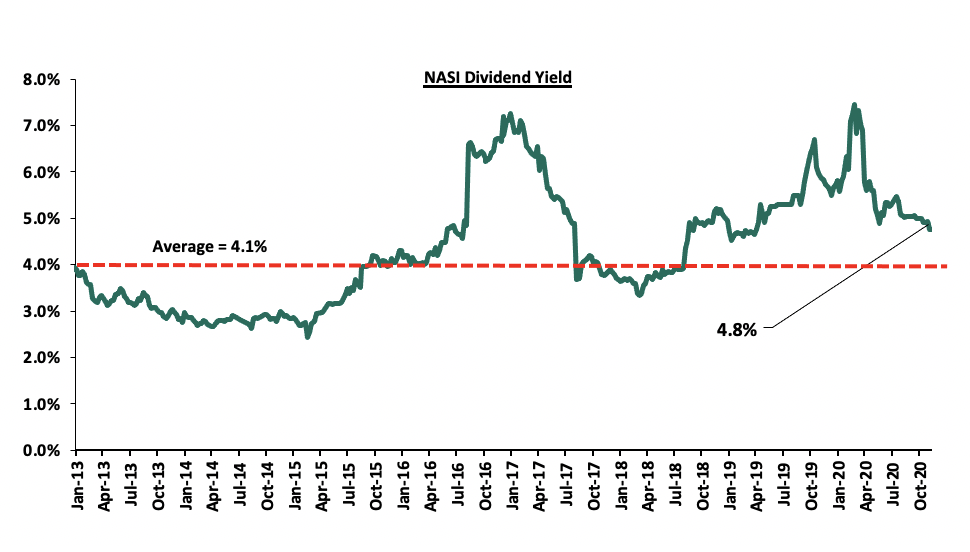
The market is currently trading at a price to earnings ratio (P/E) of 10.9x, 15.6% below the 11-year historical average of 12.9x. The average dividend yield is currently at 4.8%, unchanged from the previous week, and 0.7% points above the historical average of 4.1%.
With the market trading at valuations below the historical average, we believe there are pockets of value in the market for investors with higher risk tolerance and are willing to wait out the pandemic. The current P/E valuation of 10.9x is 41.7% above the most recent valuation trough of 7.7x experienced in the first week of August 2020. The charts below indicate the historical P/E and dividend yields of the market.
Weekly Highlight
During the week, the Central Bank of Kenya (CBK) released the Bank Supervision Annual Report 2019 highlighting that the sector’s gross loans and advances increased by 8.8% to Kshs 2.7 tn in FY’2019, from Kshs 2.5 tn in FY’2018. The highest proportion of the banking industry gross loans and advances were channeled to Trade, Real Estate and Personal/Household sectors, which collectively accounted for 74.5% of the gross loans, a 0.5% point increase from the 74.0% recorded in 2018. Other key take-outs from the report include:
- The balance sheet expanded with the total net assets growing by 9.1% to Kshs 4.8 tn in FY’2019, from Kshs 4.4 tn in FY’2018. This was mainly attributable to the 9.6% growth in Investments in Government Securities to Kshs 1.3 tn, from Kshs 1.2 tn recorded in FY’2018, coupled with the 7.6% increase in loans and advances to Kshs 2.5 tn, from Kshs 2.3 tn in FY’2018. The outperformance by government securities points to a preference by banks to lend to the government, shying away from lending to the private sector due to the interest rate cap which was repealed in November 2019. The use of alternative channels such as agency banking and mobile phones platforms led to an 8.3% growth in customer deposits to 3.6 tn in FY’2019 from 3.3 tn in FY’2018,
- Interest Income increased by 1.5% to Kshs 391.6 bn, from Kshs 386.0 bn in FY’2018 attributable to the 60.4% increase in interest income from deposits and placements to Kshs 8.5 bn, from Kshs 5.3 bn in FY’2018. Interest income from government securities grew by 2.5% to Kshs 121.6 bn, from Kshs 118.7 bn recorded in FY’2018. However, the gains were weighed-down by a 9.4% decline in other interest income which declined to Kshs 1.2 bn in FY’2019 from Kshs 1.3 bn in FY’2018 and interest income from Loans and advances which declined by 0.1% to Kshs 260.3 bn, from Kshs 260.7 bn over the same period,
- Non-Funded Income (NFI) increased by 15.6% to Kshs 140.0 bn, from Kshs 121.1 bn in FY’2018. The increase was mainly driven by the 33.7% increase in Fees and commissions from loans to Kshs 33.8 bn from Kshs 25.3 bn in FY’2018, coupled with an 8.7% increase in other fees and commissions to 52.1 bn in FY’2019 from Kshs 47.9 bn in FY’2018. Forex trading income also grew by 9.7% to Kshs 30.8 bn in FY’2019, from Kshs 28.1 bn recorded in FY’2018. Consequently, the revenue mix for the banking sector shifted to 65:35 funded to non-funded income, from 68:32, owing to the faster growth in NFI compared to Net Interest Income (NII) pointing towards continued revenue diversification in the banking sector,
- The pre-tax profit for the sector increased by 4.2% to Kshs 159.1 bn, from Kshs 152.7 bn in FY’2018. The growth in profitability in 2019 is attributed to a higher increase in total income by 6.6% to Kshs 573.3 bn in FY’2019, from Kshs 513.5 bn in FY’2018, which outpaced the 4.8% increase in total expenses to Kshs 378.2, from Kshs 360.8 recorded in FY’2018. The sector recorded a 4.2% increase in the profit after tax to Kshs 105.7 bn in FY’2019 from Kshs 110.1bn in FY’2018,
- Gross non-performing loans (NPLs) rose by 6.3% to Kshs 335.9 bn in FY‘2019, from Kshs 316.7 bn in FY‘2018. The NPL ratio declined by 0.2% points to 12.5%, from 12.7% recorded in FY’2018, following the faster 8.2% growth in gross loans to Kshs 2.7 tn in FY’2019, from Kshs 2.5 tn recorded in FY’2018, that outpaced the 6.3% increase in NPLs,
- NPL coverage for the sector declined by 0.4% points to 56.0% in FY’2019, from 56.4% owing to the faster 29.3% increase in general loan loss provisions which outpaced the 6.3% increase in gross NPLs. Key to note, in the risk classification of the loans and advances, Kshs 2.1 tn of the sectors loan book were classified as loss in FY’2019, a 10.9% increase from the Kshs 1.9 tn recorded in FY’2018, and,
- During the period of review, the sector also saw several consolidation efforts, which were necessitated by factors such as: regional expansion and industry market share growth. Some of the major consolidations included: KCB acquiring 100.0% shareholding in National Bank of Kenya (NBK), even though NBK will continue operating individually, CBA Bank merged with NIC Bank to form NCBA Bank which became the third largest bank by assets, at Kshs 464.9 bn, controlling a combined asset market share of 9.7%, and, Access Bank from Nigeria acquired 100.0% ownership in Transnational Bank.
From the Financial Stability Report – October 2020, CBK expects the banking sector to remain stable and resilient despite the negative effects of the COVID-19 pandemic on the sector’s assets quality and overall performance. The regulator also expects the industry to utilize its sufficient capital buffers to withstand COVID-19 pandemic related shocks. Given the uncertainty of the tenor of the pandemic, we believe that the banking sector will continue to be negatively affected as evidenced by the depressed earnings and the deteriorating asset quality seen in Q3’2020. As highlighted in our Q3’2020 Banking Report, the listed banking sector recorded a weighted decline in its core earnings per share of 32.4%, compared to a weighted growth of 8.7% recorded in Q3’2019 with the asset quality deteriorating, with the gross NPL ratio rising by 2.6% points to 12.4% from 9.8% in Q3’2019. However, despite all these effects, we support CBKs outlook and we believe that banking sector will remain resilient due to the proactive monitoring of the loan book coupled with the measures taken by the Central Bank to support the sector, as highlighted in our Cytonn Weekly #50/2020.
Following the approval granted by the Capital Markets Authority (CMA), the Nairobi Securities Exchange (NSE) launched the Unquoted Securities Platform (USP), a market infrastructure that will facilitate the trading, clearing and settlement of securities of unlisted companies. For trading purposes, an investor will be required to open and maintain a USP securities trading account, identified by a unique trade identification code, generated by the platform. An investor shall then trade their USP securities by placing a buy or sale order through their USP securities dealer.
Some of the offerings that the platform will provide to issuer companies include:
- Offering issuers an opportunity to access the capital markets for long term funding through private placements whilst enjoying flexibility in listing requirements and obligations,
- Enabling unquoted companies that have a register of shareholders to enjoy price discovery and increase liquidity of their shares, and,
- The platform will also increase transparency and accessibility to information for investors given that prices will be published daily.
The move is in line with the objectives of the CMA’s 10-year strategic plan Capital Market Master Plan (2014-2023) of developing a deeper and more liquid domestic equities market through increased listings. We are of the view that the platform will help unlisted firms, mostly SMEs, with an opportunity to raise capital necessary for growth and enhance their future listing prospects on the respective segments at the Exchange.
Universe of Coverage:
|
Company |
Price at 11/12/2020 |
Price at 18/12/2020 |
w/w change |
YTD Change |
Year Open |
Target Price* |
Dividend Yield |
Upside/ Downside** |
P/TBv Multiple |
Recommendation |
|
Kenya Reinsurance |
2.1 |
2.3 |
6.6% |
(25.7%) |
3.0 |
4.0 |
4.9% |
82.7% |
0.2x |
Buy |
|
Diamond Trust Bank*** |
69.3 |
67.3 |
(2.9%) |
(38.3%) |
109.0 |
105.1 |
3.9% |
60.2% |
0.3x |
Buy |
|
Sanlam |
12.7 |
11.8 |
(6.7%) |
(31.4%) |
17.2 |
18.4 |
0.0% |
55.9% |
1.2x |
Buy |
|
Liberty Holdings |
7.5 |
7.4 |
(1.9%) |
(28.9%) |
10.4 |
9.8 |
0.0% |
33.2% |
0.6x |
Buy |
|
I&M Holdings*** |
46.0 |
45.2 |
(1.7%) |
(16.3%) |
54.0 |
60.1 |
5.5% |
38.5% |
0.7x |
Buy |
|
KCB Group*** |
37.0 |
36.8 |
(0.5%) |
(31.9%) |
54.0 |
46.0 |
9.5% |
34.5% |
0.8x |
Buy |
|
Co-op Bank*** |
11.7 |
11.7 |
0.0% |
(28.4%) |
16.4 |
14.5 |
8.5% |
32.5% |
0.8x |
Buy |
|
Equity Group*** |
35.0 |
34.6 |
(1.3%) |
(35.4%) |
53.5 |
43.0 |
5.7% |
30.2% |
0.8x |
Buy |
|
ABSA Bank*** |
9.6 |
9.2 |
(4.2%) |
(31.4%) |
13.4 |
10.5 |
11.5% |
26.1% |
1.1x |
Buy |
|
Britam |
7.2 |
7.0 |
(2.5%) |
(22.0%) |
9.0 |
8.6 |
3.5% |
26.0% |
0.8x |
Buy |
|
Stanbic Holdings |
75.3 |
82.0 |
9.0% |
(24.9%) |
109.3 |
84.9 |
9.4% |
12.9% |
0.7x |
Accumulate |
|
Jubilee Holdings |
270.0 |
285.0 |
5.6% |
(18.8%) |
351.0 |
313.8 |
3.3% |
13.4% |
0.5x |
Accumulate |
|
Standard Chartered*** |
150.0 |
147.3 |
(1.8%) |
(27.3%) |
202.5 |
153.2 |
8.3% |
12.4% |
1.2x |
Accumulate |
|
NCBA*** |
23.3 |
23.5 |
0.9% |
(36.2%) |
36.9 |
25.4 |
1.1% |
9.2% |
0.6x |
Hold |
|
CIC Group |
2.1 |
2.1 |
(0.5%) |
(23.5%) |
2.7 |
2.1 |
0.0% |
2.4% |
0.7x |
Lighten |
|
HF Group |
3.1 |
3.2 |
5.2% |
(49.8%) |
6.5 |
3.0 |
0.0% |
(7.4%) |
0.2x |
Sell |
|
*Target Price as per Cytonn Analyst estimates **Upside/ (Downside) is adjusted for Dividend Yield ***For Disclosure, these are banks in which Cytonn and/ or its affiliates are invested in |
||||||||||
We are “bullish” on the equities market, given the current low valuations, compared to historical averages, presenting pockets of value especially in the financial sector for investors with a higher risk tolerance and are willing to wait out the pandemic.
- Industry Reports
During the week, the Central Bank of Kenya (CBK) released the Bank Supervision Annual Report 2019, outlining the performance of various financial institutions licenced to operate by the CBK. Some of the key take outs in relation to the mortgage market in Kenya include;
- The value of mortgage loan assets outstanding increased by 5.7% from Kshs 224.9 bn in December 2018 to Kshs 237.7 bn in December 2019 attributed to increased appetite for home ownership,
- Approximately 76.4% of lending to the mortgage market was by 6 institutions which included, one medium sized bank (16.9%) and five banks from the large peer group (59.5%) as compared to one medium sized bank (15.0%) and five banks from the large peer group (61.1%) in December 2018,
- The outstanding value of non-performing mortgages decreased from Kshs 38.1 bn in December 2018 to Kshs 31.0 bn in December 2019 due to increase in the number of loan repayments,
- The mortgage non-performing loans (NPLs) to gross mortgage loans decreased to 13.0% in December 2019 compared to 16.9% in December 2018,
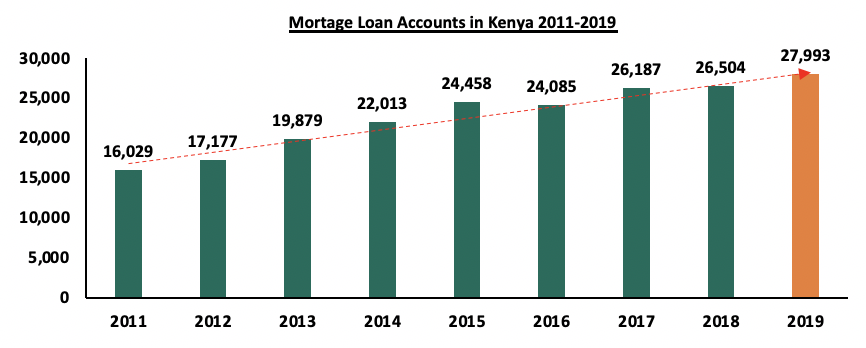
- There were 27,993 mortgage loan accounts in the market in December 2019 an increase by 6.9% from 26,504 in December 2018. The graph below shows the growth of mortgage accounts in Kenya;
-
Source: Central Bank of Kenya
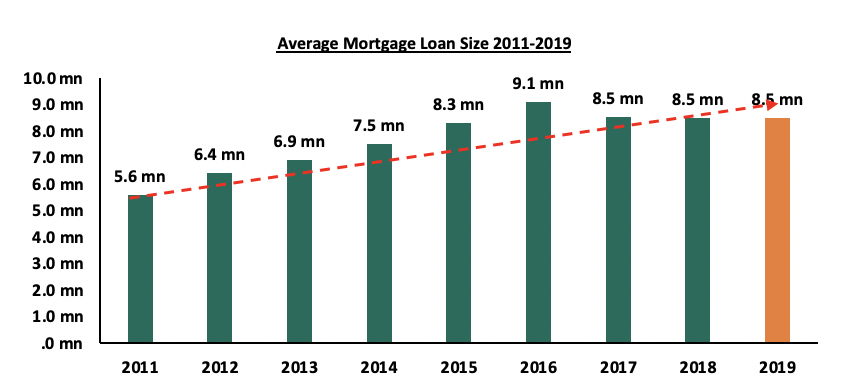
- The average mortgage loan size increased from Kshs 8.48 mn in 2018 to Ksh.8.49 mn in 2019. The graph below shows the average mortgage loan size between 2011-2019;
-
Source: Central Bank of Kenya
- The number of institutions offering mortgages to customers were 31 in 2019 as compared to 32 in 2018. One bank in the small peer group stopped offering mortgage loans in 2019, and,
- The average loan maturity was 11.2 years with minimum of 5 years and a maximum of 20 years in 2019 as compared to average loan maturity of 10.6 years with a minimum of 4 years and a maximum of 22 years in 2018.
The above statistics shows an improvement of the Kenyan mortgage market in 2019 compared to 2018. However, for 2020, we expect an increase in non-performing loans as well as reduced mortgage uptake attributable to the tough economic times with borrowers shying away from taking loans amid constrained income levels. However, this may be cushioned by the operationalization of the Kenya Mortgage Refinance Company which has been offering affordable mortgage loans since September 2020, thus enhancing the accessibility of affordable mortgage loans, a resultant boost to the mortgage market, and increased home ownership which has remained low in Kenya.
Source: Centre for Affordable Housing Africa
- Residential
The Kenya Mortgage Refinance Company (KMRC), a state backed mortgage firm offered KCB Group, Housing Finance, Stima Sacco and Nyandarua Sacco Kshs 2.64 bn home loans at an interest rate of 5.0% to enable them write home loans at an interest rate of 7.0% which is lower compared to an average market rate of 12.0%. Out of the Kshs 2.64 bn, KCB Group will receive Kshs 2.13 bn while Housing Finance Corporation is expected to receive Kshs 514 mn. Stima Sacco and Nyandarua Sacco were offered Kshs 69.0 mn and Kshs 29.0 mn, respectively. Potential home buyers are expected to benefit from the products that KMRC offers which include;
- Affordable Housing Loans: These are loans that are capped at Kshs 4.0 mn for Nairobi Metropolitan Area (Nairobi, Kiambu, and Machakos & Kajiado) and Kshs 3.0 mn elsewhere, at a 7.0% interest rate to individual borrowers whose monthly income is not more than Kshs 150,000, and,
- Market Housing Loans: These are loans above the affordable housing loans threshold, have a limit of above Kshs 4.0 mn, and will be issued at interests determined by the average market rates.
The move by the KMRC to provide cheaper home loans is expected to increase mortgage uptake which has remained low with 27,993 mortgage loan accounts in the Kenyan market in December 2019 out of an adult population of more than 24 million. It is also expected to improve Kenya’s mortgage penetration rate which stood at 3.2% of gross domestic product (GDP) as at 2017, compared to other developed countries such as South Africa at 19.6%. The graph below shows the Mortgage to GDP ratio of different countries as of 2019;
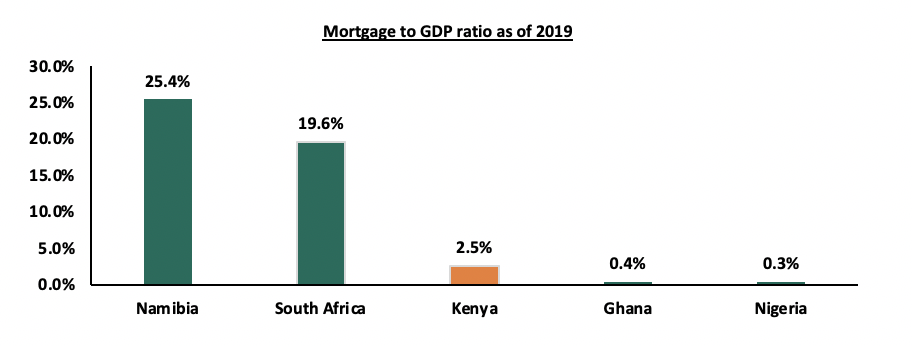
Source: Centre for Affordable housing Africa
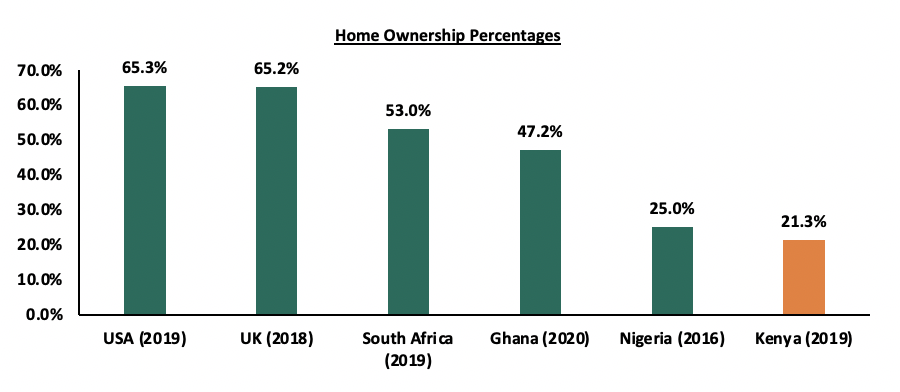
With the expected improvement in the mortgage penetration rates, we expect home ownership in Kenya to also increase as people will be able to access funds through mortgage loans to finance the purchasing and building of their homes. Home ownership in Kenya has been relatively low at 21.3% compared to other countries such as South Africa and Ghana at 53.0% and 47.2%, respectively as shown in the graph below;
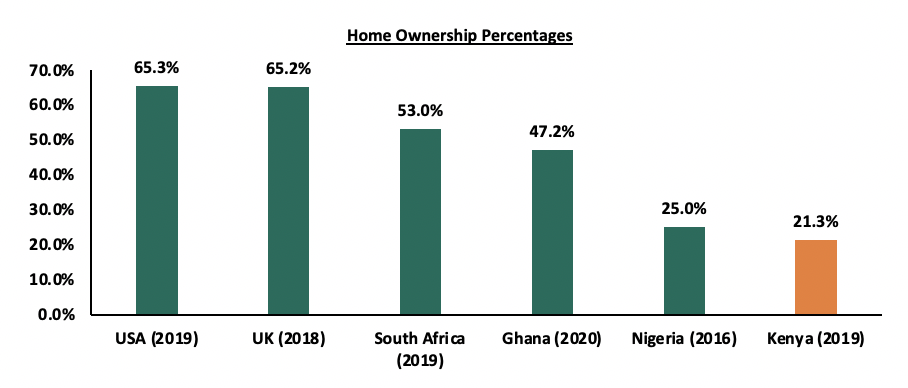
Source: Centre for Affordable Housing Africa
- Retail Sector
During the week, Naivas Supermarket opened a new branch in Rongai completing a series of outlets that they had initially announced will be opened within the Nairobi Metropolitan Area earlier this year. This brings the total number of outlets by the retailer to 69 with 8 outlets opened during this year. The move by the retailer to invest in Rongai is supported by; i) positive demographics with Rongai having a population of 172,569 as of 2019, a 331.9% growth from the 39,951 recorded in 2009, according to the Kenya National Bureau of Statistics (KNBS) Population and Housing Census Report, and, ii) ease of access as the area is served by Magadi and Gataka Road. With a total of 69 branches, Naivas has so far surpassed the 65 number of branches held by Nakumatt during its prime days. The continued expansion of the retailer as well as other retail chains such as QuickMart and Carrefour, taking up prime retail space left behind by troubled chains such as Tuskys and Nakumatt, is expected to cushion the retail sector performance which is currently witnessing; i) reduced demand for physical space due to shifting focus to online shopping, ii) reduced purchasing power among consumers amid a tough economic environment, and, iii) reduced rental rates as landlords offer rental concessions to retain tenants.
The table below shows the summary of the number of stores of the key local and international retail supermarket chains in Kenya;
|
Main Local and International Retail Supermarket Chains |
||||||
|
Name of Retailer |
Initial number of branches |
Number of branches opened in 2020 |
Closed branches |
Current number of Branches |
Branches expected to be opened / closed |
Projected total number of branches |
|
Naivas Supermarket |
61 |
8 |
0 |
69 |
0 |
69 |
|
Tuskys |
64 |
2 |
14 |
52 |
27 |
25 |
|
QuickMart |
29 |
6 |
0 |
35 |
0 |
35 |
|
Chandarana Foodplus |
19 |
1 |
0 |
20 |
0 |
20 |
|
Carrefour |
7 |
1 |
0 |
8 |
3 |
11 |
|
Uchumi |
37 |
0 |
33 |
4 |
0 |
4 |
|
Game Stores |
2 |
1 |
0 |
3 |
0 |
3 |
|
Choppies |
15 |
0 |
13 |
2 |
0 |
2 |
|
Shoprite |
4 |
0 |
2 |
2 |
0 |
2 |
|
Nakumatt |
65 |
0 |
65 |
0 |
0 |
0 |
|
Total |
303 |
19 |
127 |
194 |
31 |
171 |
Source: Online Research
In terms of performance, according to the Kenya Retail Report 2020, satellite towns such as Rongai recorded the lowest rental rates averaging Kshs 130.0 hence an opportunity for expanding retailers such as Naivas to take up affordable space. The table below shows the Nairobi Metropolitan Area (NMA) Retail performance FY’2020;
All values in Kshs unless stated otherwise
|
Nairobi Metropolitan area (NMA) 2020 Retail Performance |
|||
|
Node |
Rent/SQFT 2020 |
Occupancy 2020 |
Rental Yield 2020 |
|
Westlands |
207.5 |
80.9% |
9.8% |
|
Karen |
215.5 |
79.1% |
9.2% |
|
Kilimani |
169.5 |
83.0% |
8.6% |
|
Ngong Road |
179.8 |
79.3% |
8.5% |
|
Kiambu road |
174.8 |
65.3% |
6.8% |
|
Mombasa road |
140.8 |
70.8% |
6.2% |
|
Thika Road |
160.1 |
69.0% |
6.2% |
|
Eastlands |
138.3 |
69.2% |
6.1% |
|
Satellite towns |
130.0 |
73.6% |
5.8% |
|
Average |
168.5 |
74.5% |
7.5% |
Source: Cytonn Research 2020
We expect the continued expansion by local retail chains to cushion the performance of the retail sector supported by; i) continued improvement of infrastructure opening up areas for investment, ii) relatively high population growth rate, iii) investor confidence due to the ease of doing business in Kenya, having been ranked position #56 by World Bank in the ease of doing business, and, iv) the growing middle class with increased purchasing power.
- Hospitality
During the week, Sarova Group of Hotels and Resorts announced that it has ventured into the restaurant business to cushion itself against the effects of the pandemic which has hurt its operation with some of the worst hit outlets being Nairobi’s Sarova Stanley and Sarova Panafric due to their reliance on hotel and room services. The hotel chain has opened two urban eateries in Westlands; Chiso that will focus on food from various Asian countries like Japan, China, Indonesia, Malaysia and Thai, and the second one named The Kitchen which will offer Western, African and Indian food. The decision by the hotel chain to diversify its portfolio to the restaurant business has been prompted by the reduced number of hotel bookings attributable to a slowdown in the tourism industry and an overall decline in international arrivals. According to the Kenya National Bureau of Statistics the number of international arrivals declined by 71.5% from 1.2 mn persons between January-September in 2019 to 0.3 mn persons during the same period in 2020. The table below shows the number of international arrivals over the last 5 years (January to September);
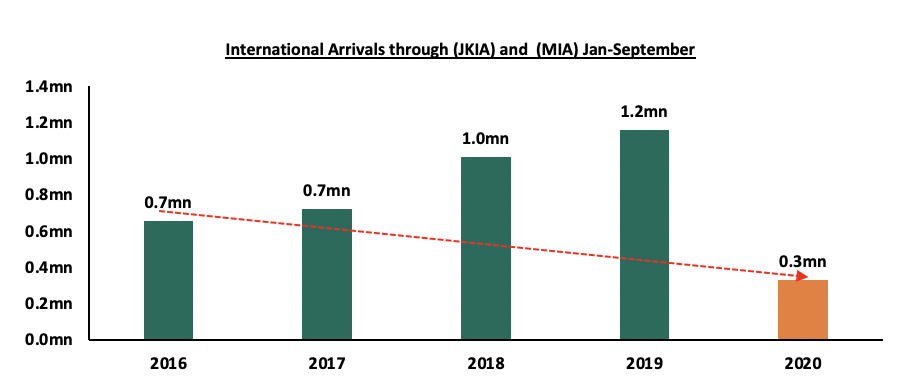
Source: Kenya National Bureau of Statistics.
Despite being negatively affected by the pandemic, the decision by the Sarova Group of Hotels and Resorts to continue investing in the Kenyan hospitality sector indicates investor confidence in the resilience of the sector. In addition, the choice of Westlands area as an investment node is supported by the presence of high and middle-income earners with relatively high disposable income and spending power, presence of a huge working population as it is a key commercial node and ease of accessibility in and out of the area.
In line with the above, the Serena Group of hotels reopened its beach resort after eight months and a half months of closure on 15th of December with the intention to take advantage of the expected growing demand for accommodation facilities at the coast during the December holiday season. The Serena Beach Resort and Spa in Mombasa plans to operate at a capacity of 74 rooms which represents 45.0% of its hotel capacity a move aimed at complying with the COVID-19 protocols set by the government. The decision to reopen is supported by the gradual reopening of the economy and resumption of tourism activities especially at the Kenyan Coast.
Nevertheless, during the week, Radisson Blu, an international hotel chain announced that it had halted the operations of its Nairobi UpperHill branch as bookings remain low due to the COVID-19 Pandemic. The decision to close the branch and send employees home was aimed at mitigating the economic impact of the pandemic on the business. The move by Radisson Blu mirrors the decision made by other hospitality services such as Fairmont Hotels and Resorts which closed The Norfolk, and Fairmont Mara Safari Cub, and other hotels under their brand in May this year to cushion themselves against the effects of the pandemic.
The hospitality sector has been one of the hardest hit sectors by the pandemic due to over reliance on tourism and Meetings Incentives Conferences and Exhibitions (MICE). It has resulted in a general slowdown in tourism activities and travel with the issuance of travel advisories by key tourism markets such as the USA, cancellation of meetings and conferences and overall decline in revenue inflows amid reduced demand for hospitality services and facilities. This is evidenced by the subdued performance of the hospitality sector with its contribution to GDP declining by 83.3% during the second quarter of 2020 compared to an expansion of 12.1% during the same period in 2019, according to the KNBS Quarterly Gross Domestic Product Report – Q2'2020.
Going forward, we expect the sector to witness gradual recovery supported by; i) the easing of travel restriction in and out of the country due to opening up of key tourism markets such as Asia, ii) domestic tourism picking up leading to opening up of hotels like Serena, iii) government strategies to support the recovery of the sector such as the Ministry of Tourism Post-Corona recovery funds aimed at offering financial aid to hotel and other establishments in the hospitality industry through the Tourism Finance Corporation (TFC), Other factors boosting the hospitality sector include; i) recognition of Kenya as a regional hub, ii) improved security, and, iii) political stability.
- Statutory Reviews
The president of Kenya, Uhuru Kenyatta signed into law the Sectional Properties Act 2019, and, the Statute Law (Miscellaneous Amendments) 2020 bill.
The new Sectional Properties Act, 2019 which repeals the Sectional Properties Act of 1987, provides for the division of buildings into units to be owned by individual proprietors and common property to be owned by proprietors of the units as tenants in common and to provide for the use and management of the units and common property and for connected purposes.
- The Act will give property developers and apartment owner’s greater transaction ability in financing and disposal of properties in the market as it will allow apartment buyers to have title deeds as proof of ownership,
- Independent and complete ownership of properties will give banks greater incentive to lend to apartment owners since charges can be placed directly on individual titles,
- The owner of a unit shall only be liable in respect of an interest endorsed on the sectional plan in proportion to the unit factor for his unit,
- Developers can subdivide buildings into two or more units by the registration of a sectional plan prepared, by a surveyor, from a building plan that has been approved by a county government,
- Common property comprised in a registered sectional plan, shall be held by the owners, and,
- Landlords or owners of existing units are allowed to convert their properties into units under the Act if they want to sell them as units. This implies developers will no longer be allowed to sell units without sectional plans to enable individual ownership.
The above provisions have a direct impact on home buyers as it will enable them have easier access to secure loans as they can use title deeds as collateral.
The Statute Law (Miscellaneous Amendments) 2020 Act on the other hand amends 21 statutes which includes Interpretation and General Provisions Act, Records Disposal Act, Penal Code, Public Holidays Act, Kenya Roads Board Act, and Firearms Act among others. Key real estate sector related take outs include;
- Amendment of the Housing Act (Cap.117) to remove the mandatory nature of contributions to the National Housing Development Fund, and,
- Amendment of The Kenya Roads Board Act 1999 (No.7 of 1999) to include a minimum number of days the board can hold every year at 4 days in a year hence departing from the current provision where the board is required to hold meetings every month.
The above amendments under the Statute Law (Miscellaneous Amendments) act, 2020 will imply that the individuals will not be subjected to the mandatory housing levy but instead will be allowed the liberty to make savings towards purchasing of their homes voluntarily through the NHDF. This will mitigate against the otherwise financial burden of making the contributions monthly in addition to the already existing statutory deductions especially during these tough economic times. However, on the downside, we expect this to affect the ability of the government to reach their target on funds that are expected to be collected through the National Housing Development Fund in support of the affordable housing initiative. Additionally, the reduction of the meetings by the Kenya Roads Board will help in regular planning thus creating a shift from the tedious process of meeting every month. The regular planning for meetings will also help in streamlining the way infrastructural projects are launched as it will create more time to deliberate on the effectiveness of the projects.
We expect real estate sector activities to be supported by the continued expansion of local retailers, policy and regulatory reforms in support of the housing sector, and the diversification of businesses by hospitality industry players to cushion themselves against the tough economic times. However, the exit by some businesses operating in the hospitality industry is expected to affect the sector’s performance.
Last year in November, we released the Nairobi Metropolitan Area Mixed-Use Developments (MUDs) Report 2019, highlighting the performance of Mixed-Use Developments within the Nairobi Metropolitan Area and their comparison to single-use themes. According to the report, MUDs recorded an average rental yield of 7.3% in 2019 with retail, office, and residential themes within MUDs recording average rental yields of 8.4%, 7.9%, and 5.4%, respectively. This was in comparison to average rental yields of 8.0%, 7.7%, and 5.0%, for retail, office, and residential spaces, respectively, and an overall market average of 6.9% for single-themed developments.
This week, we update our report based on research conducted in 8 nodes in the Nairobi Metropolitan Area, comparing the Mixed- Use Developments performance against the market performance of the residential, commercial office, and retail sectors. The topical shall cover the following:
- Overview of Mixed-Use Developments
- Mixed-Use Developments Performance Summary in 2020
- Mixed-Use Developments Investment Opportunity and Outlook
Section I: Overview of Mixed-Use Developments
As a recap of our definition on a Mixed-Use Development (MUD), it refers to a real estate development containing more than one real estate theme. Such a development would therefore have two or more uses, that is, residential, retail, office, and hospitality, all in one location, and whose functions are often physically and structurally integrated. They offer a variety of benefits such as housing, workplaces and other amenities within the same location and hence the real estate themes within the developments complement each other.
The growth of Mixed-Use Developments has mainly been driven by;
- Positive Demographics: Kenya’s current urbanization and population growth rates stand at approximately 4.0% and 2.2%, against the global averages of 1.9% and 1.1%, respectively, according to Word Bank. This influx has necessitated innovative real estate solutions to meet the growing demand for units that offer operational synergies in themes that complement each other,
- Relatively Higher Returns: The project mix comprising of themes that perform differently has led to MUDs gaining traction over the past years as a result of the diversified portfolio offering a spread of risk and thus higher returns,
- Growth of the Middle Class: Kenya’s growing middle class with increased disposable income, has created a niche for developers to connect work stations and residence while targeting the equally growing demand for convenient lifestyles such as the live, work and play setting,
- Benefits of Economies of Scale to the Developer and the Buyer: Due to the relatively large scale of most MUDs, developers are able to offer amenities and services at a relatively lower unit cost, therefore benefiting both the developer and the buyer.
However Mixed-Use Developments face various challenges such as:
- High Development Costs: The intricacies involved in incorporating various real estate themes together, coupled by soaring land prices in Nairobi and other urban areas, with the price per acre in Nairobi suburbs averaging at Kshs 138.6 mn as at September 2020, driven by demand due to population pressures and infrastructural improvements has led to high development costs thus discourages development of MUDs, and,
- Inadequate infrastructure: Mixed- Use Developments required well planned and developed infrastructure such as water, sewerage systems, and reliable electricity, which is currently inadequate to accommodate the rapid growth of urban populations therefore crippling development activities
Section II: Mixed-Use Developments Performance Summary in 2020
- Summary of Thematic Performance in Comparison to General Market Performance
Mixed-Use Developments recorded average rental yields of 7.1%, 0.3% points higher than the respective single use retail, commercial office and residential themes with 6.8% in 2020. In 2020, retail, offices and residential spaces in MUDs recorded rental yields of 7.8%, 7.3% and 6.2%, respectively, compared to the single-use average of 7.5%, 7.2%, and 5.6%, respectively. The relatively better performance by MUDs is attributed to the prime locations, mostly serving the high and growing middle class supported by the concept’s convenience as it incorporates working, shopping and living spaces. The retail and commercial themes in MUDs each recorded 0.6% points decline in rental yield, attributed to oversupply of 3.1 mn SQFT and 6.3 mn SQFT, respectively, amid reduced demand for physical retail and office spaces in the wake of a tough economic environment resulting in a decline in rental rates and occupancy. However, retail and office themes within MUDs performed better than the single- use themes which posted average rental yields of 7.5% and 7.2%, respectively, attributed the plethora of amenities offered by MUDs coupled with high quality finishes hence higher rental rates that offered higher returns. Residential units within MUDs, recorded 0.8% points increase in rental yield from 5.4% in 2019 to 6.2%, attributable to the incorporation of lifestyle developments in MUDs offering high returns and increased demand for rented residential units as opposed to units for sale within MUDs hence high occupancy rates.
On overall, MUDs recorded a 0.2% points y/y decline in average rental yield to 7.1% in 2020 from 7.3% in 2019 attributed to a tough economic environment caused by the Covid-19 pandemic that constrained consumer spending, led to reduced demand of space in MUDs amid reduced disposable income and reduced investor appetite in MUDs with sales dropping as investors adopt a wait and see attitude in the wake of market uncertainty.
The table below shows the performance of single-use and mixed-use development themes between 2019 and 2020:
|
Thematic Performance of MUDs in Key Nodes 2019-2020 |
||||||
|
|
MUD Themes Average |
Single-Use Themes Average |
||||
|
|
Rental Yield % 2020 |
Rental Yield % 2019 |
Rental Yield % 2020 |
Rental Yield % 2019 |
∆ in y/y MUD Rental yields |
∆ in MUD vs Single-Use Rental Yield 2019 |
|
Retail |
7.8% |
8.4% |
7.5% |
8.0% |
(0.6%) |
0.3% |
|
Offices |
7.3% |
7.9% |
7.2% |
7.7% |
(0.6%) |
0.1% |
|
Residential |
6.2% |
5.4% |
5.6% |
5.0% |
0.8% |
0.6% |
|
Average |
7.1% |
7.3% |
6.8% |
6.9% |
(0.2%) |
0.3% |
|
· Mixed-Use Developments recorded average rental yields of 7.1%, 0.3% points higher than the respective single-use retail, commercial office and residential themes with 6.8% in 2020 |
||||||
Source: Cytonn Research 2020
- Mixed-Use Developments Performance per Node
Westlands was the best performing node recording an average MUD yield of 8.5% with the retail, office and residential spaces recording rental yields of 9.8%, 8.2% and 7.0%, respectively, 2.0%, 0.9% and 0.8% points higher than the sector averages of 7.8%, 7.3% and 6.2%, respectively. The performance was driven by the prime office and retail spaces resulting in relatively high demand with occupancies averaging at 75.7%, while the average rental rates came in at Kshs 178 per SQFT, Kshs 117 per SQFT and Kshs 1,226 per SQM for the retail, office and residential themes, respectively, compared to the respective thematic MUD averages of Kshs 157 per SQFT, Kshs 112 per SQFT and Kshs 835 per SQM. This is in addition to Westlands being a prime commercial node with high demand for commercial and residential space supported by the improved infrastructure; i.e., construction of the Nairobi Expressway along Waiyaki Way which will increase business activities in the area.
Limuru Road and Karen came in second position with an average MUD rental yield of 7.3% each, largely driven by their attractiveness as retail destinations with malls such as Two Rivers and Galleria offering high quality retail spaces in addition to hosting high income earners with relatively high purchasing power especially in the case of Karen. Eastlands was the worst performing node recording an average rental yield of 5.5% attributed to low rental charges at Kshs 110 per SQFT, Kshs 100 per SQFT and Kshs 333 per SQM in the retail, office and residential themes, respectively. The low rates are attributable to unavailability of quality space and relatively high competition from informal Mixed-Use Developments.
The table below shows the performance of Mixed-Use Developments by node in 2020:
(All values in Kshs Unless stated otherwise)
|
Nairobi’s Mixed-Use Developments Market Performance by Nodes 2020 |
|||||||||||||||
|
|
Retail Performance |
Office Performance |
Residential Performance |
|
|||||||||||
|
Location |
Price/SQFT |
Rent/SQFT |
Occupancy (%) |
Rental Yield (%) |
Price/ SQFT |
Rent/SQFT |
Occupancy %) |
Rental Yield (%) |
Price/SQM |
Rent/SQM |
Annual Uptake % |
Rental Yield % |
Average MUD yield |
||
|
Westlands |
15,833 |
178 |
70.8% |
9.8% |
12,667 |
117 |
73.3% |
8.2% |
211,525 |
1,226 |
24.5% |
7.0% |
8.5% |
||
|
Limuru Rd |
23,900 |
223 |
85.0% |
9.5% |
13,500 |
130 |
65.0% |
7.5% |
147,496 |
1,166 |
20.0% |
7.3% |
|||
|
Karen |
23,333 |
143 |
88.5% |
6.7% |
13,200 |
123 |
80.0% |
9.0% |
7.3% |
||||||
|
Kilimani |
17,400 |
143 |
75.0% |
7.5% |
13,250 |
108 |
68.8% |
6.6% |
7.2% |
||||||
|
UpperHill |
15,485 |
120 |
65.0% |
6.0% |
12,500 |
107 |
65.0% |
6.7% |
6.6% |
||||||
|
Msa Rd |
20,000 |
150 |
70.0% |
6.3% |
13,000 |
100 |
70.0% |
6.5% |
157,440 |
874 |
14.3% |
6.7% |
6.5% |
||
|
Thika Rd |
26,250 |
200 |
85.0% |
8.5% |
13,750 |
105 |
64.0% |
5.9% |
143,803 |
705 |
22.5% |
5.9% |
6.4% |
||
|
Eastlands |
20,000 |
110 |
80.0% |
5.3% |
12,000 |
100 |
55.0% |
5.5% |
72,072 |
333 |
18.0% |
5.6% |
5.5% |
||
|
Average |
18,857 |
157 |
75.7% |
7.8% |
12,957 |
112 |
69.9% |
7.3% |
146,023 |
835 |
20.3% |
6.2% |
7.3% |
||
|
· Westlands was the best performing node recording an average MUD yield of 8.5% with the retail, office and residential spaces recording rental yields of 9.8%, 8.2% and 7.0%, respectively, 2.0%, 0.9% and 0.8% points higher than the sector averages of 7.8%,7.3% and 6.2%, respectively · Thika Road and Eastlands were the worst performing areas recording yields of 6.4% and 5.5%, respectively attributed to low rental charges as a result of competition from informal Mixed-Use Developments |
|||||||||||||||
Source: Cytonn Research 2020
- Performance of Real Estate Themes in MUDs versus Single-themed Developments’ Performance
In our Mixed-Use Development analysis, we looked into the performance of the retail, commercial office and residential themes:
- Retail Space
Retail spaces in Mixed-Use Developments recorded average occupancy rates and rental yields of 75.7% and 7.8%, respectively, 1.2% and 0.3% points higher than the single use retail market average of 74.5% and 7.5% in 2020, respectively. The better performance of retail spaces in Mixed-Use Developments is attributed to their prime locations, serving the growing middle class with relatively high purchasing power while offering convenience as one-stop centres for consumers living and working in the area.
Westlands and Limuru Road were the best-performing nodes recording rental yields of 9.8% and 9.5%, respectively. This is mainly attributed to the presence of affluent residents with high consumer purchasing power as the areas host high-end and middle income earners, relatively good infrastructure, high footfall in Westlands as it is a prime commercial node and relatively high occupancy rates in Limuru road at 85.0% against MUD retail average of 75.7%. Eastlands recorded the worst performance with rental yields of 5.3%, 1.5% points lower than the MUD retail average of 7.8%, attributed to low quality spaces coupled with relatively poor infrastructure hence reduced rental rates amid the tough economic environment.
The table below provides a summary of the performance of retail spaces in MUDs against market performance in 2020;
(All values in Kshs unless stated otherwise)
|
Performance of Retail in MUDs versus Market Performance 2020 |
|||||||
|
|
MUD Retail Performance |
Single Theme Retail Market Performance |
|
||||
|
Location |
Rent/SQFT |
Occupancy (%) |
Rental Yield (%) |
Rent/SQFT |
Occupancy (%) |
Rental Yield (%) |
Rental Yield Difference |
|
Westlands |
178 |
70.8% |
9.8% |
208 |
80.9% |
9.8% |
(0.0%) |
|
Limuru Rd |
223 |
85.0% |
9.5% |
175 |
65.3% |
6.8% |
2.7% |
|
Thika Rd |
200 |
85.0% |
8.5% |
160 |
69.0% |
6.2% |
2.3% |
|
Kilimani |
143 |
75.0% |
7.5% |
170 |
83.0% |
8.6% |
(1.1%) |
|
Karen |
143 |
88.5% |
6.7% |
216 |
79.1% |
9.2% |
(2.5%) |
|
Mombasa Rd |
150 |
70.0% |
6.3% |
141 |
70.8% |
6.2% |
0.1% |
|
UpperHill |
120 |
65.0% |
6.0% |
|
|
|
|
|
Eastlands |
110 |
80.0% |
5.3% |
138 |
69.2% |
6.1% |
(0.8%) |
|
Average |
157 |
75.7% |
7.8% |
168 |
74.5% |
7.5% |
0.3% |
|
· Westlands and Limuru Road were the best-performing nodes in Mixed-Use Developments recording rental yields of 9.8% and 9.5%, respectively · Eastlands was the worst performing node recording rental yields of 5.3% |
|||||||
Source: Cytonn Research 2020
- Commercial Office Space
Commercial office spaces in MUDs performed better than office spaces in single –use themes recording an average rental yield of 7.3%, 0.1% points higher than the latter at 7.2%. Office spaces in MUDS have in the past offered higher returns compared to those in single-use themes due to the quality spaces with differentiated concepts such as shared offices in some of the developments. The decline in performance of office spaces in MUDs was attributed to reduced demand for physical space with some firms downsizing due to financial constraints while others continued embracing working from home thus leading to reduced occupancy rates. Karen and Westlands were the best-performing office spaces in MUDs recording average rental yields of 9.0% and 8.2%, respectively, attributable to high quality spaces with above average rental rates, coupled with demand for office space by start-ups and freelancers in the shared offices concept. Eastlands was the worst performing node recording average occupancy rates and rental yields of 55.0% and 5.5%, respectively, attributed to introduction of concessions by landlords in a bid to retain tenants, and firms mainly small and medium-sized enterprises (SMEs) downsizing or shutting down operations in an effort to cushion themselves from the effect of the pandemic.
The table below shows the performance of office spaces in MUDs against the single use themed market in 2020;
(All values in Kshs unless stated otherwise)
|
Performance of Commercial Offices in MUDs in 2020 versus Single Theme Market Performance |
|||||||||
|
|
MUD Office Performance |
Single Theme Residential Market Performance |
|
||||||
|
Location |
Price/SQFT |
Rent/SQFT |
Occupancy (%) |
Rental Yield (%) |
Price/SQFT |
Rent/SQFT |
Occupancy (%) |
Rental Yield (%) |
Rental Yield Difference |
|
Karen |
13,200 |
123 |
80.0% |
9.0% |
13,665 |
108 |
86.3% |
8.1% |
0.9% |
|
Westlands |
12,667 |
117 |
73.3% |
8.2% |
12,262 |
104 |
78.9% |
8.1% |
0.1% |
|
Limuru Rd |
13,500 |
130 |
65.0% |
7.5% |
13,400 |
118 |
84.6% |
9.0% |
(1.5%) |
|
UpperHill |
12,500 |
107 |
65.0% |
6.7% |
12,592 |
93 |
79.9% |
7.1% |
(0.4%) |
|
Kilimani |
13,250 |
108 |
68.8% |
6.6% |
12,546 |
94 |
79.6% |
6.8% |
(0.2%) |
|
Msa Rd |
13,000 |
100 |
70.0% |
6.5% |
11,350 |
75 |
63.9% |
4.9% |
1.6% |
|
Thika Rd |
13,750 |
105 |
64.0% |
5.9% |
12,500 |
82 |
76.3% |
6.0% |
(0.1%) |
|
Eastlands |
12,000 |
100 |
55.0% |
5.5% |
|
|
|
|
|
|
Average |
12,957 |
112 |
69.9% |
7.3% |
12,479 |
94 |
79.9% |
7.2% |
0.1% |
|
· Commercial office spaces in MUDs recorded average occupancy rates of 69.9%, 10.0% points lower than that of single-use themes at 79.9% attributed to reduced demand for physical space in MUDs |
|||||||||
Cytonn Research 2020
- Residential Space
Residential units within Mixed-Use Developments recorded average rental yields of 6.2% in 2020, 0.6% points higher than the single-use residential market rental yields of 5.6%. Residential units in MUDs also recorded an average price and rent per SQM of Kshs 146,023 and Kshs 835, respectively, above the single- use market average of Kshs 92,060 and Kshs 496, respectively. The relatively high rates within mixed-use developments are attributable to the incorporation of lifestyle communities, with high quality finishes and salient amenities thus high rates and resultant high returns. Westlands was the best performing node recording an average rental yield of 7.0% driven by the high rental rates, boosted by the presence of affluent clientele coupled with increased demand for units in the area supported by the growing middle class with increased purchasing power and need for convenient lifestyles.
The table below summarizes the performance of residential spaces in MUDs against the single themed market in 2020;
(All values in Kshs unless stated otherwise)
|
Performance of Residential Units in MUDs in 2020 versus Single Theme Market Performance |
|||||||||
|
|
MUD Residential Performance |
Single Theme Residential Market Performance |
|
||||||
|
Location |
Price/SQM |
Rent/SQM |
Uptake % |
Rental Yield % |
Price/SQM |
Rent/SQM |
Uptake % |
Rental Yield % |
Rental Yield Difference |
|
Westlands |
211,525 |
1,226 |
24.5% |
7.0% |
172,924 |
775 |
23.3% |
5.8% |
1.2% |
|
Msa Rd |
157,440 |
874 |
14.3% |
6.7% |
78,772 |
425 |
16.1% |
5.9% |
0.8% |
|
Thika Rd |
143,803 |
705 |
22.5% |
5.9% |
79,333 |
449 |
16.9% |
5.4% |
0.4% |
|
Eastlands |
72,072 |
333 |
18.0% |
5.6% |
71,993 |
396 |
16.6% |
5.8% |
-0.3% |
|
Limuru Rd |
147,496 |
1,166 |
20.0% |
|
100,215 |
520 |
25.6% |
5.3% |
|
|
Average |
146,023 |
835 |
20.3% |
6.2% |
100,647 |
513 |
19.7% |
5.6% |
0.6% |
|
· Residential spaces in Mixed-Use Developments recorded rental yields of 6.2% in 2020, 0.6% points more than the market rental yields of 5.6% · Westlands was the best performing area recording rental yields of 7.0% |
|||||||||
Cytonn Research 2020
Section III: Mixed-Use Developments Investment Opportunity and Outlook
The table below summarizes our outlook on Mixed-Use Developments (MUDs), where we look at the general performance of the key sectors that compose MUDs i.e. retail, commercial office and residential and investment opportunities that lies in the themes;
|
Mixed-Use Developments (MUDs) Outlook |
||
|
Sector |
2020 Sentiment and Outlook |
2020 Outlook |
|
Retail |
|
Neutral |
|
Office |
|
Negative |
|
Residential |
|
Positive |
|
Outlook |
The outlook for Mixed-Use Developments (MUDs) is NEUTRAL supported by the relatively high returns offered by the residential spaces amid subdued performance of the retail and office themes mainly constrained by oversupply 0f 3.1 mn SQFT and 6.3mn SQFT of retail and office spaces, respectively, within the Nairobi Metropolitan Area. The investment opportunity within the Nairobi Metropolitan Area lies in areas with relatively high returns such as Westlands which recorded an average MUD rental yield of 8.5%, and, Limuru Road and Karen recording average MUD yields of 7.3% each. |
|
Source: Cytonn Research 2020
Disclaimer: The views expressed in this publication are those of the writers where particulars are not warranted. This publication is meant for general information only and is not a warranty, representation, advice or solicitation of any nature. Readers are advised in all circumstances to seek the advice of a registered investment advisor.

- Talk to us
- Kenya
- P.O Box 20695 - 00200, Nairobi, Kenya
- Cell +254709101200
- Tel +254709101200
- WhatsApp +254741676635
- United States
- +254709101200
- DOWNLOAD OUR APP
-


- Kenya
- 8th Floor, Pinetree Plaza, Kaburu Drive, Ngong Road, Nairobi, Kenya
- USA
- Suite 1150, 1775 Eye Street NW, USA, Washington DC 20006, USA
- Investments
- High Yield
- Private Equity
- Real Estate
- Real Estate
- RiverRun Estates
- Cytonn Towers
- The Ridge
- Taraji Heights
- The Alma