Cytonn Q3'2023 Markets Review
By Cytonn Research, Oct 8, 2023
Executive Summary
Global Markets Review
According to the July 2023 World Economic Outlook Report by the international monetary Fund (IMF), the global economy is projected to grow at a rate of 3.0% in 2023, 0.5% points lower than the 3.5% growth recorded in 2022 and 0.2% points higher than the IMF’s earlier projection in April 2023. The upward revision is mainly driven by the continued tightening of monetary policies in most economies in their efforts to fight inflation with the global headline inflation being expected to fall to 6.8% in 2023 from the 8.7% recorded in 2022. Notably, advanced economies continue to drive the decline in growth in 2023 from 2022, with weaker manufacturing sector offsetting the stronger services sector and the growth is expected to decline to 1.5% in 2023, compared to the 2.1% growth in 2022. However, the growth in the Emerging Market and Developing Economies is expected to expand marginally to 4.0% in 2023, from an estimated growth of 3.7% in 2022;
Sub-Saharan Africa Regional Review
According to the International Monetary Fund (IMF), the Sub Saharan economy is projected to grow at a rate of 3.5% in 2023, a 0.3% points decline from a growth of 3.8% recorded in 2022. Notably, the projection is an upward revision from the World Bank’s Global Economic Prospects - 2023 projection of 3.2%. The upward revision of the regional growth by the IMF is mainly as a result of expected easing of inflationary pressures in line with the ongoing reduction of global inflation as the central banks around the world continue to tighten the monetary policies aimed at bringing down the inflation rate to the target ranges. However, the expected slowdown in the regional economic growth in 2023 from 2022 is mainly on the back of adverse weather conditions that have undermined agricultural productivity, weak external demand, tight global financial conditions and high inflationary pressures in most countries in the region. Additionally, public debt is expected to remain high due to increased debt serving costs as a result of continued currency depreciations and increased interest rates in developed economies;
In Q3’2023, most of the select Sub-Saharan currencies depreciated against the US Dollar, mainly attributable to the elevated inflationary pressures in region, high debt servicing costs that continue to dwindle foreign exchange reserves and monetary policy tightening by advanced economies. The high interest rates in developed countries has led to massive capital outflows as investors both institutional and individual seek to take advantage of the higher returns offered in developed economies. Further, the elevated inflationary pressures in most economies in the region puts pressure on the value of local currencies due to expensive importation;
Kenya Macroeconomic Review
The KNBS Economic Survey 2023 reported that the Kenyan economy grew by 4.8% in FY’2022, albeit lower than the 7.6% growth recorded in FY’2021. Notably, KNBS recently released Q2’2023 GDP Report highlighting that the Kenyan economy recorded a 5.4% expansion in Q2’2023, higher than the 5.2% growth in over a similar period last year. Notably, the average inflation rate eased to 6.9% in Q3’2023, compared to 8.7% in Q3’2022, attributable to a decrease in the price of food and beverages following the favorable weather conditions that have boosted agricultural production, resulting in increased food supplies. As a result, Kenya’s general business environment improved in Q3’2023, with the average Purchasing Manager’s Index for the quarter coming at 48.0, compared to 47.4 recorded in a similar period in 2022;
Fixed Income
In Q3’2023, T-bills were oversubscribed, with the overall subscription rate coming in at 110.0%, up from 108.6% in Q2’2023. Investors’ preference for the 91-day paper persisted as they sought to avoid duration risk, with the paper receiving bids worth Kshs 369.5 bn against the offered Kshs 56.0 bn, translating to an oversubscription rate of 549.6%, higher than the oversubscription rate of 508.0% recorded in the previous quarter. Overall subscription rates for the 364-day and 182-day papers came in at 18.4% and 25.7%, lower than the 27.3% and 30.1%, respectively, recorded in Q2’2023. The average yields on the 364-day, 182-day, and 91-day papers increased by 2.3% points, 2.4% points and 2.6% points to 13.6%, 13.3%, and 13.3% in Q3’2023, respectively, from 11.3%, 10.9%, and 10.6%, respectively, in the previous quarter. The upward trajectory in yields is mainly on the back of investors attaching higher risks amid high inflation, currency depreciation, and tight liquidity positions, hence the need to demand higher returns to cushion against the possible loss. The acceptance rate during the period came in at 88.5%, albeit lower than the 92.8% recorded in Q2’2023, with the government accepting a total of Kshs 344.4 bn out of the Kshs 369.5 bn worth of bids received;
During the week, T-bills were oversubscribed for the first time in four weeks, with the overall subscription rate coming in at 138.1%, higher than the undersubscription rate of 56.9% recorded the previous week. Investors’ preference for the shorter 91-day paper persisted, with the paper receiving bids worth Kshs 28.6 bn against the offered Kshs 4.0 bn, translating to an oversubscription rate of 714.5%, higher than the oversubscription rate of 275.2% recorded the previous week. The subscription rate for the 364-day and 182- day papers increased to 31.6% and 14.1% respectively, from 18.4% and 8.1% recorded the previous week. The government rejected expensive bids, accepting a total of Kshs 27.2 bn worth of bids out of Kshs 33.1 bn bids received, translating to an acceptance rate of 82.2%. The yields on the government papers continued to rise, with the yields on the 364-day, 182-day and 91-day papers increasing by 13.2 bps, 2.8 bps, and 5.3 bps to 15.2%, 15.0%, and 14.9%, respectively.
Equities
During Q3’2023, the equities market was on a downward trajectory, with NASI, NSE 20 and NSE 25 declining by 11.0%, 4.2% and 9.4%, respectively, while the newly introduced NSE 10 declined by 4.1% since inception. The equities market performance during the quarter was driven by losses recorded by large caps such as KCB Group, Safaricom, EABL and Equity Group of 28.8%, 16.6%, 15.5% and 7.1%, respectively. The losses were however mitigated by gains recorded by banking stocks such as Standard Chartered Bank-Kenya and ABSA of 2.8% and 1.3%, respectively;
During the week, the equities market was on a downward trajectory, with NASI declining the most by 1.8%, while NSE 20, NSE 25 and NSE 10 declined by 1.2%, 0.8% and 1.1% respectively, taking the YTD performance to losses of 26.6%, 11.0%, and 21.8% for NASI, NSE 20, and NSE 25, respectively. The equities market performance was mainly driven by losses recorded by large-cap stocks such as Bamburi, EABL and Safaricom of 6.9%, 5.3% and 4.1% respectively. The losses were however mitigated by gains recorded by stocks such as, NCBA Group, Equity Group and Diamond Trust Bank-Kenya of 3.3%, 2.8% and 1.5% respectively;
During the week, the Central Bank of Kenya (CBK) released the Quarterly Economic Review for the period ending 30 June 2023, highlighting that the banking sector remained stable and resilient during the period owing to the strong liquidity and capital adequacy;
Real Estate
During Q3’2023, the Real Estate sector in Kenya recorded substantial growth in terms of activity, as compared to the similar period in 2022, attributable to continued investments flowing into the sector. According to the Kenya National Bureau of Statistics (KNBS), the Real Estate sector recorded a growth rate of 5.8% in Q2’2023, 0.8% points higher than 5.0% growth rate recorded in the similar period during 2022;
In terms of the Nairobi Metropolitan Area (NMA) performance, the residential sector recorded improvement with a 0.2%-points y/y increase in average total returns to 6.0%, a 0.1%-points increase from 5.9% recorded in Q3’2022. The commercial office sector recorded average rental yields of 7.7% in Q3’2023, representing a 0.4%-points y/y increase from 7.4% recorded in Q3’2022. The retail sector recorded average rental yields of 8.2% in Q3’2023, representing a 0.6%-points y/y increase from 7.6% recorded in Q3’2022. The land sector recorded an average annualized capital appreciation of 3.2% in Q3’2023, with the average prices per acre in the NMA coming in at Kshs 129.0 mn in Q3’2023, from Kshs 130.4 mn recorded in Q3’2022;
Investment Updates:
- Weekly Rates:
- Cytonn Money Market Fund closed the week at a yield of 14.23%. To invest, dial *809# or download the Cytonn App from Google Playstore here or from the Appstore here;
- Cytonn High Yield Fund closed the week at a yield of 16.01% p.a. To invest, email us at sales@cytonn.com and to withdraw the interest, dial *809# or download the Cytonn App from Google Playstore here or from the Appstore here;
- We continue to offer Wealth Management Training every Wednesday, from 9:00 am to 11:00 am. The training aims to grow financial literacy among the general public. To register for any of our Wealth Management Trainings, click here;
- If interested in our Private Wealth Management Training for your employees or investment group, please get in touch with us through wmt@cytonn.com;
- Cytonn Insurance Agency acts as an intermediary for those looking to secure their assets and loved ones’ future through insurance namely; Motor, Medical, Life, Property, WIBA, Credit and Fire and Burglary insurance covers. For assistance, get in touch with us through insuranceagency@cytonn.com;
- Cytonn Asset Managers Limited (CAML) continues to offer pension products to meet the needs of both individual clients who want to save for their retirement during their working years and Institutional clients that want to contribute on behalf of their employees to help them build their retirement pot. To more about our pension schemes, kindly get in touch with us through pensions@cytonn.com;
Real Estate Updates:
- For more information on Cytonn’s Real Estate developments, email us at sales@cytonn.com;
- Phase 3 of The Alma is now ready for occupation and the show house is open daily. To join the waiting list to rent, please email properties@cytonn.com;
- For Third Party Real Estate Consultancy Services, email us at rdo@cytonn.com;
- For recent news about the group, see our news section here;
Hospitality Updates:We currently have promotions for Staycations. Visit cysuites.com/offers for details or email us at sales@cysuites.com;
Global Economic Growth:
According to the July 2023 World Economic Outlook Report by the international monetary Fund (IMF), the global economy is projected to grow at a rate of 3.0% in 2023, 0.5% points lower than the 3.5% growth recorded in 2022 and 0.2% points higher than the IMF’s earlier projection in April 2023. The upward revision is mainly driven by the continued tightening of monetary policies in most economies in their efforts to fight inflation with the global headline inflation being expected to fall to 6.8% in 2023 from the 8.7% recorded in 2022. Notably, advanced economies continue to drive the decline in growth in 2023 from 2022, with weaker manufacturing sector offsetting the stronger services sector and the growth is expected to decline to 1.5% in 2023, compared to the 2.1% growth in 2022. However, the growth in the Emerging Market and Developing Economies is expected to expand marginally to 4.0% in 2023, from an estimated growth of 3.7% in 2022;
The expected slowed down in global economic growth in 2023 as compared to 2022 is majorly attributable to;
- The elevated global inflationary pressures which have necessitated hiking of interest rates by central banks around the world with the aim of anchoring inflation. As such, the global inflation is forecasted to ease slightly to 6.8% in 2023, from 8.7% in 2022,
- Tight global financial conditions occasioned by high cost of borrowing which have increased risks of debt distress in emerging economies as most advanced economies continue to tighten their monetary policies, and,
- Persistent supply chain constraints worsened by the ongoing Russia-Ukraine conflict which have led to increase in global fuel and energy prices. Consequently, the high energy prices have increased inflationary pressures as well as contributed to currency depreciation as dollar demand increases in majority of the world economies.
The global economy is expected to remain subdued in the short term mainly as a result of persistent inflationary pressures as well as tightening of monetary policies which are expected to weigh down on economic activity.
Global Commodities Market Performance:
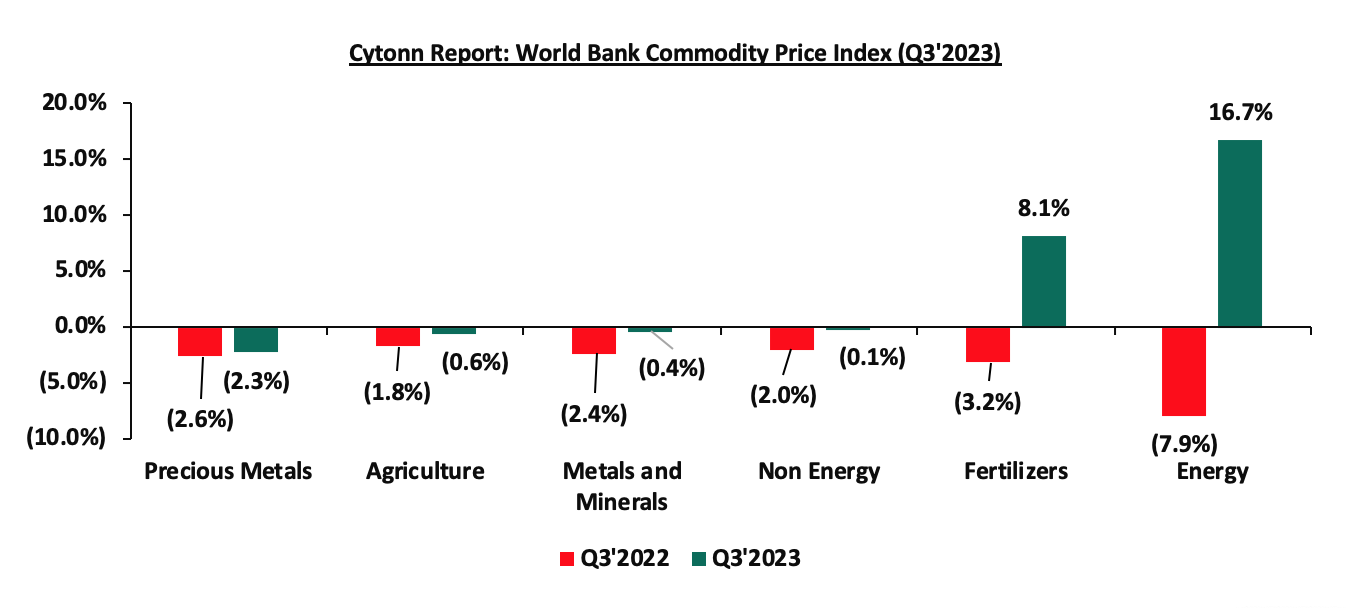
Global commodity prices recorded mixed performance in Q3’2023, with prices of energy increasing the most by 16.7% compared to the 7.9% decline recorded in Q3’2022, mainly as result of increased global demand on the back of persistent supply chain constraints worsened by the ongoing Russia-Ukraine conflict. Similarly, prices of fertilizers increased by 8.1% in Q3’2023, compared to 3.2% in a similar period last year, while prices prices of precious metals, agriculture, metals and minerals, and Non- energy declined by 2.3%, 0.6%, 0.4% and 0.1% respectively, on the back of reduced global demand coupled with easing supply chain constraints. The chart below shows a summary of performance of various commodities;
Source: World Bank
Global Equities market performance:
The global stock market recorded mixed performance in Q3’2023, with most indices in developed economies declining attributable to the cash outflows from equities market to the fixed income docket mainly on the back of elevated inflationary pressures world over which has led to increased interest rates. Notably, the Mauritius stock exchange index (Semdex) was the largest gainer at 10.1% in Q3’2023 driven by gains recorded by stocks in the financial sector as a result of the improved business environment in the country with economy having expanded by 6.0% in Q2’2023 signaling improved investors’ confidence in the Mauritius equities market. On the other hand, NASI was the largest decliner recording losses of 15.6% in Q3’2023, mainly due to capital flight as foreign investors sold off their investments in the Kenyan equities market. Additionally, investors have continued to attach higher risk premium to the country as a result the inflationary pressures coupled with the sustained depreciation of the Kenyan shilling against the dollar so far having depreciated by 20.0% on year to date basis in 2023. The chart below shows a summary of the performance of key indices in Q3’2023;
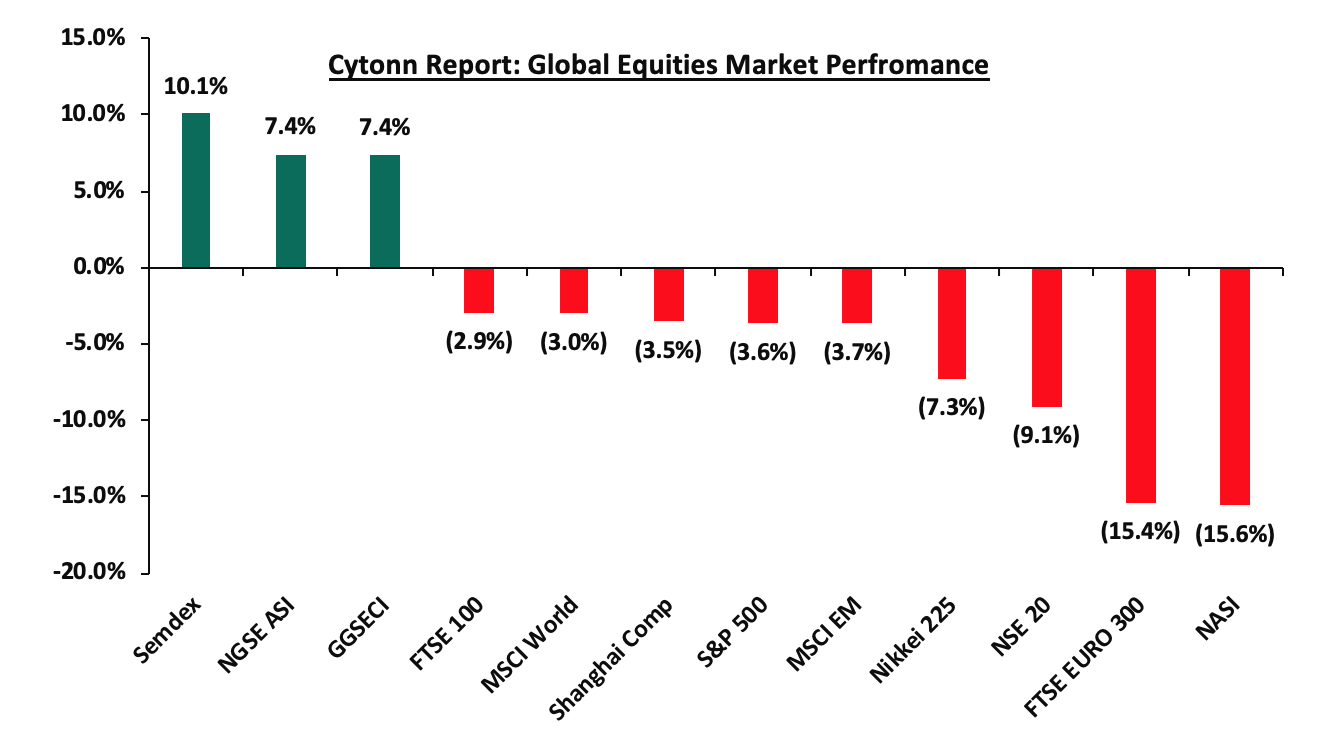
*Dollarized performance
According to the International Monetary Fund (IMF), the Sub-Saharan African economy is projected to grow at a rate of 3.5% in 2023, a 0.3% points decline from a growth of 3.8% recorded in 2022. Notably, the projection is an upward revision from the World Bank’s Global Economic Prospects - 2023 projection of 3.2%. The upward revision of the regional growth by the IMF is mainly as a result of expected easing of inflationary pressures in line with the ongoing reduction of global inflation as the central banks around the world continue to tighten the monetary policies aimed at bringing down the inflation rate to the target ranges. However, the expected slowdown in the regional economic growth in 2023 from 2022 is mainly on the back of adverse weather conditions that have undermined agricultural productivity, weak external demand, tight global financial conditions and high inflationary pressures in most countries in the region. Additionally, public debt is expected to remain high due to increased debt serving costs as a result of continued currency depreciations and increased interest rates in developed economies.
Currency Performance
In Q3’2023, most of the select Sub-Saharan currencies depreciated against the US Dollar, mainly attributable to the elevated inflationary pressures in region, high debt servicing costs that continue to dwindle foreign exchange reserves and monetary policy tightening by advanced economies. The high interest rates in developed countries has led to massive capital outflows as investors both institutional and individual seek to take advantage of the higher returns offered in developed economies. Further, the elevated inflationary pressures in most economies in the region puts pressure on the value of local currencies due to expensive importation. Below is a table showing the performance of select African currencies against the US Dollar:
|
Cytonn Report: Select Sub Saharan Africa Currency Performance vs USD |
|||||
|
Currency |
Sep-22 |
Jan-23 |
Sep-23 |
Last 12 Months change (%) |
YTD change (%) |
|
Mauritius Rupee |
44.1 |
43.0 |
43.1 |
2.4% |
(0.4%) |
|
Ugandan Shilling |
3,814.7 |
3,678.1 |
3,713.3 |
2.7% |
(0.9%) |
|
Malawian Kwacha |
1,011.0 |
1,009.0 |
1,067.0 |
(5.2%) |
(5.4%) |
|
Tanzanian Shilling |
2,332.0 |
2,332.0 |
2,505.5 |
(6.9%) |
(6.9%) |
|
Botswana Pula |
13.2 |
12.6 |
13.6 |
(3.3%) |
(7.4%) |
|
South African Rand |
17.6 |
16.9 |
19.0 |
(7.1%) |
(10.9%) |
|
Zambian Kwacha |
15.7 |
18.1 |
20.73 |
(24.1%) |
(12.9%) |
|
Ghanaian Cedi |
10.1 |
9.8 |
11.6 |
(12.7%) |
(15.3%) |
|
Kenyan Shilling |
119.8 |
123.4 |
148.1 |
(19.1%) |
(20.0%) |
|
Nigerian Naira |
431.5 |
447.6 |
777.6 |
(44.5%) |
(42.4%) |
Source: Yahoo Finance
Key take outs from the table include:
- The Mauritius Rupee was the largest gainer against the USD Dollar over the last twelve months gaining by 2.4% and the least decliner on YTD basis by 0.4%, mainly attributable to positive investor confidence following Mauritius improved macroeconomic performance following the expansion of the Mauritius economy by 6.0% as of Q2’2023.
- Nigeria Naira was the worst performing currency in Q3’2023 and the largest decliner over the last twelve months, depreciating by 42.4% and 44.5%, respectively, mainly as result of the recent decision by the Central Bank of Nigeria to adopt floating exchange rate regime, where the currency value of the Naira is allowed to vary according to the foreign exchange market, and,
- The Kenya Shilling depreciated by 20.0% in Q3’2023 to close at Kshs 148.1 against the US Dollar, compared to Kshs 123.4 recorded at the beginning of the year, driven by increased dollar demand from importers especially oil and energy sectors, the ever-present current account deficit and the need for government debt servicing which has continued to put pressure on the country’s forex reserves.
The chart below shows the year to date performance of different sub-Saharan African countries in Q3’2023;
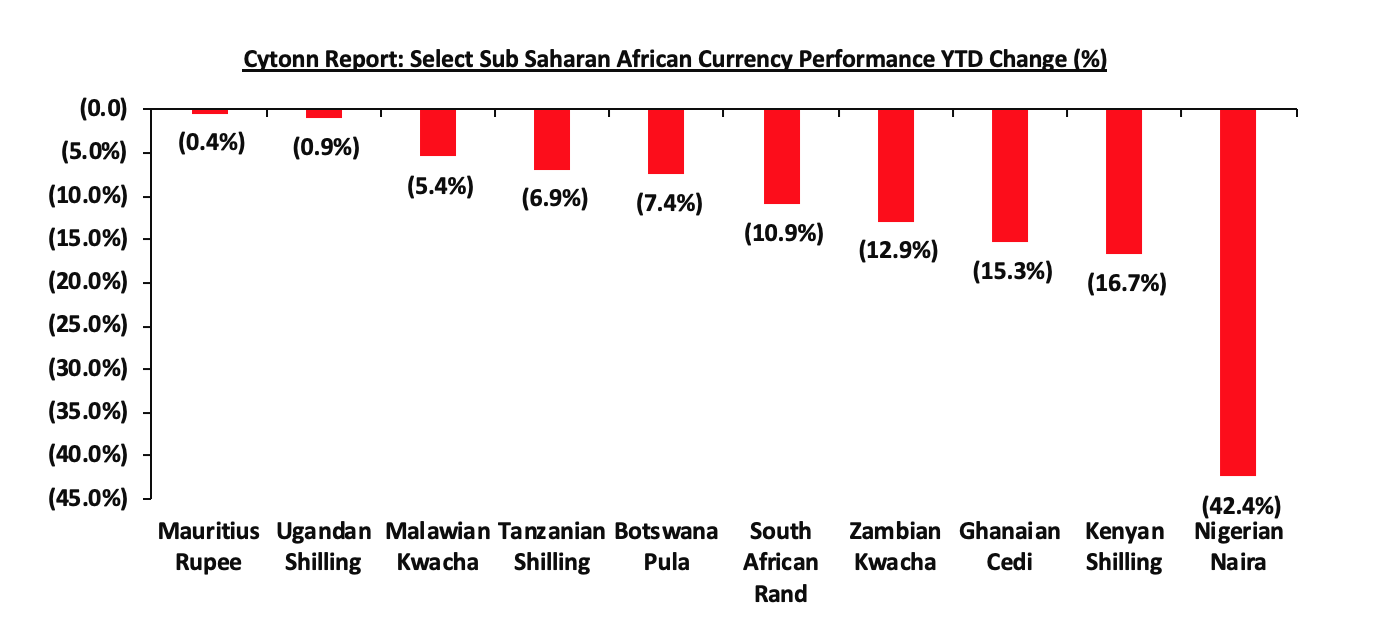
Source: Yahoo Finance
African Eurobonds:
Africa has been less interested in borrowing money in foreign currencies, with no issuer in the third quarter of 2023. Most countries avoided the Eurobonds market because of the high and persistent interest rates and the difficult economic situation. The main reason for the rise in interest rates was that investors demanded more compensation for lending to Sub-Saharan Countries, because of the high inflation, debt problems, and weakening local currencies in the region. Yields on the Senegal Eurobond remained elevated despite recording marginal increase of 0.2% points in Q3’2023 to 8.0% from 7.8%% recorded at the end of June 2023. However, the yield on Kenya’s Eurobond increased sharply by 5.2% points to 17.8% at the end of Q2’2023, up from 12.6% recorded at the end of the previous quarter, on the back of credit crunch concerns ahead of the 2024 bond maturity as evidenced by the downgrade of Kenya’s long-term foreign currency and local-currency issuer ratings and senior unsecured debt ratings from B3 from B2 with a negative outlook by Moody’s Credit Rating Agency. Below is a 5-year graph showing the Eurobond secondary market performance of select 10-year Eurobonds issued by the respective countries;
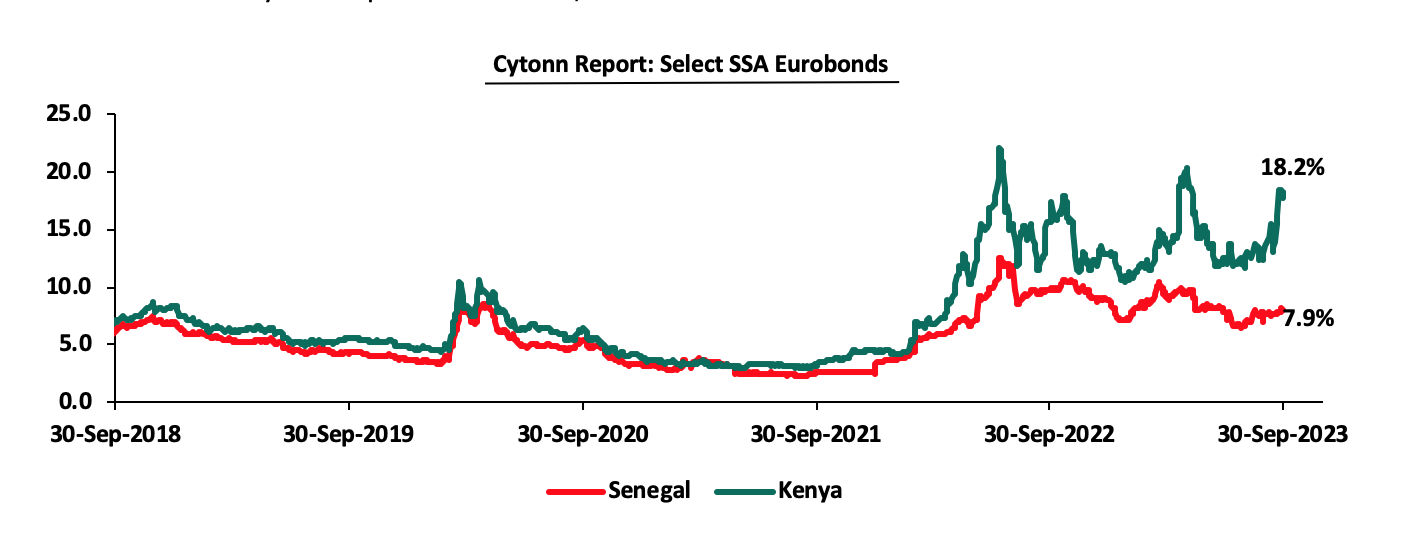
Source: S&P Capital
Equities Market Performance
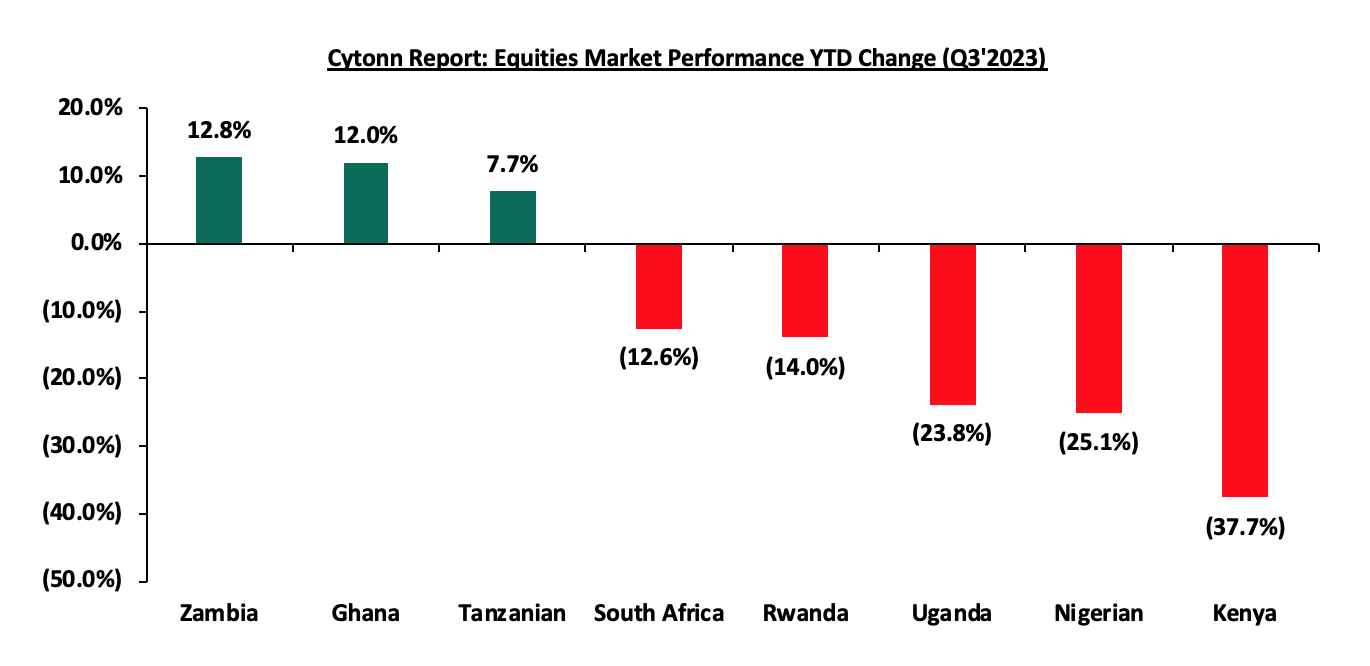
Sub-Saharan Africa (SSA) stock markets recorded mixed performance in Q3’2023, with Zambia’s stock market (LASILZ) being the best performing market gaining by 12.8% YTD driven by the gains in the financial as well as energy sectors coupled with increased copper exports in the country to countries such as China, Switzerland and Singapore driving the country’s growth prospects. Kenya’s NASI was the worst performing stock market, declining by 37.7% YTD at the end of Q3’2023, mainly attributable to increased capital flight with investors chasing higher returns from advanced economies following hiking of interest rates as well as deterioration in investor confidence in country on the back of macroeconomic uncertainties. Additionally, investors have continued to attach higher risk premium to the country as a result of the inflationary pressures coupled with the sustained depreciation of the Kenyan shilling against the dollar having depreciated by 20.0% on year to date basis in 2023. Below is a summary of the performance of key indices. The table below shows a summary of the performance of key indices;
|
Cytonn Report: Equities Market Performance Q3’2023 (Dollarized*) |
||||||
|
Country |
Index |
Sep-22 |
Jan-23 |
Sep-23 |
Last 12 Months change (%) |
YTD change (%) |
|
Zambia |
LASILZ |
479.7 |
406.2 |
458.1 |
(4.5%) |
12.8% |
|
Ghana |
GGSECI |
242.5 |
245.2 |
274.7 |
13.3% |
12.0% |
|
Tanzanian |
DARSDEI |
1.5 |
1.6 |
1.7 |
13.7% |
7.7% |
|
South Africa |
JALSH |
3,511.4 |
4,408.4 |
3,853.4 |
9.7% |
(12.6%) |
|
Rwanda |
RSEASI |
0.1 |
0.1 |
0.1 |
(15.5%) |
(14.0%) |
|
Uganda |
USEASI |
0.3 |
0.3 |
0.2 |
(24.6%) |
(23.8%) |
|
Nigerian |
NGSEASI |
113.5 |
115.3 |
86.3 |
(24.0%) |
(25.1%) |
|
Kenya |
NASI |
1.1 |
1.0 |
0.6 |
(39.3%) |
(37.7%) |
|
*The index values are dollarized for ease of comparison |
||||||
Source: Cytonn Research, Kwayisi, Yahoo Finance
The chart below shows the YTD Performance of the sub-Saharan Equities Market;
GDP growth in the Sub-Saharan Africa region is expected to slow down, in line with the rest of the global economy. Additionally, public debt continues to be a major headwind, with high debt levels experienced in the region on the back of continued weakening of local currencies, which will make debt servicing costlier, making the region less attractive to foreign capital.
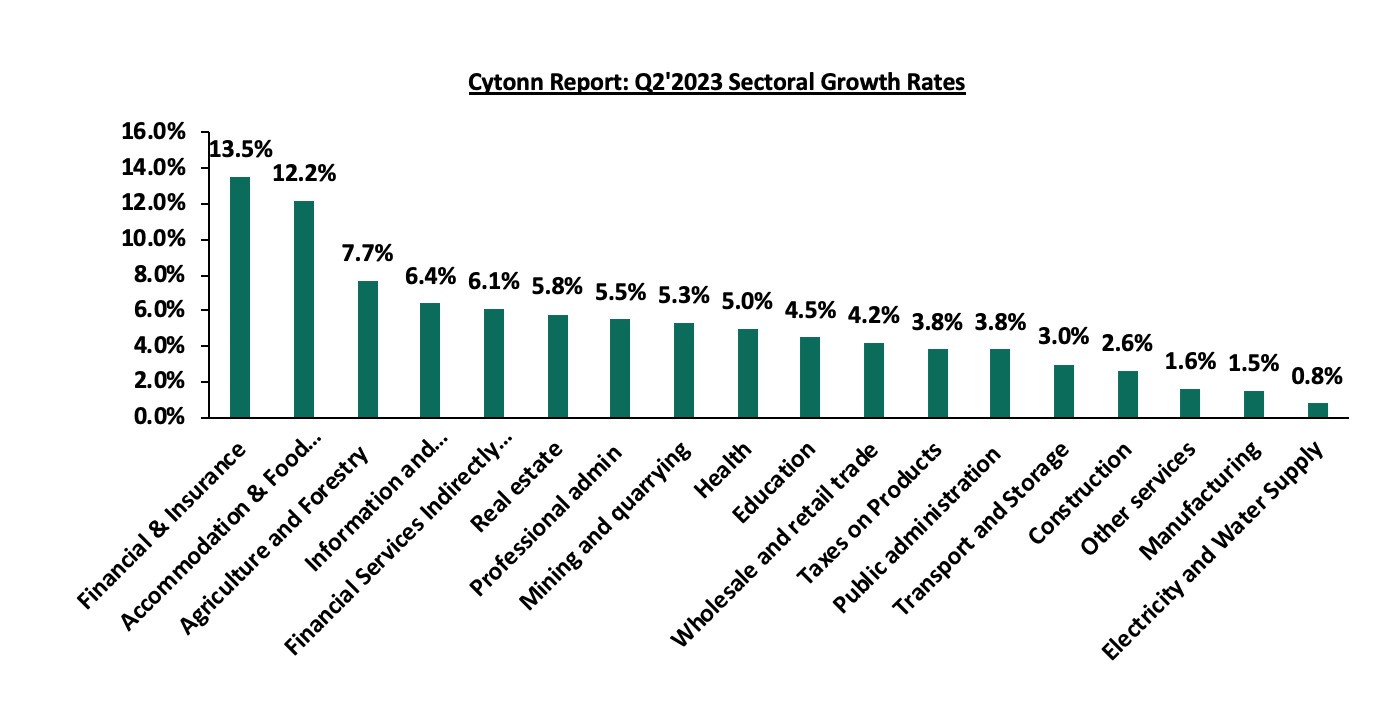
The KNBS Economic Survey 2023 reported that the Kenyan economy grew by 4.8% in FY’2022, albeit lower than the 7.6% growth recorded in FY’2021. Notably, KNBS recently released Q2’2023 GDP Report highlighting that the Kenyan economy recorded a 5.4% expansion in Q2’2023, higher than the 5.2% growth in over a similar period last year. On a quarter-on-quarter basis, the expansion was 0.1% points above the 5.3% registered in Q1’2023. The performance in Q2’2023 was mainly driven by the 7.7% growth in agricultural sector due to the favorable weather conditions, which led to more agricultural output as evidenced by the 15.2% increase in tea output to 155.5 thousand metric tonnes and 13.7% growth in coffee exports to 18.9 thousand metric tonnes in the quarter under review. Other sectors that contributed to the growth were financial & insurance, accommodation and food Service and Information & Communication, having increased by 13.5%, 12.2% and 6.4% respectively during the quarter under review. However, the performance was weighed down by the subdued quarterly growth in electricity and water supply, manufacturing, construction, and transport & storage of 0.8%, 1.5%, 2.6% and 3.0% respectively. The Kenyan Economy is projected to grow at an average of 5.2%, in 2023 according to various organizations as shown below:
|
Cytonn Report: Kenya 2023 growth Projections |
||
|
No. |
Organization |
2023 GDP Projections |
|
1 |
International Monetary Fund |
5.1% |
|
2 |
National Treasury |
6.1% |
|
3 |
World Bank |
5.0% |
|
4 |
Fitch Solutions |
5.1% |
|
5 |
Cytonn Investments Management PLC |
5.0% |
|
Average |
5.2% |
|
Source: Cytonn Research
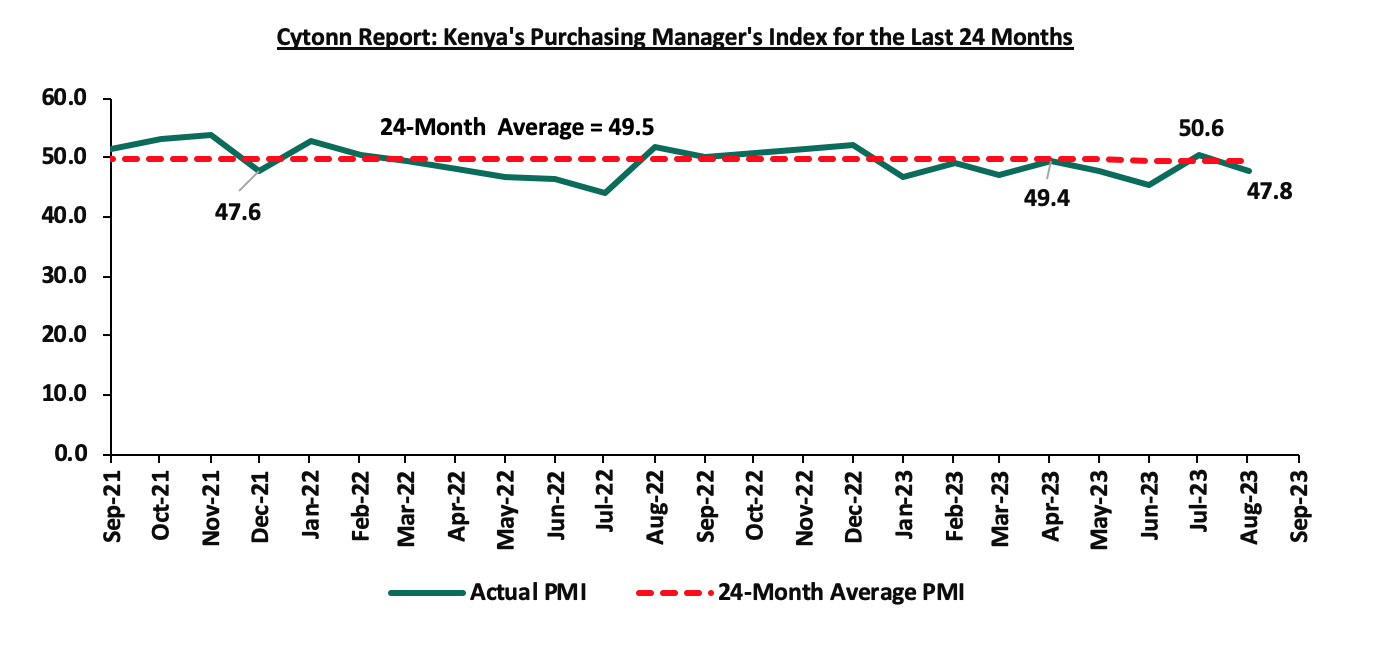
Key to note, Kenya’s general business environment improved in Q3’2023, with the average Purchasing Manager’s Index for the quarter coming at 48.0, compared to 47.4 recorded in a similar period in 2022. The improvement was mainly on the back of the eased inflationary pressures experienced in the country, with the inflation rate averaging 6.9% in Q3’2023, lower than the 8.7% recorded over a similar period in 2022. After seven months of decline, the private sector showed signs of recovery in August evidenced by the increase in output and new orders as well as businesses hiring more workers and purchasing more goods. However, the economy continues to be under inflationary pressures following the increase in fuel pump prices by an average of Kshs 23.8 by the Energy and Petroleum Regulatory Authority (EPRA), along with more taxes and probable future tax hikes, coupled with aggressive depreciation of the Kenyan shilling which has contributed significantly to the fall in production output by most businesses. Additionally, the Moody’s Credit Rating agency downgraded Government of Kenya’s long-term foreign currency and local-currency issuer ratings and senior unsecured debt ratings to B3 from B2 with a negative outlook, on the back of increased liquidity risk as investors were less interested in buying long-term government bonds resulting in higher bond yields. The downgrade shows that the risk of default was higher with very little room for error because of the low liquidity and the high debt payments in the next fiscal year. The chart below summarizes the evolution of PMI over the last 24 months. (A reading above 50.0 signal an improvement in business conditions, while readings below 50.0 indicate a deterioration):
Inflation:
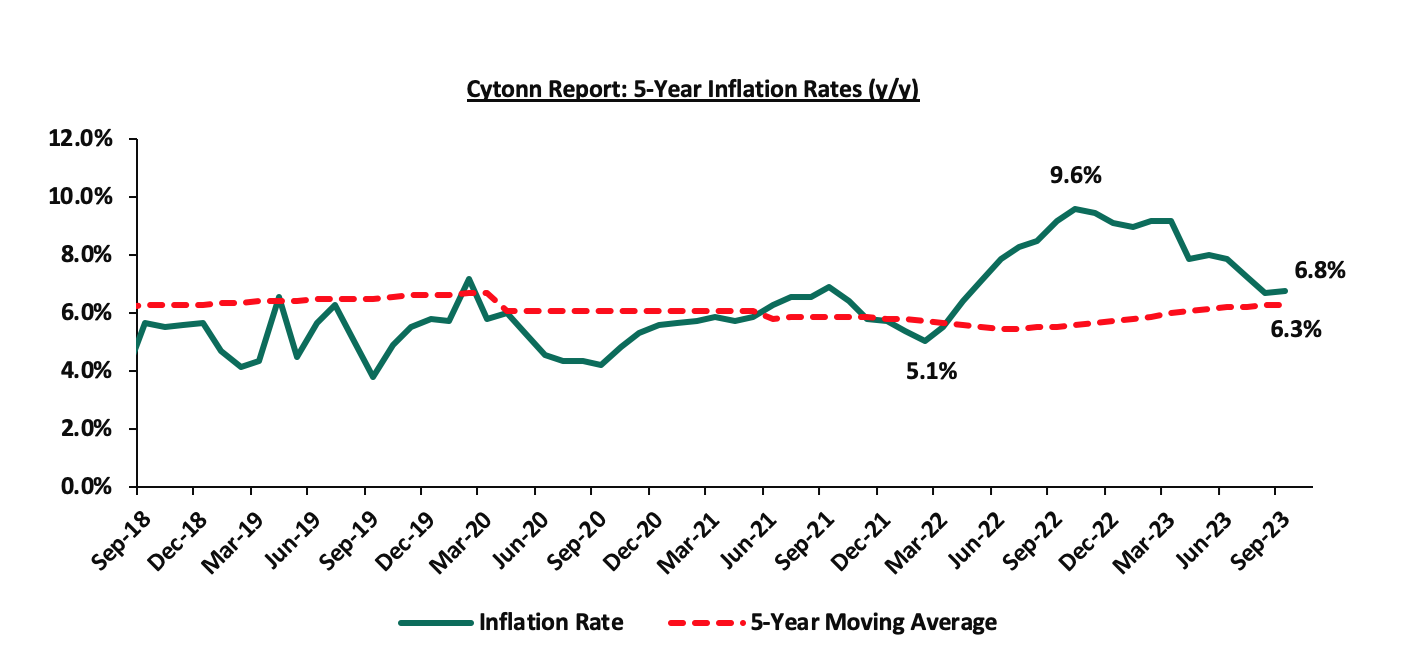
The average inflation rate eased to 6.9% in Q3’2023, compared to 8.7% in Q3’2022, attributable to a decrease in the price food and beverages following the favorable weather conditions that have boosted agricultural production, resulting in increased food supplies. Notably, fuel prices increased by 22.9%, 28.3% and 35.6% in June 2023 to Kshs 195.5, Kshs 179.7, and Kshs 173.4, from Kshs 159.1, Kshs 140.0, and Kshs 127.9 per liter in June 2022 for Super petrol, Diesel, and Kerosene, respectively. Inflation for the month of June 2023 marginally eased to 7.9%, from 8.0% recorded in May 2023, mainly driven by a 1.3% increase in the food and non-alcoholic beverages index. Below is a chart showing inflation trend for the last five years:
In July 2023 Kenya’s inflation rate decreased to 7.3% from the 7.9% recorded in June 2023, marking the first time in 14 months that Kenya’s inflation fell within the Central Bank of Kenya (CBK) target range of 2.5% - 7.5%. This follows the tightened monetary policies instituted by the Monetary Policy Committee (MPC) to contain the rise by raising the Central Bank Rate (CBR) by cumulative of 300.0 bps to 10.5% in June 2023 from the 7.5% CBR rate that was set in July 2022. Going forward, we expect the inflationary pressures to remain elevated in the short to medium term, mainly on the back of high fuel prices, which is key components of the headline inflation index. Additionally, the complete removal of the fuel subsidy, coupled with the increase in VAT on petroleum products to 16.0% from 8.0% in the new Finance Act 2023 and the decline in oil supply following Russia’s oil supply cut is expected to add more pressure on the fuel prices in the country.
September 2023 Inflation
The y/y inflation in September 2023 increased marginally by 0.1% points to 6.8%, from the 6.7% recorded in August 2023. This was in line, but below our projections of an increase to within a range of 7.2% to 7.6%. The headline inflation in September 2023 was majorly driven by increase in prices of commodities in the following categories, food and non-alcoholic beverages; housing, water, electricity, gas and other fuels, and transport. The table below shows a summary of both the year on year and month on month commodity indices performance;
|
Cytonn Report: Major Inflation Changes – 2023 |
|||
|
Broad Commodity Group |
Price change m/m (September-2023/August-2023) |
Price change y/y (September-2022/September-2023) |
Reason |
|
Food and Non-Alcoholic Beverages |
0.7% |
7.9% |
The m/m increase was mainly driven by the increase in prices of commodities such as potatoes, cabbages and Kales (Sukuma-Wiki) of 18.4%, 7.4% and 4.2%, respectively. However, the increase was weighed down by decrease in prices of Maize flour-loose, maize flour-sifted, maize grain-loose, and wheat flour-white by 6.7%, 6.0%, 5.4%, and 3.6%, respectively. |
|
Housing, Water, Electricity, Gas and Other Fuel |
1.4% |
6.3% |
The m/m performance was mainly driven by the increase in prices of 13.0kg gas/LPG by 3.2%. However, there was a decrease in prices of Electricity of 200kWh and 50kWh by 2.1% and 2.5% respectively. |
|
Transport cost |
3.5% |
13.0% |
The m/m increase in transport Index was mainly due to increase in prices of nationwide bus fares on the back of the rise in the prices of petrol and diesel by 8.7% and 11.8%, respectively. |
|
Overall Inflation |
1.0% |
6.8% |
The m/m increase was mainly driven by 3.5% increase in transport costs. |
Notably, the overall headline inflation remained within the Central Bank of Kenya (CBK) target range of 2.5% to 7.5% for the third consecutive month. The increase in headline inflation in September 2023 comes amid the recent rise in fuel prices which increased by 8.7%, 11.8% and 19.4% to Kshs 211.6, Kshs 200.6 and Kshs 202.6, per litre of Super Petrol, Diesel and Kerosene, respectively, for the period between 15th September 2023 to 14th October 2023.
The Kenyan Shilling:
The Kenyan Shilling depreciated against the US Dollar by 5.4% in Q3’2023, to close at Kshs 148.1, from Kshs 140.5 as at the end of Q2’2023, partly attributable to increased dollar demand from importers, especially in the energy, oil and manufacturing sectors. Key to note, this is the lowest the Kenyan shilling has ever depreciated against the dollar. During the week, the Kenya Shilling depreciated against the US Dollar by 0.4% to close at 148.7, from 148.1 recorded the previous week. . On a year to date basis, the shilling has depreciated by 20.5% against the dollar, adding to the 9.0% depreciation recorded in 2022. We expect the shilling to remain under pressure in 2023 as a result of:
- An ever-present current account deficit which came at 3.7% of GDP in Q2’2023 from 6.0% recorded in a similar period last year,
- The need for government debt servicing, continues to put pressure on forex reserves given that 66.8% of Kenya’s external debt is US Dollar denominated as of April 2023, and,
- Dwindling forex reserves currently at USD 6.9 bn (equivalent to 3.7-months of import cover), which is below the statutory requirement of maintaining at least 4.0-months of import cover.
The shilling is however expected to be supported by:
- Diaspora remittances standing at a cumulative USD 2,766.3 mn in 2023 as of August 2023, 3.4% higher than the USD 2,674.5 mn recorded over the same period in 2022, which has continued to cushion the shilling against further depreciation. In the August 2023 diaspora remittances figures, North America remained the largest source of remittances to Kenya accounting for 57.0% in the period, followed by Europe at 17.3% while the rest of the world accounted for 25.7% of the total remittances, and,
- The tourism inflow receipts came in at USD 268.1 bn in 2022, a significant 82.9% increase from USD 146.5 bn inflow receipts recorded in 2021.
Monetary Policy:
The Monetary Policy Committee (MPC) met once during Q3’2023, with the MPC announcement on 9th August 2023 retaining the Central Bank Rate at 10.5% in the second consecutive sitting. Below are some of the Key highlights from the meeting:
- The overall inflation eased to 7.3% in July 2023 from 7.9% in June, marking the first time in 14 months that the inflation has fallen within the CBK target range of 2.5%-7.5%. The overall easing in inflation was driven by lower food and non-food non-fuel inflation. The food inflation eased to 8.6% in July 2023 from 10.3% in June 2023, attributable to lower prices of vegetables as a result of the long rains, and improved supply of select non-vegetable food items. On the other hand, fuel inflation remained elevated at 14.5% in July from 12.9% in June, largely attributable to increased electricity prices and implementation of the 16.0% VAT on petroleum products. Fuel inflation was however moderated by lower prices of cooking gas following the removal of VAT on liquefied petroleum gas (LPG). The MPC expect the overall inflation to ease further in the short-term, due to the lower food prices and improving supply of key food items particularly maize,
- The recently released GDP data for the first quarter of 2023 showed continued strong performance of the Kenyan economy, with real GDP growing by 5.3%. This was attributable to a strong rebound in the agriculture sector due to favourable weather conditions and resilient performance of the services sector. Leading indicators of economic activity pointed to continued strong performance in the second quarter of 2023. Despite the global uncertainties, the economy is expected to continue to strengthen in 2023, supported by resilient services sector, the rebound in agriculture, and implementation of measures to boost economic activity in priority sectors by the Government,
- Goods exports have remained resilient, growing by 2.1% in the 12 months to June 2023 compared to 11.2% in a similar period in 2022. Receipts from tea and manufactured exports increased by 7.0% and 23.0%, respectively, attributable to increased demand from traditional markets. Additionally, Imports declined by 6.1% in the 12 months to June 2023 compared to 20.2% in a similar period in 2022. The slowed growth of imports is partly attributable to drop of imports of infrastructure related equipment, mainly on the back of completed projects as well as manufactured goods. Oil prices have continued to ease since the fourth quarter of 2022. Receipts from services exports increased reflecting improvement in international travel and transport. Remittances totalled USD 4,017.0 mn in the 12 months to June 2023, 0.1% higher than USD 4,012.0 mn recorded in the same period in 2022. The current account deficit is estimated at 4.2% of the GDP in the 12 months to June 2023 and is projected to improve to 4.8% of GDP in 2023 from the 5.1% of GDP in 2022,
- The CBK foreign exchange reserves, which currently stand at USD 7,338.0 mn representing a 4.0 months of import cover, continues to provide adequate cover and a buffer against any short-term shocks in the foreign exchange market,
- The banking sector remains stable and resilient, with strong liquidity and capital adequacy ratios. The ratio of gross non-performing loans (NPLs) to gross loans stood at 14.5% in June 2023 compared to 14.9% in May 2023. Decreases in NPLs were noted in the transport and communication, agriculture, manufacturing, and personal and household sectors. However, banks have continued to make adequate provisions for the NPLs,
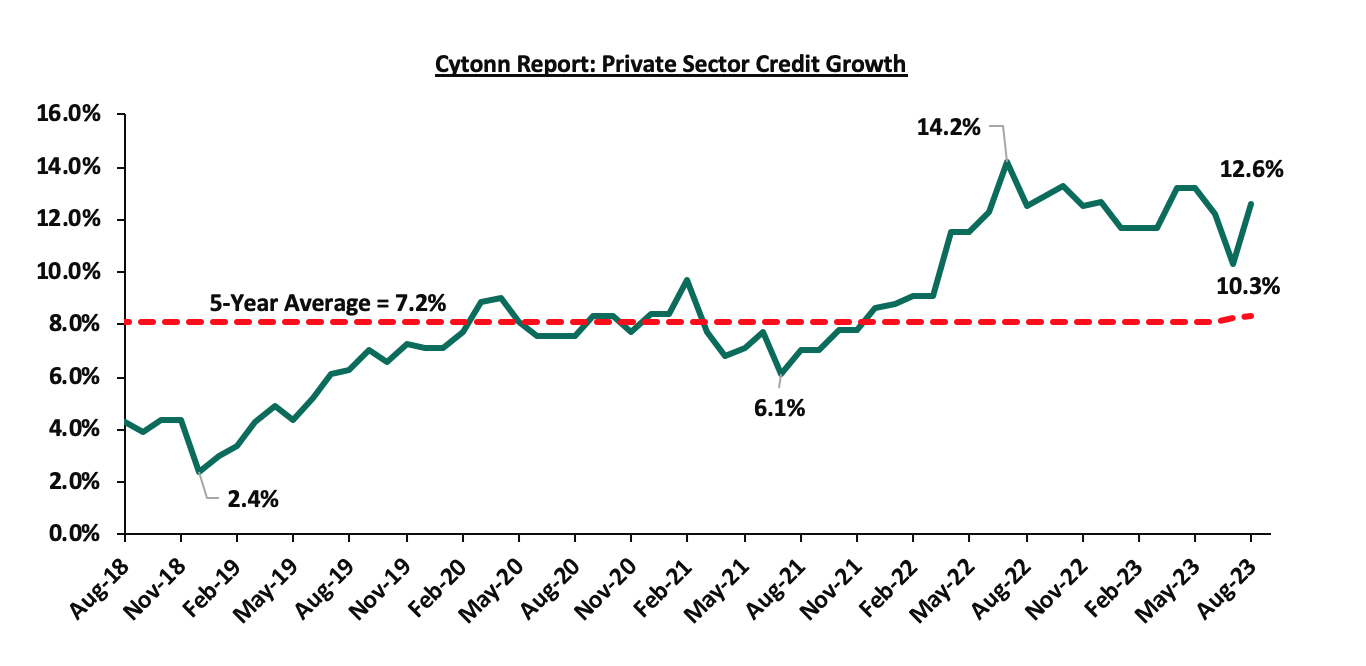
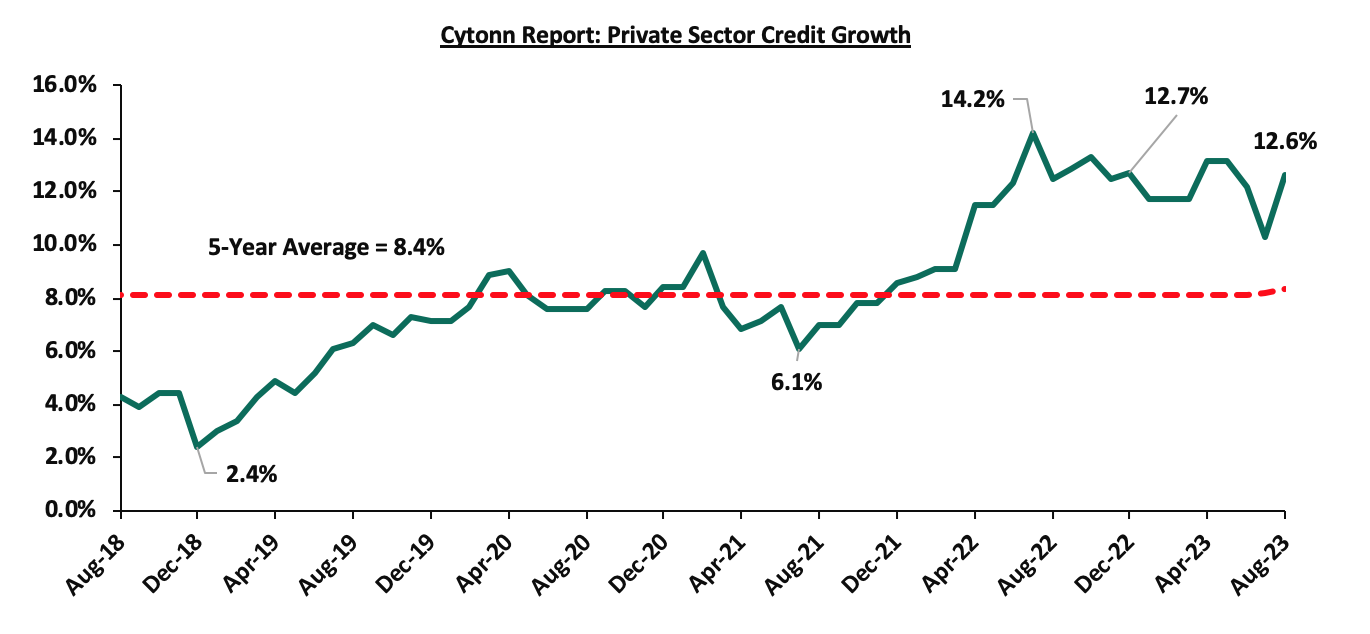
- Growth in private sector credit declined to 12.2% in June 2023 from 13.2% in May 2023. Strong credit growth was observed in sectors such as; transport and communication, manufacturing, trade, and consumer durables of 19.9%, 18.0%, 12.5% and 11.8% respectively. Additionally, the number of loan applications and approvals remained strong, reflecting resilience in economic activities. Notably, the private sector credit increased by 12.6% in August 2023, up from 10.3% in July, supported by credit growth in sectors such as transport and communication, manufacturing, consumer durables and trade of 24.9%, 19.6%, 12.7% and 9.4%, respectively. The number of loan requests and grants stayed high, indicating robust economic activities. The chart below shows the movement of the private sector credit growth of the last five year;
- The Committee noted the outcome of the FY’2022/23 Government Budget operations, which resulted in a lower budget deficit of 5.3% of GDP in FY’2022/23 from 6.2% of GDP in FY’2021/22. Additionally, the MPC noted the ongoing implementation of the FY’2023/24 Government Budget, which continues to reinforce fiscal consolidation. The MPC welcomed the efforts by the National Treasury to source new external financing for the budget, noting that, as a result of the identified new external financing, the projected net domestic borrowing by the Government had been reduced to Kshs 316.0 bn from Kshs 586.5 bn, which is consistent with the government’s economic programme. The MPC observed that the revised borrowing requirements should exert downward pressure on domestic interest rates, while the additional external financing will bolster the foreign reserves of the CBK, and,
- The MPC also considered and approved a new monetary policy implementation framework designed to enhance monetary policy transmission. This new framework is based on inflation targeting and introduces an interest rate corridor around the Central Bank Rate (CBR) set at ± 250.0 bps. Henceforth, the monetary policy operations will be aimed at ensuring the interbank rate, as an operating target, closely tracks the CBR. In addition, to improve access to the Discount Window, the Committee agreed to reduce the applicable interest rate to 400.0 bps above the CBR from the current 600.0 bps above CBR.
The committee noted that, the impact of its move to tighten the monetary policy in June 2023 to anchor inflationary expectations was still transmitting in the economy and therefore it concluded that the current stance on monetary policy was appropriate and decided to retain the central Bank Rate at 10.50%. Additionally, the committee noted that inflation was already within the target range and was expected to decline further as food inflation is expected to come down. The Committee will closely monitor the impact of the policy measures, as well as developments in the global and domestic economy, and stands ready to take further action as necessary. The Committee last met on 3rd October 2023 and the next meeting is scheduled for December 2023.
Money Markets, T-Bills Primary Auction:
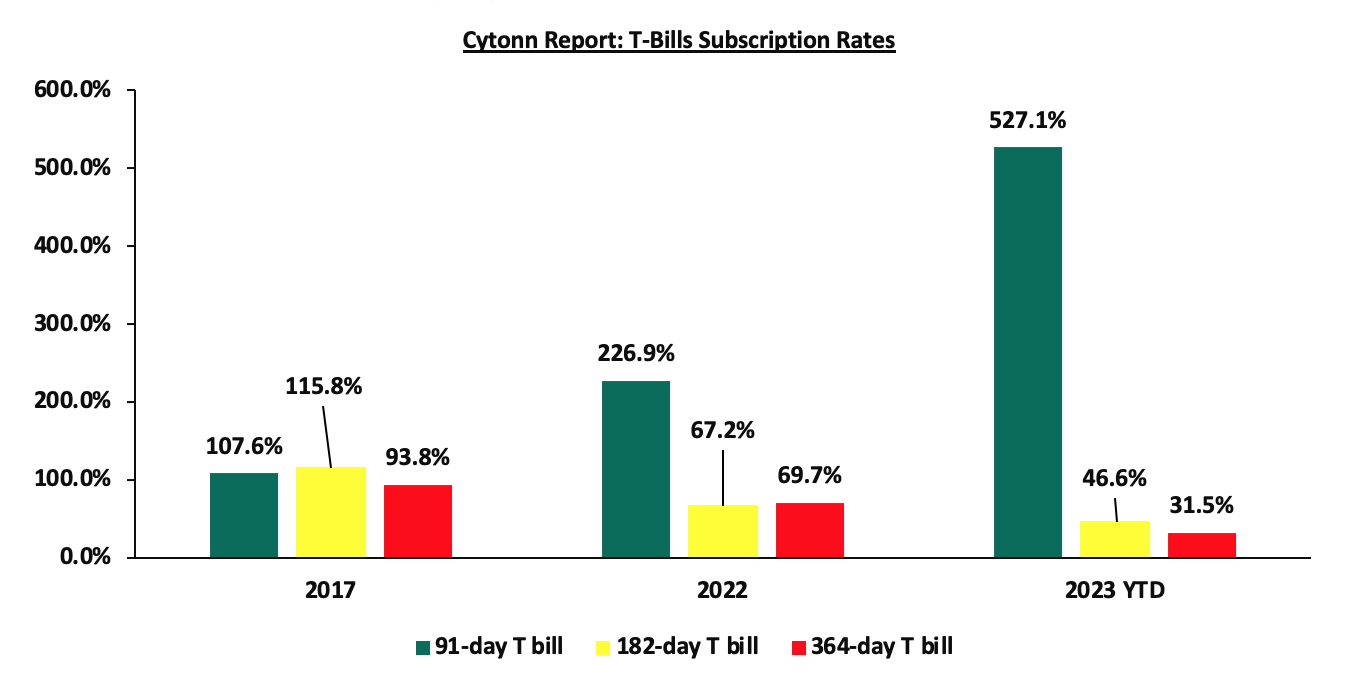
In Q3’2023, T-bills were oversubscribed, with the overall subscription rate coming in at 110.0%, up from 108.6% in Q2’2023. Investors’ preference for the 91-day paper persisted as they sought to avoid duration risk, with the paper receiving bids worth Kshs 369.5 bn against the offered Kshs 56.0 bn, translating to an oversubscription rate of 549.6%, higher than the oversubscription rate of 508.0% recorded in the previous quarter. Overall subscription rates for the 364-day and 182-day papers came in at 18.4% and 25.7%, lower than the 27.3% and 30.1%, respectively, recorded in Q2’2023. The average yields on the 364-day, 182-day, and 91-day papers increased by 2.3% points, 2.4% points and 2.6% points to 13.6%, 13.3%, and 13.3% in Q3’2023, respectively, from 11.3%, 10.9%, and 10.6%, respectively, in the previous quarter. The upward trajectory in yields is mainly on the back of investors attaching higher risks amid high inflation, currency depreciation, and tight liquidity positions, hence the need to demand higher returns to cushion against the possible loss. The acceptance rate during the period came in at 88.5%, albeit lower than the 92.8% recorded in Q2’2023, with the government accepting a total of Kshs 344.4 bn out of the Kshs 369.5 bn worth of bids received;
During the week, T-bills were oversubscribed for the first time in four weeks, with the overall subscription rate coming in at 138.1%, higher than the undersubscription rate of 56.9% recorded the previous week. Investors’ preference for the shorter 91-day paper persisted, with the paper receiving bids worth Kshs 28.6 bn against the offered Kshs 4.0 bn, translating to an oversubscription rate of 714.5%, higher than the oversubscription rate of 275.2% recorded the previous week. The subscription rate for the 364-day and 182- day papers increased to 31.6% and 14.1% respectively, from 18.4% and 8.1% recorded the previous week. The government rejected expensive bids, accepting a total of Kshs 27.2 bn worth of bids out of Kshs 33.1 bn bids received, translating to an acceptance rate of 82.2%. The yields on the government papers continued to rise, with the yields on the 364-day, 182-day and 91-day papers increasing by 13.2 bps, 2.8 bps, and 5.3 bps to 15.2%, 15.0%, and 14.9%, respectively. The chart below compares the overall average T- bills subscription rates obtained in 2017, 2022 and 2023 Year to Date (YTD):
Primary T-Bond Auctions in Q3’2023
In Q3’2023, the Government issued two new bonds, reopened four, and issued four bonds on tap-sale, seeking to raise Kshs 176.0 bn. The bonds were generally oversubscribed, receiving total bids worth Kshs 206.8 bn translating to an average subscription rate of 138.7% during the quarter. The government rejected expensive bids and only accepted bids worth Kshs 146.3, translating to an average acceptance rate of 74.3% during the quarter. The table below provides more details on the bonds issued during the period:
|
Cytonn Report: Bonds Issued in Q3'2023 |
|||||||||
|
Issue Date |
Bond Auctioned |
Effective Tenor to Maturity (Years) |
Coupon |
Amount offered (Kshs bn) |
Actual Amount Raised (Kshs bn) |
Total bids received |
Average Accepted Yield |
Subscription Rate |
Acceptance Rate |
|
7/17/2023 |
FXD1/2016/10-Re-opened |
3.2 |
15.0% |
40.0 |
38.6 |
51.8 |
16.3% |
129.4% |
74.5% |
|
FXD1/2023/05 |
5.0 |
16.8% |
16.8% |
||||||
|
7/24/2023 |
FXD1/2016/10 - tap sale |
3.2 |
15.0% |
20.0 |
43.4 |
44.4 |
16.3% |
222.1% |
97.8% |
|
FXD1/2023/05 - tap sale |
5.0 |
16.8% |
16.8% |
||||||
|
8/21/2023 |
FXD1/2023/02 |
2.0 |
17.0% |
40.0 |
19.1 |
53.0 |
17.0% |
132.5% |
36.1% |
|
FXD1/2023/05-Re-opened |
4.9 |
16.8% |
18.0% |
||||||
|
8/28/2023 |
FXD1/2023/02- tapsale |
2.0 |
17.0% |
21.0 |
23.5 |
23.6 |
17.0% |
112.4% |
99.6% |
|
FXD1/2023/05- tapsale |
4.9 |
16.8% |
18.0% |
||||||
|
9/18/2023 |
FXD1/2023/02-Reopened |
1.9 |
17.0% |
35.0 |
21.6 |
34.0 |
17.5% |
97.2% |
63.6% |
|
FXD1/2016/10- Reopened |
2.9 |
15.0% |
17.9% |
||||||
|
Q3'2023 Total |
176.0 |
146.3 |
206.8 |
||||||
|
Q2'2023 Total |
185.0 |
300.3 |
313.7 |
||||||
|
Q3'2023 Average |
3.5 |
16.3% |
29.3 |
29.3 |
41.4 |
17.2% |
138.7% |
74.3% |
|
|
Q2'2023 Average |
5.5 |
13.9% |
65.7 |
100.1 |
104.5 |
14.5% |
159.2% |
87.3% |
|
Secondary Bond Market Activity:
- Bond Turnover:
The secondary bond market recorded increased activity, with the turnover increasing by 7.6% to Kshs 210.5 bn from Kshs 195.7 bn in Q3’2022, pointing towards increased activities by commercial banks in the secondary bond market. The chart below shows the bond turnover over the past 12 months;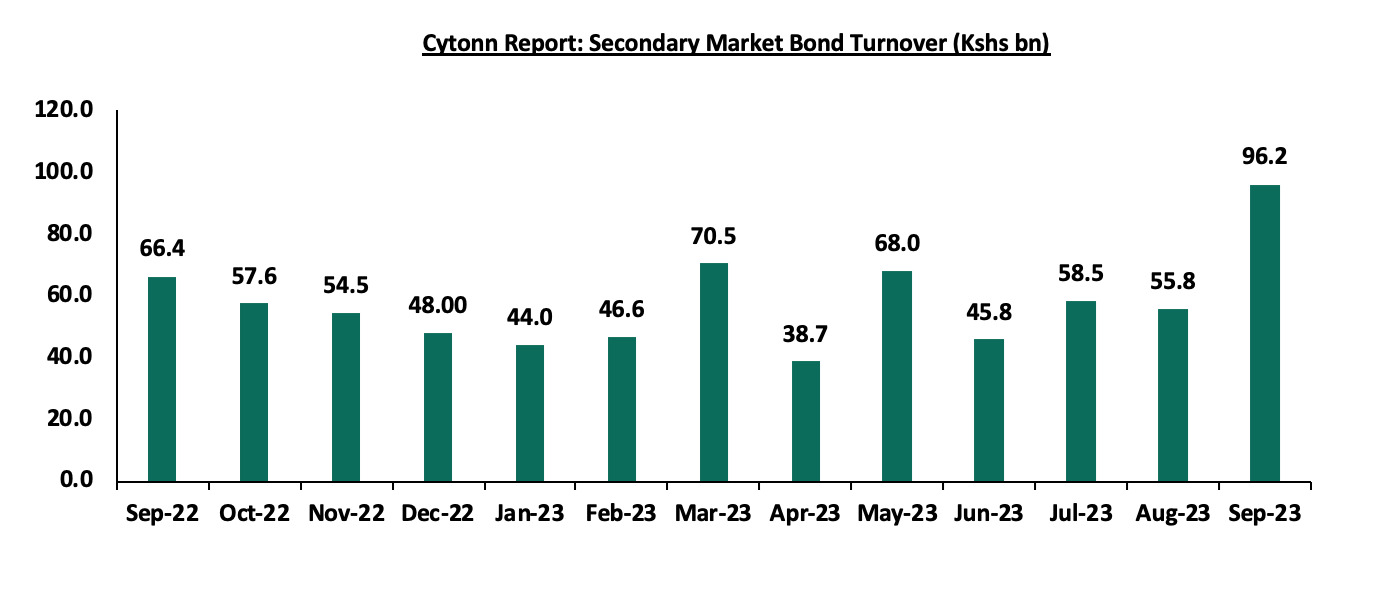
- Yield Curve:
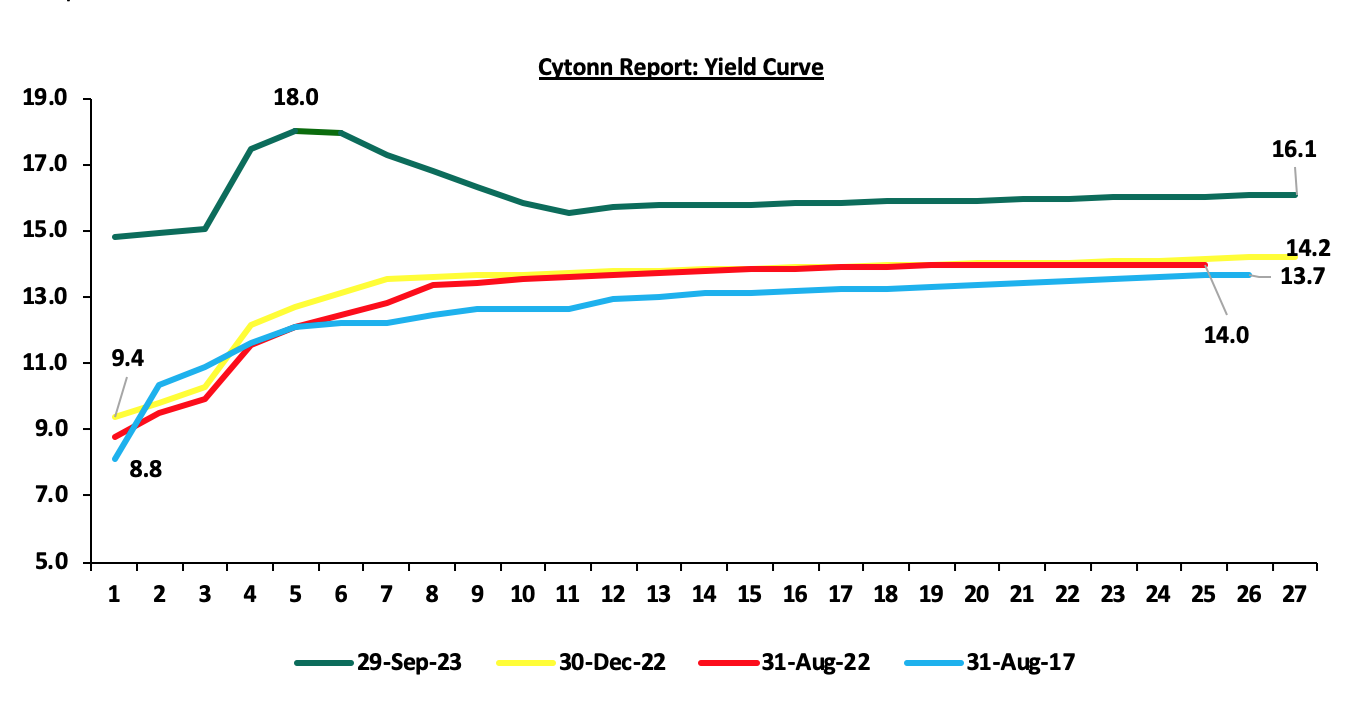
During Q3’2023, the yields on government securities were on an upward trajectory as a result of the elevated inflationary pressures, leading to investors attaching higher risk premiums. Additionally, Short-term rates have climbed mainly on the back of rising interest rates. The chart below shows the yield curve movement during the period:
Money Market Performance
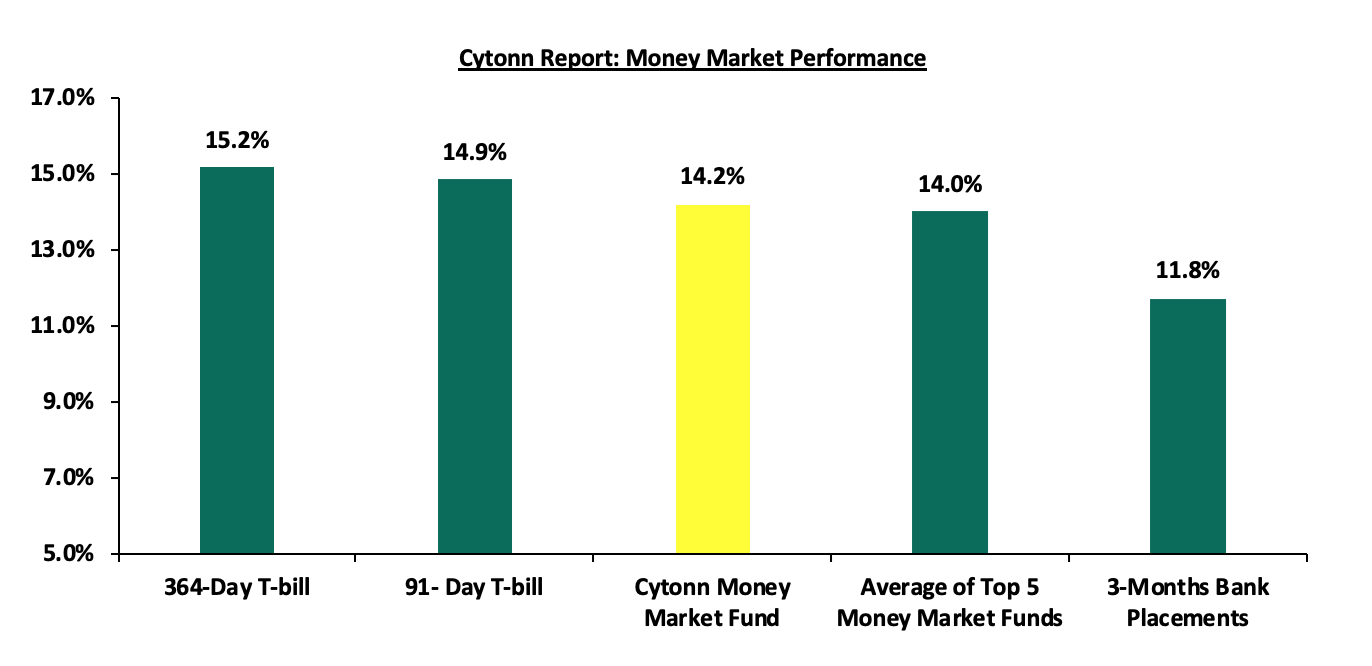
The 3-month bank placements recorded 11.8% at the end of Q3’2023, 2.0% points higher than the 9.8% recorded at the end of Q2’2023 (based on what we have been offered by various banks). The average 91-day T-bill rate increased by 4.7% points to 13.3% in Q3’2023 from 8.6% in Q3’2022, and the average Top 5 Money Market Funds increased by 3.7% points to 13.6%, from 9.9% in Q3’2022. The yield on the Cytonn Money Market (CMMF) increased by 3.3% points to 13.9% in Q3’2023, from 10.6% recorded at the end of Q3’2022.
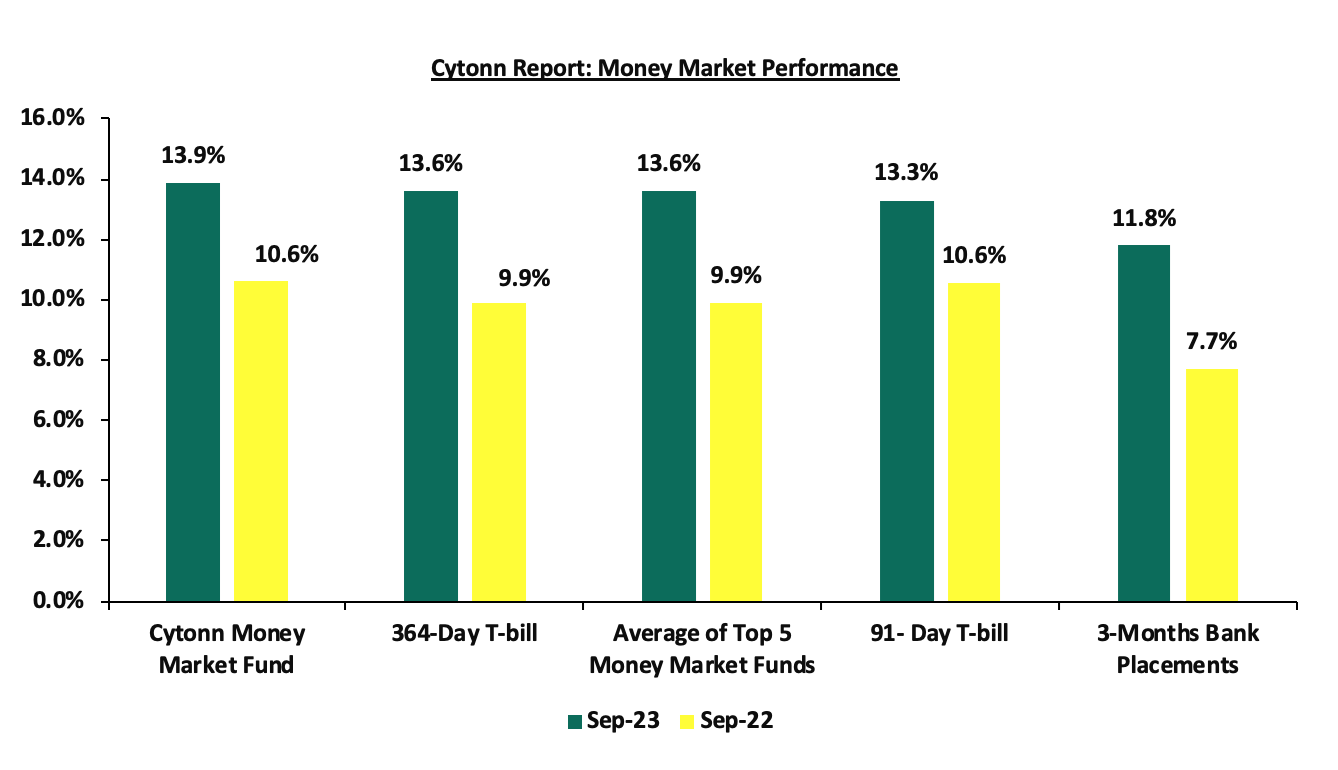
During the week, 3-month bank placements ended the week at 11.8% (based on what we have been offered by various banks), and the yields on the 364-day and 91-day T-bill increased by 13.2 bps and 5.3 bps to 15.2% and 14.9%, respectively. The yields of the Cytonn Money Market Fund increased by 44.0 bps to 14.2% from 13.8% recorded the previous week, and the average yields on the Top 5 Money Market Funds increased by 42.6 bps to 14.0%, from 13.6%.
The table below shows the Money Market Fund Yields for Kenyan Fund Managers as published on 6th October 2023:
|
Cytonn Report: Money Market Fund Yield for Fund Managers as published on 6th October 2023 |
||
|
Rank |
Fund Manager |
Effective Annual Rate |
|
1 |
GenAfrica Money Market Fund |
14.4% |
|
2 |
Etica Money Market Fund |
14.4% |
|
3 |
Cytonn Money Market Fund |
14.2% |
|
4 |
Enwealth Money Market Fund |
13.9% |
|
5 |
Lofty-Corban Money Market Fund |
13.3% |
|
6 |
Jubilee Money Market Fund |
13.1% |
|
7 |
Nabo Africa Money Market Fund |
13.1% |
|
8 |
Madison Money Market Fund |
13.0% |
|
9 |
Co-op Money Market Fund |
12.9% |
|
10 |
Absa Shilling Money Market Fund |
12.7% |
|
11 |
Kuza Money Market fund |
12.7% |
|
12 |
AA Kenya Shillings Fund |
12.5% |
|
13 |
GenCap Hela Imara Money Market Fund |
12.3% |
|
14 |
Sanlam Money Market Fund |
12.3% |
|
15 |
Apollo Money Market Fund |
12.2% |
|
16 |
Old Mutual Money Market Fund |
12.2% |
|
17 |
KCB Money Market Fund |
11.5% |
|
18 |
Equity Money Market Fund |
11.5% |
|
19 |
ICEA Lion Money Market Fund |
11.5% |
|
20 |
Dry Associates Money Market Fund |
11.3% |
|
21 |
Orient Kasha Money Market Fund |
11.1% |
|
22 |
CIC Money Market Fund |
11.0% |
|
23 |
Mali Money Market Fund |
10.3% |
|
24 |
British-American Money Market Fund |
9.5% |
Source: Business Daily
Liquidity:
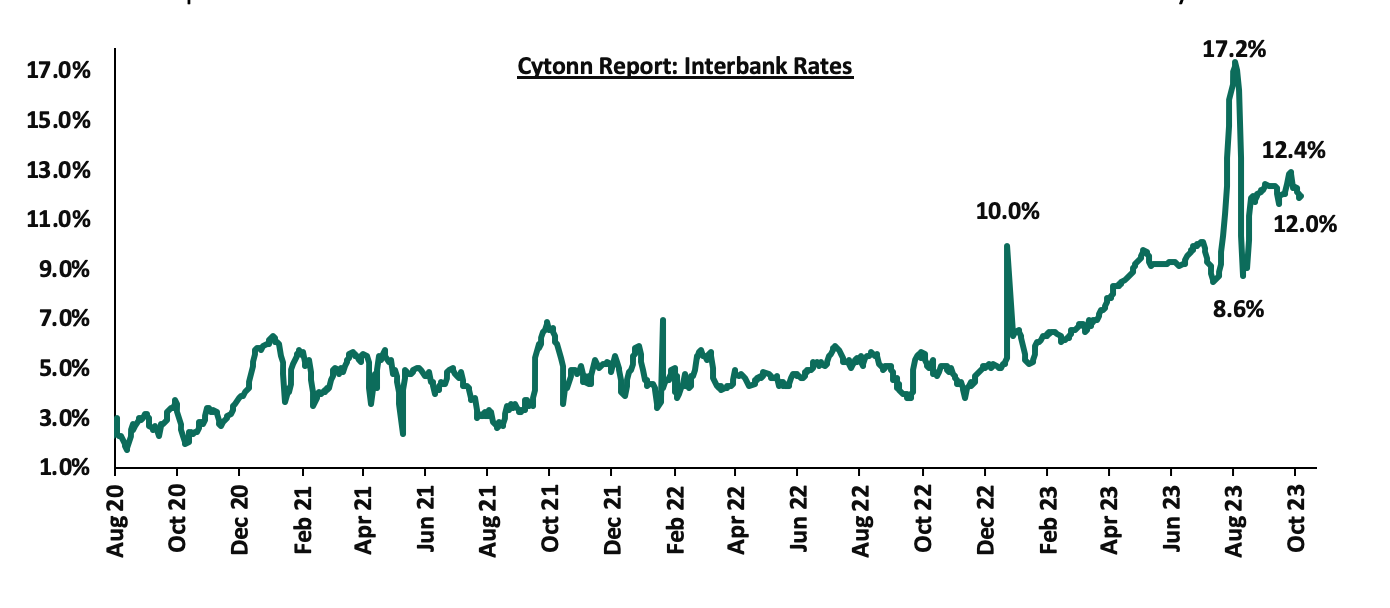
In Q3’2023, liquidity in the money markets tightened, as evidenced by the increase in the average interbank rate to 11.9%, from 9.2% in Q2’2023, partly attributable to tax remittances that offset government payments. Additionally, the average volumes traded in the interbank market increased by 6.8% to Kshs 22.6 bn, from Kshs 21.1 bn recorded in Q2’2023.
Similarly, during the week, liquidity in the money markets eased, with the average interbank rate decreasing to 12.1% from 12.7% recorded the previous week, partly attributable to government payments that offset tax remittances. The average interbank volumes traded increased by 15.3% to Kshs 26.6 bn from Kshs 23.1 bn recorded the previous week. The chart below shows the interbank rates in the market over the years:
Kenya Eurobonds:
In Q3’2023, the yields on Eurobonds were on an upward trajectory, with the 10-Year Eurobond issued in 2014 being the largest gainer, increasing by 5.8% points to 18.3% from 12.5% recorded at the end of Q2’2023. On a year to date basis, the yields on all Eurobonds were on an upward trajectory, with the yield of the 10-year Eurobond issued in 2014 increasing the most by 6.4% points to 19.3% from 12.9% recorded at the start of the year.
Similarly, during the week, the yields on Eurobonds were on an upward trajectory, with the yield on the 7-Year Eurobond issued in 2019 increasing the most by 0.9% points to 15.4% from 14.6% recorded the previous week. The table below shows the summary of the performance of the Kenyan Eurobonds as of 29 June 2023;
|
Cytonn Report: Kenya Eurobond Performance |
||||||
|
|
2014 |
2018 |
2019 |
2021 |
||
|
Date |
10-year issue |
10-year issue |
30-year issue |
7-year issue |
12-year issue |
12-year issue |
|
Amount Issued (USD) |
2.0 bn |
1.0 bn |
1.0 bn |
0.9 bn |
1.2 bn |
1.0 bn |
|
Years to Maturity |
0.8 |
4.5 |
24.5 |
3.7 |
8.7 |
10.8 |
|
Yields at Issue |
6.6% |
7.3% |
8.3% |
7.0% |
7.9% |
6.2% |
|
30-Jun-23 |
12.5% |
11.0% |
11.1% |
11.3% |
11.1% |
10.3% |
|
2-Jan-23 |
12.9% |
10.5% |
10.9% |
10.9% |
10.8% |
9.9% |
|
28-Sep-23 |
18.7% |
13.5% |
12.6% |
14.6% |
12.9% |
12.5% |
|
29-Sep-23 |
18.3% |
13.3% |
12.5% |
14.3% |
12.7% |
12.3% |
|
2-Oct-23 |
19.0% |
13.5% |
12.6% |
14.6% |
12.9% |
12.5% |
|
3-Oct-23 |
20.3% |
14.2% |
13.0% |
15.5% |
13.5% |
13.0% |
|
4-Oct-23 |
19.9% |
14.5% |
13.1% |
15.6% |
13.7% |
13.1% |
|
5-Oct-23 |
19.3% |
14.3% |
13.0% |
15.4% |
13.5% |
13.0% |
|
Weekly Change |
0.6% |
0.8% |
0.4% |
0.9% |
0.7% |
0.5% |
|
q/q Change |
5.8% |
2.2% |
1.4% |
3.0% |
1.6% |
2.0% |
|
YTD Change |
6.4% |
3.8% |
2.1% |
4.5% |
2.8% |
3.1% |
Source: Central Bank of Kenya (CBK)
Weekly Highlights:
- Q2’2023 Quarterly Gross Domestic Product Release
During the week, the Kenya National Bureau of Statistics (KNBS) released the Q2'2023 Quarterly Gross Domestic Product Report, highlighting that the Kenyan economy recorded a 5.4% growth in Q2’2023, marginally faster than the 5.2% growth recorded in Q2’2022. The main contributor to Kenyan GDP remains to be the Agriculture, fishing and forestry sector which grew by 7.7% in Q2’2023 compared to a contraction of 2.4% in Q2’2022. All sectors in Q2’2023 recorded positive growths, with varying magnitudes across activities. However, most sectors recorded subdued growth compared to Q2’2022 with Accommodation and Food Services, Mining and Quarrying, and Professional Administration sectors recording the highest growth declines of 31.8% points, 11.3% points, and 5.4% points, respectively. However, the expansion recorded in other sectors like Agriculture, led to the overall expansion in GDP. Other sectors that recorded expansion in growth rate, from what was recorded in Q2’2022 were Real Estate, Health, Education, and Wholesale and Retail Trade sectors, of 0.8%, 0.6%, 0.1% and 0.1% points, respectively,
The key take-outs from the report include;
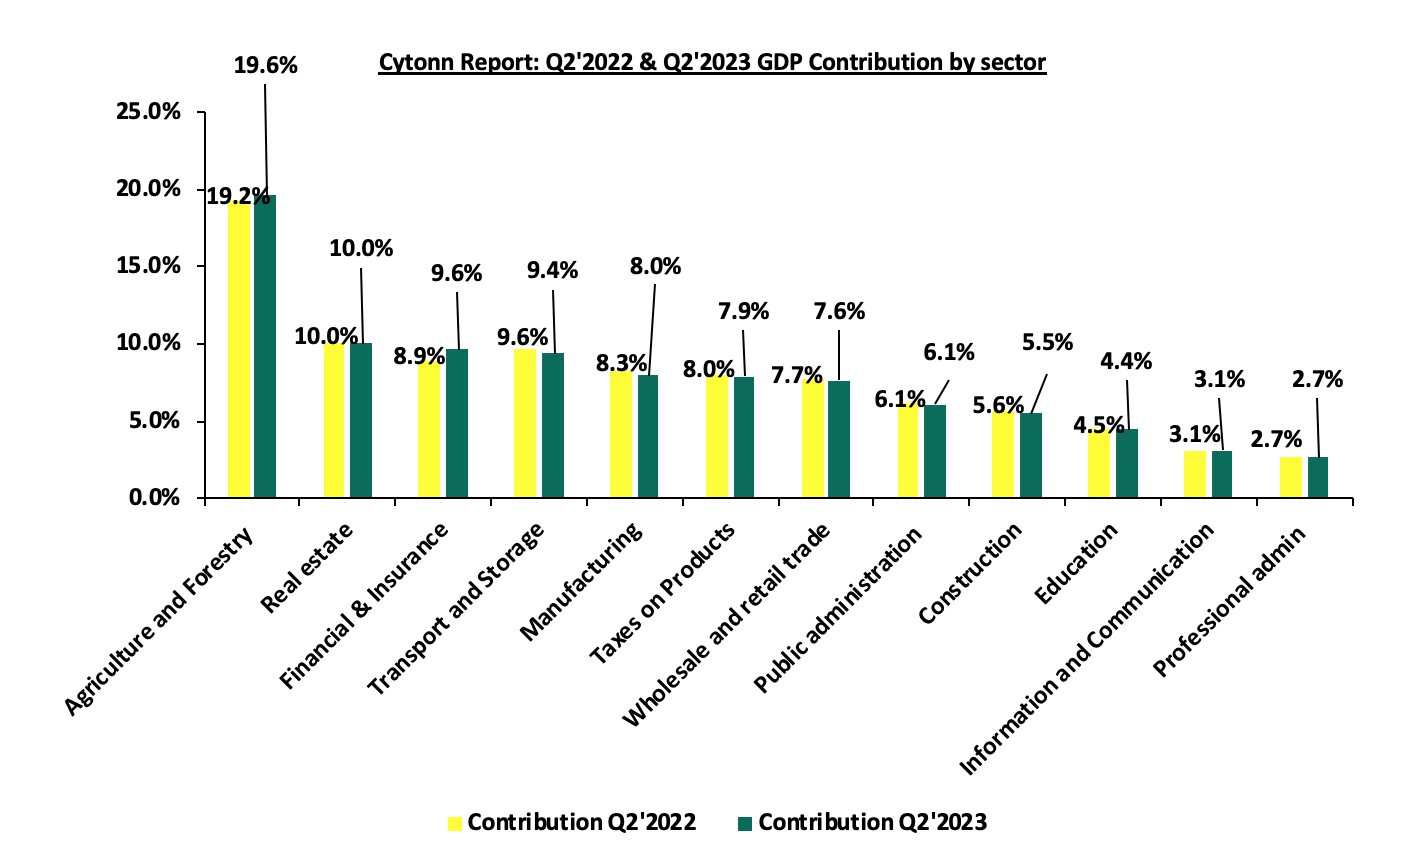
- Sectoral Contribution to Growth - The biggest gainer in terms of sectoral contribution to GDP was the financial and Insurance sector, increasing by 0.7% points to 9.6% in Q2’2023 from 8.9% in Q2’2022, while the Manufacturing sector was the biggest loser, declining by 0.3% points to 8.0% in Q2’2023, from 8.3% in Q2’2022. Real Estate was the second largest contributor to GDP at 10.0% in Q2’2023, remaining relatively unchanged from Q2’2022, indicating sustained growth. The Financial and Insurance sector recorded the highest growth rate in Q2’2023 growing by 13.5%, albeit slower than the 16.1% growth recorded in Q2’2022. The chart below shows the top contributors to GDP by sector in Q2’2023:
- Rebound in the Agricultural Sector– Agriculture, Forestry and Fishing activities recorded a growth of 7.7% compared to a contraction of 2.4% points in Q2’2022. The performance was an increase of 1.9% points, from the growth of 5.8% recorded in Q1’2023. The positive growth recorded during the quarter was mainly attributable to sufficient rainfall experienced in the quarter under review resulting to increased agricultural production. Notably, during the quarter, production of key food crops and cash crops increased with a significant increase in the production of tea, coffee, milk, vegetables and fruit during the quarter under review,
- Slower growth in the manufacturing sector - The manufacturing sector recorded a slower growth of 1.5% in Q2’2023 compared to a 3.6% growth in a similar period of review in 2022. Similarly, the sectoral contribution to GDP decreased by 0.3% points, to 8.0% in Q2’2023 from 8.3% in Q2’2022,
- Significant growth in the Financial and Insurance sector growth: Financial and Insurance sector recorded the highest growth rate among all the sectors in Q2’2023, having expanded by 13.5%, albeit lower than the 16.1% recorded in Q2’2022. Additionally, the contribution to GDP increased by 0.7% points, to 9.6% in Q2’2023, compared to 8.9% recorded in Q2’2022,
- Sustained resilience in the Accommodation and Food services sector: The sector recorded 12.2% growth in Q2’2023, albeit lower than the 44.0% growth recorded in Q2’2022. This comes after the sector recorded significantly subdued performance in 2020 and part of 2021 as a consequence of the COVID-19 pandemic. The activity in the sector remained resilient during the quarter, with the number of visitor arrivals through Jomo Kenyatta International Airport and Moi International Airport increasing by 13.3% to 317,196 in Q2’2023 up from 279,981 recorded in Q2’2022. Additionally, the sectoral contribution to GDP increased by 0.1% points, to 1.0% in Q2’2023 from 0.9% recorded in Q2’2022. The chart below shows the different sectoral GDP growth rates for Q2’202
Source: KNBS Q2’2023 GDP Report
In the near-term, we expect the economy to grow at a slower pace given the subdued general business environment in the country, mainly as a result of elevated inflationary pressures occasioned by high fuel and food prices. Additionally, the Central Bank of Kenya’s Monetary Policy Committee’s (MPC) decision on 3rd October 2023 to maintain the Central Bank Rate (CBR) at 10.5% in a bid to curb inflation and maintain price stability is expected to curtail economic growth. The high CBR is set to maintain the cost of credit issued by lenders high, hence discouraging borrowing, which will in turn lead to reduced investment spending in the economy by both individuals and businesses. Additionally, the inflation in the country remains high, although within the Central Bank’s range, and risks going high in the short term with the fuel prices recently spiking up. Thus, the consumer purchasing power remains low, resulting in reduced demand for goods and services and consequentially slowed economic growth. However, we expect the agricultural sector to continue backing economic growth in the country, as the country expects sufficient rain in the year. The sector remains Kenya’s largest contributor to GDP, as well as food prices being a major contributor to headline inflation.
- Monetary Policy Committee (MPC) October Meeting
The monetary policy committee met on October 3, 2023 to review the outcome of its previous policy decisions amidst a backdrop of continued global uncertainties, high inflationary pressures, a weak global growth outlook as well as measures taken by other economies around the world in response to these developments. The MPC retained the CBR rate at 10.50%, which was in line with our expectations of the MPC to maintain the CBR rate at the current rate of 10.50%. Below are some of the key highlights from the meeting:
- The overall inflation marginally tightened to 6.8% in September 2023, from 6.7% in August driven by increased food and non-food non-fuel (NFNF) inflation. The food inflation increased to 7.9% in September 2023 from 7.5% in August 2023, attributable to increased prices of vegetables such as onions, cabbages and spinach. The increase was weighed down by decrease in prices of key non-vegetable food items like maize and wheat flour, attributable to improved harvests and governments measures to zero-rate key food imports. Fuel inflation remained elevated at 13.1% in September from 14.5% in July 2023, largely attributable to increased international prices on fuel. We expect the overall inflation to tighten further in short-term, due to the increased fuel and food prices,
- Goods exports have remained resilient, growing by 0.5% in the 12 months to August 2023 compared to 11.0% in a similar period in 2022. Receipts from tea and manufactured exports increased by 4.5% and 23.2%, respectively, attributable to increased demand from traditional markets. Additionally, Imports declined by 11.9% in the 12 months to August 2023 compared to a growth of 16.0% in a similar period in 2022, partly attributable to drop of imports of infrastructure related equipment. Remittances totaled USD 4,120.0 mn in the 12 months to August 2023, 3.2% higher than USD 3,992.2 mn recorded in the same period in 2022. The current account deficit is estimated at 3.7% of the GDP in the 12 months to August 2023 and is projected to improve to 4.1% of GDP in 2023 from the 5.1% of GDP in 2022,
- The CBK foreign exchange reserves, which currently stand at USD 6,901.0 mn representing a 3.7 months of import cover, continues to provide adequate cover and a buffer against any short-term shocks in the foreign exchange market,
- The banking sector remains stable and resilient, with strong liquidity and capital adequacy ratios. The ratio of gross non-performing loans (NPLs) to gross loans stood at 15.0% in August 2023 compared to 14.2% in August 2022. Increases in NPLs were noted in the manufacturing, mining and quarrying, real estate, and building and construction sectors. However, banks have continued to make adequate provisions for the NPLs,
- Growth in private sector credit increased to 12.6% in August 2023 from 10.3% in July 2023, attributed to strong credit growth in sectors such as; transport and communication, manufacturing, consumer durables and trade, of 24.9%, 19.6%, 12.7% and 9.4%, respectively. Additionally, the number of loan applications and approvals remained strong, reflecting resilience in economic activities. The chart below shows the movement of the private sector credit growth of the last five years:
- The Committee assessed the progress in the implementation of the new monetary policy framework, which is based on an interest rate corridor of ±250 basis points around the Central Bank Rate (CBR). The MPC noted that interbank market activity has increased while volatility in interbank interest rates had reduced. Additionally, spreads in the interbank interest rates have narrowed with improved liquidity distribution,
The committee noted that the impact of its move to tighten the monetary policy in June 2023 to anchor inflationary expectations was still transmitting in the economy and therefore it concluded that the current stance on monetary policy was appropriate and decided to retain the central Bank Rate at 10.50%. Additionally, the committee noted that inflation was already within the target range and was expected to remain within the target range as food inflation is expected to come down, on expected improved supply. Additionally, the committee assessed that the Non-food Non-fuel (NFNF) was expected to decline, indicative of easing underlying inflationary pressures. The Committee will closely monitor the impact of the policy measures, as well as developments in the global and domestic economy, and stands ready to take further action as necessary. The Committee will meet again in December 2023.
- Stanbic Bank’s September 2023 Purchasing Manager’s Index (PMI)
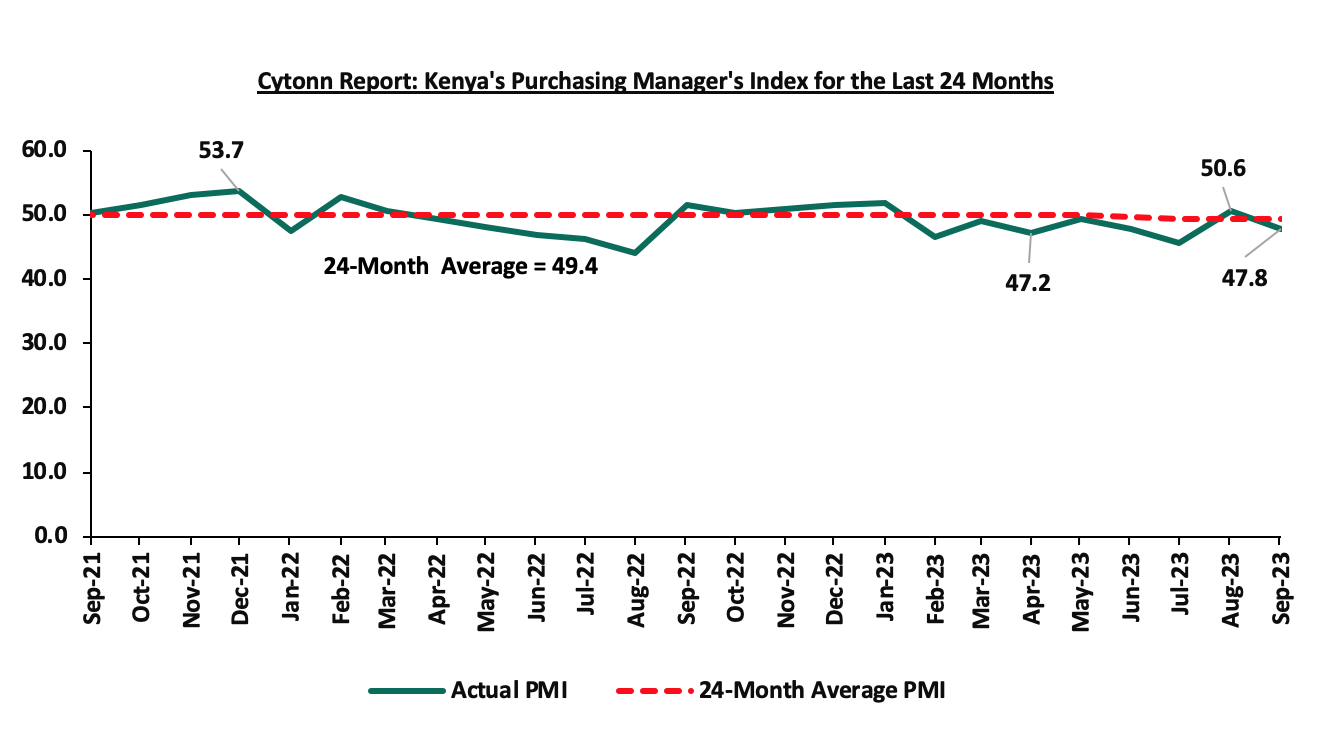
During the week, Stanbic Bank released its monthy Purchasing Manager's Index (PMI), highlighting that the index for the month of September 2023 slid back into the negatives, coming in at 47.8, down from 50.6 in August 2023, signaling a stronger downturn of the business environment at the end of Q3’2023. On a year to year basis, the index recorded a 7.5% deterioration from the 51.7 recorded in September 2022. The strong downturn of the general business environment is mainly attributable to the elevated inflationary pressure experienced in the country, albeit within the Central Bank of Kenya (CBK) target range of 2.5%–7.5% with the inflation rate in September 2023 slightly tightening to 6.8%, from 6.7% recorded in August 2023, coupled with the rising fuel prices, mostly resulting from the aggressive depreciation of the Kenyan shilling. Additionally, the elevated fuel prices, having increased by an average of Kshs 23.8 per litre in September, dampened sales, as prices spiked up. Notably, input costs remained historically elevated, on the back of deterioration of the Shilling against the dollar, which led to price pressures.
As such, the manufacturing output declined during the month, with the services, wholesale and retail sectors registering significant declines in activity attributable to the rapid price increases, leading to reduced customer demand. However, the declines were mitigated by the agricultural sector which recorded an increase in output and new orders in September.
Notably, exports rose for the seventh consecutive month, attributable to the weak shilling, which made Kenyan exports more affordable in the global market, even as firms quoted change of focus to the foreign markets, as domestic demand dipped. However, the pace of growth slowed down compared to August. Key to note, a PMI reading of above 50.0 indicates an improvement in the business conditions, while readings below 50.0 indicate a deterioration. The chart below summarizes the evolution of PMI over the last 24 months:
Going forward, we project that the business environment will be restrained in the short to medium term on the back of higher food and fuel prices, as well as the sustained depreciation of the Kenyan shilling, which continues to raise the cost of production and importation, consequently raising the inflation rate. Further, the increased taxation, with likelihood of more upward tax revisions is set to continue restraining the business environment in the country. As a result, the volume of new businesses is expected to remain stifled as consumers cut back on spending owing to a lack of purchasing power. Notably, the general improvement in business conditions is largely dependent on the stability of the Kenya shilling, given that the country's high cost of production is mostly attributable to the high import cost of goods owing to the poor performance of the shilling.
Q3’2023 Highlights:
- The Kenya National Bureau of Statistics (KNBS) released the year-on-year inflation highlighting that the inflation rate in the month of September 2023 increased marginally to 6.8%, from the 6.7% inflation rate recorded in the month of August 2023. Please read our Cytonn Weekly #39/2023,
- The Energy and Petroleum Regulatory Authority (EPRA) released their monthly statement on the maximum retail fuel prices in Kenya, effective 15 September 2023 to 14 October 2023. Notably, fuel prices for super petrol, Diesel and Kerosene increased Please read our Cytonn Weekly #37/2023,
- National Treasury gazetted the revenue and net expenditures for the second month of FY’2023/2024, ending 31st August 2023 highlighting that total revenue collected as at the end of August 2023 amounted to Kshs 323.4 bn, equivalent to 12.6% of the original estimates of Kshs 2,571.2 bn for FY’2023/2024 and is 75.5% of the prorated estimates of Kshs 428.5 bn. Please read our Cytonn Weekly #37/2023,
- Stanbic Bank released its monthly Purchasing Manager’s Index (PMI), highlighting that the index for the month of August 2023 came in at 50.6, up from 45.5 in July 2023, signalling an expansion in business conditions for the first time since January. The expansion was attributable to the greater political stability, improved food supply and increased marketing of products. Please read our Cytonn Weekly #36/2023,
- The Kenya National Bureau of Statistics (KNBS) released the year-on-year inflation highlighting that the inflation rate in the month of July 2023 eased to 7.3%, from the 7.9% inflation rate recorded in the month of June 2023, marking the first time in 14 months that the inflation has fallen within the CBK target range of 2.5%-7.5%. Please read our Cytonn Monthly – July 2023,
- Stanbic Bank released its monthly Purchasing Manager's Index (PMI), highlighting that the index for the month of July 2023 came in at 45.5, down from 47.8 in June 2023, signalling a stronger downturn of the business environment at the start of Q3’2023. The strong downturn is mainly attributable to the high cost of living amid rising fuel prices and the sustained depreciation of the Kenya shilling. Please read our Cytonn Monthly – July 2023,
- The monetary policy committee met on August 9, 2023 to review the outcome of its previous policy decisions amidst a backdrop of continued global uncertainties, high inflationary pressures, a weak global growth outlook as well as measures taken by other economies around the world in response to these developments. The MPC retained the CBR rate at 10.50%, which was in line with our expectations of the MPC to maintain the CBR rate at the current rate. Please see our Cytonn Weekly #32/2023,
- The National Treasury gazetted the revenue and net expenditures for the first month of FY’2022/2023, ending 31st July 2022, indicating that the total revenue collected as at the end of July 2023 amounted to Kshs 159.6 bn, equivalent to 6.2% of the original estimates of Kshs 2,571.2 bn for FY’2023/2024 and is 74.5% of the prorated estimates of Kshs 214.3 bn. Please see our Cytonn Weekly #33/2023,
- The Energy and Petroleum Regulatory Authority (EPRA) released their monthly statement on the maximum retail fuel prices in Kenya effective 15 August 2023 to 14 September 2023. Notably, fuel prices remained unchanged at Kshs 194.7 per litre for Super Petrol, Kshs 179.7 per litre for Diesel and Kshs 169.5 per litre for Kerosene respectively. Please see our Cytonn Weekly #33/2023,
- The Kenya National Bureau of Statistics (KNBS) recently released the Q1'2023 Quarterly Gross Domestic Product (GDP) Report, highlighting that the Kenyan economy recorded a 5.3% growth in Q1’2023, albeit slower than the 6.2% growth recorded in Q1’2022. For more information, please see our Cytonn Weekly #27/2023,
- The Kenya National Bureau of Statistics released the Q1’2023 Quarterly Balance of Payment Report, highlighting that Kenya’s balance of payments position recorded a 6.0% deterioration, with the deficit widening to Kshs 127.8 bn in Q1’2023, from a deficit of Kshs 120.6 bn recorded in Q1’2022 and a significant deterioration from the Kshs 29.1 bn deficit recorded in Q4’2022. For more information, please see our Cytonn Weekly #27/2023,
- Stanbic Bank released its monthly Purchasing Manager’s Index (PMI), highlighting that the index for the month of June 2023 came in at 47.8, down from 49.4 in May 2023, signaling a stronger downturn of the business environment in the fifth month running in June 2023. For more information, please see our Cytonn Weekly #27/2023,
- United Nations Conference on Trade and Development (UNCTD) released the 2023 World Investment Report, highlighting that Kenya recorded an enormous growth in Foreign Direct Investment (FDI), having grown by 63.9% to USD 759.1 mn in 2022 from USD 463.0 mn in 2021 after a five-year dip leading to 2021. The significant increase is mainly attributable to a range of policy interventions to mobilize resources and investments within the renewable energy sector. For more information, please see our Cytonn Weekly #28/2023,
- The Energy and Petroleum Regulatory Authority (EPRA) released their monthly statement on the maximum retail fuel prices in Kenya, effective 15 July 2023 to 14 August 2023. Notably, prices for Super Petrol and Kerosene declined 0.4% and 2.3% to Kshs 194.7 and Kshs 169.5, respectively, from Kshs 195.5 and 173.4 per litre. However, the price of diesel remained unchanged at Kshs 179.7 per litre. For more information, please see our Cytonn Weekly #28/2023,
- Kenya Revenue Authority (KRA) released the annual revenue performance for FY’2022/2023 highlighting that the total revenue collection amounted to Kshs 2.2 tn against the target of Kshs 2.3 tn, translating to a target achievement of 95.3%. For more information, please see our Cytonn Weekly #28/2023,
- International Monetary Fund (IMF) announced that it had completed the fifth review of the 38-month Extended Fund Facility (EFF) and Extended Credit Facility (ECF) financing for Kenya allowing for an immediate disbursement of USD 415.4 mn (Kshs 58.9 bn), inclusive of USD 110.3 mn (Kshs 15.6 bn) from an augmentation of access. The board also approved Kenya’s request for a 20-month arrangement under the Resilience and Sustainability Facility (RSF), amounting to USD 551.4 mn (Kshs 78.1 bn) in a bid to build resilience against the impacts of climate change and attract additional private investment towards climate-related initiatives. For more information, please see our Cytonn Weekly #29/2023, and,
- Fitch Ratings, a global credit rating agency, revised the outlook on Kenya's Long-Term Foreign-Currency Issuer Default Rating (IDR) to negative from stable and affirmed the IDR at 'B', mainly due to external financing constraints amid high funding requirements, including a USD 2.0 bn Eurobond maturity in 2024, weakening forex reserves, rising financing costs, and uncertainty regarding the fiscal trajectory. For more information, please see our Cytonn Weekly #29/2023.
Rates in the Fixed Income market have been on an upward trend given the continued high demand for cash by the government and the occasional liquidity tightness in the money market. The government is 2.7% ahead of its prorated net domestic borrowing target of Kshs 68.1 bn, having a net borrowing position of Kshs 69.9 bn of the domestic net borrowing target of Kshs 313.6 bn for the FY’2023/2024. Therefore, we expect a continued upward readjustment of the yield curve in the short and medium term, with the government looking to bridge the fiscal deficit through the domestic market. Owing to this, our view is that investors should be biased towards short-term fixed-income securities to reduce duration risk.
Market Performance:
During Q3’2023, the equities market was on a downward trajectory, with NASI, NSE 20 and NSE 25 declining by 11.0%, 4.2% and 9.4%, respectively, while the newly introduced NSE 10 declined by 4.1% since inception. The equities market performance during the quarter was driven by losses recorded by large caps such as KCB Group, Safaricom, EABL and Equity Group of 28.8%, 16.6%, 15.5% and 7.1%, respectively. The losses were however mitigated by gains recorded by banking stocks such as Standard Chartered Bank-Kenya and ABSA of 2.8% and 1.3%, respectively.
Equities turnover increased by 13.6% during the quarter to USD 119.3 mn, from USD 105.0 mn in Q2’2023. Foreign investors remained net sellers during the quarter, with a net selling position of USD 25.9 mn, from a net selling position of USD 10.9 mn recorded in Q2’2023.
During the week, the equities market was on a downward trajectory, with NASI declining the most by 1.8%, while NSE 20, NSE 25 and NSE 10 declined by 1.2%, 0.8% and 1.1% respectively, taking the YTD performance to losses of 26.6%, 11.0%, and 21.8% for NASI, NSE 20, and NSE 25, respectively. The equities market performance was mainly driven by losses recorded by large-cap stocks such as Bamburi, EABL and Safaricom of 6.9%, 5.3% and 4.1% respectively. The losses were however mitigated by gains recorded by stocks such as, NCBA Group, Equity Group and Diamond Trust Bank-Kenya of 3.3%, 2.8% and 1.5% respectively.
During the week, equities turnover increased by 117.0% to USD 7.5 mn from USD 3.5 mn recorded the previous week, taking the YTD total turnover to USD 580.2 mn. Foreign investors transitioned to net buyers for the first time in six weeks with a net buying position of USD 0.3 mn, from a net selling position of USD 0.5 mn recorded the previous week, taking the YTD foreign net selling position to USD 281.8 mn.
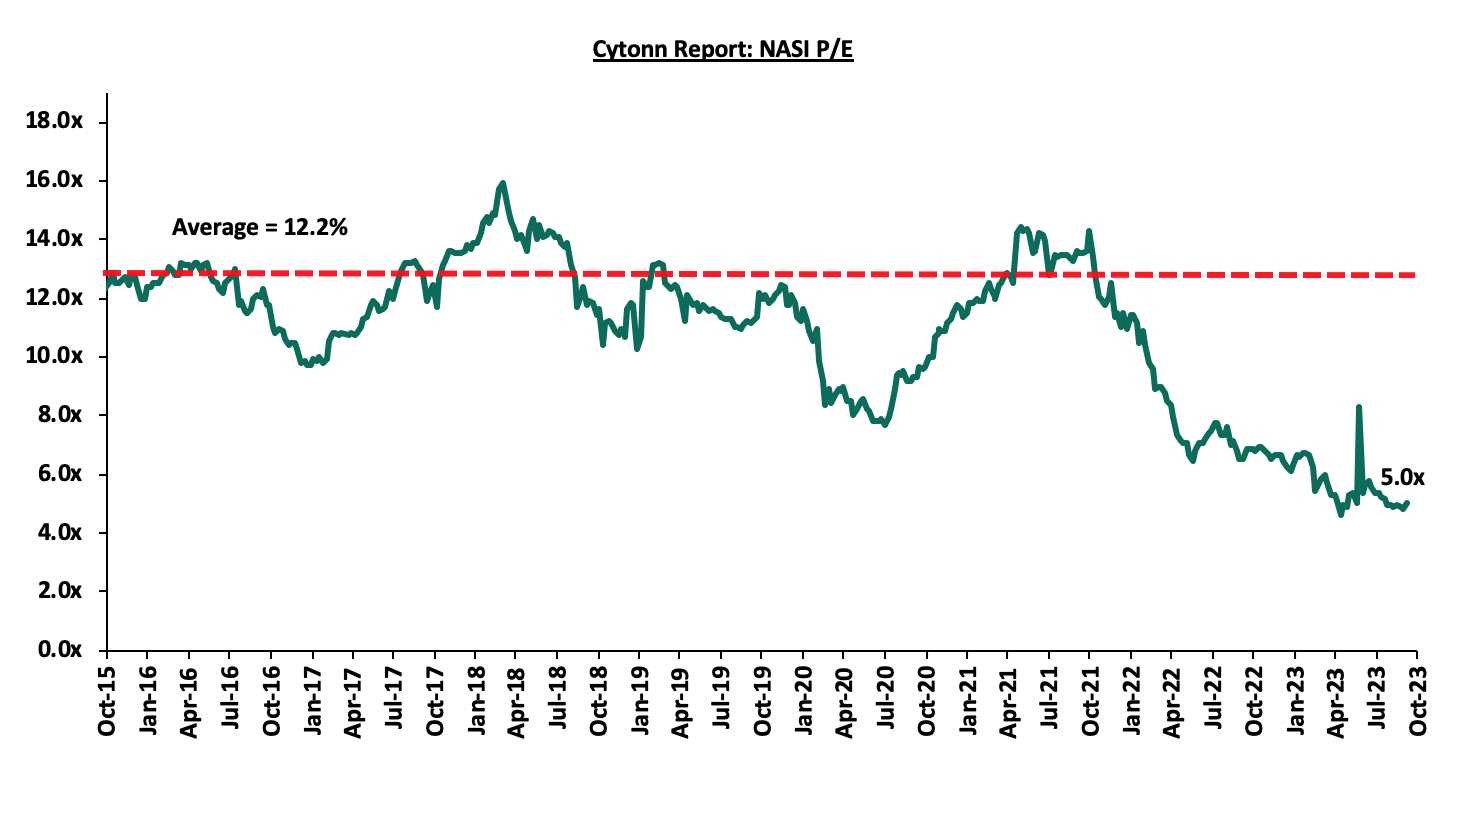
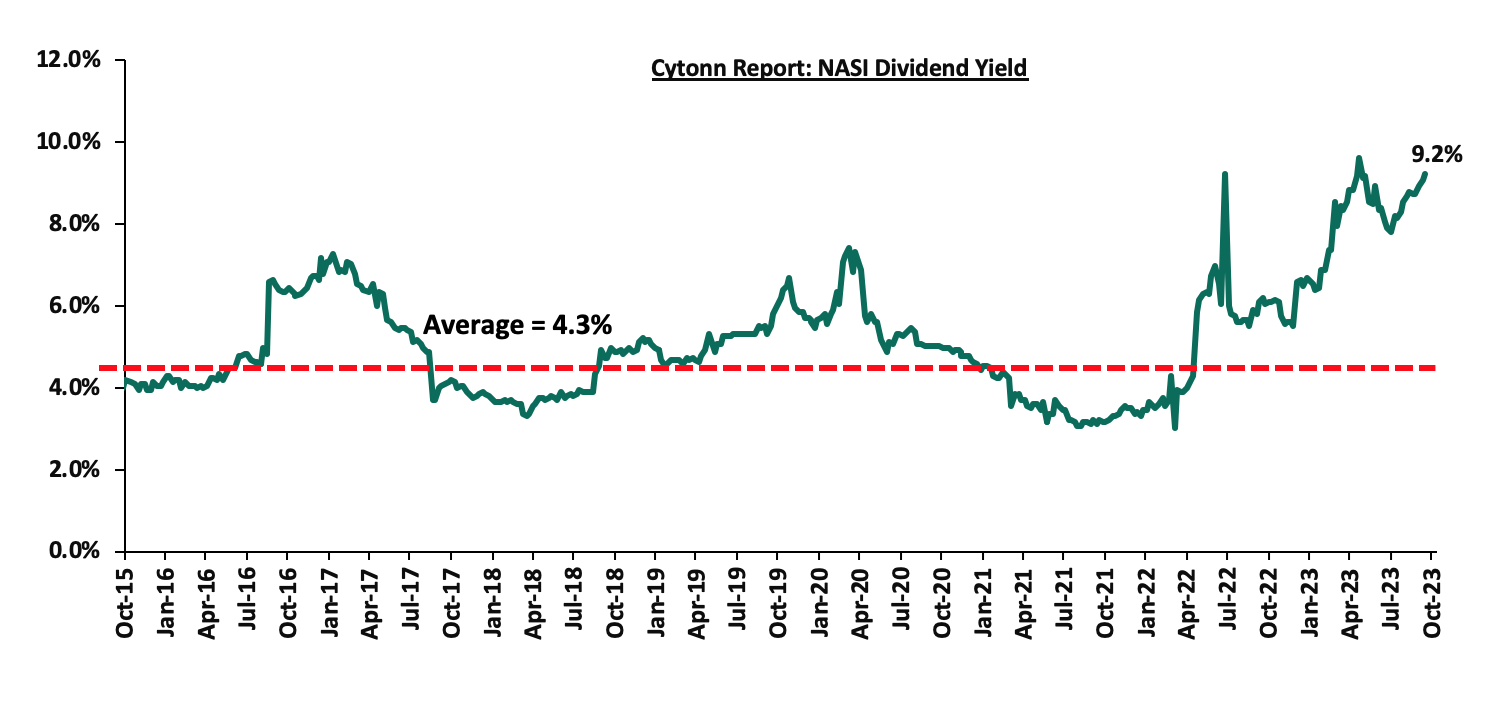
The market is currently trading at a price to earnings ratio (P/E) of 5.0x, 59.0% below the historical average of 12.2x. The dividend yield stands at 9.2%, 4.9% points above the historical average of 4.3%. Key to note, NASI’s PEG ratio currently stands at 0.6x, an indication that the market is undervalued relative to its future growth. A PEG ratio greater than 1.0x indicates the market is overvalued while a PEG ratio less than 1.0x indicates that the market is undervalued. The charts below indicate the historical P/E and dividend yields of the market.
The charts below indicate the historical P/E and dividend yields of the market;
Listed Banks’ H1’2023 Performance
During the third quarter of 2023, the listed banking sector released their H1’2023 results, recording y/y earnings growth of 13.4% in their core EPS in H1’2023, compared to a weighted average increase of 34.0% in H1’2022. The performance was largely attributable by the Strong EPS growth from HF Group, Stanbic Bank and ABSA Bank of 264.8%, 47.0% and 32.0%, respectively. For more information, please see our Kenya’s Listed Banks H1’2023.
Key Q3,2023 Highlights:
During Q3’2023;
- Cooperative Bank of Kenya disclosed that it had received a USD 100.0 mn (Kshs 13.8 bn) loan facility with a maturity of 7 years from the consortium of financial institutions led by DEG which is aimed at providing loans to Micro Small and Medium Enterprises ( MSMEs) operating in Kenya. For more information, please see our Cytonn Weekly #29/2023,
- Nairobi Securities Exchange (NSE) announced that it had launched two new market indices, NSE 10 share index (N20) and the NSE Bond Index (NSE-BI) to track the performance of equities market and bond market respectively, please see our Cytonn Weekly #36/2023, and,
- Safaricom announced that it had secured a Kshs 15.0 bn deal that is scalable to Kshs 20.0 bn by accordion. The multi-billion Sustainability Linked Loan (SLL) facility is expected to support Safaricom Environmental, Social, Governance agenda. The facility is the largest ESG-linked loan facility ever undertaken in East Africa and the first of its kind for Safaricom. Furthermore, it is the first Kenya Shilling-denominated SLL in the market. The facility will enable Safaricom to access funding based on the progressive achievement of milestones across key ESG areas, please see our Cytonn Weekly #36/2023.
Universe of Coverage:
|
Company |
Price as at 29/09/2023 |
Price as at 06/10/2023 |
w/w change |
YTD Change |
Target Price* |
Dividend Yield |
Upside/ Downside** |
P/TBv Multiple |
Recommendation |
|
KCB Group*** |
20.9 |
21.0 |
0.5% |
(45.4%) |
41.3 |
9.5% |
106.5% |
0.4x |
Buy |
|
Liberty Holdings |
3.6 |
3.6 |
0.0% |
(28.6%) |
5.9 |
0.0% |
64.4% |
0.3x |
Buy |
|
Kenya Reinsurance |
1.8 |
1.8 |
(0.6%) |
(5.9%) |
2.5 |
11.4% |
54.0% |
0.1x |
Buy |
|
Equity Group*** |
35.6 |
36.6 |
2.8% |
(18.9%) |
51.2 |
10.9% |
50.9% |
0.8x |
Buy |
|
Jubilee Holdings |
185.8 |
188.0 |
1.2% |
(5.4%) |
260.7 |
6.4% |
45.0% |
0.3x |
Buy |
|
Co-op Bank*** |
11.8 |
11.6 |
(1.7%) |
(4.1%) |
15.0 |
12.9% |
41.8% |
0.5x |
Buy |
|
HF Group |
4.4 |
4.2 |
(3.2%) |
34.0% |
5.8 |
0.0% |
37.7% |
0.2x |
Buy |
|
NCBA*** |
37.9 |
39.1 |
3.3% |
0.4% |
48.9 |
10.9% |
35.8% |
0.8x |
Buy |
|
ABSA Bank*** |
12.0 |
11.9 |
(0.4%) |
(2.5%) |
14.7 |
11.3% |
34.6% |
1.0x |
Buy |
|
Sanlam |
6.5 |
7.7 |
17.7% |
(19.6%) |
10.3 |
0.0% |
33.6% |
2.2x |
Buy |
|
Standard Chartered*** |
165.0 |
160.3 |
(2.9%) |
10.5% |
183.9 |
13.7% |
28.5% |
1.1x |
Buy |
|
Britam |
5.0 |
4.7 |
(6.0%) |
(9.8%) |
6.0 |
0.0% |
27.3% |
0.6x |
Buy |
|
CIC Group |
2.1 |
2.1 |
(3.3%) |
8.4% |
2.5 |
6.3% |
27.1% |
0.7x |
Buy |
|
Stanbic Holdings |
115.3 |
115.0 |
(0.2%) |
12.7% |
127.9 |
11.0% |
22.1% |
0.8x |
Buy |
|
Diamond Trust Bank*** |
48.1 |
48.8 |
1.5% |
(2.1%) |
54.6 |
10.2% |
22.1% |
0.2x |
Buy |
|
I&M Group*** |
17.1 |
18.0 |
5.3% |
5.3% |
19.5 |
12.5% |
20.9% |
0.4x |
Buy |
Weekly Highlights
- Q2’2023 Economic Review (Banking Sector)
During the week, the Central Bank of Kenya (CBK) released the Quarterly Economic Review for the period ending 30 June 2023, highlighting that the banking sector remained stable and resilient during the period owing to the strong liquidity and capital adequacy. According to the report, the sector’s total assets increased by 4.1% to Kshs 7.1 tn in June 2023, from Kshs 6.8 tn in March 2023. The increase was mainly attributable to a 3.3% increase in loans and advances to Kshs 4.0 tn, from Kshs 3.9 tn recorded in Q1’2023. On a yearly basis, total assets increased by 12.8% to Kshs 7.1 tn, from Kshs 6.2 tn in Q2’2022. Notably, loans and advances accounted for 51.8% of total assets in Q2’2023, which was a decrease from 52.1% of total assets in Q1’2023.
Other key take-outs from the report include:
- The banking sector recorded a 15.4% decrease in Profit before Tax (PBT) to Kshs 55.1 bn in Q2’2023, from Kshs 65.1 bn in Q1’2023. The decrease in profitability was mainly attributable to a faster 13.0% increase in quarterly expenses, which outpaced the 3.9% increase in quarterly income. On a yearly basis, PBT decreased by 12.0%, to Kshs 55.1 bn, from Kshs 62.6 bn recorded in Q2’2022,
- The sector’s Return on Asset (ROA) decreased slightly to 2.7% in Q2’2023, from 3.1% recorded in Q1’2023. Similarly, Return on Equity (ROE) recorded a 1.6% points decrease to 25.4% in Q2’2023, from 27.0% in Q1’2023, and 1.4% points decrease from 26.8% recorded in Q2’2022,
- Lending increased by 3.3% to Kshs 4.0 tn in Q2’2023, from Kshs 3.9 tn in Q1’2023, attributable to an increase in credit advanced to individual borrowers as well as for working capital purposes in sectors such as tourism, restaurant and hotels, trade, manufacturing, and transport and communication which increased by 7.1%, 6.6%, 6.1% and 5.2%, respectively. On a yearly basis, lending was up by 14.0% to Kshs 4.0 tn, from Kshs 3.5 tn in Q2’2022,
- Deposits recorded a 6.9% increase to Kshs 5.2 tn in Q2’2023, from Kshs 4.8 tn in Q1’2023, attributable to a 10.1% increase in foreign currency deposits which increased to Kshs 1.5 tn in Q2’2023, from Kshs 1.3 tn recorded in Q1’2023. Notably, on a yearly basis, deposits increased by 11.8% to Kshs 5.2 tn in Q2’2023, from Kshs 4.6 tn in Q2’2022. Key to note, customer deposits remain the main source of funding for banks, accounting for 73.2% of the sector’s total liabilities and shareholder’s funds as at Q2’2023, 1.9% points higher than the 71.3% recorded in Q1’2023 and a further 0.7% points decline from the 73.9% recorded in Q2’2022,
- Credit risk remained elevated in the sector with the gross NPLs to gross loans ratio increasing to 14.5% in Q2’2023, from 14.0% in Q1’2023. The increase in gross NPL ratio was driven by a faster 6.5% increase in gross Non-Performing Loans (NPLs) to kshs 576.1 bn in Q2’2023, from Kshs 540.8 bn in Q1’2023, which outpaced the 3.3% increase in gross loans in the period under review. Manufacturing, Energy and water, Real Estate, Financial Services, and Building and construction sectors registered increases in NPLs by Kshs 33.6 bn as a result of delayed repayments attributed to a challenging operating environment. Notably, Mining and Quarrying, registered major decrease in NPLs, mainly due to repayments. Key to note, the asset quality declined on a year on year basis to 14.5% in Q2’2023, from 14.7% recorded in Q2’2022,
- The sector’s NPL coverage ratio decreased to 38.1% in Q2’2023, from 40.4% in Q1’2023, attributable to a faster 6.5% increase in gross Non-Performing Loans, which outpaced the slower 0.7% increase in specific provisions to Kshs 183.8 bn, from Kshs 177.0 bn in Q1’2023. We expect increased provisioning levels owing the elevated credit risks brought by the tough operating environments,
- The banking sector remained adequately capitalized, despite the aggregate Core Capital to Total Risk weighted Assets ratio decreasing marginally by 0.1% points to 15.4% in Q2’2023, from 15.5% in Q1’2023, and 0.7% points lower than the 16.1% recorded in Q2’2022. The core capital to Total Risk-Weighted Assets ratio was 4.9% points above the CBK’s minimum statutory ratio of 10.5%. On the other hand, Total Capital to Total Risk-Weighted Asset ratio, increased by 0.2% points to 18.6% in Q2’2023, from 18.4% recorded in Q1’2023 and 0.2% points lower than 18.8% recorded in Q2’2022. The Q1’2023 Total Capital to Total Risk-Weighted Assets ratio was 4.1% points above the CBK’s minimum statutory ratio of 14.5%. Key to note, the decreases in the capital ratios were mainly due to a higher increase in Total Risk Weighted Asset by 3.9% as compared to the increases in core capital during the period under review, and,
- The sector remained sufficiently liquid during the period under review, despite the liquidity ratio decreasing to 49.7% in Q2’2023, from 49.9% in Q1’2023. Year on year, the ratio decreased by 2.8% points from 52.5% recorded in Q2’2022. This was 29.7% points above the minimum statutory level of 20.0%. The decrease in the banking sector’s liquidity is attributable to a faster 5.7% increase in short term liabilities, relative to a 5.2% increase in total liquid assets between the periods under review.
The decreased profitability in Q2’2023 evidenced by the 15.4% decrease in Pre-tax profits comes on the back of the deterioration of the business environment in Q2’2023 with the average Purchasing Managers Index (PMI) coming in at 48.1 as compared to an average of 48.2 in the similar period last year. However, the banking sector remains sufficiently capitalized and with adequate liquidity levels above the minimum statutory requirement, evidenced by the capital adequacy and liquidity ratios remaining above the minimum statutory ratios. Additionally, credit risk level remained elevated with Gross Non-Performing Loan ratio increasing in Q2’2023, attributable to increased cost of living exacerbated by inflationary pressures and continued depreciation of the Kenyan shilling. Going forward, we expect the sector’s profitability to be boosted by expected increase in interest income as a result of the continued adoption of risk-based pricing models.
We are “Neutral” on the Equities markets in the short term due to the current tough operating environment and huge foreign investor outflows, and, “Bullish” in the long term due to current cheap valuations and expected global and local economic recovery.
With the market currently being undervalued to its future growth (PEG Ratio at 0.6x), we believe that investors should reposition towards value stocks with strong earnings growth and that are trading at discounts to their intrinsic value. We expect the current high foreign investors sell-offs to continue weighing down the equities outlook in the short term.
During Q3’2023, the Real Estate sector in Kenya recorded substantial growth in terms of activity, as compared to the similar period in 2022, attributable to continued investments flowing into the sector. According to the Kenya National Bureau of Statistics (KNBS), the Real Estate sector recorded a growth rate of 5.8% in Q2’2023, 0.8% points higher than 5.0% growth rate recorded in the similar period during 2022. This improvement in performance was supported by various factors including;
- Resurgence of investor confidence in the sector, leading to increased development activities, evidenced by a 6.2% increase in the gross loans advanced to the Real Estate sector Kshs 495.0 bn in Q2’2023, from Kshs 466.0 bn in Q2’2022, according to the Central Bank of Kenya,
- A continued focus by both the government and the private sector to provide decent housing to Kenyans through the Affordable Housing Program (AHP). Currently, the AHP pipeline boasts an estimated total of 99,757 housing units under construction by the government and private sector,
- Implementation of various infrastructure projects, such as construction of the Kenol-Marua Highway, extension of the Standard Gauge Railway (SGR) to Kisumu and Isiolo, and development of the Dongo Kundu Special Economic Zone, which are set to open up new areas for investment, thereby boosting the performance of the Real Estate sector,
- Provision of sustainable housing finance through the Kenya Mortgage Refinance Company (KMRC) aimed at making home ownership more accessible to Kenyans. This is through offering sustainable financing to primary mortgage lenders (PMLs) such as banks and SACCOS,
- Growth of the retail sector has continued to grow, with local and international retailers such as Naivas, QuickMart and Carrefour pursuing aggressive expansion strategies in a bid to increase their dominance in the market, replacing distressed retailers such as Nakumatt, Tuskys, and Uchumi,
- Increased activity in the hospitality industry which has reinstated investor confidence, with the planned development of hotels, as the number of international arrivals into the country registered a 13.3% increase to 317,196 in Q2’2023, from the 279,981 recorded in Q2'2022, and,
- Attractive national demographics, with relatively high population and urbanization growth rates of 1.9% and 3.7%, which are above the global averages of 0.9% and 1.6% respectively, as at 2021, which continue to drive the demand for Real Estate developments.
However, several challenges continue to impede the performance of the sector, such as;
- Stringent lending requirements to developers, with financial institutions such as banks demanding more collateral due to perceived credit risks in the Real Estate sector on the back of a tough operating environment. This is evidenced by a 20.9% spike in gross Non-Performing Loans (NPLs) to the Real Estate sector by banks to Kshs 96.0 bn in Q2’2023, from Kshs 79.4 bn in Q2’2022. In addition, on a q/q basis, the banking sector NPLs recorded a 9.0% increase from Kshs 88.1 bn realized in Q1’2023,
- Increasing construction costs, averaging Kshs 41,600 per SQM in 2023, a 20.1% increase from Kshs 34,650 per SQM in 2022. The rise is primarily due to the hike in prices of key construction materials such as cement, steel, paint, aluminum, and PVC on the back of inflation. These higher costs are expected to impede development activities in the sector,
- An existing oversupply of physical space in select sectors, with approximately 5.8 mn SQFT in the NMA commercial office market, approximately 3.3 mn SQFT in the NMA retail market, with the rest of the Kenyan retail market having an oversupply of approximately 2.1 mn SQFT, leading to prolonged vacancy rates in the respective Real Estate sectoral themes, and,
- Subpar performance of the REITs market, owing to various challenges such as the large capital requirements of Kshs 100.0 mn for trustees which limits the role to banks, prolonged approval process for REITs, only a few entities capable of incorporating REITs, and high minimum investment amounts set at Kshs 5.0 mn which discourage investments and limited knowledge of the asset class by investors.
Despite these limitations, the Kenyan Real Estate sector has continued to witness increased activities over the years, resurging from the slowdown attributed to the pandemic slowdowns. Consequently, the Real Estate sector is has become the second-largest contributor to the national economy. This positive performance can primarily be attributed to increased development activities driven by a resurgence in investor confidence. The graph below shows the Real Estate sector growth rates from Q1’2020 to Q2’2023;
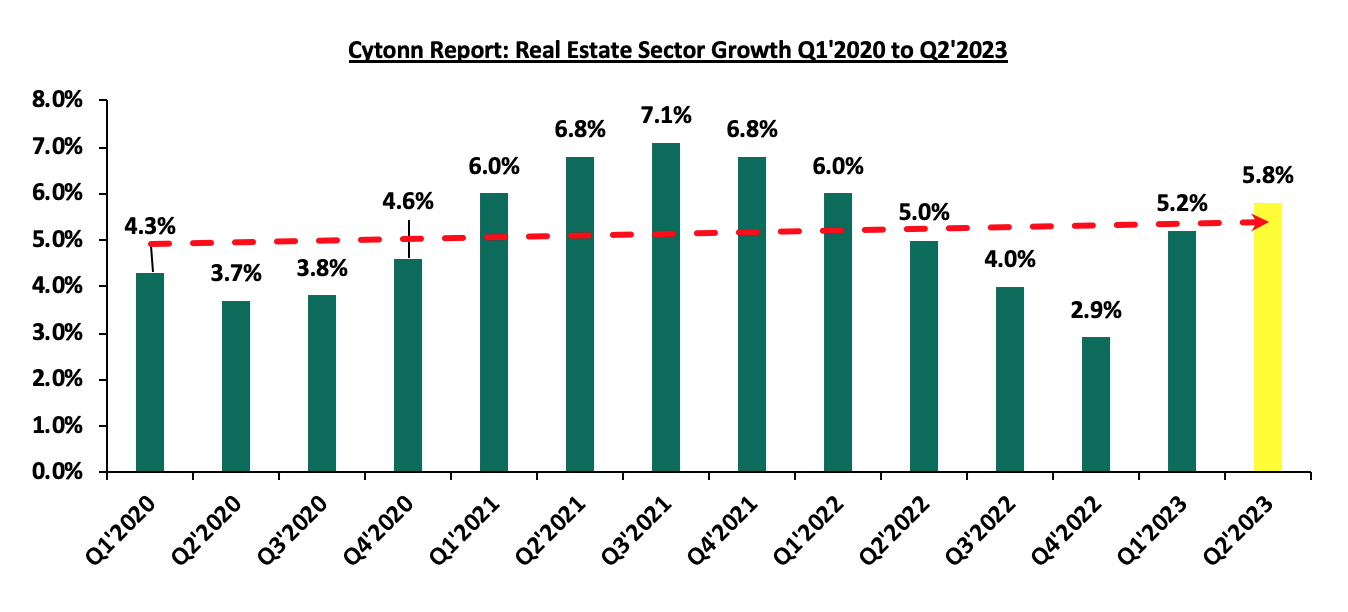
Source: Kenya National Bureau of Statistics (KNBS)
Sectoral Market Performance:
- Residential Sector
During Q3’2023, the NMA residential sector realized an improvement in performance with average y/y total returns to investors coming in at 6.0%, a 0.1%-points increase from 5.9% recorded in Q3’2022. The performance was attributed to an improvement in the residential average y/y rental yield which came in at 5.3% in Q3’2023, 0.2% points higher than the 5.1% rental yield recorded in Q3’2022. In addition, on q/q basis the residential market stabilized, with the average total return remaining relatively unchanged from H1’2023. The price appreciation came in at 0.7% in Q3’2023, recording a 0.1%-points decline from the 0.8% price appreciation recorded in Q3’2022. The table below shows the NMA residential sector’s performance during Q3’2022 and Q3’2023;
|
All values in Kshs unless stated otherwise |
|||||||||||
|
Cytonn Report: Nairobi Metropolitan Area (NMA) Residential Sector Summary – Q3’2023/Q3’2022 |
|||||||||||
|
Segment |
Average of Price per SQM Q3'2023 |
Average of Rent per SQM Q3'2023 |
Average of Rental Yield Q3'2023 |
Average of Price Appreciation Q3'2023 |
Average of Total Returns Q3'2023 |
Average of Rental Yield Q3'2022 |
Average of Price Appreciation Q3'2022 |
Average of Total Returns Q3'2022 |
y/y ∆ in Rental Yield |
y/y ∆ in Price Appreciation |
y/y ∆ in Total Returns |
|
Detached Units |
|||||||||||
|
High End |
197,758 |
818 |
5.1% |
0.7% |
5.8% |
4.3% |
1.3% |
5.6% |
0.8% |
(60.0%) |
0.2% |
|
Upper Middle |
142,010 |
603 |
4.6% |
1.0% |
5.5% |
4.6% |
0.8% |
5.4% |
0.0% |
0.2% |
0.1% |
|
Lower Middle |
74,206 |
330 |
5.0% |
1.0% |
6.0% |
5.0% |
0.8% |
5.8% |
0.0% |
0.2% |
0.2% |
|
Detached Units Average |
137,991 |
583 |
4.9% |
0.9% |
5.8% |
4.6% |
1.0% |
5.6% |
0.3% |
(0.1%) |
0.2% |
|
Apartments |
|||||||||||
|
Upper Mid-End |
118,546 |
626 |
5.5% |
0.3% |
5.8% |
5.4% |
0.3% |
5.7% |
0.1% |
0.0% |
0.1% |
|
Lower Mid-End Suburbs |
91,011 |
490 |
5.8% |
0.6% |
6.4% |
5.5% |
0.3% |
5.9% |
0.3% |
0.3% |
0.5% |
|
Lower Mid-End Satellite Towns |
77,432 |
395 |
5.6% |
0.9% |
6.5% |
5.5% |
1.3% |
6.8% |
0.1% |
(0.4%) |
(0.3%) |
|
Apartments Average |
95,663 |
504 |
5.6% |
0.6% |
6.2% |
5.4% |
0.7% |
6.1% |
0.2% |
(0.1%) |
0.1% |
|
Residential Market Average |
116,827 |
543 |
5.3% |
0.7% |
6.0% |
5.1% |
0.8% |
5.9% |
0.2% |
(0.1%) |
0.1% |
Source: Cytonn Research
- Detached Units Performance
The table below shows the NMA residential sector detached units’ performance during Q3’2023;
|
All values in Kshs unless stated otherwise |
||||||||
|
Cytonn Report: Residential Sector Detached Units Summary Q3’2023 |
||||||||
|
Area |
Average of Price per SQM Q3'2023 |
Average of Rent per SQM Q3'2023 |
Average of Occupancy Q3'2023 |
Average of Uptake Q3'2023 |
Average of Annual Uptake Q3'2023 |
Average of Rental Yield Q3'2023 |
Average of Price Appreciation Q3'2023 |
Total Returns |
|
High End |
||||||||
|
Karen |
179,378 |
441 |
83.4% |
91.6% |
9.9% |
5.1% |
1.6% |
6.7% |
|
Runda |
242,974 |
1,020 |
93.7% |
95.8% |
8.2% |
4.7% |
1.4% |
6.1% |
|
Kitisuru |
216,975 |
994 |
95.4% |
95.1% |
11.6% |
5.9% |
(0.2%) |
5.7% |
|
Rosslyn |
178,477 |
877 |
89.8% |
98.2% |
12.7% |
5.3% |
0.0% |
5.3% |
|
Lower Kabete |
170,985 |
756 |
85.3% |
81.6% |
10.8% |
4.3% |
0.7% |
5.0% |
|
Average |
197,758 |
818 |
89.5% |
92.5% |
10.6% |
5.1% |
0.7% |
5.8% |
|
Upper Middle |
||||||||
|
Ridgeways |
170,857 |
675 |
88.3% |
90.7% |
8.7% |
4.4% |
2.0% |
6.4% |
|
Redhill & Sigona |
92,778 |
445 |
89.5% |
97.0% |
12.3% |
5.3% |
1.0% |
6.3% |
|
Loresho |
168,277 |
785 |
80.5% |
82.5% |
11.7% |
5.1% |
0.9% |
6.0% |
|
Lavington |
189,218 |
724 |
87.2% |
91.6% |
11.1% |
4.1% |
1.5% |
5.6% |
|
Runda Mumwe |
154,392 |
697 |
87.4% |
91.4% |
11.6% |
4.8% |
0.5% |
5.3% |
|
South B/C |
104,204 |
440 |
88.1% |
86.4% |
9.5% |
4.1% |
0.7% |
4.8% |
|
Langata |
114,345 |
452 |
89.0% |
85.7% |
9.3% |
4.3% |
0.2% |
4.5% |
|
Average |
142,010 |
603 |
87.1% |
89.3% |
10.6% |
4.6% |
1.0% |
5.5% |
|
Lower Middle |
||||||||
|
Syokimau/Mlolongo |
75,050 |
323 |
88.8% |
90.8% |
15.0% |
4.5% |
2.7% |
7.2% |
|
Ngong |
53,509 |
295 |
94.9% |
97.9% |
8.7% |
5.7% |
1.3% |
7.0% |
|
Athi River |
86,984 |
387 |
89.3% |
95.9% |
11.4% |
5.1% |
1.6% |
6.7% |
|
Ruiru |
68,637 |
348 |
87.4% |
83.7% |
14.7% |
5.6% |
0.9% |
6.5% |
|
Kitengela |
63,372 |
334 |
87.0% |
87.4% |
11.8% |
5.3% |
0.7% |
6.0% |
|
Rongai |
81,862 |
297 |
97.1% |
98.1% |
14.3% |
4.7% |
1.0% |
5.7% |
|
Juja |
92,884 |
318 |
86.8% |
91.3% |
16.5% |
5.6% |
(0.1%) |
5.5% |
|
Donholm/Komarock |
83,647 |
400 |
87.8% |
96.0% |
9.8% |
4.1% |
1.1% |
5.2% |
|
Thika |
61,912 |
266 |
83.0% |
86.9% |
11.6% |
4.8% |
(0.4%) |
4.4% |
|
Average |
74,206 |
330 |
89.1% |
92.0% |
12.6% |
5.0% |
1.0% |
6.0% |
|
Detached Units Average |
137,991 |
583 |
88.6% |
91.3% |
11.3% |
4.9% |
0.9% |
5.8% |
Source: Cytonn Research
The key take-outs from the table include;
- Average Total Returns – The average y/y total returns to apartments’ investors came in at 5.8%, a 0.2%-points increase from the 5.6% recorded in Q3’2022, driven by a 0.3%-points increase in the average rental yield to 4.9% in Q3’2023, from 4.6% recorded in Q3’2022. The improvement in performance was attributable to a 7.6% uptick in the average rents per SQM to Kshs 583 in Q3’2023, from Kshs 542 recorded in Q3’2022,
- Segment Performance – The best performing segment was the lower-middle segment offering an average total return of 6.0%, attributable to a relatively high average rental yield of 5.0%, 0.1%-points higher than the detached market average rental yield of 4.9%. The impressive performance of the segment is driven by returns from well-performing nodes such as Syokimau/Mlolongo, and Ngong that have continued to offer relatively high returns to investors, and,
- Nodal Performance – Overall, Syokimau/Mlolongo was the best performing node, offering the highest returns at 7.2%, driven by a relatively high y/y price appreciation of 2.7%. The node has continued to attract residential investments in terms of modern townhouses for sale within gated communities, due to its convenient accessibility from the Nairobi CBD through key infrastructure developments such as the Nairobi Expressway. Ngong followed with an average total return of 7.0%, while the worst performing node was Thika which recorded an average total return of 4.4%, 1.4% points lower than the detached market average of 5.8%.
- Apartments Performance
The table below shows the NMA residential sector apartments’ performance during Q3’2023;
|
All values in Kshs unless stated otherwise |
||||||||
|
Cytonn Report: Residential Sector Apartments Summary Q3’2023 |
||||||||
|
Area |
Average of Price per SQM Q3'2023 |
Average of Rent per SQM Q3'2023 |
Average of Occupancy Q3'2023 |
Average of Uptake Q3'2023 |
Average of Annual Uptake Q3'2023 |
Average of Rental Yield Q3'2023 |
Average of Price Appreciation Q3'2023 |
Total Returns |
|
Upper Mid-End |
||||||||
|
Kileleshwa |
121,194 |
647 |
89.1% |
92.5% |
12.4% |
5.8% |
0.6% |
6.4% |
|
Westlands |
125,592 |
812 |
83.1% |
87.3% |
15.3% |
5.7% |
0.5% |
6.2% |
|
Kilimani |
106,859 |
584 |
87.8% |
91.7% |
19.4% |
5.5% |
0.3% |
5.9% |
|
Loresho |
124,000 |
572 |
88.0% |
97.2% |
9.4% |
4.9% |
0.8% |
5.7% |
|
Upperhill |
126,905 |
710 |
84.3% |
88.4% |
11.2% |
5.8% |
(0.3%) |
5.5% |
|
Parklands |
106,723 |
432 |
88.6% |
92.0% |
12.0% |
5.6% |
(0.2%) |
5.4% |
|
Average |
118,546 |
626 |
86.8% |
91.5% |
13.3% |
5.5% |
0.3% |
5.8% |
|
Lower Mid-End Suburbs |
||||||||
|
Waiyaki Way |
79,849 |
451 |
83.8% |
87.3% |
15.1% |
5.7% |
1.5% |
7.2% |
|
Kahawa West |
74,351 |
454 |
89.0% |
86.2% |
8.1% |
6.1% |
0.9% |
7.0% |
|
South C |
109,184 |
652 |
88.9% |
90.0% |
15.6% |
6.1% |
0.8% |
6.9% |
|
Race Course/Lenana |
102,298 |
504 |
85.8% |
91.2% |
15.8% |
5.6% |
1.1% |
6.7% |
|
Langata |
112,005 |
569 |
86.1% |
88.0% |
11.1% |
5.2% |
1.4% |
6.6% |
|
Imara Daima |
70,482 |
407 |
86.4% |
86.9% |
8.8% |
5.5% |
1.0% |
6.5% |
|
South B |
111,222 |
508 |
91.3% |
96.1% |
14.2% |
5.2% |
0.8% |
6.0% |
|
Donholm/Komarock |
69,894 |
442 |
92.6% |
91.4% |
8.4% |
6.1% |
(0.2%) |
5.9% |
|
Dagoretti |
89,810 |
424 |
88.3% |
81.2% |
11.1% |
6.3% |
(0.5%) |
5.8% |
|
Average |
91,011 |
490 |
88.0% |
88.7% |
12.0% |
5.8% |
0.6% |
6.4% |
|
Lower Mid-End Satellite Towns |
||||||||
|
Ngong |
79,583 |
382 |
86.7% |
85.9% |
10.6% |
5.7% |
1.8% |
7.5% |
|
Syokimau |
67,668 |
368 |
87.0% |
91.8% |
11.2% |
5.9% |
1.2% |
7.1% |
|
Ruiru |
90,587 |
480 |
87.0% |
83.6% |
14.1% |
5.5% |
1.3% |
6.8% |
|
Ruaka |
108,246 |
535 |
77.1% |
83.8% |
16.5% |
5.2% |
1.5% |
6.7% |
|
Athi River |
59,356 |
285 |
90.1% |
94.5% |
13.2% |
5.3% |
1.3% |
6.6% |
|
Kikuyu |
82,675 |
427 |
87.7% |
93.6% |
16.4% |
5.4% |
1.1% |
6.5% |
|
Rongai |
52,702 |
248 |
89.6% |
81.5% |
13.0% |
5.6% |
0.4% |
6.0% |
|
Thindigua |
97,189 |
522 |
88.9% |
304.7% |
143.2% |
6.1% |
(0.2%) |
5.9% |
|
Kitengela |
58,885 |
306 |
85.5% |
87.5% |
8.3% |
5.6% |
(0.1%) |
5.5% |
|
Average |
77,432 |
395 |
86.6% |
111.9% |
27.4% |
5.6% |
0.9% |
6.5% |
|
Apartments Average |
95,663 |
504 |
87.2% |
97.4% |
17.6% |
5.6% |
0.6% |
6.2% |
Source: Cytonn Research
The key take-outs from the table include;
- Average Total Returns – The average y/y total returns to detached units’ investors came in at 6.2%, a 0.1%-points increase from the 6.1% recorded in Q3’2022. The improvement in performance was driven by a 0.2%-points increase in the average rental yield to 5.6% in Q3’2023, from 5.4% recorded in Q3’2022. majorly attributable to a 2.1%-points increase in average occupancy rates to 87.2%, from the 85.1% recorded in Q3’2022. However, the y/y price appreciation softened by 0.1%-points to 0.6%, from 0.7% recorded in Q3’2022, mainly attributable to a 4.1% decline in the average selling prices per SQM to Kshs 95,663 from Kshs 99,567 recorded in Q3’2022,
- Segment Performance – The best performing segment was the lower mid-end satellite towns with average total return of 6.5%, attributed to a relatively high average price appreciation of 0.9%. The impressive performance of the segment was driven by returns from well-performing nodes such as Ngong, Syokimanu, and Ruiru that have continued to offer competitive returns to investors in comparison to other segments, and
- Nodal Performance – Overall, the best performing node was Ngong, offering investors average total returns of 7.5%, 1.3%-points higher than the apartment market average total returns of 6.2%. Ngong has seen increased apartment investments owing to an inflow of residents brought about by the enhanced accessibility to the Nairobi CBD after the completion of the Ngong-Lang’ata Link road. The worst performing node was Kitengela, which recorded an average total return of 5.5%, 0.7%-points lower than the detached market average of 6.2%.
For notable highlights during Q3’2023, please see our Cytonn Monthly - July 2023, and Cytonn Monthly - August 2023 reports. For the month of September;
- Absa Bank Kenya announced a strategic partnership with Unity Homes, a leading property developer of residential communities in Kenya, which will allow potential home buyers to access affordable mortgage loans backed by the Kenya Mortgage Refinancing Company to purchase homes at Unity One. Additionally, the International Finance Corporation (IFC) disclosed details of a Kshs 2.9 bn (USD 20.0 mn) proposed loan to Centum Real Estate Limited (CRE), a wholly owned subsidiary of Centum Investment Company Plc. For more information, see Cytonn Weekly #36/2023, and,
- The Capital Markets Authority (CMA) granted Linzi Finco Trust the approval to issue an inaugural Shariah compliant bond, ‘Linzi Sukuk. For more information, see Cytonn Weekly #39/2023.
We have a NEUTRAL outlook for the NMA residential sector, as we as we expect the supply and demand of housing to grow, supported by several factors such as; i) increased financing geared to bring more property developments, ii) provision of affordable housing by the government and private sector, iii) focus on mortgage financing through the KMRC, and, iv) Kenya's positive demographics in terms of urbanization and population growth rates compared to global rates. However, various setbacks such as the continued increase in construction costs on the back of the high inflation, low penetration rate of mortgage financing to buyers, and constrained financing to developers with underdeveloped capital markets are expected to remain weighing down the optimum performance of the sector.
- Commercial Office Sector
The table below highlights the performance of the Nairobi Metropolitan Area (NMA) Commercial Office sector from Q3’2022 to Q3’2023;
|
Cytonn Report: Nairobi Metropolitan Area (NMA) Commercial Office Returns Over Time |
||||||
|
Year |
Q3'2022 |
FY'2022 |
Q1'2023 |
H1'2023 |
Q3'2023 |
∆ Q3'2023/Q3'2022 |
|
Occupancy % |
78.2% |
79.4% |
79.8% |
80.8% |
79.9% |
1.7% points |
|
Asking Rents (Kshs/SQFT) |
96 |
96 |
97 |
98 |
100 |
4.2% |
|
Average Prices (Kshs/SQFT) |
12,221 |
12,223 |
12,238 |
12,238 |
12,265 |
0.4% |
|
Average Rental Yields (%) |
7.4% |
7.6% |
7.6% |
7.8% |
7.7% |
0.3% points |
Source: Cytonn Research
The key take-outs from the table include;
- Average Asking Rents – In Q3’2023, the average asking rents per SQFT in the NMA increased by 4.2% to Kshs 100 from Kshs 96 in Q3’2022. On a quarter-on-quarter (q/q) basis, the performance registered a 2.0% increase to Kshs 100 from Kshs 98 recorded in H1’2023. The rise in average asking rents was attributable to increased supply of grade A offices fetching higher rents such as The Cube, The Rock, The Piano, Principal Place and TDB Towers among others, and increasing demand for high-grade office properties. Additionally, as a result of the continued depreciation of the Kenyan Shilling, there has been an escalating inclination among investors to opt for rental payments in U.S. dollars. This in turn, has contributed to an increase in rental rates,
- Average Occupancy Rates – The average occupancy rates came in at 79.9% in Q3’2023, a 1.7% points increase from 78.2% in Q3’2022. On a q/q basis, the performance registered a 0.9% points decline from 80.8% in H1’2023. The decline in occupancy rates was attributed to increased supply of office space on the back of new establishments being delivered into the market, which weighed down on absorption rates. However, the performance on a year-on-year (y/y) basis registered an improvement on account of reduced supply of office space delivered into the market as compared to a similar period in 2022, and,
- Average Rental Yields – The average rental yields recorded a 0.3% points increase to 7.7% in Q3’2023 from 7.4% recorded in Q3’2022 due to improved average asking rents and occupancy rates. On a q/q basis, average rental yields in the NMA declined by 0.1% points to 7.7%, from 7.8% recorded in H1’2023.
For the submarket performance, Gigiri, Westlands, and Parklands were the best performing nodes realizing average rental yields of 8.5%, 8.4% and 8.1% respectively in Q3’2023, compared to the market average of 7.7%. Their impressive performance was attributed to several factors including; i) the abundance of Grade A office spaces with high-quality amenities commanding premium rents, thus appealing to investors with the promise of attractive returns, ii) increasing demand for high quality commercial office spaces in these markets, supported by the presence of international organizations, multinational companies, and embassies, iii) relatively good infrastructure and amenities providing ease of accessibility and convenience, which has made them popular choices for businesses, and, iv) their appealing locations, set apart from the busy city center, offering a tranquil environment creating excellent office locations. Conversely, Mombasa Road was the least performing node with an average rental yield of 5.2%, 2.5% points lower than the market average of 7.7%. This was attributed to; i) the presence of lower quality offices fetching lower average rents at Kshs 71 per SQFT, ii) its recognition as an industrial zone, making it less appealing to office-centric businesses, and, iii) stiff competition from other sub-markets in the NMA that offer superior quality office spaces. The table below shows the Nairobi Metropolitan Area (NMA) sub-market performance in Q3’2023;
|
All values in Kshs unless stated otherwise |
|||||||||||
|
Cytonn Report: NMA Commercial Office Submarket Performance Q3’2023 |
|||||||||||
|
Area |
Price/SQFT Q3'2023 |
Rent/SQFT Q3'2023 |
Occupancy Q3'2023 |
Rental Yields Q3'2023 |
Price/SQFT Q3'2022 |
Rent/SQFT Q3'2022 |
Occupancy Q3'2022 |
Rental Yields Q3'2022 |
∆ in Rent |
∆ in Occupancy (% points) |
∆ in Rental Yields (% points) |
|
Gigiri |
13,500 |
115 |
81.8% |
8.5% |
13,500 |
118 |
81.0% |
8.6% |
(2.5%) |
0.8% |
(0.2%) |
|
Westlands |
12146 |
114 |
75.2% |
8.4% |
12,032 |
107 |
75.7% |
8.1% |
7.3% |
(0.5%) |
0.3% |
|
Karen |
13,431 |
116 |
79.7% |
8.3% |
13,431 |
107 |
83.0% |
7.9% |
8.2% |
(3.3%) |
0.3% |
|
Parklands |
11,662 |
93 |
83.6% |
8.0% |
11,662 |
91 |
81.0% |
7.6% |
2.0% |
2.6% |
0.4% |
|
Kilimani |
12,356 |
98 |
83.4% |
7.9% |
12,260 |
92 |
80.8% |
7.3% |
6.6% |
2.6% |
0.6% |
|
Nairobi CBD |
11,971 |
87 |
85.0% |
7.6% |
11,971 |
82 |
84.4% |
6.9% |
7.1% |
0.7% |
0.7% |
|
Upperhill |
12,605 |
98 |
76.1% |
7.1% |
12,586 |
96 |
75.2% |
6.9% |
2.7% |
0.9% |
0.2% |
|
Thika Road |
12,571 |
79 |
80.1% |
6.0% |
12,571 |
77 |
77.9% |
5.7% |
1.9% |
2.3% |
0.3% |
|
Mombasa Road |
11,325 |
71 |
67.9% |
5.2% |
11,325 |
73 |
65.5% |
5.1% |
(2.3%) |
2.4% |
0.1% |
|
Average |
12,265 |
100 |
79.9% |
7.7% |
12,221 |
96 |
78.2% |
7.4% |
5.0% |
1.7% |
0.3% |
Source: Cytonn Research
We retain a NEUTRAL outlook for the NMA commercial office sector, driven by factors such as the growing popularity of co-working spaces and reduced developments in the pipeline, which we anticipate will assist curb the existing oversupply challenge. However, the oversupply of office space, totaling 5.8 mn SQFT in the NMA, is expected to dampen the sector's performance by constraining overall demand for physical space. Investment opportunity lies in Gigiri, Westlands and Parklands offering relatively higher returns compared to the market average.
- Retail Sector
The table below shows the performance of the retail sector performance in Nairobi Metropolitan Area from Q1’2022 to Q3’2023;
|
Cytonn Report: Nairobi Metropolitan Area (NMA) Retail Performance Q1’2022 – Q3’2023 |
||||||||
|
Year |
Q1'2022 |
H1'2022 |
Q3'2022 |
FY'2022 |
Q1'2023 |
H1’2023 |
Q3’2023 |
Q3’2023/ Q3’2022 ∆ (% points) |
|
Average Asking Rents (Kshs/SQFT) |
170 |
173 |
171 |
174 |
176 |
177 |
182 |
7.2% |
|
Average Occupancy Rates |
77.2% |
75.9% |
76.1% |
77.6% |
78.0% |
79.2% |
78.7% |
2.6% |
|
Average Rental Yields |
7.9% |
7.8% |
7.6% |
7.9% |
8.0% |
8.2% |
8.2% |
0.6% |
Source: Cytonn Research
The key take-outs from the table include;
- Average Occupancy Rate – The average occupancy rates came in at 78.7%, a 2.6% points increase from 76.1% recorded in Q3’2022. The positive growth is attributed to; i) continuous expansion by local and foreign retailers such as Naivas, Carrefour, Quickmart, Optica Limited, Kentucky Fried Chicken (KFC), Cleanshelf, and, Simbisa Kenya that owns Chicken and Pizza Inn franchises over the period, ii) increased entry of smaller retailers in the prime spaces introduced by new malls in the region such as Business Bay Square Mall in Easleigh, iii) positive demographics which continues to sustain demand for consumable goods and services hence triggering expansion by several existing retailers, and, iv), continuous improvement of infrastructure developments not only benefited existing retail spaces but has also opened up new regions for retail opportunities.
However, on a q/q basis, the performance represented a 0.5% points decline from 79.2% recorded in Q2’2023. The performance can be attributed to tougher economic conditions with; i) escalating inflationary pressure leading to receding consumer shopping baskets and power among shoppers, ii) credit squeeze from financial institutions due to increased tightening of lending terms, iii) persistent weakening of the Kenyan Shilling, and, iv) the introduction of new taxes in the business environment along with increased rates in the existing taxes which became effective from July 2023. Some of the notable ta changes include the increase in turnover tax to 3.0% from 1.0%, 15.0% withholding tax on income generated digitally, and increase in the Value Added Tax (VAT) rate on petroleum products from 8.0% to 16.0%. Some of the tax changes have also led to increased rental charges by retail space owners, cumulatively putting more significant pressure on retailers. Retailers are faced with the tough decision of either operating with reduced margins in retail spaces or passing the additional costs on to consumers. In response to these challenges, some retailers are moving to informal retail spaces to keep their businesses afloat. This shift allows them to continue operations while navigating the tough business environment,
- Asking Rents – The average asking rents per SQFT increased by 4.4% to Kshs 182 in Q3’2023 from Kshs 171 recorded in Q3’2022, driven by an increased entry of quality retail spaces such as the Global Trade Centre (GTC) mall and Business Bay Square (BBS) Mall which also boasts as the largest mall by total built up area in East and Central Africa. Additionally, presence of quality retail spaces continues to fetch higher rents in several nodes of NMA such as Karen, Kilimani, Westlands, and, along Kiambu and Limuru roads. These spaces within the aforementioned areas continue to attract more foreign businesses due to their proximity to multinational organizations and embassies aimed at serving the consumer needs and interests of foreign clients working in those entities. Some of the notable foreign businesses and international brands that have entered the Kenyan market for the first time and racing for the prime retail stores include Adidas, Puma, Michael Kors, Aldo and many more. As a result, property owners of these retail spaces have allowed rental transactions to be quoted in dollars. This practice has contributed to the increase in rental rates, especially considering the ongoing depreciation of the Kenyan currency against the dollar, with a notable 22.8% depreciation to Kshs 148.7 by end of Q3’2023 from Kshs 121.3 by the end of Q3’2022 The combination of foreign business attraction and the quoting of rents in dollars has led to a notable increase in rental prices in these areas, and,
- Average Rental Yield – The average rental yield for the NMA retail sector improved by 0.6% points to 8.2% in Q3’2023, from 7.6% in Q3’2022 attributed to improved asking rents and occupancy rates.
Regarding sub-market performance Karen, Kilimani, and Westlands stood out as the best performing nodes with average rental yields of 10.0%, 9.9%, and 9.1% respectively, surpassing other nodes. The exceptional performance of was attributed to the availability of high-quality retail spaces that command high rents, as well as the presence of quality infrastructure services in those areas. Conversely, Eastlands continued to register the least average rental yield of 6.2% due to; i) lower occupancy rates at 71.7%, 6.0% points lower than the market average of 78.7% at the back of entry of BBS Mall in the region in 2023 and relatively lower demand in other malls within the region, ii) poor quality infrastructure in most towns within the region which is unsustainable for the retail spaces and hindering sufficient accessibility, and, iii) heavy presence of informal retail spaces that quickly adapt to market trends and service stations with value added amenities offering opportunities for better quality retail spaces, one-stop-shop approach, convenience and cheaper rates for price sensitive clients increasingly cause stiffer competition. However, it has to be noted that the rental rates in Eastlands recorded the highest change at 26.3% against the market average of 7.2%. This increase can be attributed to the BBS Mall, which is currently the largest mall in East and Central Africa and offers high-quality and modern spaces at relatively higher rental charges.
Additionally, prime retail spaces in the satellite towns have exhibited the highest change in occupancy rates at 7.3% against the market average of 2.6%. This shift is primarily driven by the growing population in these regions, prompting retailers to expand their operations beyond the city center and tap into opportunities in satellite towns. This strategic move aims to bring convenience to residents in the most accessible way possible. Additionally, some retail space owners have reduced rents in these areas to attract more clients, given the increased demand for consumer goods, services, and entertainment facilities. The table below shows the submarket performance of nodes in the Nairobi Metropolitan Area (NMA) Q3’2023;
|
All values in Kshs unless stated otherwise |
|||||||||
|
Cytonn Report: Nairobi Metropolitan Area Retail Market Performance Q3’2023 |
|||||||||
|
Area |
Rent /SQFT Q3’2023 |
Occupancy% Q3’2023 |
Rental Yield Q3’2023 |
Rent/SQFT Q3’2022 |
Occupancy% Q3’2022 |
Rental Yield Q3’2022 |
∆ in Rental Rates |
∆ in Occupancy (% points) |
∆ in Rental Yield (% points) |
|
Karen |
217 |
85.0% |
10.0% |
205 |
78.6% |
8.8% |
6.3% |
6.4% |
1.2% |
|
Kilimani |
192 |
82.3% |
9.9% |
184 |
84.8% |
9.8% |
4.2% |
(2.5%) |
0.1% |
|
Westlands |
216 |
77.6% |
9.1% |
214 |
73.6% |
8.6% |
0.8% |
4.1% |
0.5% |
|
Kiambu Road & Limuru Road |
202 |
74.0% |
8.7% |
187 |
71.7% |
7.8% |
8.0% |
2.3% |
0.9% |
|
Mombasa road |
168 |
78.7% |
8.0% |
148 |
80.8% |
7.3% |
13.8% |
(2.1%) |
0.8% |
|
Ngong Road |
170 |
81.0% |
7.8% |
169 |
78.8% |
7.5% |
0.7% |
2.3% |
0.3% |
|
Thika Road |
165 |
80.7% |
7.5% |
158 |
73.8% |
6.7% |
4.2% |
6.8% |
0.8% |
|
Satellite towns |
139 |
79.8% |
6.9% |
138 |
72.5% |
6.1% |
0.7% |
7.3% |
0.8% |
|
Eastlands |
160 |
71.7% |
6.2% |
127 |
73.0% |
5.7% |
26.3% |
(1.3%) |
0.5% |
|
Average |
182 |
78.7% |
8.2% |
171 |
76.1% |
7.6% |
7.2% |
2.6% |
0.6% |
Source: Cytonn Research
Weekly Highlights:
- Naivas opens 99th Outlet in Mombasa County
During the week, chain store Naivas Supermarket opened its 99th outlet located along Ronald Ngala Street Tudor, Sabasaba, Mombasa County. The retailer’s decision to open up the store forms part of its expansion strategy dubbed ‘Road to 100’, and was driven by;
- Naivas’ ambition to enhance shopping accessibility for its shoppers by offering convenience, thus catering to evolving consumer inclinations,
- Naivas’ ongoing aggressive drive to broaden its presence and boost its market share in a bid to stamp market dominance against rival retailers such as Quickmart, and Carrefour as the outlet is Naivas’ 11th branch in the coastal region, and,
- The strategic location the junction of Ronald Ngala street and Mombasa A109 highway and at the vicinity of the Mombasa Central Business District (CBD) Waiyaki Way aiming to capitalize on booth foot and vehicular traffic within the area.
- Carrefour opens 21st Outlet in Nairobi County
During the week, French retailer Carrefour Supermarket, opened a new outlet at Ellis Plaza along Wabera Street in Nairobi CBD, bringing the retailer’s number of operating outlets countrywide to 21. The move is part of the retailer’s strategic plan to expand its footprint in the Kenyan market especially in the capital city with currently 17 outlets operating in Nairobi County, and 2 within the heart of the city. The location was also influenced by the desire to tap into the high footfall of shoppers within the city especially during the daytime period hence increasing shopping convenience. This is also a response to the consistent dominance of small retailers who are continually opening convenience stores not only in urban centers but also within residential areas. Additionally, the foreign retailer is on an aggressive move to stamp dominance and boost its market share against fierce rivals such as Naivas and Quickmart and consistent dominance by small retailers constantly opening convenience stores in not only the urban centers but within residential areas.
Notably, these two major openings come at a time when formal retail penetration in Kenya is still low, standing at 30.0% as at 2018, coupled with existing gaps left by other retailers such as Nakumatt, Uchumi, Shoprite and Choppies Supermarkets which exited the market. The table below shows the number of stores currently operated by key local and international retail supermarket chains in Kenya;
|
Cytonn Report: Main Local and International Retail Supermarket Chains |
|||||||||
|
Name of retailer |
Category |
Branches as at FY’2018 |
Branches as at FY’2019 |
Branches as at FY’2020 |
Branches as at FY’2021 |
Branches as at FY’2022 |
Branches opened in 2023 |
Closed branches |
Current branches |
|
Naivas |
Hybrid* |
46 |
61 |
69 |
79 |
91 |
8 |
0 |
99 |
|
Quick Mart |
Hybrid** |
10 |
29 |
37 |
48 |
55 |
4 |
0 |
59 |
|
Chandarana |
Local |
14 |
19 |
20 |
23 |
26 |
0 |
0 |
26 |
|
Carrefour |
International |
6 |
7 |
9 |
16 |
19 |
2 |
0 |
21 |
|
Cleanshelf |
Local |
9 |
10 |
11 |
12 |
12 |
1 |
0 |
13 |
|
Tuskys |
Local |
53 |
64 |
64 |
6 |
6 |
0 |
59 |
5 |
|
Game Stores |
International |
2 |
2 |
3 |
3 |
0 |
0 |
3 |
0 |
|
Uchumi |
Local |
37 |
37 |
37 |
2 |
2 |
0 |
35 |
2 |
|
Choppies |
International |
13 |
15 |
15 |
0 |
0 |
0 |
15 |
0 |
|
Shoprite |
International |
2 |
4 |
4 |
0 |
0 |
0 |
4 |
0 |
|
Nakumatt |
Local |
65 |
65 |
65 |
0 |
0 |
0 |
65 |
0 |
|
Total |
|
257 |
313 |
334 |
189 |
211 |
15 |
181 |
225 |
|
*51% owned by IBL Group (Mauritius), Proparco (France), and DEG (Germany), while 49% owned by Gakiwawa Family (Kenya) |
|||||||||
|
**More than 50% owned by Adenia Partners (Mauritius), while Less than 50% owned by Kinuthia Family (Kenya) |
|||||||||
Source: Cytonn Research
For other highlights during Q3’2023, please see our Cytonn Monthly - July 2023, and Cytonn Monthly - August 2023 reports.
We have a NEUTRAL outlook on the performance of retail sector as we anticipate that the sector will be influenced by various factors. On the positive side, We anticipate a sustained upsurge in activities within the Kenyan retail industry, supported by; i) ongoing expansion efforts by local and foreign retailers and international brands to capture a larger market share and establish dominance, ii) increased capital investments from foreign entities in the Kenyan retail market amid e-commerce developments, iii) rising demand for goods, services, and retail spaces due to favorable demographics in the country, and, iv) infrastructural developments enhancing accessibility in various regions, thus opening up viable opportunities to previously inaccessible areas for retail investment. However, the sector's optimal performance is expected to be subdued by challenging economic conditions such as inflationary pressures, eroding the purchasing power of consumers, which could have a dampening effect among retailers especially those reliant on discretionary spending. Very tough economic conditions with the introduction of new taxes in the business environment along with increased rates in the existing taxes has persistently been piling pressure on retailers and thus face the tough decision of either operating with reduced margins or passing the additional costs on to consumers. Additionally, the oversupply of retail spaces, currently estimated at 3.3 mn SQFT in the Nairobi Metropolitan Area (NMA) and 2.1 mn SQFT in the larger Kenyan retail sector (excluding NMA), will continue to subdue the sector. Additionally, the rapid growth of e-commerce in the retail landscape with an expected Compound Annual Growth Rate (CAGR 2023-2027) of 6.7% driven by change in consumer behavior and preferences could intensively limit the optimal utilization of physical retail spaces.
- Hospitality Sector
During the quarter, one hospitality sector related industry report was released and the key-take outs were as follows;
|
Cytonn Report: Released Industry Report related to Hospitality Sector H1’2023 |
||
|
# |
Report |
Key Take-outs |
|
1 |
The Leading Economic Indicators (LEI) July 2023 Report by the Kenya National Bureau of Statistics (KNBS) |
|
During the week, W Hospitality Group released the Hotel Chain Development Pipelines in Africa 2023 Report, compiling data from 45 regional and international hotel chains. Key highlights from the report included;
- African hotel chain development pipelines now total 482 hotels with 84,427 rooms, a 5.2% increase from 447 hotels with 80,291 rooms registered in the pipeline in 2022. This total was analyzed according to two main regions, which are North Africa accounting for five countries – Morocco, Algeria, Tunisia, Libya and Egypt, and sub-Saharan Africa accounting for 49 countries, including the Indian Ocean islands. Notably, the pipeline for Sub-Saharan Africa recoded a 6.1% increase to 47,750 rooms in 2023, from 45,011 rooms in 2022,
- Kenya was ranked fifth highest in the continent by number of planned rooms, with 25 hotels and 3,729 rooms in the pipeline. This was a 18.2% increase from 2022, when Kenya registered 24 hotels and 3,155 rooms in the pipeline and was ranked position seven in the continent, and,
- Additionally, Nairobi was ranked the fifth highest city with anticipated additions to supply, with 17 hotels and 3,161 rooms expected to open in 2023. This is a 21.6% increase from 16 hotels with a total of 2600 rooms in the pipeline in 2022.
The graph below highlights the number of new hotels and hotels room in the pipeline in the top ten countries and cities in the African continent;
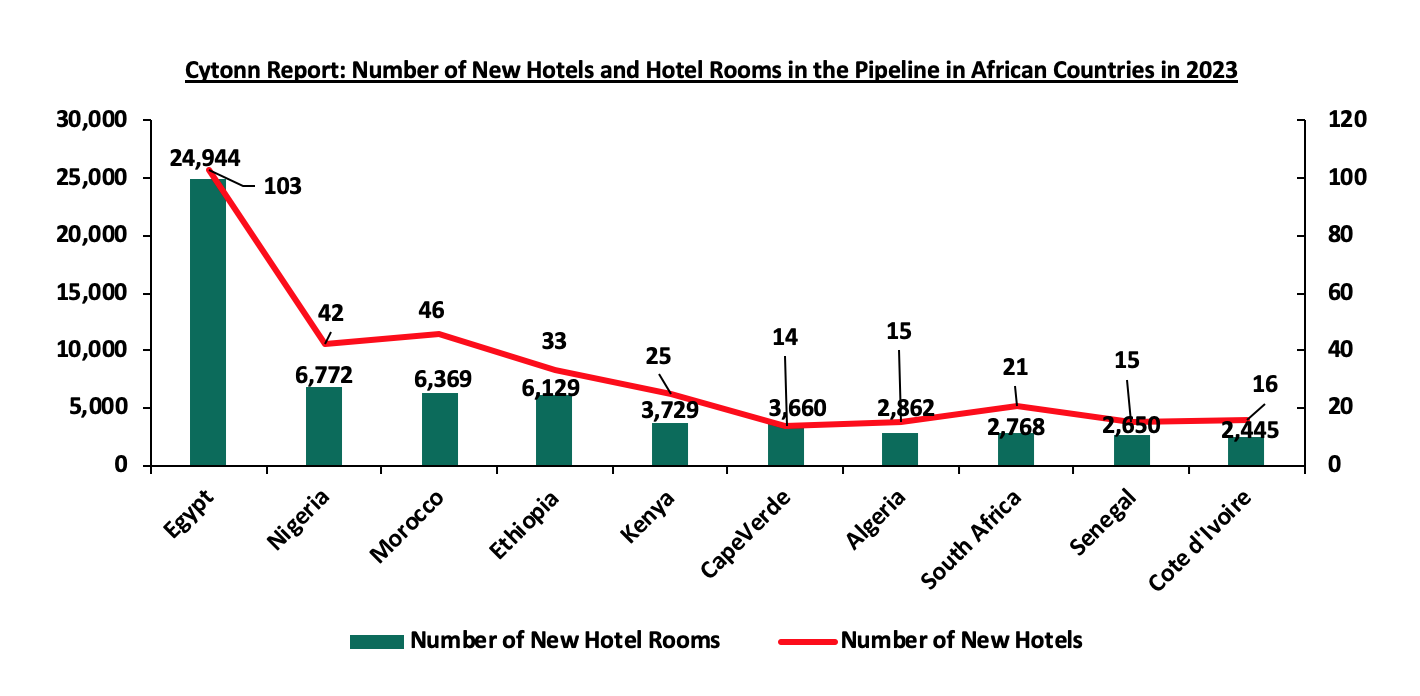
Source: Hotel Chain Development Pipelines in Africa 2023
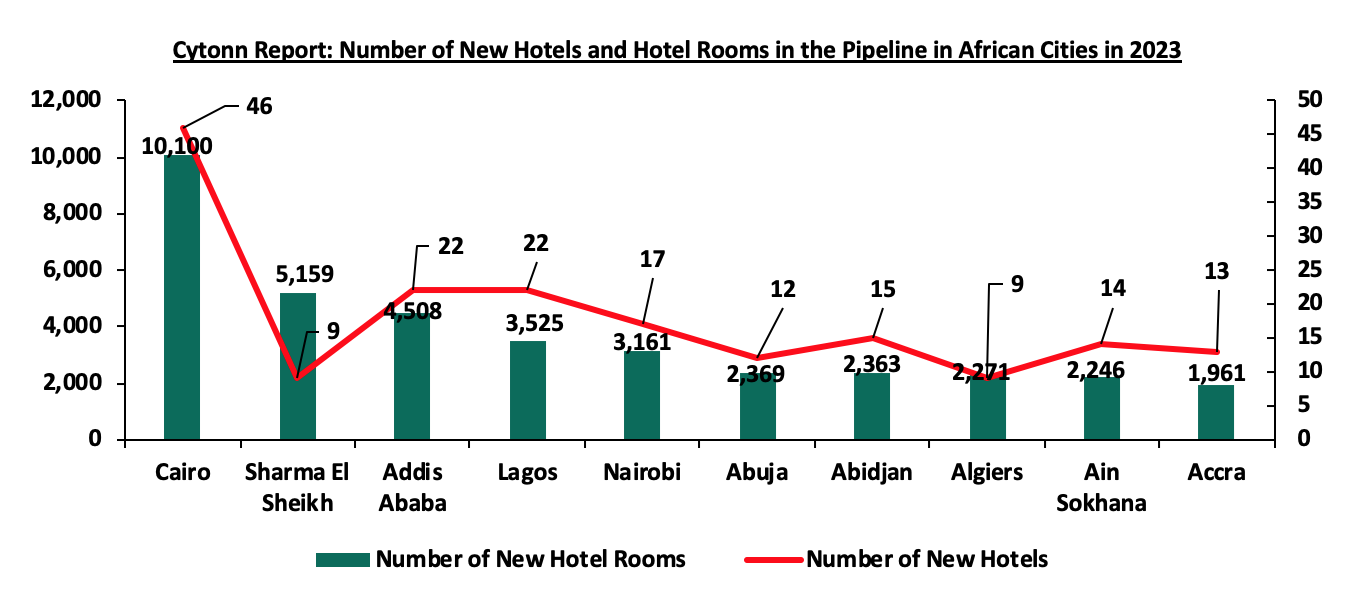
Source: Hotel Chain Development Pipelines in Africa 2023
The rise in the number of hotels and hotel rooms in the pipeline comes at a period when the hospitality sector across the region and globally is recovering from the adverse effects of the COVID-19 pandemic which negatively affected the growth and expansion of the hotel industry. The relaxation of travel restrictions between countries worldwide played a pivotal role in the resurgence of local and international tourism, resulting in an uptick in visitors’ arrivals to major tourist destinations for various purposes such as leisure, entertainment, sports, business meetings, physical conferences, and international exhibitions among others.
Additionally, the recent revived efforts by the Tourism Fund and other regulatory authorities such as the Tourism Regulatory Authority to register all short-term rental accommodation businesses popularly known as Airbnb will have a mixed effect in the serviced apartment sector and the general hospitality sector. The regulatory bodies have raised concerns about the growing preference among Kenyan tourists for luxurious Airbnb stays over traditional hotel accommodations, leading to a substantial revenue loss Part of the concerted efforts will to register more Airbnb hosts where out of the 40,000 short term accommodations mapped by the authorities only 400 units have been registered. On top of that, the short term accommodation business will be added in the tax bracket where the Tourism fund has proposed a 2.0% tax levy for the hosts.
In our view, we expect the deliberations to; i) significantly increase government revenue through the tax levy collected from the over 40,000 Airbnb hosts that will be registered in Kenya, ii) create a level playing field and fairer competition between traditional hotels and Airbnbs where hoteliers have complained about high taxation while Airbnbs have enjoyed tax-free profits due to lack of regulations, and, iii) better regulatory framework where all hosts will have to meet certain quality standards, increased protection on clients, increased accountability and transparency in the market, price and rental charges control and stabilization thus potentially improving the quality of accommodations available. However, some of the proposals such as levying of tax will contribute to negative factors such as; i) increase the cost of Airbnb accommodations, which could affect their competitiveness where hosts might choose to absorb the cost, while others might pass it on to the clients therefore decrease in demand and ultimately affect the profitability of the businesses especially during low seasons in the Kenyan tourism sector, and, ii) potential resistance from the hosts where majority of serviced apartment owners Airbnb might resist the levy and the registration processes or have ways of navigating the processes to evade the taxation.
We retain a NEUTRAL outlook for the hospitality sector during the year as we expect the sector’s performance to be supported by; i) promotion of regional tourism to enhance performance of the African markets, ii) increased international tourism arrivals into the country gearing towards pre-COVID levels as highlighted by the LEI and Annual Tourism Sector Performance Report 2022 reports, ii) increased budgetary allocation towards the sector through the Tourism Fund and Tourism Promotion Fund (TPF) in FY’2023/24, iii) development of niche products such as cruise tourism, adventure tourism, culture and sports tourism, iv) extensive marketing of Kenya’s tourism sector through platforms such as Magical Kenya by the Kenya Tourism Board, v) promotion of affordable and accessible travel across Kenya for Free Independent Travelers (FITs) and implementation of vital government initiatives such as the New Tourism Strategy for Kenya 2021-2025 promoting local tourism, vi) increased leisure and sporting activities with the hosting of Annual World Rally Championship (WRC) competition in Naivasha until 2026, and, vii) continuous opening and expansions by local and international hotel brands such as JW Marriott of the Bonvoy Global and Pan Pacific Hotels Group in the country. We also continue to expect greater improvement in the hospitality sector driven by high-level regional events and international exhibitions held in Nairobi, such as the 5th Mid-Year Coordination Meeting, African Climate Summit, African Development Bank's (AfDB) Civil Society and Community Engagement Division, Nairobi International Trade Fair, and many others to be held towards the end of 2023. These events attracted numerous African presidents, expatriates, and professionals and activists from various sectors, solidifying Nairobi's position as a regional hub for meetings, events, exhibitions, and conferences across the continent. The continuous efforts by the head of state in marketing the country further bolster this position.
However, the recent austerity measures implemented by the Chief of Staff and Head of Public Service, including the indefinite suspension of non-essential local and foreign travels, stringent restrictions on essential travels, and significant reduction in delegation size for hotel meetings, conferences, and trainings by state officers in Ministries, State Departments, and Agencies (MDAs), are expected to adversely impact the optimal performance of the hospitality sector in the country.
- Land Sector
The average selling prices for land in the Nairobi Metropolitan Area (NMA) recorded an overall improvement in performance in Q3’2023, with the y/y average capital appreciation coming in at 3.2%. Additionally, average prices per acre in the NMA slowed down to come in at Kshs 129.0 mn in Q3’2023, from Kshs 130.4 mn recorded in Q3’2022 attributable to uncertainty on future demand cycles given economic slowdown. The performance was supported by;
- Government’s continued emphasis on infrastructural development such as roads, railways, water and sewer lines which has improved and opened up areas for investment, ultimately increasing property prices,
- Limited supply of land especially in urban areas which has contributed to exorbitant prices,
- Increased construction activities particularly in the residential sector fueled by the government’s affordable housing agenda, private sector initiatives in trying to curb the housing deficit and individuals homeownership demands, in addition to increased developments in other segments in Real Estate sector thus boosting demand for land upwards, and,
- Positive demographics driving demand for land upwards, facilitated by high population and urbanization growth rates of 1.9% and 3.7%, which are above the global averages of 0.9% and 1.6% respectively.
Overall Performance: Un-serviced land in the satellite towns of Nairobi recorded the highest y/y capital appreciation of 9.0% mainly due to; i) the areas improved accessibility benefitting from infrastructural developments such as the Nairobi Expressway and the expansion of the Eastern Bypass, ii) affordability of land prices enticing buyers and investors, and, iii) high land prices within Nairobi commercial zones. Notably, average land prices per acre in Nairobi commercial zones registered significant price corrections owing to their high prices weighing down on demand. The table below shows the overall performance of the sector across all land sub-sectors during Q3’2023;
|
Price in Kshs Per Acre |
|||
|
Cytonn Report: Summary of the Performance Across All regions Q3’2023 |
|||
|
|
Q3'2022 |
Q3'2023 |
Annualized Capital Appreciation |
|
Un-serviced land - Satellite Towns |
15.2 mn |
16.4 mn |
9.0% |
|
Serviced Land - Satellite Towns |
15.9 mn |
18.3 mn |
8.7% |
|
Nairobi High End Suburbs (Low- and High-Rise Areas) |
134.8 mn |
135.7 mn |
2.4% |
|
Nairobi Middle End Suburbs- High Rise Residential Areas |
84.2 mn |
82.3 mn |
(1.2%) |
|
Nairobi Suburbs- Commercial Areas |
402.1 mn |
392.5 mn |
(2.6%) |
|
Average |
130.4 mn |
129.0 mn |
3.2% |
Source: Cytonn Research
Sub-markets Performance - For the satellite areas, Juja, Ruiru and Athi River were the best performing nodes both with 15.5%, 12.22% and 11.4% year-on-year (y/y) capital appreciations owing to: i) improved infrastructure developments enhancing accessibility, and high concentration of tertiary learning institutions such as colleges, Technical and Vocational Education and Training (TVETs), and campuses around and within the areas. On the other hand, Nairobi commercial zones recorded a 2.6% price correction mainly on the back of declined demand owing to high land prices. The average asking prices per acre coming in at Kshs 392.5 mn, which is significantly higher than the market average of Kshs 129.0 mn. Furthermore, areas such as Kilimani are increasingly becoming congested due to relaxed zoning regulations, occasioning frequent traffic snarl-ups rendering them inconvenient and difficult to access. The table below shows NMA’s land performance by submarkets in Q3’2022;
|
Price in Kshs per Acre |
|||
|
Cytonn Report: Nairobi Metropolitan Area Land Performance By Submarkets – Q3’2023 |
|||
|
Location |
Price Q3'2022 |
Price Q3'2023 |
Capital Appreciation |
|
Satellite Towns - Unserviced Land |
|||
|
Juja |
13.0 mn |
15.0 mn |
15.5% |
|
Athi River |
4.7 mn |
5.2 mn |
12.2% |
|
Limuru |
21.7 mn |
23.5 mn |
8.3% |
|
Rongai |
20.3 mn |
21.4 mn |
5.5% |
|
Utawala |
16.1 mn |
16.7 mn |
3.5% |
|
Average |
15.2 mn |
16.4 mn |
9.0% |
|
Satellite Towns - Serviced Land |
|||
|
Ruiru & Juja |
25.2 mn |
28.1 mn |
11.4% |
|
Syokimau |
15.5 mn |
17.2 mn |
11.1% |
|
Ruai |
11.3 mn |
12.5 mn |
10.4% |
|
Rongai |
17.8 mn |
19.1 mn |
7.2% |
|
Athi River |
14.0 mn |
14.4 mn |
3.2% |
|
Average |
16.8 mn |
18.3 mn |
8.7% |
|
Nairobi High End Suburbs (Low and High Rise Areas) |
|||
|
Runda |
82.2 mn |
87.9 mn |
6.9% |
|
Kitisuru |
90.4 mn |
95.0 mn |
5.0% |
|
Spring Valley |
168.7 mn |
176.5 mn |
4.6% |
|
Ridgeways |
86.0 mn |
87.0 mn |
1.2% |
|
Karen |
65.2 mn |
65.7 mn |
0.9% |
|
Kileleshwa |
316.2 mn |
301.9 mn |
(4.5%) |
|
Average |
134.8 mn |
135.7 mn |
2.4% |
|
Nairobi Middle End Suburbs – High Rise Residential Areas |
|||
|
Kasarani |
77.6 mn |
82.2 mn |
6.0% |
|
Embakasi |
76.6 mn |
79.2 mn |
3.3% |
|
Dagoretti |
98.4 mn |
85.6 mn |
(13.0%) |
|
Average |
84.2 mn |
82.3 mn |
(1.2%) |
|
Nairobi Suburbs - Commercial Zones |
|||
|
Upperhill |
461.3 mn |
458.1 mn |
(0.7%) |
|
Westlands |
420.3 mn |
413.2 mn |
(1.7%) |
|
Kilimani |
384.7 mn |
375.9 mn |
(2.3%) |
|
Riverside |
342.1 mn |
323.0 mn |
(5.6%) |
|
Average |
402.1 mn |
392.5 mn |
(2.6%) |
Source: Cytonn Research
We retain a POSITIVE outlook for the land sector in the NMA which has consistently demonstrated its resilience affirming its position as a reliable investment opportunity. We expect that the sector's performance will be driven by several key factors including; i) increased demand for land for development supported by positive population demographics, ii) ongoing government initiatives to streamline land transactions leading to a more efficient and accessible market, iii) notable increase in the initiation and completion of affordable housing projects owing to both government and private sector involvement, and, iv) rapid expansion of satellite towns, coupled with substantial infrastructural developments resulting in higher property prices.
- Infrastructure
Notable highlights during Q3’2023 included;
- CPF Financial Services, a leading provider of innovative financial services in Kenya and Africa Finance Corporation (AFC) signed a memorandum of understanding to jointly collaborate on infrastructure investments within the country. The agreement will see CPF make an equity investment of an undisclosed value in AFC, a move aimed at diversifying its investments from traditional asset classes, and strengthening its infrastructure investments portfolio. Under the partnership, the two entities will collaborate in identifying, developing and co-financing infrastructure projects which are in line with Kenya’s development roadmap, leveraging their combined technical expertise and access to both global and domestic capital. For more information, see our Cytonn Weekly #36/2023, and,
- Superior Homes, a Kenyan- based housing developer broke ground for the construction of its first modern roadside stopover facility at Sultan Hamud town along the busy Nairobi – Mombasa highway. The Kshs 350.0 mn complex, which will also serve as a pilot project, is part of a partnership project between Superior Homes and Northern Corridor Transit and Transport Coordination Authority (NCTTA) in developing 30 service and rest point areas dubbed ‘SupaStop’. The rest points will strategically be located along various busy transit routes frequented by long-distance truckers traversing the country to neighbouring landlocked countries. For more information, see our Cytonn Monthly- August 2023.
We expect the infrastructure sector in Kenya to continue playing a crucial role in promoting economic activities, which in turn will drive the growth and performance of the Real Estate sector, with better and improved road, railway and air transport networks, and other support facilities that make it easier for delivery of people, goods, and services efficiently, thereby increasing demand for Real Estate properties. Additionally, the government increased the budgetary allocation to the infrastructure sector by 16.9% to Kshs 286.6 bn in FY’2023/2024, from Kshs 245.1 bn in FY’2022/2023, with key focus in development and maintenance of major roads and bridges across the country, extension of the Standard Gauge Railway (SGR) to Kisumu and Isiolo, development of the Dongo Kundu Special Economic Zone, development of Nairobi Railway City, and construction of airports, airstrips and a Kshs 1.3 bn modern cruise ship terminal in Mombasa. Additionally, the government is actively pursuing the completion of major infrastructure projects that were previously halted by the current regime, signalling renewed commitment to infrastructural developments. Such projects include the dualling of Rironi-Mau Summit Highway at a cost of Kshs 180.0 bn, Kenol-Sagana-Marua highway Phase 3 and 4 at a cost of Kshs 8.0 bn, and the Eastern Bypass Highway Phase 2, that have received financial injection by the African Development Bank (AfDB). As a result, we expect boost in development of more habitable areas for settlements and increased developments of Real Estate in the new upcoming regions across the country. Additionally, we expect both the local and national governments to continuously foster strategic partnership with other public transport agencies, and major stakeholders within and beyond the infrastructure sector. These collaborations will extend beyond road construction and encompass the development of supporting facilities with standardized and quality amenities that are poised to serve as hubs for road safety awareness campaigns, promoting a culture of safe driving.
- Industrial Sector
During Q3’2023, notable highlights in the sector included;
- Tatu City Limited, Chandaria Properties, M&T Construction and Steel Structures broke ground for the construction of ‘The Link’, a warehousing and logistics park, located in Tatu City, Kiambu County. The facility will offer quality warehouse spaces ranging across 800 SQM to 8,000 SQM, targeting Small and Medium Enterprise (SME) businesses in the Tatu City Special Economic Zone (SEZ). For more information, please see our Cytonn Weekly #30/2023, and,
- During the week, Kenya Electricity Generating Company (KenGen), government energy and electricity generating company, and Konza Technopolis Development Authority (KoTDA), government agency overseer of the Konza Technopolis development and management, broke ground for KenGen’s Green Energy Park in Olkaria, Naivasha. The industrial park project, spanning 342.0 hectares, is estimated to be developed at a cost of USD 884.0 mn (Kshs 128.4 bn). The park aims to attract a diverse range of businesses, including small, medium, and large enterprises involved in the production of fertilizers, iron, steel, plastics, packaging, fabricated metal and wood products, food and beverages, textiles, and apparel. For more information, please see our Cytonn Monthly- August 2023.
We anticipate substantial growth and development in the industrial sector in 2023 supported by; i) increased business operations in the post-election and post-COVID-19 period, ii) the government's accelerated focus on exporting agricultural and horticultural products to the international market, with aim to improve the quantity, quality, efficiency, and reliability of Kenya-farmed produce thereby increasing the country’s competitiveness, iii) increased demand for cold storage facilities for perishable agricultural produces for export and drugs and vaccines whose demand is supported by the Universal Health Coverage program initiated by the government and private and Non-Governmental health organizations, iv) Kenya being recognized as a regional hub hence attracting investments exhibited by entry, expansions, mergers and acquisitions of more foreign manufacturing entities such as CFAO Motors, Taifa Gas, Unilever East Africa, Safic-Alcan, Globeleq, and many more, v) increased demand for data centres by both the government and private-sector firms driven by continued increase in demand for data protection services in line with the Data Protection Act 2019 requiring personal data to be stored in servers or data centres located within Kenya’s borders, vi) increased foreign investments in Kenya’s information and communication sector such as Huawei and Toshiba in collaboration with private communication firms such as Safaricom, Jamii Telkom Limited and the public sector through the Ministry of Information and Communication Technology unveiling several units for data protection services and free internet provision within the country. This is in line with governments ambition of enhancing digital superhighway across the country through its Bottom Up Economic Transformation Agenda (BETA) and the country hosting several international and regional ICT companies, such as Microsoft, IBM, Google, and Facebook, and, vii) increased demand of e-commerce warehouses in the retail sector driven by the rising demand for space to store goods meant for delivery to clients across the country, as more people shift towards home delivery as a convenient and efficient way to purchase goods. However, the prolonged stalling of development of infrastructure such as roads, water and electricity within industrial parks and in most towns continues to hamper optimum development and investments in the industrial sector.
Additionally, there are significant initiatives at both the national and county levels in Kenya aimed at boosting economic growth, particularly in the manufacturing and agriculture sectors. These initiatives involve collaboration between the National Government, County Governments, private sector partners, development organizations, and the United Nations Industrial Development Organization (UNIDO).
Since August 2023, these entities have been actively working together to implement the County Aggregation and Industrial Parks (CAIP) in the 47 Counties across the country. This project is a joint effort between the National Government, the Council of Governors, and County Governments the National Government through the Ministry of Investment, Trade and Industry and County Governments in partnership with private sector, development partners and United Nation Industrial Development Organization (UNIDO). The programme is expected to grow manufacturing and investments through Agro-Industries and enhance productivity of agriculture sector in a sustainable manner hence creating inclusive decent jobs, increase farmers’ income; increase foreign exchange through Foreign Direct Investments (FDIs), provide platform where farmers, processors, exporters, research institutions, industrial bodies and Government can engage for agro-industrial development. Upon completion, each CAIP will be tailored to harness the unique potential and resources of the respective counties, with a focus on maximizing value addition to the products offered by each region. The overarching goal is to accelerate inclusive and sustainable industrial development that will have a positive impact on the country's overall economic growth.
- Statutory Review
We continue to anticipate that both the national and county governments will continue to make adjustments to their legal policies and introduce new regulations to enhance transparency, efficiency, compliance, and increased transactions in the Real Estate sector. These efforts aim to strengthen Kenya's competitive advantage in the region for Real Estate investments. Furthermore, the recently assented Finance Act 2023 to law, is expected to stimulate activities in the residential sector such as; i) The government will secure the essential capital needed to finance nationwide affordable housing projects, with the goal of addressing the significant housing deficit, currently estimated at approximately 80.0%, ii) encouraging collaborations and partnerships between the government and private developers, further boosting the supply of affordable housing in the country, iii) incentives outlined in the act will also support the private sector's efforts to construct affordable housing units and price them within reach of Kenyan homeowners, iv) generating employment opportunities, increase incomes of those in the construction sector and development, and overall economic growth of both individuals and the country as a whole, and, v) help reducing housing inequalities and improving social equity by bridging the gap between different income groups by providing housing options for low- and middle-income individuals and families.
However, it is worth noting that certain policies, such as the new Capital Gains Tax (CGT) rates, could potentially have adverse effects on the attractiveness of Kenya's Real Estate sector. These effects may include reduced property transaction volumes, limited investments due to increased merger and acquisition costs, and a slight decrease in foreign investments. Consequently, some investors may opt to divert their investments to other countries in the region with lower CGT rates.
- Regulated Real Estate Funds
- Real Estate Investment Trusts (REITs)
In the Nairobi Securities Exchange, ILAM Fahari I-REIT closed the week trading at an average price of Kshs 7.5 per share, marking it the last day for ILAM Fahari I-REIT to trade in the NSE Main Market Segment. The performance represented a 1.6% increase from Kshs 7.4 per share recorded the previous week, taking it to a 10.9% Year-to-Date (YTD) growth from Kshs 6.8 per share recorded on 3 January 2023. Additionally, the performance represented a 62.4% Inception-to-Date (ITD) loss from the Kshs 20.0 price. The dividend yield currently stands at 8.6%. The graph below shows Fahari I-REIT’s performance from November 2015 to 06 October 2023;
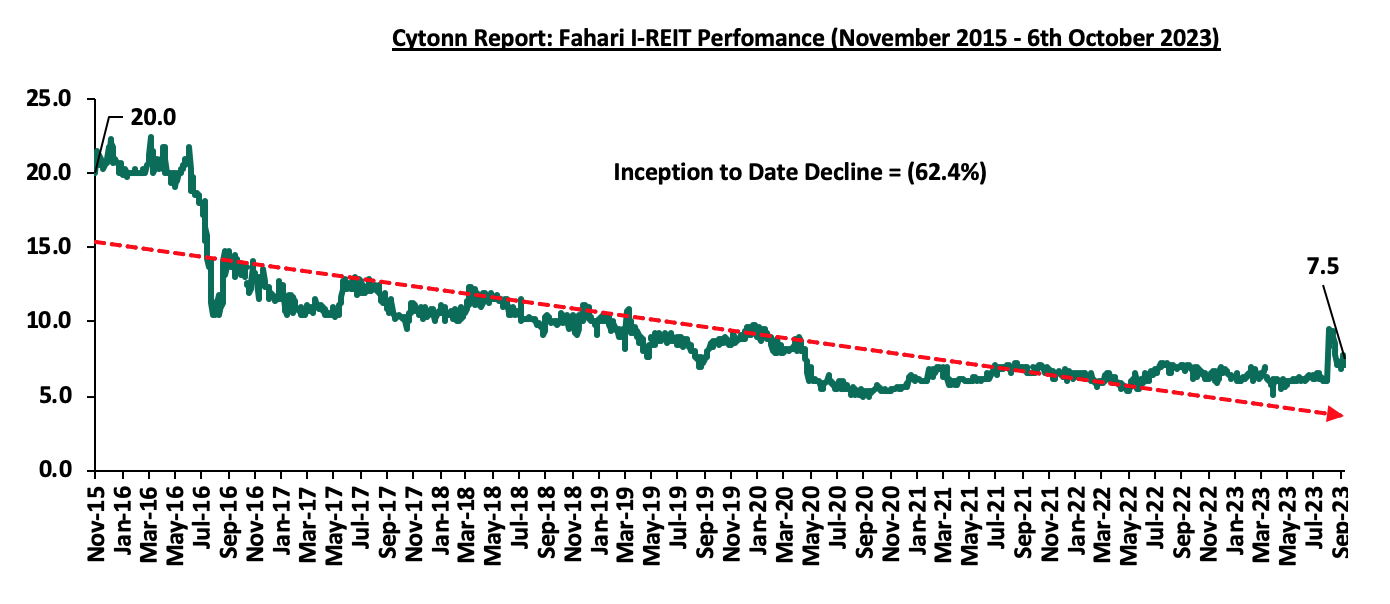
On the Unquoted Securities Platform, Acorn D-REIT and I-REIT traded at Kshs 25.3 and Kshs 21.7 per unit, respectively, as at 29 September 2023. The performance represented a 26.6% and 8.2% gain for the D-REIT and I-REIT, respectively, from the Kshs 20.0 inception price. The volumes traded for the D-REIT and I-REIT came in at 12.3 mn and 30.6 mn shares, respectively, with a turnover of Kshs 257.5 mn and Kshs 632.1 mn, respectively, since inception in February 2021.
- Cytonn High Yield Fund (CHYF)
Cytonn High Yield Fund (CHYF) closed the week with an annualized yield of 16.0% which was 1.3% points higher than the 14.7% annualized yield recorded the previous week. The performance also represented a 2.1% points Year-to-Date (YTD) increase from 13.9% yield recorded on 1 January 2023, and 0.3% points Inception-to-Date (ITD) increase from the 15.7% yield. The graph below shows Cytonn High Yield Fund’s performance from November 2019 to 06 October 2023;
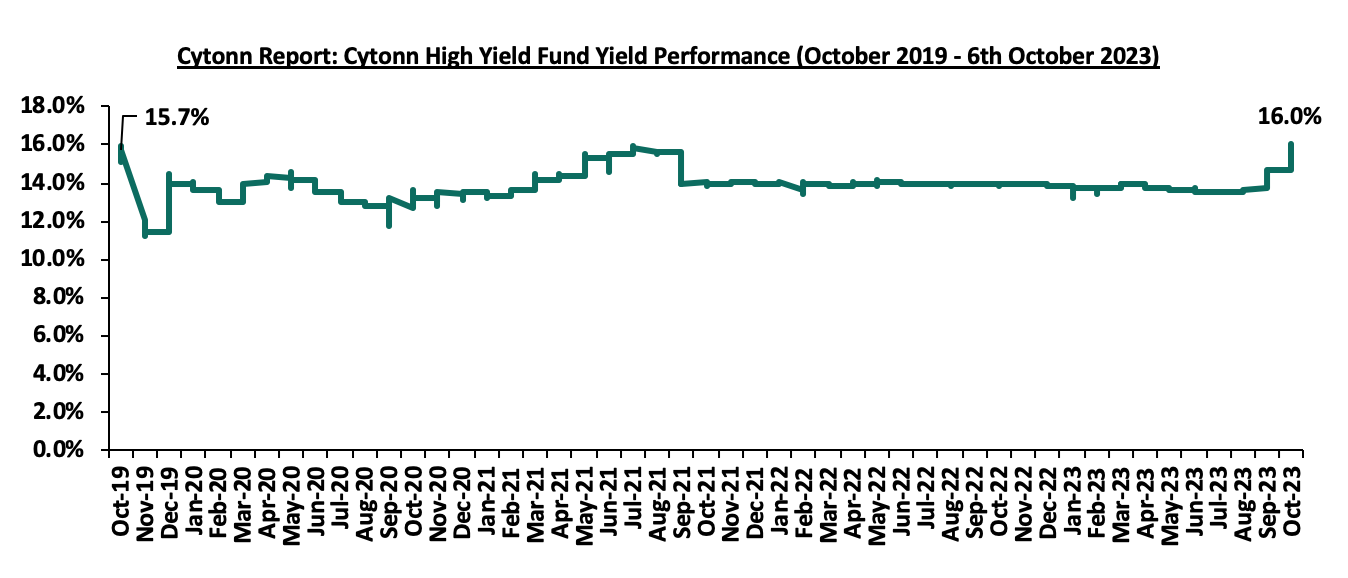
Notably, the CHYF has outperformed other regulated Real Estate funds with an annualized yield of 16.0%, as compared to Fahari I-REIT and Acorn I-REIT with yields of 8.6%, and 2.8% respectively. As such, the higher yields offered by CHYF makes the fund one of the best alternative investment resource in the Real Estate sector. The graph below shows the yield performance of the Regulated Real Estate Funds;
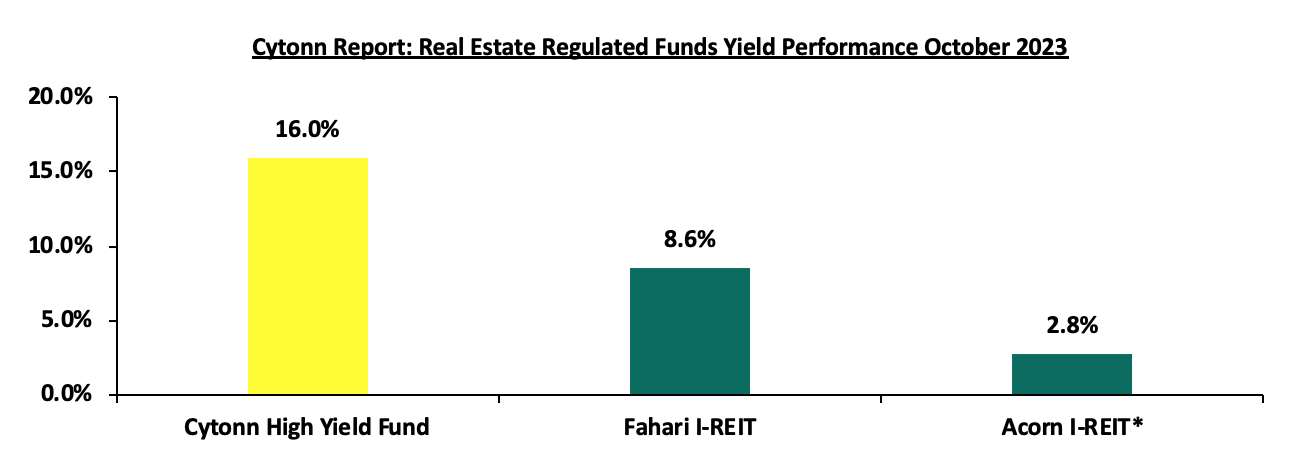
*H1’2023
Source: Cytonn Research
Notable highlights during Q3’2023 include;
- During the week, the Capital Markets Authority (CMA) gave its approval for the conversion of ILAM Fahari Income Real Estate Investment Trust (REIT) from the Unrestricted Main Market segment of the Nairobi Securities Exchange (NSE) into the Restricted Market Segment through a Conversion Offering Memorandum. Under the conversion process, 36,585,134 units held by retail investors also known as non-professional investors, worth below Kshs 5.0 mn will redeem their shares at Kshs 11.0 per unit to ICEA Lion Asset Management Limited. The proposed conversion is part of the ongoing strategic restructuring of the property fund. The offer is set to commence on September 6, 2023, and will conclude on October 6, 2023. For more information, see our Cytonn Monthly- August 2023.
Despite these benefits and the gradual growth in the sector, REITs have struggled to achieve significant performance due to various obstacles such as; i) lack of sufficient investor awareness regarding the potential of REITs as an investment tool, ii) lengthy approval procedures for establishing REITs have hindered their formation and deployment in the market, iii) high minimum capital requirement of Kshs 100.0 mn for trustees which restricts the involvement of non-bank entities in the role of trustees, and, iv) steep minimum investment amount of Kshs 5.0 mn discourages potential investors from engaging in REITs.
On the other hand, the introduction of LAPTRUST Imara I-REIT on the Nairobi Securities Exchange (NSE), the establishment of the Kenya National REIT (KNR), and the launch of the Vuka Investment Platform towards the end of 2022 are poised to bring about positive changes in Kenya's capital markets. These initiatives, in addition to the existing REIT institutions, offer several advantages. These advantages include accessing additional sources of capital, diversifying investment portfolios, generating consistent and long-term returns, enjoying tax exemptions, ensuring transparency, promoting liquidity, and offering flexibility as an asset class.
Additionally, we expect reduced activities in the industry as all REIT platforms are at a cautionary undertaking of their businesses by not actively engaging in open trading of their shares on the NSE. This may also involve restrictions on offering interim or final dividends to existing investors, as analyzed in our Kenya’s Real Estate Investments Trusts (REITS) H1’2023 Report. Instead, we expect the REITs will focus on long-term capital growth, portfolio development in Real Estate, stabilization of earnings, and acquiring more investments before considering re-entering the main market segment of NSE. Furthermore, the restriction limiting only high-net-worth individuals to buying shares contradicts a proposal made by the CMA to reduce the minimum investment for entering the market from Kshs 5.0 mn to Kshs 10,000, thereby hindering investment decisions for many small-scale retail investors who would otherwise be attracted to invest in Kenyan REITs market.
Disclaimer: The views expressed in this publication are those of the writers where particulars are not warranted. This publication, which is in compliance with Section 2 of the Capital Markets Authority Act Cap 485A, is meant for general information only and is not a warranty, representation, advice or solicitation of any nature. Readers are advised in all circumstances to seek the advice of a registered investment advisor.

- Talk to us
- Kenya
- P.O Box 20695 - 00200, Nairobi, Kenya
- Cell +254709101200
- Tel +254709101200
- WhatsApp +254741676635
- United States
- +254709101200
- DOWNLOAD OUR APP
-


- Kenya
- 8th Floor, Pinetree Plaza, Kaburu Drive, Ngong Road, Nairobi, Kenya
- USA
- Suite 1150, 1775 Eye Street NW, USA, Washington DC 20006, USA
- Investments
- High Yield
- Private Equity
- Real Estate
- Real Estate
- RiverRun Estates
- Cytonn Towers
- The Ridge
- Taraji Heights
- The Alma