Review of Kenya’s Public Debt 2024, & Cytonn Weekly #30/2024
By Research Team, Jul 28, 2024
Executive Summary
Fixed Income
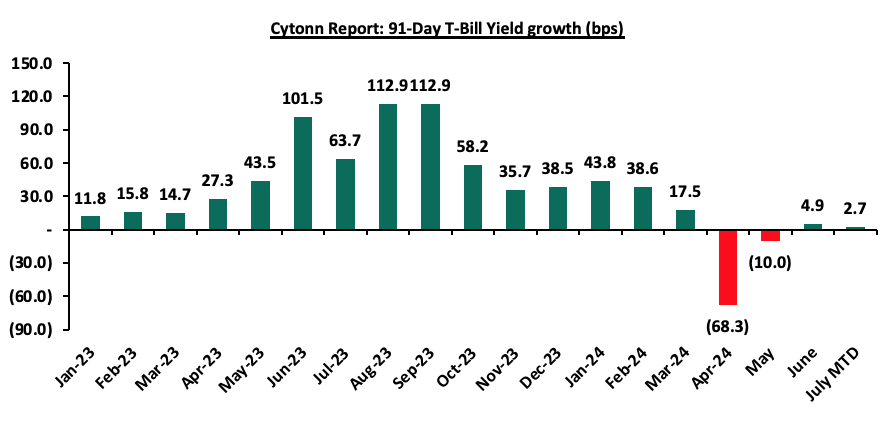
During the week, T-bills were oversubscribed, with the overall oversubscription rate coming in at 131.9%, a reversal from the undersubscription rate of 87.4% recorded the previous week. Investors’ preference for the shorter 91-day paper persisted, with the paper receiving bids worth Kshs 25.8 bn against the offered Kshs 4.0 bn, translating to an oversubscription rate of 645.3%, higher than the oversubscription rate of 272.1% recorded the previous week. The subscription rates for the 182-day and 364-day papers decreased to 41.5% and 16.9% respectively from the 72.6% and 28.4% respectively recorded the previous week. The government accepted a total of Kshs 22.9 bn worth of bids out of Kshs 31.6 bn bids received, translating to an acceptance rate of 72.5%. The yields on the government papers recorded a mixed performance, with the yields on the 364-day paper increasing by 2.4 bps to 16.92% from the 16.90% recorded the previous week, while the yields on the 182-day and 91-day papers decreased by 0.2 bps and 2.2 bps to 16.85% and 16.00% respectively from 16.85% and 16.02% respectively recorded the previous week;
In the primary bond market, the government is looking to raise Kshs. 50 bn through the reopened infrastructure bonds IFB1/2023/6.5 with a tenor to maturity of 5.8 years and IFB1/2023/17 with a tenor to maturity of 15.7 years. The bonds will be offered at fixed coupon rates of 17.9% and 14.4% for the IFB1/2023/6.5 and IFB1/2023/17 respectively. Given the current market conditions and the recent bond issues, we expect the average rate of accepted bids for the two bonds to come in at a range of 17.85%-17.95% for the IFB1/2023/6.5 and 14.45%-14.85% for the IFB1/2023/17;
During the week, Cameroon announced the issuance of a USD 550.0 mn Eurobond with a tenor of 7 years at a coupon rate of 9.5% and a yield of 10.75%, becoming the fifth country in the Sub-Saharan Africa (SSA) region, following Ivory Coast, Benin, Senegal, and Kenya to tap into the international capital markets in 2024. The bond was undersubscribed, with the undersubscription rate coming in at 98.9%, receiving USD 550.0 mn (332.2 bn CFA Francs) of the CFA 336.0 bn offered initially. The issuance was conducted through a private placement, with Citigroup Global Markets Ltd serving as the sole placement agent and arranger alongside Cygnum Capital Middle East;
Also, we are projecting the y/y inflation rate for June 2024 to come in at the range of 4.7% - 5.0% mainly on the back of the weakening of the Kenya Shilling against the US Dollar having recorded a 2.4% month-to-date decline to Kshs 132.6 as of 26th July 2024 from the Kshs 129.5 recorded at the beginning of the month, a contrast to the 0.5% gain recorded last month and the 15.6% year-to-date gain from the Kshs 157.0 recorded at the beginning of the year;
Equities
During the week, the equities market was on a downward trajectory, with NASI being the biggest decliner by 4.0% while NSE 10, NSE 25, and NSE 20 declined by 3.4%, 3.1%, and 1.6% respectively, taking the YTD performance to gains of 19.5%, 17.2%, 13.3%, and 11.0% for NSE 10, NSE 25, NASI, and NSE 20 respectively. The equities market performance was driven by losses recorded by large-cap stocks such as Safaricom, KCB, and Equity of 8.2%, 7.3%, and 3.4% respectively. The performance was, however, supported by gains recorded by large-cap stocks such as DTBK and Bamburi of 0.8% and 0.4% respectively;
During the week, British American Tobacco Kenya Plc released their H1’2024 financial results, recording a 24.3% decline in Profits after Tax (PAT) to Kshs 2.1 bn, from Kshs 2.8 bn recorded in H1’2023. The decline in PAT was majorly attributed to the 6.5% decrease in Gross Sales to Kshs 19.6 bn in H1’2024 from Kshs 21.0 bn recorded in H1’2023;
Real Estate
During the week, Faulu Microfinance Bank, a subsidiary of Old Mutual Group, announced a range of innovative financial solutions including unsecured loans, customized financial packages for property improvement, and payment plans aligned with rental income cycles aimed at addressing gaps in service access for landlords, agents, and other stakeholders in Real Estate development and management;
Additionally, Megna Homes, a Mombasa-based developer announced plans for the construction of a modern 816-unit gated community project in Kisauni. The project dubbed ‘Santana’ is set to be launched in August 2024 and is expected to be complete by the end of 2 years at Kwa Sonko in Bakarani along the Old Mombasa-Malindi Road;
On the Unquoted Securities Platform, Acorn D-REIT and I-REIT traded at Kshs 24.5 and Kshs 22.0 per unit, respectively, as per the last updated data on 26th July, 2024. The performance represented a 22.5% and 10.0% gain for the D-REIT and I-REIT, respectively, from the Kshs 20.0 inception price. Additionally, ILAM Fahari I-REIT traded at Kshs 11.0 per share as of 26th July, 2024, representing a 45.0% loss from the Kshs 20.0 inception price;
Focus of the Week
Kenya is one of the fastest growing economies in Sub-Saharan Africa, having registered a growth rate of 5.0% in the first quarter of 2024. Despite being one of the fastest growing economies in Sub-Saharan Africa with a projected economic growth rate of 5.0%, above the region’s average of 3.7%, Kenya is grappling with a high debt burden, facing elevated risk of debt distress and significant challenges in managing its public debt, which has increased rapidly in recent years. As per the latest data from the Central Bank of Kenya (CBK), the total public debt stood at Kshs 10.6 tn as of June 2024, compared to Kshs 10.3 tn recorded in June 2023. Notably, external debt reduced by 5.2% during the period to Kshs 5.2 tn in March 2024, from 5.4 tn in June 2023 attributable to the early partial repayment of the USD 2.0 bn Eurobond in February 2024. Consequently, the debt to GDP ratio has increased to 70.0% as of June 2024, 20.0% points higher than the International Monetary Fund (IMF) threshold of 50.0% for developing countries, though slightly down from the 70.8% recorded in June 2023. The rising public debt has raised concerns about its sustainability and implications for fiscal and macroeconomic stability. These concerns have seen credit rating agencies such as Fitch, Moody’s, and S&P Global maintaining Kenya’s credit outlook at negative, resulting in higher borrowing costs in the international market. Notably, earlier this month, Moody’s downgraded Kenya’s credit score by one scale to Caa1, from B3 on the back of the country’s inability to implement its fiscal consolidation measures focused on revenue, which are necessary to reduce overall debt. Additionally, S&P Global has scheduled a review on 23rd August 2024 to decide on Kenya’s sovereign credit rating. The firm may either downgrade Kenya’s B credit score to B- or maintain the current rating but keep it on downgrade warning with a negative outlook. S&P Global is adopting a wait-and-see approach to gain more clarity on the appropriation bill, spending allocations, the final budget, and the finance bill. With the withdrawal of the planned tax increases, Kenya’s government faces the challenge of prolonged fiscal deficits, which could further deteriorate the government’s public debt situation and worsen the debt vulnerability of Kenya. Consequently, in this week’s topical, we shall focus on the current status of Kenya’s public debt as at the end of FY’2023/2024. We shall also give our outlook on the country’s debt sustainability;
Investment Updates:
- Weekly Rates:
- Cytonn Money Market Fund closed the week at a yield of 18.40% p.a. To invest, dial *809# or download the Cytonn App from Google Play store here or from the Appstore here;
- We continue to offer Wealth Management Training every Monday, from 10:00 am to 12:00 pm. The training aims to grow financial literacy among the general public. To register for any of our Wealth Management Trainings, click here;
- If interested in our Private Wealth Management Training for your employees or investment group, please get in touch with us through wmt@cytonn.com;
- Cytonn Insurance Agency acts as an intermediary for those looking to secure their assets and loved ones’ future through insurance namely; Motor, Medical, Life, Property, WIBA, Credit and Fire and Burglary insurance covers. For assistance, get in touch with us through insuranceagency@cytonn.com;
- Cytonn Asset Managers Limited (CAML) continues to offer pension products to meet the needs of both individual clients who want to save for their retirement during their working years and Institutional clients that want to contribute on behalf of their employees to help them build their retirement pot. To more about our pension schemes, kindly get in touch with us through pensions@cytonn.com;
Hospitality Updates:
- We currently have promotions for Staycations. Visit cysuites.com/offers for details or email us at sales@cysuites.com;
Money Markets, T-Bills Primary Auction:
During the week, T-bills were oversubscribed, with the overall oversubscription rate coming in at 131.9%, a reversal from the undersubscription rate of 87.4% recorded the previous week. Investors’ preference for the shorter 91-day paper persisted, with the paper receiving bids worth Kshs 25.8 bn against the offered Kshs 4.0 bn, translating to an oversubscription rate of 645.3%, higher than the oversubscription rate of 272.1% recorded the previous week. The subscription rates for the 182-day and 364-day papers decreased to 41.5% and 16.9% respectively from the 72.6% and 28.4% respectively recorded the previous week. The government accepted a total of Kshs 22.9 bn worth of bids out of Kshs 31.6 bn bids received, translating to an acceptance rate of 72.5%. The yields on the government papers recorded a mixed performance, with the yields on the 364-day paper increasing by 2.4 bps to 16.92% from the 16.90% recorded the previous week, while the yields on the 182-day and 91-day papers decreased by 0.2 bps and 2.2 bps to 16.85% and 16.00% respectively from 16.85% and 16.02% respectively recorded the previous week:
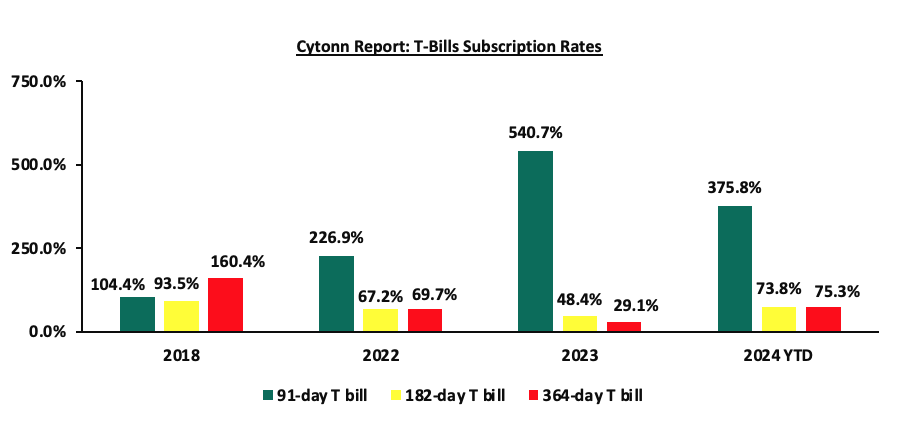
The chart below compares the overall average T-bill subscription rates obtained in 2018, 2022, 2023, and 2024 Year-to-date (YTD):
In the primary bond market, the government is looking to raise Kshs. 50 bn through the reopened infrastructure bonds IFB1/2023/6.5 with a tenor to maturity of 5.8 years and IFB1/2023/17 with a tenor to maturity of 15.7 years. The bonds will be offered at fixed coupon rates of 17.9% and 14.4% for the IFB1/2023/6.5 and IFB1/2023/17 respectively. Given the current market conditions and the recent bond issues, we expect the average rate of accepted bids for the two bonds to come in at a range of 17.85%-17.95% for the IFB1/2023/6.5 and 14.45%-14.85% for the IFB1/2023/17.
Money Market Performance:
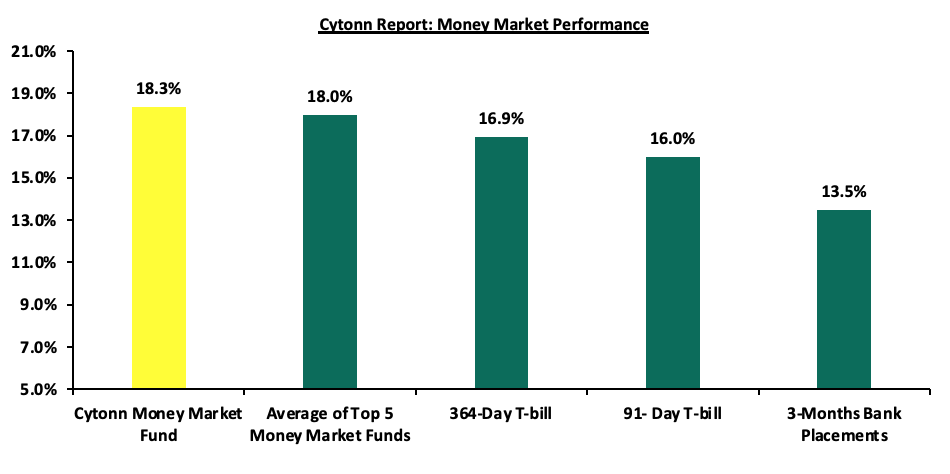
In the money markets, 3-month bank placements ended the week at 13.5% (based on what we have been offered by various banks), and the yields on the government papers recorded a mixed performance, with the yields on the 364-day paper increasing by 2.4 bps to remain relatively unchanged at 16.9% recorded the previous week, while the yields on the 91-day paper decreased by 2.2 bps to remain unchanged at 16.0% recorded the previous week. The yields on the Cytonn Money Market Fund increased marginally by 4.0 bps to close the week at 18.3% remaining relatively unchanged from last week, while the average yields on the Top 5 Money Market Funds increased by 8.4 bps to 18.0% from 17.9% recorded the previous week.
The table below shows the Money Market Fund Yields for Kenyan Fund Managers as published on 26th July 2024:
|
Cytonn Report: Money Market Fund Yield for Fund Managers as published on 26th July 2024 |
||
|
Rank |
Fund Manager |
Effective Annual Rate |
|
1 |
Etica Money Market Fund |
18.4% |
|
2 |
Cytonn Money Market Fund (Dial *809# or download the Cytonn App) |
18.3% |
|
3 |
Lofty-Corban Money Market Fund |
18.3% |
|
4 |
Kuza Money Market fund |
17.8% |
|
5 |
Arvocap Money Market Fund |
17.2% |
|
6 |
GenAfrica Money Market Fund |
16.9% |
|
7 |
Nabo Africa Money Market Fund |
16.7% |
|
8 |
GenCap Hela Imara Money Market Fund |
16.3% |
|
9 |
Jubilee Money Market Fund |
16.1% |
|
10 |
Enwealth Money Market Fund |
15.9% |
|
11 |
Co-op Money Market Fund |
15.6% |
|
12 |
Mayfair Money Market Fund |
15.6% |
|
13 |
Absa Shilling Money Market Fund |
15.5% |
|
14 |
Apollo Money Market Fund |
15.4% |
|
15 |
Madison Money Market Fund |
15.4% |
|
16 |
Sanlam Money Market Fund |
15.2% |
|
17 |
KCB Money Market Fund |
15.2% |
|
18 |
AA Kenya Shillings Fund |
15.1% |
|
19 |
Mali Money Market Fund |
15.1% |
|
20 |
Orient Kasha Money Market Fund |
14.7% |
|
21 |
Dry Associates Money Market Fund |
14.0% |
|
22 |
Equity Money Market Fund |
13.8% |
|
23 |
CIC Money Market Fund |
13.7% |
|
24 |
Old Mutual Money Market Fund |
13.5% |
|
25 |
British-American Money Market Fund |
13.5% |
|
26 |
ICEA Lion Money Market Fund |
13.4% |
Source: Business Daily
Liquidity:
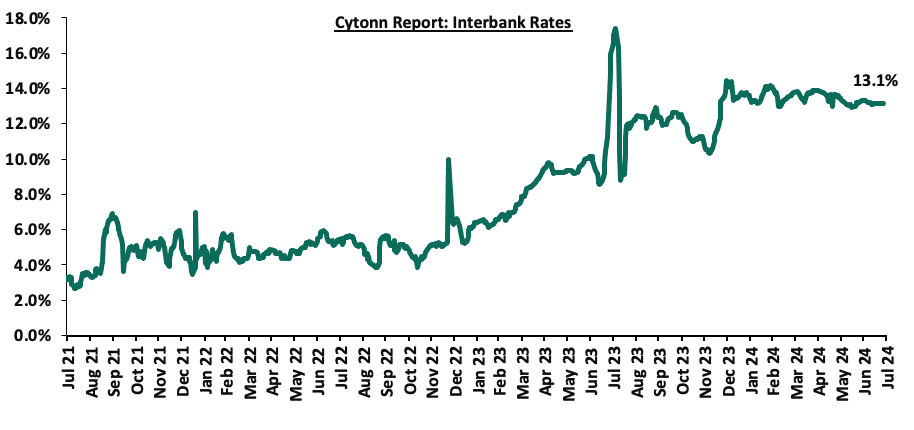
During the week, liquidity in the money markets marginally tightened, with the average interbank rate increasing by 0.6 bps, to 13.2% from the 13.1% recorded the previous week, partly attributable to tax remittances that offset government payments. The average interbank volumes traded decreased by 9.9% to Kshs 24.3 bn from Kshs 26.9 bn recorded the previous week. The chart below shows the interbank rates in the market over the years:
Kenya Eurobonds:
During the week, the yields on Eurobonds were on an upward trajectory, with the yields on the 7-year Eurobond issued in 2019 increasing the most by 27.7 bps to 10.4% from 10.1% recorded the previous week. The table below shows the summary of the performance of the Kenyan Eurobonds as of 26th July 2024;
|
Cytonn Report: Kenya Eurobonds Performance |
||||||
|
|
2018 |
2019 |
2021 |
2024 |
||
|
Tenor |
10-year issue |
30-year issue |
7-year issue |
12-year issue |
13-year issue |
7-year issue |
|
Amount Issued (USD) |
1.0 bn |
1.0 bn |
0.9 bn |
1.2 bn |
1.0 bn |
1.5 bn |
|
Years to Maturity |
3.6 |
23.6 |
2.8 |
7.8 |
9.9 |
6.6 |
|
Yields at Issue |
7.3% |
8.3% |
7.0% |
7.9% |
6.2% |
10.4% |
|
1-Jan-24 |
9.8% |
10.2% |
10.1% |
9.9% |
9.5% |
|
|
1-Jul-24 |
10.6% |
11.1% |
10.3% |
11.0% |
11.0% |
11.1% |
|
18-Jul-24 |
10.4% |
10.8% |
10.1% |
10.8% |
10.7% |
10.8% |
|
22-Jul-24 |
10.3% |
10.8% |
10.1% |
10.6% |
10.8% |
10.8% |
|
23-Jul-24 |
10.3% |
10.6% |
10.0% |
10.6% |
10.6% |
10.7% |
|
24-Jul-24 |
10.5% |
10.6% |
10.1% |
10.8% |
10.6% |
10.7% |
|
25-Jul-24 |
10.5% |
10.8% |
10.4% |
10.8% |
10.8% |
10.9% |
|
Weekly Change |
0.1% |
0.1% |
0.3% |
0.1% |
0.1% |
0.1% |
|
MTD Change |
(0.0%) |
(0.2%) |
0.0% |
(0.2%) |
(0.2%) |
(0.2%) |
|
YTD Change |
0.7% |
0.7% |
0.3% |
0.9% |
1.3% |
10.9% |
Source: Central Bank of Kenya (CBK) and National Treasury
Kenya Shilling:
During the week, the Kenya Shilling depreciated against the US Dollar by 1.6%, to close at Kshs 132.6, from Kshs 130.5 recorded the previous week. On a year-to-date basis, the shilling has appreciated by 15.6% against the dollar, a contrast to the 26.8% depreciation recorded in 2023.
We expect the shilling to be supported by:
- Diaspora remittances standing at a cumulative USD 4,535.0 mn in the 12 months to June 2024, 12.9% higher than the USD 4,017.0 mn recorded over the same period in 2023, which has continued to cushion the shilling against further depreciation. In the June 2024 diaspora remittances figures, the US remained the largest source of remittances to Kenya accounting for 54.0% in the period, and,
- The tourism inflow receipts which came in at USD 352.5 bn in 2023, a 31.5% increase from USD 268.1 bn inflow receipts recorded in 2022, and owing to tourist arrivals that improved by 27.2% to 2.1 mn in the 12 months to March 2024, from 1.6 mn recorded during a similar period in 2023.
The shilling is however expected to remain under pressure in 2024 as a result of:
- An ever-present current account deficit which came at 3.2% of GDP in Q1’2024 from 3.0% recorded in Q1’2023, and,
- The need for government debt servicing, continues to put pressure on forex reserves given that 67.3% of Kenya’s external debt is US Dollar-denominated as of December 2023, and,
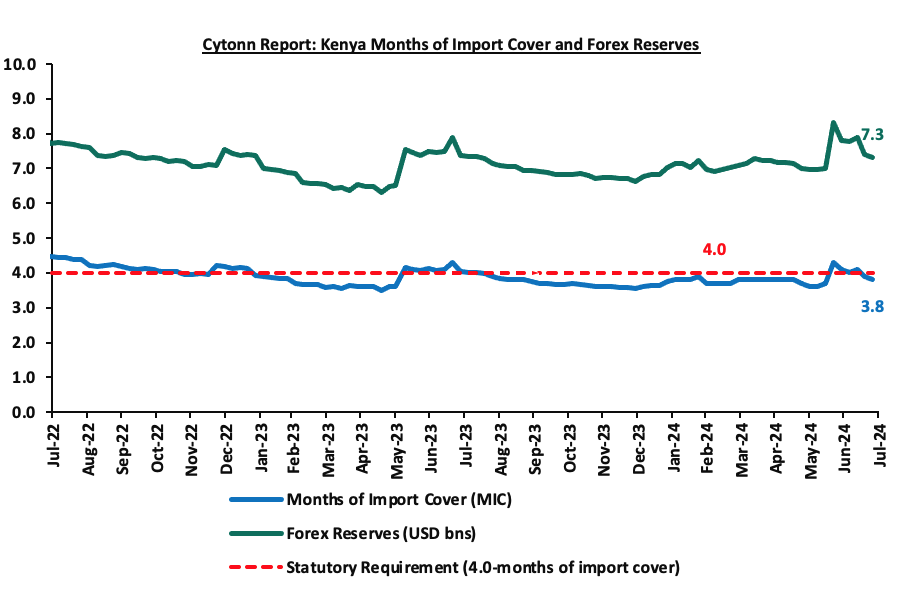
- Dwindling forex reserves currently at USD 7.3 bn (equivalent to 3.8-months of import cover), which is below the statutory requirement of maintaining at least 4.0-months of import cover, and also lower than the EAC region’s convergence criteria of 4.5-months of import cover.
Key to note, Kenya’s forex reserves decreased by 1.3% during the week to USD 7.3 bn, from the USD 7.4 bn recorded the previous week, equivalent to 3.8 months of import cover, a decrease from the 3.9 months recorded the previous week, and below the statutory requirement of maintaining at least 4.0-months of import cover. The chart below summarizes the evolution of Kenya's months of import cover over the years:
Weekly Highlights
- Cameroon’s USD 550.0 mn Eurobond Issue
On 23rd July 2024, Cameroon announced the issuance of a USD 550.0 mn Eurobond with a tenor of 7 years at a coupon rate of 9.5% and a yield of 10.75%, becoming the fifth country in the Sub-Saharan Africa (SSA) region to tap into the international capital markets in 2024. The issuance was conducted through a private placement, with Citigroup Global Markets Ltd serving as the sole placement agent and arranger alongside Cygnum Capital Middle East. A private placement refers to the sale of securities to a relatively small number of select investors as a way of raising capital. Investors involved in private placements are typically institutional investors such as banks, insurance companies, pension funds, and mutual funds, or high-net-worth individuals.
The bond was undersubscribed, with the undersubscription rate coming in at 98.9%, receiving USD 550.0 (332.2 bn CFA Francs) of the CFA 336.0 bn offered initially. The President authorized the Minister of Economy, Planning and Regional Development to borrow on the international capital markets an amount of 336.0 bn CFA francs, to finance the development projects provided for in the Finance Law of the Republic of Cameroon for the 2024 financial year, and to settle outstanding payments.
This issue follows issues by four other SSA countries earlier in the year. Ivory Coast tapped into the international capital markets on 24th January 2024successfully issuing two bonds with respective maturities of 8.5 years and 12.5 years and coupon rates of 7.65% and 8.25% respectively, maturing on 30th January 2033 and 30th January 2037 respectively. In addition, Benin issued its debut dollar bond with a tenor of 14 years at a coupon rate of 8.375% on February 6th 2024. In addition, Kenya also successfully issued a USD 1.5 bn Eurobond with a tenor of 6 years at a coupon rate of 9.75% on February 30th 2024. On June 6th 2024, Senegal followed suit by issuing a USD 750.0 mn Eurobond with a maturity of 7 years and a coupon rate of 7.75%.
Notably, Cameroon’s issuer ratings according to Moody’s, S&P Global, and Fitch stand at Caa1 (stable), CCC+ (stable), and B (negative) respectively, indicating that the country is considered a high credit risk by these ratings agencies, with a significant chance of default on its debt obligations.
The table below shows comparison between Cameroon’s issue and the other four issues in the Sub-Saharan Africa region;
|
Cytonn Report: Comparison Between Cameroon Issue and Sub-Saharan Peers |
|||||||
|
Fitch Rating's Long-Term Foreign-Currency Issuer Default Rating (IDR) |
2024 Eurobond Issues |
||||||
|
Country |
IDR Credit Rating |
IDR Credit Outlook |
Date |
Value (USD mn) |
Tenor (Years) |
Coupon Rate |
Yield at issuance |
|
Ivory Coast |
BB- |
Stable |
Feb-2024 |
1,100.0 |
8.5 |
7.650% |
7.88% |
|
1,500.0 |
12.5 |
8.250% |
8.50% |
||||
|
Benin |
B+ |
Stable |
Mar-2024 |
750.0 |
14.0 |
8.375% |
8.40% |
|
Kenya |
B |
Negative |
Feb-2024 |
1,500.0 |
6.0 |
9.750% |
10.30% |
|
Senegal |
B |
Stable |
Feb-2024 |
750.0 |
7.0 |
7.75% |
7.75% |
|
Cameroon |
B |
Negative |
May-2024 |
550.0 |
7.0 |
9.5% |
10.75% |
Source: Cytonn Research
- July 2024 Inflation Projection
We are projecting the y/y inflation rate for June 2024 to come in at the range of 4.7% - 5.0% mainly on the back of:
- Weakening of the Kenya Shilling against the US Dollar – The Kenya Shilling has recorded a 2.4% month-to-date decline to Kshs 132.6 as of 26th July 2024 from the Kshs 129.5 recorded at the beginning of the month, a contrast to the 15.6% year-to-date gain from the Kshs 157.0 recorded at the beginning of the year. This is partly attributable to the recent anti-finance bill protests which have rocked the country’s political stability, and the downward revision of Kenya’s credit rating by Moody’s which brought back the debt risk onto the country. This loss in the exchange rate is expected to tighten inflation further on the back of increased import and input prices, and,
We, however, expect that inflation will be supported by:
- Reduced Fuel Prices – The prices for Super Petrol, Diesel and Kerosene decreased by Kshs 1.0, Kshs 1.5 and Kshs 1.3 each respectively, and will retail at Kshs 188.8, Kshs. 171.6 and Kshs. 161.8 per litre respectively from the June 2024 prices of Kshs 189.8, Kshs. 173.1 and Kshs. 163.1 respectively. According to the latest EPRA report, following the government's efforts to stabilize pump prices through the petroleum pump price stabilization mechanism which expended Kshs 9.9 bn in the FY2023/24 to cushion the increases applied to the petroleum pump prices. This decline in fuel prices is likely to contribute to the easing of inflationary pressures as it provides a stabilizing effect on consumer purchasing power as well as business operational costs since fuel is a major input cost for businesses,
- The maintenance of the Central Bank Rate (CBR) at 13.0% – Earlier this year, the monetary policy committee noted that there was a need to tighten the monetary policy following the sustained depreciation of the Kenyan shilling as well as the heightened inflationary pressures which came in at 6.9% in the month of January, 0.3% points increase from the 6.6% in December and remaining within the upper bound of the inflation target range of 2.5% to 7.5%. In line with this, the committee increased the CBR by 50 bps to 13.00% from 12.50% in February. Additionally, on 3rd April 2024, the monetary policy committee decided to maintain the CBR at 13.0% to give the new rate time to take further effect in the economy, with inflation easing to 5.0% in April from 5.7% recorded in March 2024. Also, Also, on 5th June 2024, the monetary policy committee decided to retain the CBR at 13.00% in order to maintain overall inflation around the mid-point of the target range in the short term while ensuring continued exchange rate stability, with inflation easing to 5.0% in June from 4.6% recorded in May 2024. The committee is expected to meet again in August this year, and,
- Reduction in electricity prices – In April, EPRA announced a Kshs 3.3 decrease per unit in electricity consumer prices on the back of a reduction in the cost of fuel as a result of the strengthening of the Shilling against the dollar, with the Fuel Energy Cost decreasing to Kshs 3.3 from Kshs 4.7 and the foreign exchange rate fluctuation decreasing to Kshs 2.0 in April from Kshs 3.7 per unit in March. With electricity being one of the major inputs of inflation, this decline is expected to reduce production costs for businesses as well as reduce electricity costs for households thus easing inflation.
Going forward, we expect inflationary pressures to alleviate in the short term, while remaining in the CBK’s target range of 2.5%-7.5% aided by the marginal reduction in fuel and electricity prices. Furthermore, the decision to maintain the CBR at 13.0% during the latest MPC meeting is meant to continue reducing money supply, in turn easing inflation as well as support the exchange rate. We, however, expect that the recent currency depreciation will have a negative effect on inflation, hence the marginal increase on the m/m inflation rate.
Rates in the Fixed Income market have been on an upward trend given the continued high demand for cash by the government and the occasional liquidity tightness in the money market. The government is 20.8% ahead of its prorated net domestic borrowing target of Kshs 33.0 bn, having a net borrowing position of Kshs 39.8 bn. However, we expect a downward readjustment of the yield curve in the medium and long term, with the government looking to increase its external borrowing to maintain the fiscal surplus, hence alleviating pressure in the domestic market. As such, we expect the yield curve to normalize in the medium to long-term and hence investors are expected to shift towards the long-term papers to lock in the high returns.
Market Performance:
During the week, the equities market was on a downward trajectory, with NASI being the biggest decliner by 4.0% while NSE 10, NSE 25, and NSE 20 declined by 3.4%, 3.1%, and 1.6% respectively, taking the YTD performance to gains of 19.5%, 17.2%, 13.3%, and 11.0% for NSE 10, NSE 25, NASI, and NSE 20 respectively. The equities market performance was driven by losses recorded by large-cap stocks such as Safaricom, KCB, and Equity of 8.2%, 7.3%, and 3.4% respectively. The performance was however supported by gains recorded by large-cap stocks such as DTBK and Bamburi, of 0.8%, and 0.4% respectively.
During the week, equities turnover increased by 25.6% to USD 12.1 mn from USD 9.7 mn recorded the previous week, taking the YTD total turnover to USD 386.4 mn. Foreign investors remained net sellers with a net selling position of USD 2.6 mn, from a net selling position of USD 0.9 mn recorded the previous week, taking the YTD foreign net buying position to USD 3.5 mn.
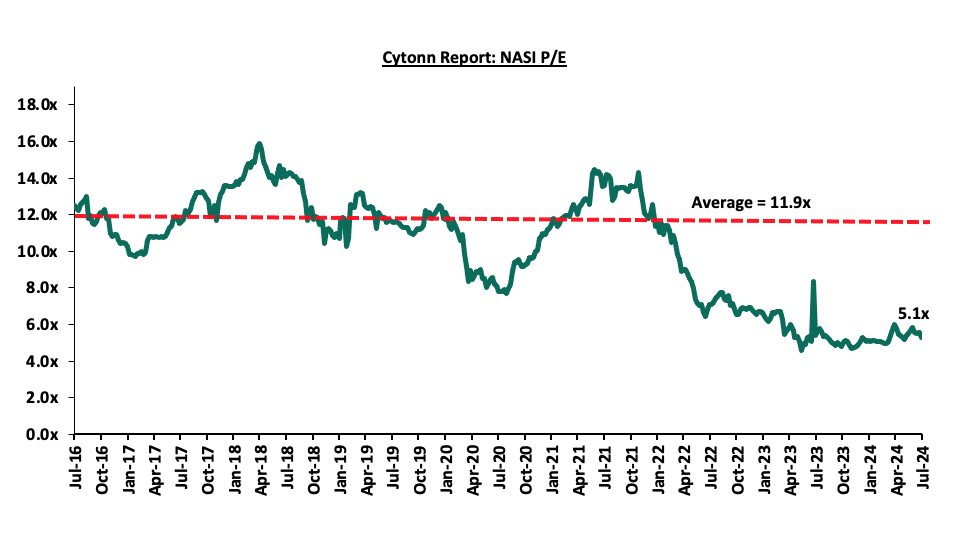
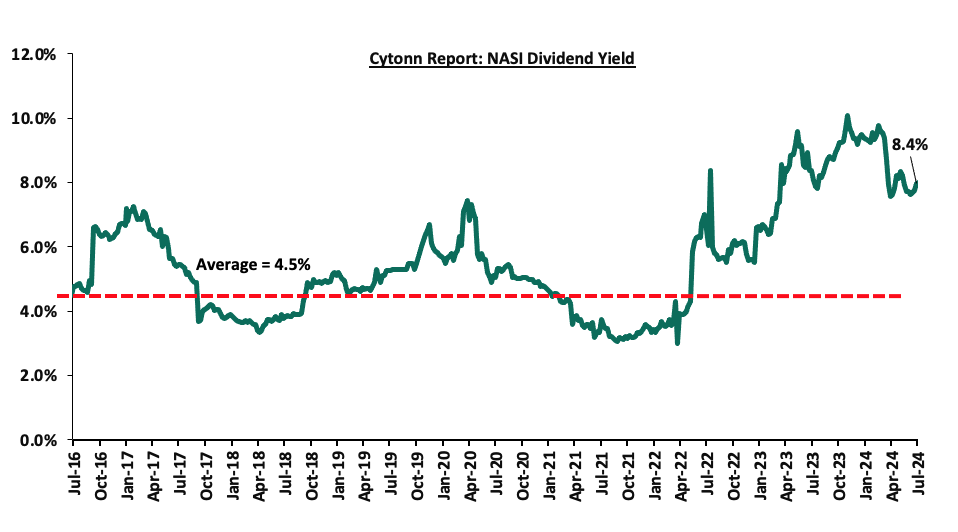
The market is currently trading at a price-to-earnings ratio (P/E) of 5.1x, 56.7% below the historical average of 11.9x. The dividend yield stands at 8.4%, 3.8% points above the historical average of 4.5%. Key to note, NASI’s PEG ratio currently stands at 0.6x, an indication that the market is undervalued relative to its future growth. A PEG ratio greater than 1.0x indicates the market is overvalued while a PEG ratio less than 1.0x indicates that the market is undervalued. The charts below indicate the historical P/E and dividend yields of the market;
Universe of Coverage:
|
Cytonn Report: Equities Universe of Coverage |
||||||||||
|
Company |
Price as at 19/07/2024 |
Price as at 26/07/2024 |
w/w change |
YTD Change |
Year Open 2024 |
Target Price* |
Dividend Yield |
Upside/ Downside** |
P/TBv Multiple |
Recommendation |
|
Jubilee Holdings |
170.5 |
164.0 |
(3.8%) |
(11.4%) |
185.0 |
260.7 |
8.7% |
67.7% |
0.3x |
Buy |
|
Equity Group*** |
42.8 |
41.3 |
(3.4%) |
20.8% |
34.2 |
60.2 |
9.7% |
55.4% |
0.8x |
Buy |
|
Diamond Trust Bank*** |
46.1 |
46.5 |
0.8% |
3.8% |
44.8 |
65.2 |
10.8% |
51.1% |
0.2x |
Buy |
|
KCB Group*** |
34.3 |
31.8 |
(7.3%) |
44.9% |
22.0 |
46.7 |
0.0% |
46.7% |
0.5x |
Buy |
|
NCBA*** |
40.9 |
40.9 |
0.0% |
5.3% |
38.9 |
55.2 |
11.6% |
46.6% |
0.8x |
Buy |
|
Co-op Bank*** |
13.1 |
12.9 |
(1.5%) |
13.7% |
11.4 |
17.2 |
11.6% |
45.0% |
0.6x |
Buy |
|
CIC Group |
2.2 |
2.1 |
(5.0%) |
(8.7%) |
2.3 |
2.8 |
6.2% |
40.2% |
0.7x |
Buy |
|
Stanbic Holdings |
116.0 |
115.5 |
(0.4%) |
9.0% |
106.0 |
145.3 |
13.3% |
39.1% |
0.8x |
Buy |
|
I&M Group*** |
21.6 |
20.7 |
(4.2%) |
18.3% |
17.5 |
25.5 |
12.3% |
35.8% |
0.4x |
Buy |
|
ABSA Bank*** |
14.1 |
14.1 |
0.0% |
21.6% |
11.6 |
17.3 |
11.0% |
34.2% |
1.1x |
Buy |
|
Britam |
5.5 |
5.7 |
4.0% |
11.7% |
5.1 |
7.5 |
0.0% |
30.7% |
0.8x |
Buy |
|
Target Price as per Cytonn Analyst estimates **Upside/ (Downside) is adjusted for Dividend Yield ***For Disclosure, these are stocks in which Cytonn and/or its affiliates are invested in |
||||||||||
Weekly Highlights
- British American Tobacco (BAT) Kenya Plc H1’2024 Financial Performance
During the week, British American Tobacco Kenya Plc released their H1’2024 financial results, recording a 24.3% decline in Profits after Tax (PAT) to Kshs 2.1 bn, from Kshs 2.8 bn recorded in H1’2023. The decline in PAT was majorly attributed to the 6.5% decrease in Gross Sales to Kshs 19.6 bn in H1’2024 from Kshs 21.0 bn recorded in H1’2023. The performance was further weighed down by the 596.6% decrease in the net finance income to a loss of Kshs 0.7 bn in H1’2024, from a net finance income of Kshs 0.1 bn recorded in H1’2023 mainly driven by a downturn in the current assets in the period under review. The tables below show the breakdown of BAT’s financial performance;
|
Cytonn Report: British American Tobacco (BAT) Kenya Plc Summarized Income Statement |
|||
|
Income Statement |
H1'2023 |
H1'2024 |
Y/Y Change |
|
Kshs (bn) |
Kshs (bn) |
||
|
Gross Sales including Indirect Taxes |
21.0 |
19.6 |
(6.5%) |
|
Excise Duty and Value-Added Taxes |
(7.9) |
(7.9) |
0.6% |
|
Net Revenue |
13.1 |
11.7 |
(10.7%) |
|
Cost of operations |
(9.2) |
(7.9) |
(14.0%) |
|
Profit from operations |
3.9 |
3.8 |
(3.0%) |
|
Net Finance Costs |
0.1 |
(0.7) |
(596.6%) |
|
Profit Before Income Tax |
4.0 |
3.1 |
(24.3%) |
|
Income Tax Expenses |
(1.2) |
(0.9) |
(24.3%) |
|
Profit After Tax |
2.8 |
2.1 |
(24.3%) |
|
Dividend Per Share |
5.0 |
5.0 |
0.0% |
|
Earnings Per Share (Kshs) |
21.4 |
28.2 |
32.1% |
Source: British American Tobacco (BAT) Kenya Plc H1’2024 Financial Report
|
Cytonn Report: British American Tobacco (BAT) Kenya Plc Summarized Balance Sheet |
|||
|
Balance Sheet |
H1'2023 |
H1'2024 |
Y/Y Change |
|
Kshs (bn) |
Kshs (bn) |
||
|
Current Assets |
14.3 |
10.8 |
(24.3%) |
|
Non-Current Assets |
12.3 |
11.5 |
(6.4%) |
|
Total Assets |
26.6 |
22.3 |
(16.1%) |
|
Current Liabilities |
10.6 |
5.5 |
(48.6%) |
|
Non-Current Liabilities |
2.0 |
2.4 |
23.0% |
|
Total Liabilities |
12.6 |
7.9 |
(37.4%) |
|
Total Equity |
14.0 |
14.4 |
3.1% |
Source: British American Tobacco (BAT) Kenya Plc H1’2024 Financial Report
Key take outs from the financial performance include;
- Net revenue decreased by 10.7% to Kshs 11.7 bn in H1’2024, from Kshs 13.1 bn recorded in H1’2023, mainly driven by the 6.5% decline in gross sales to Kshs 19.6 bn in 2023, from Kshs 21.0 bn in 2023 coupled with the 0.6% increase in indirect taxes that came in at Kshs 7.9 bn in H1’2024, from Kshs 7.9 bn in H1’2023. Notably, the decrease in gross sales is attributed to the increase in illicit trade in tax evaded cigarettes, inflationary pressures and geo-political tensions experienced during the period,
- Indirect Taxes increased marginally by 0.6% to remain relatively unchanged at Kshs 7.9 bn attributable to an increase in excise duty tax rates,
- Cost of sales decreased by 14.0% to Kshs 7.9 bn in H1’2024, from Kshs 9.2 bn in H1’2023, largely driven by a decline in sales volumes, prudent cost control, and the advantages of productivity improvements made to slow down cost growth,
- The Group’s current liabilities decreased by 48.6% to Kshs 5.5 bn in H1’2024, from Kshs 10.6 bn recorded in H1’2023, mainly attributable a decrease in short term loans due to the significant increase of the net finance costs to Kshs 0.7 bn in H1’2024, from a net financial income of Kshs 0.1 bn recorded in H1’2023,
- Earnings per share decreased significantly by 19.2% to Kshs 55.7 in FY’2023, from Kshs 68.9 in H1’2023, mainly due to the 10.7% decline in net revenue to Kshs 11.7 bn in H1’2024, from Kshs 13.1 bn recorded in H1’2023, and,
- The board of directors approved an interim dividend of Kshs 5.0 per share for the period ending 31st December 2024. The interim dividend will be paid on or about 27th September 2024 with a book closure on 30th August 2024. The total dividend to be paid for the FY’2024 amounts to Kshs 5.0 per share, translating to a dividend yield of 1.4%, as at 26th July 2024.
Amidst a challenging macroeconomic climate, BAT's PAT declined by 24.3% to Kshs 2.1 bn in H1'2024, down from Kshs 2.8 bn in H1'2023. The difficult operating environment was marked by local currency appreciation, which led to substantial foreign exchange losses from exports trading currency which trade in USD, and inflationary pressures that eroded consumers' purchasing power, coupled with geopolitical disruptions. These factors collectively weighed down the Group's overall performance and profitability. Additionally, regulatory uncertainty surrounding BAT's modern oral product hindered the commercialization of its nicotine pouch factory in Nairobi and caused supply chain disruptions for tobacco-free oral nicotine pouches. Moving forward, the company has accepted offers for the sale of the oral nicotine pouch factory. Notably, during this period, the Group successfully completed a route-to-market business simplification exercise to achieve a sustainable, future-fit model. This proactive initiative is expected to support the underlying business performance. The company also continues to engage transparently in establishing a sustainable regulatory framework to facilitate the resumption of commercial operations in the modern oral nicotine category.
We are “Neutral” on the Equities markets in the short term due to the current tough operating environment and huge foreign investor outflows, and, “Bullish” in the long term due to current cheap valuations and expected global and local economic recovery. With the market currently being undervalued for its future growth (PEG Ratio at 0.6x), we believe that investors should reposition towards value stocks with strong earnings growth and that are trading at discounts to their intrinsic value. We expect the current high foreign investors’ sell-offs to continue weighing down the equities outlook in the short term.
- Residential Sector
- Faulu Microfinance Bank to Offer Real Estate Financial Solutions
During the week, Faulu Microfinance Bank, a subsidiary of Old Mutual Group, announced a range of innovative financial solutions aimed at addressing gaps in service access for landlords, agents, and other stakeholders in Real Estate development and management. The solutions include expedited unsecured loans, customized financial packages for property improvement, and payment plans aligned with rental income cycles. Additionally, the bank aims to introduce simplified application procedures and funds for property expansion.
Faulu aims to become the go-to financial institution for landlords and Real Estate agents by providing specialized services and building strong relationships. This move is seen positively as the Real Estate sector plays a crucial role in Kenya's economy, contributing up to 10.2% of its GDP.
With rapid urbanization currently at 3.7% per annum according to the World Bank, the demand for housing, particularly in urban areas, is surging. The national homeownership rate stands at approximately 21.3% in urban areas, significantly below the national average of 61.3%, while 78.7% of urban dwellers rent. The combined efforts of Faulu Bank and key Real Estate stakeholders play a crucial role in ensuring effective property oversight, matching tenants with suitable homes, and maintaining overall stability in the Real Estate market.
We expect that Faulu Bank's new solutions will not only fill existing service gaps but also drive further growth and innovation in Kenya's Real Estate sector, ultimately making housing more accessible and affordable for a broader segment of the population.
- Megna Homes to Construct Gated Community Development
Additionally, during the week, Megna Homes, a Mombasa-based developer, announced plans for the construction of a modern gated community project in Kisauni. The project, dubbed ‘Santana’, is set to be launched in August 2024 and is expected to be complete by the end of 2 years at Kwa Sonko in Bakarani along the Old Mombasa-Malindi Road. The project will comprise 816 modern units of one-bedroom, two-bedroom, three-bedroom typologies and commercial spaces which will be sold at an affordable price. Additionally, the project will feature modern amenities such as an Olympic-sized swimming pool, multi-purpose community centre, kids’ playground, football pitch, jogging tracks, green spaces, food courts, parking spaces, and a police post.
The project is set to contribute positively to the Kisauni area by improving the standards of living, community living, enhance security, and it’s expected to boost employment of youths and women of Kisauni by offering more than 2,000 job opportunities.
The Santana project represents a strategic investment in the future of Kisauni. By boosting local employment, enhancing infrastructure, and providing modern amenities, the project aims to stimulate economic growth and attract further investments into the area.
- Real Estate Investments Trusts (REITs)
- ILAM Fahari Financial Results
During the week, ILAM Fahari I-REIT released their H1’2024 financial results highlighting that the I-REIT recorded a 37.4% decline in profits earned to Kshs 53.8 mn, from Kshs 86.0 mn in H1’2023. Below is a summary of the ILAM Fahari I-REIT’s H1’2024 performance;
|
All values in Kshs bn unless stated otherwise |
||||||
|
Balance Sheet |
H1'2022 |
FY'2022 |
H1'2023 |
FY'2023 |
H1'2024 |
∆ Y/Y (H1’24/ H1’23) |
|
Total Assets |
3.7 |
3.6 |
3.6 |
3.5 |
3.4 |
(5.3%) |
|
Total Equity |
3.5 |
3.4 |
3.4 |
3.3 |
3.2 |
(4.7%) |
|
Total Liabilities |
0.1 |
0.2 |
0.2 |
0.2 |
0.1 |
(17.1%) |
|
Income Statement |
H1'2022 |
FY'2022 |
H1'2023 |
FY'2023 |
H1'2024 |
∆ Y/Y (H1’24/ H1’23) |
|
All values in Kshs bn unless stated otherwise |
||||||
|
Rental Income |
0.2 |
0.4 |
0.2 |
0.3 |
0.1 |
(22.7%) |
|
Income from Other Sources |
0.0 |
0.0 |
0.0 |
0.1 |
0.0 |
50.8% |
|
Operating Expenses |
0.1 |
0.2 |
0.1 |
0.2 |
0.1 |
(0.1%) |
|
Profit/Loss |
0.1 |
0.0 |
0.1 |
0.0 |
0.1 |
(37.4%) |
|
Basic EPS |
0.5 |
-0.2 |
0.5 |
0.0 |
0.3 |
(37.4%) |
|
Ratios Summary |
H1'2022 |
FY'2022 |
H1'2023 |
FY'2023 |
H1 2024 |
∆ Y/Y (H1’24/ H1’23) % Points |
|
ROA |
2.3% |
(0.8%) |
2.4% |
(0.01%) |
1.59% |
(0.8%) |
|
ROE |
2.4% |
(0.8%) |
2.5% |
(0.01%) |
1.66% |
(0.9%) |
|
Debt Ratio |
4.0% |
5.3% |
4.9% |
4.7% |
4.3% |
(0.6%) |
|
PBT Margin |
51.2% |
(8.4%) |
48.4% |
(0.1%) |
38.4% |
(9.9%) |
|
Annualized Rental Yield |
10.3% |
9.8% |
12.7% |
11.6% |
10.2% |
(2.4%) |
The key take-outs include;
- The basic earnings per unit declined by 37.4% to come in at a gain of Kshs 0.3 mn in H1’2024, from a gain of Kshs 0.5 mn in H1’ 2023. The performance is attributed to a 37.4% loss in ILAM Fahari’s comprehensive profit to a gain of Kshs 53.8 mn in H1’2024, from a gain of Kshs 86.0 mn recorded in H1’2023. This was mainly driven by a 15.1% reduction in total income to a gain of Kshs 164.9 mn realized in H1’2024 from a gain of Kshs 194.4 mn in H1’2023. Additionally, operating expenses declined by 0.1% from Ksh 109.9 mn in H1’2023 to Kshs 109.8 mn in H1’2024,
- Rental income declined by 22.7% to Kshs 138.7 mn in H1’2024, from Kshs 179.5 mn recorded in H1’2023, largely attributed to the loss of revenue from Starling Park Properties upon lease expiry. We note that efforts are underway by the REIT Manager to secure a new tenant for the property,
- Interest income increased by 50.8% to Kshs 24.9 mn in H1’2024, from Kshs 16.5 mn realized in the similar period in 2023, owing to the high interest rates being experienced in the market currently,
- Total assets reduced by 5.3% to Kshs 3.4 bn in H1’2024, from Kshs 3.6 bn in H1’2023. This was attributable to; i) a 76.0% decline in investment securities to Kshs 46.1 mn in H1’2024, from Kshs 192.2 mn recorded in H1’2023, ii) a 20.2% decrease in assets held for sale to Kshs 160.0 mn in H1’2024, from Kshs 200. 4 mn in H1’2023 Total assets reduced by 5.3% to Kshs 3.4 bn in H1’2024, from Kshs 3.6 bn in H1’2023. This was attributable to; i) a 76.0% decline in investment securities to Kshs 46.1 mn in H1’2024, from Kshs 192.2 mn recorded in H1’2023, ii) a 20.2% decrease in assets held for sale to Kshs 160.0 mn in H1’2024, from Kshs 200. 4 mn in H1’2023,
- The REIT Manager did not recommend an interim distribution in relation to H1’2024. However, a first and final distribution of Kshs 0.7 per unit was paid in April 2024 in relation to FY’2023. The is translates to a dividend yield of 6.4% as at the last trading date, that is 26th July 2024 as of the distribution made in FY’2023 and an implied capitalization rate of 3.3%.
For more information, see the ILAM Fahari H1’2024 Earning’s Note.
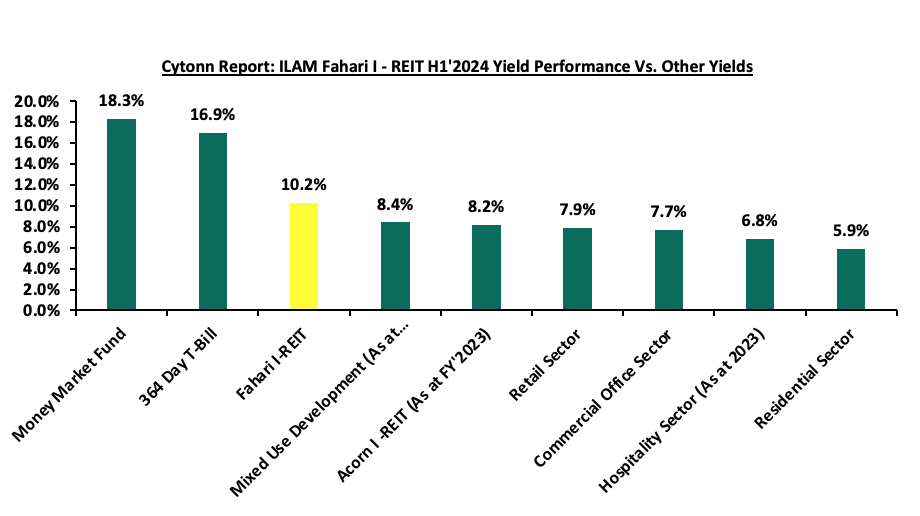
The chart below shows the comparison of ILAM Fahari I-REIT’s yield performance versus other yields;
- I-REIT Weekly Performance
On the Unquoted Securities Platform, Acorn D-REIT and I-REIT traded at Kshs 24.5 and Kshs 22.0 per unit, respectively, as per the last updated data on 26th July, 2024. The performance represented a 22.5% and 10.0% gain for the D-REIT and I-REIT, respectively, from the Kshs 20.0 inception price. The volumes traded for the D-REIT and I-REIT came in at 12.3 mn and 31.6 mn shares, respectively, with a turnover of Kshs 257.5 mn and Kshs 633.8 mn, respectively, since inception in February 2021. Additionally, ILAM Fahari I-REIT traded at Kshs 11.0 per share as of 26th July, 2024, representing a 45.0% loss from the Kshs 20.0 inception price. The volume traded to date came in at 138,600 for the I-REIT, with a turnover of Kshs 1.5 mn since inception in November 2015.
REITs offer various benefits, such as tax exemptions, diversified portfolios, and stable long-term profits. However, the ongoing decline in the performance of Kenyan REITs and the restructuring of their business portfolios are hindering significant previous investments. Additional general challenges include: i) insufficient understanding of the investment instrument among investors, ii) lengthy approval processes for REIT creation, iii) high minimum capital requirements of Kshs 100.0 mn for trustees, and iv) minimum investment amounts set at Kshs 5.0 mn for the Investment REITs, all of which continue to limit the performance of the Kenyan REITs market.
We expect the performance of Kenya’s Real Estate sector to be sustained by: i) increased investment from local and international investors, particularly in the residential sectors ii)favorable demographics in the country, leading to higher demand for housing and Real Estate, (iii) government infrastructure development projects e.g. roads, opening up satellite towns for investment, and iv) ongoing residential developments under the Affordable Housing Agenda, aiming to reduce the housing deficit in the country which is currently at 80.0%. However, challenges such as rising construction costs, strain on infrastructure development, and high capital demands in REIT sector will continue to impede the sector’s optimal performance by restricting developments and investments.
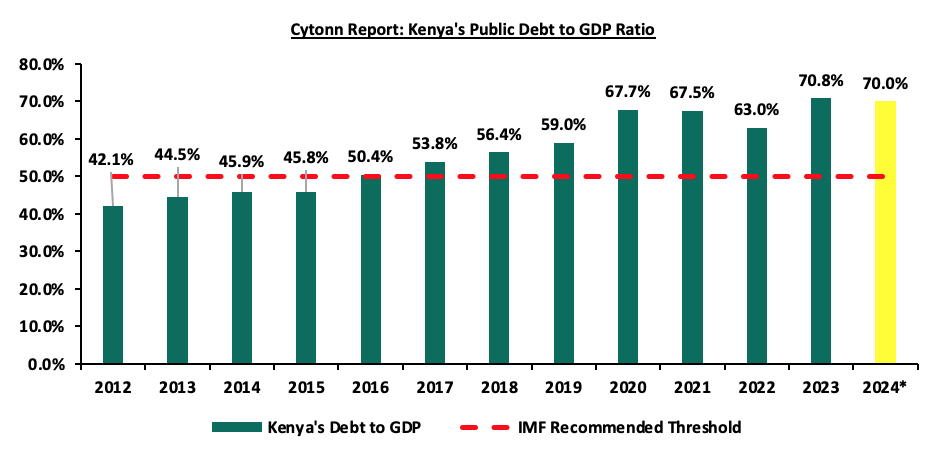
Kenya is one of the fastest growing economies in Sub-Saharan Africa, having registered a growth rate of 5.0% in the first quarter of 2024. Despite being one of the fastest growing economies in Sub-Saharan Africa with a projected economic growth rate of 5.0%, above the region’s average of 3.7%, Kenya is grappling with a high debt burden, facing elevated risk of debt distress and significant challenges in managing its public debt, which has increased rapidly in recent years. As per the latest data from the Central Bank of Kenya (CBK), the total public debt stood at Kshs 10.6 tn as of June 2024, compared to Kshs 10.3 tn recorded in June 2023. Notably, external debt reduced by 5.2% during the period to Kshs 5.2 tn in March 2024, from 5.4 tn in June 2023 attributable to the early partial repayment of the USD 2.0 bn Eurobond in February 2024. Consequently, the debt to GDP ratio has increased to 70.0% as of June 2024, 20.0% points higher than the International Monetary Fund (IMF) threshold of 50.0% for developing countries, though slightly down from the 70.8% recorded in June 2023. The government has been working on trimming the domestic borrowing so as to alleviate the pressure on interest rates, with the short-day papers all crossing the 16.0% mark in the recent auctions. Furthermore, following the withdrawal of the Finance Bill 2024, which aimed to raise Kshs 344.3 bn in additional revenues, the government has outlined plans to adjust the FY’2024/25 Budget to align with the Revised Fiscal Framework and implement expenditure cuts so as to reduce the fiscal deficit. Reducing local borrowing also aims to address the crowding out of the private sector. External debt primarily comes from multilateral and bilateral creditors, while domestic debt consists mainly of Treasury bonds and Treasury bills. Likewise, the debt service to revenue ratio has increased over the period to 69.6% as of June 2024, 39.6% points higher than the IMF threshold of 30.0%. Notably, the debt service to revenue ratio hit an all-time high of 101.4% as of July 2023, indicating the growing burden of debt servicing that continues to weigh on the government’s expenditure.
The rising public debt has raised concerns about its sustainability and implications for fiscal and macroeconomic stability. These concerns have seen credit rating agencies such as Fitch, Moody’s and S&P Global maintaining Kenya’s credit outlook at negative, resulting in higher borrowing costs in the international market. Notably, earlier this month, Moody’s downgraded Kenya’s credit score by one scale to Caa1, from B3 on the back of the country’s ability to implement its fiscal consolidation measures focused on revenue, which are necessary to reduce overall debt. Additionally, S&P Global has scheduled a review on 23rd August 2024 to decide on Kenya’s sovereign credit rating. The firm may either downgrade Kenya’s B credit score to B- or maintain the current rating but keep it on downgrade warning with a negative outlook. S&P Global is adopting a wait-and-see approach to gain more clarity on the appropriation bill, spending allocations, the final budget, and the finance bill. With the withdrawal of the planned tax increases, the Kenyan government faces the challenge of prolonged fiscal deficits, which could further deteriorate the government’s public debt situation and worsen the debt vulnerability of Kenya.
We have been tracking the evolution of the public debt and below are the most recent topicals we have done on Kenya’s debt:
- Kenya's Public Debt Review 2023: Is Kenya's Public Debt Level Sustainable- In April 2023, we highlighted the state of affairs concerning the country’s public debt and concluded by discussing strategies that the government could implement in order to reduce the economic consequences of high debt levels as well as mitigate the high risk of debt distress,
- Kenya’s Public Debt 2022; Debt Service Coverage- In July 2022, In December 2016, we wrote about Kenya’s debt level, questioning its sustainability, and concluded that the government needed to reduce the amount of public debt, giving suggestions as to how this could be achieved, and,
- Kenya’s Public Debt: On a path to Distress?- In October 2021, we highlighted the state of affairs concerning the country’s public debt profile and levels and concluded that Kenya’s risk of debt distress remained elevated,
- Kenya’s Public Debt Review 2023 – In October 2023, we highlighted Kenya’s public debt situation and the need for prudent fiscal management and strategic planning to ensure that the debt remains sustainable and does not compromise the country’s economic prospects.
In this week's topical, we will focus on the current status of Kenya's public debt at the end of FY’2023/2024. We will examine the economic consequences of high debt levels and provide our outlook on the country's debt sustainability following the withdrawal of proposed tax increases. Instead, the government is now focusing on expenditure cuts to reduce fiscal deficits. Additionally, the report will compare Kenya's public debt situation with that of other Sub-Saharan countries using various indicators such as the debt-to-GDP ratio and the debt service-to-revenue ratio.
This we shall cover as follows;
- The Current State of Kenya’s Public Debt,
- Kenya’s Debt Servicing Cost,
- Economic Impact of Kenya’s High Debt Levels,
- Kenya’s Debt Sustainability Analysis and Projection,
- Comparative Analysis with Regional Peers, and,
- Policy Recommendations and Conclusion.
Section I: The Current State of Kenya’s Public Debt
According to the Central Bank of Kenya (CBK) Weekly Bulletin Report, Kenya’s public debt reached Kshs 10.6 tn, (equivalent to 70.0% of GDP) as of end of June 2024, marking a 2.9% increase from the Kshs 10.3 tn (70.8% of GDP) recorded in June 2023. Amidst the government’s fiscal consolidation efforts through expenditure cuts in the budget’s appropriations, so as to stem the escalation of debt accumulations and maintain sustainable debt levels, in the FY’2024/2025 Supplementary Budget Estimates I, total expenditure and net lending were revised to 21.4% of GDP, from the original projection of 22.1% of GDP. However, overall fiscal deficit level inclusive of grants increased by 0.3% points to 3.6% of GDP, from the original projection of 3.3% of GDP. The public debt to GDP ratio is projected to decline to 58.2% in 2024. However, we expect the government efforts to be impeded by the deteriorated macroeconomic environment as evidenced by the decline in Purchasing Manager's Index (PMI) to 47.2 recorded in June 2024, below the 50.0 neutral, down from 51.8 in May 2024, signaling a deterioration in the operating conditions across Kenya, resulting from the recent unrest following the anti-finance bill protests, in addition to the high interest rates from tightening monetary policy and an overall rise in the cost of living. Additionally, the high fuel prices, despite the decline over recent months and slower economic growth is expected to stifle revenue collection. Below is a graph highlighting the trend in the Kenya’s debt to GDP ratio over the last 10 years:
Source: National Treasury
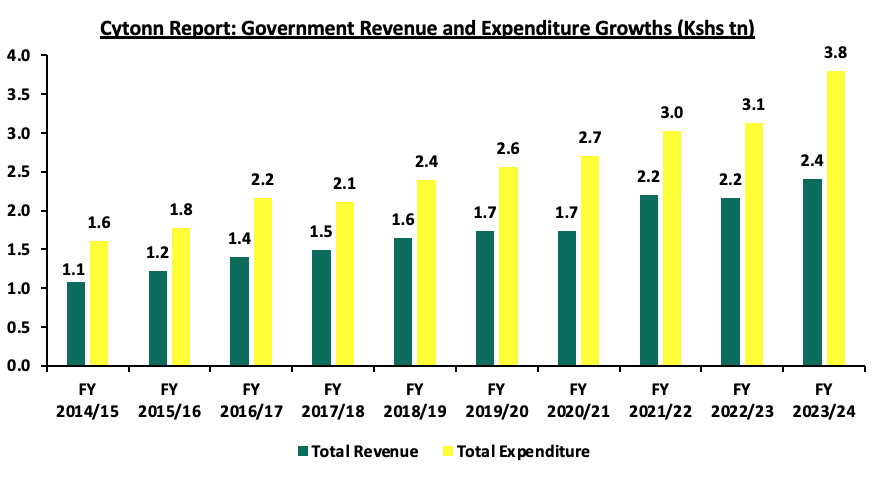
Kenya's debt levels have been rising due to persistent fiscal deficits, which have averaged 7.3% of GDP over the last 10 financial years. This increase is attributed to sustained recurrent expenditures, debt costs and a focus on development projects. Over this ten-year period, government revenue grew at a compound annual growth rate (CAGR) of 8.3%, reaching Kshs 2.4 tn by the end of FY’2023/24, up from Kshs 1.1 tn by the end of FY‘2014/15. However, this revenue growth was outpaced by growth in government expenditure, which grew at a CAGR of 9.0%, reaching Kshs 3.8 tn by the end of FY’2023/24, up from Kshs 1.6 tn in FY’2014/15. The chart below shows the growth in Kenya’s total revenue and expenditure in the last 10 fiscal years:
Source: Central Bank of Kenya
- The Nature of Kenya’s Debt Composition (Domestic vs External)
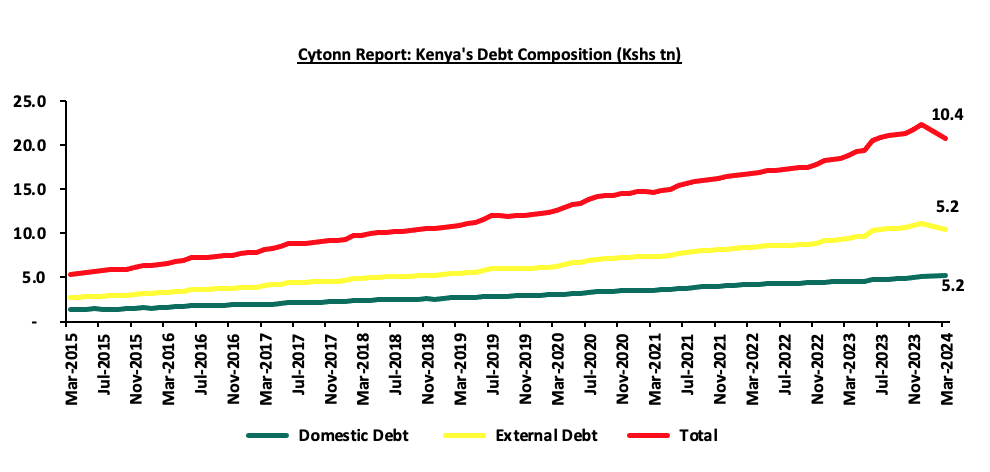
Over the years, Kenya’s debt composition has been evenly distributed between domestic and external borrowing. However, since the beginning of 2023, there has been a shift towards external borrowing with the proportion of external debt against domestic debt standing at 54.7% to 45.3% in December 2023, compared with 51.1% to 48.9% observed over a similar period in 2022. The shift was brought about by the government’s revision of its domestic borrowing target for the FY’2023/24 from the initial Kshs 586.5 bn to Kshs 316.0 bn, a move aimed at mitigating the upward pressure on the domestic borrowing rates while at the same time bolstering foreign reserves by increasing the government’s efforts on sourcing for bilateral and multilateral funding. As of March 2024, the proportion of external debt against domestic debt stood at 49.7% to 50.3%, with the higher domestic debt attributable to the Eurobond repayment. Notably, external debt increased at a 10-year CAGR of 25.0% to Kshs 5.2 tn as at March 2024, from Kshs 1.3 tn in March 2015, higher than the 14.1% CAGR recorded by domestic debt to Kshs 5.2 tn as at March 2024 from Kshs 1.4 tn in March 2015. Consequently, the total public debt has increased at a 10-year CAGR of 14.5% to Kshs 10.4 tn as at March 2024, from the Kshs 2.7 tn recorded as at March 2015. Below is a graph highlighting the trend in the external and domestic debt composition over the last 10 years;
Source: National Treasury and Central Bank of Kenya
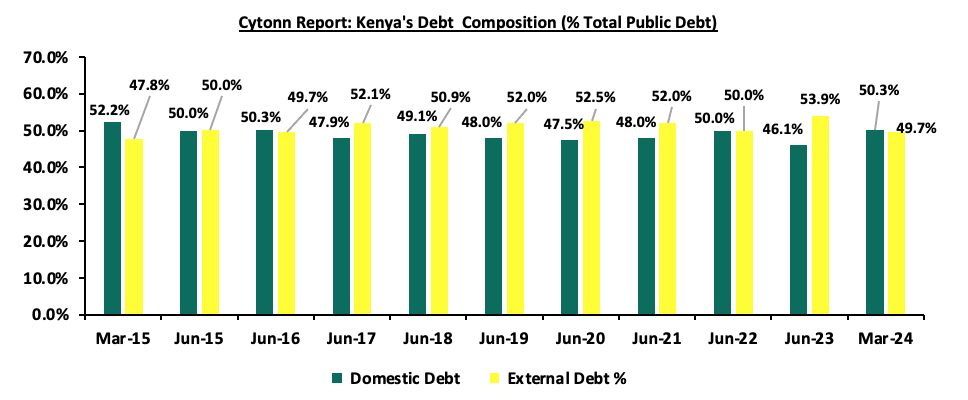
Below is a graph highlighting the composition of domestic and external debt as a percentage of total public debt over the last 10 years:
Source: National Treasury and Central Bank of Kenya
- Public Debt Mix by Holders
- External Debt Composition by Holders (Bilateral, Multilateral, and Commercial Banks)
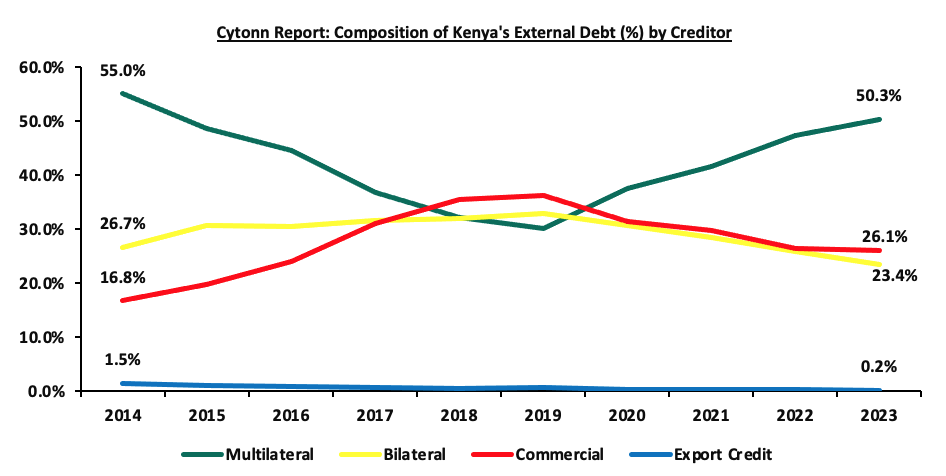
Kenya’s external debt stock is mainly composed of multilateral loans, bilateral loans and commercial loans. According to the CBK Quarterly Economic Review, in the second quarter of FY’2023/2024, Kenya’s exposure to multilateral loans recorded a 2.9% points increase to 50.3%, from 47.4% as at the end of December 2022. This was attributable to favourable terms offered in terms of low interest rates and longer repayment periods, when compared to bilateral loans and commercial loans. Notably, during the third quarter of FY’2023/24, Kenya was able to issue a new Eurobond worth USD 1.5 bn, aimed to facilitate the buyback of the USD 2.0 bn Eurobond originally issued in 2014. In June 2024, Kenya successfully settled the remaining portion of the 2014 Eurobond issue, assuring foreign investors of the country’s broader plan to maintain debt sustainability and manage public debt efficiently. Despite, initial declines following the Eurobond buyback in February, the yields on the Eurobonds have once again shown volatility in recent months, indicating renewed investor concerns over Kenya’s economic stability and debt sustainability. This is attributable to perceived risks associated with Kenya’s economic environment, including fiscal deficits, debt sustainability concerns and the ongoing protests that continue to put pressure on the economy. The chart below shows external debt composition by Creditors:
Source: National Treasury, CBK
It is key to note that:
- The portion of multilateral debt increased by 2.9% points to 50.3% in December 2023, from 47.4% recorded over a similar period in 2022, due to disbursements from IMF USD 1.0 bn (Kshs 138.6 bn) under the Development Policy Operation (DPO) from the World Bankand a total of USD 415.4 mn (Kshs 58.9 bn) from the IMF under the Extended Credit Facility arrangement (EFF/ECF) for budgetary support during the period. This was in addition to the USD 551.4 mn (Kshs 78.1 bn) approved under the Resilience and Sustainability Facility (RSF), following the completion of IMF’s fifth review of the 38-months Extended Fund Facility (EFF) and Extended Credit Facility (ECF) financing. Notably, Bilateral debt decreased by 2.9% points to 24.4% in June 2023, from 27.3% in June 2022,
- Commercial debt as a percentage of external debt reduced by 0.4% points to 26.1% of total external debt in December 2023 from 26.5% in December 2022, mainly attributable to Kenya’s government shunning away from the more expensive debt due to the prevailing market conditions, and,
According to the CBK Quarterly Economic Review as at December 2023, 67.3% of the external debt was US Dollar denominated contributing to the increasing debt servicing cost given the shilling’s depreciation having lost against the USD by 26.8% as of December 2023. The table below shows the currency composition of the external debt stock:
|
Cytonn Report: Currency composition of the External Debt Stock (%) |
||
|
Currency |
December-2022 |
December-2023 |
|
USD |
68.1% |
67.3% |
|
EUR |
19.8% |
21.4% |
|
Yuan |
5.4% |
5.1% |
|
Yen |
4.2% |
3.8% |
|
GBP |
2.4% |
2.2% |
|
Other Currencies |
0.2% |
0.2% |
Source: Central Bank of Kenya
- During the week, Treasury released the Public Debt Management Office Report as of June 2023, noting that, for multilateral debt, the International Development Association (IDA) was the largest creditor, with debt increasing by 29.3% to Kshs 1,573.6 bn as at June 2023, from Kshs 1,217.2 bn as of June 2022 making up 59.3% of the total multilateral debt. The International Monetary Fund (IMF) was the second largest creditor, with debt increasing by 62.6% to Kshs 335.6 bn as at June 2023, from Kshs 206.4 bn as at June 2022 equivalent to 12.6% of the total multilateral debt. The International Bank for Reconstruction & Development (IBRD) accounted for 2.8% of the total multilateral, increasing significantly by 126.8% to Kshs 152.2 bn as of June 2023, from Kshs 67.1 bn in FY’2021/22. The table below shows the source composition of multilateral debt stock for the FY’2021/22 and FY’2022/23:
|
Cytonn Report: External Multilateral Debt Stock by Source (Kshs bn) |
||||
|
Currency |
Jun-2022 |
Jun-2023 |
% Change |
Proportion (%) |
|
International Development Association |
1217.2 |
1573.6 |
29.3% |
59.3% |
|
International Monetary Fund |
206.4 |
335.6 |
62.6% |
12.6% |
|
African Development Fund |
259.4 |
314.0 |
21.0% |
11.8% |
|
African Development Bank |
125.9 |
203.9 |
61.9% |
7.7% |
|
Intl Bank for Reconstruction & Development |
67.1 |
152.2 |
126.8% |
5.7% |
|
Others |
56.7 |
75.6 |
33.4% |
2.8% |
|
Total |
1932.7 |
2654.9 |
37.4% |
100.0% |
Source: Public Debt Management Office Report FY’2022/23
- For bilateral debt, the largest creditor was the Exim Bank of China, which increased its debt by 8.9% to Kshs 880.9 bn as at June 2023, from Kshs 809.2 bn as at the end of FY’2021/22 representing 70.5% of the total bilateral debt in FY’2022/2023. The total bilateral debt rose by 10.8% to Kshs 1,248.6 bn from Kshs 1,127.3 bn as at the end of FY’2021/22, showing an increase in overall borrowing. The table below shows the source composition of the bilateral debt stock for the FY’2021/22 and FY’2022/23:
|
Cytonn Report: External Bilateral Debt Stock by Source (Kshs bn) |
||||
|
Currency |
Jun-2022 |
Jun-2023 |
% Change |
Proportion (%) |
|
Exim Bank of China |
809.2 |
880.9 |
8.9% |
70.5% |
|
Agence Francaise De Development |
85.3 |
100.0 |
17.2% |
8.0% |
|
Government of Japan |
85.9 |
99.1 |
15.4% |
7.9% |
|
Unicredit SPA |
53.0 |
52.8 |
-0.3% |
4.2% |
|
Govt of Fed. Reublic of Germany |
34.6 |
44.7 |
29.3% |
3.6% |
|
Others |
59.3 |
71.0 |
19.8% |
5.7% |
|
Total |
1127.3 |
1248.6 |
10.8% |
100.0% |
Source: Public Debt Management Office Report FY’2022/23
- Domestic Debt Composition by Holders
Banking institutions make up for the highest percentage of domestic debt, accounting for 45.5% of government securities holdings as at 24th July 2024, 0.6% points lower than the 46.1% share recoded as at the end of the second quarter of FY’2023/24, with the increase mainly attributed reduced credit risk. On the other hand, government securities holding by other domestic investors registered 1.6% points increase to 12.9% as at 24th July 2024, from the 11.3% recorded at the end of December 2023. Notably, pension funds accounted for the second largest portion with 29.3% of holdings in government securities as at 24th July 2024, albeit 0.6% points lower than the 29.9% registered in December 2023. Below is a table of the composition of government domestic debt by holders:
|
Cytonn Report: Composition of Government Domestic Debt by Holder |
||||||||||||
|
Domestic debt |
Dec-13 |
Dec-14 |
Dec-15 |
Dec-16 |
Dec-17 |
Dec-18 |
Dec-19 |
Dec-20 |
Dec-21 |
Dec-22 |
Dec-23 |
July-24 |
|
Banking institutions |
49.2% |
54.3% |
55.4% |
52.2% |
54.6% |
54.5% |
54.3% |
53.3% |
50.2% |
46.8% |
46.1% |
45.5% |
|
Insurance Companies |
10.2% |
9.9% |
8.4% |
7.3% |
6.4% |
6.1% |
6.4% |
6.4% |
6.8% |
7.4% |
7.2% |
7.2% |
|
Parastatals |
3.5% |
2.8% |
4.6% |
5.8% |
6.9% |
7.3% |
6.5% |
5.7% |
5.6% |
6.1% |
5.5% |
5.1% |
|
Pension Funds |
26.1% |
23.9% |
25.4% |
28.2% |
27.5% |
27.6% |
28.6% |
30.3% |
31.3% |
33.3% |
29.9% |
29.3% |
|
Other domestic investors |
11.0% |
9.0% |
6.2% |
6.5% |
4.6% |
4.6% |
4.2% |
4.3% |
6.1% |
6.4% |
11.3% |
12.9% |
|
TOTAL |
100.0% |
100.0% |
100.0% |
100.0% |
100.0% |
100.0% |
100.0% |
100.0% |
100.0% |
100.0% |
100.0% |
100.0% |
Source: Central Bank of Kenya
- GDP per Capita vs Debt per Capita
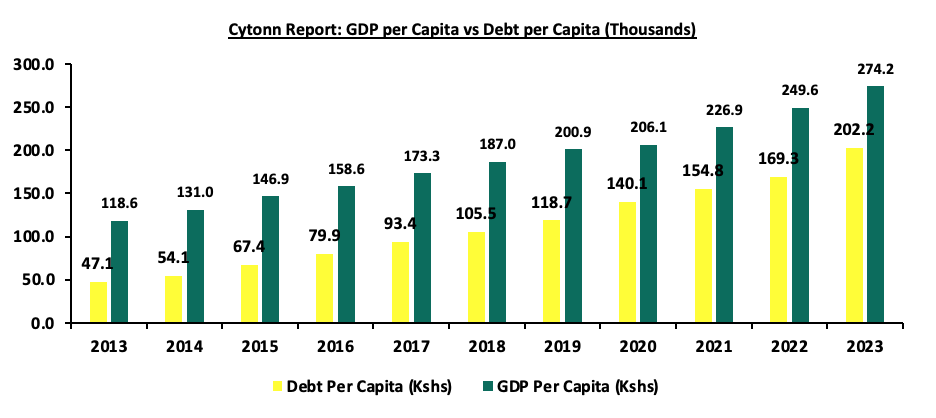
According to Central Bank data, Kenya’s Public Debt per Capita has increased at a 10-year CAGR of 15.7% to Kshs 202,169.2 in 2023, from Kshs 47,140.9 in 2013. Conversely, GDP per Capita has grown at a slower 10-year CAGR of 8.7% to Kshs 274,202.6 in 2023, from Kshs 118,576.5 in 2013. This discrepancy suggests that the rapid increase in public debt is not being matched by corresponding economic growth. The chart below compares Kenya’s GDP per capita to the debt per capita over the last 10 years:
Source: World Bank, CBK
Factors that have accelerated the growth in Kenya’s Public debt;
- Fiscal Deficit – Kenya has witnessed a persistent fiscal deficit averaging at 7.5% of the GDP for the last 10 financial years and is projected to ease to 3.6% of the GDP at the end of FY’2024/25, from the 5.7% recorded in FY 2023/24. According to the revised Budget Estimates for FY'2024/25 the approved budget for the FY’2024/25 is estimated to be Kshs 3.9 tn against a targeted revenue collection of Kshs 3.1 tn, hence the need to borrow an additional Kshs 0.4 tn domestically and Kshs 0.3 tn externally,
- Debt Servicing Costs – Debt servicing cost has been on the rise, with the debt service to revenue ratio averaging 23.5% over the last 10 financial years and standing at 69.6% as of June 2024. The rising debt servicing cost is attributed to the continuous accumulation of total public debt, resulting from the increased flow of international development assistance in the form of concessional loans,
- Short falls of Revenue collections – Despite the significant growth in tax revenues, the Kenya Revenue Authority (KRA) has consistently fallen short of its tax revenue targets, with the tax collections for FY'2023/24 increasing by 11.1% to Kshs 2.4 tn from Kshs 2.2 tn in FY’2022/23, albeit short of the Kshs 2.5 tn target. To plug the budget deficits, the government has had to borrow externally and also from the domestic market thereby increasing the country’s debt profile over time, and,
- Guaranteed loans by the Government of Kenya – The guaranteed loans on state corporations put pressure on the need for excessive spending, despite poor performances by the said state corporations.
Section II: Kenya’s Debt Servicing Cost
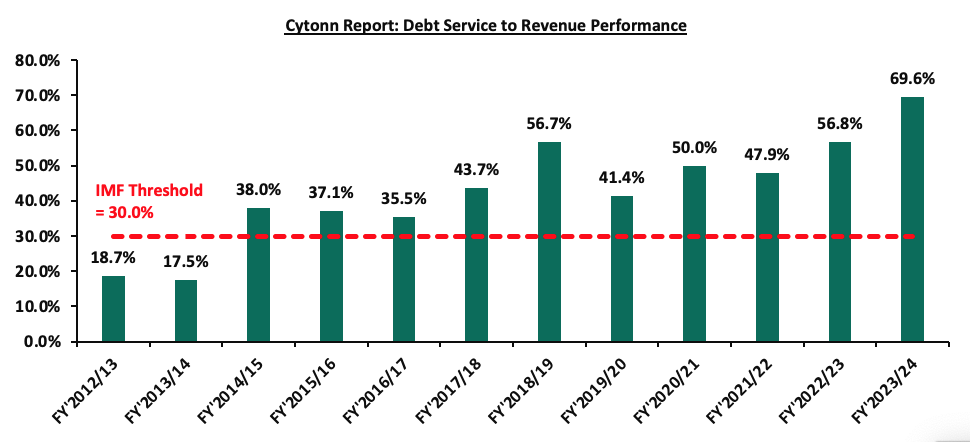
According to the Revenue and Net Expenditures Report for the FY’2023/24 by the National Treasury, the cumulative public debt servicing cost amounted to Kshs 1,596.6 bn which was 89.6% of the revised estimates of Kshs 1,782.4 bn, and 91.2% of the original estimates of Kshs 1,751.1 bn. Notably, the Kshs 1,596.6 bn debt servicing cost was equivalent to 69.6% of the actual revenues of Kshs 2,292.0 bn collected as at the end of FY’2023/24, which was 39.6% points above IMF’s recommended threshold of 30.0%. The sustained high debt service to revenue ratio above the recommended threshold is a worrying sign, with a large proportion of the government’s revenue being allocated to servicing debt rather than being available for other essential expenditures. A ratio of above 50.0% means that more than half of the government's revenue is being allocated to servicing debt which may leave limited fiscal space for public investments, social programs, and other critical government functions, which are essential for the long-term well-being of the country, as a significant part of the budget is pre-committed to debt repayment. Below is a chart showing the debt service to revenue ratio for the last ten fiscal years:
Source: National Treasury
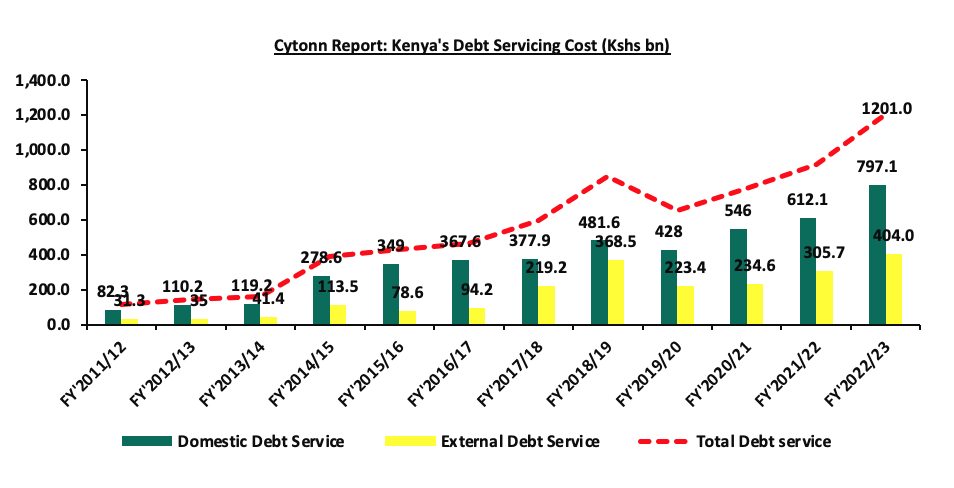
Kenya’s debt servicing costs have continued to increase over time growing at a 10-year CAGR of 23.5% to Kshs 1,201.0 bn in FY’2022/2023, from Kshs 145.2 bn in FY’2022/2023. The graph below compares the domestic debt servicing cost to the external debt servicing cost over the last ten fiscal years:
Source: National Treasury
The key take-outs from the chart include:
- Total debt service for the FY’2022/23 stood at Kshs 1,201.0 bn, a 30.9% increase from Kshs 917.8 bn recorded in FY’2021/22. Domestic debt service took the largest share, accounting for 66.4% of the total debt service, equivalent to Kshs 797.1 bn, while external debt service represented 33.6%, equivalent to Kshs 404.0 bn in FY’2022/23, and,
- Interest payments made up the bulk of Kenya’s debt servicing costs coming in at Kshs 689.0 bn, equivalent to 57.4% of the total debt service in FY’2022/2023, higher than the Kshs 578.0 bn worth of interest payments in FY’2021/2022 and equivalent to 63.0% of the total debt service costs as at June 2022. Notably, the domestic interest payments came in at Kshs 533.1 bn, while the external interest payment was Kshs 155.9 bn in FY’2022/2023.
Section III: Economic Consequences of High Debt Levels
The COVID-19 pandemic left numerous sub-Saharan African countries grappling with a fragile global economy, escalating prices, costly loans, and a high cost of living. Many of these nations continue to face challenges like high inflation, elevated interest rates, currency fluctuations, and political instability. Consequently, many developing countries, including Kenya, have had to increase borrowing to shield their economies from additional economic shocks caused by internal geopolitical tensions and supply chain disruptions amid emerging global conflicts. However, this ongoing borrowing has led to significant debt accumulation, posing several implications for the Kenyan economy.
- Impact on currency value-High debt levels can lead to a depreciation of the national currency. Investors may lose confidence in the country's ability to manage its debt, leading to capital flight and a weaker currency. A depreciated currency can increase the cost of imports, contributing to inflationary pressures,
- Increased Debt Servicing Costs – High debt levels have led to increased costs of debt servicing given that a significant portion of the debt is in foreign currencies despite the fact that the Kenyan Shilling has been strengthening. The government has had to increase taxes and cut spending in other areas to meet its debt obligations and the conditions set by Multilateral lenders such as the IMF,
- Higher Borrowing Costs on New Loans – Given the country’s high levels of debt, lenders perceive Kenya’s credit environment to be riskier, therefore demanding higher interest rates for new borrowing. This makes it more expensive for the government to finance its operations and investments,
- Reduced Fiscal Space – High debt levels tend to limit a government’s fiscal space, or its ability to respond to economic shocks with fiscal policy. This is because a large portion of the government’s budget gets tied up in debt servicing, leaving less money for other expenditures and development,
- Crowding Out of the Private Sector – Because of the increased domestic borrowing, the government crowds out the private sector by driving up interest rates in the economy thus making it difficult for both businesses and individuals to borrow, and,
- Risk of Default – High levels of debt can lead to default, where a country is unable to meet its debt obligations. For Kenya’s situation, credit rating agencies such as Fitch and Moody’s have downgraded the country’s credit outlook from stable to negative resulting in increased borrowing costs and loss of investor confidence.
Section IV: Kenya’s Debt sustainability Analysis and Outlook
As discussed in above sections, the country’s risk of debt distress remains elevated as evidenced by the high debt service to revenue ratio of 69.6% as of June 2024. Additionally, Kenya’s debt to GDP ratio currently stands at 70.0%, 20.0% points above IMF’s recommended threshold of 50.0% for developing countries. Notably, Kenya’s public debt recorded a 5-year CAGR of 10.1% to Kshs 10.6 tn in June 2024, outpacing the economic growth’s 5-year average of 4.6%, with the International Monetary Fund (IMF) projecting Kenya’s 2024 GDP growth to come in at 5.0% as of January 2024, a downward revision from its projection of 5.3% made in July 2023 as a result of high interest rates and domestic shocks in emerging economies in the G20 such as China, whose spills over effects are being projected to impact Kenya’s economic output. The persistent fiscal deficits resulting from the revenue-expenditure mismatch continue to hamper fiscal consolidation efforts as revenue continues to lag behind expenditure.
Kenya’s debt levels have been of concern, with the recent ratings by S&P Global, Fitch and Moody’s credit agencies downgrading the country’s credit outlook from stable to negative. Notably, on July 8th 2024, Moody’s announced its revision of Kenya’s credit score, downgrading it by one scale to Caa1 from a credit rating of B3 while maintaining a negative outlook, on the back of the government's decision to forgo proposed tax increases through the Finance Bill 2024 and rely on expenditure cuts, significantly impacting Kenya's fiscal trajectory and financing needs. The downgrades of Kenya’s credit score have dimmed the country’s ability to access cheaper loans in the international financial markets. Below is a summary of the credit rating on Kenya by various rating agencies;
|
Cytonn Report: Kenya Credit Rating Agencies Ratings |
|||||
|
Rating Agency |
Previous Rating |
Previous Outlook |
Current Rating |
Current Outlook |
Date Released |
|
Moody's Rating |
B3 |
Negative |
Caa1 |
Negative |
8th July, 2024 |
|
Fitch Ratings |
B |
Negative |
B |
Negative |
16th February 2024 |
|
S&P Global |
B |
Negative |
B |
Negative |
9th February 2024 |
Source: Fitch Ratings, S&P Global
With the tough macro-economic environment currently being witnessed in the country, the government’s projection of increased revenues especially through tax collection may fall short of its target, thus leading to continuous need for borrowing. The table below gives the trend of both expenditure and revenue growths in the last five financial years and projections in the medium term;
|
Cytonn Report: Public Debt (Kshs tn) |
|||||||
|
FY'2019/20 |
FY'2020/21 |
FY'2021/22 |
FY2022/23 |
*FY2023/24 |
**FY2024/25 |
**FY2025/26 |
|
|
Cumulative Domestic Debt |
3.2 |
3.7 |
4.3 |
4.8 |
5.4 |
5.9 |
6.4 |
|
Cumulative External Debt |
3.4 |
3.8 |
4.3 |
5.4 |
5.2 |
5.8 |
6.0 |
|
Total |
6.5 |
7.5 |
8.6 |
10.3 |
10.6 |
11.7 |
12.4 |
|
Expenditure |
2.6 |
2.8 |
3.0 |
3.2 |
3.8 |
3.9 |
4.5 |
|
Revenue Collected |
1.6 |
1.6 |
1.9 |
2.1 |
2.3 |
3.0 |
3.3 |
|
Budget Deficit |
1.0 |
1.2 |
1.1 |
1.1 |
1.5 |
1.2 |
1.2 |
|
Domestic Borrowings |
0.5 |
0.6 |
0.6 |
0.5 |
0.7 |
0.4 |
0.6 |
|
External Borrowings |
0.3 |
0.3 |
0.1 |
0.3 |
0.3 |
0.3 |
0.3 |
|
Total |
0.8 |
1.0 |
0.7 |
0.8 |
1.0 |
0.7 |
0.9 |
|
Domestic debt service |
0.4 |
0.5 |
0.6 |
0.8 |
1.3 |
1.1 |
|
|
External debt Service |
0.2 |
0.2 |
0.3 |
0.4 |
0.6 |
0.7 |
|
|
Total Debt Service |
0.7 |
0.8 |
0.9 |
1.2 |
1.6 |
1.9 |
1.8 |
|
Debt service to Revenue |
41.4% |
50.0% |
47.9% |
56.0% |
69.6% |
63.4% |
53.5% |
*Provisional data as per the June 2024 Exchequer Issue
**Projected data
Source: National Treasury (Annual Public Debt Management Report and Budget Policy Statement)
Key take outs;
- Debt servicing costs are expected to remain high in the FY’2023/24 due to the need for more borrowings. The high borrowings are expected to be channelled to debt repayment, financing the increasing fiscal deficit as KRA lags behind the target and the depreciating shilling continues to increase debt repayment costs,
Our View: Debt service is projected to grow in FY’2024/25 with debt servicing costs remaining high due to the continued local and external debt maturities,
- Revenue is expected to grow at a 5-year CAGR of 13.9% to Kshs 3.7 tn by the end of FY’2025/26, from Kshs 1.9 tn in FY’2021/22, attributable to the government’s focus to increased tax revenues. Due to the unfavourable business climate, combined with high inflation, the withdrawal of the Finance Bill 2024 and limited liquidity in the country, it is anticipated that revenue collections will not meet the target. Consequently, the success of revenue collection is heavily reliant on the country’s economic performance and how quickly the business environment improves,
- Compared to revenue, expenditure is expected to grow at a relatively slower 5-year CAGR of 8.0% to Kshs 4.5 tn by the end of FY’2025/26, from 3.0 tn recorded in FY’2021/22, on the back of increased recurrent expenditure and persistent current account deficit, and,
- The budget deficit is expected to narrow in the projected years as revenue is projected to increase at a faster rate compared to expenditure. The persistent budget deficit in the projected financial years, is an indication of the need for further borrowing, impeding the government’s in managing the current debt level.
It is clear that the government faces challenges on how they shall finance their operations in the next couple of months as the debt servicing is high and the economic activity is much slower. The KRA collections for the FY’2023/24 amounted to Kshs 2.4 tn, falling short of the tax revenue target of Kshs 2.5 tn, mainly attributed to the tough macroeconomic situation in the country. The situation is exacerbated by the government's decision to forgo proposed tax increases through the Finance Bill 2024 and rely on expenditure cuts, significantly impacting Kenya's fiscal trajectory and financing needs. As a result, the government’s capability to repay its upcoming maturities and meet its debt obligations is still a major concern.
Section V: Comparison with other African countries
Kenya's elevated debt situation is part of a broader trend seen across the sub-Saharan region, where debt levels remain high. According to World Bank’s International Debt Statistics, Africa's debt-to-GDP ratio reached 68.6% at the end of 2023, with 75.0% of this debt being long-term. Notably, 67.0% of the continent's debt is concentrated in just ten countries. Egypt leads with 14.5% of Africa's total debt, followed closely by South Africa at 14.3%. Kenya accounts for 3.7% of the continent's debt, while Tunisia, Sudan, and Ghana each hold between 3.0% and 3.4%. This concentration of debt among a few countries highlights the significant financial pressures faced by these economies within the region. The graph below highlights the composition of the debt by the top 10 countries as a percentage of total region debt:
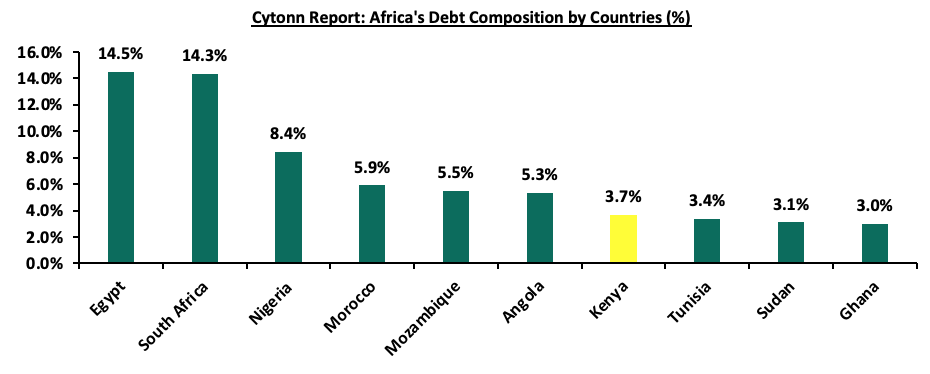
Source: Afrexim Bank Research
Currently, China makes up the largest portion of Africa’s debt stock, and is Africa’s biggest bilateral lender. As of 2023, China held almost USD 24.4 tn of Africa’s external debt. The graph below shows Africa’s debt to China in the last 15 years:
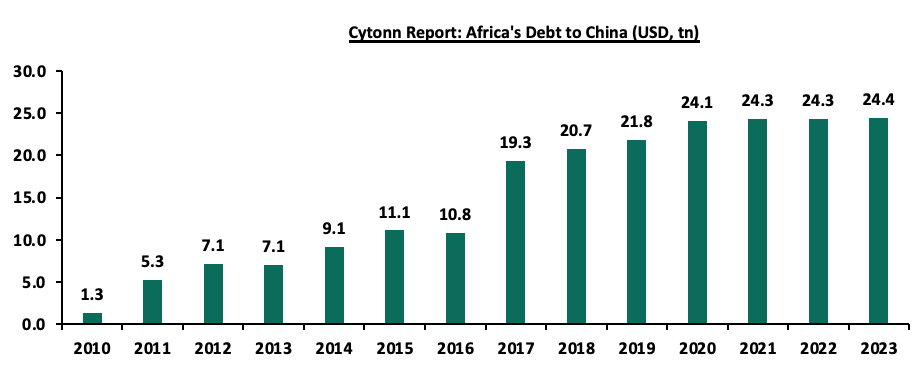
Source: International debt statistics
Additionally, Africa’s debt to service ratio came in at 19.6% in 2023 according to the African Export-Import bank report, with 34 countries recording an increase in the ratio during the year. A high debt service to revenue ratio indicates vulnerability of the country and increased unsustainability of the country’s debt. The table below summarizes debt indicators for select countries in the region as of 2023:
|
Cytonn Report: Select African Countries Debt Ratios |
||||
|
|
Debt to GDP |
Debt service to revenue |
Tax Revenue to GDP |
Expenditure to GDP |
|
Zambia |
99.5% |
14.0% |
16.8% |
14.3% |
|
Mauritius |
85.9% |
11.8% |
19.0% |
15.9% |
|
Ghana |
84.9% |
43.5% |
11.3% |
6.7% |
|
Senegal |
75.0% |
30.5% |
18.7% |
16.3% |
|
South Africa |
72.2% |
21.3% |
25.9% |
19.2% |
|
Kenya |
70.0% |
69.6% |
15.2% |
24.6% |
|
Rwanda |
62.1% |
15.9% |
15.0% |
17.0% |
|
Uganda |
48.6% |
18.4% |
12.5% |
9.8% |
|
Nigeria |
38.8% |
66.9% |
7.0% |
12.0% |
|
Tanzania |
38.3% |
44.6% |
11.7% |
8.3% |
|
Ethiopia |
38.0% |
31.0% |
6.2% |
7.4% |
Source: IMF, World bank, Afrexim Bank
From the table above,
- Zambia has the highest debt to GDP ratio of the select sub-Saharan region countries, at 99.5%, while Ethiopia has the least ratio at just 38.0%. At 70.0%, Kenya’s debt-to-GDP ratio ranks sixth of the select countries. Of these select countries, only four have a ratio below the IMF recommended threshold of 50.0%,
- On Debt service to Revenue ratio, which measures the amount of a country’s revenue that goes into payment of debt, Kenya had the highest ratio at 69.6%, followed closely by Nigeria at 66.9%. Mauritius had the lowest ratio, at 11.8%, indicating much more stability and sustainability of the country’s debt,
- South Africa recorded the highest tax revenue to GDP ratio, at 25.9%. This ratio indicates the level of taxation in a country relative to its GDP. A high ratio could indicate the country has a larger fiscal ability and can meet most of its requirements efficiently. Kenya’s ratio stood at 15.2%, while Ethiopia recorded the lowest ratio at 6.2%, and,
- On government spending to GDP ratio, Kenya led at 24.6%. This ratio measures the size of a government's expenditures relative to the overall economic output of a country. Kenya’s high ratio indicates that our government plays a larger role in the economy as compared to the other countries, with significant public sector activities and social services.
The continent has also had access to the global finance markets, with four countries issuing Eurobonds in 2024. Kenya, Benin, and Ivory Coast issued Eurobonds earlier this year. In January, Ivory Coast (Côte d’Ivoire) January 2024 Eurobond issued two bonds with maturities of 8.5 years and 12.5 years, which fetched coupon rates of 7.6% and 8.3% respectively. Notably, the sovereign raised a total of USD 2.6 bn from the two tranches, with the two issues recording an oversubscription of over USD 8.0 bn. This issue was quickly followed by Benin’s issue of a 14-year bond with a coupon rate of 8.45%, a bond that was oversubscribed at 666.7%. Kenya then went into the market for a USD 1.5 bn Eurobond, which it got at a yield of 10.4% and a coupon rate of 9.8%, which was used to buy back a maturing bond. Cameroon was the most recent country to tap into the markets this July, issuing a USD 550.0 mn bond with a 7-year tenor and a yield of 10.8%, replacing Kenya for the most expensive bond issued in recent years.
Section VI: Conclusions and Recommendations
Kenya's public debt situation underscores the need for prudent fiscal management and strategic planning to ensure that the debt remains sustainable and does not compromise the country's economic prospects. It is essential to strike a balance between funding the government's development projects and maintaining debt at manageable levels. To address the challenges posed by the high public debt in Kenya, here are some actionable steps that the Kenyan government can consider:
- Enhanced Debt Management – Implement a comprehensive debt management strategy that encompasses short, medium, and long-term objectives which regularly assess the cost and risk profile of the debt portfolio as well as Prioritizing refinancing high-cost debt with lower-cost alternatives to reduce debt service obligations,
- Capital Markets Reform – The government should Strengthen the regulatory and supervisory framework for capital markets and improve the efficiency, stability, and inclusiveness of the financial sector, especially the markets for stocks, bonds, and other securities to improve capital formation and foreign direct investments (FDIs) flowing into the country,
- Improve Ease of Doing Business – The government should improve the competitiveness and attractiveness of the country for investors and entrepreneurs. This can be achieved by simplifying and streamlining the procedures and requirements for starting, operating, and closing a business. Also Promoting a conducive and competitive business environment that fosters innovation, productivity, and growth. These measures will spur business growth and improve the country’s production thus allowing the government to collect more revenue,
- Focus on Areas of Strength Such as Tourism and Diaspora - Kenya's tourism sector is a significant contributor to the economy, providing jobs, generating foreign exchange, and boosting infrastructure development. Additionally, the Kenyan diaspora plays a crucial role in remittances, which are a vital source of foreign currency. By investing in the tourism sector and fostering stronger ties with the diaspora, government can enhance its appeal as a premier travel destination and create favourable conditions for diaspora remittance flow to help diversify income sources and reduce reliance on debt.
- Fiscal Consolidation – High fiscal deficit is attributable to higher growth in expenditure volumes relative to revenue collections, creating the need for excessive borrowing levels. The government needs to implement robust fiscal consolidation through expenditure reduction by introducing austerity measures and limit capital expenditure to projects with either high social impact or have a high Economic Rate of Return (ERR), and high economic benefits outweighing costs,
- Investment in Productive Sectors – Direct investments toward sectors that have the potential for high economic growth and job creation, such as infrastructure, agriculture, and manufacturing as well as developing targeted incentive programs to attract both domestic and foreign investments in these sectors,
- Public-Private Partnerships (PPPs) – The government should identify infrastructure projects suitable for PPP arrangements and incentivize the private sector to participate in such projects, thus sharing the financial burden and transferring project risk to the private sector,
- Improving the Country’s Exports – The government should formulate export and manufacturing favourable policies to improve the current account. This would stabilize the exchange rate and stop our foreign-denominated debt from increasing as the shilling depreciates,
- Efficient Tax Collection – The government should strengthen tax collection and administration to improve revenue collection without increasing tax rates significantly. This can be done through broadening the tax base while ensuring tax policies are equitable and do not disproportionately burden the lower-income segments of the population,
- Transparency and Accountability: Maintain transparency in the utilization of borrowed funds and ensure that loans are allocated to projects with measurable returns. Better governance will help to reduce wastage and corruption levels that had impeded proper allocation of funds towards designated projects, resulting in misappropriation of funds,
- Cut Corruption and Wastage: Corruption and wastage of resources have long been significant impediments to Kenya's economic development. Addressing these issues is crucial for improving public trust and ensuring that borrowed funds and public revenues are used effectively, leading to better outcomes in public service delivery and infrastructure development, ultimately contributing to a more sustainable debt position, and,
- Monitoring and Reporting: Establish mechanisms for continuous monitoring of debt levels and fiscal health, with regular reporting to stakeholders and the public.
Addressing the public debt issue is a collective effort that requires cooperation among policymakers, stakeholders, and the general public, all working together to secure the country’s financial future and prosperity.
Disclaimer: The views expressed in this publication are those of the writers where particulars are not warranted. This publication, which is in compliance with Section 2 of the Capital Markets Authority Act Cap 485A, is meant for general information only and is not a warranty, representation, advice or solicitation of any nature. Readers are advised in all circumstances to seek the advice of a registered investment advisor.

- Talk to us
- Kenya
- P.O Box 20695 - 00200, Nairobi, Kenya
- Cell +254709101200
- Tel +254709101200
- WhatsApp +254741676635
- United States
- +254709101200
- DOWNLOAD OUR APP
-


- Kenya
- 8th Floor, Pinetree Plaza, Kaburu Drive, Ngong Road, Nairobi, Kenya
- USA
- Suite 1150, 1775 Eye Street NW, USA, Washington DC 20006, USA
- Investments
- High Yield
- Private Equity
- Real Estate
- Real Estate
- RiverRun Estates
- Cytonn Towers
- The Ridge
- Taraji Heights
- The Alma