Status of Rate Cap Review in Finance Bill, 2018, & Cytonn Weekly #32/2018
By Cytonn Research Team, Aug 26, 2018
Executive Summary
Fixed Income
T-bills were oversubscribed during the week with the overall subscription rate coming in at 120.4%, up from 102.2% recorded the previous week. Yields on the 91-day and 364-day papers declined by 10 bps each to 7.6% and 9.9% from 7.7% and 10.0%, respectively, while the yield on the 182-day paper remained unchanged at 9.0%. During the week, the Finance and Planning committee tabled their proposals in the National Assembly during the second reading of the Finance Bill, 2018. The proposals were based on the public awareness and stake-holder participation conducted between 1st– 3rd August 2018, following the first reading of the Finance Bill, 2018 on 3rd July 2018. The committee noted that they did not have any justification to repeal the interest rate cap law, as they have not seen any efforts by banks to address the issue of high credit risk pricing;
Equities
During the week, the equities market was on a downward trend, with NASI, NSE 20 and NSE 25 declining by 0.9%, 1.2% and 1.4%, respectively. For the last twelve months (LTM), NASI has gained 2.5%, while NSE 20 and NSE 25 have declined by 18.7% and 0.5%, respectively, with year to date (YTD) gains of 1.0%, (11.2%) and 1.6% by NASI, NSE 20, and NSE 25, respectively. Standard Chartered Bank, NIC Group and National Bank of Kenya released H1’2018 financial results, recording core earnings per share growth of 30.3%, (2.1%), and 39.3%, respectively
Private Equity
In the financial services sector, Old Mutual, a UK based financial services group has entered into a Share Purchase Agreement with two key shareholders of UAP-Old Mutual Holdings, a financial services company based in Kenya. Old Mutual will acquire a combined stake of 6.0%, equivalent to 12.7 mn shares from Joe Wanjui, the Chairman and James Muguiyi, a Director at UAP-Old Mutual Holdings. The transaction is valued at GBP 24.0 mn (Kshs 3.1 bn), which puts the value of UAP-Old Mutual Holdings at GBP 400.0 mn (Kshs 52.0 bn) and implied transaction multiple of 2.7x price to book value. In fundraising, Dubai-based private equity firm Abraaj Holdings’ investors have appointed US firm AlixPartners to oversee the separation of Abraaj Growth Markets Health Fund (AGHF). The Dubai-based private equity firm with USD 13.6 bn in assets under management has been accused of misusing funds earmarked for the AGHF;
Real Estate
The real estate sector recorded increased activity during the week, with Double Win Company Limited announcing plans to develop a 168-unit residential apartment complex in Hurligham, Nairobi. Central Bank of Kenya (CBK) released the Bank Supervision Annual Report 2017, which included a residential mortgage market survey, highlighting the size of mortgage portfolio, mortgage loan characteristics, mortgage risk characteristics and the obstacles to the development of the mortgage market. In the infrastructural sector, the Kenyan Government is set to sign a contract with a Chinese contractor, China Communications Construction Company (CCCC), for the construction of the Second Phase (2B) of the Standard Gauge Railway (SGR), which is set to cost Kshs 380.0 bn, and will run from Naivasha to Kisumu;
Focus of the Week
This week we revisit the interest rate cap topic following the proposed amendments to the Finance Bill, 2018, tabled by the Parliamentary Committee on Finance and Planning in the National Assembly during its second reading. The Finance Bill, 2018, during its first reading, proposed the repeal of section 33B of the Banking Act, which would result in the elimination of the Central Bank’s powers to enforce an interest rate cap in banks and other financial institutions. However, based on the committee’s deliberations and input from the public, the committee is now of the view that, (i) the upper limit on interest rate charged on borrowers, which is capped at 400 basis points above the CBR, should be maintained, stating that there is no justification for the repeal of the cap, as banks have not shown efforts to address the issue of high credit risk pricing, and (ii) the floor set for deposit rates paid to depositors at 70% of the CBR should be repealed. To quote the chair of the committee, “We propose to retain the status quo and maintain the upper cap on the lending rate but, we propose removing the lower cap on the saving rate so that the banks and customers are left to discuss about the interest rates to be given on savings.” We therefore look at what led to the enactment of the interest rate cap, the effects it has had, and, including our view on parliament’s proposal to maintain the law. We conclude with the view that the law should be repealed. However, a successful repeal of the law must be accompanied by important legislation that will address the existing bank dominance, and funding reliance we have on banks and support the expansion of capital markets as an alternative to banks.
- Peris Kiarie, Risk and Compliance Assistant was on Njata T.V to discuss the process of making Investments decision. See Peris here
- Samuel Ng’ang’a was featured on The Star, with an opinion piece on “Raising the bar on financial reports” Read his article here
- The second session of Cytonn eHub Season 3 was held on 25th August 2018. The focus of the day’s session was “Identifying a Business Opportunity and Packaging Your Business Idea.” See Event Note here
- The Q2’2018 issue of our quarterly Sharp Cents Magazine, themed Sustainable Finance, is out. Read the issue here or email clientservices@cytonn.com to get a copy
- The weekly workshops and site visits target both investors looking to invest in real estate directly and those interested in high yield investment products to familiarize themselves with how we support our high yields. Watch progress videos and pictures of The Alma, Amara Ridge, The Ridge, and Taraji Heights. Key to note is that our cost of capital is priced off the loan markets, where all-in pricing ranges from 16.0% to 20.0%, and our yield on real estate developments ranges from 23.0% to 25.0%, hence our top-line gross spread is about 6.0%. If interested in attending the site visits, kindly register here
- We continue to see very strong interest in our weekly Private Wealth Management Training (largely covering financial planning and structured products). The training is at no cost and is open only to pre-screened participants. We also continue to see institutions and investment groups interested in the training for their teams. The Wealth Management Training is run by the Cytonn Foundation under its financial literacy pillar. If interested in our Private Wealth Management Training for your employees or investment group please get in touch with us through wmt@cytonn.com. To view the Wealth Management Training topics, click here
- For recent news about the company, see our news section here
- We have 10 investment-ready projects, offering attractive development and buyer targeted returns of around 23.0% to 25.0% p.a. See further details here: Summary of Investment-Ready Projects
- We continue to beef up the team with ongoing hires for Senior Operations Manager, Operations Associate and Operations Analyst in Cytonn Group as well as Financial Advisors in Nairobi and Kisumu. Visit the Careers section on our website to apply.
- Cytonn Real Estate is looking for a 0.75-acre land parcel for a joint venture in Lavington, Karen or Kiambu Road. The parcel should be in a good location with frontage to a tarmac road. For more information or leads, email us at rdo@cytonn.com
- The September intake for diploma, certificate and short professional courses offered by Cytonn College is ongoing. Learn more about the college and refer potential students who are looking for practical hands-on experience to enrol for the ongoing intake here
T-bills were oversubscribed during the week, with the overall subscription rate coming in at 120.4%, up from 102.2% recorded the previous week, due to improved liquidity in the money market. Yields on the 91-day and 364-day papers declined by 10 bps each to 7.6% and 9.9% from 7.7% and 10.0% in the previous week, respectively, while the yield on the 182-day paper remained unchanged at 9.0%. The acceptance rate for T-bills declined to 79.3% from 95.8% the previous week with the government accepting Kshs 22.9 bn of the Kshs 28.9 bn worth of bids received. The subscription rate for the 182-day and 364-day papers improved to 94.1% and 175.4% from 72.8% and 110.9%, the previous week, respectively while the subscription rate for the 91-day paper declined to 48.4% from 153.9% the previous week, with investors’ participation remaining skewed towards the longer dated paper attributed to the scarcity of newer short-term bonds in the primary market.
The Kenyan Government issued a new 10-year Treasury bond (FXD 1/2018/10) with a market determined coupon rate in a bid to raise Kshs 40.0 bn for budgetary support. The issue was under-subscribed, with the overall subscription rate coming in at 74.6%, while the weighted average rate of accepted bids came in at 12.7%, in line with our expectations of 12.7% - 13.0%. We attribute the continued undersubscription of government bonds to investors being cautious in lengthening their bond portfolio duration due to uncertainties in the interest rate environment as a result of the ongoing debate on the repeal of interest rate cap, which if passed, might result into an upward pressure on interest rates. The government accepted Kshs 19.4 bn out of the Kshs 29.8 bn worth of bids received, translating to an acceptance rate of 64.9%.
Liquidity:
The average interbank rate declined to 6.1%, from 7.0% the previous week, while the average volumes traded in the interbank market increased by 97.1% to Kshs 17.9 bn, from Kshs 9.1 bn the previous week, with the increased activity in the interbank market being attributed to a pickup in demand for funds to facilitate VAT remittances by corporates. The decline in the average interbank rate points to improved liquidity, which the Central Bank of Kenya partly attributed to banks trading currency in the interbank markets at lower interest rates during the week.
Kenya Eurobonds:
According to Bloomberg, the yield on the 5-Year Eurobond issued in 2014 increased by 0.1% points to 4.6% from 4.5% the previous week, while yield on the 10-year Eurobond declined by 0.1% points to 7.1% from 7.2% the previous week. Since the mid-January 2016 peak, yields on the Kenya Eurobonds have declined by 4.2% points and 2.5% points for the 5-year and 10-year Eurobonds, respectively, an indication of the relatively stable macroeconomic conditions in the country. Key to note is that these bonds have 0.8 years and 5.8-years to maturity for the 5-year and 10-year, respectively.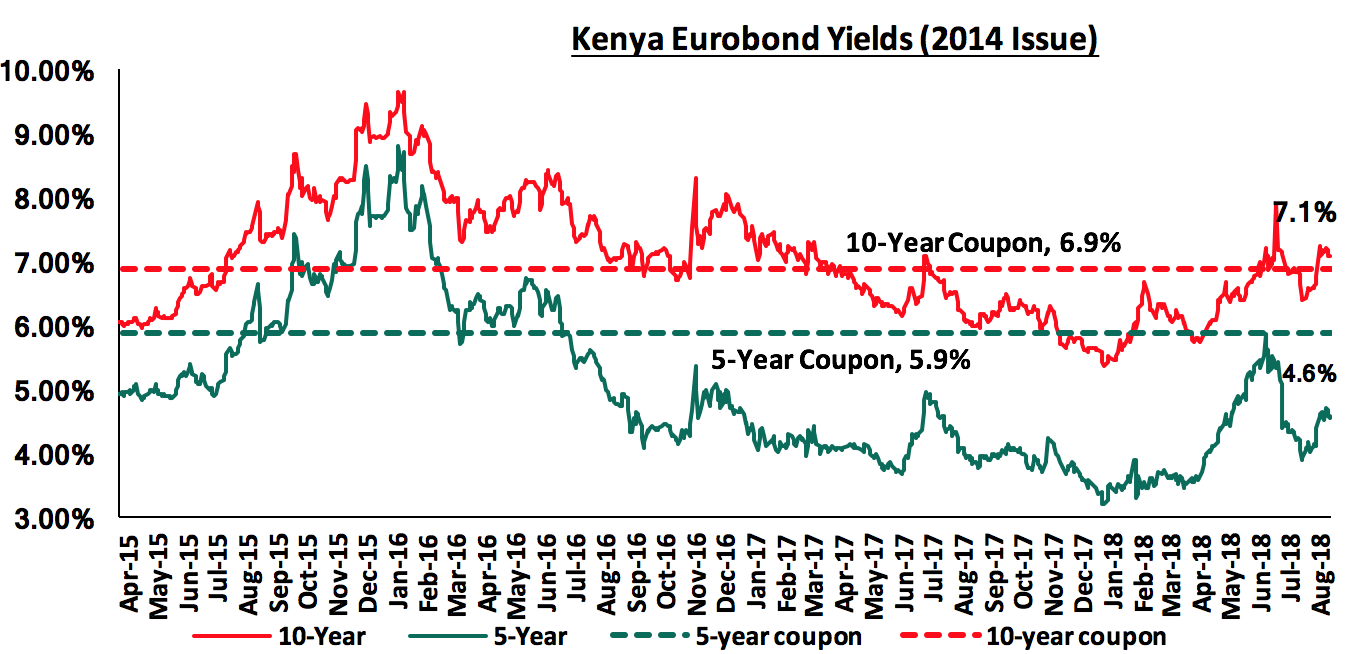
For the February 2018 Eurobond issue, during the week, the yields on both the 10-year and 30-year Eurobonds both declined by 0.1% points to 7.7% and 8.6% from 7.8% and 8.7% the previous week, respectively. Since the issue date, the yields on the 10-year and 30-year Eurobonds have increased by 0.4% points and 0.3% points, respectively.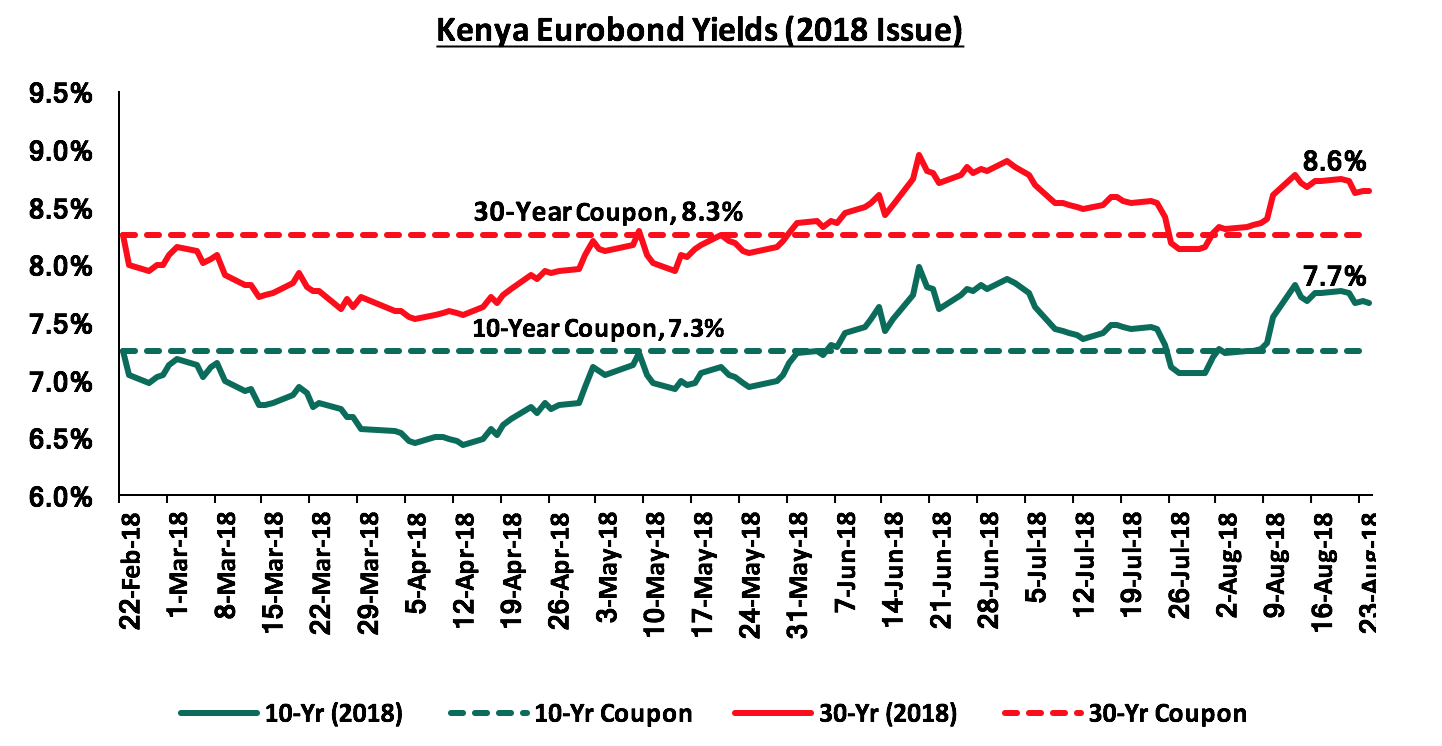
Key to note is the yields on the 2018 Eurobond issues as well as the 10-year 2014 issue which were on a decline this week, which the CBK attributed to improved investors’ risk perception in the global markets.
The Kenya Shilling:
During the week, the Kenya Shilling appreciated marginally by 0.1% against the US dollar to close at Kshs 100.7 from Kshs 100.8 the previous week, driven by the relatively balanced demand and supply of the US dollar in the interbank market. The Kenyan shilling has appreciated by 2.4% year to date and in our view the shilling should remain relatively stable against the dollar in the short term, supported by:
- The narrowing of the current account deficit to 5.8% in the 12-months to June 2018, from 6.3% in March 2018, attributed to improved agriculture exports, and lower capital goods imports following the completion of Phase I of the Standard Gauge Railway (SGR) project,
- Stronger inflows from principal exports, which include coffee, tea, and horticulture, which increased by 10.8% during the month of May to Kshs 24.3 bn from Kshs 21.9 bn in April, with the exports from coffee, tea and horticulture improving by 11.0%, 19.1% and 2.0% m/m, respectively,
- Improving diaspora remittances, which increased by 71.9% y/y to USD 266.2 mn from USD 154.9 mn in June 2017 and 4.9% m/m, from USD 253.7 mn in May 2018, with the largest contributor being North America at USD 130.1 mn attributed to; (a) recovery of the global economy, (b) increased uptake of financial products by the diaspora due to financial services firms, particularly banks, targeting the diaspora, and (c) new partnerships between international money remittance providers and local commercial banks making the process more convenient, and,
- High forex reserves, currently at USD 8.7 bn (equivalent to 5.8 months of import cover) and the USD 1.5 bn stand-by credit and precautionary facility by the IMF, still available until September 2018.
Highlights of the Week:
During the week, the committee on Finance and planning tabled their proposals in the National Assembly during the second reading of the Finance Bill, 2018. The proposals were based on the comments received during public awareness and stake-holder participation conducted between 1st – 3rd August 2018, following the first reading of the Finance Bill, 2018 on 3rd July 2018 which proposed the repeal of section 33B of the Banking Act, which would result in the elimination of the Central Bank’s powers to enforce an interest rate cap in banks and other financial institutions. Based on the deliberations, the committee was of the view that there is no justification for the repeal the interest rate cap, as there was no effort by banks to address the issue of high credit risk pricing. The committee also proposed that the Central Bank Rate (CBR) ought to be maintained as the benchmark rate as opposed to the Kenya Bank reference rate (KBRR) since the latter was not yet operational. The committee also proposed the removal of the 70.0% minimum limit on deposits, pegged on the Central Bank Rate (CBR) and instead, leave the decision of the interest rate to be given on deposits at the discretion of the banks and customers.
The committee also proposed the following exemptions to the Robin Hood Tax, with the proposed amendments set to be introduced during the third reading of the Finance Bill, 2018;
- Exemption on transfers between accounts belonging to the same person within the same bank/financial institution,
- Exemption on the transfer of funds by or to the national government, county governments or the Central Bank of Kenya,
- Exemption on the transfer of taxes remitted to Kenya Revenue Authority (KRA) as well as refunds from KRA,
- Exemptions on the transaction of funds from the KRA collection accounts at the central bank,
- Exemption on transfer of funds related to the purchase and sale of shares and securities at the Nairobi Securities Exchange (NSE),
- Exemption on the transfer of funds to and from registered retirement benefit schemes, and
- Exemption on Inter-bank transfers between bank and non-bank financial institutions or between non-bank financial institutions.
We have expounded more on the issues surrounding the interest rate cap on this week’s focus note, and we maintain our view that a repeal or at least a significant review of the Banking (Amendment) Act, 2015, is essential given that the current regulatory framework has hampered credit growth, evidenced by the low private sector credit growth, which stood at 4.3% as at June 2018, below the 5-year average of 13.1%. We also commend the proposed exemptions on the robin hood tax. The exemption on inter-bank transfers has addressed the concerns on the negative effect on liquidity as banks would resort in holding cash to avoid extra charges from interbank transfers. There were also concerns on erosion on investment returns from transactions related to purchase and sale of shares which has also been addressed.
We are projecting the inflation rate for the month of August to range between 4.0% - 4.4%. The month on month inflation is expected to rise mainly due to:
- An increase in petrol prices by 1.3% to Kshs 113.7 from Kshs 112.2 per litre previously, despite diesel prices having declined by 0.5% to Kshs 102.7 per litre, for the period of 15th August – 14th September 2018, this will directly affect transport costs and indirectly affect food prices in August,
- An increase in electricity prices, despite the scrapping of the Kshs 150.0 standing charge. This is because of higher rates charged to households due to a reduction in the subsidized rate to low income households, which was previously capped at 50 units per month under the old tariff regime but has now been reduced to 15 units of power per month, and
- An increase in some food prices outweighing a decline in others as well as the pass through effect from transport costs.
We expect inflation in H2’2018 to experience upward pressure, partly due to the expected rise in fuel and transport prices with the introduction of 16.0% VAT on petroleum products as from September 2018, which was first introduced in the VAT Act in 2013 with a grace period of 3 years that would have seen its enforcement in September 2016 but was further deferred by 2 years to September 2018. We however still expect inflation to remain within the government’s set target of 2.5%-7.5% during the year.
Rates in the fixed income market have been on a declining trend, as the government continues to reject expensive bids as it is currently 46.6% ahead of its pro-rated borrowing target for the current financial year, having borrowed Kshs 69.0 bn against a prorated target of Kshs 46.6 bn. The 2018/19 budget gives a domestic borrowing target of Kshs 271.9 bn, 8.6% lower than the 2017/2018 fiscal year’s target of Kshs 297.6 bn, which may result in reduced pressure on domestic borrowing. However, the National Treasury has proposed to repeal the interest rate cap, which if repealed can result in an upward pressure on interest rates, as banks would resume pricing of loans to the private sector based on their risk profiles. With the cap still in place, and the national assembly not keen on repealing it, citing that there have been no concerted efforts by banks to address high credit risk pricing, we maintain our expectation of stability in the interest rate environment. With the expectation of a relatively stable interest rate environment, our view is that investors should be biased towards medium-term fixed-income instruments.
Market Performance:
During the week, the equities market was on a downward trend, with NASI, NSE 20 and NSE 25 declining by 0.9%, 1.2% and 1.4%, respectively; taking their YTD performance to 1.0%, (11.2%) and 1.6%, for NASI, NSE 20 and NSE 25, respectively. This week’s performance was driven by declines in most of the large-cap counters; with NIC Group, EABL, KCB Group, Co-operative Bank and Barclays Bank declining by 5.8%, 3.3%, 3.0%, 2.9% and 2.1%, respectively. For the last twelve months (LTM), NASI has gained 2.5%, while NSE 20 and NSE 25 have declined by 18.7% and 0.5%, respectively.
Equities turnover decreased by 35.9% this week to USD 17.3 mn from USD 26.9 mn the previous week, with foreign investors dominating market with a net selling position. On a YTD basis, foreign investors have remained net sellers, recording a net outflow of USD 195.2 mn as they exit the market at relatively expensive valuations so as to realize capital gains earned from the bullish rally witnessed from Q2’2017 to March 2018, for possible re-entry at cheaper valuations. We expect the market to remain resilient this year supported by positive investor sentiment, as investors take advantage of the attractive stock valuations in select counters.
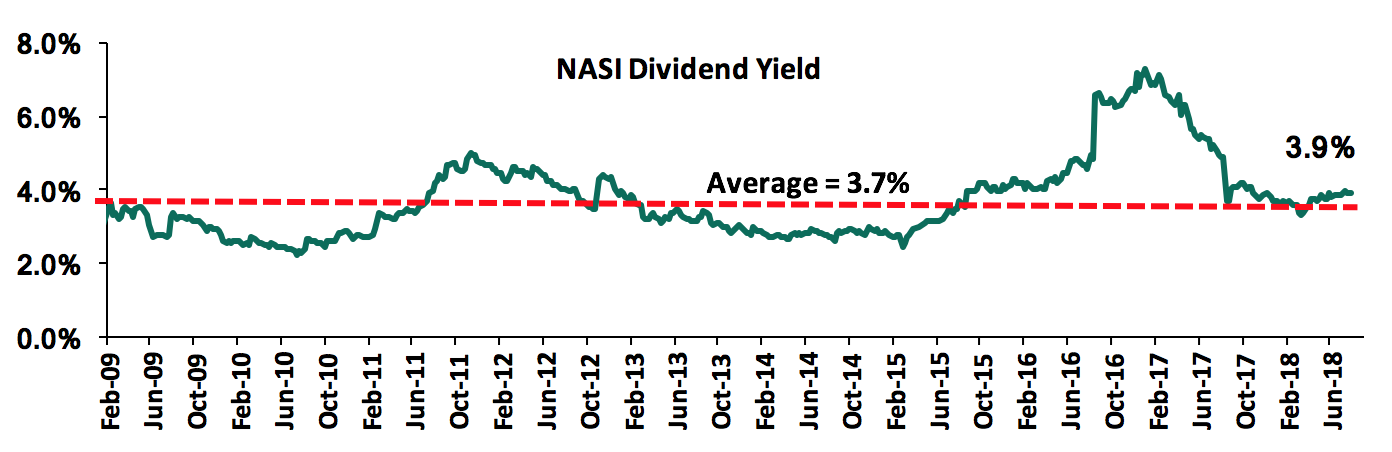
The market is currently trading at a price to earnings ratio (P/E) of 13.8x, which is 2.2% above the historical average of 13.5x, and a dividend yield of 3.9%, which is higher than the historical average of 3.7%. The current P/E valuation of 13.8x is 40.8% above the most recent trough valuation of 9.8x experienced in the first week of February 2017, and 66.3% above the previous trough valuation of 8.3x experienced in December 2011. The charts below indicate the historical P/E and dividend yields of the market.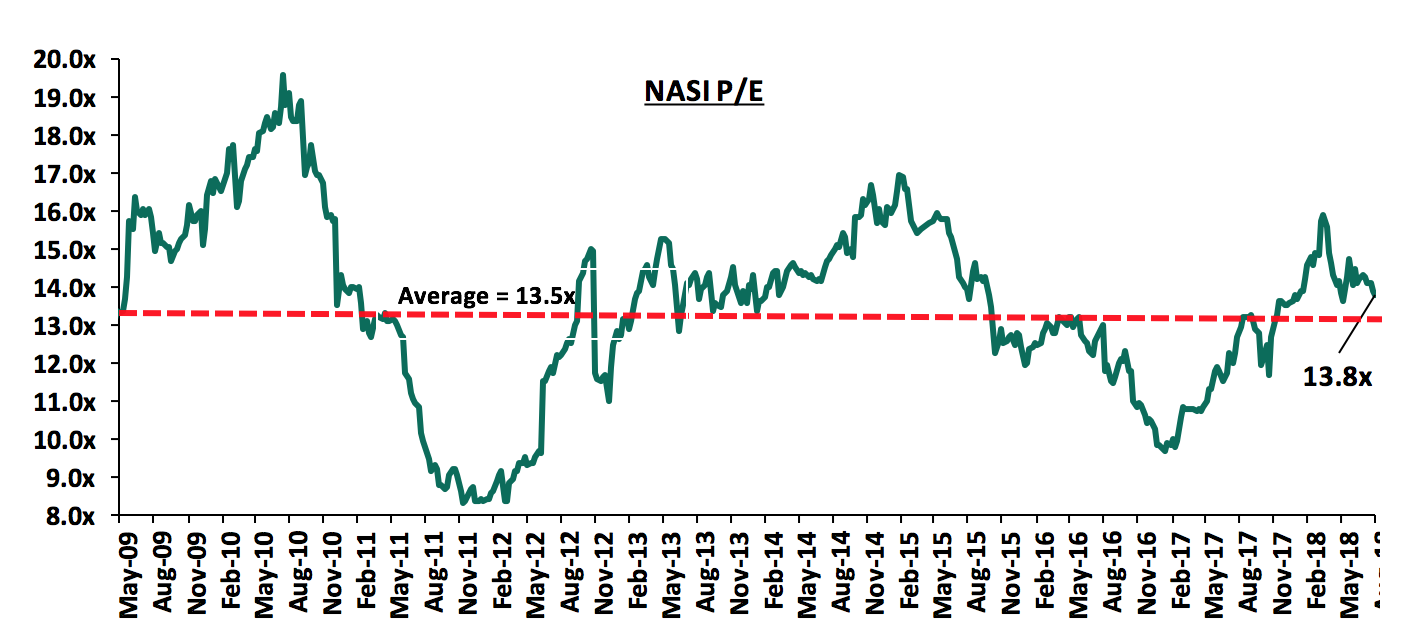
Weekly Highlights:
Standard Chartered Bank Kenya released H1’2018 results during the week;
Standard Chartered Bank released H1’2018 results, with core earnings per share growth of 30.3% to Kshs 13.0 from Kshs 10.0 in H1’2017, slightly higher than our expectation of a 26.0% increase to Kshs 12.6. The improvement in performance was driven by a 9.0% rise in total operating income coupled with a 4.5% decline in total operating expenses.
Highlights of the performance from H1’2017 to H1’2018 include:
- Total operating income increased by 9.0% to Kshs 14.7 bn in H1’2018 from Kshs 13.5 bn in H1’2017. Performance was driven by a 7.5% increase in Net Interest Income (NII) to Kshs 9.8 bn from Kshs 9.2 bn in H1’2017, coupled with a 12.2% increase in Non-Funded Income (NFI) to Kshs 4.8 bn from Kshs 4.3 bn in H1’2017,
- Interest income increased by 7.9% to Kshs 13.7 bn from Kshs 12.7 bn in H1’2017 bn, driven by an increase in interest income on government securities that rose by 23.2% to Kshs 6.4 bn in H1’2018 from Kshs 5.2 bn in H1’2017. However, interest income on loans and advances declined by 2.0% to Kshs 6.7 bn from Kshs 6.9 bn in H1’2017. The yield on interest earning assets increased slightly to 11.3% in H1’2018 from 11.2% in H1’2017, due to the relatively faster increase in the interest income by 7.9% compared to the 3.1% rise in interest earning assets to Kshs 241.8 bn from Kshs 234.6 bn in H1’2017,
- Interest expense increased by 8.8% to Kshs 3.9 bn from Kshs 3.6 bn in H1’2017, following an 11.0% increase in the interest expense on customer deposits to Kshs 3.4 bn from Kshs 3.0 bn in H1’2017. Other interest expenses also increased by 11.3% to Kshs 0.51 bn in H1’2018 from Kshs 0.46 bn in H1’2017, while interest expense on bank placements declined by 68.5% to Kshs 0.03 bn from Kshs 0.1 bn. Consequently, the cost of funds increased to 3.6% from 3.5% in H1’2017, while the Net Interest Margin declined to 8.0% from 8.2% in H1’2017,
- Non-Funded Income increased by 12.2% to Kshs 4.8 bn from Kshs 4.3 bn in H1’2017. The growth in NFI was driven by a 35.6% increase in other fees and commissions to Kshs 2.8 bn from Kshs 2.1 bn in H1’2017, and an 11.6% rise in foreign exchange trading income to Kshs 1.4 bn from 1.2 bn in H1’2018. The current revenue mix stands at 67:33 funded to non-funded income as compared to 68:32 in H1’2017. The proportion of non-funded income to total revenue increased slightly owing to the faster growth in NFI as compared to NII,
- Total operating expenses declined by 4.5% to Kshs 8.1 bn from Kshs 8.5 bn in H1’2017, largely driven by a 45.2% decline in loan loss provisions to Kshs 1.3 bn in H1’2018 from Kshs 2.3 bn in H1’2017. However, other operating expenses increased by 27.5% to Kshs 2.6 bn from Kshs 2.1 bn in H1’2017. Staff costs increased marginally by 1.9% to Kshs 3.33 bn from Kshs 3.23 bn in H1’2018,
- The cost to income ratio improved to 55.2% from 63.0% in H1’2017. Without LLP, the cost to income ratio deteriorated to 46.6% from 45.8% in H1’2017,
- Profit before tax increased by 32.0% to Kshs 6.6 bn from Kshs 5.0 bn in H1’2017. Profit after tax rose by 30.3% to Kshs 4.5 bn in H1’2018 from Kshs 3.4 bn in H1’2017,
- Standard Chartered Bank declared an interim dividend of Kshs 5.0 per share. We expect a final dividend per share of Kshs 17.0, taking the total dividend for 2018 to Kshs 22.0 per share, translating to a dividend yield of 10.6%,
- Total assets increased by 2.4% to Kshs 296.0 bn from Kshs 289.1 bn in H1’2017. This growth was driven by a 3.5% increase in government securities to Kshs 120.9 bn from Kshs 116.8 bn in H1’2017. The loan book declined by 1.1% to Kshs 111.7 bn in H1’2018 from Kshs 113.0 bn in H1’2017,
- Total liabilities rose by 2.4% to Kshs 251.3.7 bn from Kshs 245.5 bn in H1’2017, driven by a 2.8% increase in customer deposits to Kshs 230.8 bn from Kshs 224.5 bn in H1’2017. Deposits per branch increased by 2.8% to Kshs 6.4 bn from Kshs 6.2 bn in H1’2017 as the bank’s branches declined to 36 from 40 in 2017,
- The growth in deposits coupled with the decline in loans led to a decline in the loan to deposit ratio to 48.4% from 50.4% in H1’2017,
- Gross non-performing loans increased by 9.7% to Kshs 18.5 bn in H1’2018 from Kshs 16.9 bn in H1’2017. As a consequence, the NPL ratio deteriorated to 15.5% in H1’2018 from 13.5% in H1’2017. Loan loss provisions increased by 4.4% to Kshs 7.1 bn from Kshs 6.8 bn in H1’2017. The NPL coverage increased to 75.0 % in H1’2018 from 71.9% in H1’2017,
- Shareholders’ funds increased by 2.4% to Kshs 44.6 bn in H1’2018 from Kshs 43.6 bn in H1’2017,
- Standard Chartered Bank Kenya Limited is currently sufficiently capitalized with a core capital to risk weighted assets ratio of 15.8%, 5.3% above the statutory requirement. In addition, the total capital to risk weighted assets ratio was 18.6%, exceeding the statutory requirement by 4.1%. Adjusting for IFRS 9, the core capital to risk weighted assets stood at 16.1%, while total capital to risk weighted assets came in at 19.0%, indicating that the bank’s total capital relative to its risk-weighted assets declined by 0.3% due to implementation of IFRS 9,
- Standard Chartered Bank currently has a return on average assets of 2.7% and a return on average equity of 18.0%, compared to the Tier 1 and 2 average of 21.0%
We expect the bank’s growth to be further driven by:
- Growth in NFI which increased by 12.2% in H1’2018. We expect the growth in NFI to be driven by increased adoption of alternative channels with the implementation of their “Digital by Design strategy” which is targeting to migrate over 80% of transactions to alternative non-bank channels by 2020. This will improve operational efficiency as well as increase the bank’s transactional income. The bank is poised to see the commission and fee income from their mobile banking platform in the future, and
- Better loan underwriting to improve non-performing loans; as the bank’s NPL ratio is currently at 15.5% compared to tier 1 average of 11.6%,
For a comprehensive analysis, see our Standard Chartered Bank H1’2018 Earnings Note
NIC Group Plc released H1’2018 results during the week;
NIC Group released H1’2018 results, with core earnings per share declining by 2.1% to Kshs 2.8 from Kshs 2.9 in H1’2017, which fell below our expectation of a 7.5% growth to Kshs 3.1. The variance in core earnings per share growth against our expectations was largely due to a 4.9% decrease in net interest income (NII) against a projected 11.1% increase to Kshs 6.0 bn. The performance was driven by a 1.7% decline in operating income to Kshs 7.3 bn from Kshs 7.4 bn in H1’2017, which declined faster than a 1.2% decline in operating expenses to Kshs 4.4 bn from Kshs 4.5 bn.
Highlights of the performance from H1’2017 to H1’2018 include:
- Total operating income decreased by 1.7% to Kshs 7.3 bn in H1’2018 from Kshs 7.4 bn in H1’2017. This was due to a 4.9% decrease in Net Interest Income (NII) to Kshs 5.1 bn from Kshs 5.4 bn in H1’2017, despite a 7.0% increase in Non-Funded Income (NFI) to Kshs 2.2 bn from Kshs 2.0 bn in H1’2017,
- Interest income increased by 8.6% to Kshs 9.6 bn from Kshs 8.8 bn in H1’2017. The interest income on loans and advances decreased by 6.5% to Kshs 6.2 bn from Kshs 6.6 bn in H1’2017. Interest income on government securities increased by 52.8% to Kshs 3.3 bn in H1’2018 from Kshs 2.1 bn in H1’2017. The yield on interest earning assets however declined to 10.9% in H1’2018 from 11.0% in H1’2017, due to the relatively faster increase in low-yielding government securities by 25.7% to Kshs 55.7 bn from Kshs 44.3 bn in H1’2017,
- Interest expense increased by 30.0% to Kshs 4.4 bn from Kshs 3.4 bn in H1’2017, as interest expense on customer deposits increased 37.7% to Kshs 3.7 bn from Kshs 2.7 bn in H1’2017. Interest expense on deposits from other banking institutions rose by 70.4% to Kshs 104.8 mn from Kshs 61.5 mn in H1’2017. The cost of funds rose to 5.4% from 4.5% in H1’2017. The Net Interest Margin declined to 6.0% from 7.1% in H1’2017,
- Non-Funded Income increased by 7.0% to Kshs 2.2 bn from Kshs 2.0 bn in H1’2017. The increase in NFI was driven by a 16.9% increase in forex trading income to Kshs 0.7 bn from Kshs 0.6 bn in H1’2017, coupled with a 24.1% increase in other income to Kshs 0.4 bn from Kshs 0.3 bn in H1’2017. Other fees and commissions increased by 13.5% to Kshs 0.5 bn from Kshs 0.4 bn in H1’2017. However, fees and commissions on loans declined by 13.6% to Kshs 0.6 bn from Kshs 0.7 bn in H1’2017. The revenue mix shifted to 70:30 funded to non-funded income in H1’2018 from 73:27 in H1’2017, owing to the increase in NFI, coupled with the decline in NII,
- Total operating expenses decreased by 1.2% to Kshs 4.4 bn from Kshs 4.5 bn, largely driven by a 23.0% decrease in loan loss provision (LLP) to Kshs 1.1 bn in H1’2018 from Kshs 1.4 bn in H1’2017. Staff costs, however, increased by 7.7% to Kshs 1.7 bn in H1’2018 from Kshs 1.6 bn in H1’2017,
- The cost to income ratio deteriorated marginally to 60.9% from 60.6% in H1’2017. Without LLP, the cost to income ratio deteriorated to 45.6% from 41.1% in H1’2017,
- Profit before tax decreased by 2.4% to Kshs 2.8 bn, up from Kshs 2.9 bn in H1’2017. Profit after tax decreased 2.1% to Kshs 1.99 bn in H1’2018 from Kshs 2.03 bn in H1’2017,
- The balance sheet recorded an expansion with total assets growth of 6.0% to Kshs 201.0 bn from Kshs 189.5 bn in H1’2017. This growth was largely driven by a 25.7% increase in government securities to Kshs 55.7 bn from Kshs 44.3 bn in H1’2017, The loan book contracted by 1.5% to Kshs 115.0 bn in H1’2018 from Kshs 116.8 bn in H1’2017,
- Total liabilities rose by 7.5% to Kshs 168.7 bn from Kshs 156.9 bn in H1’2017, driven by a 10.0% increase in total deposits to Kshs 149.4 bn from Kshs 135.7 bn in H1’2017. Deposits per branch increased by 2.2% to Kshs 3.6 bn from Kshs 3.5 bn in H1’2017, as bank branches increased to 42 from 38; while deposit growth was strong, the cost of deposits is very costly given one of the highest cost of funds at 5.4%, compared to tier 1 and 2 average of 3.2%,
- The growth in deposits coupled with the decline in loans led to a decline in the loan to deposit ratio to 78.2% from 88.7% in H1’2017,
- Gross non-performing loans increased by 12.7% to Kshs 16.2 bn in H1’2018 from Kshs 14.3 bn in H1’2017. Consequently, the NPL ratio deteriorated to 13.1% in H1’2018 from 11.7% in H1’2017.General Loan loss provisions increased by 33.0% to Kshs 6.8 bn from Kshs 5.1 bn in H1’2017. Consequently, the NPL coverage improved to 52.2% in H1’2018 from 48.1% in H1’2017,
- Shareholders’ funds decreased marginally to Kshs 31.8 bn in H1’2018 from Kshs 32.1 bn in H1’2017,
- NIC Group is currently sufficiently capitalized with a core capital to risk weighted assets ratio of 17.8%, 7.3% above the statutory requirement. In addition, the total capital to risk weighted assets ratio was 20.4%, exceeding the statutory requirement by 5.9%. Adjusting for IFRS 9, the core capital to risk weighted assets stood at 18.1%, while total capital to risk weighted assets came in at 20.7%, indicating that the bank’s total capital relative to its risk-weighted assets decreased by 0.3% due to the impact of IFRS 9,
- NIC Group currently has a return on average assets of 2.1% and a return on average equity of 12.8%. This compares to a tier 1 and 2 average of 21.0% in H1’2017, with the bank’s RoE falling below its peers due to the low trailing PAT,
Going forward, we expect the bank’s growth to be further driven by;
- Non-Funded Income Growth Initiatives – NIC Bank’s NFI is improving as the bank focuses on digital innovation and alternative banking channels to augment transaction volumes and increase fee income. The bank needs to increase capacity of its brokerage and advisory business, in addition to setting income targets for these entities so as to increase fee income from investment and advisory services,
- Loan growth – The bank needs to grow its loan book aggressively so as to increase interest income on loans and advances. The bank is shying away from lending to the SME segment, which forms much of its clientele base. With the rate capping legislation expected to be repealed, the bank should grow its market reach to include retail and corporate clients in order to increase loans and maximize interest income,
- Better underwriting in order to reduce the proportion of non-performing loans and improve the bank’s asset quality as the bank’s NPL ratio currently stands at 13.1% compared to the Tier 1 and 2 banks’ average of 11.6%.
- Funding Structure - The bank needs to relook at its funding structure as it is not clear why the bank was accumulating expensive deposit only to invest in low yielding assets,
- Operational efficiency - Recording a staff cost growth of 7.7% with such a poor bottom line performance in the era of bank processes automation and digitisation is worrying and not in the best interest of shareholders.
For a comprehensive analysis, see our NIC Group H1’2018 Earnings Note
National Bank of Kenya released H1’2018 results during the week;
National Bank released H1’2018 results, with core earnings per share growth of 39.3% to Kshs 0.7 from Kshs 0.5 in H1’2017, compared to our expectation of a 54.9% increase to Kshs 0.8. The variance in core earnings per share growth against our expectations was largely due to a decrease of 120.3% in loan loss provisions (LLP) to Kshs 0.1 bn against a projected increase of Kshs 38.2% to Kshs 0.3 bn. Performance was driven by a 10.1% decrease in total operating income, which outpaced the 8.3% decrease in the total operating expenses.
Highlights of the performance from H1’2017 to H1’2018 include:
- Total operating income declined by 10.1% to Kshs 3.7 bn from Kshs 4.1 bn in H1’2017. This was due to an 8.9% decrease in Net Interest Income (NII) to Kshs 2.6 bn from Kshs 2.9 bn in H1’2017, coupled with a 13.1% decline in Non-Funded Income (NFI) to Kshs 1.1 bn from Kshs 1.2 bn in in H1’2017,
- Interest income declined by 9.6% to Kshs 4.1 bn from Kshs 4.6 bn in H1’2017, driven by the decline in interest income on loans and advances which declined by 14.4% to Kshs 2.1 bn from Kshs 2.4 bn in H1’2017. Interest income on government securities also declined by 3.7% to Kshs 2.0 bn from Kshs 2.1 bn in H1’2017. As a result, the yield on interest earning assets declined to 10.1% in H1’2018 from 10.3% in H1’2017,
- Interest expense declined by 10.1% to Kshs 1.5 bn from Kshs 1.7 bn in H1’2017, following a 27.1% decline in the interest expense on deposits and placements from banking institutions to Kshs 153.9 mn from Kshs 211.0 mn in H1’2017. Interest expense on customer deposits declined by 8.6% to Kshs 1.4 bn from Kshs 1.5 bn in H1’2017. Consequently, the cost of funds declined to 3.0% from 3.5% in H1’2017. Net Interest Margin improved to 6.9% from 6.5% in H1’2017, due to the faster decline in the interest expense, coupled with a 0.7% decline in interest earning assets to Kshs 94.4 bn from Kshs 95.1 bn,
- Non-Funded Income declined by 13.1% to Kshs 1.1 bn from Kshs 1.2 bn in H1’2017. The decline in NFI was driven by a 59.4% decrease in fees and commissions on loans and advances to Kshs 37.6 mn from Kshs 92.7 mn in H1’2017, coupled with a 9.8% decline in other fees and commissions to Kshs 0.6 bn from Kshs 0.7 bn in H1’2017. However, foreign exchange trading income increased marginally by 1.3% to Kshs 285.0 mn from Kshs 281.3 mn in H1’2017. The current revenue mix stands at 71:29 funded to non-funded income as compared to 70:30 in H1’2017. The proportion of funded income to total revenue increased slightly owing to the faster decline in NFI as compared to NII,
- Total operating expenses decreased by 8.3% to Kshs 3.5 bn from Kshs 3.8 bn, largely driven by the write back in provisions of Kshs 47.9 mn in H1’2018, as compared to the Kshs 235.3 mn loan loss provision expense incurred in H1’2017. The decline in the operating expenses could also be attributed to the 17.4% decline in other operating expenses to Kshs 1.0 bn from Kshs 1.2 bn in H1’2017. Staff costs rose marginally by 0.5% to Kshs 1.89 bn in H1’2018 from Kshs 1.88 bn in H1’2017,
- The cost to income ratio deteriorated to 95.6% from 93.7% in H1’2017. Without LLP, the Cost to income ratio also deteriorated to 97.0% from 87.9% in H1’2017,
- Profit before tax decreased by 37.9% to Kshs 0.2 bn, down from Kshs 0.3 bn in H1’2017. The bank incurred an undefined exceptional item of Kshs 0.5 bn in H1’2018, and as a result, the bank recorded a loss after tax of Kshs 282.7 mn in H1’2018, compared to the profit of Kshs 59.5 mn in H1’2017. Stripping off the exceptional item, the profit before tax decreased by 37.9% to Kshs 159.4 mn from Kshs 256.9 mn in H1’2017
- The balance sheet experienced a contraction, as total assets declined by 2.8% to Kshs 113.3 bn from Kshs 116.6 bn in H1’2017. This decline was largely due to by a 16.1% decrease in loans and advances to Kshs 47.8 bn from Kshs 57.0 bn in H1’2017,
- Government securities increased by 9.8% to Kshs 41.3 bn from Kshs 37.6 bn in H1’2017,
- Total liabilities increased by 2.2% to Kshs 107.5 bn from Kshs 105.2 bn in H1’2017, driven by a 170.4% increase in placements by other institutions to Kshs 6.8 bn from Kshs 2.5 bn in H1’2017, coupled with a 20.1% increase in other liabilities to Kshs 4.7 bn from Kshs 3.9 bn in H1’2017,
- Customer deposits declined by 2.8% to Kshs 96.0 bn from Kshs 98.8 bn in H1’2017. Deposits per branch increased by 4.1% to Kshs 1.4 bn from Kshs 1.3 bn in H1’2017, as the bank closed 5 branches,
- The faster decline in loans as compared to deposits led to a decline in the loan to deposit ratio to 49.8% from 57.7% in H1’2017,
- Gross non-performing loans increased by 2.5% to Kshs 30.1 bn in H1’2018 from Kshs 29.4 bn in H1’2017. Consequently, the NPL ratio increased to 46.5% from 44.2% in H1’2017. General provisions increased by 109.5% to Kshs 13.1 bn from Kshs 6.3 bn in H1’2017. The NPL coverage thus increased to 56.5% in H1’2018 from 32.5% in H1’2017. The bank had a write back in provisions of Kshs 47.9 mn in H1’2018,
- Shareholders’ funds decreased by 48.8% to Kshs 5.9 bn in H1’2018 from Kshs 11.4 bn in H1’2017, mainly due to a decline in the retained earnings owing to an accumulated loss of Kshs 4.9 bn from a retained earnings position of Kshs 3.3 bn in H1’2017,
- National Bank is currently severely undercapitalized with a core capital to risk weighted assets ratio of 2.0%, 8.5% below the statutory requirement. In addition, the total capital to risk weighted assets ratio was 3.4%, below the statutory requirement by 11.1%. Adjusting for IFRS 9, the core capital to risk weighted assets stood at 2.4%, while total capital to risk weighted assets came in at 3.9%, indicating that the bank’s total capital relative to its risk-weighted assets declined by 0.5% due to implementation of IFRS 9,
- National Bank currently has a return on average assets of 0.0% and a return on average equity of (0.6%).
The bank could improve its poor performance, and needs to focus on the following to improve:
- Privatisation: We are of the strong view that the bank needs to be privatized as the core step to address its underperformance
- Improve the asset quality: National bank has the worst asset quality in the listed banking space, with an NPL ratio of 46.5%. At this level of NPL, a restructuring to separate the “good bank” from the “bad bank” is necessary to resolve the bad portfolio. It will be difficult for the bank to focus on growth with such a bad portfolio,
- Improve the capital position: The bank is currently undercapitalized and needs to improve its capital position, to meet the regulatory requirements. The bank has stated its efforts to raise both Tier I and Tier II capital in the form of subordinated debt, and a rights issue. Other capital raising initiatives would be the sale of non-core assets such as land. However, we believe the fastest way to raise capital would be a privatization of the bank
For a comprehensive analysis, see our National Bank H1’2018 Earnings Note
|
Bank |
Core EPS Growth |
Interest Income Growth |
Interest Expense Growth |
Net Interest Income Growth |
Net Interest Margin |
Non-Funded Income (NFI) Growth |
NFI to Total Operating Income |
Growth in Total Fees & Commissions |
Deposit Growth |
Growth in Govt. Securities |
Loan Growth |
LDR |
Cost of Funds |
IFRS 9 Impact on Capital |
Return on Average Equity |
|
Stanbic Holdings |
104.5% |
15.4% |
21.7% |
11.9% |
4.9% |
34.0% |
50.0% |
(4.2%) |
21.3% |
26.9% |
15.4% |
71.4% |
3.1% |
(0.9%) |
14.8% |
|
National Bank |
39.3% |
(9.6%) |
10.1% |
(8.9%) |
6.9% |
(13.1%) |
28.8% |
(15.7%) |
(2.8%) |
9.8% |
16.1% |
49.8% |
3.0% |
(0.5%) |
(0.6%) |
|
Stanchart |
30.3% |
7.9% |
8.8% |
7.5% |
8.0% |
12.2% |
32.9% |
36.2% |
2.8% |
3.5% |
(1.1%) |
48.4% |
3.6% |
(0.3%) |
18.0% |
|
KCB Group |
18.0% |
6.1% |
11.9% |
4.3% |
8.6% |
(0.1%) |
32.2% |
(6.0%) |
8.7% |
(2.8%) |
3.6% |
80.3% |
3.0% |
(1.0%) |
21.9% |
|
Equity Group |
17.6% |
10.2% |
14.0% |
9.1% |
8.8% |
1.5% |
40.2% |
(1.0%) |
8.5% |
18.7% |
3.8% |
69.9% |
2.7% |
(0.8%) |
23.9% |
|
Co-op Bank |
7.6% |
7.9% |
2.2% |
10.4% |
8.6% |
(1.6%) |
32.1% |
(3.0%) |
3.9% |
12.0% |
(0.6%) |
84.6% |
3.9% |
(0.9%) |
18.0% |
|
Barclays Bank |
6.2% |
7.6% |
22.4% |
4.0% |
9.0% |
6.9% |
30.0% |
1.9% |
14.9% |
33.6% |
7.5% |
81.2% |
2.6% |
(0.2%) |
17.5% |
|
NIC Group |
(2.1%) |
8.6% |
30.0% |
(4.9%) |
6.0% |
7.0% |
29.5% |
(3.0%) |
10.5% |
25.7% |
(1.5%) |
78.2% |
5.4% |
(0.3%) |
12.8% |
|
Weighted Average H1'2018* |
21.4% |
8.6% |
12.9% |
7.1% |
8.3% |
4.6% |
35.4% |
1.6% |
8.7% |
15.9% |
3.4% |
73.7% |
3.2% |
(0.7%) |
20.1% |
|
Weighted Average H1’2017* |
(13.8%) |
(8.3%) |
(9.3%) |
(6.9%) |
7.1% |
(6.9%) |
36.1% |
16.9% |
6.0% |
17.2% |
6.8% |
77.9% |
2.9% |
- |
21.0% |
*Market Cap weighted average as per 24-8-2018
Key takeaways from the table include:
- All listed banks recorded an increase in core EPS growth with the exception of NIC Group, with the weighted average increase coming in at 21.4% compared to a decrease of 13.8% for the same period last year. Growth is driven by an increase in the Net Interest Income (NII), which came in at 7.1%, and a 4.6% growth in NFI. This indicates that the banking industry has adjusted to the new operating environment;
- Average deposit growth came in at 8.7%. Interest expense paid on deposits recorded a faster growth of 12.9% on average, indicating that more interest earning accounts have been opened. Deposits are expected to grow going forward as the proposed changes regarding financial inclusion in the Banking Sector Charter take effect;
- Average loan growth came in at 3.4%, while investment in government securities has grown by 15.9%, outpacing the loan growth, showing increased lending to the government by banks as they avoid the risky borrowers. The loan to deposit ratio thus declined marginally to 73.7% from 77.9% in H1’2017; and,
- The average Net Interest Margin in the banking sector currently stands at 8.3%, an increase from the 7.1% recorded in H1’2017.
Highlights of the Week:
The Central Bank of Kenya (CBK) has downgraded the banking sector rating to “satisfactory”, from a previous rating of “strong” in 2016. According to the Bank Supervision Annual Report 2017 released by the regulator, the downgrade was as a result of a decline in capital adequacy, as well as a deterioration in asset quality in the sector. Specifically:
- core capital to total risk-weighted assets (TRWA) for the banking sector declined to 16.5% in 2017 from 17.0% in the 2016 financial year,
- total capital relative to total risk-weighted assets (TRWA) declined to 18.8% from 19.8% over the same period,
- core capital as a ratio of total deposit liabilities also declined to 18.9% in 2017 from 20.0% in 2016, and,
- non-performing loans (NPLs) for the year increased by 23.4% to Kshs 264.6 bn from Kshs 214.3 bn in December 2016 consequently, the NPL ratio increased to 12.3% in December 2017 from 9.3% in December 2016
Despite the decline in capital adequacy ratios, the banking sector remained well capitalized with sufficient buffers above the minimum required ratios. The deterioration in asset quality came as a result of a challenging business environment in 2017, occasioned by poor weather conditions, delayed payments from both private and public institutions and the upheavals due to the protracted electioneering period last year. The key highlights of the performance of the banking sector include:
- Gross loans and advances decreased by 5.7% to Kshs 2.2 tn in December 2017 from Kshs 2.3 tn in December 2016. However, total net assets grew by 8.1% to Kshs 4.0 tn from Kshs 3.7 tn in December 2016, with the growth being supported by investments in government securities,
- Customer deposits increased by 10.8% to Kshs 2.9 tn from Kshs 2.6 tn in December 2016. The growth was attributed to increased deposit mobilization by banks as they expanded their outreach and leveraged on digital platforms,
- The profit before tax decreased by 9.6% to Kshs 133.2 bn in December 2017 from Kshs 147.4 bn in December 2016. The decrease in profitability was attributed to a faster decrease in income which outpaced a marginal decrease in expenses. The banking sector income declined by 3.1% in the period ended December 2017 whereas expenses marginally decreased by 0.5% over the same period,
- The banking sector remained well capitalized with capital adequacy ratio of 18.8% in 2017, well above the regulatory requirement of 14.5%,
- The banking sector average liquidity ratio stood at 43.7% as compared to 40.3% in December 2016, mainly attributed to a higher growth in total liquid assets, compared to the growth in total short-term liabilities. Total liquid assets grew by 16.3% while total short-term liabilities grew by 10.4%. The banking sector’s average liquidity in the twelve months to December 2017 was above the statutory minimum requirement of 20.0%.
The Central Bank uses the Capital Adequacy, Asset Quality, Management Quality, Earnings and Liquidity (CAMEL) rating framework in assessing the soundness of commercial banks. Below is a summary of the banking sector performance rating:
|
Banking Sector Performance Rating |
||||||
|
Performance |
2016 |
2017 |
||||
|
|
No. of Institutions |
Total Net Assets (Kshs ‘000’) |
Market Share |
No. of Institutions |
Total Net Assets (Kshs ‘000’) |
Market Share |
|
Strong |
11 |
1,845,960 |
49.95% |
9 |
1,234,627 |
30.94% |
|
Satisfactory |
16 |
1,438,960 |
38.93% |
16 |
2,285,671 |
57.84% |
|
Fair |
11 |
295,908 |
8.01% |
12 |
132,835 |
8.37% |
|
Marginal |
1 |
115,114 |
3.11% |
3 |
349,608 |
2.85% |
|
Unsatisfactory |
|
|
|
|
|
|
|
Total* |
39 |
3,695,943 |
100.00% |
40 |
4,002,741 |
100.00% |
|
Rating |
Strong |
|
|
Satisfactory |
|
|
|
*Charterhouse Bank in Statutory Management, and Imperial Bank and Chase Bank in Receivership have been excluded in the 2017 statistics |
||||||
Source: CBK
From the table above, the 25 banks with strong/satisfactory rating command a cumulative market share of 88.8%, while the 3 banks with a “marginal” rating have a mere 2.9% market share. The declining capital adequacy may be a signal of looming consolidation in the sector as weaker banks are absorbed by their larger, more stable counterparts in order to recapitalize as per the statutory requirements.
Corporate Governance Changes:
KCB Group Plc announced the appointment of Mr. Lawrence Mark Njiru as a non-executive director for the Group.
Following the KCB Group Board Changes:
- The board size has increased to 10 from 9 hence a deterioration of the metric score to 0.5 from 1.0 since the board consists an even number of members, raising the possibility of a tie in case board members decide to vote on a decision;
- Gender diversity has declined slightly to 20.0% from 22.2%,
- Ethnic diversity remained unchanged at 20.0%, which is less than 50.0% from one ethnicity;
- The proportion of non-executive members has improved slightly to 20.0% from 22.2% previously but the score remains the same as it is still greater than 70.0%;
Overall, the comprehensive score has deteriorated to 85.4% from 87.5%, although the bank has remained at position 1 in the 2017 Cytonn Corporate Governance Index.
Equities Universe of Coverage:
Below is our Equities Universe of Coverage:
|
Banks |
Price as at 17/08/2018 |
Price as at 24/08/2018 |
w/w change |
YTD Change |
LTM Change |
Target Price* |
Dividend Yield |
Upside/ Downside** |
P/TBv Multiple |
|
NIC Bank*** |
34.8 |
32.8 |
(5.8%) |
(3.0%) |
(2.0%) |
54.1 |
3.1% |
58.7% |
0.8x |
|
Zenith Bank*** |
23.6 |
22.0 |
(7.0%) |
(14.4%) |
(5.0%) |
33.3 |
12.3% |
53.5% |
1.0x |
|
Ghana Commercial Bank*** |
5.3 |
5.3 |
0.8% |
5.7% |
4.5% |
7.7 |
7.1% |
52.8% |
1.3x |
|
I&M Holdings*** |
115.0 |
105.0 |
(8.7%) |
1.0% |
(16.0%) |
169.5 |
3.3% |
50.7% |
1.2x |
|
UBA Bank |
8.4 |
8.0 |
(4.2%) |
(22.3%) |
(17.6%) |
10.7 |
18.8% |
46.9% |
0.6x |
|
Diamond Trust Bank*** |
197.0 |
193.0 |
(2.0%) |
0.5% |
1.6% |
280.1 |
1.3% |
43.5% |
1.1x |
|
Union Bank Plc |
5.9 |
5.6 |
(5.1%) |
(28.8%) |
(7.5%) |
8.2 |
0.0% |
39.3% |
0.6x |
|
HF Group*** |
7.9 |
7.5 |
(5.1%) |
(27.9%) |
(27.3%) |
10.2 |
4.3% |
33.4% |
0.3x |
|
CRDB |
160.0 |
160.0 |
0.0% |
0.0% |
(20.0%) |
207.7 |
0.0% |
29.8% |
0.5x |
|
KCB Group*** |
49.5 |
48.0 |
(3.0%) |
12.3% |
6.1% |
60.9 |
6.3% |
29.3% |
1.6x |
|
Barclays |
12.0 |
11.8 |
(2.1%) |
22.4% |
11.4% |
14.0 |
8.5% |
25.2% |
1.5x |
|
Co-operative Bank |
17.1 |
16.6 |
(2.9%) |
3.8% |
(0.6%) |
19.7 |
4.8% |
20.0% |
1.5x |
|
Ecobank |
9.0 |
9.0 |
0.1% |
18.0% |
41.0% |
10.7 |
0.0% |
19.8% |
2.5x |
|
Equity Group |
50.0 |
50.0 |
0.0% |
25.8% |
15.6% |
55.5 |
4.0% |
15.0% |
2.5x |
|
Stanbic Bank Uganda |
33.0 |
33.0 |
0.0% |
21.1% |
21.1% |
36.3 |
3.5% |
13.5% |
2.1x |
|
Bank of Baroda |
120.0 |
145.0 |
20.8% |
28.3% |
31.8% |
130.6 |
1.7% |
10.6% |
1.0x |
|
CAL Bank |
1.3 |
1.3 |
0.0% |
17.6% |
48.1% |
1.4 |
0.0% |
10.2% |
1.1x |
|
Bank of Kigali |
290.0 |
290.0 |
0.0% |
(3.3%) |
13.7% |
299.9 |
4.8% |
8.2% |
1.6x |
|
Guaranty Trust Bank |
38.0 |
37.5 |
(1.3%) |
(8.0%) |
(7.6%) |
37.1 |
6.4% |
4.0% |
2.1x |
|
Access Bank |
9.6 |
9.0 |
(6.3%) |
(13.9%) |
(10.1%) |
9.5 |
4.4% |
3.4% |
0.6x |
|
SBM Holdings |
6.7 |
6.7 |
0.0% |
(10.7%) |
(14.8%) |
6.6 |
4.5% |
2.4% |
1.0x |
|
Standard Chartered |
206.0 |
206.0 |
0.0% |
(1.0%) |
(11.2%) |
184.3 |
10.6% |
(4.5%) |
1.6x |
|
Stanbic Holdings |
106.0 |
107.0 |
0.9% |
32.1% |
30.5% |
85.9 |
2.1% |
(16.9%) |
1.3x |
|
Stanbic IBTC Holdings |
50.1 |
49.5 |
(1.1%) |
19.3% |
28.5% |
37.0 |
1.2% |
(24.9%) |
2.6x |
|
Standard Chartered |
26.1 |
26.5 |
1.7% |
5.0% |
16.2% |
19.5 |
0.0% |
(25.3%) |
3.3x |
|
FBN Holdings |
9.8 |
9.7 |
(1.5%) |
9.7% |
61.4% |
6.6 |
2.6% |
(29.8%) |
0.5x |
|
National Bank |
6.1 |
6.1 |
0.0% |
(35.3%) |
(47.4%) |
2.8 |
0.0% |
(53.7%) |
0.4x |
|
Ecobank Transnational |
21.1 |
20.0 |
(5.0%) |
17.6% |
11.1% |
9.3 |
0.0% |
(55.9%) |
0.8x |
|
*Target Price as per Cytonn Analyst estimates |
|||||||||
|
**Upside / (Downside) is adjusted for Dividend Yield |
|||||||||
|
***Banks in which Cytonn and/or its affiliates holds a stake. For full disclosure, Cytonn and/or its affiliates holds a significant stake in NIC Bank, ranking as the 5th largest shareholder ****Stock prices indicated in respective country currencies |
|||||||||
We are “NEUTRAL” on equities for investors with a short-term investment horizon since the market has rallied and brought the market P/E slightly above its’ historical average. However, pockets of value exist, with a number of undervalued sectors like, financial services, which provide an attractive entry point for long-term investors, and with expectations of higher corporate earnings this year, we are “POSITIVE” for investors with a long-term investment horizon.
Old Mutual, a UK based international financial services group providing investment and savings, insurance, asset management and retirement solutions, is set to increase its stake in UAP-Old Mutual Holdings from 60.7% to 66.7%, in a deal to purchase a 6.0% stake in UAP-Old Mutual for GBP 24.0 mn (Kshs 3.1 bn). The transaction involved the acquisition of 12.7 mn shares of UAP-Old Mutual Holdings’ Chairman Joe Wanjui (9.8 mn shares) and Director James Muguiyi (2.9 mn shares) at a price of Kshs 245.6 per share. The current transaction at Kshs 245.6 per share represents a 36.7% premium on the 2015 buyout price of Kshs 180.0 per share. Old Mutual first invested in UAP in January 2015 through two separate acquisitions:
- The acquisition of 23.3% stake, an equivalent of 49.3 mn shares, from investment firm Centum and businessman Chris Kirubi, and,
- The combined acquisition of 37.3% stake, an equivalent of 78.9 mn shares, from AfricInvest, Abraaj and Swedfund.
This transaction made Old Mutual the largest shareholder of UAP Holdings with a 60.7% stake in the company at a cost of Kshs 20.8 bn. The transaction was carried out at a P/B multiple of 3.6x. However, in 2017 Old Mutual revalued down the stake acquired by Kshs 9.7 bn. Following the adjustment, the post write-off acquisition transaction value dropped to Kshs 11.1 bn representing a P/B transaction multiple of 1.9x an indication that the deal was relatively overvalued in the market. This transaction led to UAP changing its name to UAP-Old Mutual Holdings.
At a price of Kshs 245.6 per share and book value per share of 90.0 as at December 2017, the acquisition will be carried out at a P/B multiple of 2.7x, which is a 30.3% premium on the average insurance sector transaction P/B multiple of 2.1x over the last seven-years, and almost double the last insurance transaction - the 1.3x multiple that Swiss Re paid for the Britam stake; the expensive transaction multiple indicates that the deal is relatively overvalued, which indicates that Old Mutual was keen to increase its stake. The table below highlights the transaction multiples in Kenya’s insurance sector over the last seven years;
|
Insurance Sector Transaction Multiples over the Last Seven Years |
|||||||
|
No. |
Acquirer |
Insurance Acquired |
Book Value (Kshs bn) |
Transaction Stake |
Transaction Value (Kshs bn) |
P/B |
Date |
|
1. |
Africa Development Corporation |
Resolution Health East Africa |
N/A |
25.1% |
0.2 |
N/A |
Dec-10 |
|
2. |
Leapfrog Investments |
Apollo Investments |
0.3 |
26.9% |
1.1 |
15.6x |
Dec-11 |
|
3. |
Saham Finances |
Mercantile Insurance |
0.5 |
66.0% |
Undisclosed |
N/A |
Jan-13 |
|
4. |
Swedfund |
AAR |
0.4 |
20.0% |
0.4 |
5.4x |
May-13 |
|
5. |
BAAM |
Continental Re Kenya |
0.7 |
30.0% |
0.3 |
1.4x |
Apr-14 |
|
6. |
Union Insurance of Mauritius |
Phoenix of East Africa |
1.8 |
66.0% |
2.0 |
1.6x |
May-14 |
|
7. |
UK Prudential |
Shield Assurance |
0.1 |
100.0% |
1.5 |
10.2x |
Sep-14 |
|
8. |
Swiss Re |
Apollo Investments |
0.6 |
26.9% |
Undisclosed |
N/A |
Oct-14 |
|
9. |
Britam |
Real Insurance Company |
0.7 |
99.0% |
1.4 |
2.1x |
Nov-14 |
|
10. |
Leap Frog Investments |
Resolution Insurance |
0.2 |
61.2% |
1.6 |
11.7x |
Nov-14 |
|
11. |
Old Mutual Plc |
UAP Holdings |
9.6 |
60.7% |
20.8 |
3.6x** |
Jan-15 |
|
12. |
Old Mutual Plc |
UAP Holdings |
9.6 |
60.7% |
11.1 |
1.9x* |
Jan-15 |
|
13. |
MMI Holdings |
Cannon Assurance |
1.7 |
75.0% |
2.4 |
1.9x |
Jan-15 |
|
14. |
Pan Africa Insurance Holdings |
Gateway Insurance Company Ltd |
1.0 |
51.0% |
0.6 |
1.1x |
Mar-15 |
|
15. |
Barclays Africa |
First Assurance |
2.0 |
63.3% |
2.9 |
2.2x |
Jun-15 |
|
16. |
IFC |
Britam |
22.5 |
10.4% |
3.6 |
1.5x |
Mar-17 |
|
17. |
AfricInvest III |
Britam |
28.5 |
14.3% |
5.7 |
1.4x |
Sep-17 |
|
18. |
Swiss Re Asset Management |
Britam |
22.6 |
13.8% |
4.8 |
1.3x |
Jun-18 |
|
20 |
Old Mutual plc |
UAP Holdings (Wanjui & Muguiyi) |
19.0 |
6.0% |
3.1 |
2.7x** |
Aug-18 |
|
|
Harmonic Mean |
|
|
29.9% |
|
2.1x |
|
|
|
Median |
|
|
55.9% |
|
1.9x |
|
|
*-Proforma transaction multiple after goodwill impairment write-off **-Excluded in the harmonic mean and median |
|||||||
In the fundraising sector, investors in the Abraaj Growth Markets Health Fund (AGHF), a subsidiary of Abraaj Group, a Dubai-based private equity firm, venture capital and real estate investment firm have appointed AlixPartners, a US firm to oversee the separation of the health fund from Abraaj Group. The separation follows allegations of mismanagement of the USD 1.0 bn invested in the special purpose vehicle. AGHF, whose main investors are the Bill & Melinda Gates Foundation, World Bank’s International Finance Corporation (IFC), Britain’s CDC Group and Proparco Group of France has invested heavily in Kenyan clinics and hospitals, namely Nairobi Women’s Hospital, Avenue Hospital, Metropolitan Hospital, and Ladnan Hospital.
The separation process in private equity companies arises due to mismanagement of funds and high levels of leverage. The separation process is important for investors since it ensures continuity and builds a stable platform for the future. In order to manage the funds invested and avoid instances of restructuring, private equity companies should;
- Manage conflicts of interest in a way that is in the best interests of the funds,
- Establish and implement written policies and procedures to identify, monitor and appropriately mitigate conflicts of interest throughout the scope of business that the firm conducts,
- Make policies and procedures available to all fund investors both at inception of their relationship with the firm, and on an ongoing basis, and,
- Ensure that all disclosures provided to investors are clear, complete, fair and not misleading.
Private equity investments in Africa remains robust as evidenced by the increasing investor interest, which is attributed to; (i) rapid urbanization, a resilient and adapting middle class and increased consumerism, (ii) the attractive valuations in Sub Saharan Africa’s private markets compared to its public markets, (iii) the attractive valuations in Sub Saharan Africa’s markets compared to global markets, and (iv) better economic projections in Sub Sahara Africa compared to global markets. We remain bullish on PE as an asset class in Sub-Sahara Africa. Going forward, the increasing investor interest and stable macro-economic environment will continue to boost deal flow into African markets
During the week, Double Win Company Limited, a real estate firm, announced plans to put up a residential complex, along Argwings Kodhek Road. The project will comprise of two blocks of 14 storeys each, and will have 168-apartments; 2 and 3 bedroom units. According to Cytonn Nairobi Metropolitan Area Residential Report 2017/2018, Kilimani area had average total returns of 13.9%, 5.7% points higher than the market average of 8.2%. The attractive returns are as a result of Kilimani’s proximity to key business districts and nodes such as CBD, Upperhill and Westlands, and its vast supply of social amenities such as malls including Yaya Centre, and continued infrastructural development as seen through the upgrading of Ngong’ Road.
Below is a table showing the performance of apartments in the upper- mid end market;
|
(all figures in Kshs unless stated otherwise) |
||||||
|
Nairobi Metropolitan Area Apartments Performance 2017/2018 - Upper Mid-End Performance |
||||||
|
Location |
Average Price Per SQM |
Average Rent Per SQM |
Average Annual Sales (%) |
Average Rental Yield (%) |
Average Price Appreciation (%) |
Average Total Returns (%) |
|
Kilimani |
131,594 |
621 |
25.6% |
6.1% |
7.8% |
13.9% |
|
Riverside |
121,295 |
508 |
21.7% |
5.4% |
3.8% |
9.3% |
|
Spring Valley |
144,169 |
647 |
24.1% |
5.9% |
3.1% |
9.0% |
|
Loresho |
109,426 |
558 |
23.2% |
6.0% |
2.7% |
8.7% |
|
Upperhill |
141,905 |
593 |
23.7% |
5.2% |
3.4% |
8.6% |
|
Westlands |
132,128 |
636 |
26.1% |
6.0% |
2.3% |
8.3% |
|
Kileleshwa |
124,549 |
629 |
23.6% |
6.0% |
1.0% |
7.0% |
|
Parklands |
113,908 |
641 |
25.8% |
7.3% |
(1.3%) |
5.9% |
|
Average |
127,372 |
604 |
24.2% |
6.0% |
2.9% |
8.9% |
|
· Kilimani had the highest returns at 13.9% owing to its proximity to key business districts and nodes such as CBD, Upperhill, and Westlands, and also its vast supply of social amenities such as neighborhood malls and good infrastructure and incoming infrastructure such as the upgrade of Ngong’ Road, |
||||||
Source: Cytonn Research
We expect continued investments in the residential sector driven by; (i) the rapid population growth at an average of 3.3% in Nairobi, compared to the national average of 2.6%, (ii) the introduction of innovative financial credit solutions such as the Kenya Mortgage Refinancing Company(KMRC) and National Housing Development Fund(NHDF), which are expected to create a better credit financing environment for developers and end buyers, (iii) continued infrastructural development activities including, revamping of old roads such as the Ngong’ Road whose Phase 2 is currently undergoing expansion, thus opening up new areas for investment, and (iv) the relatively high urbanization rate in Kenya at 4.4% compared to the global average of 2.1%, necessitating the need for adequate housing in the urban areas.
During the week, Central Bank of Kenya (CBK) released the Bank Supervision Annual Report 2017, which included a residential mortgage market survey. The survey gave updates on the size of mortgage portfolio, mortgage loan characteristics, mortgage risk characteristics and the obstacles to the development of the mortgage market.
The main take-outs from the survey include;
- The value of mortgage loan assets outstanding increased by 1.5% from Kshs 219.9 bn in December 2016, to Kshs 223.2 bn in December 2017, attributable to the increased appetite for home ownership as opposed to rentals;
- The number of mortgage loan accounts increased by 8.8%, from 24,059 accounts in December 2016 to 26,187 accounts in December 2017. This is also attributable to the increased appetite for home ownership as opposed to rentals;
- On the mortgage loan characteristics, the interest rate charged on mortgages averaged at 13.6% in 2017, compared to 18.7% in 2016, excluding bank and other charges. This decrease is attributable to the interest rate capping effected in September 2016. The capping has resulted in increased appetite for mortgages as more borrowers perceived home loans to be more affordable;
- The maximum loan as a percentage of property value, also referred to as the loan to value, remained constant at 90.0%, for majority of the banks both in 2016 and 2017;
- The main factors considered by institutions before approving mortgage loans for households were as follows: (i) sustainability of the borrower income, depending on the terms of payment, (ii) the credit history of the borrower, (iii) property location and ease of sale in the case of default, (iv) the ability and willingness of the buyer to repay the loan, and (v) legitimacy of the property;
- On lending to businesses, the survey indicated that the main risk factors examined by institutions include: (i) the profitability of the business owner, (ii) the economic stability of the business, (iii) the experience of the management in the running of the particular business, (iv) the length of the business operation, (v) the business’s ability to pay the loan from its cash flows, and (vi) the business’s credit history and the status of existing debts;
- The main obstacles facing the mortgage market in 2017 included: (i) the high cost of housing units, (ii) the high cost of land for construction, high incidental cost, and (iii) difficulties with property registration, unlike in 2016 where low-income levels were cited as the major impediment;
- The financial institutions highlighted several measures which on implementation, are expected to result in the improvement of the mortgage market. These include: (i) government incentives for low cost housing solutions, (ii) availability of affordable long term loans, (iii) reduction of stamp duty for first time owners, and (iv) the availability of low cost housing solutions; and;
- In 2018, the mortgage market is expected to record increased activities, driven by: (i) the political calm following the conclusion of the prolonged electioneering period, and (ii) the Kenyan Government’s affordable housing agenda.
This information is summarized in the table below;
|
6 year Mortgage KPI Trends in Kenya |
||||||||
|
Year |
2011 |
2012 |
2013 |
2014 |
2015 |
2016 |
2017 |
6 Year CAGR |
|
Outstanding Mortgages (Kshs) |
90.4 bn |
119.6 bn |
138.1 bn |
164.0 bn |
203.3 bn |
219.9 bn |
223.2 bn |
16.3% |
|
Non- performing Mortgages (Kshs) |
3.0 bn |
6.8 bn |
8.5 bn |
10.8 bn |
11.7 bn |
22.0 bn |
27.3 bn |
44.5% |
|
Average Mortgage Size (Kshs) |
5.6 mn |
6.4 mn |
6.9 mn |
7.5 mn |
8.3 mn |
9.1 mn |
10.9 mn |
11.7% |
|
Number of Mortgages |
16,029 |
18,587 |
19,879 |
22,013 |
24,458 |
24,058 |
26,187 |
8.5% |
|
Annual Change in No. of mortgages |
|
16.0% |
7.0% |
10.7% |
11.1% |
(1.6%) |
8.8% |
|
|
· The number of mortgage loan accounts increased by 8.8%, from 24,059 accounts in December 2016 to 26,187 accounts in December 2017, attributable to the increased appetite for home ownership as opposed to rentals · The value of outstanding mortgages recorded a 6 year CAGR of 16.3%, from 2011 to 2017 |
||||||||
Source: Central Bank Report
The mortgage market bucked the effect of the Banking Amendment Act, 2016 that constrained performance in the financial services and real estate sectors leading to a decline in:
- Private sector credit growth, which declined by 21.9% points from 25.8% in June 2014 to 3.9% as at December 2017 , and
- Returns in the real estate sector which declined by 3.2% points from 12.6% in 2016 to 9.4% in 2017.
In 2016, the Banking Amendment Act 2016, negatively affected the mortgage market, with the number of mortgages declining by 1.6% from 24,458 accounts in 2015 to 24,058 accounts in 2016. This is attributable to the strict lending by banks to borrowers (private sector) whom they considered riskier, and instead focused on lending to the government. This resurgence is evidence of the high demand for residential real estate developments.
Going forward, we expect the sector to continue on an upward trajectory driven by: (i) the housing deficit that currently stands at 2.0 mn units according to the National Housing Corporation (NHC), (ii) positive demographics such as a high population growth rate of 2.6% recorded in 2017 1.4% point higher than global averages of 1.2%, and (iii) the relatively high urbanization rate in Kenya at 4.4% recorded in 2017 compared to the global average of 2.1%, necessitating the need for adequate housing in the urban area.
Infrastructure Sector
Transport and Infrastructure Cabinet Secretary, James Macharia, during the Architectural Association of Kenya Annual Convention at Pride Inn Hotel, Nairobi, announced that the Kenyan Government is set to sign a contract next month with China Communications Construction Company (CCCC), for the construction of the 262 Kilometre phase 2B of the Standard Gauge Railway (SGR), which is set to cost Kshs 380.0 bn, and will run from Naivasha to Kisumu. He also noted that the entire SGR (both Phase 1 & 2) budget stands at Kshs 800.0 bn. On completion, we expect that the railway line will open up areas such as Narok, Bomet, Kericho and Kisumu.
Below is a summary of the areas traversed by, distance in kilometres and costs of the various phases of the SGR:
|
Kenya’s Standard Gauge Railway |
||||||
|
Phases |
Length (Km) |
County |
Project Cost (Kshs) |
Contractor |
Status |
|
|
Phase 1 |
|
472 |
Mombasa and Nairobi |
Kshs 327 bn |
China Road and Bridge Corporation (CRBC) |
Completed and Opened in May 2017 |
|
Phase 2 |
A |
120 |
Nairobi, Kajiado, Nakuru, Kiambu, Naivasha and Narok |
Kshs 150 bn |
China Road and Bridge Corporation (CRBC) |
Commenced in March 2018 |
|
B |
262 |
Naivasha, Narok, Bomet, Nyamira and Kisumu |
Kshs 380 bn |
China Communications Construction Company (CCCC) |
Contract with the contractor to be signed in September, 2018 |
|
|
C |
107 |
Kisumu, Busia and Malaba |
Pending |
|||
Source: Cytonn Research, 2018
According to the Cytonn's H'1 2018 Market Review, the construction of the SGR, in addition to other state’s infrastructural initiatives, will boost the growth of the country’s macro-economic variables such as the Gross Domestic Product (GDP), through revenue generation, creation of employment, and ease of doing business. Infrastructure opens up areas for real estate development, through increasing accessibility and access to essential services such as water, electricity and a sewerage system. This attracts more investors to venture into the real estate sector as evidenced by the increased traction of economic activities in areas such as Thika following the completion of the Thika Superhighway in 2012, which has resulted in the development of malls such as Garden City Mall, Thika Road Mall, and master planned developments such as Tatu City and Riverrun Estates.
We expect continued investment activities in the infrastructural sector by the government, as it intensifies efforts to improve infrastructure in the country in a bid to address the huge deficit in infrastructure including rail, roads and ports. This is evidenced by the significant 2017/2018 national budget allocation of Kshs 134.9 bn, which is 22.2% of the budget, to infrastructural development.
Other highlights of the week include;
- Kilifi County Government signed an agreement with the Kenyan National Government, cementing a partnership that will see the construction of at least 2,000 housing units within the next year, in support of the affordable housing initiative of the government’s Big Four Agenda. According to the Housing Permanent Secretary, Charles Hinga, the projects will be undertaken in; Kilifi, Mtwapa and Malindi, where development land has already been identified. In addition, the project will be funded by the government through the Kenya Urban Support Programme;
- Java House Group, a local restaurant chain, announced plans to open 3 stores in Kigali, Rwanda, which will bring the total number of stores in Rwanda to four, in the next 6-months. According to the Chief Executive Officer, Paul Smith, the move is line with its expansion strategy, with the main target countries being Nigeria, Uganda and South Africa. In Uganda, the restaurant chain aims to increase the number of its branches to approximately 15, in the next 3-years, from the current 6 branches. It also targets to open an undisclosed number of branches in Nigeria and establishment of a franchise model approach in South Africa;
- French retailer Carrefour received exclusive occupancy rights for its branch situated at The Hub Mall, Karen, over a lease period of 5-years. The move will lock out other supermarkets both local and international, from setting shop in the shopping complex. The retailer currently has 6 branches in Nairobi- at Two Rivers Mall along Kiambu Road, The Junction Mall and Galleria Mall along Ngong Road, The Hub in Karen, Sarit Centre in Westlands, and Thika Road Mall along the Thika Superhighway. The retailer is also set to open its 7th branch at the Village Market later this year.
Listed Real Estate
The Fahari I-REIT closed the week at Kshs 10.2, similar to last week’s average price, and a marginal decline from the week’s opening price of Kshs 10.3. During the week, it recorded an average price of Kshs 10.2, which is a decline of 19.1% from last year’s trade price of Kshs 12.61 during the same period. This is as their H1’2018 earnings results registered a 16.3% y/y decline in earnings to Kshs 0.36 per unit from Kshs 0.43 per unit in H1’2017. The decline in performance is attributed to a temporary increase in vacancies, coupled with some tenants bargaining for reduced rentals upon the renewal of leases, leading to a reduction in rental income, thus resulting to low trade volumes, as an indication of low investor appetite.
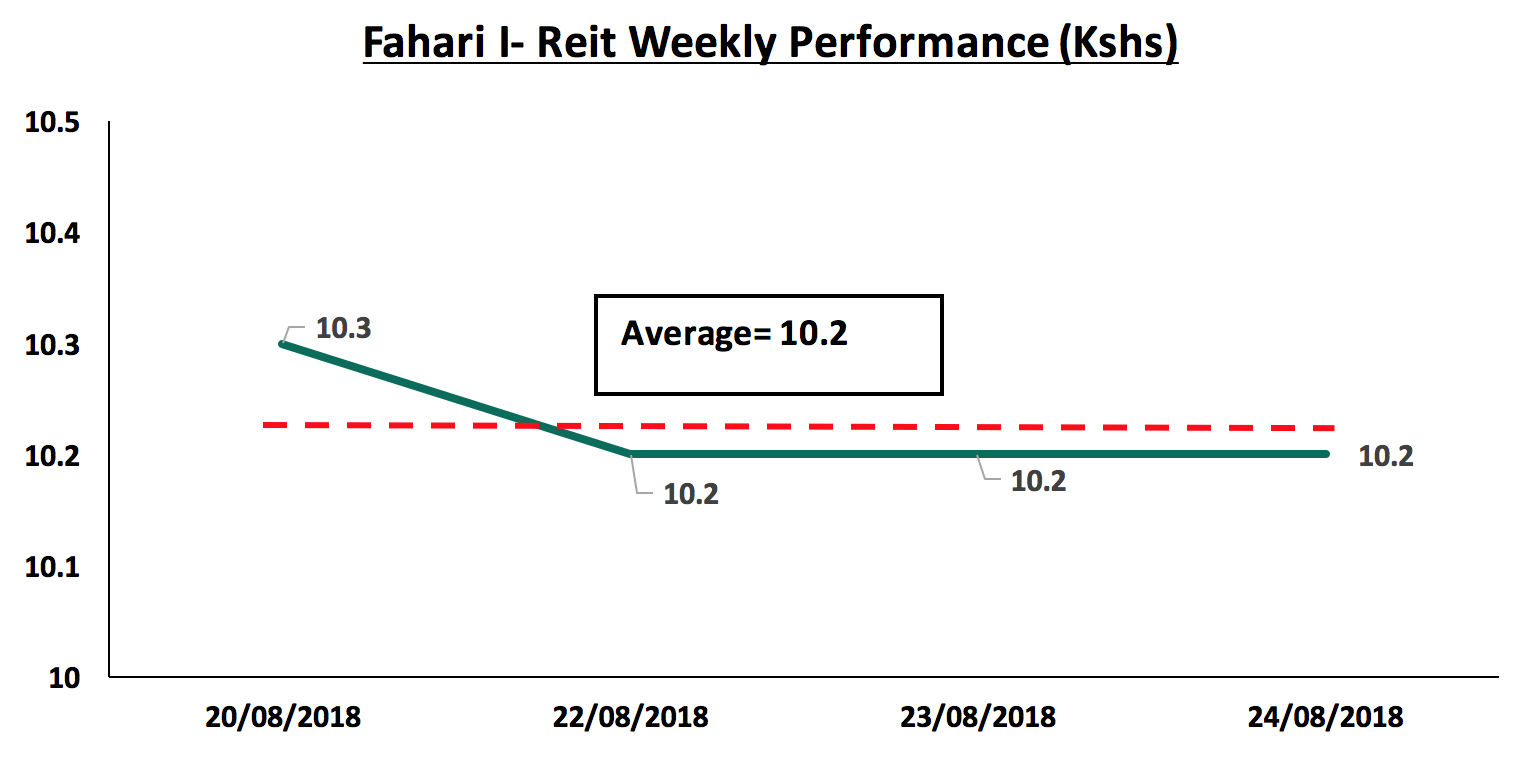
The Nigerian I-REIT market remained unchanged, with Union Homes, Skye Shelter, and UPDC, retaining a price per share of N45.2, N95 and N9, respectively, throughout the week. We attribute to the inadequate investor knowledge about the market hence low investor interest in the instrument, and poor valuation of the market, which leads to lower levels of demand by potential investors.
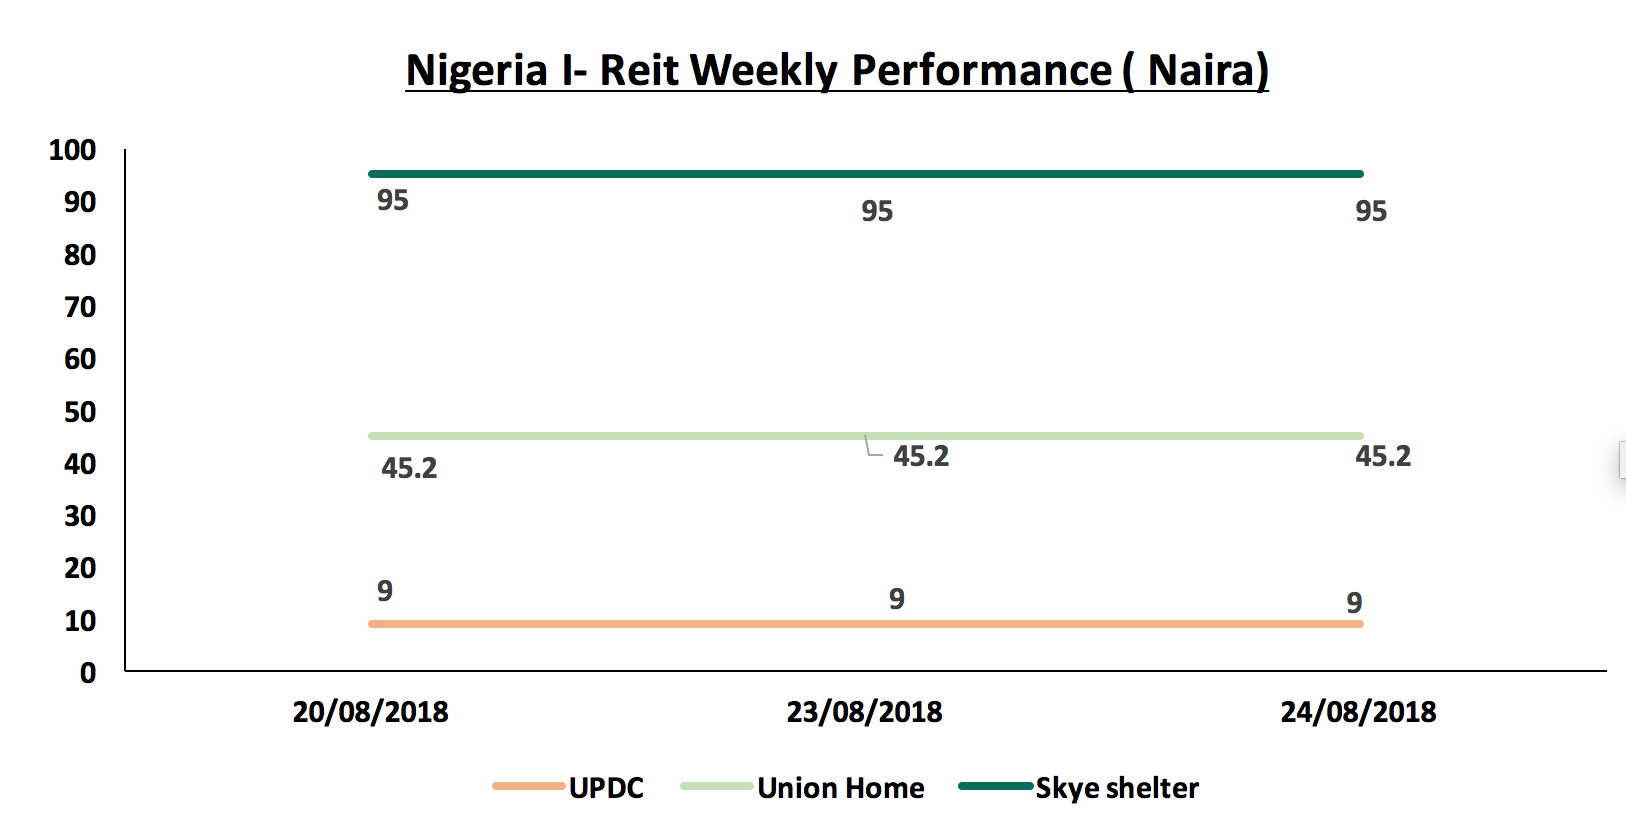
We expect continued increase in activities in the real estate sector driven by; (i) continued infrastructural development, (ii) the housing deficit that currently stands at 2.0 mn units according to the National Housing Corporation (NHC), (iii) positive demographics such as a high population growth rate of 2.6%. 1.4% point higher than global averages of 1.2%, and (iv) the relatively high urbanization rate in Kenya at 4.4% compared to the global average of 2.1%, necessitating the need for adequate housing in the urban areas.
This week we revisit the interest rate cap topic following the proposed amendments to the Finance Bill, 2018, tabled by the Parliamentary Committee on Finance and Planning in the National Assembly during its second reading. According to the chair of the committee, the proposed amendments were based on deliberations of the committee and the comments received during public awareness and stakeholder participation forums conducted between 1st – 3rd August 2018, following the first reading of the Finance Bill, 2018 on 3rd July 2018. The Finance Bill, 2018, during its first reading, proposed the repeal of section 33B of the Banking Act, which would result in the elimination of the Central Bank’s powers to enforce an interest rate cap in banks and other financial institutions. However, based on the committee’s deliberations and input from the public, the committee is now of the view that, (i) the upper limit on interest rate charged on borrowers, which is capped at 400 basis points above the CBR, should be maintained, stating that there is no justification for the repeal of the cap, as banks have not shown efforts to address the issue of high credit risk pricing, and (ii) the floor set for deposit rates paid to depositors at 70% of the CBR should be repealed.
In light of the above amendments to the bill, we revisit the issue of the interest rate cap, focusing on:
- Background of the Interest Rate Cap Legislation - What Led to Its Enactment?
- A Review of the Effects It Has Had So Far in Kenya
- A Highlight of the Finance Bill 2018 and The Proposal by Parliament to Maintain a Cap on the Lending Rates
- Our Views on the Steps That Should Be Taken to Stimulate Capital Market Alternatives
Section I: Background of the Interest Rate Cap Legislation - What Led to Its Enactment?
The enactment of the Banking (Amendment) Act, 2015, that capped lending rates at 4.0% above the Central Bank Rate (CBR), and deposit rates at 70.0% of the CBR, came against a backdrop of low trust in the Kenyan banking sector about credit pricing due to various reasons;
- First, the period was marred with several failures of banks such as Chase Bank Limited, Imperial Bank Limited and Dubai Bank, due to isolated corporate governance lapses. The failure of these banks rendered depositors helpless and unable to access their deposits in these banks. The fact that no single prosecution was ongoing at the time, for alleged malpractices that led to the collapse of some of the banks such as Imperial Bank, only served to infuriate depositors who had their deposits locked in these institutions,
- The total cost of credit was high at approximately 21.0% per annum, yet on the other hand, the interest earned on deposits placed in banks was low, at approximately 5.0% per annum. This led to a high spread between the lending rates and deposit rates as shown in the graph below,
- Credit accessibility was also subdued under this regime of expensive debt, as a lot of individuals opted out of seeking debt from commercial banks, owing to the opacity involved in the loan terms. Thus most individuals and entities opted for alternative sources of funding such as “soft loans” other than from banks, and,
- Banks are the primary source of business funding in the country, providing 95.0% of funding, with other alternative sources such as the capital markets providing a combined 5.0%, compared to developed markets where banks provide only 40.0% of the credit in the economy. This skewed source of funding in Kenya was in favor of the banks, as they would price loans on their terms, as opposed to the optimal market rate. This low level of competition from alternative sources of funding in part contributed to high interest rate charges levied by banks.
This fuelled anger from the Kenyan public, who accused banks of unfair practice in the quest for extremely high profits at the expense of borrowers and savers. As a result, banks in Kenya had been making one of the highest profits in the region, as shown in the charts below for the period between 2012 and 2016:
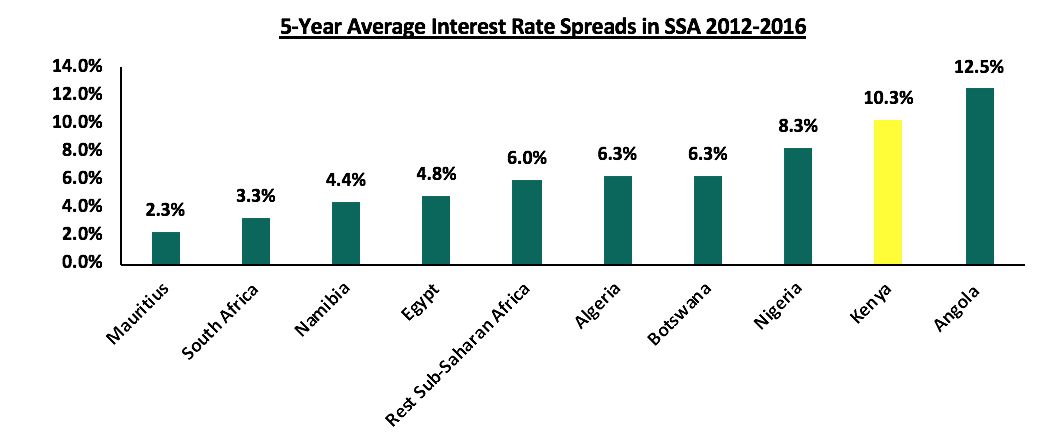
Source: World Bank
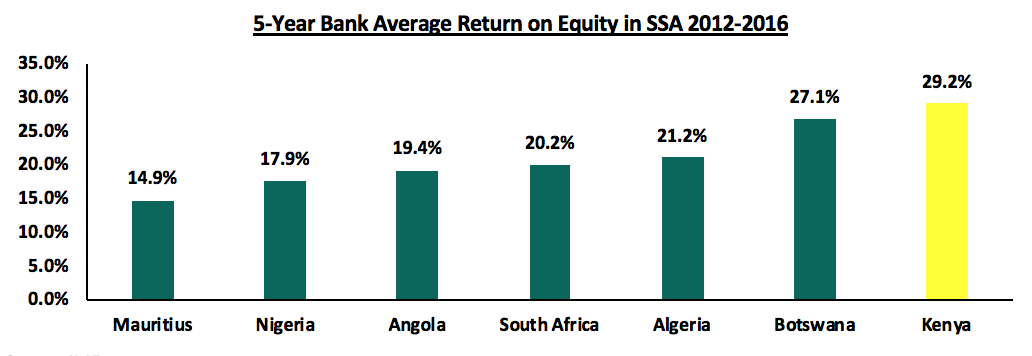
Source: IMF
This culminated in the interest rate cap bill being tabled in parliament, and due to its populist nature was passed and signed into law by the President on August 24th, 2016, and it was enforced from September 14th 2016.
Our view has always been that the interest rate cap regime would have adverse effect on the economy, and by extension, to the Kenyan People. We have previously written about this in six focus notes, namely:
- Interest Rate Cap is Kenya’s Brexit - Popular But Unwise, dated 21st August 2016, three days before the signing into law of the interest rate cap, where we first expressed our view that the interest rate cap would have a clear negative impact on the economy. We noted that free markets tend to be strongly correlated with stronger economic growth, plus we noted the lack of compelling evidence of any economy where interest rate capping was successful, as evidenced by the World Bank report on the capping of interest rates in 76 countries around the world. In Zambia, for example, interest rate caps were introduced in December 2012 and repealed 3-years later, in November 2015, after the impact was found to be detrimental to the economy. We called for the implementation of a strong consumer protection agency and framework, coupled with the promotion of initiatives for competing alternative products and channels,
- Impact of the Interest Rate Cap, dated 28th August 2016, four days after the interest rate cap bill was signed into law, where we highlighted the immediate effects of the interest rate cap, as banking stocks lost 15.6% in 2-days. Here, we re-iterated our stance on the negative effects of the interest rate cap, while identifying the winners and losers of the Banking (Amendment) Act, 2015,
- The State of Interest Rate Caps, dated 14th May 2017, 9-months after the interest rate cap was signed into law, where we assessed the interest rate cap and its effects on private sector credit growth, the banking sector and the economy in general, following concerns raised by the IMF. We noted that the law had the effect of (i) inhibiting access to credit by SMEs and other “small borrowers” whom banks cited as being unable to fit within the 4.0% risk premium, and (ii) contributed to subduing of private sector credit growth, which was recorded at 4.0% in March 2017. We suggested that policymakers review the legislation, highlighting that there existed, and continues to exist, opportunities for structured financial products and private equity players to come in and provide capital for SMEs and other businesses to grow, and consequently improve private sector credit growth,
- Update on Effect on Interest Rate Caps on Credit Growth and Cost of Credit, dated 23rd July 2017, approximately 1-year after the Banking (Amendment) Act, 2015 was signed into law, where we analyzed the decline in private sector credit growth and lending by commercial banks, coupled with the elevated total cost of credit, which was higher than the legislated 14.0%, as banks loaded excessive additional charges, while noting that the large banks, which control a substantial amount of the banking sector loan portfolio, were the most expensive. We suggested (i) a repeal or modification of the interest rate cap, (ii) increased transparency, (iii) improved and more accommodating regulation, (iv) consumer education, and (v) diversification of funding sources into alternatives,
- The Total Cost of Credit Post Rate Cap, dated 14th January 2018, where we analyzed the true cost of credit, initiatives put in place to make credit cheaper and more accessible, the impact of the interest rate cap on private sector credit growth, and what more can be done do remedy the effects of the interest rate cap, and
- Rate Cap Review Should Focus More on Stimulating Capital Markets, dated 13th May 2018, where we revisited the interest rate cap following an announcement by the Treasury that they were in the process of completing a draft proposal that will address credit management in the economy.
Section II: A Review of the Effects It Has Had So Far in Kenya
As detailed in our focus note Rate Cap Review Should Focus More on Stimulating Capital Markets, the interest rate cap has had the following four key effects to Kenya’s economy since its enactment:
- Drop in the Private Sector Credit Growth: Private sector credit growth in Kenya has been declining, and the enactment of the Banking (Amendment) Act, 2015, had the adverse effect of further subduing credit growth. The law capped lending rates at 4.0% points above the CBR. This made it difficult for banks to price some of the borrowers within the set margins, a majority being SMEs, as they were perceived “risky borrowers”. Banks thus invested in asset classes with higher returns on a risk-adjusted basis, such as government securities. As can be seen from the graph below, private sector credit growth touched a high of 25.8% in June 2014, and has averaged 13.0% over the last five-years, but dropped to 2.0% levels after the capping of interest rates, rising slightly to 4.3% in June 2018
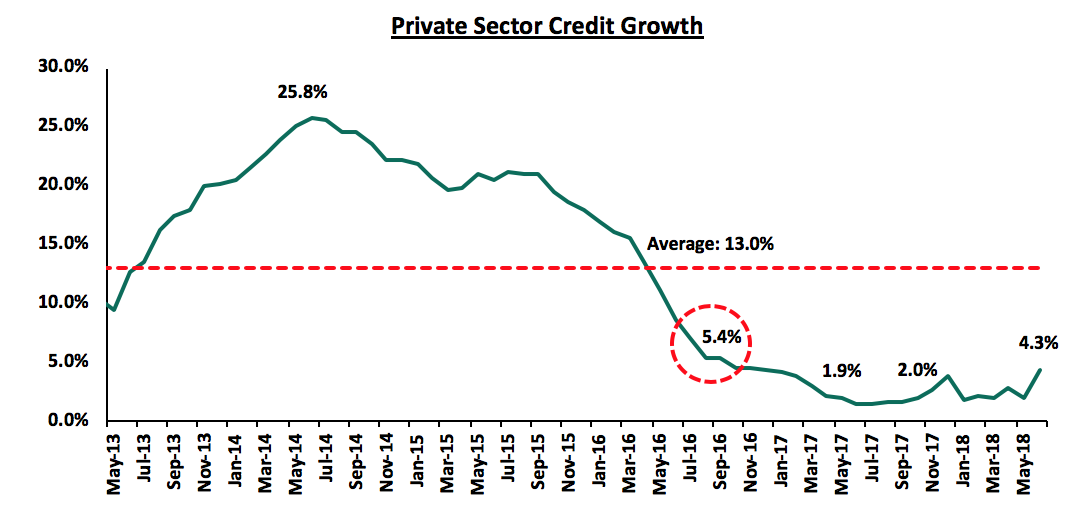
- Reduced Loan Accessibility: Immediately after the enactment of the Banking (Amendment) Act, 2015, banks saw an increase in demand for loans, as the number of loan applications increased by 20.0% in Q4’2016 according to the CBK Credit Officer Survey of October-December 2016. This was due to borrowers attempting to get access to cheaper credit. However, this demand was not matched with supply of loans by banks as evidenced by:
- Reduced Loan Growth: According to the Bank Supervision Annual Report 2017, the Net Loan growth has been declining since the enactment of the interest rate cap, having come from a growth of 11.2% in 2015, to a decline of 7.7% as of December 2017, as shown in the graph below.
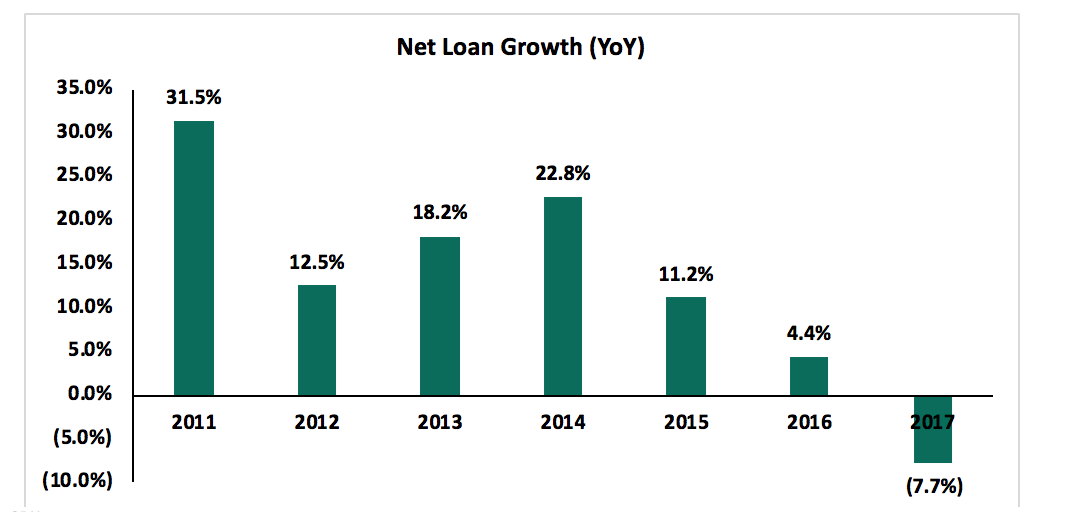
- Decline in the number of loan accounts: The number of loan accounts in large banks (Tier I) declined by 27.8%, the largest among the three tiers, followed by Tier II banks with a decline of 11.1% between October 2016 and June 2017.
- Increase in average loan size: The average loan size increased by 36.0% to Kshs 548,000 from Kshs 402,000 between October 2016 and June 2017. This points to lower credit access by smaller borrowers, while also demonstrating that credit was extended to larger and more “secure” borrowers.
- Decrease in average loan tenures: The average loan tenure declined by 50.0% to 18-24 months compared to 36-48 months prior to the introduction of the interest rate cap. This is due to bank’s increasing their sensitivity to risk, thereby opting to extend only short-term and secured lending facilities to borrowers, rather than longer-terms loans to be used for investments, according to the latest survey by the Kenya Bankers Association (KBA) on the effects of the Banking (Amendment) Act, 2015.
- Reduced Loan Growth: According to the Bank Supervision Annual Report 2017, the Net Loan growth has been declining since the enactment of the interest rate cap, having come from a growth of 11.2% in 2015, to a decline of 7.7% as of December 2017, as shown in the graph below.
- Review of Bank’s Operating Models to Mitigate Effects of the Rate Cap Legislation: The enactment of the Banking (Amendment) Act, 2015, saw banks changing their business and operating models to compensate for reduced interest income (their major source of income) as a result of the capped interest rates. Thus, banks adapted to this tough operating environment by adopting new operating models through:
- Increased focus on Non-Funded Income (NFI), evidenced by the fact that the proportion of non-interest income to total income stood at 28.4% in September 2016, and has risen to the current average of 35.4%, for listed commercial banks that have released their H1’2018 financial results,
- Increased focus on transactional accounts as increased their focus to growing their transactional accounts as opposed to interest earning accounts,
- Increased lending to the government rather than individuals and the private sector, given the higher risk-adjusted returns offered by government debt, and
- Banks also stepped up their cost rationalization efforts by increasing the use of alternative channels by mainly leveraging on technology such as mobile money and internet banking to improve efficiency and consequently reduce costs associated with the traditional brick and mortar approach. This led to the closure of branches and staff layoffs in a bid to retain the profit margins in the tough operating environment, due to depressed interest income.
- Weakening of Monetary Policy Effectiveness: The Banking (Amendment) Act, 2015, has made it difficult for the Central Bank to conduct its monetary policy function. This is majorly because any alteration to the CBR would directly affect the deposit and lending rates. Expansionary monetary policy is difficult to implement since lowering the CBR has the effect of lowering the lending rates and as a consequence, banks find it even more difficult to price for risk at the lower interest rates, leading to pricing out of even more risky borrowers, and hence further reducing access to credit. On the other hand, if the CBK was to employ a contractionary monetary policy, so as to reduce inflation and credit growth for example, then raising the CBR would have the converse effect of increasing the supply of credit in the economy since banks would be able to admit riskier borrowers.
Section III: A Highlight of the Finance Bill 2018 and The Proposal by Parliament to Maintain the Rate Cap
Having now been in effect for 24-months, we have seen various efforts put in place to review the law given the significant evidence that its intended objectives have not been achieved. The efforts noted include:
- In March 2018, the International Monetary Fund (IMF) announced its decision to withdraw the USD 1.5 bn stand-by credit and precautionary facility to Kenya, citing failure to meet conditions previously agreed upon for the facility to be extended, key among these being lowering of the budget deficit to 3.7% of GDP by the fiscal year 2018/19 (projections as per the Draft 2018 BPS indicated a deficit of 6.0%). To have the facility extended, the National Treasury and the President endorsed the repeal of the cap, stating that it had contributed towards crowding out the private sector from accessing credit.
- Development on The Draft Financial Markets Conduct Bill by Treasury, which would address credit management in the economy. The draft Bill focused on reducing the cost of credit, and present some consumer protection policies. However, as Highlighted in our Focus Note, The Draft Financial Markets Conduct Bill, 2018, the bill failed to address bank dominance , funding reliance, and the need to focus on expanding capital markets as an alternative to funding which in our view are necessary, accompaniments to a review of the law, and
- The development of The Finance Bill 2018, which sought various amendments to the tax regime and the repeal of interest rate capping. However, following the second reading of the bill in parliament, the committee on Finance and planning in the National Assembly is of the view that, (i) the upper limit on interest rate charged on borrowers, which is capped at 400 basis points above the CBR, should be maintained, stating that there is no justification for the repeal of the cap, as banks have not shown efforts to address the issue of high credit risk pricing, and (ii) the floor set for deposit rates paid to depositors at 70% of the CBR should be repealed.
In our view, the proposal by the committee to maintain the interest rate cap based only on the lack of efforts by the banks to address the issue of high credit risk pricing, fails to consider other stakeholders who have been negatively affected by the law, and echoes our consistent view that the repeal has always been more focused on banks. As highlighted in the next section, any successful review or repeal of the law should be accompanied by policies to manage bank dominance, reduce the funding reliance on banks and should focus on expanding capital markets as an alternative sources of funding.
Section IV: Steps that Should Be Taken to Expand Capital Markets as an Alternative to Banks
Considering the effects of the interest rate cap, we maintain the view that the law should be repealed or reviewed to give banks flexibility in pricing loans. In our view, the review or repeal of the law should be accompanied by the following recommendations that will address the existing bank dominance, reduce the funding reliance we have on banks and support the expansion of capital markets as an alternative to banks:
- Legislation and policies to promote competing sources of financing should be the centerpiece of the repeal legislation: A lot of legislative action has focused on the banks, yet we also need legislation to promote competing products that will diversify funding sources, which will enable borrowers to tap into alternative avenues of funding that are more flexible and pocket-friendly. This can be done through the promotion of initiatives for competing and alternative products and channels, in order to make the banking sector more competitive. In developed economies, 40% of business funding comes from the banking sector, with 60% coming from non-bank institutional funding. In Kenya, 95% of all funding is bank funding, and only 5% from non-bank institutional funding, showing that the economy is highly dominated by the banking sector and should have more alternative and capital market products for funding businesses. Alternative investment managers and the capital markets regulators need to look at how to enhance non-bank funding, such as high yield investment vehicles, such as High Yield Solutions. The products offer investors with cash to invest at a rate of about 18% to 19% per annum, equivalent to what the fund takers, such as real estate developers, would have to pay to get funds from the banks. Instead of a saver taking money to the bank and getting negligible returns, they can just invest in a funding vehicle where the business would pay them the same 18% to 19% per annum that they would pay to get the same money from the bank. For the saver, it helps improve their rate from low rates, at best 7% per annum, to as high as 18% per annum, and for the business seeking funding, it helps them access funding much faster to grow their business. Promoting alternative funding is also essential to the affordable housing piece of the “Big Four” government agenda, which requires capital markets funding,
- Consumer protection: The implementation of a strong consumer protection, education agency and framework, to include robust disclosures on cost of credit, free and accessible consumer education, enforcement of disclosures on borrowings and interest rates, while also handling issues of contention and concerns from consumers,
- Promote capital markets infrastructure: Efficient capital markets infrastructure is necessary in both regulated and private markets. The Capital Markets Authority (CMA) could aid in enhancing the capital markets’ depth in various ways such as (i) making it easier for new and structurally unique products to be introduced in the capital and financial markets, (ii) institute predictable deadlines for processing submissions from market applicants and expedite processing of applications, (iii) push for a one stop shop for applicants such that an approval from the authority on products such as REITS would suffice, as opposed to current structure where applicants have to chase other approvals from other agencies such as KRA.
- Addressing the tax advantages that banks enjoy: Level the playing field by making tax incentives available to banks to be also available to non-bank funding entities and capital markets products such as unit trust funds and private investment funds. For example, providing alternative and capital markets funding organizations with the same withholding tax incentives that banking deposits enjoy, of a 15% final withholding tax so that depositors don’t feel that they have to go to a bank to enjoy the 15% withholding tax; alternatively, normalize the tax on interest for all players to 30% to level the playing field,
- Consumer education: Educate borrowers on how to be able to access credit, the use of collateral, and the importance of establishing a strong credit history,
- The adoption of structured and centralized credit scoring and rating methodology: This would go a long way to eliminate any biases and inconsistencies associated with accessing credit. Through a centralized Credit Reference Bureau (CRB), risk pricing is more transparent, and lenders and borrowers have more information regarding credit histories and scores, thus enabling banks price customers appropriately, spurring increased access to credit,
- Increased transparency: This can be achieved through a reduction of the opacity in debt pricing. This will spur competitiveness in the banking sector and bring a halt to excessive fees and costs. Recent initiatives by the CBK and Kenya Bankers Association (KBA), such as the stringent new laws and cost of credit website being commendable initiatives,
In conclusion, a free market, where interest rates are set by the forces of demand and supply coupled with increased competition from non-bank financial institutions for funding, will see a more self-regulated environment where the cost of credit reduces, as well as increased access to credit by borrowers that have been shunned under the current regime. Consequently, a repeal is necessary, but the repeal needs to be comprehensive and contain the 7 elements above for it to be effective, but the center-piece of the legislation should be stimulating capital markets to reduce banking sector dominance, yet this key piece seems to be missing in the current Finance Bill 2018.
Disclaimer: The views expressed in this publication are those of the writers where particulars are not warranted. This publication, which is in compliance with Section 2 of the Capital Markets Authority Act Cap 485A, is meant for general information only and is not a warranty, representation, advice or solicitation of any nature. Readers are advised in all circumstances to seek the advice of a registered investment advisor.

- Talk to us
- Kenya
- P.O Box 20695 - 00200, Nairobi, Kenya
- Cell +254709101200
- Tel +254709101200
- WhatsApp +254741676635
- United States
- +254709101200
- DOWNLOAD OUR APP
-


- Kenya
- 8th Floor, Pinetree Plaza, Kaburu Drive, Ngong Road, Nairobi, Kenya
- USA
- Suite 1150, 1775 Eye Street NW, USA, Washington DC 20006, USA
- Investments
- High Yield
- Private Equity
- Real Estate
- Real Estate
- RiverRun Estates
- Cytonn Towers
- The Ridge
- Taraji Heights
- The Alma