Cytonn H1’2018 Markets Review
By Cytonn Research Team, Jul 1, 2018
Executive Summary
A. Global Markets Review
Global growth for Q1’2018 was estimated at 3.1%, similar to the projected growth, according to the World Bank. The various regions recorded continued growth in Q1’2018 with China, US and the Eurozone recording GDP growth figures of 6.8%, 2.0% and 0.4% compared to 6.8%, 1.4% and 0.5%, respectively, in Q1’2017. There was divergence in monetary policy, with the US Federal Open Market Committee (FOMC) raising the Federal Funds Rate by 25 bps to a bound of 1.75% - 2.0% in June, marking the second rate hike this year, while the European Central Bank (ECB) maintained the base lending rate at 0.00% in April;
B. Sub-Saharan Africa Regional Review
GDP growth in SSA is projected to come in at 3.4% in 2018, up from 2.8% in 2017, supported by higher commodity prices, and improved capital markets access. Majority of the SSA stock markets recorded negative returns during H1’2018, largely attributable to capital outflows from the markets as profit taking investors exited the markets so as to realize the gains made in various sectors such as oil and gas, that was boosted by a global rally in crude prices, and the financial services sector;
C. Kenya Macro Economic Review
The macroeconomic environment in Kenya has remained relatively stable in the first half of 2018, supported by (i) the Government’s continued investment in infrastructure, (ii) a stable interest rate environment, (iii) a relatively stable currency, having gained by 2.1% against the dollar in H1’2018, and (iv) improved business confidence and strong private consumption. The average inflation rate for H1’2018 decreased to 4.2% from 9.8% in H1’2017, with June 2018 inflation having risen to 4.3% from 4.0% in May;
D. Fixed Income
During the first half of 2018, T-bills auctions recorded an oversubscription, with the average subscription rate coming in at 142.6%, compared to 263.2% in H1’2017. Overall average subscription rates for the 91, 182, and 364-day papers in H1’2018 came in at 105.6%, 122.3% and 177.7%, respectively, from 154.0%, 184.5% and 131.2%, in H1’2017. Yields on T-bills declined by 40 bps, 90 bps and 70 bps in H1’2018, closing at 7.7%, 9.7%, and 10.5%, from 8.1%, 10.6%, and 11.2% for the 91, 182, and 364-day papers, respectively, at the end of 2017;
E. Equities
During H1’2018, the Kenyan equities market recorded mixed performance, with NASI and NSE 25 gaining 1.8% and 2.4% respectively, while NSE 20 declined by 11.5%. Kenyan listed banks released their FY’2017 and Q1’2018 results, recording a 1.0% decline and a 14.4% increase in core EPS, respectively, compared to a growth of 4.4% in FY’2016 and an 8.6% decline in Q1’2017;
F. Private Equity
During H1’2018, we witnessed increased private equity activity across all sectors within our coverage: Financial Services, Education, Hospitality, and Real Estate. The Financial Services sector was dominant with notable transactions in Fintech lending, Insurance, and Banking;
G. Real Estate
H1’2018 performance of the real estate sector in Kenya improved slightly, with sectors such as office, retail and industrial registering a marginal increase in yields of between 0.1% points and 0.7% points to 9.3%, 9.7% and 6.1% from 9.2%, 9.6% and 5.4%, respectively. The performance has been bolstered by (i) continued demand for investment property from multinational individuals and the growing middle class, (ii) Government efforts towards enabling the environment for developers through key statutory reforms such as National Land Use Policy, and initiatives such as the National Housing Development Fund, (iii) the expanding middle class, and (iv) continued infrastructural improvements in the country.
- During the week, Cytonn Investments Management Plc secured an additional Kshs 2.1 bn in funding from our institutional partners, Taaleri of Finland. This is the fourth time the Finnish firm is investing in Cytonn, having already committed over KES 3.0 bn towards projects by Cytonn – The Alma, Amara Ridge and Situ Village. See Press Release here
- On Wednesday, 27th June 2018, Cytonn Foundation, an initiative of Cytonn Investments that focuses on giving back to the society through skill development, held a Private Wealth Management (WMT) and Cytonn Young Leaders Program (CYLP) training at the Mount Kenya University (MKU) located in Thika, as part of the Foundation’s financial literacy pillar. The University staff were taken through a real estate management training session with a focus on opportunities available in the real estate sector. See Event Note
- Edwin H. Dande, CEO of Cytonn Investments, gave the key-note address at this year’s Founders of the Year Awards (FOYA), held on 29th July 2018. See Event Note here
- On Saturday 30th June, 2018, Cytonn Investments Management Plc held a Staff Team Building Event themed “Crazy Olympics” at the Parklands Sports Club. See Event Note here
- Edwin H. Dande, CEO of Cytonn Investments, was a panelist at the Chartered Accountants Day for the Institute of Chartered Accountants of India - Nairobi Chapter, themed “Corporate Governance”
- Caleb Mugendi, Senior Investments Analyst, discussed the 2018 Appropriation Bill. Watch him on CNBC here
- Maurice Oduor, Senior Investments Manager, discussed the impact of the interest cap law. Watch him on Citizen TV here
- We continue to hold weekly workshops and site visits on how to build wealth through real estate investments. The weekly workshops and site visits target both investors looking to invest in real estate directly and those interested in high yield investment products to familiarize themselves with how we support our high yields. Watch progress videos and pictures of The Alma, Amara Ridge, The Ridge, and Taraji Heights. Key to note is that our cost of capital is priced off the loan markets, where all-in pricing ranges from 16.0% to 20.0%, and our yield on real estate developments ranges from 23.0% to 25.0%, hence our top-line gross spread is about 6.0%. If interested in attending the site visits, kindly register here
- We continue to see very strong interest in our weekly Private Wealth Management Training (largely covering financial planning and structured products). The training is at no cost and is open only to pre-screened participants. We also continue to see institutions and investment groups interested in the trainings for their teams. The Wealth Management Trainings are run by the Cytonn Foundation under its financial literacy pillar. If interested in our Private Wealth Management Training for your employees or investment group please get in touch with us through wmt@cytonn.com. To view the Wealth Management Training topics, click here
- For recent news about the company, see our news section here
- We have 10 investment-ready projects, offering attractive development and buyer targeted returns of around 23.0% to 25.0% p.a. See further details here: Summary of Investment-Ready Projects
- We continue to beef up the team with ongoing hires for: Full Stack Software Engineer, Unit Manager-Nairobi. Visit the Careers section on our website to apply
Introduction:
Most global economies registered continued economic growth in the first quarter of 2018, with China, USA and the Eurozone registering growths of 6.8%, 2.0% and 0.4% y/y, compared to 6.7%, 1.1% and 0.5%, respectively, in Q1’2017. The regions begun the year with good performance but ongoing trade concerns and abrasive geopolitical stances have threatened to derail this.
Below is the summary of the key occurrences in H1’2018 per region:
United States:
The US Federal Open Market Committee (FOMC) hiked the Federal Funds Rate twice during the year, settling on a range of 1.75% - 2.00% in June. The decision by the FOMC to hike rates was on the back of a decline in the unemployment rate to an 18-year low of 3.8% in June from 3.9% in March 2018, below the unemployment rate target of 4.5%. The committee highlighted that economic growth has been rising at a solid rate to record a 2.0% GDP growth in Q1’2018, bolstered by tax cuts and a strong labor market. The Committee expects to raise the federal funds rate 2 more times in 2018, due to (i) a sustained GDP growth of 2.0% in Q1’2018, expected to record hit 2.7% for FY’2018, (ii) strong labor market conditions as indicated by the low unemployment rate, and (iii) inflation that is at 2.8%, which is expected to edge closer to the Committee's preferred level of 2.0% over the medium term.
The US stock market recorded a positive performance, with S&P 500 having gained by 0.8% in H1’2018, attributed to gains in the technology and financial services sectors, on optimism of pro-growth and protectionism policies from the current Trump administration, such as the corporate tax cut from 30.0% to 21.0%, which has tended to boost corporate earnings and thereby lead to rising stock prices.
We expect the US market to remain supported by a strong labor market that will spur domestic consumption and economic growth. However, the ongoing trade wars between the US and China, the Eurozone, Mexico and Canada is likely to dampen the country’s growth prospects, which could disrupt product supply chains and undercut business investment.
Eurozone:
In the Eurozone, the momentum in growth waned, as the GDP growth was recorded at 0.4% in Q1’2018, which was lower than the 0.7% growth recorded in both Q1’2017 and Q4’2017. The decline in the GDP growth could largely be attributed to a weak performance in the external sector, as exports declined by 0.4%, for the first time since Q4’2012. The decline in exports was largely due to a lower aggregate demand of products that could be attributed to a strong Euro currency. Moreover, there was overall reduced government spending coupled with reduced fixed investment growth. The Eurozone PMI declined by 5.9% to 55.5 from 58.8 recorded in January 2018. The decline in the PMI points to slowing economic growth in the region, as inflows from new business grew at a reduced pace.
The European Central Bank (ECB) recently met in June, maintaining the base lending rate at 0.00%, and the rates on the marginal lending facility and deposit facility at 0.25% and (0.40%), respectively. The current negative deposit rates are expected to persist in 2018 and impact growth positively by spurring domestic regional consumption. The Bank also announced an upcoming end to its Quantitative Easing (QE) program at its June meeting. The ECB will finalize its asset purchase program at the end of December 2018 and halve the pace of purchases from the current EUR 30.0 bn per month to EUR 15.0 bn per month in the final quarter of the year. This points to the beginning of the end for monetary stimulus in the Eurozone. The bank also signaled that the path of interest rates going forward, is likely to remain at the current levels through to the summer of 2019, granted inflation moves as expected.
The stock markets in Europe registered declines in the first half of 2018, with the FTSE 100 declining by 0.1%, primarily due to the healthcare and telecommunication sectors. The region’s stock markets began the year with a positive performance, but were weighed down by uncertainty on the path of US interest rates and the outlook of global trade. The sectors tend to serve as “bond proxies” that offer stable returns and are much sought after when bond yields are low. However, amid rising US rates, and therefore rising bond yields, these sectors declined on account of increased capital outflows.
On the political front, growing global trade tensions are threatening the Eurozone’s outlook. On 22nd June, US President Donald Trump threatened to escalate a trade dispute with the EU by slapping a 20.0% tariff on automobiles. This came after the EU enacted retaliatory tariffs on US goods, following the US’s imposition of tariffs on steel and aluminum imports from the EU. While the US’ initial tariffs on steel and aluminum are expected to have a relatively small economic effect, the automobile industry is a much larger sector and the US is the biggest market for EU car exports, meaning that the economic effect would be much more pronounced for countries such as Germany and the UK, if the tariffs are imposed. On the domestic political front, Italy and Spain have experienced political uncertainty. New, relatively unstable governments have been installed in both countries, as detailed below:
In Italy:
- A Coalition Government formed by the populist Five Star Movement (M5S) and right-wing League party was installed in June, ending months of political deadlock, and,
- The Coalition spelt out plans for fiscally expansionary policies, which may cause the government to clash with European bodies if they flout the expenditure guidelines.
In Spain:
- Pedro Sánchez was sworn in as the new Prime Minister at the start of June, after the incumbent Mariano Rajoy lost a confidence motion in parliament after a fallout from a massive corruption scandal that he had been implicated in, and,
- The newly installed government has weak political mettle, as it commands only 84 seats out of 350 in parliament, which will constrain policymaking and possibly limit its tenure.
In Germany:
- Political uncertainty has increased due to an internal dispute within the ruling coalition over migration policy. The dispute is seen as undermining Chancellor Angela Merkel’s leadership, which is receiving opposition from the Interior Minister Horst Seehofer, who threatened to prevent immigrants registered in other European countries from gaining entry into Germany, a move that Merkel has been vocal against.
Declining GDP growth recorded in the first quarter of 2018, coupled with rising inflation and mounting political risks, led to a downgrade of the region’s GDP growth estimates. According to World Bank, GDP is now projected to grow by 2.1% in FY’2018, down from last month’s forecast of 2.3%. Rising inflation is likely to reduce household consumption this year. The ongoing trade tensions between the Eurozone and the US is expected to impact negatively on the external trade sector, as commodities such as automobiles, are set to be disadvantaged in the US, which is a major market for them. This, coupled with the various political problems in major member countries, is expected to hamper the regions GDP growth for the year 2018.
China:
China’s y/y GDP in Q1’2018 increased by 6.8% to Yuan 19.9 tn (USD 3.2 tn), the same rate as Q3’2017 and Q4’2017. The steady economic growth was driven by (i) a steady growth in industrial production, (ii) an increase in private consumption, and (iii) increased investment in infrastructure by the government. New businesses and industries continued to record steady growth, as corporate profit and resident incomes steadily increased which boosted private consumption. The services sector, which accounted for 56.6% of the economy, played a key role in driving China’s economic growth, with a growth rate of 7.5% y/y.
On the stock market, the Shanghai Composite Index declined by 15.0% in H1’2018. The heightened uncertainty occasioned by a prolonged trade spat between China and the US has dampened investor sentiment in the country, resulting in a generally stronger Yuan against major currencies. Corporate results for December 2017 had showed positive trends. However, stock performance within sectors was attributed to investor sentiment that was influenced by political events both domestically and globally.
The Chinese economy faces several challenges that could derail the steady growth pace recorded in the previous quarters. These include (i) increased protectionism policies (policies aimed at protecting own domestic interests) in countries such as the US, (ii) monetary policy adjustments by major economies, and (iii) financial market turbulence mainly in the Eurozone. This could lead to increased uncertainty in the international markets, which could affect the country’s export business seeing as the economy is a net exporter of their domestically produced commodities. The US administration has imposed tariffs of about USD 50.0 bn on Chinese goods and, recently announced activation of denial of export privileges against leading Chinese telecom equipment maker ZTE Corp. However, the government is insistent on the capability of the economy to handle trade tensions with the United States, citing the country's increasingly domestic-led growth from local consumption, growing innovation edge, and ample room for development and policy control.
We expect the global economy to recover and post a better growth than that recorded in FY’2017, on account of improving commodity prices, increased income levels and by extension consumption levels. However, ongoing geopolitics are likely to dampen any growth prospects.
Regional Economic Growth:
During H1’2018, the IMF released their Regional Economic Outlook report for Sub-Saharan Africa (SSA) dated April 2018, with a focus on domestic revenue mobilization and private investment. The key take-outs from the report were:
- GDP growth in SSA is projected to come in at 3.4% in 2018, up from 2.8% in 2017, supported by higher commodity prices, and improved capital markets access,
- The average current account deficit in SSA is estimated to have narrowed to 2.6% of GDP in 2017, from 4.1% in 2016. The improvement was due to an increase in international receipts in about half of the region’s economies. For large oil exporters, external balances improved due to higher oil production, improvement in oil prices, and reduced imports with the current account deficit in the Central African Economic and Monetary Community (CEMAC) declining to 4.3% of GDP in 2017, from 13.8% of GDP in 2016. In non-resource intensive countries, the current account deficits remained high in 2017, due to a combination of low exports, high capital goods imports, high food and fuel imports, and increased imports related to public infrastructure projects, and,
- Regional annual inflation in SSA fell to just over 10.0% in 2017, from 12.5% in 2016, and is expected to fall further in 2018, driven by declining food prices due to improved weather conditions.
The report points to an improved operating environment in SSA with (i) a projected higher GDP growth in 2018 of 3.4%, compared to 2.8% in 2017, (ii) the average current account deficit narrowing to 2.6% of GDP in 2017, from 4.1% in 2016, and (iii) average annual inflation declining to 10.0% in 2017 from 12.5% in 2016, expected to fall further in 2018. The key concern, however, remains the rising debt burden, as public debt continued to rise in 2017, with about 40.0% of low-income developing countries in the region being in debt distress or at a high risk of debt distress, and the median level of public debt in SSA exceeding 50.0% of GDP. With the rise in debt, interest payments have also been on the rise, with the median interest payments-to-revenue ratio close to 10.0%, up from the 5-year average of 5.0%.
Regional Currencies:
Regional currencies generally declined during H1’2018 due to the strengthening of the US dollar as evidenced by the dollar index gaining 2.5% on a year to date basis. The table below shows the performance of the various currencies:
|
Select Sub Saharan Africa Currency Performance vs USD |
|||||
|
Currency |
Jun-17 |
Dec-17 |
Jun-18 |
Last 12 months |
YTD change % |
|
Kenyan Shilling |
103.7 |
103.2 |
101.1 |
2.5% |
2.1% |
|
Malawian Kwacha |
725.4 |
725.5 |
726.3 |
(0.1%) |
(0.1%) |
|
Zambian Kwacha |
9.2 |
10.0 |
10.0 |
(8.6%) |
(0.1%) |
|
Nigerian Naira |
324.5 |
360.0 |
361.2 |
(11.3%) |
(0.3%) |
|
Tanzanian Shilling |
2237.0 |
2234.6 |
2270.0 |
(1.5%) |
(1.6%) |
|
Mauritius Rupee |
34.7 |
33.6 |
34.6 |
0.3% |
(2.9%) |
|
Botswana Pula |
10.2 |
9.8 |
10.4 |
(1.5%) |
(5.7%) |
|
Ghanaian Cedi |
4.4 |
4.5 |
4.8 |
(8.4%) |
(6.0%) |
|
Ugandan Shilling |
3578.0 |
3643.3 |
3884.2 |
(8.6%) |
(6.6%) |
|
South African Rand |
13.1 |
12.4 |
13.7 |
(5.0%) |
(10.8%) |
SSA Eurobonds:
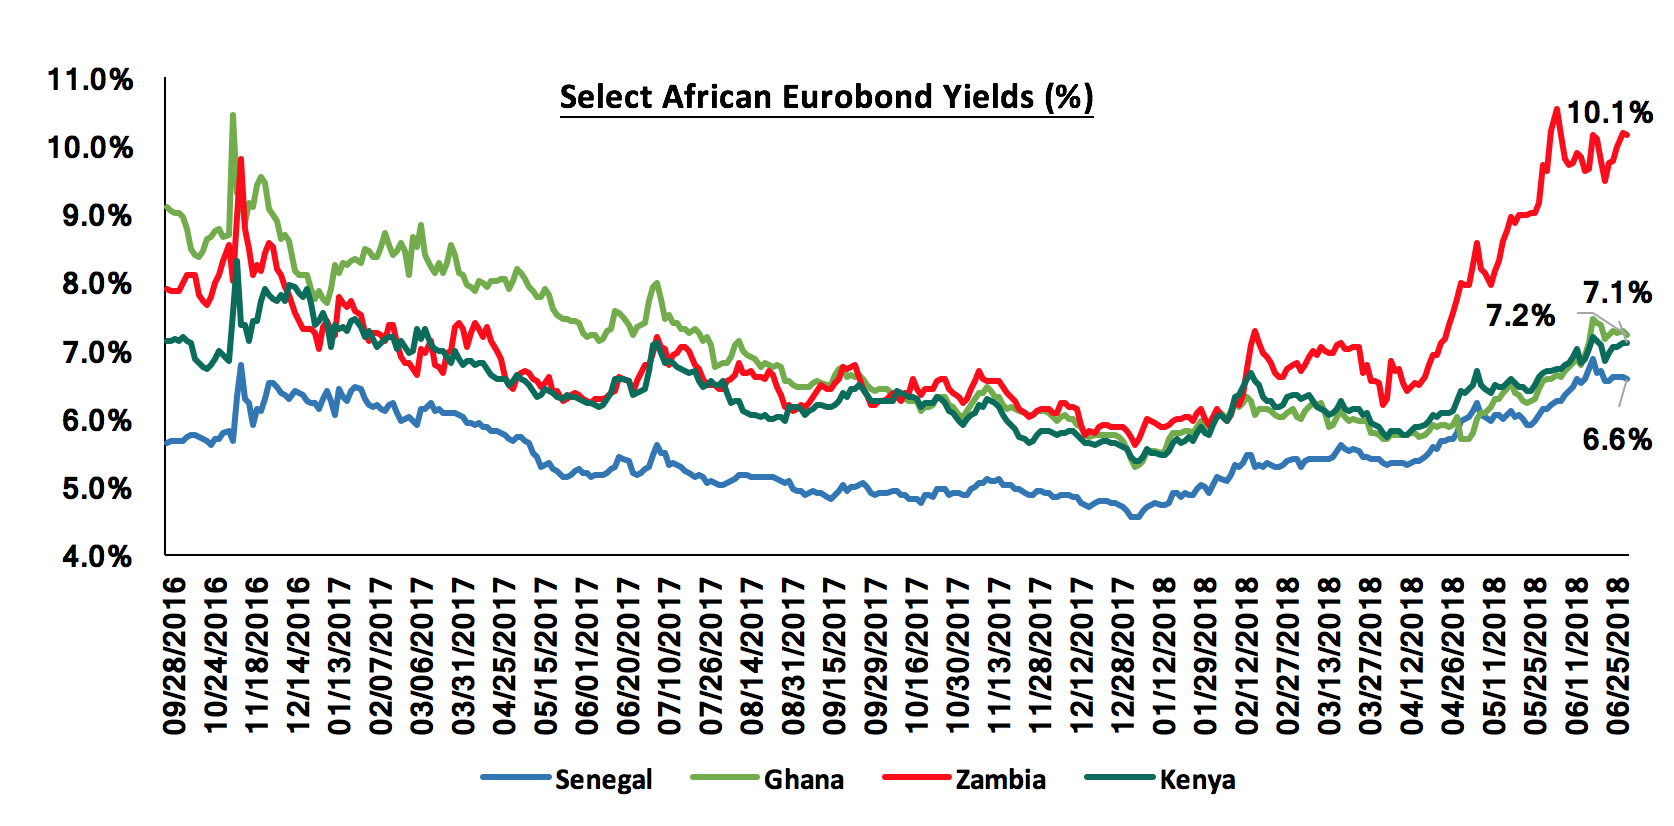
The first half of 2018 was characterized by Eurobond issuance by 5 Sub Saharan African countries (Kenya - USD 2.0 bn, Nigeria - USD 2.5 bn, Senegal - USD 2.2 bn, Ghana - USD 2.0 bn, and South Africa - USD 2.0 bn) jointly raising USD 10.7 bn; see our Focus Note on the Eurobonds in Sub-Saharan Africa here.
The table below shows the performance of select Eurobonds with a tenor of 10-years in the Sub-Saharan Africa region, with all yields having increased during the H1’2018 period:
|
Select Sub Saharan Africa 10-Year Tenor Eurobonds Performance |
|||||
|
Country |
Jun-17 |
Dec-17 |
Jun-18 |
Last 12 Months (% Points) |
YTD Change (% Points) |
|
Ghana |
7.4% |
5.7% |
7.2% |
(0.2%) |
1.5% |
|
Kenya |
6.4% |
5.6% |
7.1% |
0.7% |
1.5% |
|
Senegal |
5.2% |
4.7% |
6.6% |
1.3% |
1.9% |
|
Zambia |
6.8% |
5.9% |
10.1% |
3.4% |
4.3% |
Yields on African Eurobonds have risen attributed to corrections in global markets in line with the rising US Treasury yields, which act as a crucial benchmark for financial markets. This has also seen flight of capital as investors move to the relatively less risky USA securities. These corrections were driven by the end of the US Federal Reserve’s expansionary policy measures with 2 Fed rate hikes in the first half of 2018, which has seen a rise in the US Treasury yields against a backdrop of tighter monetary policy, rising interest rates, and inflation expected to rise in the coming months having edged up to 2.8% in May from 2.5% in April.
Regional Stock Markets:
Majority of the SSA stock markets recorded negative returns during H1’2018, largely attributable to capital outflows from the markets as profit taking investors exited the markets to realize the gains made in various sectors such as oil and gas, that was boosted by a global rally in crude prices, and the financial services sector. Various markets had experienced bullish runs from the previous year to Q1’2018 as indicated in our Q1’2018 Markets Review, however, price correction due to the capital outflows resulted in the declining performance in the second quarter of 2018. Below is a summary of the performance of key bourses in SSA:
|
Equities Market Performance (Dollarized) |
|||||
|
Country |
Jun-17 |
Dec-17 |
Jun-18 |
Last 12 Months |
YTD Change(%) |
|
Malawi |
21.8 |
29.8 |
42.4 |
94.6% |
42.3% |
|
Ghana |
446.5 |
569.7 |
600.9 |
34.6% |
5.5% |
|
Kenya |
1.5 |
1.7 |
1.7 |
17.1% |
4.0% |
|
Zambia |
519.4 |
532.1 |
547.4 |
5.4% |
2.9% |
|
Nigeria |
105.2 |
106.2 |
105.9 |
0.6% |
(0.3%) |
|
Uganda |
0.5 |
0.6 |
0.5 |
15.4% |
(2.5%) |
|
Rwanda |
0.1 |
0.2 |
0.1 |
0.8% |
(4.3%) |
|
Tanzania |
1.0 |
1.1 |
1.0 |
1.6% |
(6.4%) |
|
BRVM |
0.5 |
0.4 |
0.4 |
(13.2%) |
(11.6%) |
|
South Africa |
3953.1 |
4802.6 |
4188.0 |
5.9% |
(12.8%) |
NB: Please note these indices are dollarized and may differ from the equities section, which is in Kshs
We are of the view that increased government spending on infrastructure development, improving commodity prices in the global markets, better weather conditions and relative political stability will be the key drivers for SSA growth in 2018.
Economic Growth:
During the first half of 2018, we tracked Kenya GDP growth projections for FY’2018 released by 15 organizations, that comprised of research houses, global agencies, and government organizations. The average GDP growth, including our projection of 5.5% as at Q2’2018, came in at 5.5%, unchanged from average projections released in Q1’2018. The common view is that GDP growth will improve in 2018, from 4.9% in 2017, generally due to (i) recovery in the agriculture sector on the back of improved weather conditions, and (ii) recovery in the business environment following easing of political risk caused by the prolonged political impasse over the 2017 presidential elections.
|
Kenya 2018 Annual GDP Growth Outlook |
|||
|
No. |
Organization |
Q1'2018 |
Q2'2018 |
|
1 |
Central Bank of Kenya |
6.2% |
6.2% |
|
2 |
Kenya National Treasury |
5.8% |
5.8% |
|
3 |
Oxford Economics |
5.7% |
5.7% |
|
4 |
African Development Bank (AfDB) |
5.6% |
5.6% |
|
5 |
Stanbic Bank |
5.6% |
5.6% |
|
6 |
Citibank |
5.6% |
5.6% |
|
7 |
International Monetary Fund (IMF) |
5.5% |
5.5% |
|
8 |
World Bank |
5.5% |
5.5% |
|
9 |
Fitch Ratings |
5.5% |
5.5% |
|
10 |
Barclays Africa Group Limited |
5.5% |
5.5% |
|
11 |
Cytonn Investments Management Plc |
5.4% |
5.5% |
|
12 |
Focus Economics |
5.3% |
5.3% |
|
13 |
BMI Research |
5.3% |
5.2% |
|
14 |
The Institute of Chartered Accountants in England and Wales |
5.6% |
5.6% |
|
15 |
Standard Chartered |
4.6% |
4.6% |
|
Average |
5.5% |
5.5% |
|
The macroeconomic environment in Kenya has remained relatively stable in the first half of 2018, supported by (i) continued investment in infrastructure, (ii) a stable interest rate environment, (iii) a relatively stable currency, having gained by 2.1% in H1’2018, and (iv) improved business confidence and strong private consumption as evidenced by an average Stanbic PMI of 55.0 in the first 5 months of 2018 up from 50.2 in the first 5-months of 2017. The outlook on economic growth for 2018, is positive following improved weather conditions set to boost agricultural productivity, water supply and electricity that will in turn favor the manufacturing sector. Low private sector credit growth, which stood at 2.8% as at April as compared to the 5-year average of 14.0%, remains one of the key concerns for economic growth.
The Kenya Shilling:
The Kenya Shilling appreciated against the US Dollar by 2.1% in H1’2018 to close at Kshs 101.1 from Kshs 103.2 at the end of 2017. This week, the Kenyan Shilling declined by 0.2% against the dollar to close at Kshs 101.1 from Kshs 100.8 the previous week due to end month dollar demand from oil importers and manufacturers. In our view, the shilling should remain relatively stable in the short term, supported by,
- The narrowing of the current account deficit which stood at 6.1% of GDP as at March 2018 from 6.4% in December 2017,
- Stronger inflows from principal exports which include coffee, tea and horticulture which increased by 9.3% during the month of April to Kshs 21.9 bn from Kshs 20.0 bn in a similar period the previous year, with the exports from coffee, and horticulture increasing by 6.7%, and 25.0% y/y, respectively, despite tea exports declining marginally by 1.6% y/y,
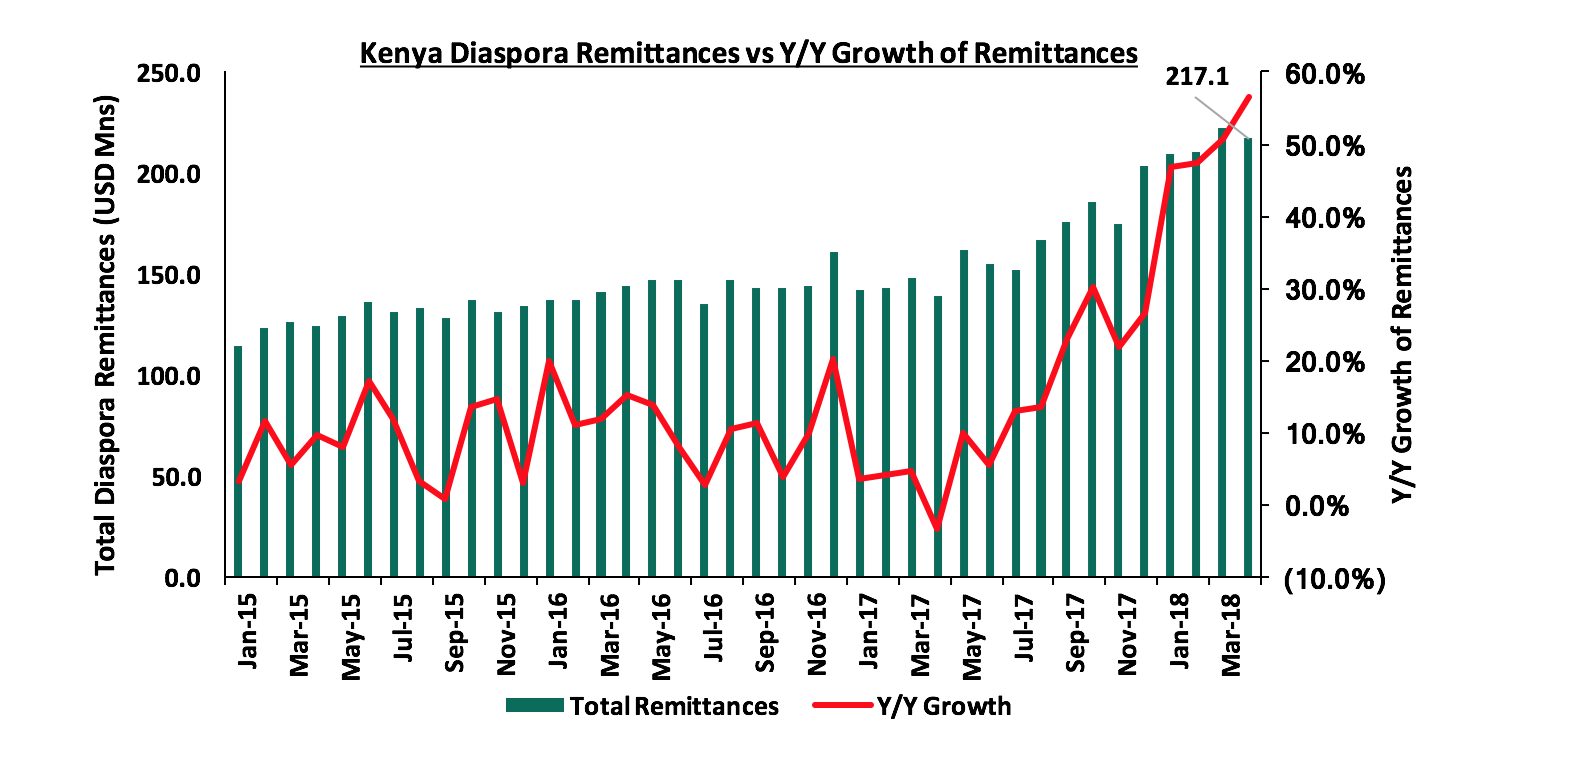
- Improving diaspora remittances, which increased by 56.6% to USD 217.1 mn in April 2018 from USD 138.6 mn in April 2017 with the bulk contribution coming from North America at USD 114.0 attributed to (a) recovery of the global economy, (b) increased uptake of financial products by the diaspora due to financial services firms, particularly banks, targeting the diaspora, and (c) new partnerships between international money remittance providers and local commercial banks making the process more convenient, and,
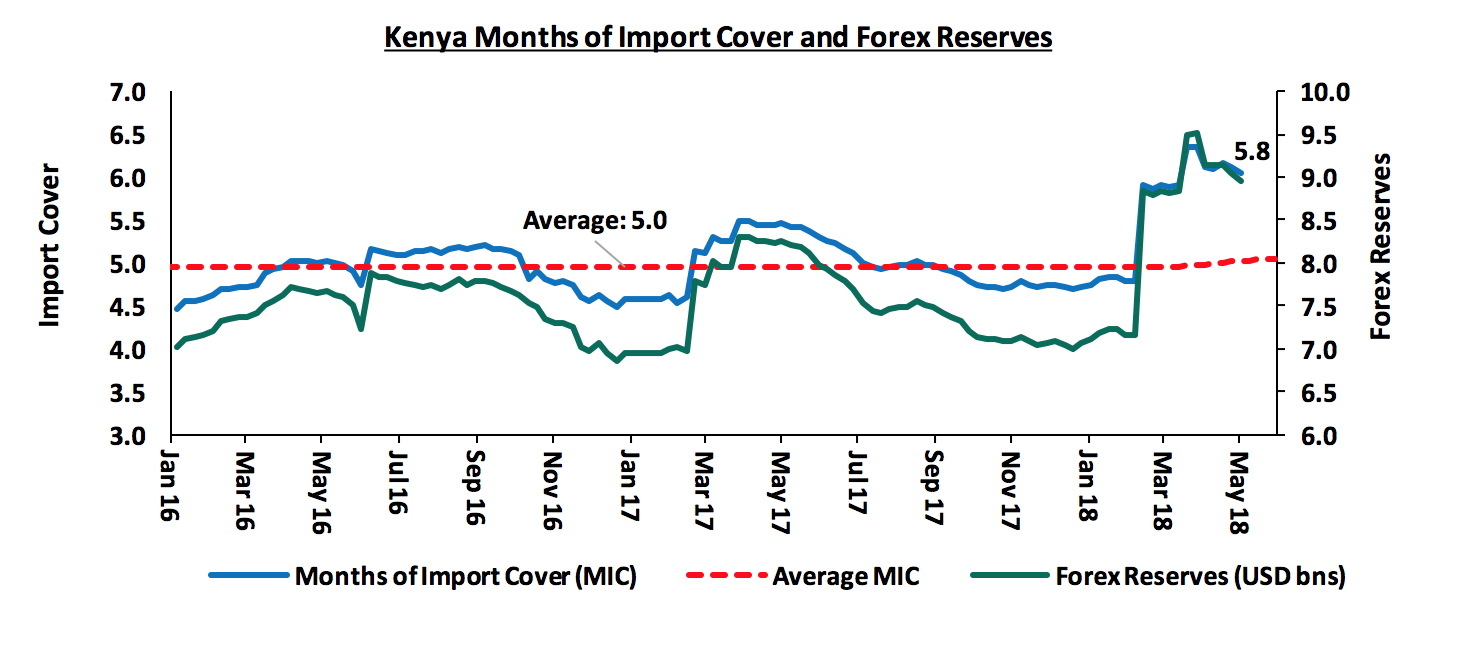
- High forex reserves, currently at USD 8.7 bn (equivalent to 5.8 months of import cover) and the USD 1.5 bn stand-by credit and precautionary facility by the IMF, still available until September 2018.
Inflation:
The average inflation rate for H1’2018 decreased to 4.2% from 9.8% in H1’2017, with June’s inflation having risen to 4.3% from 4.0% in May. Y/Y inflation in June 2018 declined mainly due to the base effect, however, m/m inflation declined by 0.9% due to a 2.2% decline in the Food and Non-Alcoholic Drinks’ Index driven by a decrease in prices of some food basket items such as onions, potatoes, maize and cabbages outweighing increases in others. Key to note is that inflation in June was not in line with our expectations of between 6.1% and 6.4%, which we expected to be driven by a base effect given declining inflation in June 2017, and increases in the transport index, the housing, water, electricity, gas & fuel index, and food inflation, as highlighted in our Cytonn Weekly #25/2018.
|
Major Inflation Changes in the Month of June 2018 |
|||
|
Broad Commodity Group |
Price change m/m (June-18/May-18) |
Price change y/y (June-18/June-17) |
Reason |
|
Food & Non-Alcoholic Beverages |
(2.2%) |
0.9% |
This was due to a decrease in prices of |
|
Transport Cost |
0.4% |
7.5% |
This was on account of an increase in the pump price of petrol and diesel |
|
Housing, Water, Electricity, Gas and other Fuels |
0.5% |
14.2% |
This was |
|
Overall Inflation |
(0.9%) |
4.3% |
The m/m decline was due to a 2.2% decline in food prices which has a CPI weight of 36.0% |
We expect relatively higher inflation during the second half of the year, mainly due to the base effect, as June was the inflexion point last year where inflation started declining. Going forward, we expect inflation to average 7.0% in 2018, which is within the government target range of 2.5% - 7.5%.
Monetary Policy:
The Monetary Policy Committee (MPC) met thrice in H1’2018, In the January 22nd meeting, they decided to retain the CBR at 10.0%, noting an increased optimism for growth prospects in the economy and inflation expectations anchored within the Government target range of 2.5% - 7.5%. In the March 19th meeting, the MPC decided to lower the CBR to 9.5% for the first time since July 2016, noting that there was room for monetary policy easing to further support economic activity as evidenced by (i) inflation, which had eased to 4.5% in February 2018 from 4.8% in January, and (ii) increased private sector optimism as per the MPC private sector market perception survey. They later retained the CBR at 9.5% in the May 28th meeting, citing that the impact of the 50-bps reduction in March had not yet been fully transmitted to the economy, despite there being room for monetary policy easing to further support economic activity.
Half-Year Highlights:
The Kenyan National Treasury released the fiscal year 2018/19 national budget in June 2018. Below are some of the key highlights
Amounts in Kshs trillions unless stated otherwise
|
Comparison of 2017/18 and 2018/19 Fiscal Year Budgets |
||||||||
|
|
2018/19 |
% change 2017/18 to 2018/19 |
2017/18 |
% change 2016/17 to 2017/18 |
2016/17 |
|||
|
Revenue |
1.9 |
14.5% |
1.7 |
9.6% |
1.5 |
|||
|
Recurrent expenditure |
1.5 |
7.7% |
1.4 |
13.3% |
1.2 |
|||
|
Development expenditure |
0.6 |
7.8% |
0.6 |
(27.3%) |
0.8 |
|||
|
County governments |
0.4 |
7.3% |
0.4 |
16.4% |
0.3 |
|||
|
Total expenditure |
2.5 |
7.7% |
2.3 |
(0.2%) |
2.3 |
|||
|
Deficit as % of GDP |
(5.7%) |
1.5% |
(7.2%) |
1.9% |
(9.1%) |
|||
|
Net foreign borrowing |
0.3 |
(11.2%) |
0.3 |
(30.3%) |
0.5 |
|||
|
Net domestic borrowing |
0.3 |
(8.6%) |
0.3 |
(14.7%) |
0.3 |
|||
|
Total borrowing |
0.6 |
(10.0%) |
0.6 |
(23.6%) |
0.8 |
|||
Key take-outs from the table:
- Total expenditure in the fiscal year 2018/2019 is set to increase by 7.3%, to Kshs 2.5 tn from Kshs 2.3 tn in the fiscal year 2017/18,
- Development expenditure is set to increase at a slightly faster rate than recurrent expenditure; with recurrent increasing by 7.7% to Kshs 1.5 tn from Kshs 1.4 tn, while development will increase by 7.8% to Kshs 625.0 bn from Kshs 579.6 bn in FY 2017/18,
- The budget deficit is projected to decline to 5.7% of GDP from an estimated 7.2% of GDP in the FY 2017/18; this in line with the International Monetary Fund’s (IMF’s) recommendation, in a bid to reduce Kenya’s public debt requirements,
- The total borrowing requirement to plug in the deficit is expected to decline to Kshs 558.9 bn from Kshs 620.8 bn, in a bid to reduce Kenya’s public debt burden which is estimated at 55.6% of GDP as at 2017 by the IMF, 5.6% above the East African Community (EAC) Monetary Union Protocol, the World Bank Country Policy and Institutional Assessment Index, and the IMF threshold of 50.0%, but well below the 74.0% mark considered a signal for debt unsustainability, and,
- Debt financing of the 2018/19 budget is split 51:49 between foreign and domestic borrowing, with the foreign and domestic debt being estimated at Kshs 287.0 billion (equivalent to 3.0% of GDP) and Kshs 271.9 billion (equivalent to 2.8% of GDP), respectively.
Key to note is that the Treasury proposed a repeal of the interest rate cap, subject to passing by the National Assembly, stating that the rate cap had not achieved its intended purpose; this is after failing to mention it in the Draft Financial Markets Conduct Bill, 2018 – see our Focus Note on the Conduct Bill here. The Kenyan budget has always been expansionary given that Kenya is a developing country, and this has led to a budget deficit usually bridged through debt, resulting in a rising debt-to-GDP ratio, estimated to have hit 55.6% by the end of 2017, 5.6% above the East African Community (EAC) Monetary Union Protocol threshold of 50.0%. To reduce this deficit, a few changes have been proposed to beef up revenue collection as follows: (i) an expected implementation of the 16.0% VAT on petroleum products from September 2018, (ii) the raising of excise duty fee on cellular money transfer services to 12.0% from 10.0%, previously, and (iii) introduction of a robin hood tax of 0.05% on any amount exceeding Kshs 500,000 transferred through financial institutions. As we continue to see significant changes to taxes, we are of the view that this should be accompanied by equally significant reduction efforts in recurrent expenditure, as only this joint effort will lead to a substantial decline in the budget deficit and in turn the public debt burden.
Macroeconomic Indicators Table:
The table below summarizes the various macroeconomic indicators, the expectation at the beginning of 2018, the actual H1’2018 experience, the impact of the same, and our expectations going forward:
|
Macro-Economic & Business Environment Outlook |
|||||
|
Macro-Economic Indicators |
2018 Expectations at Beginning of Year |
YTD 2018 Experience |
Going Forward |
Outlook - Beginning of Year |
Current Outlook |
|
Government Borrowing |
Government to come under pressure to borrow as it is well behind both domestic and foreign borrowing targets for FY 2017/18, and KRA is unlikely to meet its collection target due to expected suppressed corporate earnings in 2017 |
i. The government surpassed its domestic borrowing target for the 2017/18 fiscal year, having borrowed Kshs 390.2 bn against a target of 297.6 bn |
With the interest rate cap still in place, we don’t expect upward pressure on interest rates. Should the cap be repealed, we expect this to result in upward pressure on interest rates in the next borrowing cycle, as the government will no longer have an easy time collecting funds from the domestic market. However, with National Assembly against a complete repeal and The Draft Financial Markets Conduct Bill, 2018 having not addressed the issue of the interest rate cap, we still remain positive on government borrowing. |
Negative |
Positive |
|
Exchange Rate |
Currency projected to range between Kshs 102.0 and Kshs 107.0 against the USD in 2018. With the possible widening of the current account deficit being a possible point of concern, we expect the CBK to continue to support the Shilling in the short term through its sufficient reserves of USD 7.1 bn (equivalent to 4.7 months of import cover) |
The Shilling has appreciated by 2.1% against the USD YTD to 101.1. |
The government projects the current account deficit to narrow to 5.4% of GDP in 2018 due to lower food and SGR imports. |
Neutral |
Neutral |
|
Interest Rates |
Upward pressure expected on interest rates, especially in the first half of the year, as the government falls behind its borrowing targets for the fiscal year. However, with the Banking (Amendment) Act, 2015, the MPC might be unable to do much with the CBR which has remained at 10.0% throughout 2017 |
The MPC met on 28th May 2018 and maintained the CBR at 9.5 citing that the impact of the 50-bps reduction in March had not yet been fully transmitted to the economy, despite there being room for monetary policy easing to further support economic activity |
The interest rate environment is expected to remain relatively stable with the CBK not accepting |
Neutral |
Neutral |
|
Inflation |
Inflation expected to average 7.5% compared to 8.0% last year |
Inflation has averaged 4.2% in the first half of 2018. The year on year inflation rate for the month of June rose to 4.3% from 4.0% in May, driven by a 0.5% rise in Housing, Water, Electricity, Gas and Other Fuels’ Index attributed to an increase in prices of kerosene and charcoal which outweighed decreases in electricity charges |
Inflation in H2’2018 is expected to experience upward pressure, partly due to the base effect, and the expected rise in fuel and transport prices with the introduction of 16.0% VAT on petroleum products as from September 2018. |
Positive |
Positive |
|
GDP |
GDP growth projected to come in at between 5.3% - 5.5% |
Kenya’s economy grew by 4.9% in 2017, compared to 5.9% in 2016 in line with our expectation of between 4.7% - 5.2%. The consensus GDP growth projection for Kenya in 2018 is at 5.5% (an average taken from 15 research firms, global agencies and government organizations projections), which is an improvement from the GDP growth experienced in 2017 |
GDP growth is projected to come in between 5.4% - 5.6% in 2018 driven by recovery of growth in the agriculture sector, continued growth in the tourism, real estate and construction sectors, and growth in the manufacturing sector |
Positive |
Positive |
|
Investor Sentiment |
Investor sentiment expected to improve in 2018 given the now settling operating environment after conclusion of the 2017 elections |
The Kenya Eurobond was 7.0x oversubscribed partly showing the appetite for Kenyan securities by the foreign community, and investor confidence in Kenya’s stable and relatively diversified economy |
Given (i) the now settled operating environment following the elections in 2017, (ii) the expectation that long term investors will enter the market seeking to take advantage of the valuations which are still historically low, and (iii) expectations of a relatively stable shilling, we still expect investor sentiment to improve in 2018 |
Positive |
Positive |
|
Security |
Security expected to be maintained in 2018, especially given that the elections were concluded and the USA lifted its travel warning for Kenya, placing it in the 2nd highest tier of its new 4-level advisory program, indicating positive sentiments on security from the international community |
The political climate in the country has eased, compared to Q3’2017 with security maintained and business picking up. Kenya now has direct flights to and from the USA, a possible signal of improving security in the country |
We expect security to be maintained in 2018, especially given that the elections are now concluded, the government has settled into office, and the country's two principals are working together towards growing the economy after the recent hand shake |
Positive |
Positive |
Of the 7 indicators we track, 5 are positive and 2 are neutral, with government borrowing being the only indicator whose outlook has changed, to positive from negative. This is a positive change from the last half of 2017 where we had 4 positives, 1 negative and 3 neutrals. From this, we maintain our positive outlook on the 2018 macroeconomic environment.
T-Bills & T-Bonds Primary Auction:
During the first half of 2018, T-bills auctions recorded an oversubscription, with the average subscription rate coming in at 142.6% compared to 263.2% in H1’2017. Overall average subscription rates for the 91, 182, and 364-day papers in H1’2018 came in at 105.6%, 122.3% and 177.7%, respectively, from 154.0%, 184.5% and 131.2%, in a similar period in 2017. Yields on T-bills declined by 40 bps, 90 bps and 70 bps in H1’2017, closing at 7.7%, 9.7%, and 10.5%, from 8.1%, 10.6%, and 11.2% for the 91, 182, and 364-day papers, respectively, at the end of 2017, mainly due to the Central Bank of Kenya’s (CBK’s) efforts to keep rates low by rejecting expensive bids in the auction market.
During the week, T-bills were oversubscribed at a subscription rate of 126.0%, down from 214.7% recorded the previous week. Yields on the 91- day and 364- day papers remained unchanged at 7.7% and 10.5%, respectively while yields on the 182-day paper declined to 9.6% from 9.7%, the previous week, as T-bill yields continue to decline. The acceptance rate declined to 88.5% from 98.8%, the previous week, with the government accepting Kshs 26.8 bn of the Kshs 30.2 bn worth of bids received.
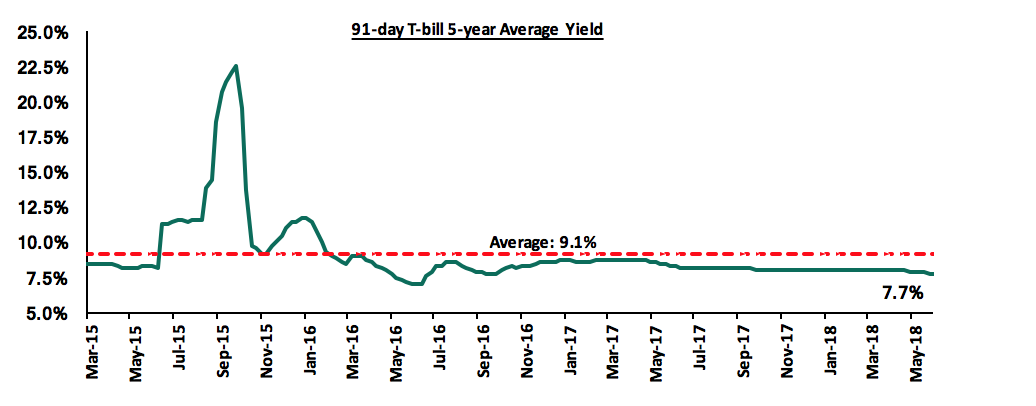
The yield on the 91-day T-bill is currently at 7.7%, below its 5-year average of 9.1%. The lower yield on the 91-day paper is mainly attributed to the low interest rate environment we have been experiencing, and we expect this to continue in the short-term because (i) the rate cap is still in place which will make it easier for the government to borrow from the domestic market, as institutions will continue channeling funds more actively towards government securities deemed less risky, since the pricing of loans to the private sector is based on the Central Bank Rate as opposed to their risk profiles, and (ii) the government domestic borrowing requirement for the 2018/19 financial year has been reduced by 8.6%, with revenues expected to increase by 14.5% from the previous fiscal year.
Should the rate cap be repealed as per the recommendation by the National Treasury as well as the International monetary fund (IMF), it would result in upward pressure on interest rates, as banks would resume pricing of loans to the private sector based on their risk profiles thus banks would revert to channeling funds to loans as opposed to government securities.
During H1’2018, the Kenyan Government issued 6 Treasury Bonds on a monthly basis, with details in the table below:
|
No. |
Date |
Bond Auctioned |
Effective Tenor to Maturity (Years) |
Coupon |
Amount to be Raised (Kshs bn) |
Actual Amount Raised (Kshs bn) |
Average Accepted Yield |
Average Subscription Rate |
Average Acceptance Rate |
|
1 |
16/01/18 |
IFB 1/2018/15 |
15.0 |
12.5% |
40.0 |
5.0 |
12.5% |
139.4% |
9.0% |
|
30/01/18 |
IFB 1/2018/15 (tap sale) |
35.0 |
36.2 |
12.5% |
103.5% |
99.9% |
|||
|
2 |
12/02/18 |
FXD/1/2010/15(re-open) |
7.1 |
10.3% |
40.0 |
4.4 |
12.7% |
60.4% |
54.7% |
|
FXD2/2013/15(re-open) |
10.2 |
12.0% |
8.8 |
12.9% |
|||||
|
27/02/18 |
FXD1/2010/15 (tap sale) |
7.1 |
10.3% |
27.0 |
0.3 |
12.7% |
14.1% |
100.0% |
|
|
FXD2/2013/15(tap sale) |
10.2 |
12.0% |
3.5 |
12.9% |
|||||
|
3 |
9/03/18 |
FXD 1/2018/5 |
5.0 |
12.3% |
40.0 |
23.1 |
12.3% |
128.5% |
61.4% |
|
FXD 1/2018/20 |
20.0 |
13.2% |
8.5 |
13.3% |
|||||
|
|
27/03/18 |
FXD 1/2018/5(tap sale) |
5.0 |
12.3% |
8.5 |
15.5 |
12.3% |
182.5% |
100.0% |
|
FXD 1/2018/20(tap sale) |
20.0 |
13.0% |
13.3% |
||||||
|
4 |
30/04/18 |
FXD1/2008/15 (Re-open) |
15.0 |
12.5% |
40.0 |
20.15 |
12.3% |
81.9% |
82.0% |
|
FXD1/2018/20 (Re-open) |
20.0 |
13.2% |
8.5 |
13.3% |
|||||
|
5 |
25/06/18 |
FXD1/2018/15 |
15.0 |
12.7% |
40.0 |
12.9 |
13.1% |
50.5% |
63.6% |
|
6 |
25/06/18 |
FXD1/2018/25 |
25.0 |
13.4% |
5.2 |
13.5% |
25.3% |
51.1% |
Performance in the Primary T-bond auctions in H1’2018 was varied between the various issues, with the subscription rate averaging 87.3% (an undersubscription). The average acceptance rate for the first half of the year came in at 65.2%, as the CBK continued to reject bids deemed expensive in order to maintain the rates at low levels, with tap sales still being used as a tool to plug in any deficits from primary auction bids.
Liquidity:
Liquidity levels remained stable and well distributed in the market as indicated by the 25.7% decline in the average volumes traded in the interbank market to Kshs 15.5 bn from Kshs 20.8 bn, recorded in H2’2017, and the subsequent decline in the interbank rate to 5.2% from 7.2% at the end of 2017. During the week, liquidity tightened with the average interbank rate rising to 6.2% from 4.1% recorded the previous week attributed to remittances of Value Added Tax (VAT) and quarterly corporate taxes through commercial banks. There was an increase in the average volumes traded in the interbank market by 41.1% to Kshs 19.9 bn, from Kshs 14.1 bn the previous week.
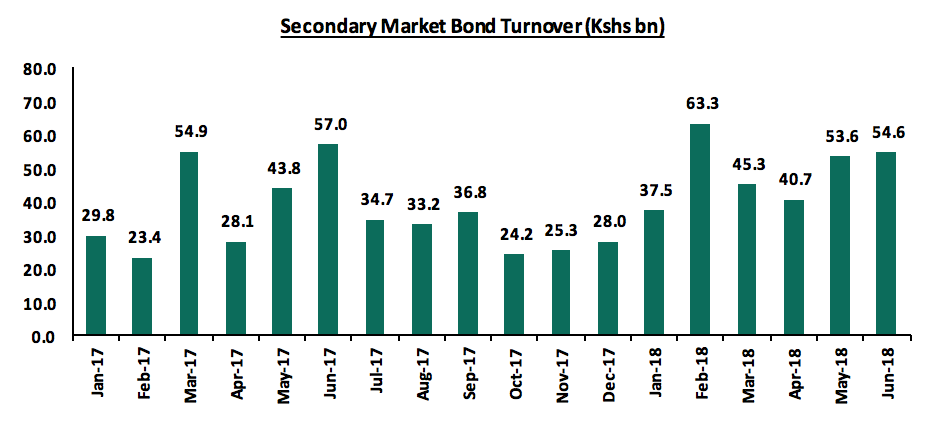
Secondary Bond Market Activity:
The NSE FTSE Bond Index gained 4.7% during H1’18 while the secondary bonds market recorded reduced activity, with turnover decreasing by 8.9% to Kshs 215.8 bn from 236.9 bn recorded in H1’2017.
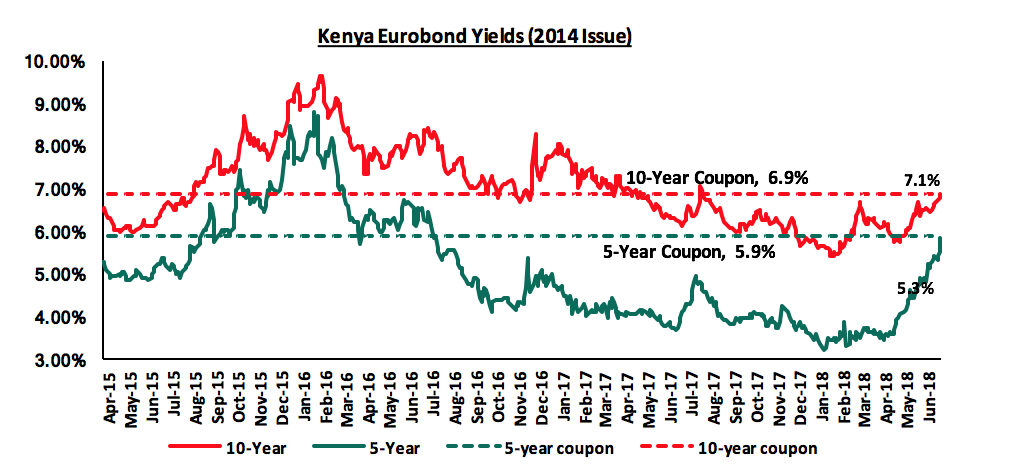
Kenya Eurobonds:
According to Bloomberg, the yields on the 5-year and 10-Year Eurobonds issued in 2014 have increased by 1.9% points and 1.5% points respectively in H1’2018. During the week the yields on the 5-year Eurobond remained unchanged at 5.3%, while the 10-year Eurobond increased by 20 bps to 7.1% from 6.9%, the previous week. Since the mid-January 2016 peak, yields on the Kenya Eurobonds have declined by 3.5% points and 2.6% points for the 5-year and 10-year Eurobonds, respectively, an indication of relatively stable macroeconomic conditions in the country.
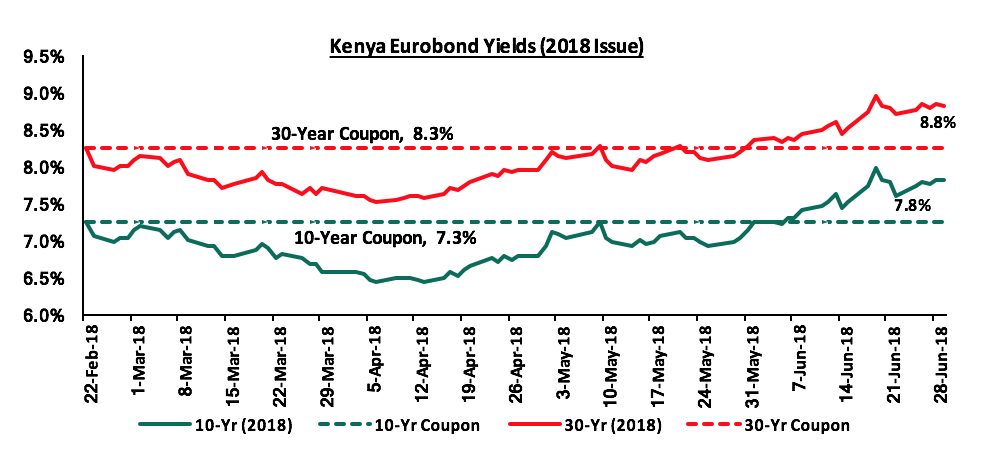
For the February 2018 Eurobond issue, since the issue date, yields on the 10-year and 30-year Eurobonds have both increased by 0.5% points. During the week, the yields on the 10-year Eurobond increased by 20 bps to 7.8% from 7.6% the previous week while the 30-year Eurobonds increased by 10 bps to 8.8% from 8.7% the previous week.
Rates in the fixed income market have remained stable, and had been on a declining trend towards the tail end of the fiscal year 2017/18, as the government rejected expensive bids given it had been under no pressure to borrow. The government is however likely to remain behind its borrowing target for the better part of the first half of the 2018/19 financial year as per historical data. The newly released 2018/19 budget gives a domestic borrowing target of Kshs 271.9 bn, 8.6% lower than the current fiscal year’s target, which may result in reduced pressure on domestic borrowing. However, the National Treasury has proposed to repeal the interest rate cap, which if repealed can result in upward pressure on interest rates, as banks would resume pricing of loans to the private sector based on their risk profiles. With the cap still in place, we maintain our expectation of stability in the interest rate environment. With the expectation of a relatively stable interest rate environment, our view is that investors should be biased towards medium to long-term fixed income instruments.
Market Performance:
After the bullish run experienced in the first quarter of 2018, where the Kenyan equities market gained 10.6%, the second quarter recorded a decline of 8.8%, bringing the first half gains for NASI, NSE 20 and NSE 25 to 1.8%, (11.5%) and 2.4%, respectively. The decline in market performance during Q2’2018 was as a result of declines in prices of large cap bank stocks such as Equity Group Holdings, KCB Group, Coop and Diamond Trust Bank, which declined by 14.4%, 11.9%, 10.7% and 9.1%, respectively. The declines were mainly in the banking sector stocks, mainly due to various banks closing their books, for dividends and counters beginning to trade ex-dividend. The result was that a majority of foreign investors held net-selling positions, exiting the market at expensive valuations, as the rally had brought the market above its historical P/E average. During the week, the market recorded mixed performance, as NASI and NSE 25 gained by 0.9% and 0.7% while the NSE 20 declined by 0.4%. The marginal gains recorded could be attributed to gains in counters such as Bamburi Cement, EABL and Safaricom that gained by 4.5%, 2.8% and 1.7% respectively. Profit taking investors exited the market, with possible re-entry at cheaper valuations in the future.
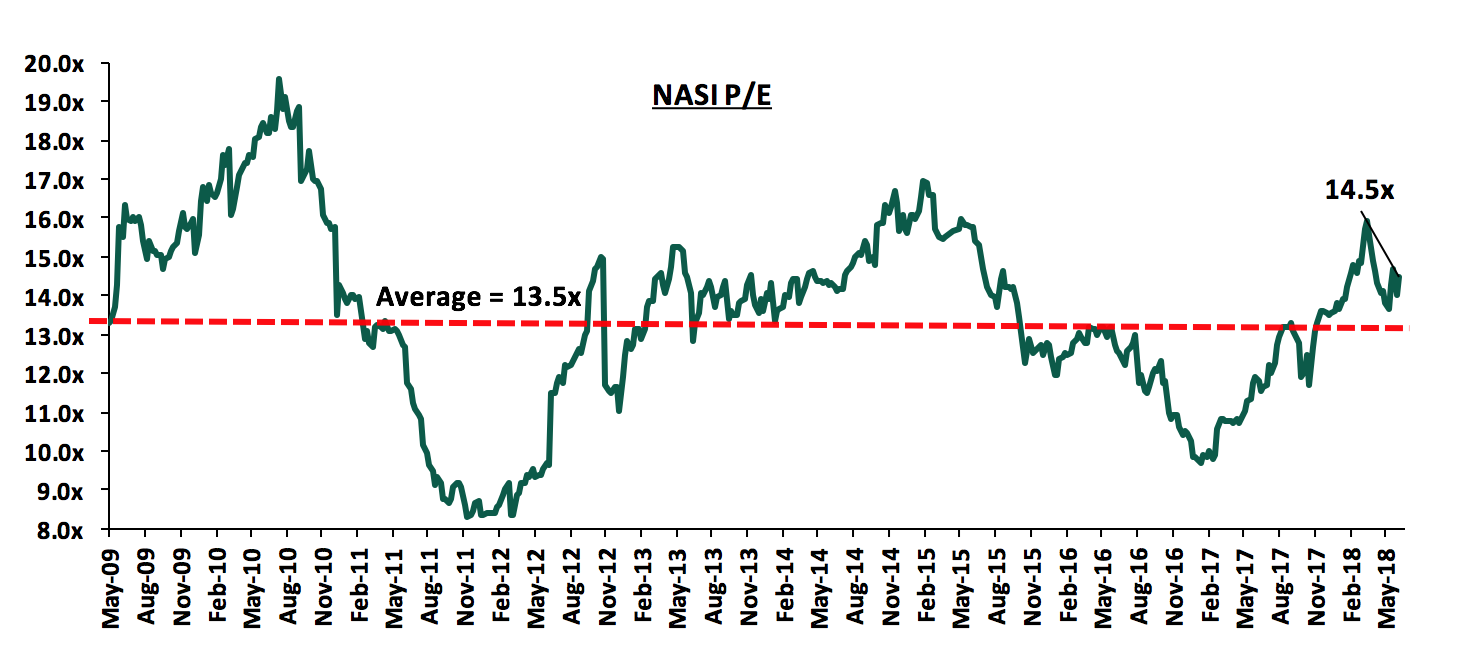
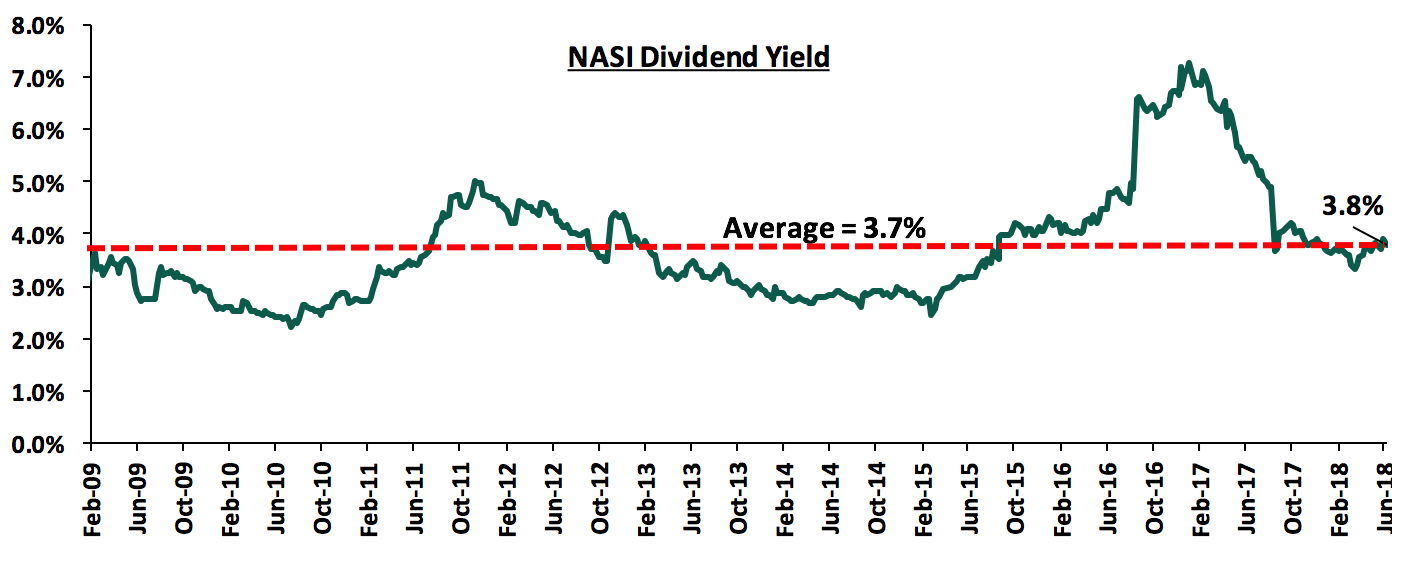
Equity turnover during H1’2018 rose by 34.4% to USD 1.1 bn from USD 795.7 mn in H1’2017. This can be attributed to improved investor sentiment, as a result of improved political stability after the election period, coupled with a bullish experienced in the banking sector, fueled by speculation of a repeal of the interest rate cap and investors taking positions on counters that declared profits for dividend income. The market is currently trading at a price to earnings ratio of 14.5x compared to 11.8x at the end of H1’2017. The current valuation is at 7.4% above the historical average of 13.5x. The current dividend yield of 3.8% is less than 5.5% recorded at the end of H1’2017, and is slightly above the historical average of 3.7%. The current P/E valuation of 14.5x is 49.5% above the most recent trough valuation of 9.7x experienced in the first week of February 2017, and 74.7% above the previous trough valuation of 8.3x experienced in December 2011. The charts below indicate the historical P/E and dividend yields of the market:
During the first half of 2018, banks released their FY’2017 and Q1’2018 results, recording declining performance in FY’2017 as core EPS declined by 1.0% but recovering in Q1’2018 to record a 14.4% growth in core EPS. The growth in core EPS could largely be attributed to an 8.1% growth in Net Interest Income in Q1’2018 compared to a 3.8% decline in FY’2017, as banks adapted to operating under the interest rate cap regime, with increased focus in Non-Funded Income (NFI) as shown by the increase in NFI to total income proportion to 37.1% from 33.6% in FY’2017.
Listed Banks Q1’2018 results:
Kenyan listed banks released their Q1'2018 results, recording a 14.4% increase in core EPS compared to a decline of 8.6% in Q1’2017. The performance for Kenyan listed banks in Q1’2018 are as summarized below:
|
Bank |
Core EPS Growth |
Interest Income Growth |
Interest Expense Growth |
Cost of Funds |
Net Interest Income Growth |
NIM |
NFI Growth |
NFI to Total Operating Income |
Growth in Total Fees & Commissions |
Deposit Growth |
Loan Growth |
Growth in Govt. Securities |
IFRS 9 Capital Ratios Effect |
|
National Bank |
348.0% |
(14.2%) |
(11.7%) |
3.3% |
(15.8%) |
7.1% |
(12.3%) |
31.0% |
91.3% |
(6.3%) |
(12.0%) |
(9.8%) |
(0.6%) |
|
Stanbic |
79.0% |
17.7% |
17.4% |
3.3% |
17.9% |
7.0% |
55.4% |
49.0% |
73.7% |
13.2% |
11.4% |
83.5% |
(0.6%) |
|
Equity Group |
21.7% |
10.5% |
10.5% |
2.7% |
10.5% |
8.4% |
6.3% |
49.0% |
7.2% |
10.0% |
3.5% |
45.5% |
(0.5%) |
|
KCB Group |
14.0% |
10.9% |
13.0% |
3.1% |
10.0% |
8.2% |
(1.1%) |
32.8% |
(2.3%) |
8.7% |
5.8% |
(10.7%) |
(0.8%) |
|
Barclays Bank |
7.7% |
8.1% |
6.8% |
2.9% |
8.5% |
9.6% |
5.0% |
29.2% |
(6.7%) |
8.4% |
(1.9%) |
35.3% |
1.00% |
|
Co-op Bank |
6.8% |
9.1% |
5.0% |
4.0% |
10.8% |
8.6% |
3.8% |
32.0% |
9.6% |
5.7% |
2.8% |
21.3% |
(0.9%) |
|
DTB |
3.0% |
4.9% |
4.2% |
5.1% |
5.4% |
6.4% |
4.4% |
22.0% |
8.3% |
11.6% |
3.0% |
16.0% |
(1.6%) |
|
NIC Group |
2.2% |
8.2% |
35.9% |
5.2% |
(8.3%) |
6.3% |
5.5% |
29.6% |
1.8% |
22.1% |
(0.4%) |
81.2% |
(0.8%) |
|
I&M holdings |
1.8% |
2.5% |
10.9% |
4.8% |
(2.7%) |
7.4% |
43.9% |
37.0% |
45.9% |
3.5% |
7.6% |
(1.7%) |
(0.2%) |
|
StanChart |
(12.5%) |
7.7% |
16.4% |
3.6% |
4.5% |
7.8% |
6.5% |
32.0% |
27.0% |
13.2% |
(2.6%) |
12.4% |
(0.5%) |
|
HF Group |
(58.4%) |
(12.8%) |
(13.0%) |
7.2% |
(12.6%) |
5.1% |
64.2% |
28.9% |
(62.7%) |
(6.1%) |
(12.5%) |
(41.4%) |
0.0% |
|
Weighted Average Q1'2018 |
14.4% |
9.3% |
11.4% |
3.4% |
8.1% |
8.1% |
9.5% |
37.1% |
12.2% |
9.4% |
3.2% |
25.0% |
(0.3%) |
|
Weighted Average Q1'2017 |
(8.6%) |
(11.6%) |
(10.3%) |
3.0% |
(10.1%) |
9.2% |
18.6% |
37.8% |
8.7% |
11.7% |
7.1% |
43.1% |
- |
Key takeaways from the table above include:
- The listed banks recorded a 14.4% increase in core EPS, compared to a decline of 8.6% decline in Q1’2017. Only Standard Chartered Bank and Housing Finance Group recorded declines in core EPS, registering declines of 12.5% and 58.4%, respectively. HF Group recorded the biggest decline at 58.4%, on the back of a 12.6% decline in Net Interest Income (NII);
- Average deposit growth came in at 9.4%. Thus, the interest expense paid on deposits recorded a higher growth of 11.4% on average, indicating that banks are growing deposits by opening more interest earning accounts. This is also reflected by the increase in the cost of funds to 3.4% from 3.0% in Q1’2017;
- Average loan growth was recorded at 3.2%, with interest income increasing by 9.3%, as banks adapted to the interest rate Cap regime, with increased allocations in government securities;
- Investment in government securities has grown by 25.0%, outpacing loan growth of 3.2%, showing increased lending to the government by banks as they avoid the risky borrowers;
- The average Net Interest Margin in the banking sector currently stands at 8.1%, a decline from the 9.2% recorded in Q1’2017;
- Non-funded income has grown by 9.5%, which included a Fee and Commissions growth of 12.2%. This shows that banks are charging more fee income to improve their income on loans above the rate cap maximum; and;
- The sector saw a decline in total capital relative to risky assets by 0.3% due to implementation of IFRS 9, indicating the implementation of the standard affected the sector’s capital position though not as much as expected. We expect this reduction to increase in the future.
Half-Year Highlights:
Consolidation in the banking sector picked up at the start of 2017, but slowed as the year progressed. In 2018, only one acquisition deal took place; SBM Bank Kenya Ltd completed the acquisition of certain assets and liabilities of Chase Bank Limited, which was under receivership. Following the agreement between the Central Bank of Kenya (CBK), Kenya Deposit Insurance Corporation (KDIC) and SBM Bank Kenya, 75.0% of the value of all moratorium deposits at Chase Bank will be transferred to SBM Bank Kenya. The remaining 25.0% will remain with Chase Bank Limited. This is a major milestone as this is the first successful instance, in the history of Kenya, of a bank being successfully brought out of receivership. Chase Bank was taken under receivership of the CBK in 2016, with customer deposits in excess of Kshs 100.0 bn. The acquisition will see SBM take control of the 62 Chase Bank branches, significantly increasing the bank’s foothold in the country. SBM Bank has injected Kshs 2.6 bn in Chase Bank, and is planning to inject a further Kshs 6.0 bn after the acquisition to revive the collapsed bank. However, the transaction value is yet to be disclosed. In addition to this, the bank is expected to absorb all the 1,300 former employees of Chase Bank Limited. We shall update with the transaction multiples once the deal is fully finalized and transaction values disclosed. We are however surprised that some of the smaller banks have managed to stay independent this long, as we would have expected weaker banks (that don’t serve a niche, don’t have a clear deposit gathering strategy and have low capital positions), being forced to merge or be acquired as they succumb to sustained effects of the interest rate cap and the implementation of IFRS 9, which affects their profitability and capital levels. Going forward we still expect more consolidations in the industry.
Below is the summary of the transaction metrics of some of the acquisitions that have taken place in the banking sector within the last 5 years:
|
Acquirer |
Bank Acquired |
Book Value at Acquisition (Kshs bns) |
Transaction Stake |
Transaction Value (Kshs bns) |
P/Bv Multiple |
Date |
|
Diamond Trust Bank Kenya |
Habib Bank Limited Kenya |
2.38 |
100.0% |
1.82 |
0.8x |
Mar-17 |
|
SBM Holdings |
Fidelity Commercial Bank |
1.75 |
100.0% |
2.75 |
1.6x |
Nov-16 |
|
M Bank |
Oriental Commercial Bank |
1.80 |
51.0% |
1.30 |
1.4x |
Jun-16 |
|
I&M Holdings |
Giro Commercial Bank |
2.95 |
100.0% |
5.00 |
1.7x |
Jun-16 |
|
Mwalimu SACCO |
Equatorial Commercial Bank |
1.15 |
75.0% |
2.60 |
2.3x |
Mar-15 |
|
Centum |
K-Rep Bank |
2.08 |
66.0% |
2.50 |
1.8x |
Jul-14 |
|
GT Bank |
Fina Bank Group |
3.86 |
70.0% |
8.60 |
3.2x |
Nov-13 |
|
Average |
|
|
80.3% |
|
1.8x |
|
The National Treasury released the Draft Financial Markets Conduct Bill, 2018, which is supposed to mitigate the reduced lending that could be attributed to the Banking (Amendment) Act 2015. The Bill, will seek to assess the whole credit management in the economy. The bill seeks to:
- Ensure better conduct by banks and other lendersin terms of extending credit to retail financial customers. By categorically not defining lenders as banks, this, in our view, might be the introduction of licensing for credit companies that are not banks, and,
- Provide consumer protection, mainly for retail customers by ensuring their credit contracts are clear and well understood in terms of interest, fees, charges and costs on credit facilities, thereby removing the opacity that has been existent in loan prices.
However, as noted in our focus note The Draft Financial Markets Conduct Bill, 2018, the Bill only addresses consumer protection and fails to address the problem of access to credit for the private sector, mainly by SMEs. We are of the view that more still needs to be done to address the fact that banks will most likely still prefer to lend to the risk-free government as opposed to lending to a riskier retail customer at the current 13.5%, (4.0% points above the current CBR of 9.5%) as dictated by the Banking (Amendment) Act 2015. The Bill was formulated to pave way for the repeal of the Banking (Amendment) Act 2015, as a clause in the Finance Bill, presented to Parliament by the Cabinet Secretary for National Treasury Henry Rotich.
Equities Universe of Coverage:
Below is our Equities Universe of Coverage:
|
Bank |
Price as at 22/06/2018 **** |
Price as at 29/06/2018 **** |
w/w change |
YTD Change |
LTM Change |
Target Price * |
Dividend Yield |
Upside/Downside ** |
P/TBv Multiple |
||
|
GCB*** |
5.2 |
5.2 |
0.6% |
2.6% |
(0.4%) |
7.7 |
7.4% |
57.3% |
1.2x |
||
|
NIC Bank*** |
36.5 |
35.5 |
(2.7%) |
5.2% |
21.1% |
54.1 |
2.7% |
51.0% |
0.9x |
||
|
I&M Holdings |
116.0 |
115.0 |
(0.9%) |
(9.4%) |
11.7% |
169.5 |
3.0% |
49.1% |
1.2x |
||
|
Diamond Trust Bank |
196.0 |
199.0 |
1.5% |
3.6% |
24.4% |
280.1 |
1.3% |
44.2% |
1.1x |
||
|
Zenith Bank |
25.9 |
25.0 |
(3.5%) |
(2.5%) |
19.6% |
33.3 |
10.4% |
39.1% |
1.1x |
||
|
Union Bank Plc |
5.9 |
6.1 |
3.4% |
(21.8%) |
17.1% |
8.2 |
0.0% |
38.1% |
0.6x |
||
|
KCB Group*** |
47.8 |
46.3 |
(3.1%) |
8.2% |
23.3% |
60.9 |
6.3% |
33.8% |
1.5x |
||
|
CRDB |
160.0 |
160.0 |
0.0% |
0.0% |
(8.6%) |
207.7 |
0.0% |
29.8% |
0.5x |
||
|
Ecobank |
8.5 |
8.5 |
(0.6%) |
11.2% |
32.8% |
10.7 |
0.0% |
26.2% |
2.4x |
||
|
Barclays |
11.9 |
11.8 |
(1.3%) |
22.4% |
18.7% |
14.0 |
8.4% |
26.1% |
1.5x |
||
|
HF Group*** |
8.5 |
8.4 |
(0.6%) |
(19.2%) |
(12.9%) |
10.2 |
3.8% |
24.5% |
0.3x |
||
|
Equity Group |
48.5 |
46.3 |
(4.6%) |
16.4% |
21.7% |
55.5 |
4.1% |
18.6% |
2.5x |
||
|
Co-operative Bank |
17.5 |
17.5 |
0.0% |
9.4% |
26.1% |
19.7 |
4.6% |
17.1% |
1.5x |
||
|
Stanbic Bank Uganda |
32.0 |
32.0 |
0.0% |
17.4% |
18.5% |
36.3 |
3.7% |
17.0% |
2.0x |
||
|
UBA Bank |
10.6 |
10.5 |
(0.9%) |
1.9% |
10.9% |
10.7 |
14.2% |
15.1% |
0.7x |
||
|
CAL Bank |
1.2 |
1.2 |
0.0% |
13.0% |
64.0% |
1.4 |
0.0% |
14.8% |
1.0x |
||
|
Bank of Kigali |
290.0 |
286.0 |
(1.4%) |
(4.7%) |
16.7% |
299.9 |
4.8% |
8.2% |
1.6x |
||
|
Stanbic Holdings |
92.0 |
92.0 |
0.0% |
13.6% |
28.7% |
85.9 |
5.7% |
(0.9%) |
1.1x |
||
|
Standard Chartered |
201.0 |
198.0 |
(1.5%) |
(4.8%) |
(4.3%) |
184.3 |
6.2% |
(2.1%) |
1.6x |
||
|
Guaranty Trust Bank |
40.7 |
40.5 |
(0.5%) |
(0.6%) |
13.4% |
37.2 |
5.9% |
(2.7%) |
2.3x |
||
|
SBM Holdings |
7.2 |
7.3 |
1.4% |
(2.9%) |
0.3% |
6.6 |
4.2% |
(4.5%) |
1.0x |
||
|
Access Bank |
10.4 |
10.4 |
(0.5%) |
(1.0%) |
8.4% |
9.5 |
3.8% |
(4.8%) |
0.7x |
||
|
Bank of Baroda |
155.0 |
150.0 |
(3.2%) |
32.7% |
38.9% |
130.6 |
1.6% |
(14.1%) |
1.3x |
||
|
Stanbic IBTC Holdings |
48.8 |
52.0 |
6.7% |
25.3% |
60.3% |
37.0 |
1.2% |
(22.9%) |
2.5x |
||
|
Standard Chartered |
27.0 |
27.0 |
0.0% |
6.9% |
59.5% |
19.5 |
0.0% |
(27.9%) |
3.4x |
||
|
FBN Holdings |
10.7 |
10.6 |
(0.5%) |
20.5% |
71.0% |
6.6 |
2.3% |
(35.4%) |
0.6x |
||
|
Ecobank Transnational |
20.2 |
20.0 |
(1.0%) |
17.6% |
50.3% |
9.3 |
0.0% |
(54.1%) |
0.7x |
||
|
National Bank |
6.6 |
6.3 |
(5.3%) |
(33.2%) |
(32.1%) |
2.8 |
0.0% |
(57.6%) |
0.4x |
||
|
|
*Target Price as per Cytonn Analyst estimates |
||||||||||
|
|
**Upside / (Downside) is adjusted for Dividend Yield |
||||||||||
|
|
***Banks in which Cytonn and/or its affiliates holds a stake. For full disclosure, Cytonn and/or its affiliates holds a significant stake in NIC Bank, ranking as the 5th largest shareholder ****Share prices in respective country local currency |
||||||||||
We are “NEUTRAL” on equities for investors with a short-term investment horizon since the market has rallied and brought the market P/E slightly above its’ historical average. However, pockets of value exist, with a number of undervalued sectors like Financial Services, which provide an attractive entry point for long-term investors, and with expectations of higher corporate earnings this year, we are “POSITIVE” for investors with a long-term investment horizon
Financial Services Sector:
The financial services sector remained attractive in H1’2018 for both local and international investors. Some of the key deals include;
- Old Mutual, a UK based international financial services group providing investment and savings, insurance, asset management and retirement solutions, increased its stake in UAP Holdings in a deal to convert a Kshs 2.7 bn loan into equity through its subsidiary Old Mutual Holdings Kenya. The transaction was valued at a P/B multiple of 1.8x, a 15% discount from the average insurance sector transaction P/B multiple of 2.1x over the last seven years, hence a valuation discount. For more information, see our Cytonn Weekly #25/2018
- European financial services company Allianz Group agreed to acquire 8.0% in African reinsurer Africa Re. The total cash consideration payable at closing amounted to Eur. 69.0 mn (Kshs 8.14 bn). An 8.0 % stake at Eur. 69.0 mn equalled to 228,112 shares and implied a market valuation of Eur. 862.5 mn (Kshs 101.7 bn); based on their last published financial statements (December 2016). The book value was Eur. 774.8 mn (Kshs 91.4 bn), implying a P/B valuation of 1.2x. For more information, see our Cytonn Weekly #23/2018
- AfricInvest, a private equity and venture capital firm based in Tunisia with a focus on agribusiness, financial services, healthcare, education and commercial sectors, completed a transaction to buy a 14.3% stake in Britam, a diversified financial services group that is listed on the Nairobi Securities Exchange, for Kshs 5.7 bn. The transaction involved the creation of 360.8 mn new shares, which AfricInvest bought at a price of Kshs 15.9 per share. Britam will use the capital to accelerate property development, inject fresh investments into its subsidiaries, and to revamp its technology to enable it deliver its products via digital channels like mobile phones, with an eye on Micro-insurance. The acquisition was carried out at a P/B multiple of 1.4x which is a discount from the average insurance sector transaction P/B multiple of 2.1x over the last seven years, hence a relatively cheaper transaction valuation. For more information, see our Cytonn Weekly #21/2018. Following the same, Swiss Re, a reinsurance company based in Zurich Switzerland, also acquired a 13.8% stake in Britam for Kshs 4.8 bn. The transaction involved the acquisition of 348.5 mn shares of Plum LLP at a price of Kshs 13.8 per share. The acquisition was carried out at a P/B multiple of 1.3x, again, a 38.0% discount from the average insurance sector transaction P/B multiple of 2.1x over the last seven years, hence a relatively cheaper transaction valuation. For more information, see our Cytonn Weekly #24/2018.
- Centum Investments, an investment company based in Kenya, injected Kshs 1.1 bn into its banking subsidiary Sidian Bank, through a rights issue meant to fund the lender’s growth initiatives and to drive its strategic goal of becoming a Tier 2 bank by 2022. With a 72.9% stake in Sidian Bank, the additional sum meant that Centum had defended its entire stake in the rights issue. The additional capital will support the bank’s growth plans, including further investments in its trade finance business, which saw a growth in portfolio from Kshs 896.0 mn in 2016 to Kshs 6.6 bn by close of 2017. For more information, see our Cytonn Q1' 2018 Markets Review,
- Sanlam Kenya, a financial services company listed on the Nairobi Securities Exchange, which mainly deals in insurance, investments and retirements schemes, invested an additional Kshs 121.7 mn in equity in Sanlam General, formally Gateway Insurance. Sanlam Kenya, then Pan Africa Insurance Holdings Limited (Pan Africa), first acquired 31,948,950 ordinary shares of Gateway Insurance, a 51.0% stake, in March 2015 for Kshs 561.0 mn. It also subscribed to additional shares in Gateway amounting to Kshs 139.7 mn to increase its shareholding to 56.5% in the same year. After the transaction, it renamed Gateway Insurance to Sanlam General. The first and second transaction valued the company at Kshs 1.1 bn and Kshs 1.2 bn, respectively. The acquisitions were carried out at a P/B multiple of 1.1x compared to the market average of 2.1x . The acquisition was a strategic move for the company to re-enter the general insurance market and to enable them to offer their clients with more comprehensive solutions such as personal and institutional insurance products. For more information, see our Cytonn Weekly #19/2018,
- Digital Financial Services (DFS) Lab, a Fintech accelerator supported by The Bill and Melinda Gates Foundation, announced an investment of USD 200,000 (Kshs 20.0 mn) in four African start-ups, two of which are Kenyan: (i) Cherehani Africa, which relies on mobile-based tech to provide credit and distribute personalized financial literacy content to women and adolescent girls who own micro-enterprises, and (ii) another unnamed start-up that focuses on digital lending. DFS Lab identifies promising entrepreneurs and invests in for-profit companies that focus on consumers in Sub-Saharan Africa and Asia. Products from the four companies have been found to simplify processes for accessing financial information and cash via mobile phone. Cherehani Africa provides access to finances to women and adolescent girls with basic level education, aged 17-45 years. For more information, see our Cytonn Weekly #17/2018,
- Fonds Européen de Financement Solidaire (Fefisol), a Luxembourg-based private equity (PE) firm, invested Kshs 100.0 mn in Kenya’s Musoni Microfinance Limited for an undisclosed stake. The investment by Fefisol will be used to grow their loan book, which stood at Kshs 1.2 bn as at January 2018. The funds will support Musoni’s objective of achieving competitive low-cost lending in the country at a time where bank funding continues to be relatively expensive. For more information, see our Cytonn Weekly #7/2018,
- Kuramo Capital, a New-York based private equity firm completed a transaction to acquire a minority stake in Kenyan investment bank Sterling Capital for an undisclosed amount. The acquisition came after the reinstatement of Sterling’s investment banking license in October 2017, after it was downgraded to stockbroker level in 2011, for failing to meet CMA’s revised minimum capital limit that required investment banks to raise their minimum capital to Kshs 250.0 mn from Kshs 30.0 mn, while stockbrokers were required to increase their capital to Kshs 50.0 mn, up from Kshs 5.0 mn. For more information, see our Cytonn Weekly #4/2018,
- Atlas Mara Limited, a financial services holding company, increased its strategic stake in Union Bank Nigeria (UBN) through a Naira 26.3 bn (USD 75.0 mn) investment in UBN’s rights issue. UBN completed a Naira 49.7 bn (USD 138.2 mn) rights offering on the Nigerian Stock Exchange at a price of Naira 4.1 per share and registered a 120.0% subscription rate. Atlas Mara’s investment of USD 75.0 mn translated to around 6.6 bn shares. Atlas Mara previously owned 44.5% of UBN’s issued share capital at the time, translating to 7.6 bn shares. With the acquisition, Atlas obtained a total shareholding of 14.1 bn shares from the 29.1 bn shares issued, translating to a 48.6% ownership in UBN. The transaction was valued at a P/B of 0.3x, an 84.2% discount to the average P/B multiple of 1.9x for select listed Banks in Nigeria. For more information, see our Cytonn Weekly #3/2018,
The insurance sector recorded significant activity during H1’2018, the same being witnessed in recent years. This is indicated in the table below that highlights the transaction multiples in Kenya’s insurance sector over the last seven years;
|
Insurance Sector Transaction Multiples over the Last Seven Years |
|||||||
|
No. |
Acquirer |
Insurance Acquired |
Book Value (bn Kshs) |
Transaction Stake |
Transaction Value (bn Kshs) |
P/B |
Date |
|
1. |
Africa Development Corporation |
Resolution Health East Africa |
N/A |
25.1% |
0.2 |
N/A |
Dec-10 |
|
2. |
Leapfrog Investments |
Apollo Investments |
0.3 |
26.9% |
1.1 |
15.6x |
Dec-11 |
|
3. |
Saham Finances |
Mercantile Insurance |
0.5 |
66.0% |
Undisclosed |
N/A |
Jan-13 |
|
4. |
Swedfund |
AAR |
0.4 |
20.0% |
0.4 |
5.4x |
May-13 |
|
5. |
BAAM |
Continental Re Kenya |
0.7 |
30.0% |
0.3 |
1.4x |
Apr-14 |
|
6. |
Union Insurance of Mauritius |
Phoenix of East Africa |
1.8 |
66.0% |
2.0 |
1.6x |
May-14 |
|
7. |
UK Prudential |
Shield Assurance |
0.1 |
100.0% |
1.5 |
10.2x |
Sep-14 |
|
8. |
Swiss Re |
Apollo Investments |
0.6 |
26.9% |
Undisclosed |
N/A |
Oct-14 |
|
9. |
Britam |
Real Insurance Company |
0.7 |
99.0% |
1.4 |
2.1x |
Nov-14 |
|
10. |
Leapfrog Investments |
Resolution Insurance |
0.2 |
61.2% |
1.6 |
11.7x |
Nov-14 |
|
11. |
Old Mutual Plc |
UAP Holdings |
9.6 |
60.7% |
11.1 |
1.9x* |
Jan-15 |
|
12. |
MMI Holdings |
Cannon Assurance |
1.7 |
75.0% |
2.4 |
1.9x |
Jan-15 |
|
13. |
Pan Africa Insurance Holdings |
Gateway Insurance Company Ltd |
1.0 |
51.0% |
0.6 |
1.1x |
Mar-15 |
|
14. |
Barclays Africa |
First Assurance |
2.0 |
63.3% |
2.9 |
2.2x |
Jun-15 |
|
15. |
IFC |
Britam |
22.5 |
10.4% |
3.6 |
1.5x |
Mar-17 |
|
16. |
AfricInvest III |
Britam |
28.5 |
14.3% |
5.7 |
1.4x |
Sep-17 |
|
17. |
Swiss Re Asset Management |
Britam |
22.6 |
13.8% |
4.8 |
1.3x |
Jun-18 |
|
18 |
Old Mutual Plc |
UAP Holdings |
19.0 |
7.30% |
2.7 |
1.8x** |
Jun-18 |
|
|
Harmonic Mean |
|
|
29.9% |
|
2.1x |
|
|
|
Median |
|
|
55.9% |
|
1.9x |
|
|
*-Proforma transaction multiple after goodwill impairment write-off **-Excluded in the harmonic mean and median |
|||||||
We expect that Investors will continue to show interest in the financial services sector, motivated by attractive valuations, growth of financial inclusion and regulation that requires institutions to increase their capital requirements across the sector.
Fintech Sector
- Cellulant, a leading Pan-African digital payments service provider that prompts, collects, settles and reconciles payments in real time, raised Kshs 4.8 bn (USD 47.5 mn) in Series C funding from a consortium of investors led by: Texas Pacific Group (TPG), through The Rise Fund, the impact fund run by the private equity group, Endeavour Catalyst, and Satya Capital, the private equity firm owned by Sudanese-British billionaire Mo Ibrahim. The USD 47.5 million represented the largest deal of its kind dedicated solely to Africa’s FinTech and payments space. However, the stake acquired was not disclosed. Cellulant offers digital payments platforms and mobile banking services aimed at those who do not have a bank account. For more information, see our Cytonn Weekly #20/2018.
- Technology investment fund Orange Digital Ventures, the strategic Corporate Venture Fund of the Orange Group invested Kshs 260.0 mn (USD 2.6 mn) in Kenya’s mobile tech company Africa’s Talking alongside California-based venture capital firm Social Capital. Founded in 2010, Nairobi based Africa’s Talking provides a platform for businesses and developers who want to integrate mobile communication and payment services to their applications. The new funding brought the total investment received by Africa’s Talking to Kshs 860.0 mn (USD 8.6 mn), in addition to Kshs 600 mn (USD 6.0 mn) by International Finance Corporation (IFC) announced in 25th April 2018. The new capital injection is set to accelerate expansion strategies and scale up its operations on the continent. Beyond Kenya, the company has started working in Uganda, Rwanda, Tanzania, Malawi, Nigeria and Ethiopia. For more information, see our Cytonn Weekly #17/2018,
- Branch International, a mobile-based Microfinance Institution (MFI) operating in Kenya, Tanzania, Nigeria and California, raised USD 70.0 mn in Series B funding, which combined USD 50.0 mn in debt and USD 20.0 mn in equity of an undisclosed stake. The funds will enable the mobile loan app company to expand its services beyond credit access, to savings and payments, and to start operations in India. The funding was led by California-based Trinity Ventures, a venture capital firm specializing in growth capital investments. The Series B investment brings Branch’s total funding to above USD 80.0 mn in the three-years since it was founded. Similar investments in the past include debt financing led by Nabo Capital in 2017 of Kshs 200.0 mn (USD 2.0 mn), a Series A equity funding round for Branch International, the company's first significant round of venture capital financing, of USD 9.6 mn led by Andreessen Horowitz, US-based venture capital firm in 2016, which was used for expansion into Nigeria, and an undisclosed seed capital from US-based Formation 8 and Khosla Ventures. For more information, see our Cytonn Weekly #15/2018,
- France-based Proparco, the private sector financing arm of the French Development Agency (Agence Française de Dévelopement), announced an equity investment of USD 3.0 mn in JUMO, an emerging market technology start-up that offers access to credit through their mobile application. JUMO currently operates in Africa (Tanzania, Kenya, Uganda, Zambia and Ghana) and had recently launched its first activities in Asia (Pakistan). In 2017 alone, the start-up handled 12.2 mn loan transactions to customers. For more information, see our Cytonn Weekly #14/2018,
Fintech lending and Microfinance institutions in general have been a major attraction for investors in Kenya and Sub-Saharan Africa. Lack of access to finance is a major issue for entrepreneurs and MSMEs across Africa. According to the IMF, there are 44.2 mn MSMEs in Sub-Saharan Africa with a potential demand for USD 404.0 bn in financing. The current volume of financing in Sub-Saharan Africa is estimated at USD 70.0 bn signifying a huge financing gap of USD 331.0 bn. Microfinance institutions aim to bridge this gap by offering convenient access to credit.
Hospitality Sector
- South-African based private equity fund Uqalo invested Kshs 404.0 mn (USD 4.0 mn) to acquire an undisclosed stake in Kenyan fast food chain Big Square. The investment is beneficial for both parties as it will (i) finance Big Squares expansion plan, as the outlet targets to expand Big Squares footprint from the current 9 branches to 30 branches over the next four-years, and (ii) expand Uqalo’s footprint and portfolio in Kenya. Uqalo has previously invested in Kenya’s Twiga Foods, where it owns a 5.0% stake in the business-to-business food supplier. For more information, see our Cytonn Weekly #10/2018.
The interest by investors in the hospitality sector in the country indicates a positive outlook in the performance of the sector, which is supported by (i) the growing middle class with increasing disposable income, and (ii) the continued growth of the sector in the country in the past years. The food and services sector produced a total of Kshs 16.2 bn in Gross Income in 2016, a 4.5% increase from Kshs 15.5 bn recorded in 2015.
Education Sector
- In its first investment in the education sector in Africa, One Thousand & One Voices (1K1V), a private family capital fund backed exclusively by families from around the globe, invested an undisclosed amount in Higher Ed Partners South Africa (HEPSA), a South African online education company. Based in Johannesburg, HEPSA is an integrated provider of online program management services to the leading tertiary educational institutions in South Africa. The Company assists universities in converting their on-campus degree programs into an online format, recruits qualified students for those programs, and supports enrolled students through graduation. For more information, see our Cytonn Weekly #20/2018,
- Dubai Investments, a private equity company listed on the Dubai Financial Market stock exchange, is set to invest USD 20 mn (Kshs 2.0 bn) in the consortium set to build a chain of Sabis-branded private schools in Africa. The consortium was previously made up of Centum Investment Company, Investbridge Capital, and Sabis Education Network. Prior to the investment, 40.0% of the consortium was owned by Centum, 40% by Investbridge and 20.0% by Sabis. The value of the investment by each party and the new shareholding after the investment by Dubai Investments is undisclosed. The consortium, which is investing through the holding company Africa Crest Education (ACE). For more information, see our Cytonn Weekly #7/2018, and
- Schole Limited, a London based education provider acquired 100% stake of Makini Schools for an undisclosed amount. Schole operates 3 institutions across Africa, (i) Crested Crane Academy, Zambia, (ii) Pestallozi Education Centre in Zambia, and (iii) Kisun High School in Uganda.
Other investors who are setting up institutions in Kenya include:
- Johannesburg Stock Exchange listed firm, Advtech, who is set to open a school in Tatu City under its Crawford Schools brand, offering the THRASS (Teaching, Handwriting, Reading, and Spelling Skills) education system, which focuses on pre-primary education,
- South Africa based Nova Pioneer, who have set up a Primary and Secondary School in Tatu City offering the 8-4-4 curriculum,
- Cytonn Investments, through its education affiliate Cytonn Education Services (CES), who are looking to provide education for all levels, from the Early Childhood Development Education (ECDE) to Tertiary Education, beginning with a Technical College branded, Cytonn College of Innovation and Entrepreneurship, and,
- Investment firm Centum Ltd who plan to build a Kshs 2.0 billion school in Runda Estate in partnership with Sabis Education Network.
The acquisitions indicate the increased interest in investment in the education sector in Sub-Saharan Africa, as investors are motivated by (i) increasing demand for quality and affordable education, with the Gross Enrolment Ratio (GER) having doubled in the last 10-years to 8.5% in 2016 from 4.5% in 2006 according to a report, “The Business of Education in Africa” by Caerus Capital, and (ii) support, such as ease of approvals, offered to investors in the education sector by governments looking to meet Sustainable Development Goals (SDGs) targets of universal access to tertiary education.
Real Estate Sector
- South African-based Vantage Capital, Africa’s largest mezzanine fund manager with funds in excess of Kshs 50.0 bn invested in projects across Africa, acquired an undisclosed stake in the Rosslyn Riviera Shopping Mall for USD 8.0 mn (Kshs 800.0 mn). The Kshs 2.9 bn mall located along Limuru Road sits on a 4.5-acre piece of land and measures approximately 116,000 SQFT. For more information, see our Cytonn Weekly #17/2018
- UK headquartered construction and management consultant, Turner and Townsend, acquired a 79.5% majority stake in Kenyan based Mentor Management Limited, MML, a project management company from private Equity firm Actis for an undisclosed amount. The management team of MML retained the minority stake. For more information, see our Cytonn Weekly #6/2018
We expect that Investors will continue to show interest in Kenya’s real estate and construction industry, which is on the rise driven by (i) a high urbanization rate of 4.4% against the global average of 2.1%, leading to a rise in demand for housing, (ii) an expanding middle class with increased disposable income, with the country’s disposable income having increased to Kshs 7.4 tn in 2016 from Kshs 6.5 tn in 2015 as per Kenya National Bureau of Statistic’s Economic Survey 2017, (iii) Kenya’s housing deficit of approximately 2.0 mn units with an increasing annual shortfall of 200,000 units, and (iv) a better operating environment for developers, characterised by tax relief of 15.0% for developers developing more than 100 affordable housing units per annum.
Exits
- Centum Investments Limited completed a sale of its 25.0% stake in Platcorp Holdings Limited, the holding company of Platinum Credit, to Suzerain Investment Holdings Limited, for an undisclosed amount. Centum invested in Platinum Credit in December 2012 with purchase of a 36.0% stake for approximately Kshs 0.8 bn, effectively valuing the microfinance institution at Kshs 2.2 bn at the time of purchase. This stake was thereafter diluted to 33.0% following the entry of a new undisclosed investor. Earlier this year, Centum sold off 8.0% through a partial exit, bringing its shareholding to 25.0%, with the 8.0% being sold for Kshs 432.0 mn, effectively valuing Platinum Credit at Kshs 5.4 bn, a 145.0% increase in value from 2012. Centum announced the sale of the remaining 25.0% for an undisclosed amount. Going by the value of Platinum Credit as at Centum’s partial exit, the divestment from Platinum is set to earn Centum about Kshs 1.3 bn. For more information, see our Cytonn Weekly #12/2018, and,
- In another transaction, Centum reached a deal to sell off a controlling 73.4% stake in fund manager GenAfrica (formerly Genesis Kenya Investment Management Limited) to New York-based equity fund Kuramo Capital LLC. GenAfrica manages assets of about Kshs 157.0 bn as at March 2017. The deal is subject to regulatory approval. According to Centum’s 2017 Annual Report, their stake in GenAfrica is valued at Kshs 1.4 bn. With GenAfrica’s earnings of Kshs 141.0 mn for the year ended March 2017, the transaction could have been carried out at a P/E multiple of 9.95x. Similar transactions that have been carried out in the past include the acquisition 100.0% of ApexAfrica Capital by Axis a Mauritian private equity fund in 2015 for Kshs 470.0 mn, translating to a transaction multiple of 40.2x on a P/E basis. For more information, see our Cytonn Weekly #12/2018.
According to the 2018 survey by Ernst & Young (EY) and Africa Venture Capitalist Association (AVCA), the number of annual PE exits in Africa have steadily increased from 30 in 2011 to peak at 50 in 2016. Despite challenging exit environments in key African markets in 2017 (with elevated political uncertainty and a weak economic environment in South Africa, the repeated Kenyan elections and continuing Nigerian currency challenges), PE activity remained resilient recording 49 exits, only slightly below the peak in 2016 (50 exits). Regionally, PE exit activity in North Africa increased in the last two years, while South Africa remained the market with the most PE exits. From 2016-2017, besides South Africa (45%) and Nigeria (6%), PE exit activity was high in the three large North African economies; Egypt (8%), Morocco (6%) and Tunisia (6%).
Exits to PE and other financial buyers continued to increase in 2017 (37%) compared to 34 % in 2016 and now represent the most common exit route. This is likely to be due to the large amount of capital raised by PE firms in 2014-2016 and PE firms needing to invest the capital raised. Looking forward, we expect to see investment in the Fintech, Education, Consumer Products and services and Energy sector.
Outlook
During the week, Safaricom staff pension fund announced its intention to explore investment opportunities in private equity (PE) firms in an effort to get higher returns for its estimated 5,000 members. Safaricom’s pension scheme disclosed during an annual general meeting that assets rose by 25.9% to Kshs 10.7 bn in 2017, from Kshs 8.5 bn in 2016. This is in line with the current trend that has seen an increase in the number of pension funds investing in PE firms. According to EAVCA, the number of pensions in Kenya which have invested in PE firms has grown to 13 in 2018 from 2 in 2015.
Data released by the Retirement Benefits Authority (RBA) indicates that retirement schemes’ investment in Private Equity (PE) and venture capital have grown rapidly as indicated in the table below;
|
Pension Schemes' Investment in Private Equity |
|||
|
Dec-16 |
Jun-17 |
Dec-17 |
|
|
Kshs Bn. |
0.22 |
0.25 |
1.00 |
|
% of Portfolio |
0.02% |
0.03% |
0.09% |
Despite this performance, PE funds still control a paltry 0.09%, of the Kshs 1.1 tn pension industry against an accepted investment limit of up to 10.0%. This can be attributed largely to; (i) little awareness among pension schemes trustees, and (ii) risk averseness among the pension scheme trustees that have knowledge of the sector. In an effort to diversify their investment portfolios in order mitigate risk and increase returns, we expect pensions to show stronger interest in private equity, which is not correlated with other traditional investments.
Private equity investments in Africa remains robust as evidenced by the increasing investor interest, which is attributed to; (i) rapid urbanization, a resilient and adapting middle class and increased consumerism, (ii) the attractive valuations in Sub Saharan Africa’s private markets compared to its public markets, (iii) the attractive valuations in Sub Saharan Africa’s markets compared to global markets, and (iv) better economic projections in Sub Sahara Africa compared to global markets. We remain bullish on PE as an asset class in Sub-Sahara Africa. Going forward, the increasing investor interest and stable macro-economic environment will continue to boost deal flow into African markets.
H1’2018 performance of the real estate sector in Kenya improved, with sectors such as office and retail registering a marginal increase in yields of 0.1% points to 9.3% and 9.7% from 9.2% and 9.6%, respectively. The performance has been bolstered by (i) continued demand for investment property from multinational individuals and the growing middle class, (ii) Kenyan Government efforts towards enabling the environment for developers through key statutory reforms such as National Land Use Policy, and initiatives such as the National Housing Development Fund set to fund public-private partnerships in delivery of affordable homes, and for end users such as the proposed stamp duty exemption for first time home buyers, (iii) the expanding middle class, and (iv) continued infrastructural improvements.
The key challenges that continue to face developers and end users include: (i) Strict access to financing with private sector credit growth coming in at 2.1% as at April 2018 compared to a five-year average of 14.0% for the period 2013 to 2018, (ii) high land costs, especially in Nairobi and its metropolis (per Cytonn’s Nairobi Metropolitan Land Report 2018); land prices appreciated by a 6-year CAGR of 17.0% for the period 2011-2017, and (iii) oversupply in selected sectors such as office, per KNBS data; the aggregate value of building approvals came in at Kshs 60.1 bn for the period January to March 2018, which is 2.1% lower than the value of approvals for the same period in 2017 which was Kshs 61.7 bn.
Residential:
The residential sector has had a build-up of development activities in H1’2018, as seen through the launch of several new projects. According to Kenya National Bureau of Statistics data, the value of approved residential buildings in Nairobi between January and March 2018 came in at Kshs 36.9 bn, 58.5% higher than non-residential approvals which came in at Kshs 23.3 bn, and 8.8% higher than the Kshs 33.9 bn registered during the same period in 2017. The sector has mainly been bolstered by (i) improving macroeconomic environment, with the World Bank projecting a GDP growth of 5.5% in 2018 compared to 4.7% in 2017, (ii) renewed investor appetite particularly after last year’s heated political climate, and (iii) the Kenyan Government’s inclusion of affordable housing as part of its Big 4 agenda, which has led to launching of sizeable projects across the country, such as:
- The County Government of Kiambu has plans of putting up a total of 19,500 housing units in a rent-to-own scheme that will target urban residents of Kiambu on 50-acres of public land, in areas such as Ruiru, Juja, Thika, Kikuyu, Limuru and old Kiambu. For more information see the Cytonn Weekly #24/2018,
- Nairobi County’s plans to have old low-rise units located in prime areas such as Starehe, Muguga Green, Shauri Moyo and Makongeni demolished to pave way for its own tenant purchase scheme that will see the development of 36,840 units. For more information see the Cytonn Weekly #24/2018,
- United Bank of Africa (UBA) announced that it had set aside Kshs 3.0 bn to be used in construction of over 1,000 affordable housing units in Kakamega County in partnership with the National Housing Corporation (NHC). For more information see the Cytonn Weekly #20/2018, and,
- Rendeavour, the developer of Tatu City, a master planned project in Ruiru, announced plans to include a 300-acre affordable housing project within the masterplan that will see the development of 10,000 affordable housing units priced between Kshs 1.5 mn to 5.0 mn. For more information see the Cytonn Weekly #17/2018.
Thus far, the Kenyan Government has rolled out various plans aimed at actualizing the affordable housing initiative, including:
- Plans to amend the revised Employment Act of 2012 to have employees to contribute 0.5% of their gross salary to the proposed National Housing Development Fund (NHDF), with employers matching the employee’s contribution by the same amount. The fund will be tasked with offering alternative financing solutions for low cost housing, as well as the required social infrastructure to Kenyans contributing towards the fund. For more analysis, please see the Cytonn Weekly #25/2018,
- A 400.0% increase in Budgetary Allocation for the Housing Sector for the financial year 2018/19 totaling Kshs 6.0 bn, compared to Kshs 1.5 bn in last year’s budget. Out of this, Kshs 3.0 bn was allocated for construction of affordable housing units, Kshs 1.5 bn for housing Kenya Prison officers, and Kshs 1.5 bn for the Civil Servants Housing Scheme Fund,
- The setting up a Mortgage Liquidity Facility (MLF) i.e. The Kenyan Mortgage Refinancing Company (KMRC), which is expected to enable mortgage affordability in Kenya and give access to long-term loans at attractive market rates in the country, by creating liquidity for primary lenders. For more analysis, please see the Cytonn Weekly #14/2018, and,
- Plans to allocate land to developers out of which 70% will be for affordable housing, while the remaining 30% will be high-end units, thus allowing the developers to recoup their costs. This initiative will be rolled out for the first lot comprising of 36,840 housing units in Starehe, Muguga Green, Shauri Moyo, Makongeni all in Nairobi County, and Mavoko, in Machakos County.
The plans are a testament to the government’s commitment to address the 2.0 mn housing shortage. However, the initiatives are also likely to face challenges such as (i) delays due to government bureaucracy and lack of absolute transparency in government activities, (ii) opposition from key stakeholders (especially the Employment Act Amendment), and (iii) insufficiency of the budgeted funds considering that the affordable housing initiative is estimated to cost Kshs 2.3 tn against a budget of Kshs 6.0 bn. Thus, we expect to see the government introduce other alternative financing strategies especially towards construction, and more reforms towards encouraging private sector involvement such as (i) clear mechanism on transferring public land to SPVs to facilitate access to private capital by using the land as capital, (ii) reduction of unnecessary red tapes such as the slow approval processes, and (iii) fast tracking of the development process as public projects time-frames tend to lag on for more than 5 years whereas private developers prefer to exit within 3-5 years .
In the mid to high-end market segment, various private developers also launched residential developments during the period driven by (i) attractive developer returns that have averaged over 20.0% in the last five years, which is higher than traditional asset classes with an average of 13.2%, (ii) improved infrastructure in selected areas, and (iii) an expanding middle class who are increasingly demanding quality and lifestyle products.
Some of the developers who launched projects during H1’2018 include;
- Cytonn Real Estate, the development affiliate of Cytonn Investments, who broke ground on a Kshs 15.0 bn, 100-acre master planned project with residential units, in Ruiru, Kiambu County, and,
- Other developers and their developments included:
|
Private Developments Launched in H1’2018 |
|||
|
Developer |
Location |
Acreage |
No. of Units |
|
Krishna Estates Limited |
Thindigua |
2.0 |
224 |
|
Cool Breeze Limited |
Mombasa Road |
2.3 |
524 |
|
Erdemann Developers Ltd |
Ngara Estate |
5.7 |
1,632 |
|
CIC Group |
Ruiru – Kamiti Road |
90.0 out of 200.0 |
417 |
|
Lordship Africa |
Upperhill |
0.8 |
239 |
Source: Online Sources
The continued investment in the residential sector underlines the sectors potential, which is mainly driven by the constant demand for housing, especially with the improving economic environment.
In terms of performance, apartments in Kilimani and Ngong Road had the highest returns to investors with annual returns of 14.4% and 11.8%, respectively, while for detached units, Ruiru and Lower Kabete areas recorded the best annual returns at 11.7% and 10.7%, respectively. Overall, apartments performed better, with the top five having the highest annual uptake at 27.5%, 5.2% points higher than the top 5 detached, which recorded an average of 22.3%.
All values in Kshs unless sated otherwise
|
Table A: Nairobi Metropolis Residential Sector Performance Summary H1’2018 |
||||||
|
Typology |
Average Price Per SQM H1’2018 |
Average Rent Per SQM H1’2018 |
Average Annual Sales H1’2018 |
Average Rental Yield H1’2018 |
Y/Y Average Price Appreciation H1’2018 |
Total Annual Returns H1’2018 |
|
Apartments |
97,617 |
478 |
25.2% |
6.1% |
3.3% |
9.4% |
|
Detached |
137,710 |
564 |
22.2% |
4.9% |
1.9% |
6.8% |
|
Average |
117,664 |
521 |
23.7% |
5.5% |
2.6% |
8.2% |
|
· Apartments registered higher returns to investors of 9.4%, 1.2% points higher than the market average of 8.2%. This is attributable to high demand for high rise units, due to (i) their affordability; apartments are 29.1% cheaper compared to detached units, and (ii) apartments allow for intensive land use especially given the high land costs in Nairobi and areas close to CBD. |
||||||
Source: Cytonn Research
All values in Kshs unless sated otherwise
|
Table B: Apartments Performance: Top 5 Areas in Nairobi Metropolis H1’2018 |
||||||
|
Location |
Average of Price Per SQM H1’ 2018 |
Average of Rent per SQM H1’ 2018 |
Average of Annual Sales H1’ 2018(%) |
Average of Rental Yield H1’ 2018 |
Y/Y Average of Price Appreciation H1’ 2018 |
Average of Total Return H1’ 2018 |
|
Kilimani |
123,433.2 |
692.5 |
31.8% |
7.1% |
7.4% |
14.4% |
|
Ngong Road |
96,203.8 |
592.6 |
26.7% |
7.1% |
4.7% |
11.8% |
|
Thindigua |
90,845.5 |
457.0 |
28.8% |
6.0% |
5.3% |
11.3% |
|
Spring Valley |
144,169.0 |
664.8 |
24.1% |
6.3% |
3.1% |
9.4% |
|
Imara Daima |
74,232.1 |
380.9 |
26.2% |
6.2% |
3.0% |
9.3% |
|
Average |
105,776.7 |
557.5 |
27.5% |
6.5% |
4.7% |
11.2% |
|
· Kilimani and other estates along Ngong Road such as Race Course, had the highest annual returns to investors, with 14.4% and 11.8%, respectively. The market is driven by increased demand from the expanding middle class, good infrastructure and social amenities as well as proximity to key business districts, that is, Upperhill and the CBD. |
||||||
Source: Cytonn Research
All values in Kshs unless stated otherwise
|
Table C: Detached Performance: Top 5 Areas in Nairobi Metropolis H1 2018 |
||||||
|
Location |
Average of Price per SM H1’ 2018 |
Average of Rent per SQM H1’ 2018 |
Average of Annual Sales (%) H1’ 2018 |
Average of Rental Yield H1’ 2018 |
Y/Y Average of Price Appreciation H1’ 2018 |
Average of Total Return H1’ 2018 |
|
Ruiru |
91,591.0 |
331.8 |
23.6% |
5.1% |
6.6% |
11.7% |
|
Lower Kabete |
174,963.1 |
470.7 |
21.4% |
3.2% |
7.5% |
10.7% |
|
Kitisuru |
250,982.7 |
1,006.7 |
20.6% |
4.7% |
5.4% |
10.1% |
|
Langata |
129,107.0 |
448.5 |
21.6% |
4.3% |
4.7% |
9.1% |
|
Runda Mumwe |
144,345.7 |
687.0 |
24.3% |
5.8% |
2.8% |
8.7% |
|
Average |
158,198.9 |
589.9 |
22.3% |
4.6% |
5.4% |
10.0% |
|
· Ruiru recorded the best returns in the detached sector with returns of 11.7%, attributable to relatively attractive rental yields. The area’s location along the Thika Superhighway, serenity, easy availability of development land that is also affordable, has continued to attract investors |
||||||
Source: Cytonn Research
We expect to continue witnessing increased activities in the residential sector in the year boosted by (i) government initiatives, such as the focus on affordable housing, (ii) an available market given the shortage of housing units that stand at 2.0mn units with an effective annual shortfall of 200,000 units, and (iii) positive demographic trends driven by a rapid population growth of 2.6% p.a higher than global averages of 1.2%, and rapid urbanization rates of 4.4% p.a compared to global average of 2.1% thereby creating demand for housing units in the country.
Commercial Office:
During the first half of the year, the commercial office sector performance in Nairobi improved marginally, with the rents, rental yields, and occupancy rates increasing by 2.8%, 0.1% points, and 1.4% points, respectively. The marginal increase in returns was as a result of:
- Conclusion of the electioneering period and thus an increase in economic activities,
- Continued positioning of Nairobi as a regional hub and thus increased entrance of multinationals such as French Based Pharmaceutical firm Sanofi that opened its regional office in Nairobi, AA Japan, a Japanese used vehicle auto dealer that set up its first office in the city in Q1’2018, and Nippon Express, a Japanese logistics firms that opened its first African office in Nairobi in Q1’2018, thus increasing demand for office space.
The table below highlights the performance of the commercial office sector in Nairobi in H1’2018:
All values in Kshs unless otherwise stated
|
Nairobi Commercial Office Performance Summary Over Time |
|||||
|
Year |
FY’2015 |
FY’2016 |
FY’2017 |
H1’ 2018 |
H/H ∆ 2018 |
|
Occupancy (%) |
89.0% |
88.0% |
83.2% |
84.6% |
1.4% points |
|
Asking Rents (Kshs/SQFT) |
97 |
97 |
99 |
102 |
2.8% |
|
Average Prices (Kshs/SQFT) |
12,776 |
12,031 |
12,595 |
12,527 |
(0.5%) |
|
Average Rental Yields (%) |
9.3% |
9.3% |
9.2% |
9.3% |
0.1% points |
|
· Occupancy rates in H1’2018 grew by 1.4% points from 83.2% to 84.6% in FY 2017. The growth can be attributed to an increase in demand for office space following the return of calm after the end of the protracted electioneering period thus boosting investor confidence to set up shop or expand · Asking rents rose by 2.8% from Kshs 99.0 per SQFT to Kshs 102.0 per SQFT leading to an increase in rental yields by 0.1% points from 9.2% in FY’ 2017 to 9.3% in H1’2018 · We remain cautiously optimistic on the performance of commercial office space in Nairobi, this is as despite the marginal increase in returns, and occupancy, the sector has an oversupply of 4.7mn SQFT, and thus investors are likely to face challenges on exit, both when selling and renting |
|||||
Source: Cytonn Research
In terms of Nairobi submarket performance for H1’2018, Karen, Parklands and Westlands were the best performing nodes recording average rental yields of 10.2%, 9.8%, and 9.7%, respectively. The high yields for the 3 locations are attributable to prime locations and high-quality office space, mostly Grade A and high-quality Grade B offices, which enabled developers to charge a premium on rent. Nairobi CBD, Thika Road and Mombasa Road were the worst performing nodes, with average rental yields of 8.7% for Thika Road and the Nairobi CBD, and 8.6% for Mombasa Road. The low yields are as a result of low quality office spaces (mostly low-quality Grade B and Grade C offices), and congestion by both vehicular and human traffic making the nodes unattractive as office locations. The low demand then constrained the rents which are on average 16.7% lower than the market average of Kshs 102 per SQFT.
The table below summarizes the commercial office performance by nodes in H1’2018 for Nairobi:
(All values in Kshs unless otherwise stated)
|
Nairobi Commercial Office Performance by Nodes H1’2018 |
|||||||||||
|
Location |
Price Kshs / SQFT H1’2018 |
Rent Kshs/SQFT H1’2018 |
Occupancy (%) H1’ 2018 |
Rental Yield (%) H1’ 2018 |
Price Kshs/ SQFT FY 2017 |
Rent Kshs/SQFT FY 2017 |
Occupancy FY 2017(%) |
Rental Yield (%) FY 2017 |
Δ in Rent (%) |
Δ in Yield (%) Points |
Δ in Occupancy (%) Points |
|
Karen |
13,776 |
118 |
87.2% |
10.2% |
13,167 |
113 |
89.2% |
9.5% |
4.0% |
0.7% |
(2.0%) |
|
Parklands |
12,433 |
103 |
85.6% |
9.8% |
12,729 |
103 |
85.7% |
9.7% |
0.0% |
0.1% |
(0.1%) |
|
Westlands |
12,567 |
109 |
84.7% |
9.7% |
12,872 |
103 |
88.5% |
9.4% |
5.8% |
0.3% |
(3.8%) |
|
Kilimani |
12,694 |
101 |
85.4% |
9.4% |
12,901 |
101 |
84.5% |
9.5% |
0.4% |
(0.1%) |
0.9% |
|
UpperHill |
12,708 |
101 |
85.7% |
9.0% |
12,995 |
99 |
82.0% |
9.0% |
1.6% |
0.0% |
3.7% |
|
Nairobi CBD |
11,750 |
87 |
92.1% |
8.7% |
12,286 |
88 |
84.1% |
8.7% |
(0.9%) |
0.0% |
8.0% |
|
Thika Road |
11,500 |
85 |
80.0% |
8.7% |
11,500 |
82 |
73.6% |
8.5% |
3.7% |
0.2% |
6.4% |
|
Msa Road |
11,770 |
83 |
68.0% |
8.6% |
11,641 |
82 |
74.2% |
8.5% |
0.6% |
0.1% |
(6.2%) |
|
Grand Total |
12,527 |
102 |
84.6% |
9.3% |
12,679 |
99 |
83.9% |
9.2% |
2.8% |
0.1% |
0.7% |
|
· Karen, Parklands and Westlands recorded the highest yields of on average 10.2%, 9.8%, and 9.7%, respectively and occupancy rates of on average 87.2%, 85.6%, and 84.7%, respectively. This is as the nodes are able to attract higher rents due to prime locations and high-quality office space · Nairobi CBD, Thika Road and Mombasa Road were the worst performing nodes with average rental yields of 8.6% for Mombasa Rd and 8.7% for both Nairobi CBD and Thika Rd. The low yields for the areas are as a result of the low quality office space (mostly Grade B and Grade C) prevalent in the nodes, and congestion by both vehicular and human traffic making the nodes undesirable, for instance, Mombasa Road had an average occupancy of 68.0% over the first half of 2018, compared to a market average of 84.6%, over the same period |
|||||||||||
Source: Cytonn Research
The main highlights in the commercial office sector during the first half of the year included:
- Federation of Kenya Employers (FKE), an entity established under the Trade Unions Act Cap 233 to represent the interest of employers, announced of its plan to construct an 8-storey office building in Upper Hill. The building is expected to cost Kshs. 620mn exclusive of land cost and will be funded through internal reserves. On completion, the building will house the federation’s headquarters, conference facilities, and staff offices. For more analysis, please see the Cytonn Weekly #20, and,
- Zamara Umbrella Solutions, a retirement and benefit fund, formerly known as Alexander Forbes announced of plans to build a twin tower in Westlands, comprising 16 and 30 floors. The Mixed-Use Development (MUD) will feature both commercial office space as well as retail space. The building will be located at the junction of General Mathenge Rd and Peponi Rd. For more analysis, please see the Cytonn Monthly February 2018.
Despite the marginal increase in rents in the first half of the year, we retain a negative outlook for the commercial office sector in Nairobi. This is as the sector has an oversupply of 4.7mn SQFT and new buildings are struggling to achieve market average occupancies. The pockets of value in the sector remain to be; (i) Grade A offices which are in short supply accounting for just 24.0% of the office space supply in the market and have attractive returns with average rental yields of 9.8%, compared to a market average of 9.3%, (ii) Serviced offices which have low supply with a market share of just 0.35% and high returns with average rental yields of 13.4% compared to a market average of 9.3%.
Retail Sector:
In H1’2018, we witnessed an increase in activities in the retail sector in Nairobi with a number of retailers, both local and international expanding, as shown below:
|
H1'2018 Retailers Expansion Activities and Plans |
||||
|
Retailer |
Country of Origin |
Nature of Store/ Business |
No of Store being Opened/ planed for opening in 2018 |
Mall/ Location |
|
Carrefour |
French |
Supermarket |
2 opened, 2-planned |
Junction Mall, Sarit Centre, Village Market, Galleria Mall |
|
Shoprite |
South African |
Supermarket |
7 outlets to be opened |
Westgate Mall, Garden City Mall and 5 undisclosed |
|
Choppies |
Botswana |
Supermarket |
1 opened, 1-planned |
Southfield mall along Airport North Road |
|
Miniso |
Japan |
Household and consumer goods |
1 opened, 2-planned |
Village Market, The Hub Karen |
|
Java Group |
Kenya |
Restaurant Chain |
2 planned for opening |
Nairobi and Mombasa |
|
Decathlon |
Dubai |
Sports retail shop |
1 planned for opening |
The Hub Karen |
|
Yves Rocher |
French |
Cosmetics group |
1 opened |
The Hub Mall in Karen |
|
· The aggressive expansion by the retailers is being driven by; i) the increased prudent marketing methods employed by main stream retailers to attract clientele and enhance footfall, and ii) increased preference for international brands by the consumers |
||||
Source: Cytonn Research
The positive outlook, and hence continued expansion by the retailers being driven by (i) high economic growth rates with the GDP growth rate averaging at more than 5.0% p.a over the last 5 years thus boosting disposable incomes, and increasing purchasing power, (ii) Kenya’s growing position as a regional and continental hub hence witnessing an increase in multinationals operating in the country, (iii) huge opportunity, with Kenya having a formal retail penetration of 35% according to Oxford Business Group, compared to markets like South Africa with a penetration of 60%, and (iv) the rise of e-commerce, as seen through the increased digitization of cash systems and a rise in mobile penetration at 90.4%, according to Jumia Mobile Report 2018, hence increased market coverage.
In H1’2018, the retail sector performance improved slightly, with occupancy rates increasing by 0.9% points from 80.3% in FY 2017 to 81.2% in H1’2018. The rents increased by 2.9% points from Kshs 185 per SQFT in FY 2017 to Kshs 190 per SQFT in H1’2018, resulting in a 0.1%-point increase in rental yields from 9.6% in FY’2017 to 9.7% in H1’2018. The improved performance is attributable to prudent methods employed by developers to attract clientele in malls and enhance footfall, including providing a wide variety of products from both local and international retailers. For instance, malls vacated by Nakumatt within Nairobi such as Garden City, Thika Road Mall, Galleria Mall and the Junction have already let out space to alternate anchor tenants such as Carrefour, Shoprite and Game.
The retail sector’s performance during the first half of the year is as shown below;
|
All figures in Kshs unless stated otherwise |
||||
|
Summary of Retail Market Performance in Nairobi Over Time |
||||
|
Item |
H1’2017 |
FY 2017 |
H1’2018 |
∆ H1’2018 |
|
Asking Rents (Kshs/SQFT) |
190 |
185 |
190 |
2.9% |
|
Occupancy (%) |
83.1% |
80.3% |
81.2% |
0.9% |
|
Average Rental Yields |
10.2% |
9.6% |
9.7% |
0.1% |
|
· The retail sector performance improved, recording an average rental yields of 9.7%, a 0.1%-point increase from 9.6% in FY'2017. The occupancy rates as well increased by 0.9% points, while the rental charges increased by 2.9% in H1'2018 |
||||
|
· The increase in occupancy rates is attributable to prudent methods employed by developers to attract clientele and enhance footfall |
||||
|
· The increase in rental charges are driven by the recovery of the market from the tough economic environment and the prolonged electioneering period in Q3’ and Q4 2017 |
||||
Source: Cytonn Research
In terms of Nairobi submarket performance for H1’2018, Westlands, Kilimani and Karen recorded the best performance with average rental yields of 12.4%, 11.9% and 10.4%, respectively. The high rental yields in these locations are as a result of high rents charged due to a premium added for the high-quality malls and prime locations. Eastlands and Satellite Towns are the worst performing nodes, with average rental yields of 7.0% and 7.3%, respectively. The low yields are as a result of competition from informal retail space hence decreased rental charges to attract tenants.
The table below shows the retail sector performance by nodes;
|
All figures in Kshs unless stated otherwise |
||||||||||
|
Nairobi Retail Sector Performance by Nodes H1'2018 |
||||||||||
|
Location |
Rent H1’2018 |
Occupancy H1’2018 |
Rental Yield H1’2018 |
Rent FY’2017 |
Occupancy FY’2017 |
Rental Yield FY’2017 |
H1’2018 ∆ in Rent (%) |
H1’2018 ∆ in Cccupancy (%) |
H1’2018 ∆ in Yield (%) |
|
|
Westlands |
231.0 |
90.8% |
12.4% |
235 |
91.0% |
13.5% |
(1.6%) |
(0.2%) |
(1.1%) |
|
|
Kilimani |
202.9 |
97.3% |
11.9% |
181 |
87.0% |
10.3% |
12.1% |
10.3% |
1.5% |
|
|
Karen |
209.5 |
95.0% |
10.4% |
206 |
96.3% |
11.2% |
1.6% |
(1.3%) |
(0.8%) |
|
|
Ngong Road |
187.9 |
93.7% |
10.2% |
171 |
81.8% |
8.7% |
10.1% |
11.9% |
1.5% |
|
|
Thika road |
204.3 |
76.5% |
9.8% |
199 |
75.3% |
8.7% |
2.5% |
1.3% |
1.1% |
|
|
Kiambu Road |
219.9 |
67.0% |
9.5% |
216 |
78.2% |
10.6% |
1.8% |
(11.2%) |
(1.1%) |
|
|
Mombasa Road |
171.8 |
74.4% |
8.6% |
180 |
68.8% |
8.3% |
(4.7%) |
5.7% |
0.3% |
|
|
Satellite Towns |
122.0 |
89.7% |
7.3% |
130 |
82.5% |
7.7% |
(6.2%) |
7.2% |
(0.4%) |
|
|
Eastlands |
164.0 |
68.2% |
7.0% |
149 |
61.8% |
6.1% |
10.1% |
6.5% |
1.0% |
|
|
Average |
190.4 |
81.2% |
9.7% |
185 |
80.3% |
9.6% |
2.8% |
3.3% |
0.2% |
|
|
||||||||||
Source: Cytonn Research
We retain a positive outlook for the retail sector on the back of continued expansion by some local supermarkets and the entry of foreign brands, positive demographics and recovery of the market from the tough economic environment and the prolonged electioneering period in Q3’ and Q4 2017.
Industrial Sector:
Similar to the commercial office and retail sectors, the industrial sector recorded improved performance in 2018 with rental yields increasing by 0.7% points from 5.4% as at H1’2017 to 6.1% in H1’2018. The increase in yields was as a result of an 11.8% increase in occupancy levels driven by an increase in demand attributable to;
- The renewal of investor confidence following the conclusion of the prolonged electioneering period, and,
- Increased focus by the government on manufacturing, with the sector being included among the governments Big Four Agendas of focus for the next four-years.
As a result of the above, we have witnessed an increase in foreign investments with firms such as Warsteiner and Hapag Lloyd from Germany, Isuzu and Volkswagen setting up assembly and manufacturing plants in the country this year.
In terms of performance by submarkets, Syokimau/Mlolongo and Baba Dogo were the best performing submarkets with average rental yields of 7.0% in both markets, against a market average rental yield of 6.1%. The better performance is attributable to the nodes’ proximity to the airport, and relatively affordable land prices for the Syokimau and Mlolongo Area, and for Baba Dogo, the key pull factor is ease of access with the area being in close proximity to the Thika Superhighway and the Eastern Bypass, making it an ideal location for storage and distribution developments such as warehouses.
The worst performing node in H1’2018 was Industrial Area which had average rental yields of 5.8%, the relatively low yields are attributable to low quality of warehouses in the node, most of which are owner occupied.
The table below summarizes the performance of the industrial sector performance by nodes in Nairobi:
|
Nairobi Industrial Sector Performance by Nodes H1’ 2018 |
||||||||||||
|
Area |
Price Kshs / SQFT H1’ 2018 |
Rent Kshs/SQFT H1’ 2018 |
Occupancy (%) H1’ 2018 |
Rental Yield (%) H1’ 2018 |
Price Kshs/ SQFT H1’ 2017 |
Rent Kshs/SQFT H1’ 2017 |
Occupancy H1’ 2017(%) |
Rental Yield (%) H1’ 2017 |
Δ in Rent (%) |
Δ in Yield (%) Points |
Δ in Occupancy (%) Points |
|
|
Syokimau/Mlolongo |
5,725 |
38 |
87.7% |
7.0% |
4,516 |
31 |
79.0% |
6.5% |
22.6% |
0.5% |
8.7% |
|
|
Baba Dogo |
6,217 |
41 |
87.6% |
7.0% |
7,206 |
44 |
93.0% |
6.8% |
(6.6%) |
0.1% |
(5.4%) |
|
|
Athi River |
4,250 |
27 |
83.8% |
6.4% |
3,242 |
25 |
73.0% |
6.8% |
8.0% |
(0.4%) |
10.8% |
|
|
Mombasa Road |
5,998 |
35 |
89.6% |
6.3% |
7,389 |
36 |
74.0% |
4.3% |
(2.9%) |
1.9% |
15.6% |
|
|
Industrial Area |
6,588 |
34 |
94.0% |
5.8% |
7,581 |
38 |
85.0% |
5.1% |
(11.0%) |
0.7% |
9.0% |
|
|
Average |
5,612 |
32 |
89.1% |
6.1% |
6,071 |
33 |
77.3% |
5.4% |
(2.0%) |
0.7% |
11.8% |
|
|
· Rental yields in the industrial market in Nairobi grew by 0.7% in H1’ 2018 as compared to the same period in 2017 attributable to return of calm that has led to increased investment activities as seen through higher occupancy rates of 89.1% in H1’2018 compared to 77.3% in H1’ 2017 · Syokimau/Mlolongo and Baba Dogo were the best performing nodes, recording average rental yields of 7.0% as a result of ease of access via Mombasa Road and Thika Road, respectively · Industrial Area recorded the lowest yields of 5.8%, despite the high occupancy rates of 94.0%. The low yields are attributable to the low quality retail space in the area, most of which are owner occupied |
||||||||||||
Source: Cytonn Research
Other highlights in the industrial sector in H1’ 2018 include:
- The Chief Executive Officer of Tilisi, a Limuru based 400-acre master planned development comprising of residential, education, logistics, medical, hospitality, recreational, commercial and retail centre, Mr Kavit Shah, announced plans to reduce the minimum land sizes it offers for sale in the industrial precinct by 80.0% from 5-acres to 10 acres, in a bid to boost uptake in the development that is currently 47.4% sold. For more analysis, please see the Cytonn Weekly # 25, and
- The County Government of Homabay announced plans to construct a Kshs 1.0 bn contemporary industrial park. The plan is expected to be executed in line with the National Government’s plan to develop at least one Export Processing Zone (EPZ) in each county. This is part of the government’s plan to increase the manufacturing sector’s contribution to GDP to at least 15.0% going forward from the 8.4% recorded in 2017. For more analysis, please see the Cytonn Weekly # 20.
We have a positive outlook for the industrial sector in Nairobi. We expect the sector to continue growing supported by; i) return of calm following the end of the protracted electioneering period that has led to a better operating environment thus increased industrial activities, ii) low supply that indicates an existence of a market niche that requires to be filled, iii) improved infrastructure that has opened up areas such as Ruiru and Athi River as well as counties for development of industrial parks, and iv) government support, given that the government has included manufacturing among the Big Four Pillars of focus for the next four- years.
Hospitality:
The hospitality sector in Kenya has continued recording increased investment driven by demand from both local and international guests, with the total room nights growing at a 6-year CAGR of 4.6% from 1.5 mn room nights in 2011 to 1.9 mn room nights in 2017 according to Kenya Bureau of Statistics Economic Survey 2018. In addition, according to the survey and following a 5-year slump between 2011 and 2015 that was as a result of insecurity and terrorism, the number of international arrivals have been growing by 16.7% from 1.2 mn in 2015 to 1.4 mn in 2017 as a result of marketing efforts by the government and improved security. As a result, in H1’2018, the sector recorded significant hotel openings and acquisitions including;
- The opening of Hilton Garden Inn along Mombasa Road in February this year. The 4-star hotel, brought to the market 171-rooms,
- DoubleTree, a brand by Global chain Hilton Group, rebranded and reopened a 109-room 4-star Hotel along Ngong’ Road, previously known as Amber Hotel. This marked the brand’s third hotel chain in Nairobi, with the others being Hilton Hotel in the CBD and Hilton Garden Inn along Mombasa Road,
- The entry of Swiss hotelier, Movenpick Hotels & Resorts, through the opening of a 5-star hotel in Westlands, owned by the Kampala based Golf Course Hotel in April 2018. The hotel features 128 guest rooms; 54-1 and 2-bed residential apartments, 94-suites, and 4,000 SQM of conference space,
- Sarova Group of Hotels announced plans to take over the management of Spirit of the Mara Lodge in a 15-year partnership agreement. The hotel located in Siana Conservancy overlooking the Mara, has 10-suites each having a lounge and sleeping area,
- Nairobi Institute of Business Studies (NIBS) announced plans to set up a 5-star hotel in Kileleshwa, Nairobi by 2019. The 72-key hotel is expected to serve commercial clients and offer practical knowledge and internship to the institute’s hospitality students.
The activities above are a clear indication of the attractiveness of the sector and will result in i) better accommodation and service standards, as hotels rebrand or improve their facilities which have depreciated over time, so as to remain competitive in the wake of stiff competition from global brands such as Radisson Blu, Mariott and now Movenpick, and ii) increased room capacity to meet the growing demand for accommodation as seen in the increase in tourist arrivals to 1.4 mn in 2017 compared to 1.3 mn in 2016, according to the Kenya National Bureau of Statistics Economic Survey Report 2018.
In addition to the increased investment in the sector, other factors likely to boost the sector include increased flight operations, which increase the convenience of travelling to and within Kenya such as;
- The launch of direct flights to the US from Kenya where Kenya Airways will be operating daily flights to and from New York and Nairobi, and will see the trip time reduce by about 8-hours, to 15-hours from the previous 23-hours,
- Kenya Airways operations between Kenya and Mauritius offering four weekly flights as from June this year, complementing Air Mauritius’ existing operations,
- Jambojet increased the frequency of its local flights per week to 39 up from 22, while Kisumu-Nairobi flights increased to 14 from the previous 8, attributed to increased demand,
- Kenya Airways and KLM Royal Dutch Airlines expanded their sales cooperation agreement to cover more European-Eastern Africa routes, unlike the previous deal, which limited their alliance on the London and Amsterdam routes into Nairobi, with the aim of creating more value for their customers, and,
- Ethiopian Airline was granted a second frequency flight to Mombasa, meaning the airline will now fly twice a day to Mombasa. This is expected to result in increased tourist arrivals in the general coastal region which is the main tourist destination in Kenya.
On serviced apartments, Executive Residency by Best Western Nairobi received the Best Property 21 to 70 Units Award, at the Serviced Apartments Worldwide Awards 2018, held at Grange Hotel Tower Bridge in London. The serviced apartment development, which is situated along Riverside Drive, came into the market in November 2016 and is currently the only internationally branded serviced apartment development in Kenya, showing the opportunity in the provision of international-grade serviced apartment facilities.
We project further growth in the hospitality sector as a result of; i) restoration of political calm, ii) the revision of negative travel advisories, warning international citizens, e.g. from the United States against visiting Kenya, iii) positive reviews from travel advisories such as Trip Advisor who ranked Nairobi as the 3rd best place to visit in 2018, only behind Ishigaki Island in Japan and Kapaa in Hawaii, and The Travel Corporation who ranked travel to Kenya as one of the top 10 transformative travel experiences in the world, iv) improved hotel standards with the entry of global hotel brands while existing hotels refurbish their developments, v) classification of hotels into their respective hotel star ratings as a way to improve visibility and credibility of local hotel brands and, vi) improved flight operations and systems which will make it easier and more convenient for travelers.
Infrastructure:
Infrastructural development has continued to boost growth in, not only real estate, but also other sectors in Kenya and has a significant impact on the country’s macro-economic variables such as: i) the Gross Domestic Product (GDP) through revenue generation, ii) employment, and iii) ease of doing business. To boost economic growth in Kenya, both the National and County governments, through their respective designated departments have continued to undertake expansionary infrastructural initiatives. During H1’18, the state released its fiscal plan for the 2018/19 financial year and highlighted that infrastructure will be among the key enablers to its Big 4 –plan for the next 5 years. The main take-outs related to infrastructural development were:
- The State will allocate Kshs 250.0 bn towards infrastructure development which marks an increase of 22.4% from last year’s Kshs 204.3 bn allocated in the 2017/18 fiscal year,
- Ongoing road construction projects and the ongoing construction of phase 2A of the SGR will take up 46.4% and 29.9% of the Kshs 250.0 bn and
- Affordable electricity will take up 15.1%, Kshs 37.8 bn of the infrastructure budget allocation while affordable energy comprising exploration of geothermal, solar, wind and oil energy will consume 7.0%, Kshs 17.5 bn of the allocation.
The move by State to invest in infrastructure will improve transport, aid in penetration of electricity with 60.0% of households currently able to access electricity fuel economic growth and result the attainment of Kenya’s projected GDP growth which is projected to grow by 5.5% in 2018, a marginal increase of 0.6% from 4.9% according to the World Bank. The Real Estate sector is bound to benefit from economies of scale due to reduced costs as a result of accessibility as well as savings on servicing costs. Additionally, investment in infrastructure is crucial in the attainment of affordable housing one of State’s key 4-pillars of focus for the period between 2017-2022 through creation of a better operating environment for investors.
During H1 2018 we saw the launch and completion of various infrastructural projects across the country, including:
|
Infrastructural Project in Kenya as at H1’2018 |
||||||
|
|
Name of project |
Type |
Length (Kms) |
County |
Project Value |
Progress |
|
1. |
Ngong Road Expansion (Phase 1) – dualling of road from the Kenya National Library to the junction at Kilimani Ring Road |
Road |
2.57 km |
Nairobi |
Kshs 2.3 bn |
Completed in Q1’2018 |
|
2. |
Dongo-Kundu Bypass – Phase 1 |
Road |
11 km |
Mombasa |
Kshs 11 bn |
Complete and Opened in June 2018 |
|
3. |
Eldoret Southern Bypass |
Road |
20.0 km |
Uasin Gishu |
Kshs 6.0 bn |
Commenced in January 2018 |
|
4. |
Four link roads that is set to connect the Garissa Highway to the upcoming Thika Bypass |
Road |
2 km, 3 km, 3 km and 8 km |
Kiambu |
Kshs 1.5bn |
Commenced in February 2018 |
|
5. |
Construction of phase 2A of the Standard Gauge Railway (SGR) traversing through the Nairobi National Park |
Railway |
120 km |
Nairobi, Kajiado, Nakuru, Kiambu, Naivasha and Narok, |
Kshs 150.0 bn |
Commenced in March 2018 |
|
6. |
Ngong Road Expansion (Phase 2) |
Road |
2.4 km |
Nairobi |
Kshs 2.2 bn |
Commissioned in March 2018 |
|
7. |
Dongo-Kundu Bypass – Phase 2 & 3 |
Road |
8.9 km |
Mombasa |
Kshs 30 bn |
Commissioned in May 2018 to commence in August 2018 |
|
8. |
Superhighway linking Jomo Kenyatta International Airport to Rironi area in Limuru along the Nakuru- Nairobi highway |
Road |
43.5 km |
Kiambu |
Kshs 59.0 bn |
Designs commenced February 2018, project to commence in Q1’2019 |
|
9. |
Dualling of the Salgaa-Mau summit highway |
Road |
22.0 km |
Nakuru |
Kshs 748.0 mn |
Tender award and project set to commence in June 2018 |
|
10. |
Upgrade of Kimbimbi-Karoti – Kajiji roads, Pi – Mumbi roads |
Road |
217 km |
Kirinyaga |
Not Disclosed |
Launched in June 2018 |
Other key highlights in infrastructure in H1’2018 were:
- Kajiado county launched a 162-commuter train that will ease operations and transport between Kajiado Town and the Konza Technocity. With a 2-trip a day schedule and operations in 5 days a week, the train will be expected to cover a 42km radius between the 2-towns,
- Nairobi Governor Mr. Mike Mbuvi Sonko is spearheading the construction of a new sewer line in Kariobangi. The new sewer line is set to replace the 150 mm diameter sewer line that is inadequate for multiple dwelling developments and
- The County Government of Kirinyaga embarked on a Kshs 1.6 bn water and sewer project covering Kutus and Kerugoya town. The project which will be funded by grants from the National Government and the African Development Bank (AfDB) is set to benefit 200 households in Sagana and Baricho area.
The increased investment in infrastructure is an indication that the government is committed to its developmental agenda and guarantees overall growth of the Kenyan economy. If successfully completed and implemented, State’s infrastructural initiatives would have a positive effect on the Real Estate sector in Kenya, since infrastructure helps open up more areas for Real Estate Development increasing accessibility and access to essential services such as water, electricity and a sewerage system. This will make more investors venture into the sector given sustained demand as seen through: i) the housing deficit that currently stands at 2.0 mn units according to the National Housing Corporation (NHC) and positive demographics such as a high population growth rate of 2.6%. 1.4% point higher than global averages of 1.2% and high urbanization rates of 4.4% as compared to world averages of 2.1%; this implies sustained demand.
We expect further investment in infrastructural development as State intensifies efforts in a bid to attain expected average GDP rates of between 5.3% - 5.5% for 2018, which would imply a rebound from a low of 4.9% in 2017, the increased investment in infrastructure is thus expected to open up new towns for real estate development and also lead to a reduction in developmental costs
Statutory Reviews:
During the H’1 2018, there were several statutory reviews made or proposed, all in line to promote efficiency and reduce cost on both develop and the end-user in the real estate sector.
The following are the key reviews;
- The Kenyan Parliament extended the period for consideration of land regulations for a further 90-days from 14th February. The regulations, published in November 2017, were set to facilitate the implementation of the new land laws which among other items outlines the mandates of the various parties, including the Ministry of Lands, the National Land Commission and the County Governments.
These regulations included;
- The Land (Extension and Renewal of Leases) Rules, 2017;
- The Land (Conversion of Land) Rules, 2017;
- The Land (Assessment of Just Compensation) Rules, 2017;
- The Land (Allocation of Public Land) Regulation, 2017;
- The Land Registration (General) Regulations, 2017;
- The Land Registration (Registration Units) Order, 2017;
- The Land Regulations, 2017;
- The Community Land Regulations, 2017; and
- The National Land Commission (Investigation of Historical Injustices) Regulations, 2017.
- Last month, the Cabinet Secretary of the Ministry of Lands and the Law Society of Kenya (LSK) agreed to form a 15-person task force to look into the issues raised by the LSK on the inadequacies of the Land Information Management System (LIMS). The task force is tasked to recommend guidelines on how the implementation of the electronic registration and conveyancing system will be undertaken, in compliance with Regulation 90 of the Land Registration(General Regulations, 2017), Cytonn Monthly- May 2018,
- The National Assembly majority leader, Aden Duale, tabled a bill in Parliament in April this year, seeking to amend the Stamp Duty Act to exempt first time home buyers from paying stamp duty. Stamp duty tax is paid on the market value of a property at the rate of 4.0% for urban areas and 2.0% for rural areas and is payable within 30-days of signing of the sale agreement. In our opinion, if the bill is passed, it will be a move in the right direction, as despite the minimal effect on the total house price, it will reduce the first-time home buyers’ financial burden,
- The Lands Ministry launched the Sessional Paper No. 1 of 2017 National Land Use Policy (NLUP), aimed at curbing land grabbing and poor land management. The policy is a prerequisite to the National Spatial Plan, County Spatial Planning Guidelines and the Physical Planning Act. In our view, this will especially aid in the delivery of the affordable housing units in the Big 4 Agenda, where availability of land has been a key challenge and will also enhance the efforts to improve the mortgage market, which has been laden with difficulties with property registration and titling,
- In a bid to increase home affordability, the government, proposed the following legal amendments; i) the NSSF Act to raise member’s contribution from current rates of Kshs 400.0 to Kshs 1,080.0, and ii) the Income Tax Act that proposes to raise tax rebates to Kshs 8,000 under the Home Ownership Savings Plan, to employees who save with mortgage institutions from the current Kshs 4,000,
- The Energy Regulatory Commission (ERC) kicked off vetting of both existing buildings and those under construction to ensure that they have complied with solar heating rules, and,
- The National Construction Authority (NCA) announced on 22nd May 2018, that it was drafting a construction industry policy that will streamline operations in the construction and real estate sectors in the country. In our opinion, this policy will result in reduced use of substandard material and ensure buildings meet set standards thus reduced number of collapsing buildings.
Listed Real Estate:
Stanlib Fahari I-REIT acquired the Kshs. 850.0 mn, 67 Gitanga Road office block in Lavington, Nairobi, in compliance with the Capital Markets Authority’s (CMA) requirement for listed REITs to invest a minimum of 75.0% of assets in income-generating real estate. The acquisition of 67 Gitanga Road Office block thus raised the real estate assets share in the fund to 90.0% from 68.0% invested in Greenspan Mall, Signature International Limited, and Bay Holdings Ltd.
The newly acquired property is set to increase the REIT’s quality of earnings with a target net income of Kshs. 73.8 mn p.a., translating to 8.7% rental yield, higher than the yield from the other properties in the REIT, which collectively have a rental yield of 7.0%. In our view, this acquisition, is a step in the right direction as the REIT is acquiring higher quality office spaces with good returns and it is likely to increase REITs total return.
On performance, Stanlib Fahari I-REIT released their FY’2017 earnings, registering a 61.0% growth in earnings to Kshs 0.95 per unit from Kshs 0.59 per unit in FY’2016, attributable to a 24.8% decline in fund management expenses to Kshs 135.6 mn from Kshs 180.4 mn in FY’2016 and a 12.4% increase in rental income to Kshs 279.4 mn from Kshs 248.6 mn in FY’2016 from the 3 real estate assets they own; Greenspan Mall, Bay Holdings and Signature International Properties. The decline in expenses was because of the one-off set up and listing costs such as promotional and marketing expenses incurred in H1’2016 while the increase in revenues was a result of the additional income from 2 of the properties that were acquired mid-2016. In addition, the I-REIT had no debt in FY’2017, thus no financing costs compared to the previous period, in which it had Kshs 23.4 mn in financing costs. The I-REIT recorded a dividend yield of 6.5%, based on market price as at 29th March 2018, up from 4.3% dividend yield in FY’2016. Despite the increase, the yield is still relatively low compared to brick and mortar assets with commercial retail and office achieving rates of 9.7% and 9.3% in H1’2018, respectively as shown below;
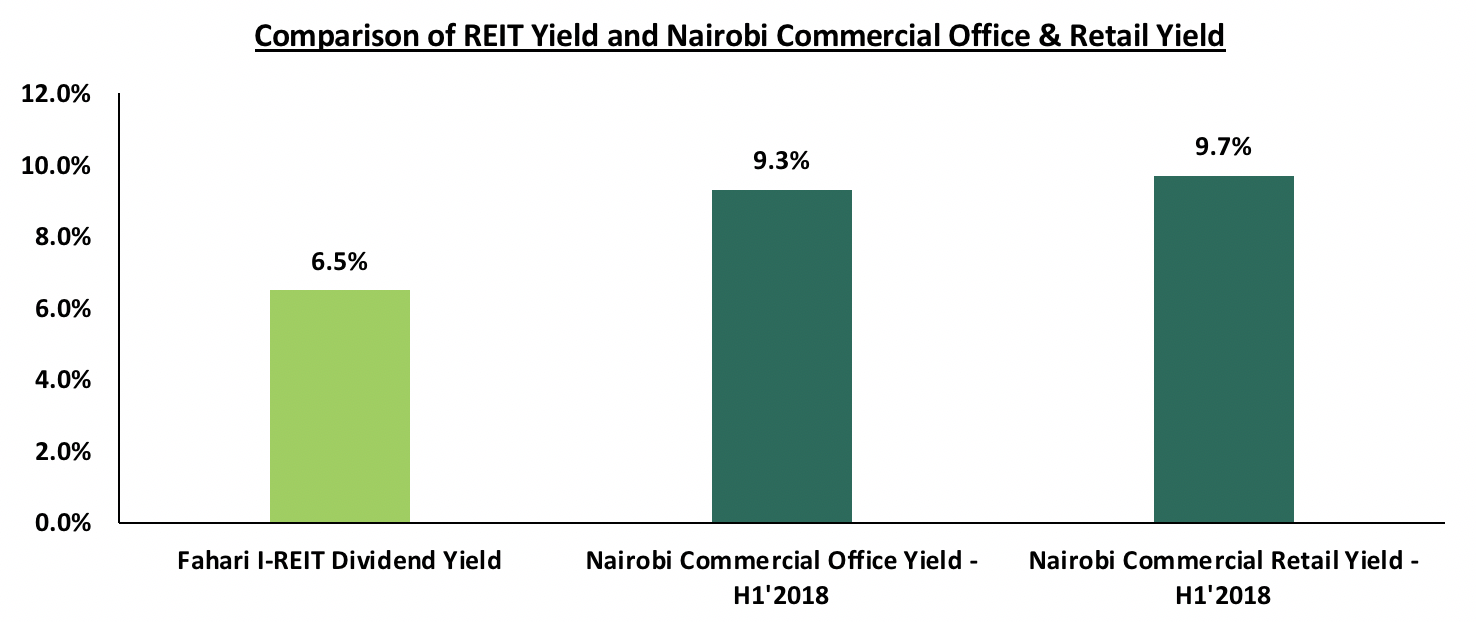
Source: Cytonn Research 2018
For a more comprehensive analysis on the REIT FY’2017 performance, see our Stanlib Fahari I-REIT Earnings Note.
During H1’2018, Stanlib’s Fahari I-REIT price rose by 8.1%, closing at Kshs 11.3 per share from Kshs 10.5 per share at the beginning of the year, and shedding 45.7% from its listing price of Kshs 20.8 in November 2015. In addition, Fahari I-REIT is trading at a discount of 47.6% to its Net Asset Value per share, which currently stands at Kshs 16.7 as per FY’2017 reporting. The prices for the instrument have remained low averaging at Kshs 11.1 in H1’2018 largely due to: i) opacity of the exact returns from the underlying assets, ii) the negative sentiments currently engulfing the sector given the poor performance of Fahari and Fusion REIT (FRED), iii) inadequate investor knowledge, and iv) lack of institutional support for REITs. We expect the REIT to continue trading at low prices and in low volumes.
The graph below shows the REIT’s performance in H1’2018;
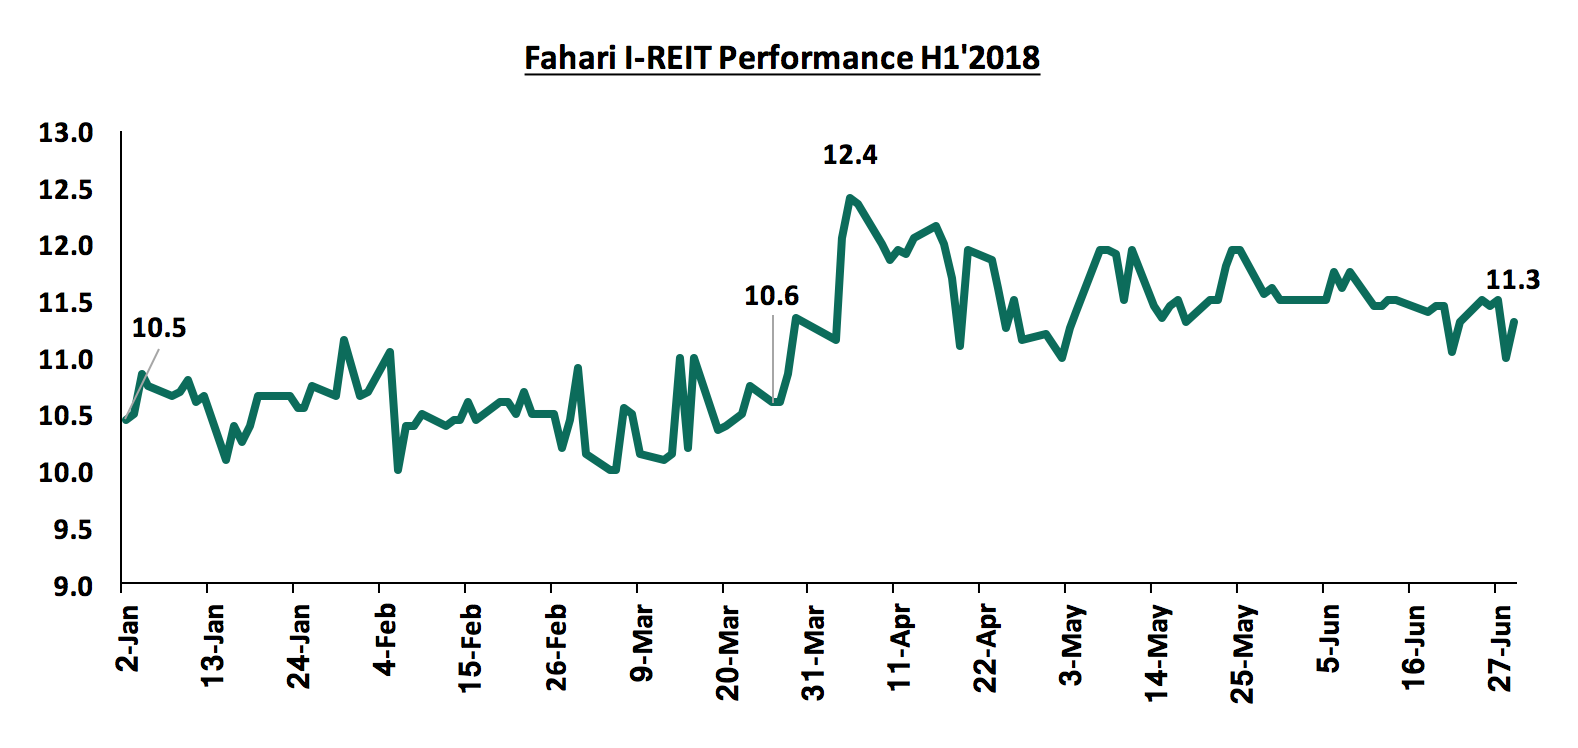
We retain a negative outlook for the listed real estate sector mainly due to market structures and poor market sentiment, however, attempts by key real estate industry players in the region such as East Africa Forum for Structured products to improve the market sentiment on REITs and other alternative investments and need for capital by developers is expected to drive uptake of the REIT.
We remain optimistic about the positive performance of the real estate sector driven by: positive demographic trends such as: rapid urbanization that currently stands at 4.4% against a global average of 2.1%, rapid population growth rates of 2.6% against a global average of 1.2%, sustained infrastructural development, with the government set to build 10,000 kms of road networks in the next 5-years which will open up areas for real estate development and a better operating environment due to political calm after the end of the extended electioneering period, as well as sustained investor appetite.
Disclaimer:The views expressed in this publication are those of the writers where particulars are not warranted. This publication, which is in compliance with Section 2 of the Capital Markets Authority Act Cap 485A, is meant for general information only and is not a warranty, representation, advice or solicitation of any nature. Readers are advised in all circumstances to seek the advice of a registered investment advisor.

- Talk to us
- Kenya
- P.O Box 20695 - 00200, Nairobi, Kenya
- Cell +254709101200
- Tel +254709101200
- WhatsApp +254741676635
- United States
- +254709101200
- DOWNLOAD OUR APP
-


- Kenya
- 8th Floor, Pinetree Plaza, Kaburu Drive, Ngong Road, Nairobi, Kenya
- USA
- Suite 1150, 1775 Eye Street NW, USA, Washington DC 20006, USA
- Investments
- High Yield
- Private Equity
- Real Estate
- Real Estate
- RiverRun Estates
- Cytonn Towers
- The Ridge
- Taraji Heights
- The Alma